 Cicely A. M. Marshall1*
 Jonathan Dabo2
 Markfred Mensah2
 Patrick Ekpe3
 James T. Kpadehyea4Ouo Ouo Haba5David Bilivogui6William D. Hawthorne6
- 1Department of Plant Sciences, University of Cambridge, Cambridge, United Kingdom
- 2Forestry Research Institute of Ghana, Kumasi, Ghana
- 3Ghana Herbarium, Department of Plant & Environmental Biology, University of Ghana, Legon, Ghana
- 4Forestry Development Authority, Mount Barclay, Liberia
- 5Université de N'Zérékoré, N'Zérékoré, Guinea
- 6Department of Plant Sciences, University of Oxford, Oxford, United Kingdom
Centres of endemism have been much studied by biogeographers, ecologists, and evolutionary theorists, and are considered conservation priorities. It is therefore important to understand the ecological traits of restricted range taxa, and the landscape-scale drivers of high endemism. Here, we investigate correlates of floristic endemism within two of west Africa’s forest biodiversity hotspots at local scale. We assembled distribution data for 1,042 vascular plant taxa from 114 sample locations within forest reserves of south west Ghana, and for 1,735 vascular plant taxa from 454 sample locations within the Nimba Mountains (Liberia and Guinea). A quantitative index of global endemism called the Genetic Heat Index was modelled linearly. We tested the significance of modern climate, altitude and disturbance as factors predicting endemism rates in these two forest reserves. Annual rainfall was significantly and positively related to endemism rates in both south west Ghana and the Nimba Mountains. Altitude was a significant predictor of endemism rates in the Nimba Mountains, with a quadratic relationship highlighting particularly high endemism over 1,000 m. Local topography rather than altitude was a significant predictor or endemism in SW Ghana, where altitude varies less. Areas of high rainfall and high altitude are geographically restricted across the western African forests, acting as edaphic islands driving spatial isolation. Disturbed vegetation samples had lower endemism rates than undisturbed samples in both Nimba and SW Ghana, and overall pioneer species had wider areas of occupancy than shade-bearing species. Endemism rates increased slightly with each year following clearance. Disturbance thus creates and maintains vegetation types which support a lower proportion of globally rare species in the two biodiversity hotspots surveyed. From the point of view of the conservation of globally rare plants, it is important to keep additional disturbance in the south west Ghana hotspot, particularly Ankasa, to a minimum, as is the current practice, and in the Nimba mountains to establish community forests which may be left relatively undisturbed amid farming and mining activities.
Introduction
Areas home to globally rare species are usually considered conservation priorities (Myers et al., 2000; Brooks et al., 2006; IUCN, 2016; Darbyshire et al., 2017). It is important therefore to understand more about the processes by which taxa characteristic of such endemism hotspots have come to be spatially aggregated and are maintained in aggregation (Simon et al., 2009). Research mapping centres of high endemism are more common than those offering explanations for this phenomenon (Harrison and Noss, 2017). This is particularly the case at local scale, where patterns of endemism within ‘hotspot’ areas are less likely to be known or interpreted.
Centres of endemism have been recognized as areas of historical climatic stability (Carnaval et al., 2009; Sandel et al., 2011; Harrison and Noss, 2017), and/or areas where previous or current insularity of geography or edaphic climate have created and maintained endemic lineages (Bossuyt et al., 2004; Kier et al., 2009; Särkinen et al., 2012). Mountainous topography increases endemism rates by contributing to climatic stability by providing refugia (Jansson, 2003; Dobrowski, 2011), and more directly by providing habitat heterogeneity (Bátori et al., 2017). The influence of climatic variables on endemism rates is expressed mainly through the creation of edaphic climate islands, which act like oceanic islands to isolate taxa (Ohlemüller et al., 2008; Buira et al., 2020). Similarly, local landscape position, for example rocky outcrops or serpentine soil (Anacker and Harrison, 2012) or swamps (Denguéadhé Kolongo et al., 2006), can create isolation and promote higher endemism. Variation in vegetation, relief and elevation even at the scale of metres (microrefugia) can have a significant effect on plant persistence and thus endemism rates over time (Dobrowski, 2011; De Frenne et al., 2013). Novel disturbance regimes have been identified by many authors as a factor acting to reduce biodiversity value, particularly habitat suitability for restricted range taxa in forest ecosystems (Barlow et al., 2007; Gibson et al., 2011; Raveloaritiana et al., 2021), leading to the homogenisation of biota across biogeographical regions (Dornelas et al., 2014; Bernardo-Madrid et al., 2019).
Upper Guinea is a phytogeographical name for the forest zone of west Africa, running from Sierra Leone in the west to the Dahomey Gap (Ghana) in the east, from the coast up to 350 km inland (White, 1979; Marshall et al., 2021). The whole ecoregion has been recognised as a biodiversity hotspot (Myers et al., 2000; Olson et al., 2001). The recognition of an area at coarse resolution as a hotspot of endemism does not imply that globally rare taxa are found in all geographical areas nor plant communities within it. For example, lowland forests are found throughout the Western African Forests hotspot, but smaller areas within the forest extent disproportionately account for its most restricted range species. Within Upper Guinea, four hotspots of plant endemism have traditionally been recognised, where high concentrations of globally restricted taxa (Marshall et al., 2016) and regionally restricted taxa (Wieringa and Poorter, 2004) are found: (i) the Nimba Mountains (where Liberia, Guinea and Ivory Coast meet), (ii) SE Liberia, (iii) SW Ivory Coast and (iv) SW Ghana. At least the Nimba Mountains and the forest reserves of SW Ghana, where this study is situated, have also been recognized as Key Biodiversity Areas Partnership (2022). Even within these smaller localities, distinct plant communities found within them such as farmland, swamp forest and high altitude savanna do not all necessarily harbour restricted range plant species, and information about the predictors and distribution of restricted range species at the finest scale within KBAs is particularly important for land management.
Upper Guinean centres of endemism have been interpreted as the result of species’ adaptation to present day environmental determinants, such as high altitude and topographic diversity (Linder, 2001; Barthlott et al., 2007) and the modern climate, particularly high rainfall (Wieringa and Poorter, 2004). Most authors have also supported the interpretation of hotspots in Africa as the result of historic changes in climate, particularly as locations of climatic stability during the Pleistocene (2.8–0.01 Ma; Hamilton, 1976; Brenan, 1978; Fjeldsa and Lovett, 1997; Linder, 2001). In Taï National Park (SW Côte d’Ivoire), one of Upper Guinea’s plant endemism centres, forest disturbance from human impact was negatively associated with endemic plant species richness, with areas logged in the 1970s associated with lower endemic species richness and higher Pioneer Index values in the late 1990s (Denguéadhé Kolongo et al., 2006).
Here, we test hypothesised correlates of plant endemism at local scale, in two of west Africa’s forest hotspots of biodiversity. We present the endemism patterns found across 114 and 454 vegetation samples of the vascular flora in the SW Ghana and the Nimba Mountains hotspots. We test the specific hypotheses that modern climatic variables (Annual Mean Temperature and Annual Precipitation), altitude and disturbance are significant predictors of plant endemism at sample scale across these two forest hotspots. Given previous studies we expect altitude and rainfall to be positively correlated with plant endemism, and disturbance to have a negative correlation with endemism. By working across two of the four hotspot areas recognised within the western African forests hotspot, we aim to identify the shared and distinct predictors of endemism operating in these two hotspot KBAs within the western African forests region.
Materials and methods
Study sites and botanic data
SW Ghana is regarded as a local hotspot of plant endemism within Upper Guinea mostly due to the relatively higher numbers of restricted range species known from the Ankasa Resource Reserve (Wieringa and Poorter, 2004). Relatively less is known about the species composition of the forest reserves to the north of Ankasa. Across the sample sites, annual precipitation averages 1,910 mm/year, whilst mean temperatures average 26.5°C (Hijmans et al., 2005). Altitude above sea level has a minimum of 40 m, a maximum of 181 m, and a mean of 97 m. Within the Nimba hotspot, the altitudinal gradient is significant, with the highest peak 1,668 m above sea level, minimum altitude of 415 m, and a mean altitude of 685 m. Annual precipitation averages 2,097 mm/year, whilst mean annual temperature averages 23.2°C (Hijmans et al., 2005). Both hotspots are subjected to anthropogenic disturbance; the forest reserves of south west Ghana accommodate logging concessions, whilst the Nimba mountains support iron ore exploration and extraction concessions, and farmland.
Twenty-seven vegetation samples were enumerated in SW Ghana for this publication, which were compiled with 87 botanic samples from the region from different surveys (Table 1; Figure 1). We compiled 454 samples from the Nimba Mountains, from three previous survey efforts (Table 2; Figure 2). The SW Ghana and Nimba datasets were analysed separately from each other.
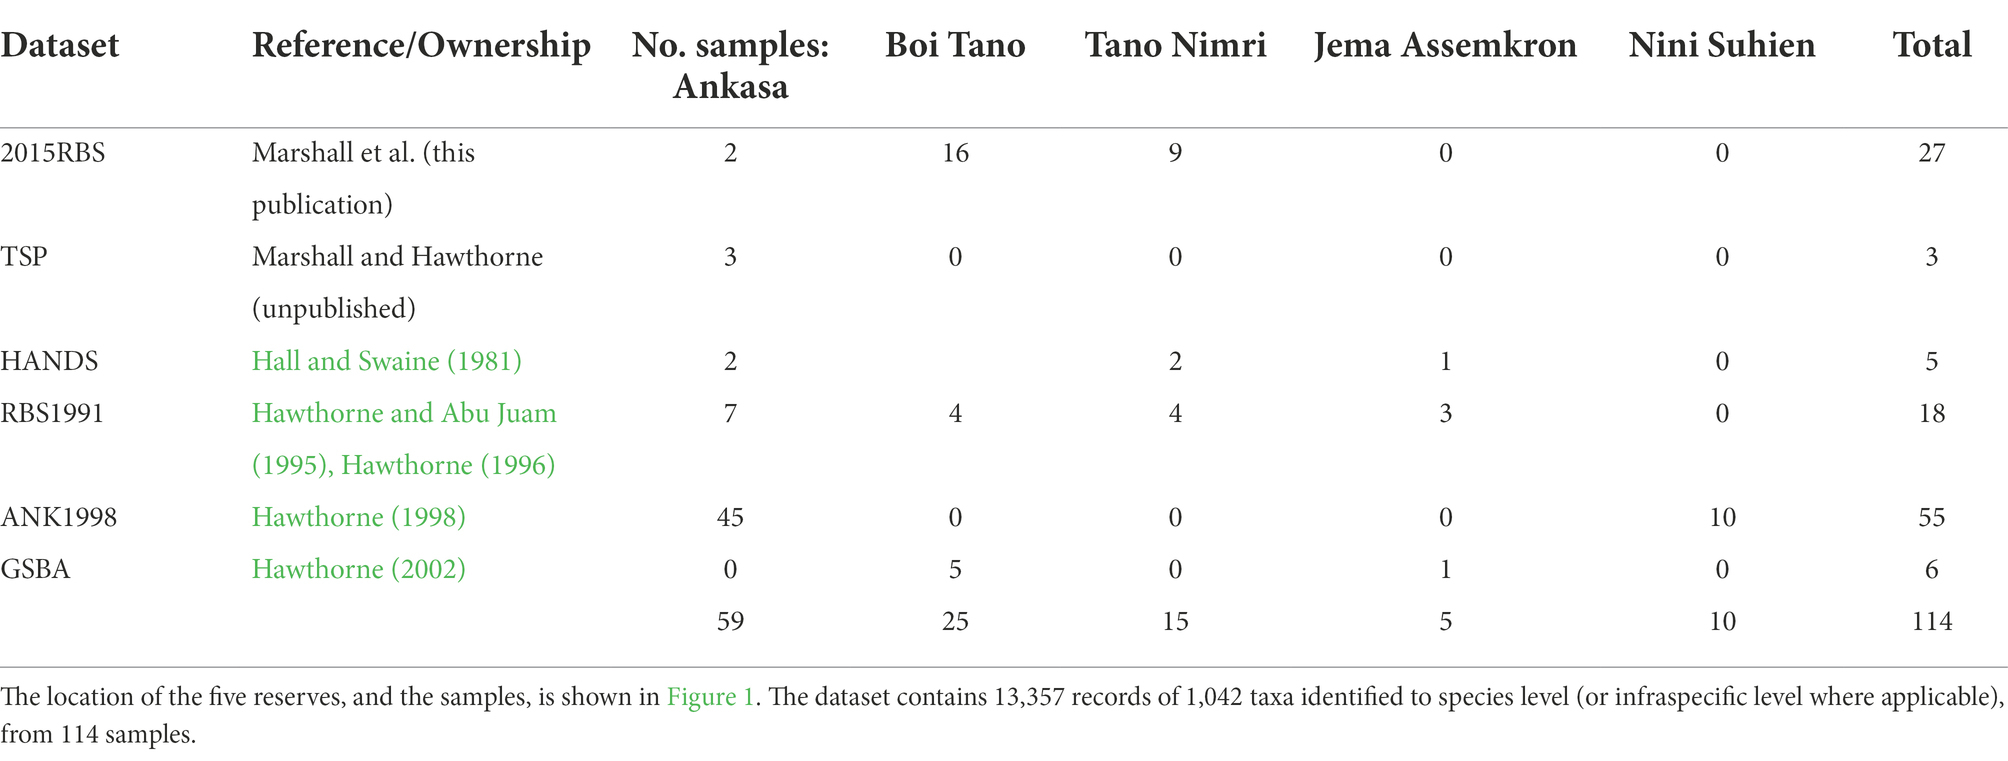
Table 1. Datasets compiled for SW Ghana.
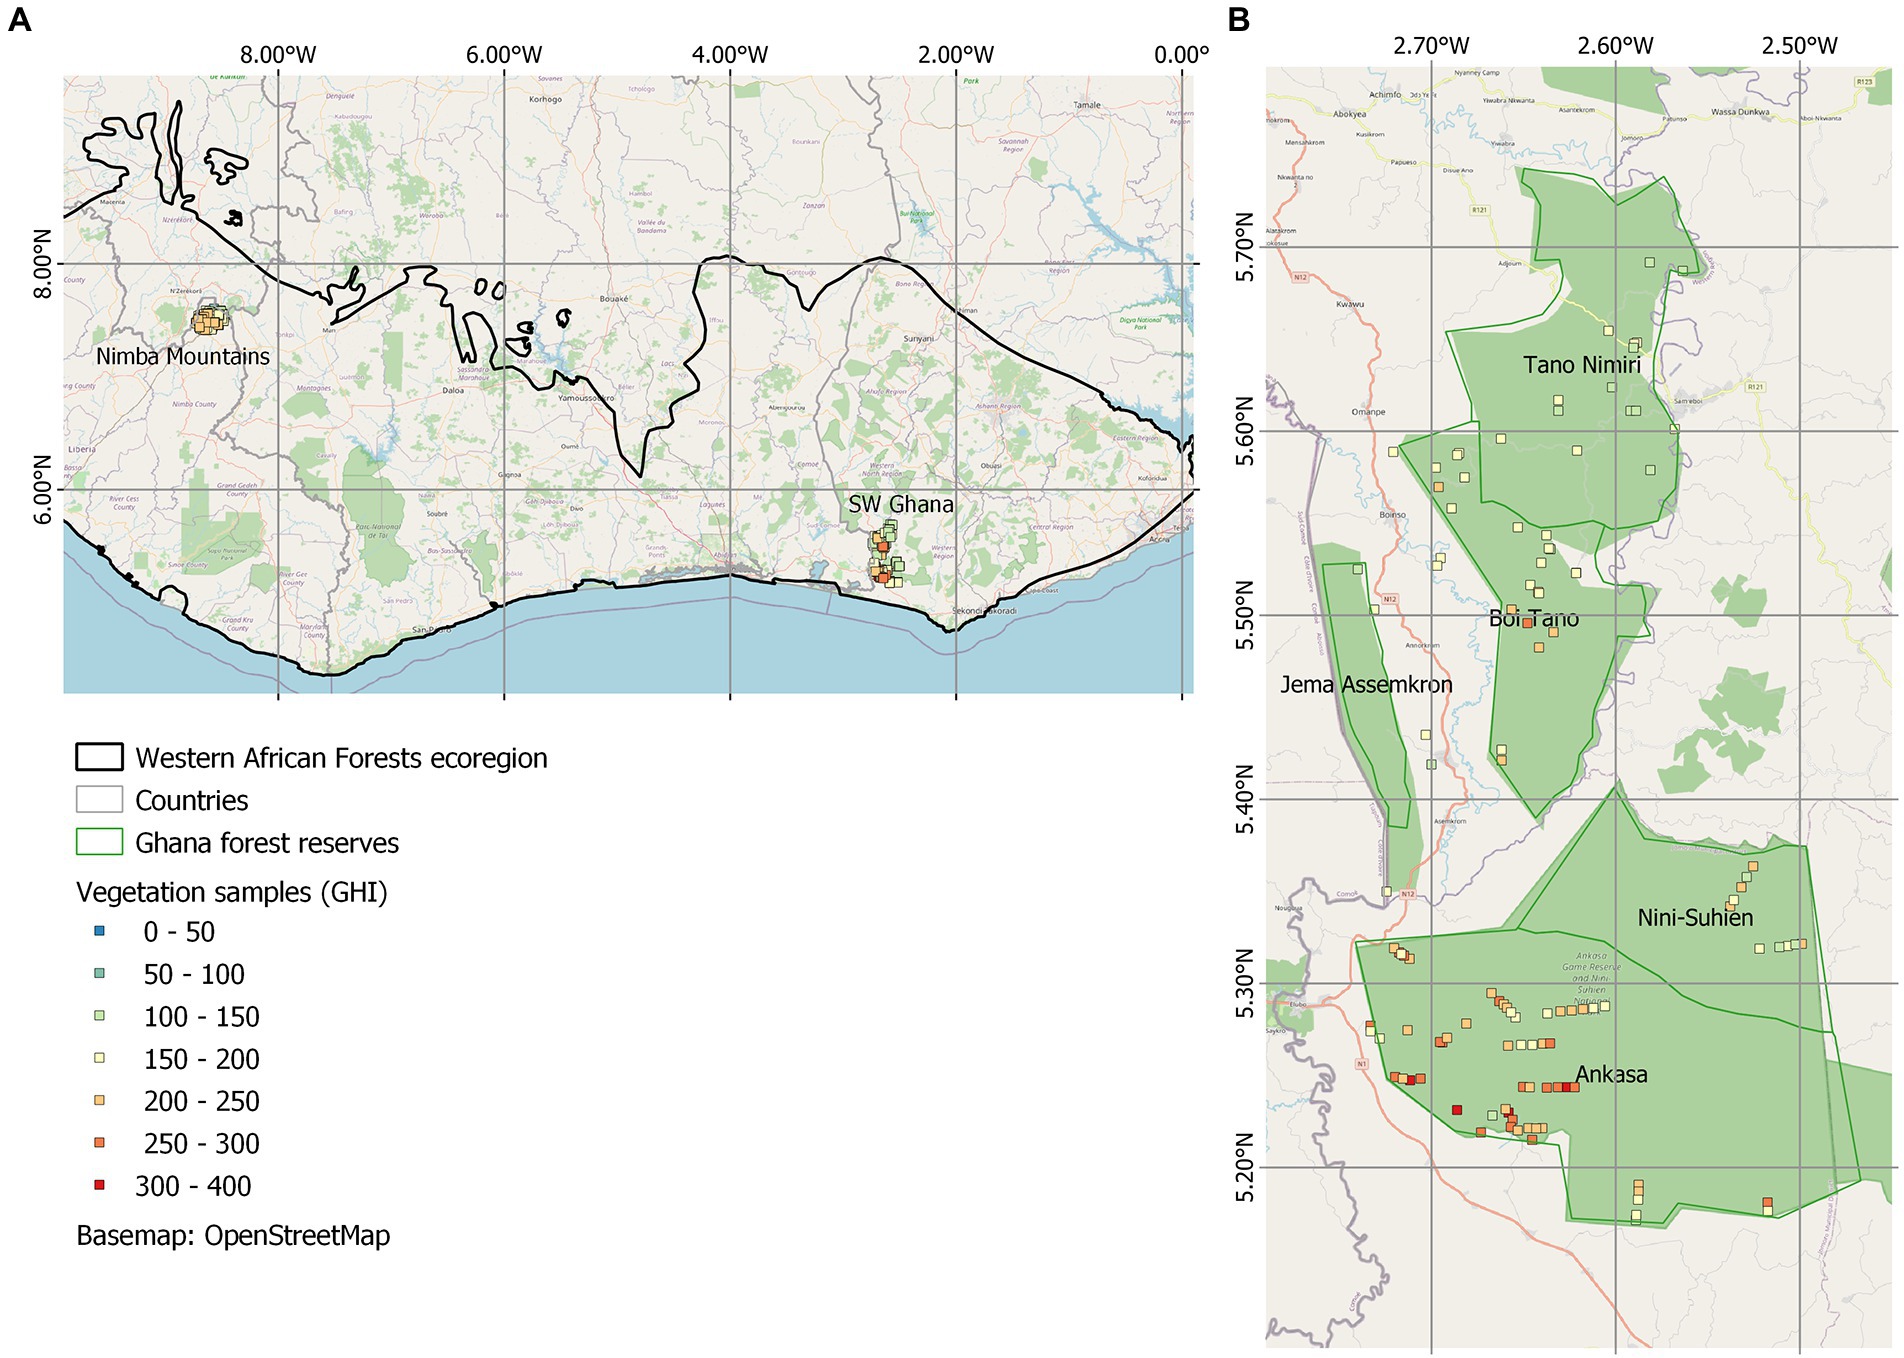
Figure 1. (A) Map of the Western African Forests ecoregion with Nimba mountains and SW Ghana study sites. (B) Sample locations of 114 samples in SW Ghana, coloured by GHI. Reserves are named. See Figure 2 for Nimba map.
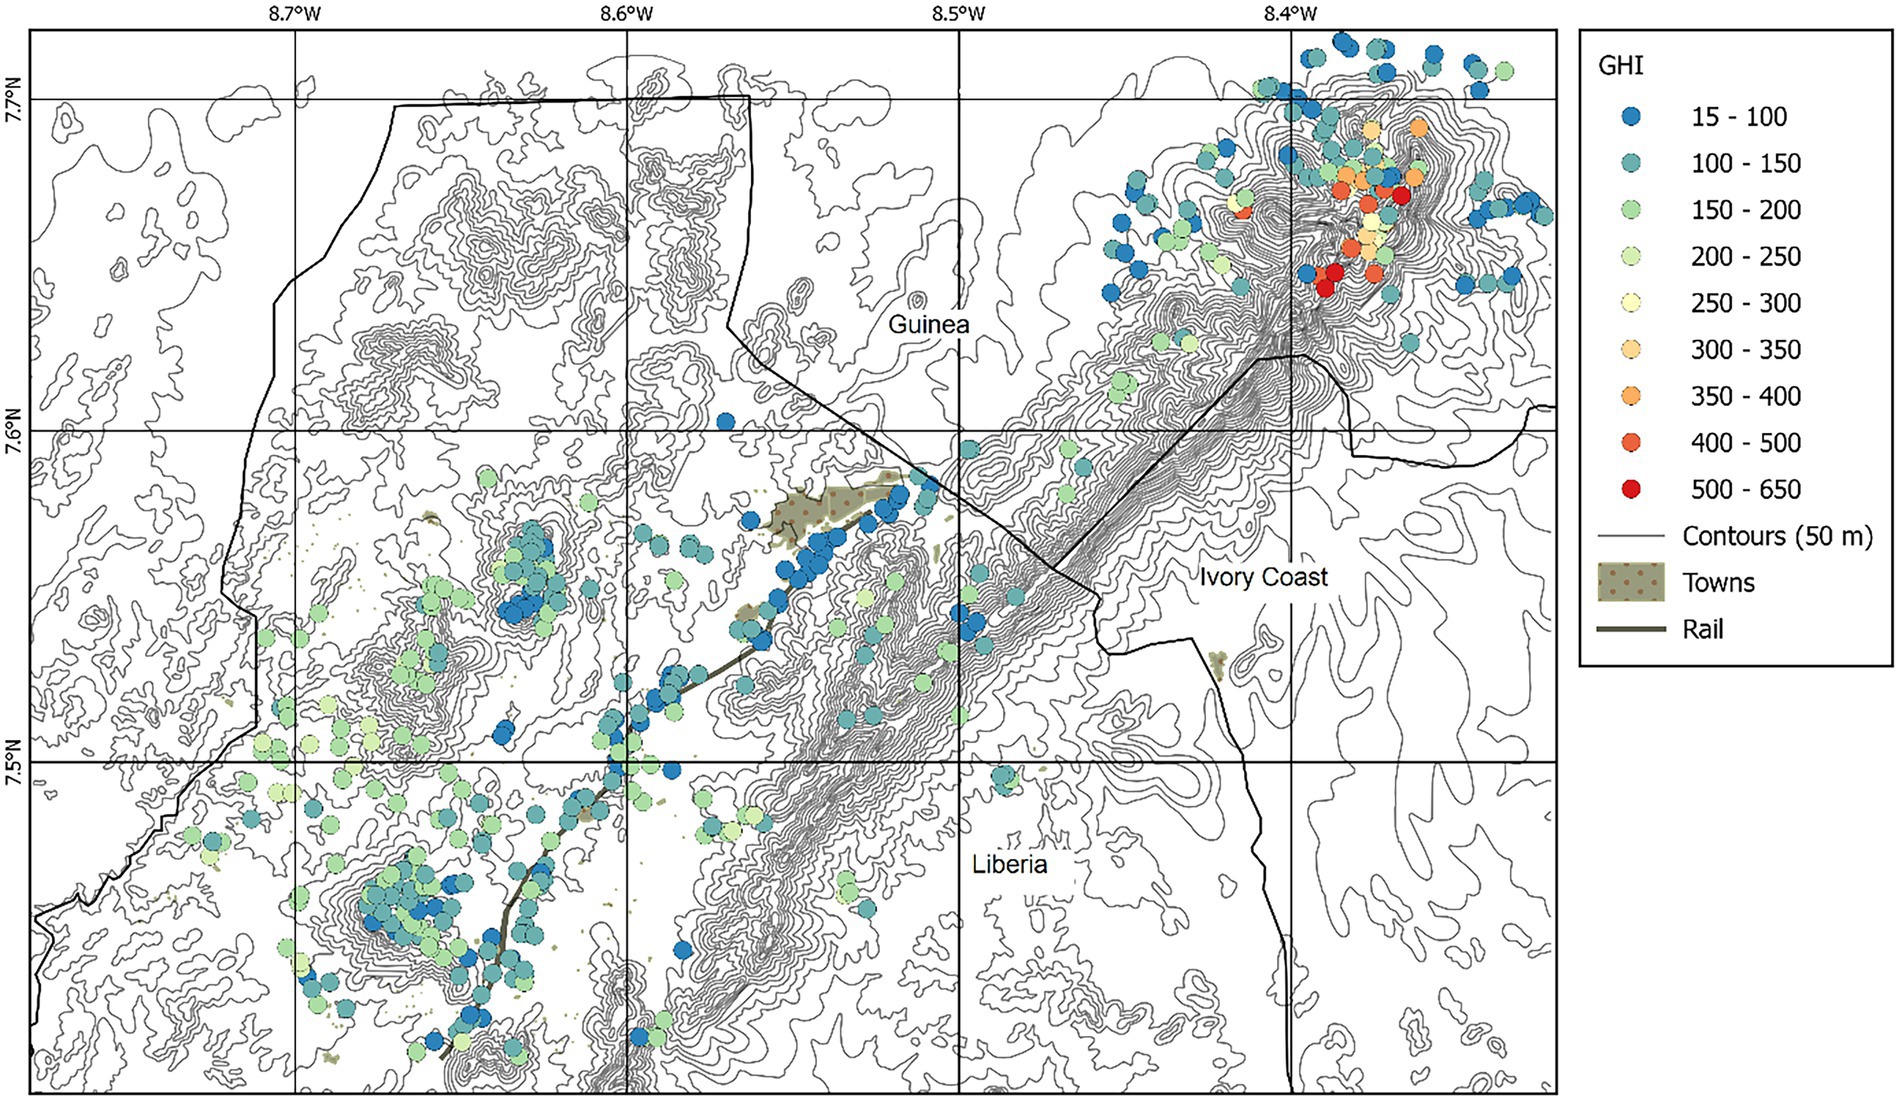
Figure 2. Sample locations of 454 samples of the Nimba Mountains, coloured by GHI. Contour lines are spaced at 50 m.
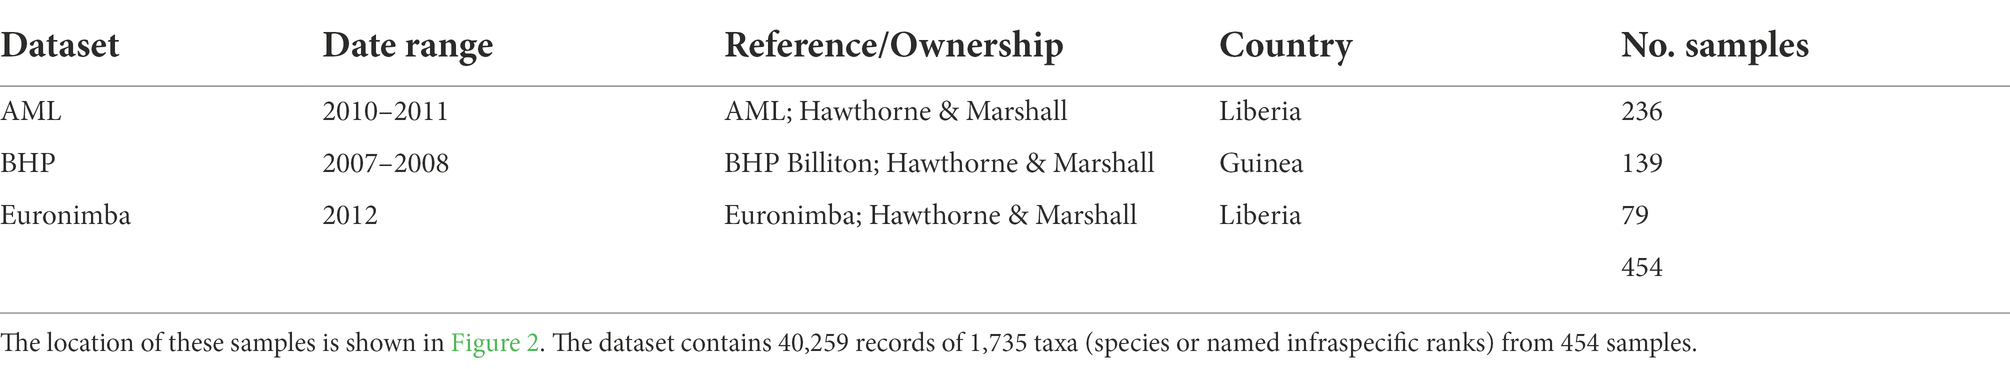
Table 2. Datasets compiled for Nimba Mountains.
With the exception of the Hall and Swaine (1981) A plots, which were 25 m × 25 m samples of the vascular flora, and B plots (the first 30–60 vascular plant species encountered), all samples were conducted using the Rapid Botanic Survey (RBS) method (Hawthorne and Marshall, 2016): RBS samples were bounded by survey effort rather than size, with the aim of recording all vascular plant species within a specified vegetation type and landscape unit, and enumerating at least 40 individual canopy trees. Samples typically took around 3 h to enumerate. Sampling was carried out in a stratified systematic manner, with samples located within all major vegetation types of the two study regions to cover geographical scope of the sites (Figures 2, 3). Latitude, longitude (decimal degrees), altitude (m asl), reserve name, landscape notes, soil notes and vegetation notes were recorded for samples in the field. The abundance of understorey species in each sample was coded as ‘1’ for present, ‘2’ for common or ‘3’ for dominant. Canopy trees were counted. For compatibility of canopy data with understory data during analysis, we subsequently and additionally coded canopy tree species ‘1’ for abundance if they accounted for less than one third of the counted stems in their sample, ‘2’ for one to two thirds, and ‘3’ for > two thirds of stems counted in the sample.
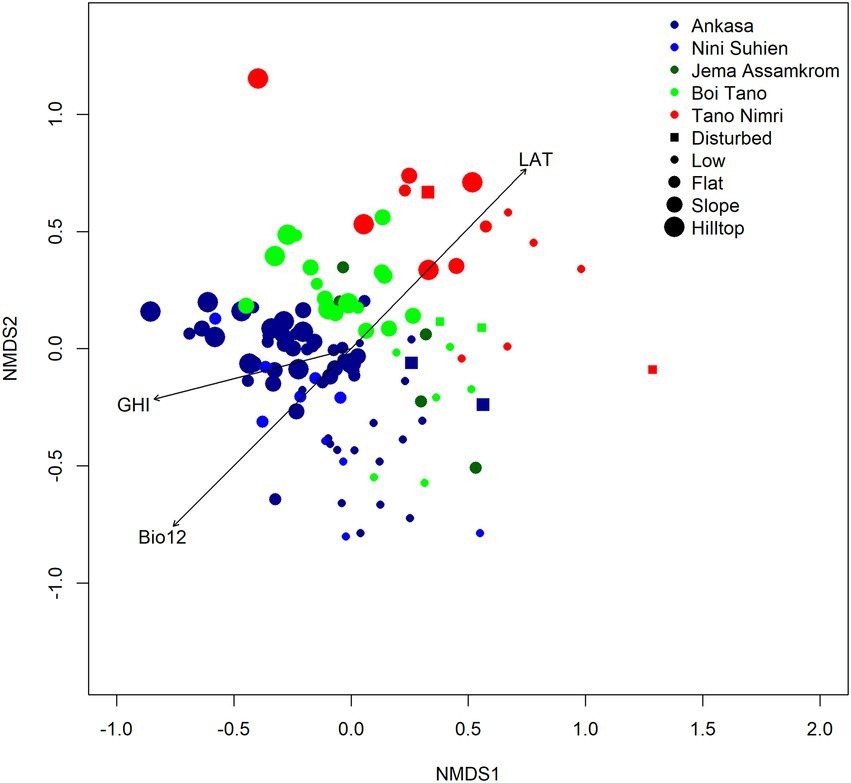
Figure 3. NMDS ordination of 114 samples of SW Ghana. Samples are coloured by reserve and sized by landscape position. Disturbed samples shown as squares. Significant environmental vectors are fitted (LAT = Latitude, Bio12 = annual mean rainfall).
Records identified to genus or family level only were dropped from the datasets. Analysis was conducted at the lowest named taxonomic level (species or named infraspecific taxa). Any record carrying a synonymous name was updated to the accepted name before analysis, using the taxonomic framework of the African Plants Database (Conservatoire et Jardin botaniques de la Ville de Genève and South African National Biodiversity Institute Pretoria, 2016). Specimens were collected of all plants for which identification was not absolutely certain. Specimens are housed at the Daubeny Herbarium in Oxford (FHO), with AML in Liberia, and with Euronimba in Liberia. Permission to collect and export plants in SW Ghana was obtained from the Ministry of Lands and Natural Resources, Samartex, and Wildlife Division for Ankasa RR, and in Nimba, from the concession managers (AML, BHP, Euronimba) and the CITES offices of Liberia and Guinea.
Response variable
Endemism patterns were represented using a quantitative index called the Genetic Heat Index (GHI; Hawthorne, 1996; Marshall et al., 2016). GHI is a continuous metric representing the weighted global ranges (endemism) of the species present in a plant community; it increases with the concentration of globally rare species in a sample, so that vegetation samples with higher GHIs are ‘hotter’ and home to a higher proportion of globally rare plants. The metric is similar to range size rarity, except that species’ ranges are measured globally at one-degree square resolution rather than within the study area at any resolution, species ranges are categorised into four groups, rather than being treated continuously, and the metric includes no measure of species richness, as is sometimes the case with range size rarity metrics. These modifications account for patchy distribution data associated with tropical African plants.
GHI was calculated as the proportion of species belonging to each ‘Star’ rating within a sample. Black (BK) Star species are the world’s rarest species, found in 2.7 degree squares on average globally. Green (GN) Star species are the commonest, found in >50 degree squares, and Gold (GD) and Blue (BU) Star species are intermediate. Star ratings for species follow (Marshall et al., 2016). Each Star rating carries a weight (Black = 27, Gold = 9, Blue = 3, Green = 0). The weights are inverse to the species’ range sizes, with Black Star species three times rarer and with a three times larger weight than Gold Star species; Gold Star species are three times rarer than Blue Star species, which are three times rarer than Green Star species. The weight for Green Star species is set to 0 rather than 1 so that the index begins at 0.
The GHI for each sample was calculated from the species present, using the following formula, where NBK, NGD, NBU and NGN are the number of Black, Gold, Blue and Green Star species in a sample, and WBK, WGD and WBU are the respective weights (Equation 1).
Equation 1. GHI calculation
Explanatory variables
Disturbance scores were calculated for each sample using the Pioneer Index, PI (Hawthorne, 1996). Guilds follow Hawthorne (1996) unless otherwise updated. PI is calculated using the following formula, where NP is the number of Pioneer species, NNPLD is the number of non-pioneer light demanders, and NSB is the number of Shade-bearers (Equation 2):
Equation 2. Pioneer Index calculation
Pioneer species (P) are defined as species which regenerate in gaps, and tend to dominate early successional forest; crowns of all sizes of tree tend to be more exposed than average for the size class. Seedlings of non-pioneer light demanders (NPLD) are more commonly found in shade than gaps, although saplings are soon very light demanding; the crowns of medium and large trees tend to be more exposed than average for the size class. All sizes of species of the shade-bearer guild (SB) can be common in undisturbed forest, especially the understorey, and all sizes of tree have crowns which tend to be more shaded than average for the size class. Species of the swamp guild are largely restricted to riversides or periodically inundated or permanent swamps. A swamp index was defined as the proportion of swamp species found within the flora of a sample. For the Nimba dataset, we also recorded the age of the vegetation by asking when the land was last cleared.
Bioclimatic variables (Bio1 and Bio12) were extracted from the WorldClim version 1.4 resource for the sample locations at 30 arc-second resolution (c. 1 km2) using the packages ‘raster’ (Hijmans, 2016) and ‘sp’ (Pebesma and Bivand, 2005; Bivand et al., 2013) in R version 3.3.1. Variables were not transformed prior to analysis. Although 19 Bioclim variables are available, to reduce substantial collinearity amongst the variables we chose to work only with Annual Mean Temperature (Bio1), and Annual Precipitation (Bio12).
Latitude, longitude (decimal degrees), altitude (m asl), reserve name, landscape notes, soil notes, and vegetation notes were recorded for samples in the field. In Nimba only, we asked local residents to estimate the date that the vegetation sample was last cleared so that the age of the vegetation in years could be recorded. This information was gathered informally through conversation with our local guides: local residents invited to work with us for the day, often farmers or hunters from the area.
Analysis
To visualise environmental correlates with GHI in an exploratory way, samples from SW Ghana only were ordinated using NMDS with a Bray–Curtis dissimilarity matrix on abundance data with the package ‘vegan’ (Oksanen et al., 2016) in R version 3.3.1 (Figure 3). Data were not transformed and no outliers were removed. Header variables were fitted to the ordination space using the ‘vegan’ function ‘envfit’ and visualized. Mapping was conducted in QGIS version 3.16.9 (Figures 1, 2).
General linear models (Figures 4, 5) were fitted using base R. The minimum adequate model was sought from the variables annual mean temperature (Bio 1), annual precipitation (Bio12), Altitude (ALT), landscape position (Hilltop or Non-hilltop; included only for the Ghana dataset only where the altitude range is smaller), and Pioneer Index (PI), including a quadratic term for altitude in the Nimba dataset after initial inspection of the data, and interaction terms between variables. All variables were fitted initially and the least significant term was removed each time. The response variable GHI was log transformed before model fitting. Explanatory variables were not transformed.
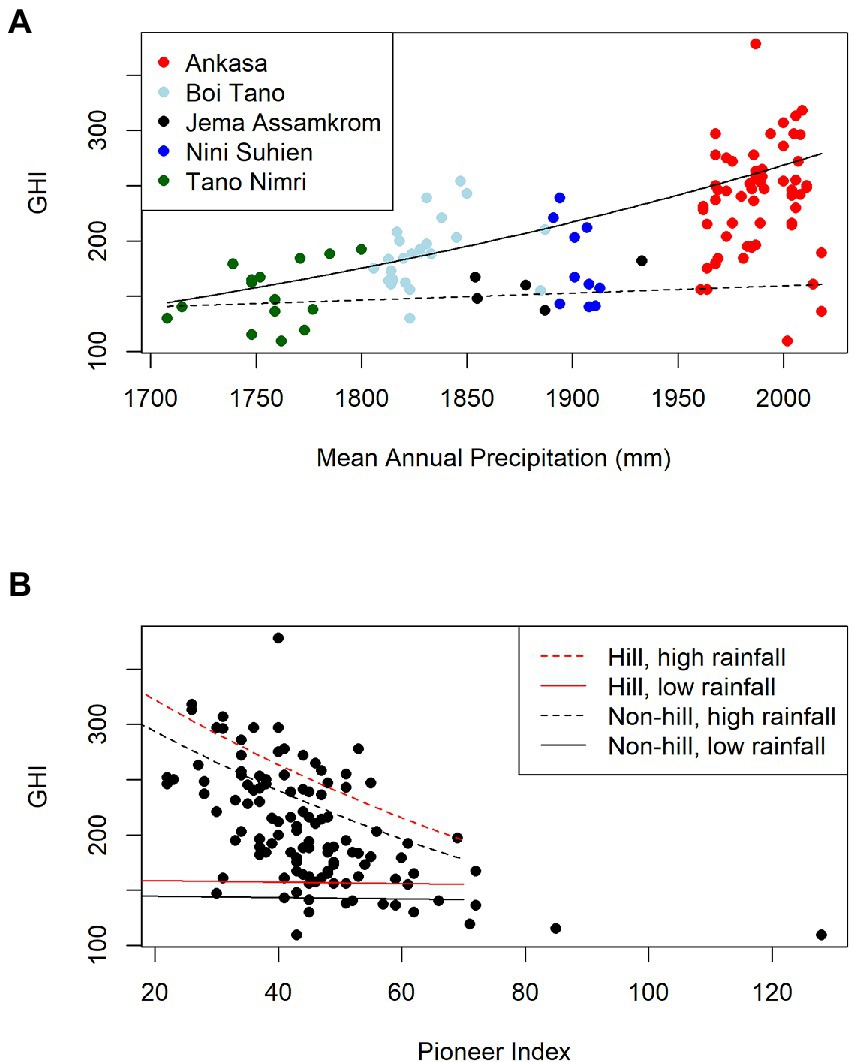
Figure 4. General linear model for GHI in SW Ghana. GHI = exp. (0.109 + 0.0523 × PI + 0.00291 × Bio12 + −0.0000310 × Bio12 × PI (−0.0934 for Non-hilltops)). Adj. R2 = 56%, n = 114, all terms are significant (p < 0.05). (A) Samples are coloured by Reserve. The dotted line shows model fit with high Pioneer Index (PI; PI = 80), the solid line at low PI (PI = 25), LAND is set to Non-hill. (B) Model fit for high rainfall (Bio12 = 2,018 mm, dotted lines) and low rainfall (Bio12 = 1,708 mm, solid lines); hill top samples are shown in red, non-hilltop samples in black.
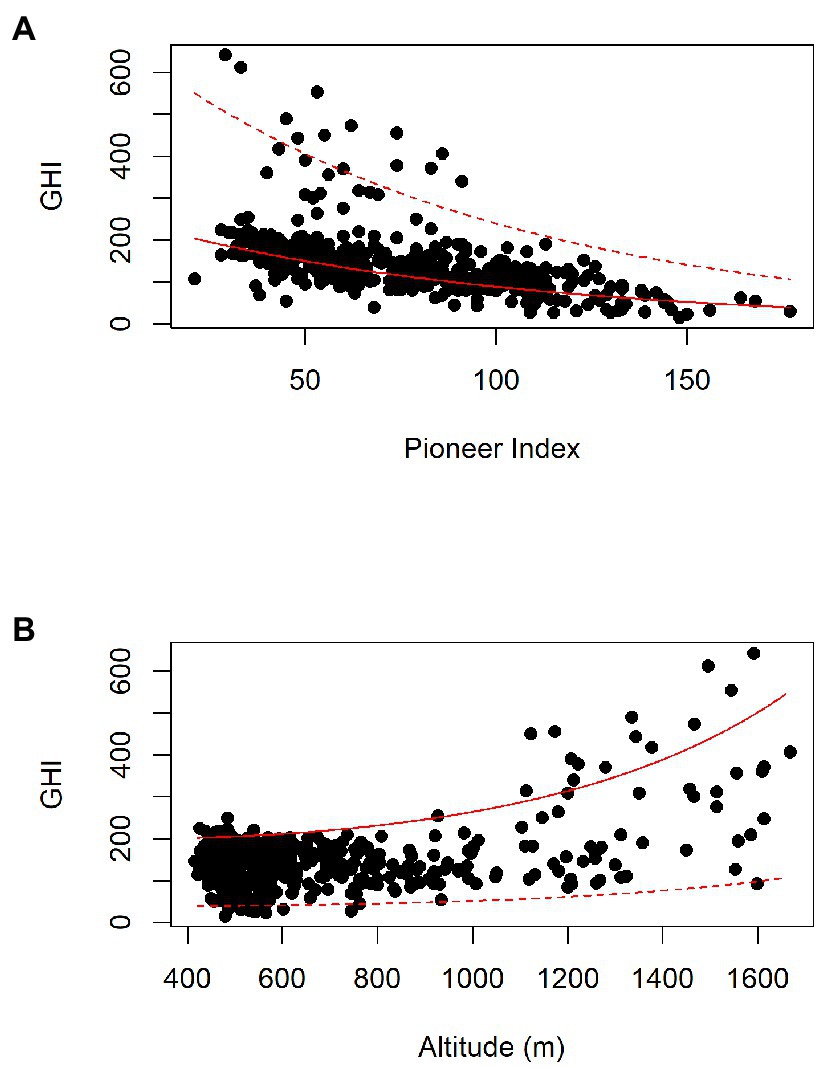
Figure 5. General linear model for GHI in Nimba: GHI = exp. (1.76 + −0.000269 × ALT + −0.0105 × PI +0.000000514 × ALT2 + −0.00181 × Bio12); Adj. R2 is 63%, n = 454, all terms are significant (p < 0.05). (A) Dotted line shows model fit at high altitude (1,660 m), solid line shows model fit at low altitude (420 m), annual precipitation (Bio12) is set to its mean value (2097 mm/year). (B) Dotted line shows high Pioneer Index (PI = 177), solid line shows low Pioneer Index (PI = 22).
The statistical population of GHI scores has a normal distribution, except that some values cannot be achieved on account of the weights being multiples of three, and the index being bounded at 0 and 2,700. The GHI of ecological samples does not always follow a normal distribution, depending on the location and vegetation types sampled; such scores tend to follow a log normal distribution (Gaston, 1996). In the SW Ghana dataset, GHI scores were log transformed to produce GHI scores and model residuals with a normal distribution (Shapiro–Wilk test p = 0.36 for log(GHI), p = 0.79 for residuals). In the Nimba dataset, the transformation rendering the dataset most normal (natural logarithm) produced GHI scores which remained right-skewed and non-normal (Shapiro–Wilk test, p < 0.0005). The dataset can be made normal by removing the 23 samples with GHI over 300, but this would remove much of the interesting signal from the dataset. The general linear model presented has residuals which were not normally distributed (the residuals are larger at higher GHIs than lower GHIs). The model’s general conclusions were therefore confirmed by fitting local regressions to the dataset, and by analysis of the normal subset of the dataset (not presented).
To explore the relationship between disturbance and GHI more directly, a general linear model of GHI by number of years since disturbance (Figure 6) was fitted for 46 samples of the Nimba dataset only, where the data were available, using base R version 3.3.1. As another way to confirm the relationship between disturbance and GHI, we also calculated the mean GHI for all species in the Pioneer guild, non-pioneer light demander guild, and Shade-bearer guild.
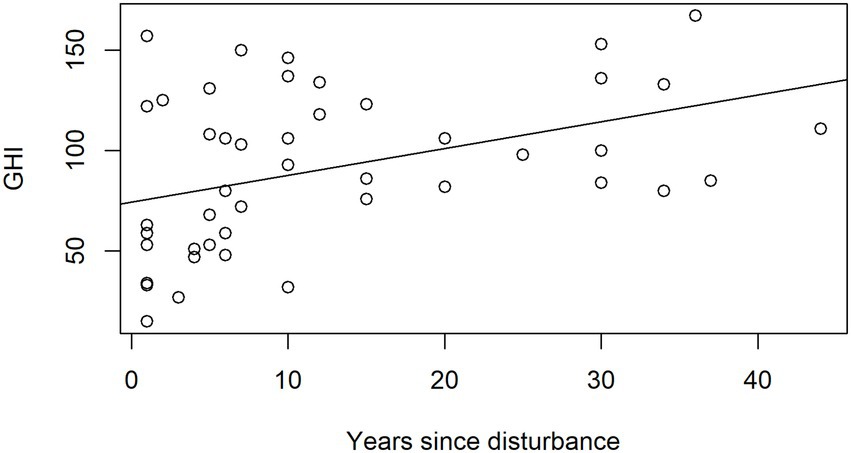
Figure 6. General linear model of GHI by number of years since disturbance, for 46 samples of the Nimba dataset. GHI = 74 + 1.34 × AGE, p = 0.005, R2 = 15%.
Results
South west Ghana
In south west Ghana, bioquality (GHI) are higher in the south than in the north, although not all southern samples are ‘hot’ (Figure 1). That is, samples from further south have higher concentrations of globally rare species than samples from further north. The position of samples in ordination space is related to the main environmental gradients, with samples from northern reserves adopting higher axis 2 positions than samples from further south (Figure 3). The environmental vector latitude (LAT) is significantly positively correlated with NMDS axis 2 (p < 0.001, correlation coefficient = 0.73). Axis 2 represents the latitudinal climatic gradient, while Axis 1 represents local water availability, i.e., the presence of swamps or hilltops: Swamp species have higher median axis 1 scores than do non-pioneer species. Low lying samples from all reserves have higher axis 1 scores than samples from higher local landscape positions. Two parallel gradients of species turnover within south west Ghana can thus be detected: one for hill top and flat land from Tano Nimri south to Ankasa, and one for low lying samples from Tano Nimri to Ankasa. GHI increases with lower axis 2 scores (towards the south), and with lower axis 1 scores (towards higher, less disturbed landscape positions). GHI is correlated with both axes, suggesting that both latitudinal and local variation is important to account for in order to make realistic GHI predictions at the sample scale.
We formalised these relationships by modelling the relationship between GHI and modern climatic variables, disturbance, and local landscape position. The minimum adequate general linear model fitted to the dataset retains the significant variables mean annual rainfall (Bio12, p < 0.0001), landscape position (a categorical variable, Hilltop or Non-hilltop, p = 0.0351), Pioneer Index (PI, p = 0.388), and the interaction between Pioneer Index and rainfall (PI:Bio12, p = 0.0182). The adjusted R2 for the model is 56%, n = 114. An equation is presented for Hilltops and Non-hilltops:
The highest GHI scores (>300) are associated with relatively undisturbed samples with highest rainfall in the south (Figure 4). The interaction between annual precipitation (Bio12) and the Pioneer Index (PI) means that the slope of PI is different depending on rainfall, and vice versa. When PI is low (samples are undisturbed), GHIs are around 125 points higher for samples with high rainfall (GHI c. 275) than for samples with low rainfall (GHI c. 150), and the slope of rainfall on GHI is strongly negative (Figure 4A, solid line). When PI is high (samples are disturbed), the slope of rainfall on GHI is almost flat, meaning that disturbed samples always have the same (low) GHI, regardless of their rainfall (Figure 4A, dashed line). GHI decreases linearly with increasing disturbance (PI), but much more steeply for samples with high rainfall compared with samples with low rainfall (Figure 4B). For the less disturbed samples, GHIs are much higher with high rainfall than low rainfall. In the more disturbed samples, both high and low rainfall samples converge on generally low GHIs. Being on a hill top adds c. 25 points to the GHI.
Nimba mountains
The major feature of the Nimba dataset is the Nimba Mountains themselves, and compared with the SW Ghana dataset the altitudinal range is dramatic (415–1,668 masl, cf. 40–181 masl). The highest GHI scores (>300) are found at high altitude in Guinea, where some samples exceed 600 (Figure 2). Disturbance decreases GHI, and altitude increases it (Figure 5). The minimum adequate general linear model retains the significant terms altitude (ALT2, p = 0.00188), Pioneer Index (PI, p < 0.0001), and annual precipitation (Bio12, p < 0.001). Adj. R2 is 63% and n = 454. The equation is:
Disturbance decreases GHI scores linearly: holding Altitude constant, increasing the PI by 10 points decreases GHI by 10 points. GHI increases non-linearly with altitude: GHI increases more for every 100 m ascent at higher altitudes than at lower altitudes, particularly over c. 1,000 m. High GHIs (over 300) are only found in areas >1,000 masl, and in samples where the Pioneer Index is less than 100. Areas above 1,000 m can also have low GHIs, particularly if they are disturbed. Altitude increases GHI, but only in relatively undisturbed vegetation.
Pioneer and non-pioneer light demanders (NPLD) species have lower GHI than shade bearers (on average, shade-bearing species are globally rarer than pioneers and NPLDs). In Nimba, the GHI of the pioneer guild overall is 81, for the NPLD guild overall is 107, and for shade-bearers is 174. The model of GHI ~ AGEYEARS tells us that 1 year of age adds 1.34 to the GHI of a sample, between 1 and 44 years of age (the range of our data); n = 46, p = 0.005, R2 = 15% (Figure 6).
Discussion
Endemism patterns and predictors of endemism
Our aim was to present the endemism patterns found across 114 and 454 vegetation samples of the vascular flora in the SW Ghana and the Nimba Mountains hotspots, using GHI as our index of endemism. GHI represents the concentration of globally rare plants in the vegetation sample, so that areas home to a higher proportion of range restricted plants have a higher GHI. High plant endemism in south west Ghana is confined to relatively undisturbed samples, decays linearly to the north, and peaks on hilltops (Figure 1). Boi Tano has GHI scores intermediate between Tano Nimri and Ankasa, and is home to at least one very globally rare species not found in Ankasa (Momordica sylvatica). The highest plant endemism of the Nimba Mountains is found in relatively undisturbed samples over 1,000 m (Figure 2).
We tested the hypotheses that modern climatic variables (rainfall and temperature), altitude, disturbance and local landscape position (SW Ghana only) were significant predictors of plant endemism at sample scale, seeking generalization across the two. In both SW Ghana and Nimba, disturbance, annual precipitation and altitude (or local landscape position in Ghana) were significant predictors of endemism, with disturbance having a negative relationship, and altitude and precipitation a positive relationship. Mean annual temperature was not a significant predictor of endemism in either study site.
The Pioneer Index is a significant term retained in both the SW Ghana and the Nimba models, indicating a degree of generalisability regarding the impact of disturbance on the distribution of globally rare species within Upper Guinean hotspots. The strong influence of disturbance on GHI scores in the southern-most reserves of SW Ghana is sobering, because the great majority of samples in this dataset are relatively undisturbed compared with land outside the forest reserves (PI < 70). The theoretical maximum for PI is 200, where every species is a pioneer or a non-pioneer light demander. The vast majority of the samples in this dataset are from closed or slightly open forest inside forest reserves, and even within these vegetation types the signature of disturbance on GHI can be observed, as was the case in Tai National Park (Denguéadhé Kolongo et al., 2006). Disturbance in these forest reserves is largely due to logging (except in unlogged Ankasa), flowing water in the wet season, natural tree falls and animal activity, and moderate human activity such as footpaths. Undisturbed forests further north already have much lower GHIs, and here disturbance has little impact on the GHI.
The influence of disturbance on GHI scores is mirrored in the Nimba dataset, where the hotspot of the Nimba Mountains is confined to relatively undisturbed samples over 1,000 m. In Nimba, GHI decreases more steeply at high altitude, where GHIs are otherwise high, than at lower altitudes, where GHI is generally lower. Disturbance in the Nimba dataset is the result of farming and iron ore mining operations as well as natural disturbances, and the range of PIs is wider than in the SW Ghana dataset (c. 0–150). GHI increases by 1.2 points with each year since vegetation was last cleared (and the Pioneer Index decreases), meaning that with every year the concentration of globally range-restricted species found in the vegetation increases, indicating good recovery potential of the vegetation if left undisturbed.
Altitude is an important and significant predictor of plant endemism in the Nimba Mountains, unsurprising given the very substantial elevation range. In SW Ghana, where the altitudinal range is small, we found that altitude was not a significant predictor of endemism. However, the local landscape position of vegetation samples in SW Ghana (hilltop vs. non-hilltops, i.e., local topography) did have a significant predictive relationship with GHI, with hilltops having higher plant endemism than non-hilltops. Maximum altitude was significantly positively correlated with species endemism at broad scales across Africa, but explained only 4% of the variation observed (Linder, 2001). Wieringa and Poorter (2004) found no correlation between species endemism and altitude in Upper Guinea. Topographic complexity, rather than altitude, has been linked to high biodiversity (Plana, 2004; Barthlott et al., 2007), although topodiversity is relatively low in Upper Guinea at least around SW Ghana, but higher for the Nimba Mountains (Mutke et al., 2001).
In both Nimba and SW Ghana, our results confirm the importance of annual rainfall for predicting the occurrence of globally rare species, with higher rainfall associated with higher plant endemism in both datasets. Rainfall plays a significant role in shaping timber species distributions across west Africa (Maharjan et al., 2011), and declining rainfall as a result of climate change is likely to exacerbate threats to restricted range species which are already restricted through habitat losses to disturbance. Annual mean temperature was not a significant predictor of plant endemism in either dataset. Environmental variables (rainfall, soil water holding capacity, altitude, soil fertility, soil pH and cation exchange capacity) were all significantly correlated with endemic richness in Upper Guinea, and rainfall in particular explained a large amount of the variation in rare species richness, with the most drought intolerant species having the smallest distributions (Wieringa and Poorter, 2004).
The high rainfall regime in the far south of Ghana is geographically isolated from other high rainfall areas, and is restricted even within southwest Ghana. This means that species adapted to these modern day, very high rainfall, conditions in the south west of Ghana must disperse a long way, over unsuitable intervening habitat, if they are to be globally widespread today. This modern day climatic isolation with respect to rainfall is likely to be responsible for maintaining the relatively higher preponderance of range-restricted species in south west Ghana. The Nimba high altitude flora (Guinea savanna) is very different floristically to the lower altitude forests, with Afromontane savannas not at all common in the region. These are two examples of edaphic islands acting as drivers of spatial isolation and reservoirs of narrow endemics (Buira et al., 2020).
Implications for conservation
From the point of view of the conservation of globally rare plants in SW Ghana, it is important to keep additional disturbance in the south, particularly Ankasa, to a minimum, as is the current practice. Boi Tano, which is actively logged, has GHI scores high enough to be brought down by disturbance, and the importance of leaving enough time for forest to regenerate between felling cycles, and for maintaining the integrity of the unloggable Globally Significant Biodiversity Areas, is highlighted by our results. In Boi Tano we found 8 Black Star species (very globally restricted species, <3 degree squares), including Momordica sylvatica, as yet not found outside of Boi Tano. We found 7 Black star species in Tano Nimri, including Ficus pachyneura on the Tano Nimri/Boi Tano border. This speaks to the high conservation value of Boi Tano forest reserve, and even Tano Nimri, but with the exception of F. pachyneura and M. sylvatica, all these species are also found in Ankasa. In the Nimba moutains it also advisable to keep unnecessary disturbance to a minimum. Establishing community forests which may be left relatively undisturbed amid farming and mining activities would be valuable, as would restoration of the highest altitude Guinea savanna vegetation on the Nimba mountain peaks.
Worldwide, biotic homogenization results in geographically widely distributed species increasing to the detriment of native species, even if species richness remains relatively unaltered or even increases (Dornelas et al., 2014; Thom and Seidl, 2016; Marconi and Armengot, 2020). Our results show that the species favoured by increased disturbance regimes in west African forest hotspots are not the restricted range species we care most about conserving.
Future directions
We have not in this manuscript tested the significance of past climates, nor the stability of past climates, in driving endemism, though this would be informative. Endemism hotspots have been linked to stable climatic refugia (Barratt et al., 2017; Harrison and Noss, 2017), and both Nimba and SW Ghana have been suggested as climatic refuges over paleo timescales (Hamilton, 1976; Brenan, 1978; Fjeldsa and Lovett, 1997; Linder, 2001). SW Ghana was likely to have remained forested during the Pleistocene, on the evidence of palynological studies of a deep-sea marine core off the Dahomey Gap (Maley, 1996). The Nimba Mountains would have provided a range of conditions suitable for differently adapted species during periods of climate change, due to their altitude (Maley, 1996; Van Rompaey, 1996). Paleo-climate modelling, and by extension paleo-vegetation modelling, is subject to great uncertainty at geographic resolutions finer than 0.5 degree square resolution (Hardy et al., 2013; Varela et al., 2015), so it has not been possible to test explicitly the importance of, e.g., Pleistocene annual rainfall on modern endemism rates at the sample level. However, it is relevant to note that we can explain 63 and 56% of the variation in GHI scores within the Nimba and SW Ghana hotspots without invoking past climate changes.
In both datasets, accounting for disturbance has a marked effect on plant endemism rates, at least within areas which would otherwise be rich in restricted range species. In SW Ghana, topographic position was also a significant predictor of endemism. Both disturbance and local topography can change at very local geographic scales and over short timescales. The implication for models of endemism of broader scope, and higher resolution, is that they disguise considerable variation at the local scale.
The generality of the patterns presented here may be determined by analysing sample datasets from other African hotspots, where we might expect the relationships to hold, in trend if not in absolute terms.
Data availability statement
The raw data supporting the conclusions of this article will be made available by the authors, without undue reservation.
Author contributions
CM, JD, MM, PE, JK, OH, DB, and WH conducted field work and identified the specimens. CM conducted the analysis and wrote the text with input from coauthors. All authors contributed to the article and approved the submitted version.
Funding
Funding for fieldwork in southwest Ghana received from Oxford University Expeditions Council; Department of Plant Sciences, University of Oxford; Merton College, University of Oxford; support for writing (CM) from King’s College, University of Cambridge; Global Challenges Research Fund. The authors declare that this study received funding from ArcelorMittal Liberia, BHP Billiton and Euronimba. The funder was not involved in the study design, collection, analysis, interpretation of data, the writing of this article, or the decision to submit it for publication.
Acknowledgments
We thank Samartex, FORIG and the Ghana Herbarium for facilitating the new field work in SW Ghana. We acknowledge the support of the ODA to WH for previous field work in SW Ghana. We thank John Howell and Jamison Suter of ArcelorMittal Liberia and BHP Billiton for supporting the field work in Liberian Nimba. We thank Pierre Poilecot, Carel Jongkind, Daniel Dorbor, Wing-Yunn Crawley and Steven Heathcote, for fieldwork and identification in Nimba, and Lincy Barlon, Eric Bontor and Rosemarie Wonbenyakeh for field work in Liberian Nimba. We thank Carel Jongkind, Jan Reitsma, Elze Hesse, Danae Maniatis, Malika Virah-Sawmy, Paquilé Cherif, Moussa Diabaté, Jean-Louis Holié, Delamou Londiah, John Amponsah, Nèma Soua Loua, Gononan Traoré, Guila Gbamou and M. Zojbelema for fieldwork and identification in Guinean Nimba.
Conflict of interest
CM, JK, OH, DB, PE, and WH were contracted by AML, BHP, and Euronimba during data collection.
The remaining authors declare that the research was conducted in the absence of any commercial or financial relationships that could be construed as a potential conflict of interest.
Publisher’s note
All claims expressed in this article are solely those of the authors and do not necessarily represent those of their affiliated organizations, or those of the publisher, the editors and the reviewers. Any product that may be evaluated in this article, or claim that may be made by its manufacturer, is not guaranteed or endorsed by the publisher.
References
Anacker, B. L., and Harrison, S. P. (2012). Climate and the evolution of serpentine endemism in California. Evol. Ecol. 26, 1011–1023. doi: 10.1007/s10682-011-9532-4
Barlow, J., Gardner, T. A., Araujo, I. S., Ávila-Pires, T. C., Bonaldo, A. B., Costa, J. E., et al. (2007). Quantifying the biodiversity value of tropical primary, secondary, and plantation forests. Proc. Natl. Acad. Sci. U. S. A. 104, 18555–18560. doi: 10.1073/pnas.0703333104
Barratt, C. D., Bwong, B. A., Onstein, R. E., Rosauer, D. F., Menegon, M., Doggart, N., et al. (2017). Environmental correlates of phylogenetic endemism in amphibians and the conservation of refugia in the coastal forests of eastern Africa. Divers. Distrib. 23, 875–887. doi: 10.1111/ddi.12582
Barthlott, W., Hostert, A., Kier, G., Küper, W., Kreft, H., Mutke, J., et al. (2007). Geographic patterns of vascular plant diversity at continental to global scales. Erdkunde 61, 305–315. doi: 10.3112/erdkunde.2007.04.01
Bátori, Z., Vojtkó, A., Farkas, T., Szabó, A., Havadtoi, K., Vojtkó, A. E., et al. (2017). Large- and small-scale environmental factors drive distributions of cool-adapted plants in karstic microrefugia. Ann. Bot. 119, 301–309. doi: 10.1093/aob/mcw233
Bernardo-Madrid, R., Calatayud, J., González-Suárez, M., Rosvall, M., Lucas, P. M., Rueda, M., et al. (2019). Human activity is altering the world’s zoogeographical regions. Ecol. Lett. 22, 1297–1305. doi: 10.1111/ele.13321
Bivand, R. S., Pebesma, E., and Gomez-Rubio, V. (2013). Applied Spatial Data Analysis with R. 2nd Edn. NY: Springer.
Bossuyt, F., Meegaskumbura, M., Beenaerts, N., Gower, D. J., Pethiyagoda, R., Roelants, K., et al. (2004). Local endemism within the Western Ghats-Sri Lanka biodiversity hotspot. Science 306, 479–481. doi: 10.1126/science.1100167
Brenan, J. P. M. (1978). Some aspects of the phytogeography of tropical Africa. Ann. Missouri Bot. Gard. 65, 437–478. doi: 10.2307/2398859
Brooks, T. M., Mittermeier, R. A., Da Fonseca, G. A. B., Gerlach, J., Hoffmann, M., Lamoreux, J. F., et al. (2006). Global biodiversity conservation priorities. Science 313, 58–61. doi: 10.1126/science.1127609
Buira, A., Cabezas, F., and Aedo, C. (2020). Disentangling ecological traits related to plant endemism, rarity and conservation status in the Iberian Peninsula. Biodivers. Conserv. 29, 1937–1958. doi: 10.1007/s10531-020-01957-z
Carnaval, A. C., Hickerson, M. J., Haddad, C. F. B., Rodrigues, M. T., and Moritz, C. (2009). Stability predicts genetic diversity in the Brazilian Atlantic forest hotspot. Science 323, 785–789. doi: 10.1126/science.1166955
Conservatoire et Jardin botaniques de la Ville de Genève and South African National Biodiversity Institute Pretoria (2016). African plant database (version 3.4.0). Available at: http://www.ville-ge.ch/musinfo/bd/cjb/africa/.
Darbyshire, I., Anderson, S., Asatryan, A., Byfield, A., Cheek, M., Clubbe, C., et al. (2017). Important plant areas: revised selection criteria for a global approach to plant conservation. Biodivers. Conserv. 26, 1767–1800. doi: 10.1007/s10531-017-1336-6
De Frenne, P., Rodríguez-Sánchez, F., Coomes, D. A., Baeten, L., Verstraeten, G., Vellen, M., et al. (2013). Microclimate moderates plant responses to macroclimate warming. Proc. Natl. Acad. Sci. U. S. A. 110, 18561–18565. doi: 10.1073/pnas.1311190110
Denguéadhé Kolongo, T. S., Decocq, G., Yao, C. Y. A., Blom, E. C., and Van Rompaey, R. S. A. R. (2006). Plant species diversity in the southern part of the Taï National Park (Côte d’Ivoire). Biodivers. Conserv. 15, 2123–2142. doi: 10.1007/s10531-004-6686-1
Dobrowski, S. Z. (2011). A climatic basis for microrefugia: the influence of terrain on climate. Glob. Chang. Biol. 17, 1022–1035. doi: 10.1111/j.1365-2486.2010.02263.x
Dornelas, M., Gotelli, N. J., McGill, B., Shimadzu, H., Moyes, F., Sievers, C., et al. (2014). Assemblage time series reveal biodiversity change but not systematic loss. Science 344, 296–299. doi: 10.1126/science.1248484
Fjeldsa, J., and Lovett, J. C. (1997). Geographical patterns of old and young species in African forest biota: the significance of specific montane areas as evolutionary centres. Biodivers. Conserv. 6, 325–346. doi: 10.1023/A:1018356506390
Gaston, K. J. (1996). Species-range-size distributions: patterns, mechanisms and implications. Trends Ecol. Evol. 11, 197–201. doi: 10.1016/0169-5347(96)10027-6
Gibson, L., Lee, T. M., Koh, L. P., Brook, B. W., Gardner, T. A., Barlow, J., et al. (2011). Primary forests are irreplaceable for sustaining tropical biodiversity. Nature 478, 378–381. doi: 10.1038/nature10425
Hall, J. B., and Swaine, M. D. (1981). “Distribution and ecology of vascular plants in a tropical rainforest,” in Forest Vegetation in Ghana. The Hague, Nertherlands: Junk Publishers.
Hamilton, A. C. (1976). The significance of patterns of distribution shown by forest plants and animals in tropical Africa for the reconstruction of upper Pleistocene palaeoenvironments: a review. Paleoecol. Africa 9, 63–97.
Hardy, O. J., Born, C., Budde, K., Daïnou, K., Dauby, G., Duminil, J. Ô., et al. (2013). Comparative phylogeography of African rain forest trees: a review of genetic signatures of vegetation history in the Guineo-Congolian region. Comptes Rendus-Geosci. 345, 284–296. doi: 10.1016/j.crte.2013.05.001
Harrison, S., and Noss, R. (2017). Endemism hotspots are linked to stable climatic refugia. Ann. Bot. 119, 207–214. doi: 10.1093/aob/mcw248
Hawthorne, W. D. (1996). Holes and the sums of parts in Ghanaian forest: regeneration, scale and sustainable use. Proc. R. Soc. Edinburgh Sect. B Biol. Sci. 104, 75–176. doi: 10.1017/S0269727000006126
Hawthorne, W. D. (1998). Plants in Ankasa, Nini-Suhien, and Bia.Review of existing knowledge, results from a new survey and recommendations for management plans. Protected Areas Development Programme, Western Region, Ghana. ULG Consultants LTD in association with S. A. Agrer, N.V.
Hawthorne, W. D. (2002). Final report of the floral survey of the Biodiversity Component of the NRMP. Forestry Commission, Biodiversity Conservation Component. Ministry of Lands and Forestry, Ghana.
Hawthorne, W. D., and Abu-Juam, M. (1995). Forest Protection in Ghana. IUCN/ODA/Forest Department Republic of Ghana, Gland, Switzerland, and Cambridge, UK, xvii + 203.
Hawthorne, W. D., and Marshall, C. A. M. (2016). A manual for rapid botanic survey (RBS) and measurement of vegetation bioquality. Available at: http://herbaria.plants.ox.ac.uk/bol/oxford/Survey.
Hijmans, R. J. (2016). raster: Geographic Data Analysis and Modeling. R package version 2.5-8 Available at: https://CRAN.R-project.org/package=raster.
Hijmans, R. J., Cameron, S. E., Parra, J. L., Jones, P. G., and Jarvis, A. (2005). Very high resolution interpolated climate surfaces for global land areas. Int. J. Climatol. 25, 1965–1978. doi: 10.1002/joc.1276
IUCN (2016). A global standard for the identification of key biodiversity areas, version 1.0. IUCN, Gland, Switzerland and Cambridge, UK.
Jansson, R. (2003). Global patterns in endemism explained by past climatic change. Proc. R. Soc. B Biol. Sci. 270, 583–590. doi: 10.1098/rspb.2002.2283
Key Biodiversity Areas Partnership (2022). Key Biodiversity Areas factsheet: Ankasa Resource Reserve - Nini-Sushien National Park. Extracted from the World Database of Key Biodiversity Areas. Developed by the Key Biodiversity Areas Partnership: BirdLife International, IUCN, American Bird Conservancy, Amphibian Survival Alliance, Conservation International, Critical Ecosystem Partnership Fund, Global Environment Facility, Global Wildlife Conservation, NatureServe, Rainforest Trust, Royal Society for the Protection of Birds, World Wildlife Fund and Wildlife Conservation Society. Downloaded from https://www.keybiodiversityareas.org/ (Accessed October 04, 2022).
Kier, G., Kreft, H., Tien, M. L., Jetz, W., Ibisch, P. L., Nowicki, C., et al. (2009). A global assessment of endemism and species richness across island and mainland regions. Proc. Natl. Acad. Sci. U. S. A. 106, 9322–9327. doi: 10.1073/pnas.0810306106
Linder, H. P. (2001). Plant diversity and endemism in sub-Saharan tropical Africa. J. Biogeogr. 28, 169–182. doi: 10.1046/j.1365-2699.2001.00527.x
Maharjan, S. K., Poorter, L., Holmgren, M., Bongers, F., Wieringa, J. J., and Hawthorne, W. D. (2011). Plant functional traits and the distribution of west African rain forest trees along the rainfall gradient. Biotropica 43, 552–561. doi: 10.1111/j.1744-7429.2010.00747.x
Maley, J. (1996). The African rain forest: main characteristics of changes in vegetation and climate from the upper cretaceous to the quaternary. Proc. R. Soc. Edinburgh B Biol. Sci. 104, 31–73. doi: 10.1017/S0269727000006114
Marconi, L., and Armengot, L. (2020). Complex agroforestry systems against biotic homogenization: the case of plants in the herbaceous stratum of cocoa production systems. Agric. Ecosyst. Environ. 287:106664. doi: 10.1016/j.agee.2019.106664
Marshall, C. A. M., Wieringa, J. J., and Hawthorne, W. D. (2016). Bioquality hotspots in the tropical African Flora. Curr. Biol. 26, 3214–3219. doi: 10.1016/j.cub.2016.09.045
Marshall, C. A. M., Wieringa, J. J., and Hawthorne, W. D. (2021). An interpolated biogeographical framework for tropical Africa using plant species distributions and the physical environment. J. Biogeogr. 48, 23–36. doi: 10.1111/jbi.13976
Mutke, J., Kier, G., Braun, G., Schultz, C., and Barthlott, W. (2001). Patterns of African vascular plant diversity: a GIS based analysis. Syst. Geogr. Plants 7, 1125–1136.
Myers, N., Mittermeier, R. A., Mittermeier, C. G., da Fonseca, G. A. B., and Kent, J. (2000). Biodiversity hotspots for conservation priorities. Nature 403, 853–858. doi: 10.1038/35002501
Ohlemüller, R., Anderson, B. J., Araújo, M. B., Butchart, S. H. M., Kudrna, O., Ridgely, R. S., et al. (2008). The coincidence of climatic and species rarity: high risk to small-range species from climate change. Biol. Lett. 4, 568–572. doi: 10.1098/rsbl.2008.0097
Oksanen, F., Blanchet, G., Friendly, M., Kindt, R., Legendre, P., McGlinn, D., et al. (2016). vegan: Community Ecology Package. R package version 2.4-0. Available at: https://CRAN.R-project.org/package=vegan
Olson, D. M., Dinerstein, E., Wikramanayake, E. D., Burgess, N. D., Powell, G. V. N., Underwood, E. C., et al. (2001). Terrestrial Ecoregions of the world: a new map of life on earth. Bioscience 51:933. doi: 10.1641/0006-3568(2001)051[0933:teotwa]2.0.co;2
Pebesma, E. J., and Bivand, R. S. (2005). Classes and methods for spatial data in R. R News 5 (2). Available at: https://cran.r-project.org/doc/Rnews/.
Plana, V. (2004). Mechanisms and tempo of evolution in the African Guineo-Congolian rainforest. Philos. Trans. R. Soc. Lond. Ser. B, Biol. Sci. 35, 1585–1594.
Raveloaritiana, E., Wurz, A., Grass, I., Osen, K., Soazafy, M. R., Martin, D. A., et al. (2021). Land-use intensification increases richness of native and exotic herbaceous plants, but not endemics, in Malagasy vanilla landscapes. Divers. Distrib. 27, 784–798. doi: 10.1111/ddi.13226
Sandel, B., Arge, L., Dalsgaard, B., Davies, R. G., Gaston, K. J., Sutherland, W. J., et al. (2011). The influence of late quaternary climate-change velocity on species endemism. Science 334, 660–664. doi: 10.1126/science.1210173
Särkinen, T., Pennington, R. T., Lavin, M., Simon, M. F., and Hughes, C. E. (2012). Evolutionary islands in the Andes: persistence and isolation explain high endemism in Andean dry tropical forests. J. Biogeogr. 39, 884–900. doi: 10.1111/j.1365-2699.2011.02644.x
Simon, M. F., Grether, R., De Queiroz, L. P., Skemae, C., Pennington, R. T., and Hughes, C. E. (2009). Recent assembly of the Cerrado, a neotropical plant diversity hotspot, by in situ evolution of adaptations to fire. Proc. Natl. Acad. Sci. U. S. A. 106, 20359–20364. doi: 10.1073/pnas.0903410106
Thom, D., and Seidl, R. (2016). Natural disturbance impacts on ecosystem services and biodiversity in temperate and boreal forests. Biol. Rev. Camb. Philos. Soc. 91, 760–781. doi: 10.1111/brv.12193
Van Rompaey, R. S. A. R. (1996). “Rain forest refugia in Liberia,” in The Biodiversity of African Plants. eds. L. J. G. Van Der Maesen, X. M. Van Der Burgt, and J. M. Van Medenbach Rooy (Dordrecht, Netherlands: Kluwer Academic Publisher), 624–630.
Varela, S., Lima-Ribeiro, M. S., and Terribile, L. C. (2015). A short guide to the climatic variables of the last glacial maximum for biogeographers. PLoS One 10, 1–15. doi: 10.1371/journal.pone.0129037
White, F. (1979). The Guineo-Congolian region and its relationships to other Phytochoria. Bull. du Jard. Bot. Natl. Belgique 49:11. doi: 10.2307/3667815
Keywords: disturbance, endemism, west Africa, Ghana, Liberia, plants, conservation, Guinea
Citation: Marshall CAM, Dabo J, Mensah M, Ekpe P, Kpadehyea JT, Haba OO, Bilivogui D and Hawthorne WD (2022) Predictors of plant endemism in two west African forest hotspots. Front. Ecol. Evol. 10:980660. doi: 10.3389/fevo.2022.980660
Edited by:
Genoveva Rodriguez-Castaneda, Saint Francis University, United StatesReviewed by:
Gwendolyn Peyre, University of Los Andes, ColombiaSpyros Tsiftsis, International Hellenic University, Greece
Copyright © 2022 Marshall, Dabo, Mensah, Ekpe, Kpadehyea, Haba, Bilivogui and Hawthorne. This is an open-access article distributed under the terms of the Creative Commons Attribution License (CC BY). The use, distribution or reproduction in other forums is permitted, provided the original author(s) and the copyright owner(s) are credited and that the original publication in this journal is cited, in accordance with accepted academic practice. No use, distribution or reproduction is permitted which does not comply with these terms.
*Correspondence: Cicely A. M. Marshall, Y205OTdAY2FtLmFjLnVr