- 1Xi’an University of Finance and Economics, Xi’an, China
- 2Business School, The University of Sydney, Sydney, NSW, Australia
In the context of “double carbon,” waste disposal has become a critical issue so far, and how to deal with it is the key to ensuring compliance with the double carbon target, the most practical treatment is still incineration, and how to establish the site selection and legal compensation mechanism is crucial. This paper establishes an environmental dynamic monitoring system for waste incineration power plants based on the Gaussian model and successfully solves the health risk of surrounding residents. Regarding the economic compensation issues, we first applied the AHP to analyze the pollutants comprehensively, constructed the judgment matrix, and conducted a consistency test, determined the weight of each index, and integrated various emissions into one pollutant, which is convenient for the concentration of pollutants. Then, by taking into account the effects of wind direction, rainfall, topography, and other factors on the diffusion of pollutants, we calculated the pollutants around the waste incineration power plant site based on the “elevated continuous point source” “diffusion model.” To obtain the concentration distribution, monitoring points were set up at representative locations, and the environmental monitoring system of the waste incineration power plant was established. Finally, Matlab software was used to draw the contour map of pollutant concentration, and the concentration level of pollutants was divided according to waste incineration. Given the income of the power plant, the economic level of the surrounding residents, the amount of compensation from the local government, and the pollution level, economic compensation plans for the surrounding residents were developed. Through analyzing the proposed compensation scheme, it can be known that the compensation scheme can satisfy the surrounding residents. The highlights of this paper can be described as follows: First, the analytic hierarchy process is used to comprehensively consider the pollutants, simplifying the establishment process of the model. Second, the pollutant concentration is graded, and the concentration equivalent map is drawn to make the monitoring point layout more representative. The economic compensation plan is more reasonable and more convincing to the public.
Introduction
On September 22, 2020, President Xi Jinping announced at the 75th General Assembly General Debate that China will increase its national contribution, adopt more robust policies and measures, and strive to peak its carbon dioxide (CO2) emissions by 2030 to achieve carbon neutrality by 2060. Carbon neutrality is a comprehensive goal that involves all sectors of the national economy and the whole process of social reproduction. Strong measures are needed to achieve peak and carbon neutrality, including source reduction, energy substitution, energy saving and efficiency improvement, recycling, process transformation, carbon capture and utilization, and other means. Achieving carbon peaking and carbon neutrality is a dynamic process that involves all aspects of society, including the transformation of energy technologies and production methods, the transformation of economic development methods, and the transformation of lifestyles. Compared with traditional sanitary landfills, waste incineration reduces the amount of CH4 and CO2 generated during landfill degradation, while incineration serves as an alternative to fossil fuels through resource utilization. In a region where incineration replaces landfills, it can be said that domestic waste disposal has achieved carbon peaking (Dongyue and Guangwei, 2021; Yanqing et al., 2021; Liu et al., 2022; Naqvi et al., 2022).
The “garbage siege” is a global problem, particularly prominent in today’s China. In 2012, the national municipal solid waste transportation volume reached 171 million tons, an increase of 13 million tons over 2010. The data shows that more than two-thirds of the cities in the country are facing the problem of a “garbage siege,” and the landfill has accumulated a total of 750,000 mu of land. Therefore, waste incineration has gradually become one of China’s primary means of garbage disposal. Municipal wastes are sorted and treated, the recyclable and harmful garbage is removed, and the remaining garbage is incinerated in an incinerator, which can avoid encroachment on a large amount of land and generate electricity and obtain a considerable economy via waste incineration. Benefit, However, due to various reasons such as poor government supervision and short-sighted investors, the waste incineration power plants built in various places have experienced increasing environmental pollution problems over the past few years, which significantly inhibits the promotion of waste incineration technology in China. The location selection of new waste incineration plants in the city has been increasingly difficult due to opposition from residents (Fan, 2018; Pu and Li, 2018; Wang, 2018; Yang et al., 2018; Yu et al., 2018).
The risk of environmental pollution caused by waste incineration plants is directly related to the scale of construction investment and the intensity of operational supervision. Due to the lack of scale effect, pollution control will also affect small-scale waste incineration plants, resulting in severe pollutant discharges, difficulty meeting new national emission standards, and a more significant environmental hazard. With the increase in urbanization level, land resources are becoming increasingly tense, and residents’ living standards are gradually increasing, and their environmental awareness is becoming stronger. Many public waste incineration projects have been publicly investigated during the EIA phase. The location selection of incineration plants is also becoming more and more difficult. Some of the completed waste incineration plants have sufficient environmental protection distance before the urban area planning. However, as the surrounding residents and factories are gradually approaching the waste incineration plant, some of the built incineration plants exert a particular impact on the surrounding environment. Residents around the incineration plants are accumulating and expressing their dissatisfaction. This phenomenon has seriously damaged the image of the waste incineration industry and even concealed its environmental benefits of waste reduction and resource utilization. Therefore, the location selection of existing urban waste treatment facilities is becoming more and more difficult. Currently, major cities in China are now tempted to replace small-scale incinerators with new large incinerators. However, large incineration plants have problems such as the high cost of garbage transportation and road construction. Therefore, studying the scale of construction of large incineration plants in different cities is worthwhile. In the operation supervision of waste incineration plants, measurement and monitoring are mainly carried out in waste incineration plants, and there is a lack of peripheral dynamic monitoring from the perspective of the surrounding environment. Therefore, forming an effective environmental monitoring system for all waste incineration plants is difficult (Cao and Zhang, 2017; Chen, 2017; Song and Gao, 2017; Wei, 2017; Wei and Wen, 2018; Zhang et al., 2021).
Environmental compensation is an essential manifestation of social equity. The location of urban waste treatment facilities in the provision of garbage disposal services for the entire city will inevitably impact the local environmental quality. The essence of this problem is the damaged areas in the urban development process, while other areas transport the garbage out of the local area and protect it. At the same time, the land is used for economic development to obtain income, and its essence is that the beneficiary is in the process of urban development. The environmental compensation mechanism can improve social equity to a certain extent, not only to compensate for the psychological damage caused by the construction of sanitation facilities in the local area but also to compensate the residents for their reduction in economic income due to the use of land for sanitation facilities. Generally, the degree of opposition to the construction of sanitation facilities will naturally also decrease, so it is essential to establish an environmental compensation mechanism (Han, 2017; Li et al., 2017; Lu, 2017; Ma and Tsai, 2017; Qian et al., 2017; Zhao and Ren, 2017; Zhao et al., 2017; Ma et al., 2018).
Analysis of issues
Shenzhen plans to build a medium-sized waste incineration plant with a planned waste disposal capacity of 1,950 tons per day (including three incinerators capable of handling 650 tons of waste per day, with a smoke outlet height of 80 m, operating 24 h a day). To meet the need to build a dynamic monitoring system for the environment and make reasonable economic compensation for the surrounding residents based on potential pollution risks, relevant departments hope to comprehensively consider various factors that cause environmental pollution as well as hazards to the surrounding waste incineration plants (for example, incinerators). With consideration of the discharge amount of pollutants, the distance from the residential zone to the waste incineration plant, the wind direction, the weather conditions such as rainfall, the topography and the occlusion of the building, etc., a feasible dynamic monitoring and evaluation method is established based on scientific quantitative analysis to investigate the environmental impacts of waste incineration plants. A reasonable economic compensation plan is developed for potential environmental risks.
It is assumed that the emission of incinerators meets the national new pollutant discharge standards, and an environmental indicator monitoring method is designed according to the surrounding environment of the waste incineration plant to realize the reasonable emission of flue gas from the waste incineration plant. Based on the actual monitoring results of the designed environmental dynamic monitoring system, a rational risk-bearing economic compensation scheme for surrounding residents’ is designed.
In the question, the emission of the incinerator is assumed to meet the national new pollutant discharge standards. Under this premise, it is necessary to comprehensively consider factors such as pollutant discharge amount, the distance from the residential area to the waste incineration plant, the wind direction, the rainfall, the topography, and the occlusion of the building. A feasible environmental monitoring system is established to determine the degree of building occlusion on the air’s concentration and spread of pollutants. An economic compensation plan is developed for the surrounding affected residents. First, each influencing factor should be analyzed according to the data given.
Since the environmental indicators are detected as atmospheric pollutants, and there are many kinds of incinerator emissions, this paper intends to integrate multiple pollutants into one kind of emission to facilitate the calculation of emission concentration and the establishment of the evaluation system. Then, comprehensively considering the above factors, the model is built according to the site selection of waste incineration power, and the distribution of pollutant concentration around the waste incineration power plant is obtained. Monitoring points are set up at representative locations, and waste incineration power generation is under monitoring is realized. An economic compensation plan is developed for the surrounding residents by grading the pollutant diffusion concentration. Finally, the environmental monitoring system is evaluated in terms of its effectiveness, pertinence, and accuracy.
Model assumptions and symbolic descriptions
Model assumptions
(1) Hypothesis 1: According to the hypothesis SPD, the average wind speed in 10 min is the average wind speed per day and is the average wind speed at the exhaust port;
(2) Hypothesis 2: According to the topography and geomorphology around the site, the atmospheric stability is assumed to beClevel;
(3) Hypothesis 3: Assume that the contaminant concentration is y, z, and the direction distribution is a normal distribution;
(4) Hypothesis 4: It is assumed that the contaminants are conserved during the diffusion process.
Model preparation
Before solving the problem, we first searched the website of the Shenzhen Meteorological Bureau. We obtained the wind direction and rainfall data at the waste incineration power plant site from 2011 to 2012. Then, EXCEL software was used to process the data. Finally, Google Earth software was applied to obtain information on topography, settlements, and buildings within a range of 1,000 m around the location of the waste incineration power plant.
Meteorological data of Shenzhen City in 2011–2012
In addition to the data on wind speed and wind direction shown in Annex 4, we also searched from the website of the Shenzhen Meteorological Bureau and found the average annual rainfall from 2011 to 2012. Some data are shown in Table 1.
Data after EXCEL processing
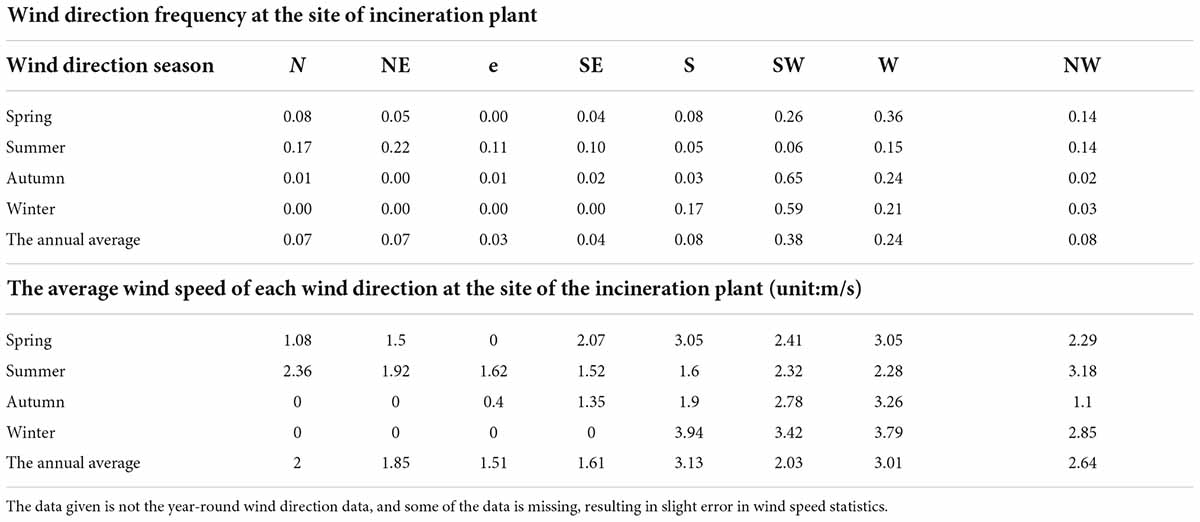
The annual wind speed was statistically compiled by EXCEL, and the wind direction frequency and average anemometer of each season and year were obtained. The detailed results are shown in Table 2.
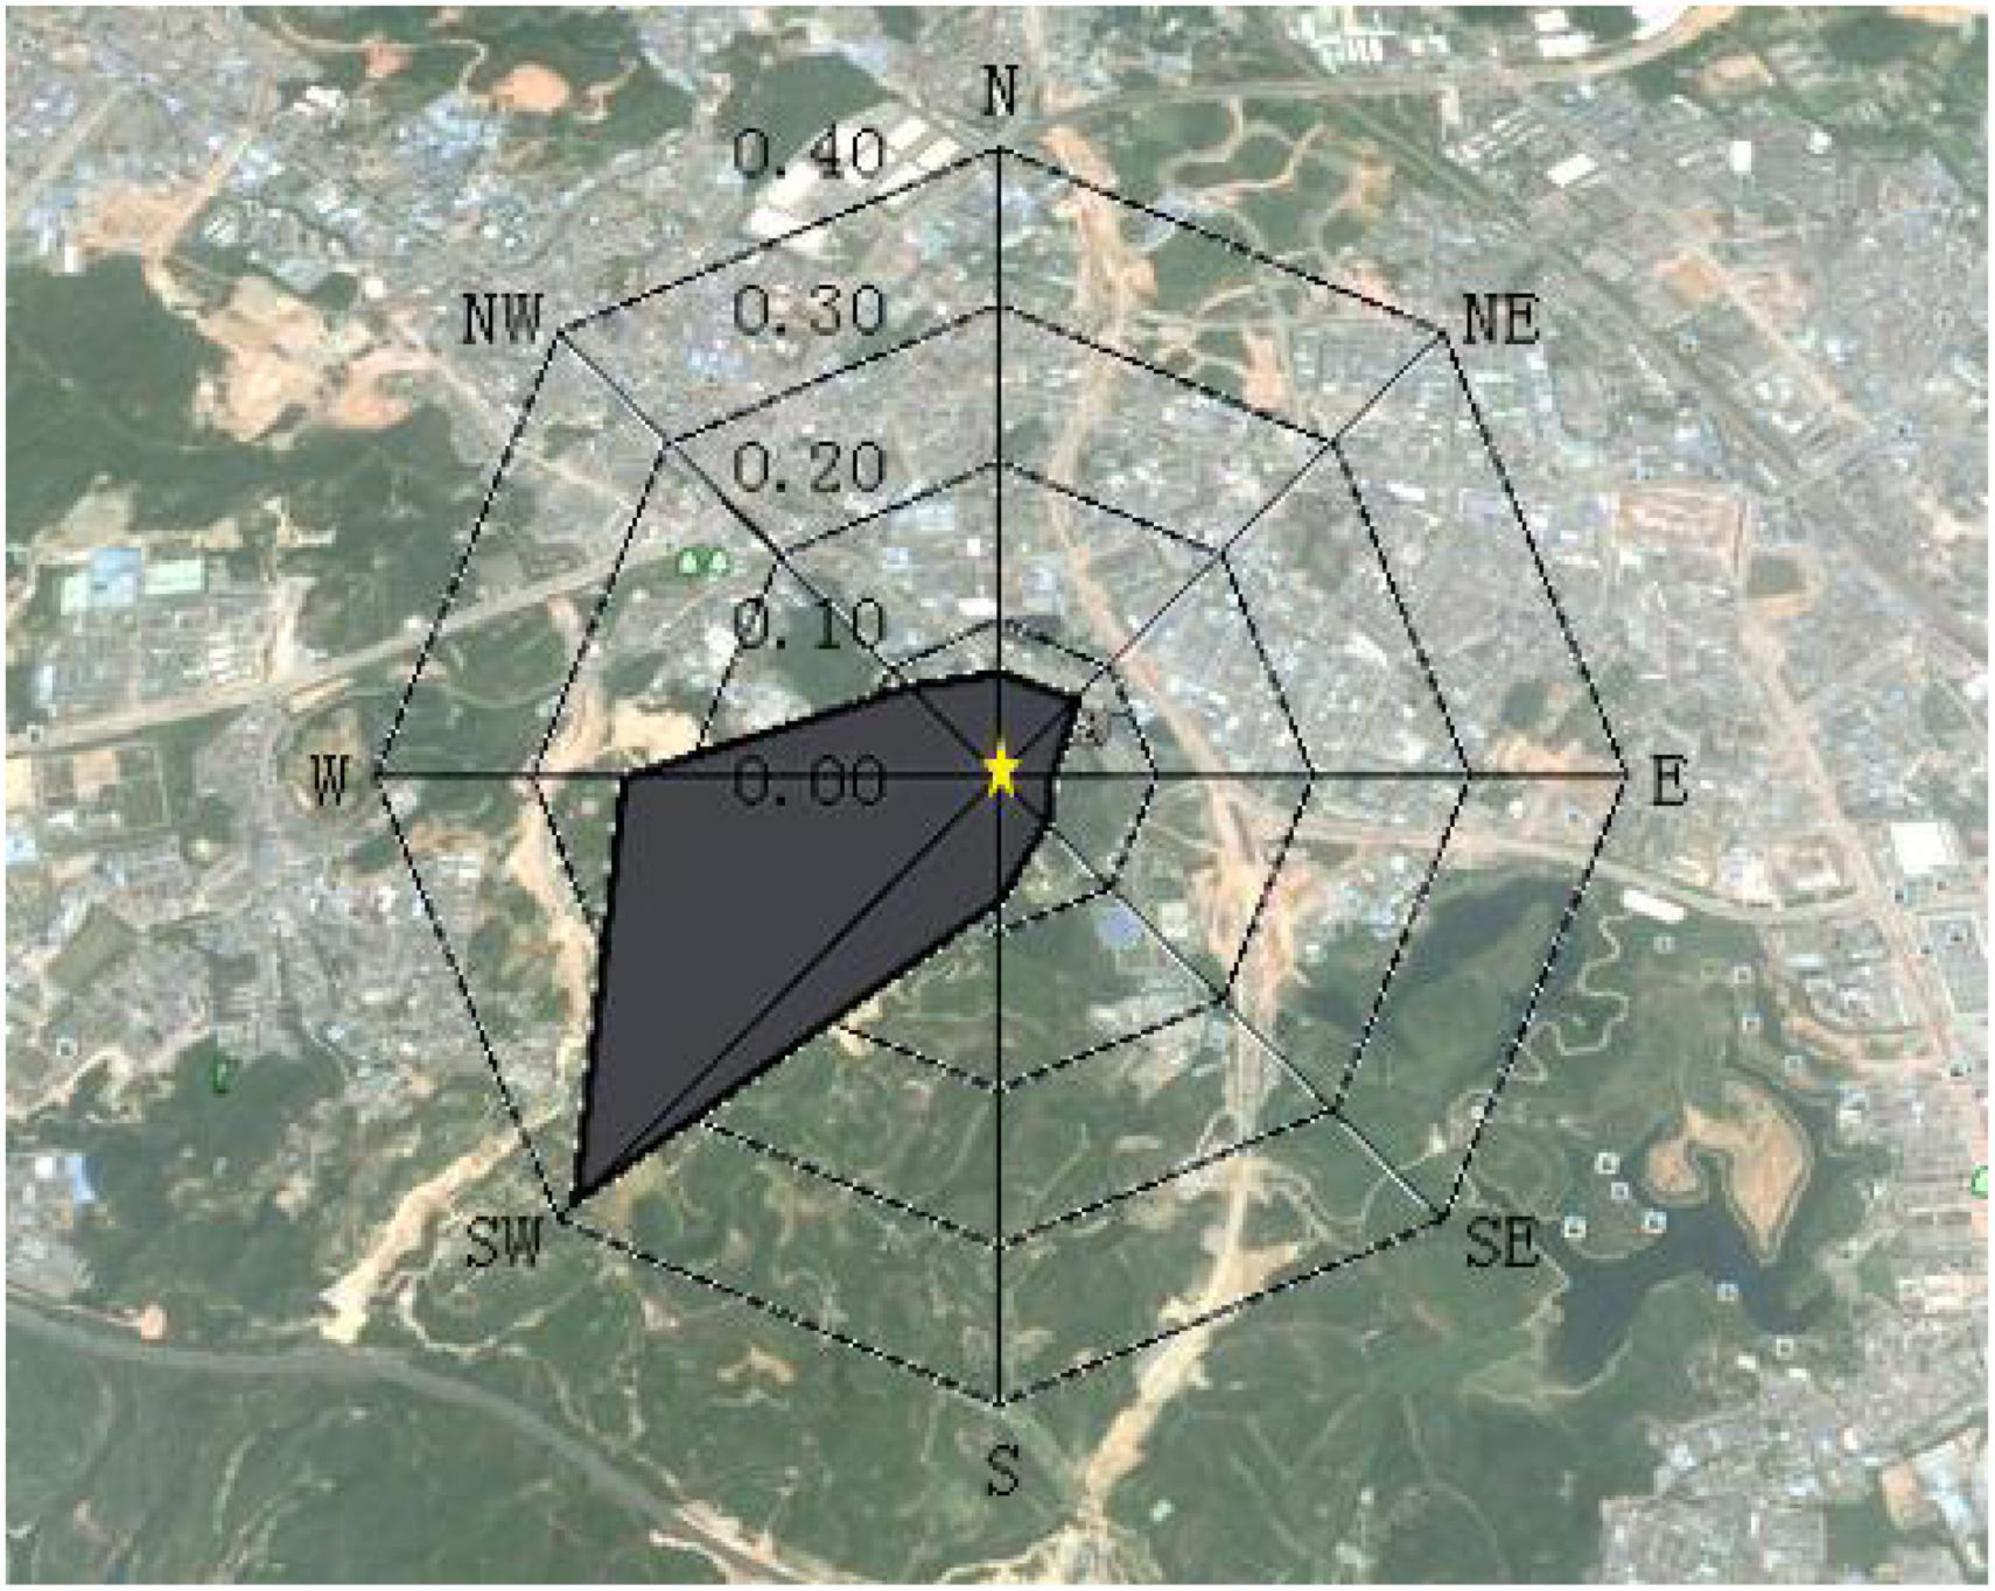
Dominant wind direction frequency map at the site of waste incineration plant
Using Google Earth software, the topographic map around the site of the waste incineration power plant was obtained. Then by integrating the annual average wind frequency rose diagram (Figure 1) into the topographic map, the dominant wind direction frequency map at the site of the waste incineration plant was obtained (see Figure 1).
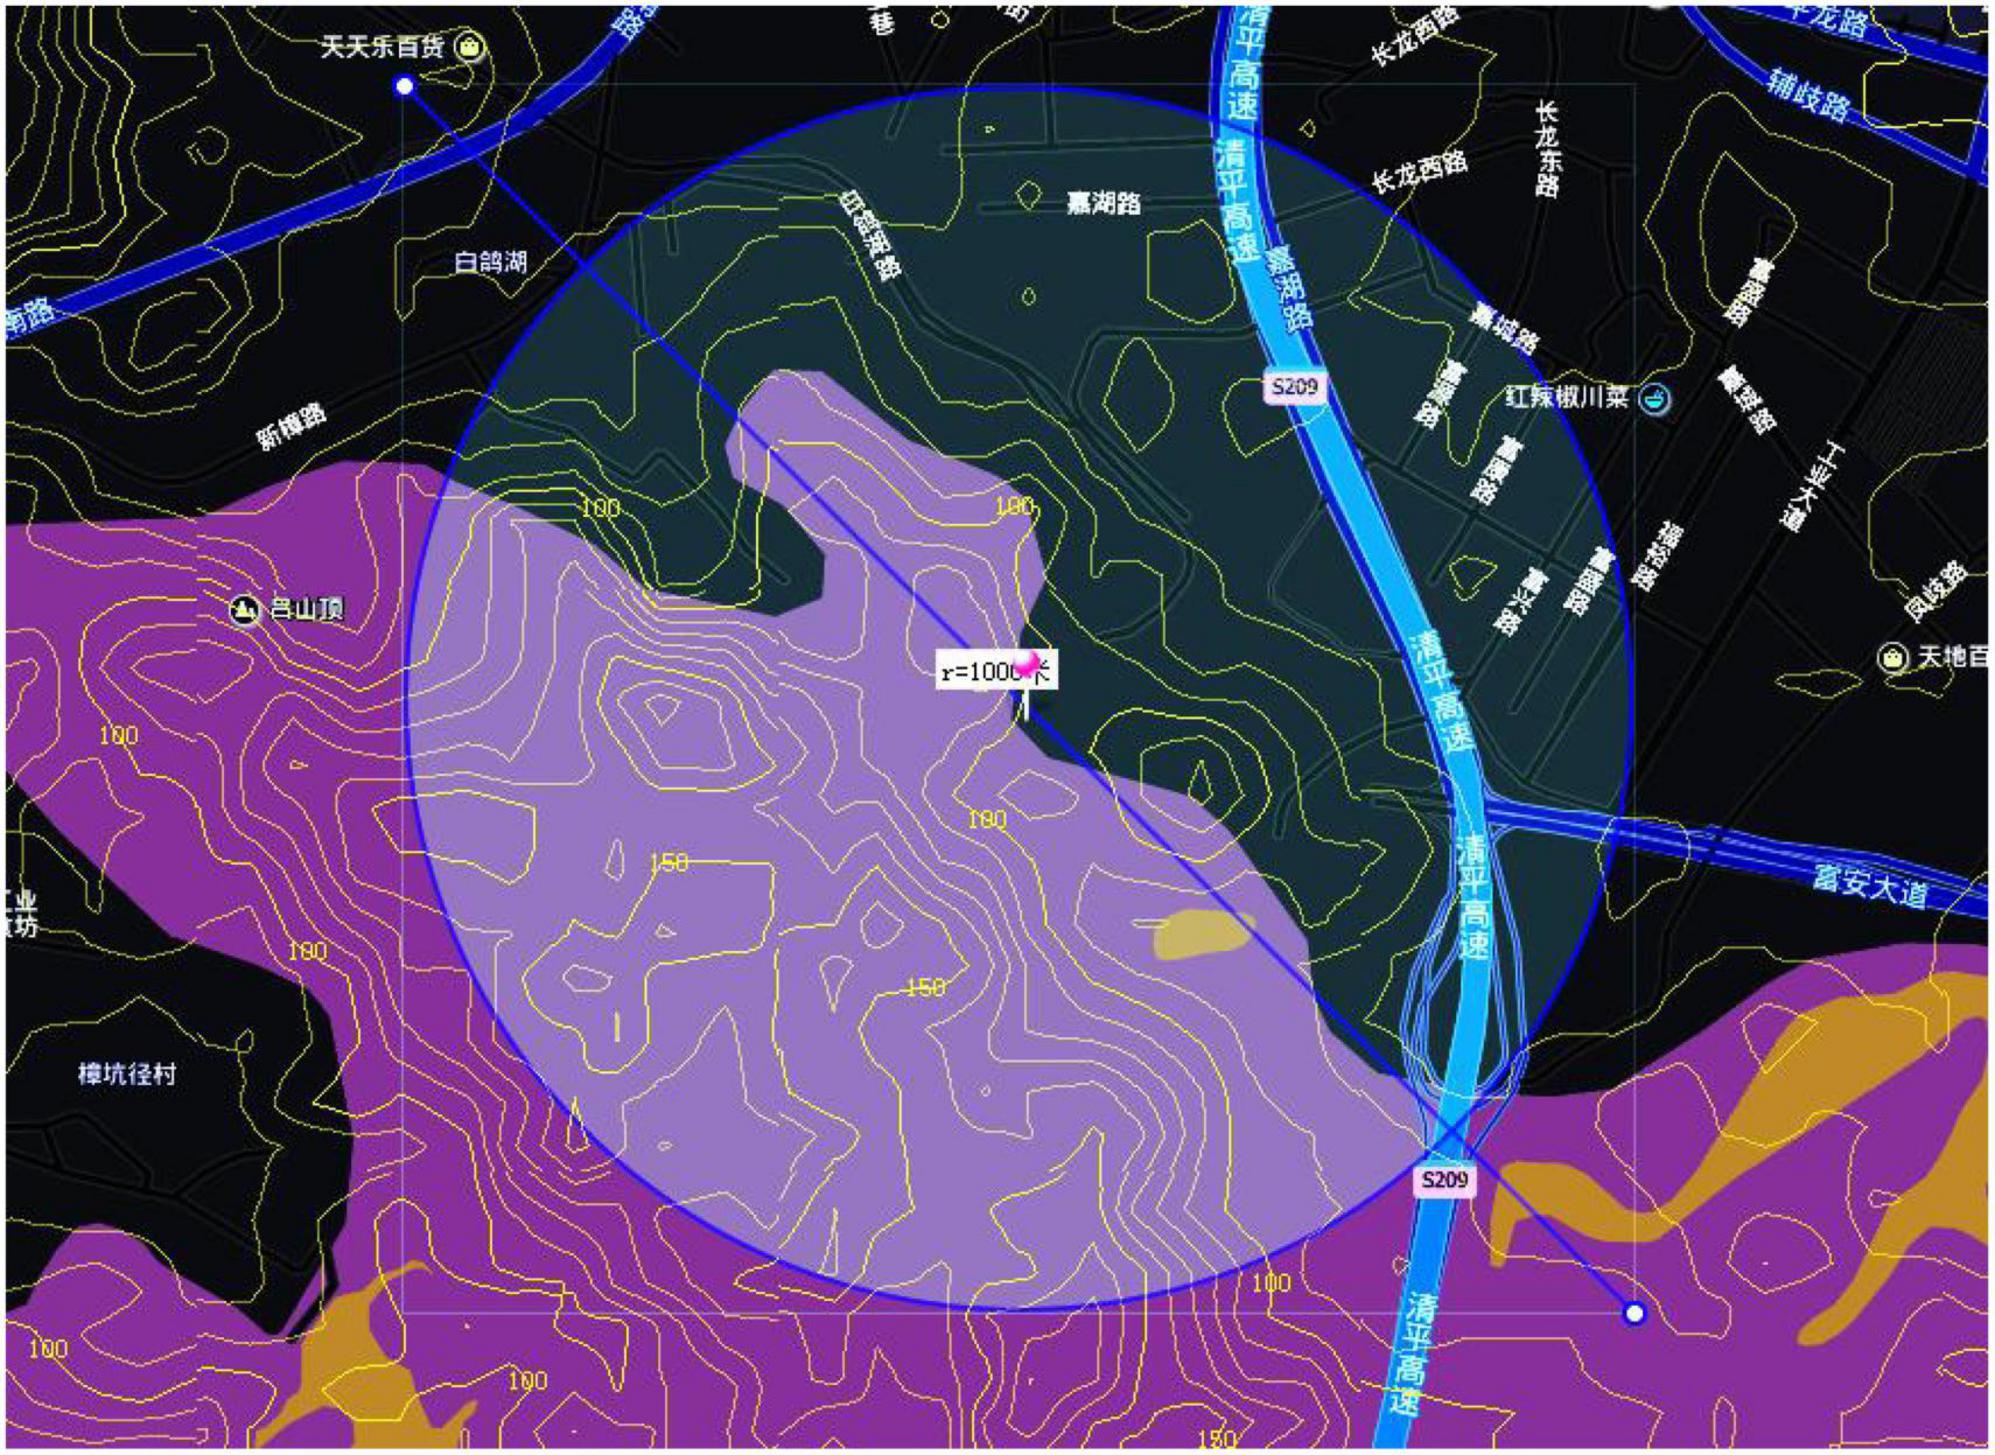
Contour map around the site of the waste incineration plant
Using the Orvieto interactive map software, a contour map (see Figure 2) within a range of 1,000 m around the waste incineration power plant was drawn. The lower purple area in the figure refers to the mountain area, and the upper black area refers to the residential area.
Model establishment and solution
To solve the problem, a feasible dynamic monitoring and evaluation method was constructed to investigate the environmental impact of waste incineration plants, and a reasonable economic compensation plan was developed to offset potential environmental risks. According to the data in the question, many kinds of incinerator emissions exist. In order to facilitate the calculation of emission concentration, first, AHP is used to determine the weights of pollutants. Then the total emissions are converted into a “comprehensive” emission. Second, the atmospheric pollutant diffusion model is reused to determine the distribution of pollutant ground concentration. Since the waste incineration plant is located in the low hilly coastal area, the back mountain bay is distanced from the pollution source center, with terrain height lower than the height of the smoke outlet so that the surrounding terrain can be regarded as a simple terrain. The long-term atmospheric pollution model of the elevated continuous point source is used to make the contour map of the equal concentration, and the location of the maximum concentration drop is calculated. Considering the monitoring point layout scheme and the monitoring period, the dynamic monitoring system is constructed around the waste incineration power plant. Then actual and modeled data are combined into the environmental dynamic monitoring system. Finally, the pollution level is divided based on the pollutant concentration, the compensation area is divided based on the pollution level, and the economic compensation for the surrounding residents is determined based on the pollution concentration level and the number of contaminated days.
Determine the comprehensive concentration of pollutants in the exhaust vent
(1) Construction of emission assessment system for waste incineration power plants
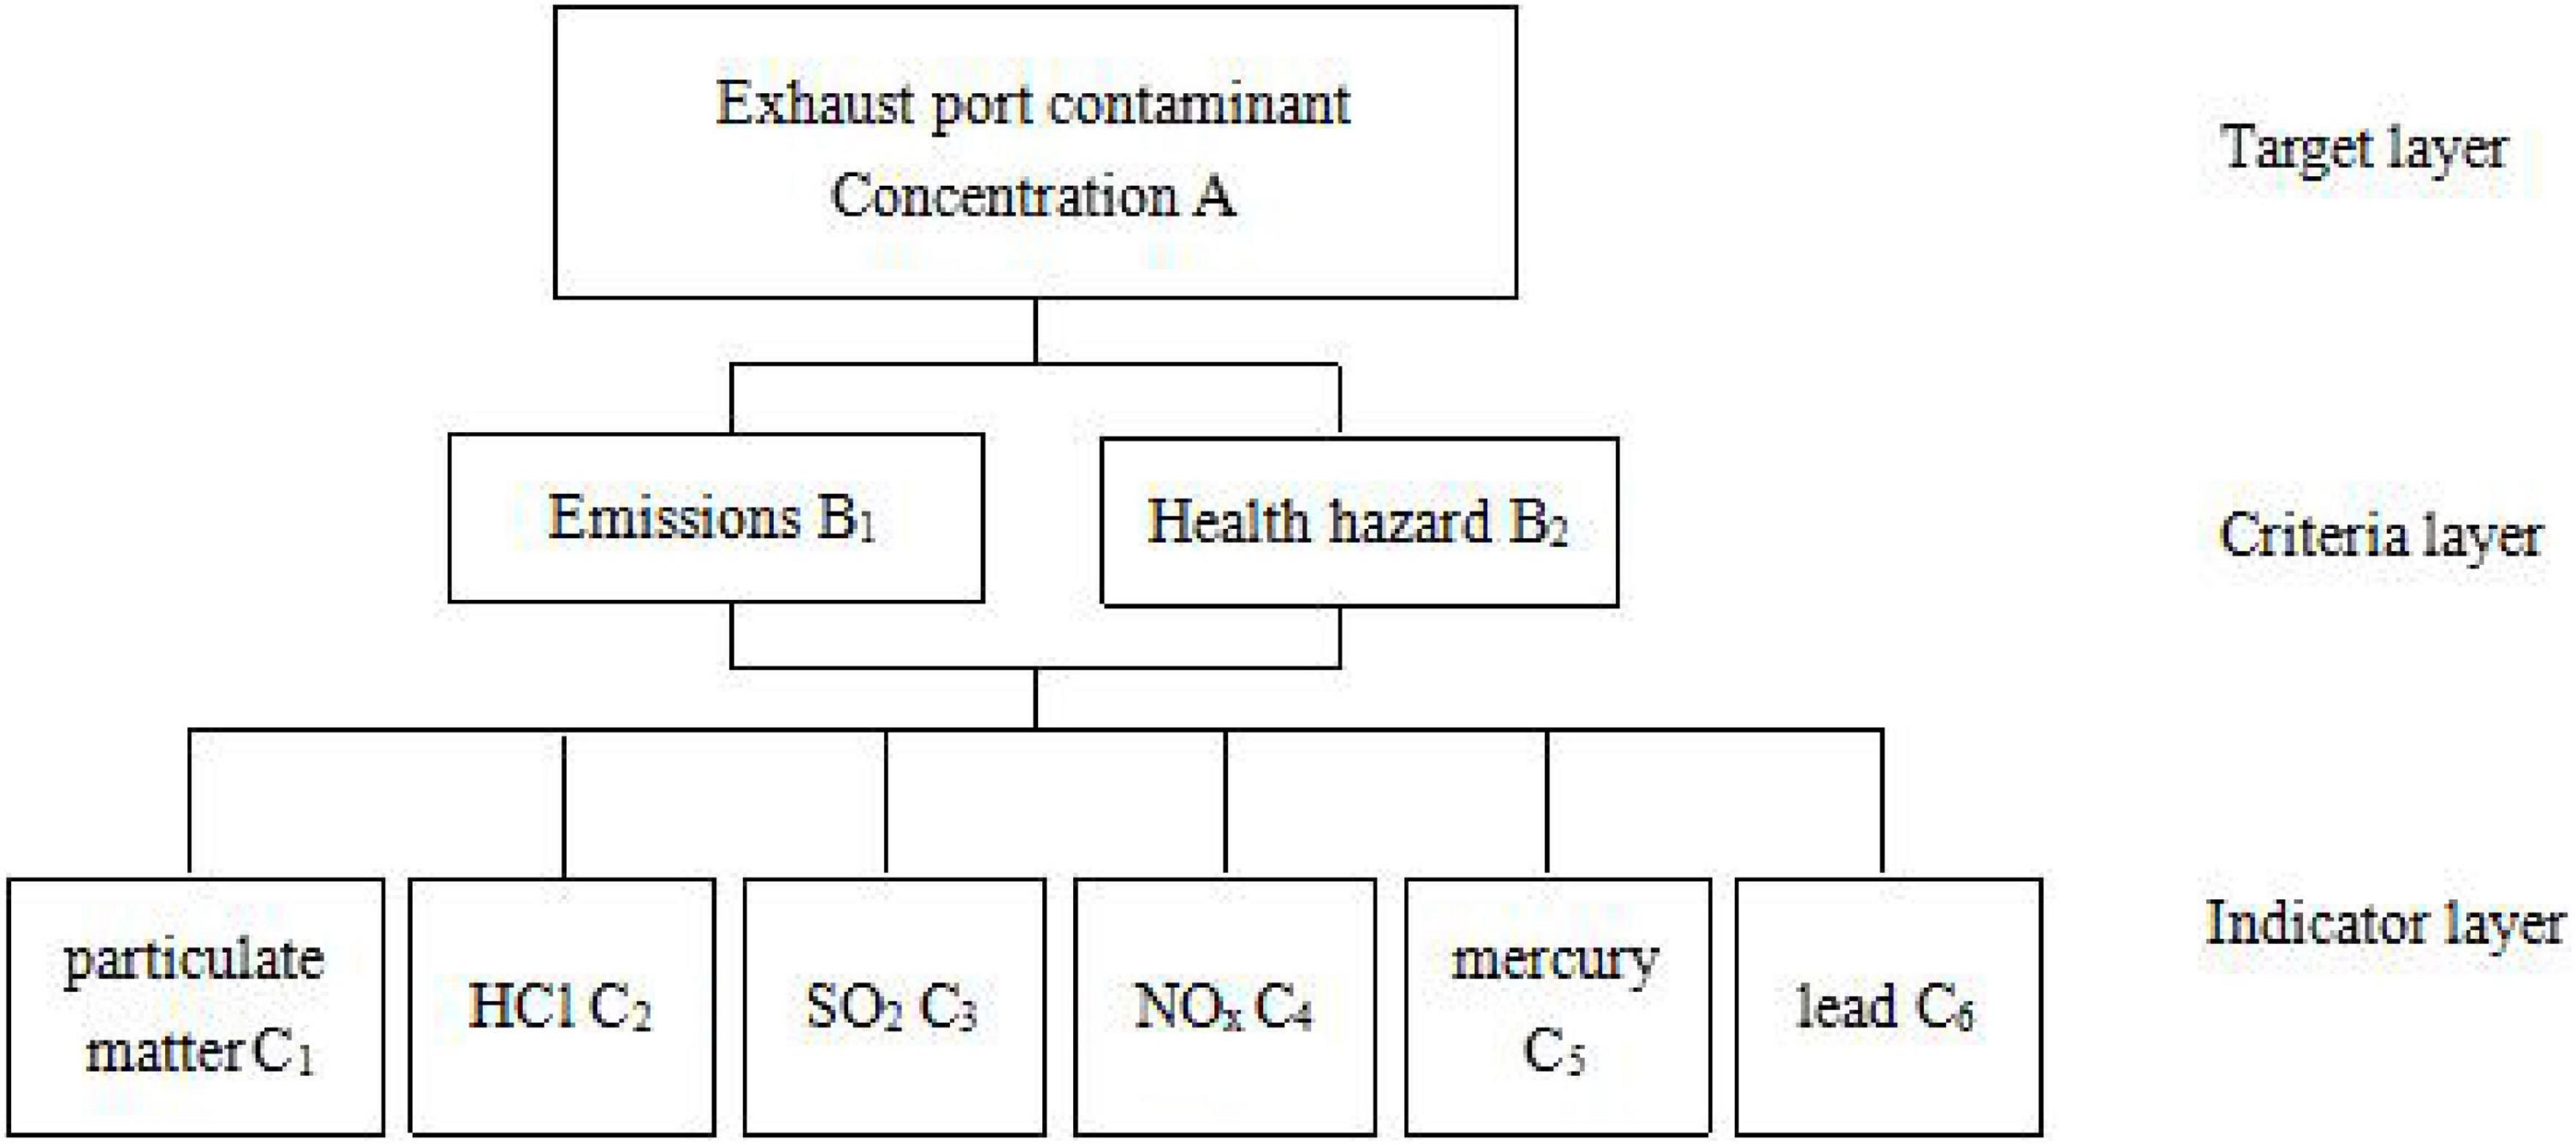
According to the country’s new pollutant discharge standards, there are six main types of pollutants: particulate matter, mercury, and lead. Meanwhile, considering the pollutant emissions and harm to the human body, a pollutant index evaluation system is established, as shown in Figure 3.
(2) Use AHP to determine the weight of each indicator
(1) Structure level analysis chart
Regarding the concentration index of the exhaust outlet, the analytic model is divided into three layers. The target layer is to determine the pollutant concentration, the criterion layer is to determine the pollutant discharge index, and the plan layer is to determine the pollutant type. The specific structure of the evaluation index system is shown in Figure 3.
(2) Construction of judgment matrix and consistency check
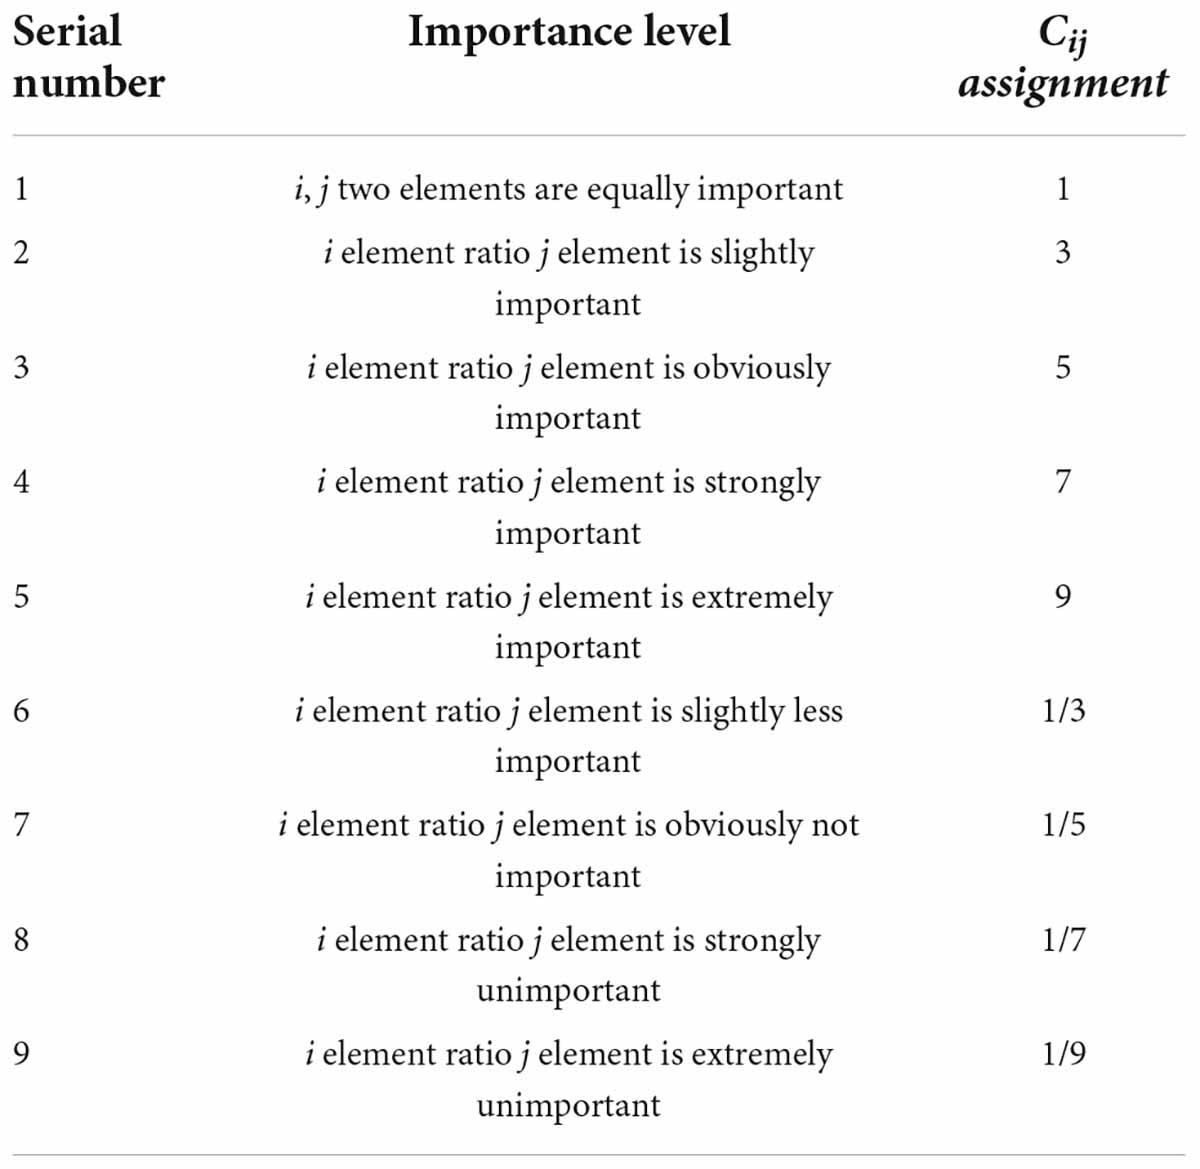
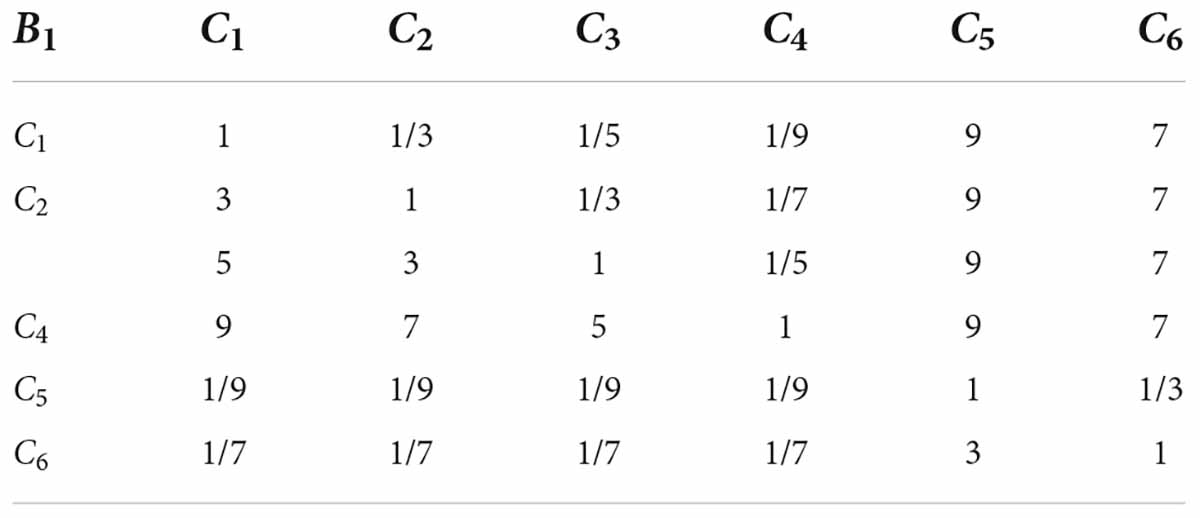
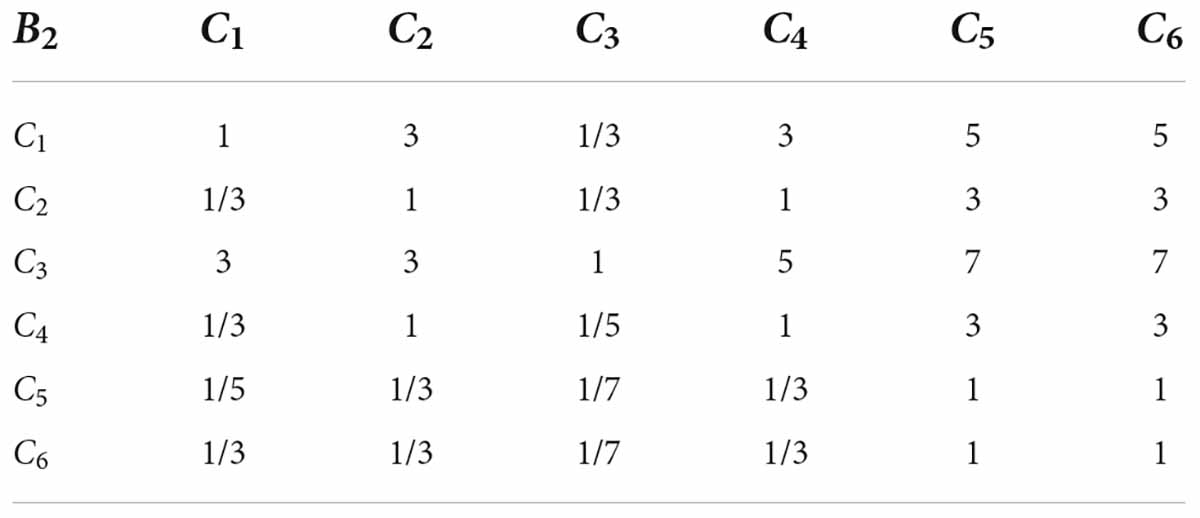
The relative importance of each factor in the criterion and indicator layers is given by consulting the data, and the judgment matrix is constructed. The two factors in the criterion layer can be regarded as equally crucial concerning the target layer. The relative importance of the two indicators in the criterion layer is 1–9 scaled (see Table 3), with appropriate scale values being introduced, as shown in Tables 4, 5.
Note: indicates that the importance level is between . These numbers are based on the intuition and judgment of people conducting qualitative analysis.
In the above process, a judgment matrix is established, which makes the judgment thinking mathematical, simplifies the problem analysis, and quantifies the pollutant index evaluation process. In addition, this decision-making method also helps to maintain consistency in judgment.
In the analytic hierarchy process, the negative mean of the remaining eigenvalues other than the largest eigenvalue of the judgment matrix is introduced, which is used as an indicator to measure the deviation of the judgment matrix.
The larger the value of CIis, the greater the degree to which the judgment matrix deviates from complete consistency; The smaller the value of CIis (closer to 0), the better the consistency of the judgment matrix is.
The judgment matrix of Tables 5, 6 is calculated by MATLAB software, and the maximum eigenvalue of the judgment matrix and the deviation consistency index are obtained. The results are shown in Table 6.
It is agreed that for different levels of judgment matrices, the consistency error is different and the requirements for the value of CI are also different. To measure whether the judgment matrices of different orders have satisfactory consistency, it is necessary to use the average random consistency index of the judgment matrix. For the judgment matrix of 1∼9 order, the values of RI are listed in Table 7.
When the order of matrix is 1 or 2, the judgment matrix always has complete consistency; when the order of matrix is greater than 2, the random consistency ratio CR is calculated:
When CR < 0.1, the judgment matrix is considered to have satisfactory consistency, otherwise the judgment matrix needs to be adjusted. According to the results in Table 7, take RI = 1.24, the random consistency ratio of the two matrices in Tables 5, 6 can be obtained, as shown in Table 8.
Obviously, CR(B1) < 0.1, CR(B2) < 0.1, so both matrices have satisfactory consistency.
(3) Determine the weight of each indicator
The hierarchical single sorting problem can be converted to be the maximum eigenvalue and eigenvector problem of the computational judgment matrix. By normalizing the eigenvectors, the hierarchical ranking result can be obtained:
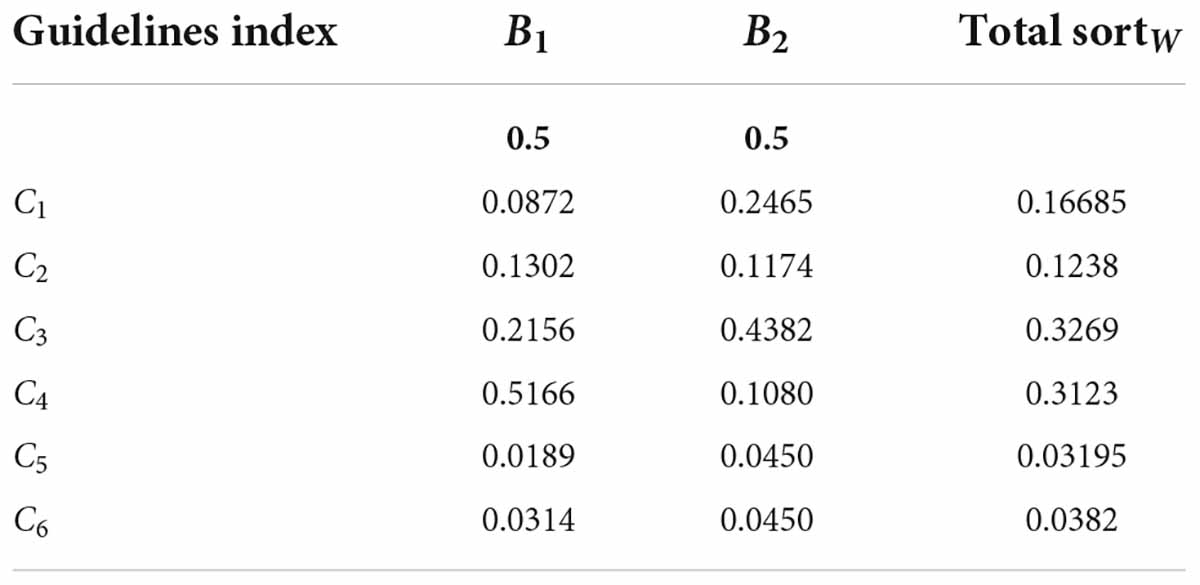
The sorting method and result of the hierarchical order are shown in Table 9. The index level and the criterion layer are, respectively, multiplied by the following formula to obtain the total hierarchical ordering W :
3) Determine the comprehensive concentration of pollutants in the exhaust vent
By summation of the weights obtained above and the emission concentration of each pollutant CF, the “comprehensive” concentration of the overall pollutant discharge CZ can be obtained, as shown in formula (4):
By substituting the data given in the question into (4), the CZ is calculated to be 113.795395mg/m3.
Establishment of pollutant diffusion model
Since the site of waste incineration plant has a simple terrain, the influence of surrounding hills on the spread of atmospheric pollutants can be ignored. An elevated continuous point source diffusion model is adopted, with the projection point of the exhaust outlet on the ground as the coordinate origin, and the height is z. The flue gas diffuses downward in the wind direction after leaving the exhaust vent, and the ground concentration of the pollutant satisfies the diffusion formula of Gaussian mode:
z = 0, the concentration of pollutants at any point on the ground can be expressed as the ground concentration model of the elevated continuous point source:
The maximum landing concentration occurs in the direction of the wind from the origin of the chimney, and then y = 0, and the ground concentration on the axis is:
and (3) are available:
Deriving x,
Let , the distance at which the maximum landing concentration occurs is obtained:
The maximum landing concentration is:
For Equation (10), when x = xm, there are:
Due to and the diffusion of pollutants in the lateral direction is similar to the diffusion in the vertical direction, so σy with σz can be written as x. Function, i.e.:
Where σy, σz represent the diffusion coefficient; γ1 and α1 represent the horizontally regression coefficient and regression index of the diffusion (y); γ2 and α2 represent vertically regression coefficient and regression index of the diffusion parameter of the direction; γ1, α1, γ2, α2 can be obtained by looking up the table according to different levels of atmospheric stability.
If substituting Equations (13) and (14) into Equation (7), we get:
Pair (15) to x find the partial guide, it can be found the model that can accurately calculate the maximum landing concentration of the elevated continuous point source:
The distance at which the maximum landing concentration occurs is:
Table 10 shows the average wind speed of each wind direction throughout the year ux
Pollutant emission Q equals to the smoke outlet concentration  the product of the daily smoke flow, the daily handling flow rate of waste incineration plant can be given according to the item given in Annex 2. The daily processing capacity of the incineration plant is calculated on a proportional basis;
The effective height of the elevated point source is the sum of the chimney height and the smoke lift height. Since the diameter of the exhaust port is not given in the question, the smoke lift height cannot be accurately calculated. Moreover, as the chimney itself has a high height, the smoke life height can be ignored;
Then He = H = 80m
For the distance from the waste incineration plant along the wind direction, the value range is 10∼5000m;
For the distance from the waste incineration plant along the vertical wind direction, the range is −500∼500m;
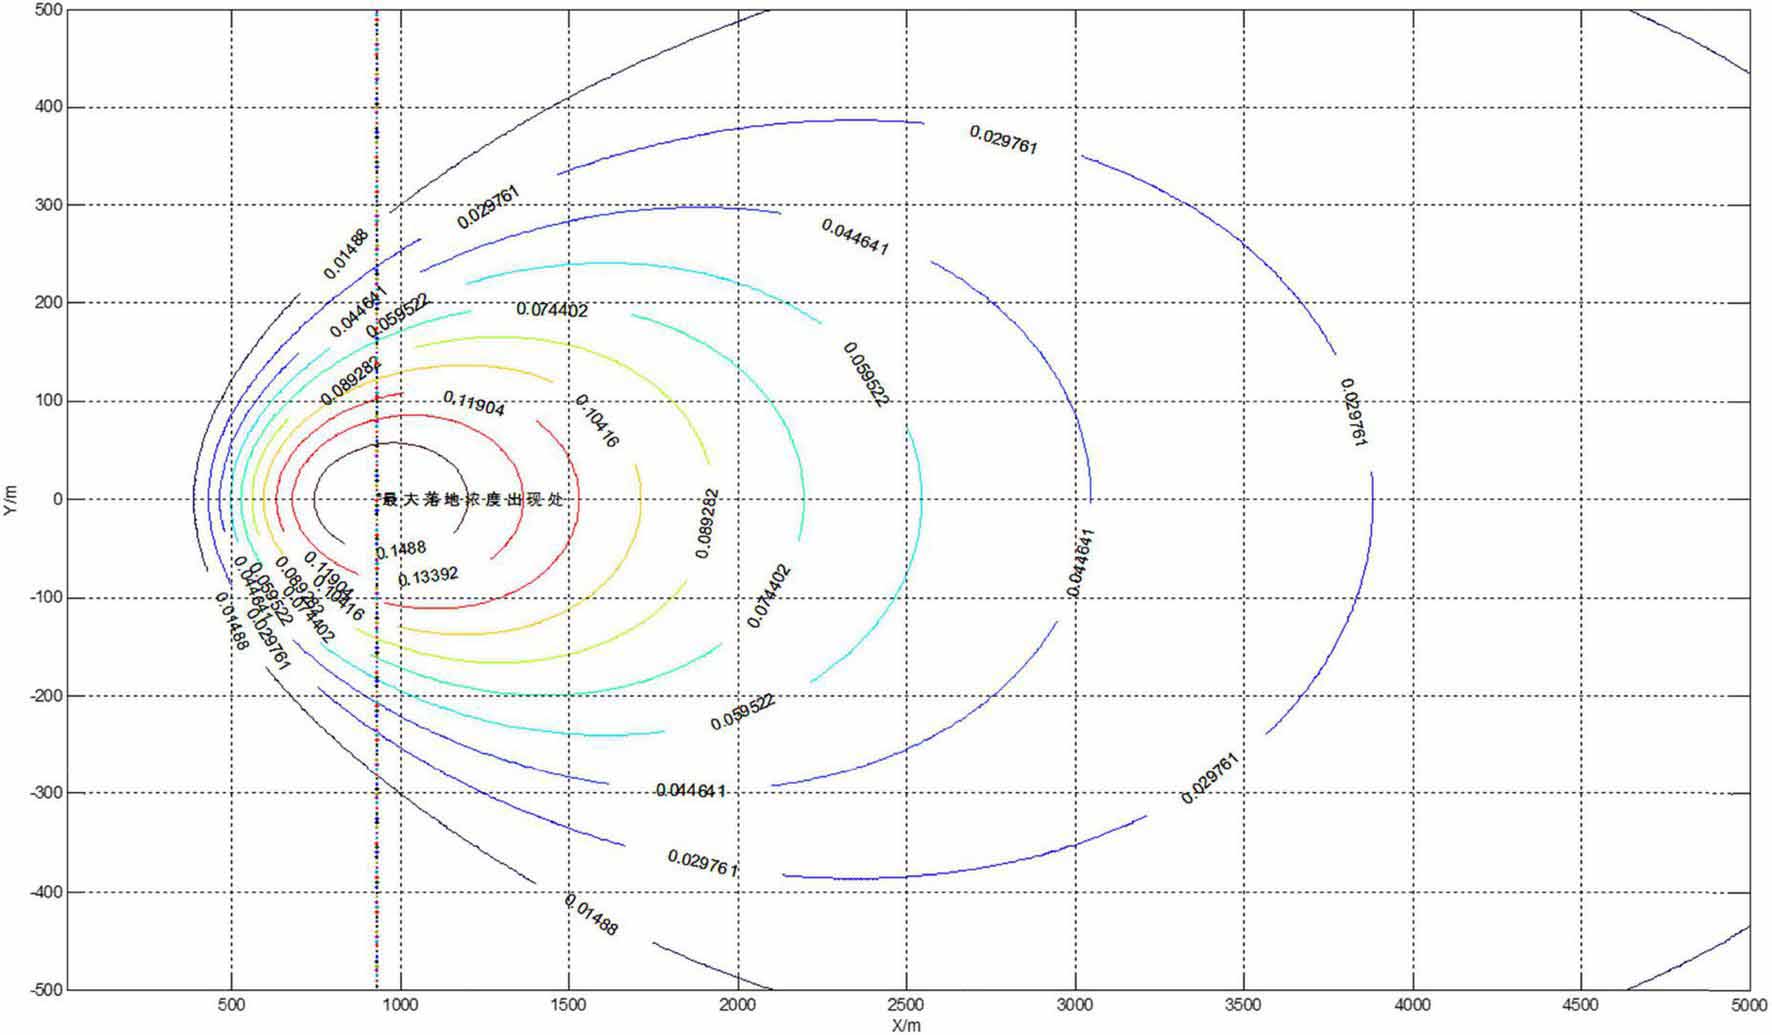
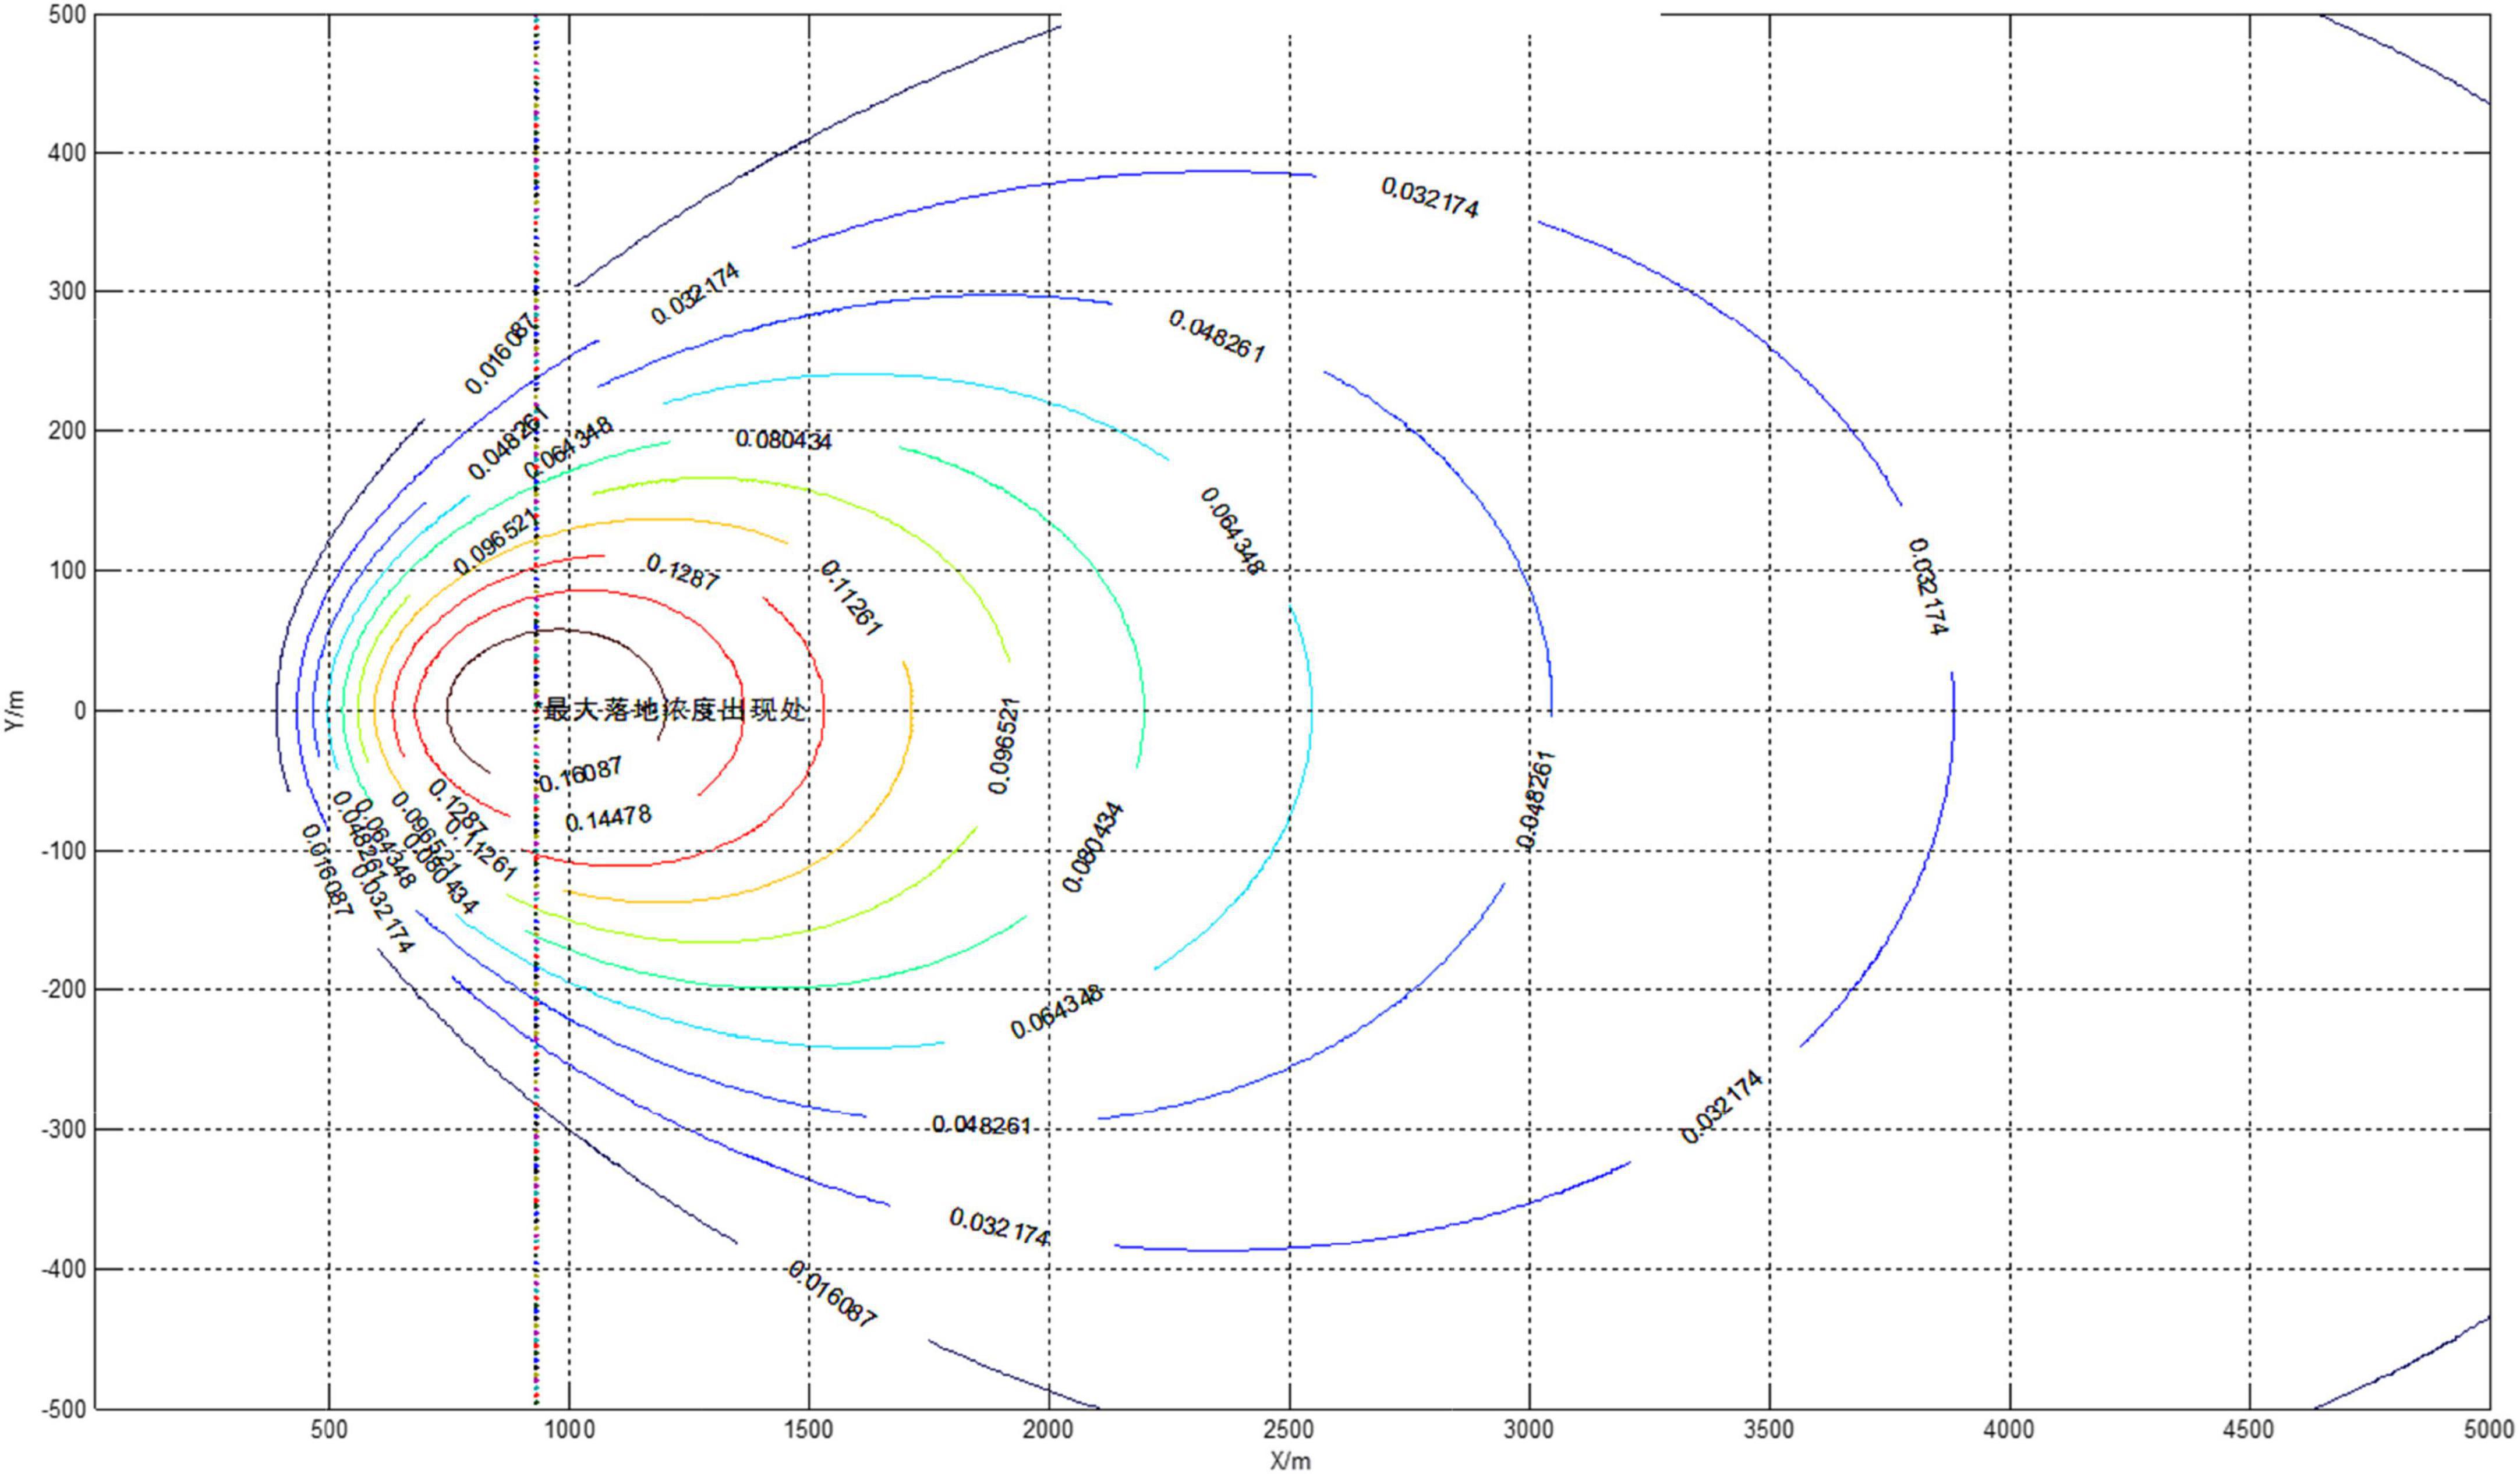
The model is solved by MATLAB software, and the distance between the maximum landing concentration and the maximum concentration in each direction is solved. The solution results are shown in Table 11. The concentration contour map of the direction N and NE, is shown in Figures 4, 5:

Table 11. Distances at which maximum landing concentration and maximum concentration in each direction occur.
In Table 11, it can be seen from the established model (17) that the maximum concentration occurrence distance is the effective emission height He, and the regression coefficient of the diffusion parameter is only related to the regression index, so the maximum concentration in each direction is 928.4540.
It can be seen from the calculation results that the maximum drop distance is independent of the wind speed of 928 m. At the point where the concentration determined by the model is the short-term average concentration, it is necessary to understand the long-term law of the change of pollutants with time and space from the perspective of long-term environmental monitoring. Due to the unique climate at the site, sudden heavy rain often occurs. Every time rainwater pollutants fall to the ground with rainwater, the pollution and concentration distribution caused by it are equal. Therefore, the influence of acid deposition is consistent with the impact level of air pollution. Moreover, due to the rain, the concentration of pollutants in the air is almost zero, and the short-term concentration is calculated again so that the model can achieve our goal.
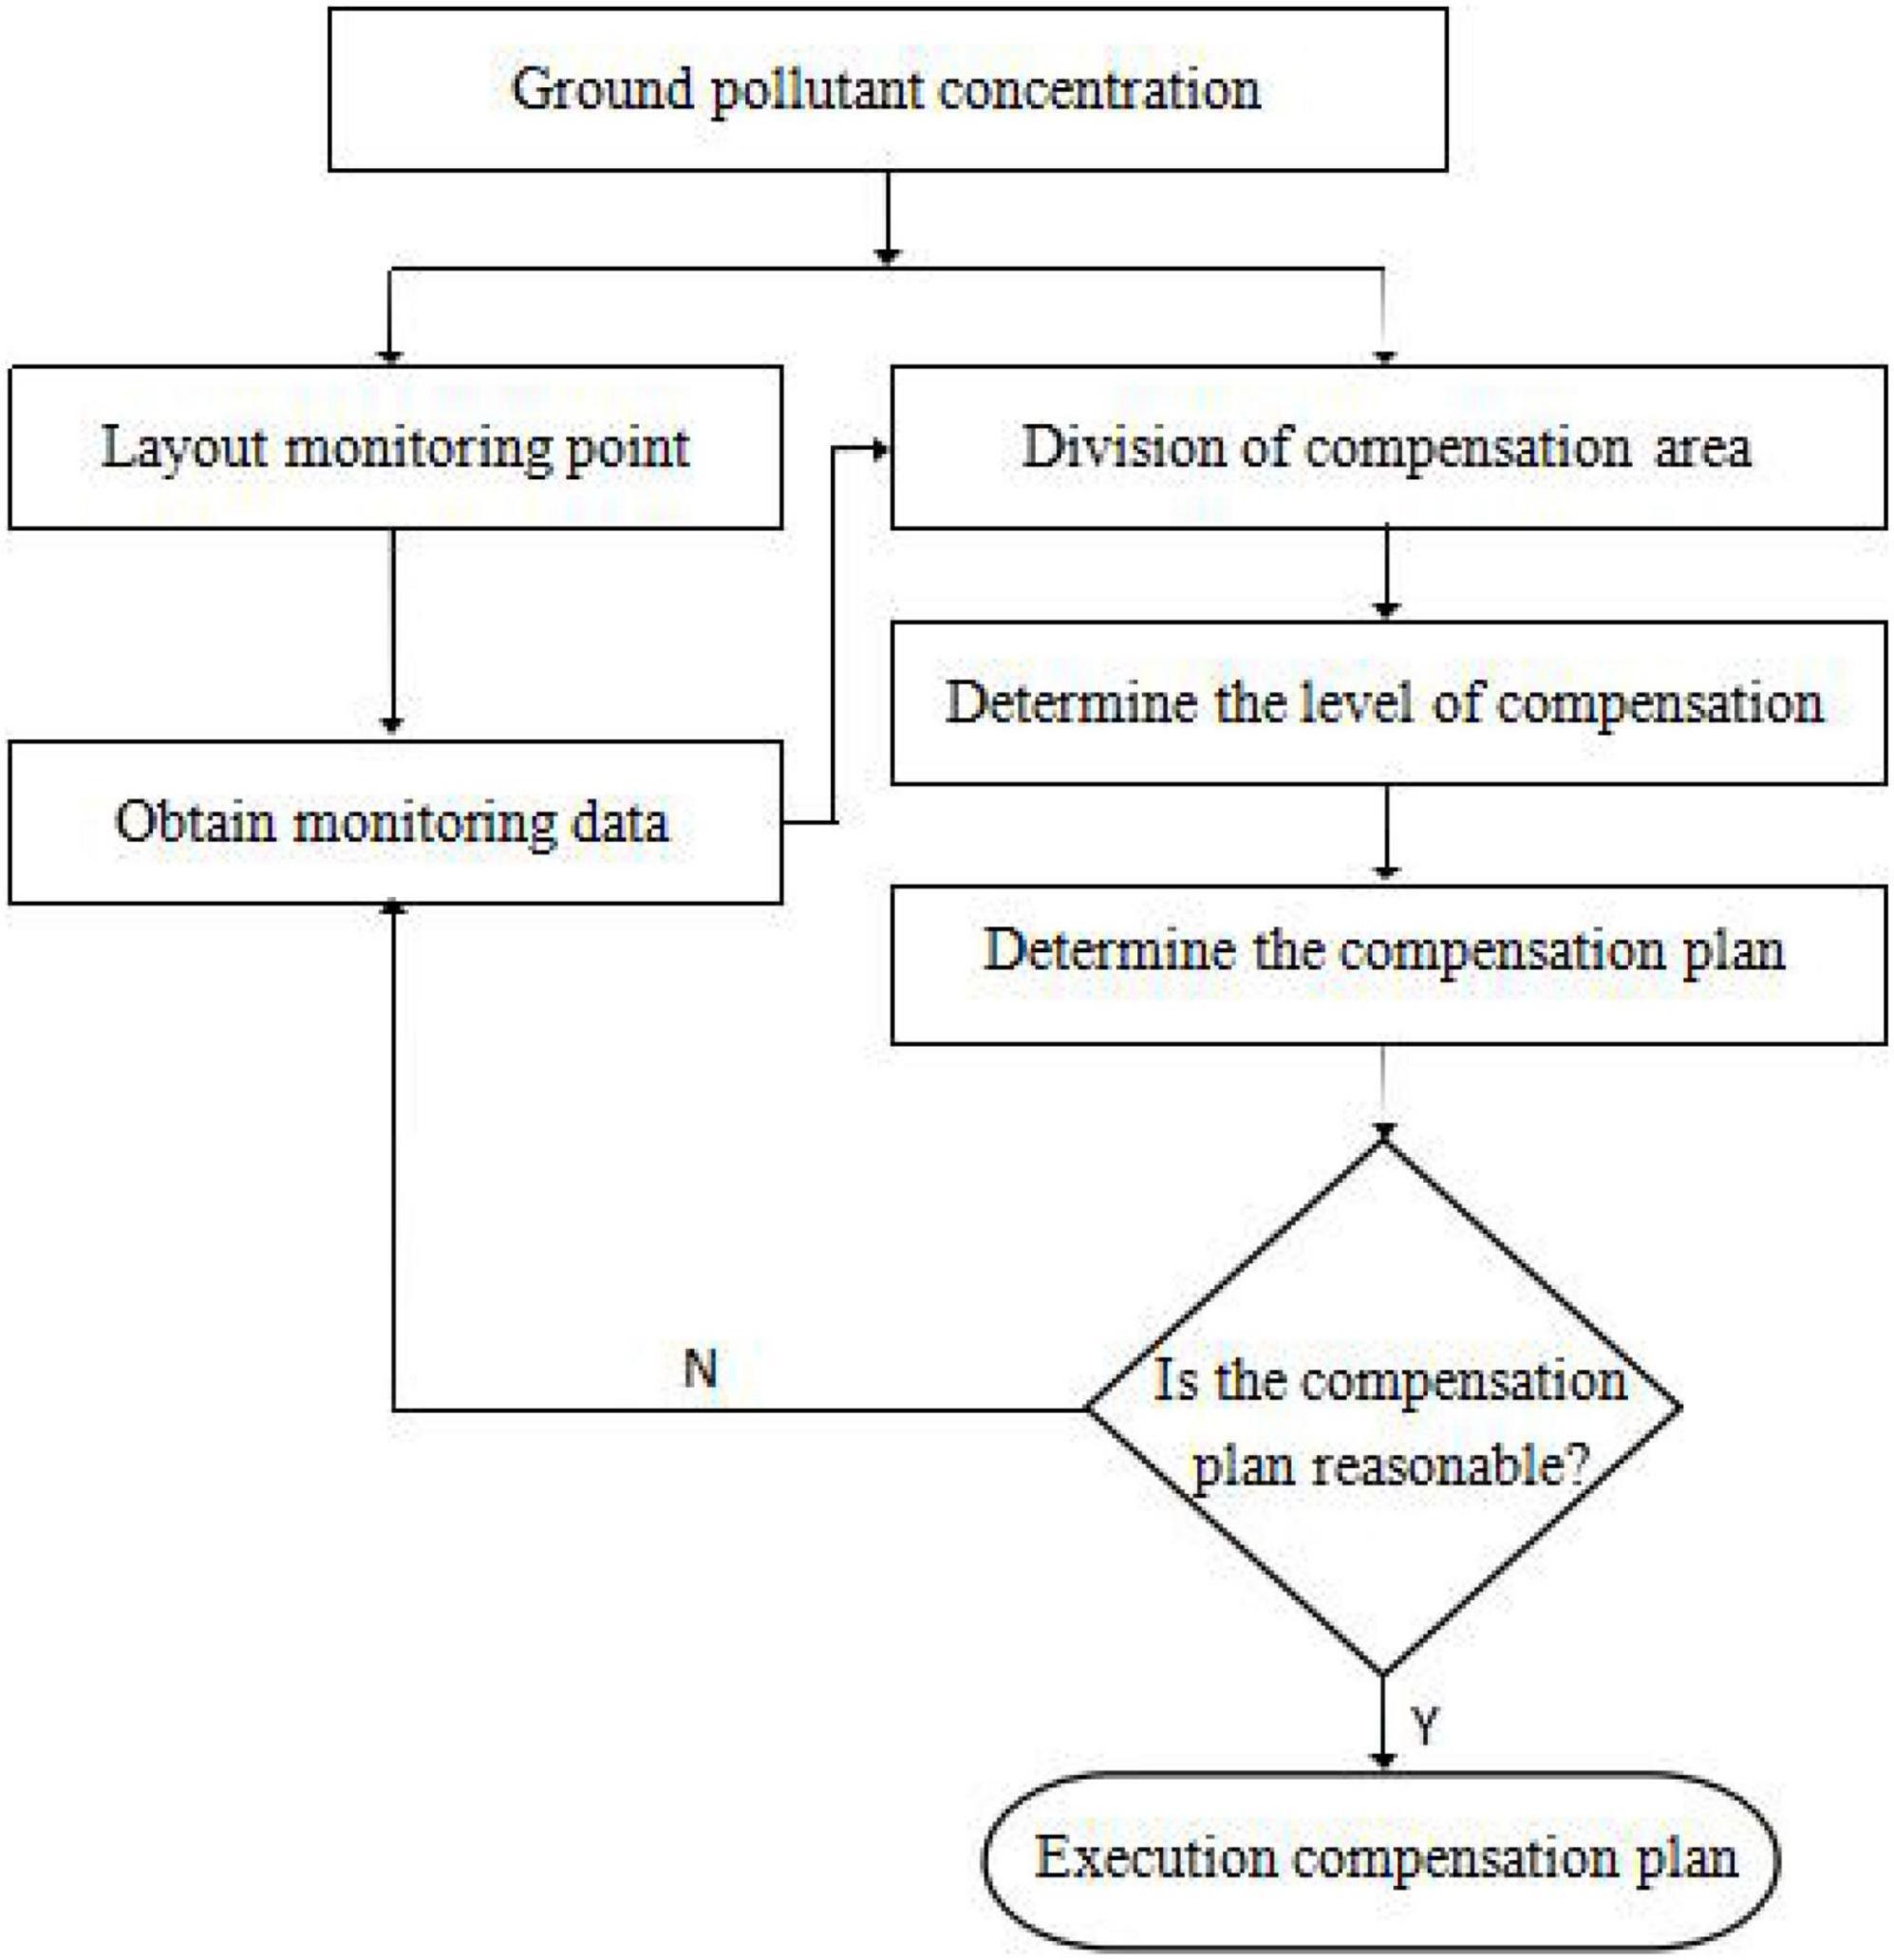
In order to obtain a feasible dynamic monitoring and evaluation method for the environmental impacts of waste incineration plants, the elevated continuous point source diffusion model is adopted to discuss the problem of pollutant diffusion and its impact on surrounding residents to construct a monitoring system and develop an economic compensation plan for surrounding residents. The specific process of developing an economic compensation plan is shown in Figure 6.
(1) Layout of monitoring points
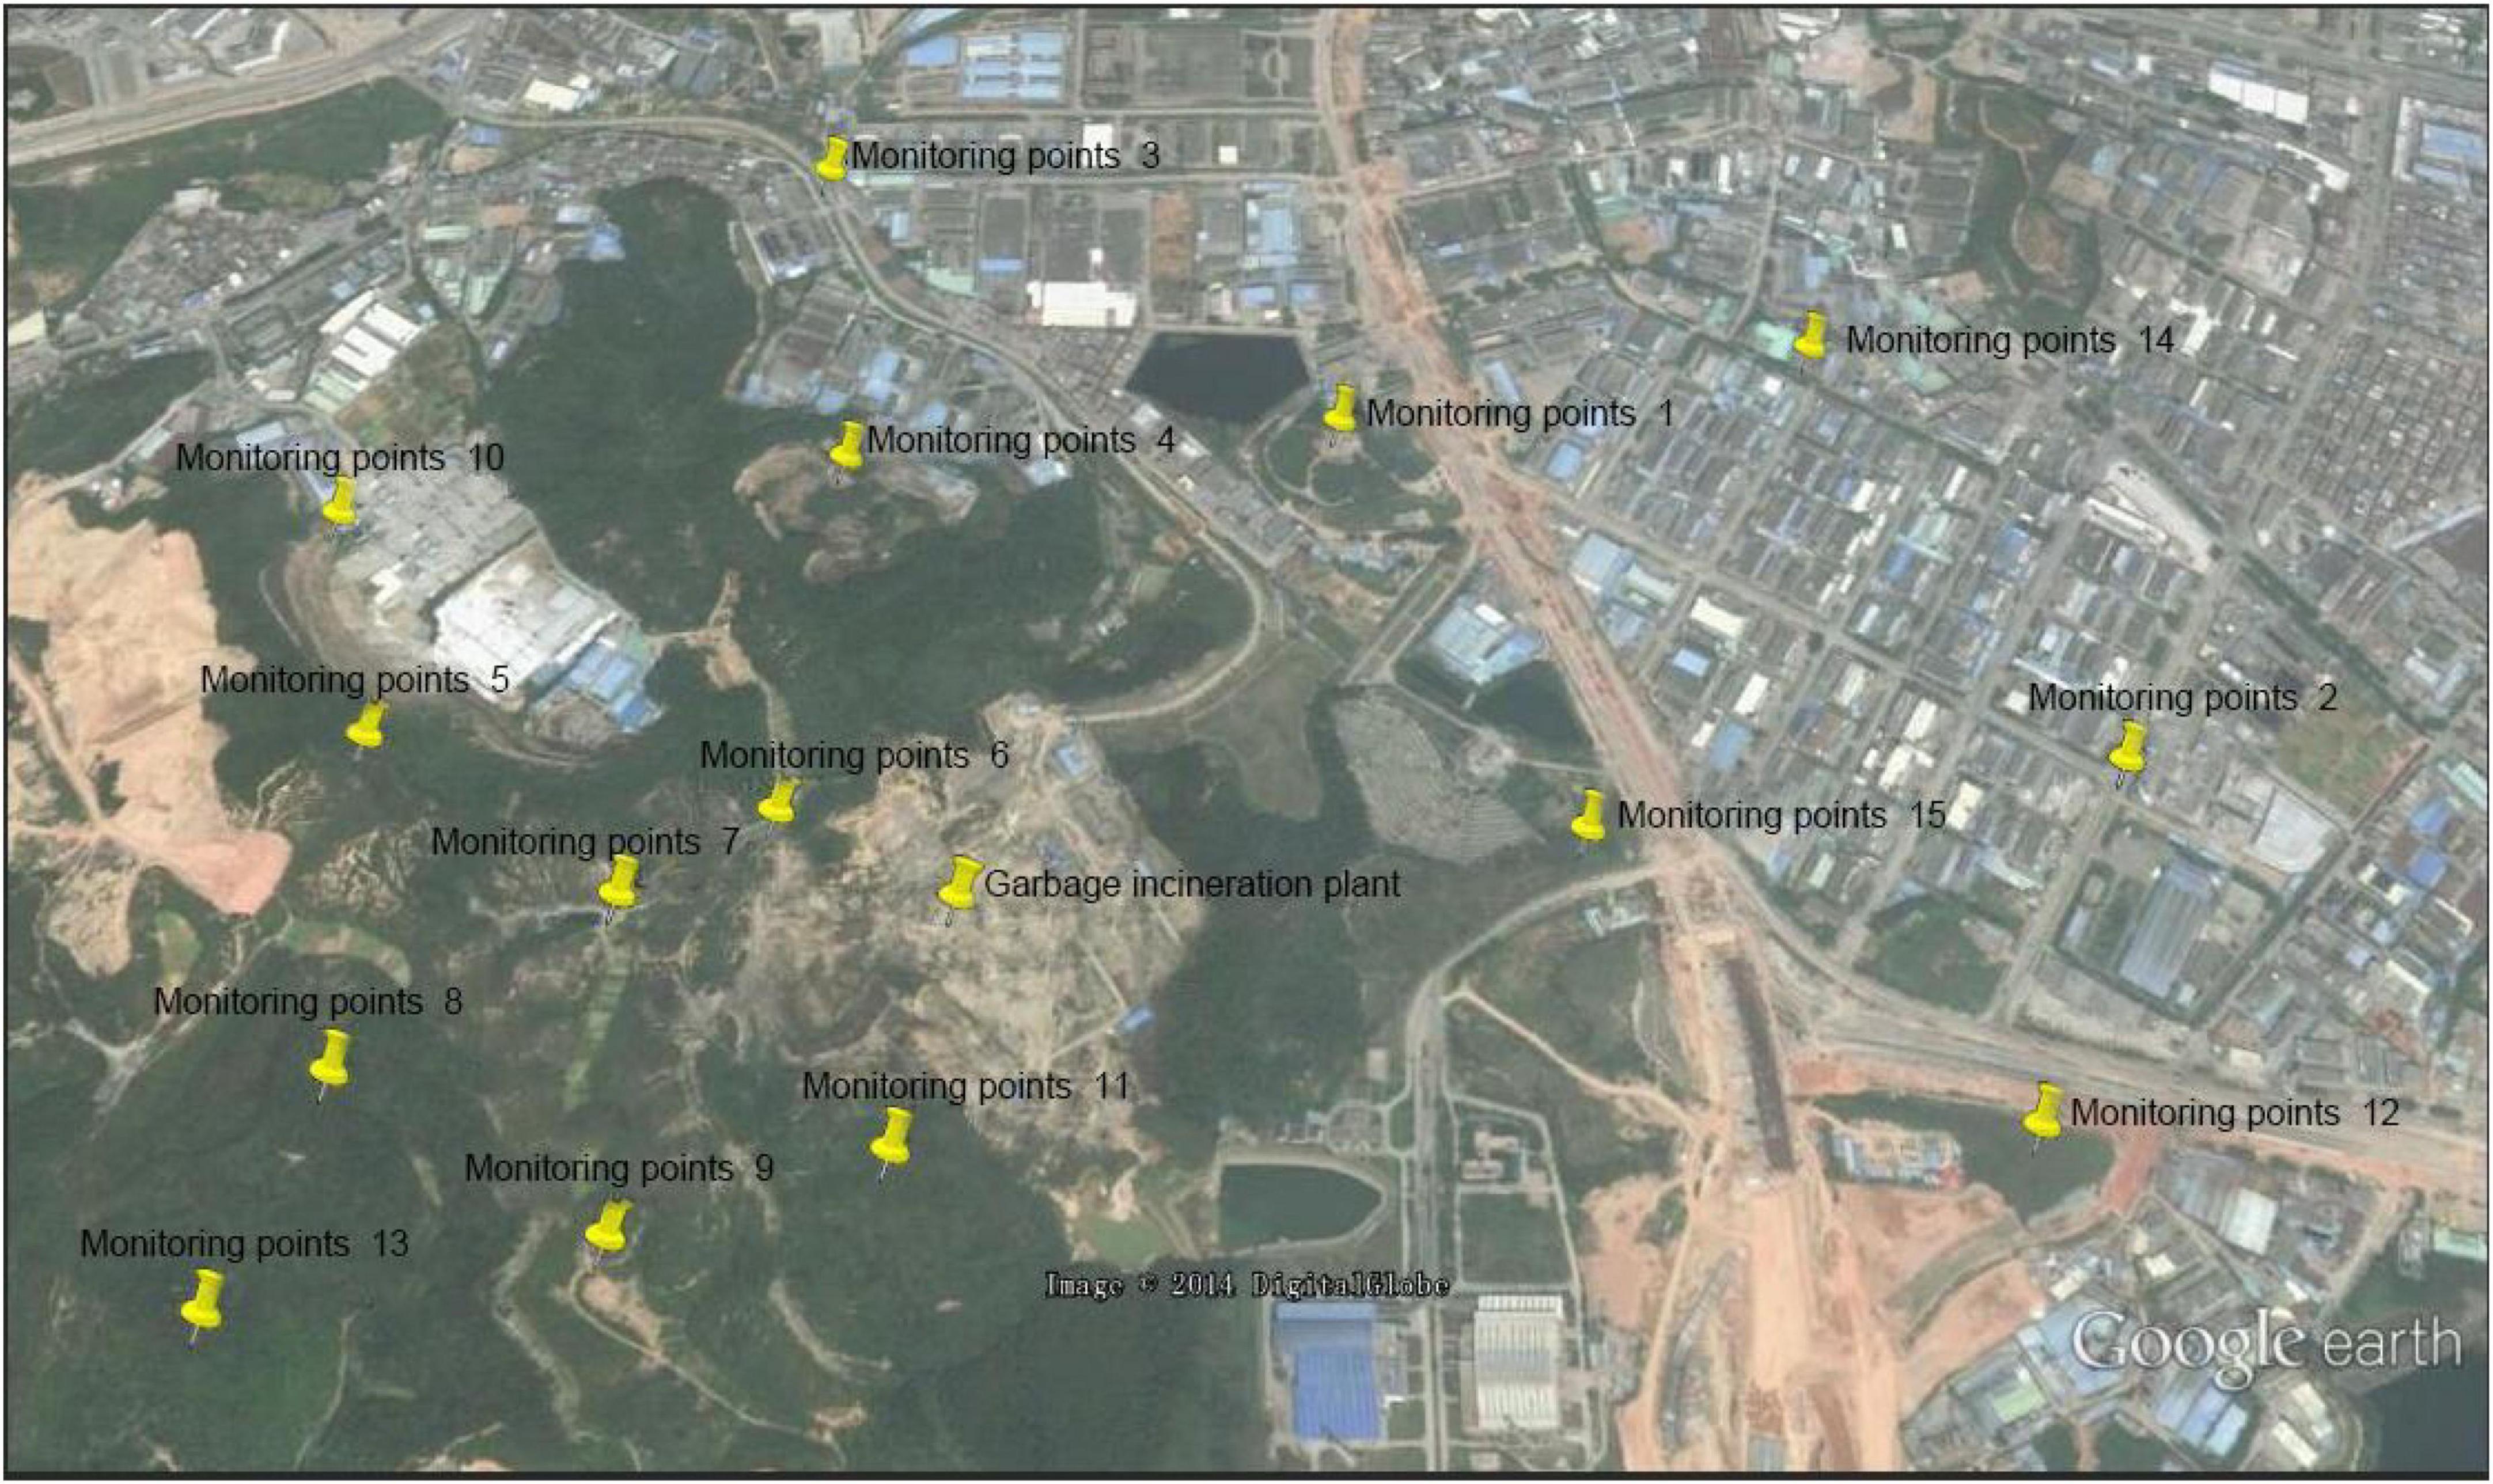
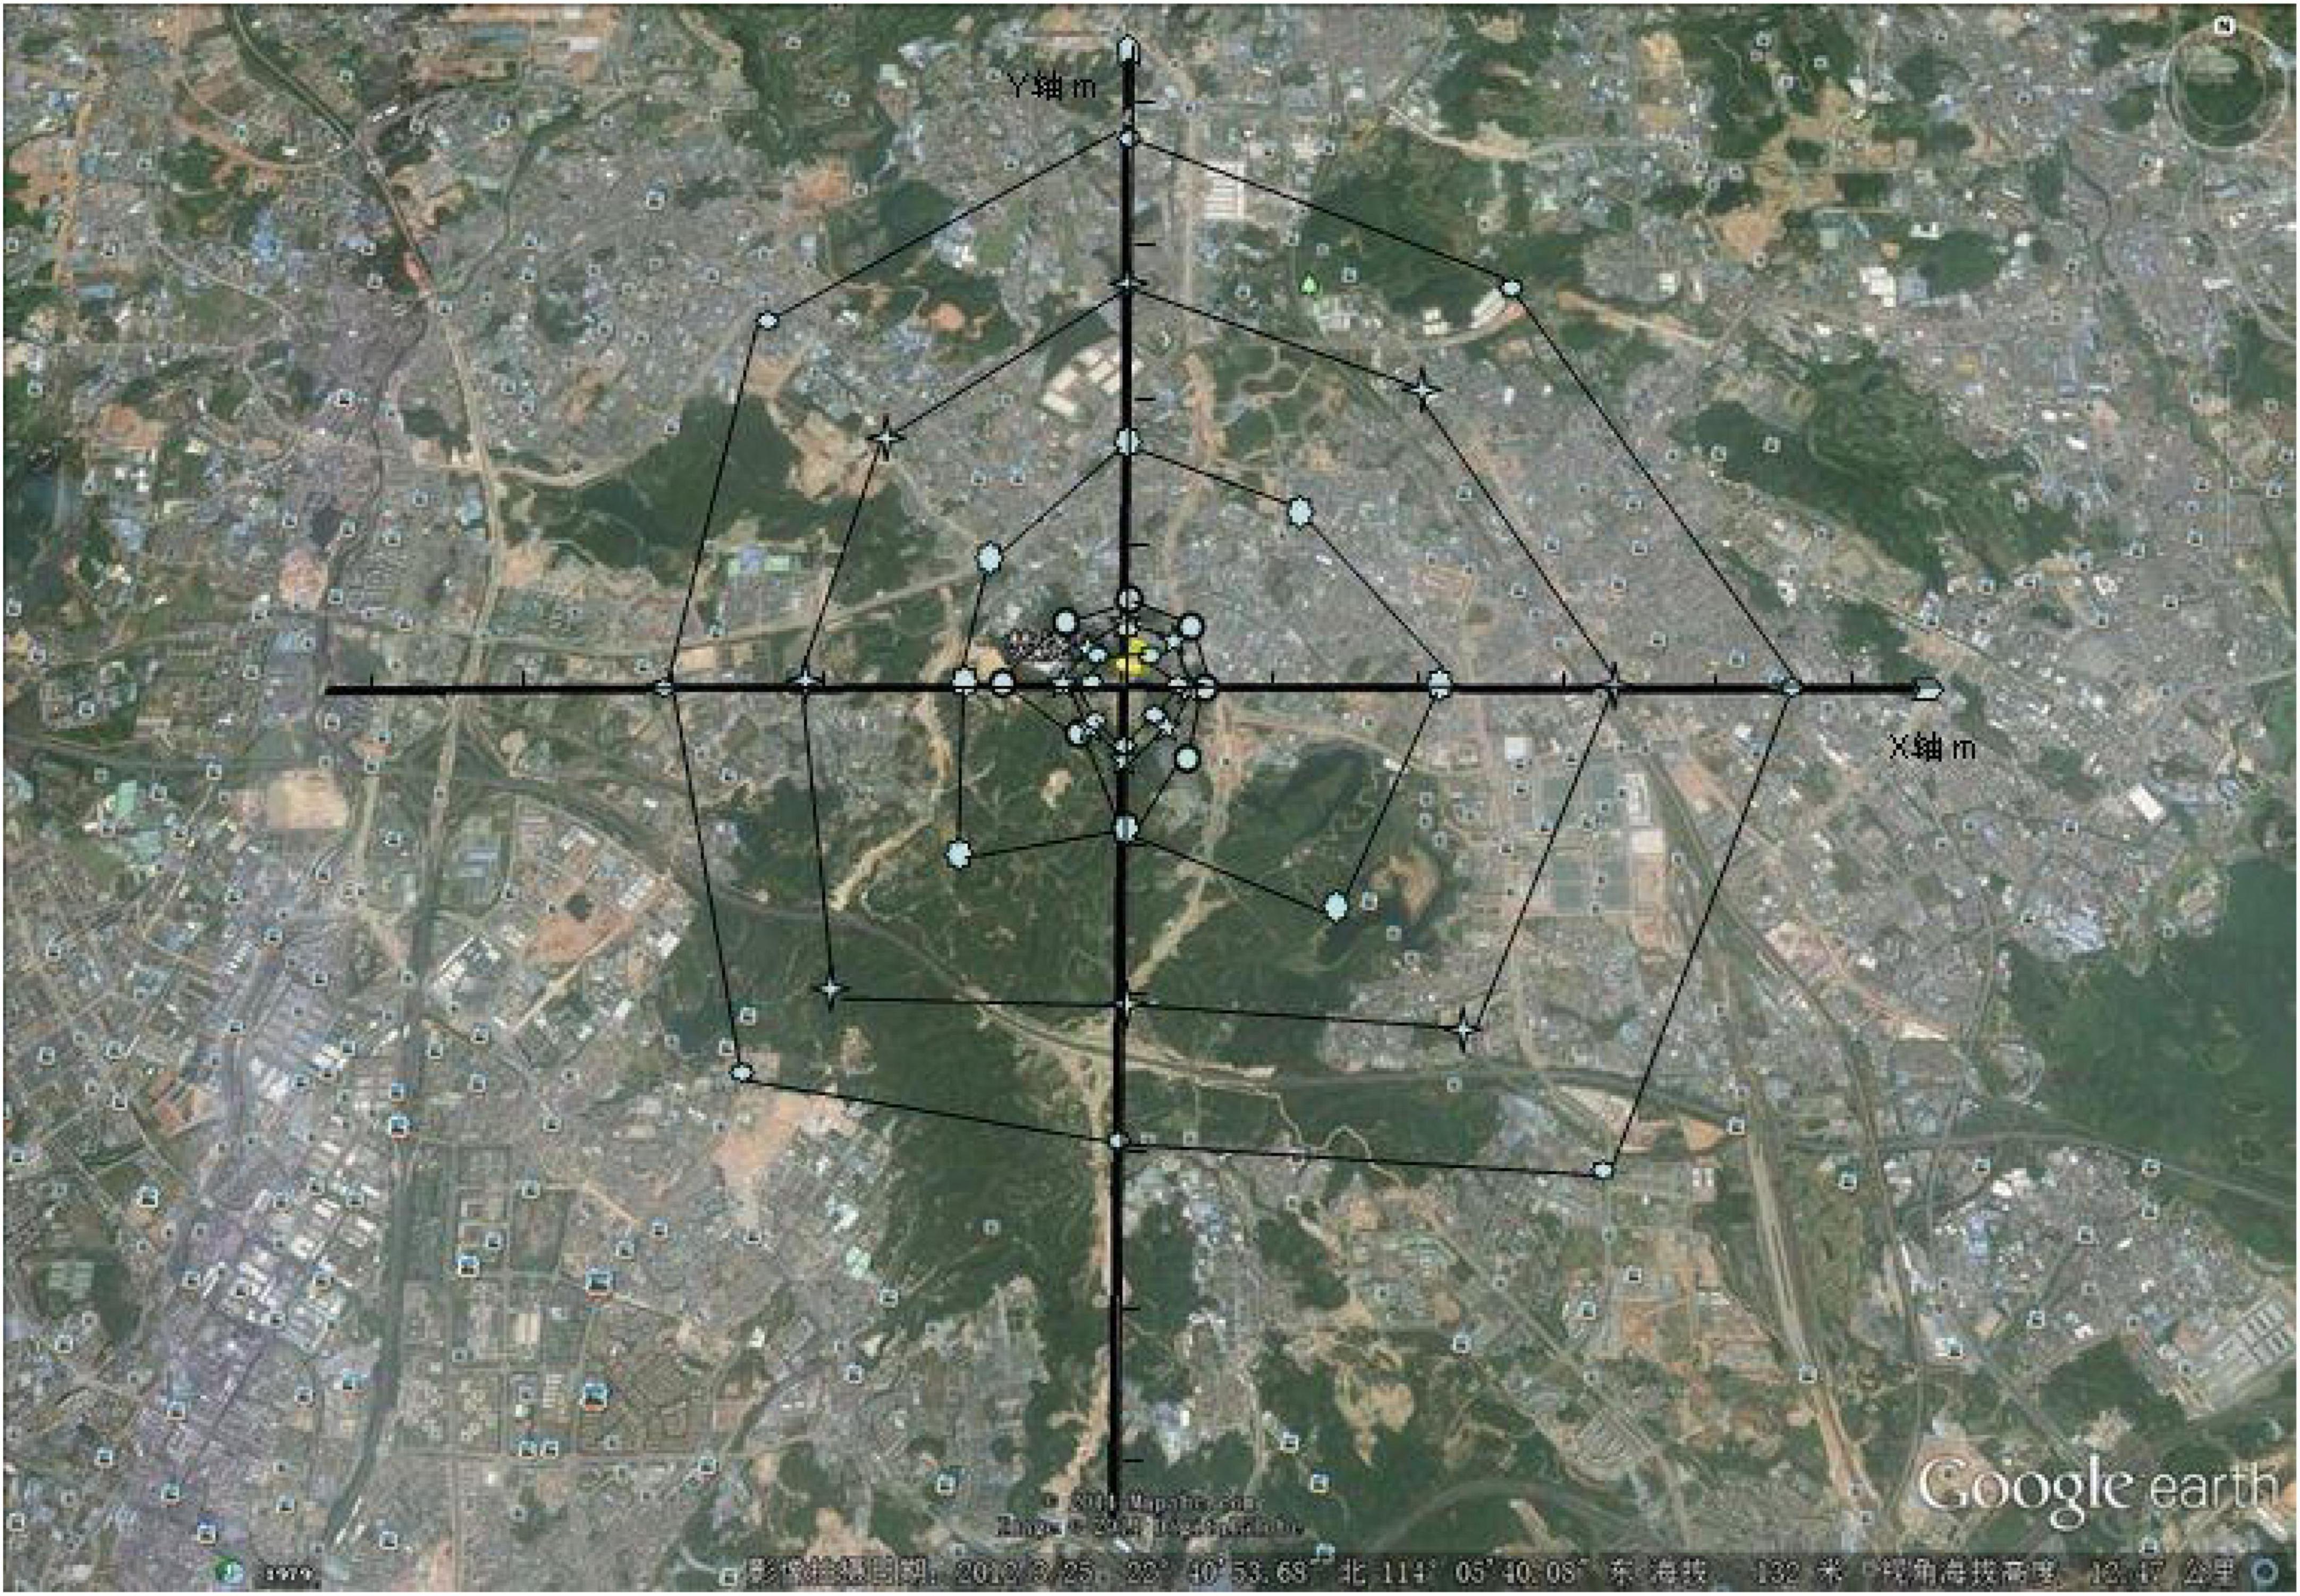
According to the maximum concentration drop location, the maximum concentration position in eight directions is obtained to be 928 m. Monitoring points are placed to achieve the best monitoring results. It can be obtained from the wind frequency map that the dominant wind direction (southwesterly wind) is significant throughout the year. Therefore, it is encrypted in the downwind direction and comprehensively considers the topographical factors, so that each monitoring point coincides with the monitoring environment air sensitive area, and is installed at the foothills and the top of the mountain. The essence of environmental monitoring is to study the impact of pollutants on people, the height of the sampling point should be set at the ground 1.5∼2.0m. The monitoring point should be updated every hour, or at 2:00, 5:00, 8:00, 11:00, 14:00, 17:00, 20:00, 23:00. The location of the monitoring point is shown in Figure 7.
(2) Division of compensation area
According to the theoretical data, the maximum concentration values in all wind directions are not equal. Due to the ambiguity and uncertainty of wind speed and wind direction, the minimum floor concentration value of 0.1046 in eight directions is used as the lower limit of the concentration for the first level compensation area. As the concentration difference is increasingly less significant, 0.0523 is taken as the lower limit of the concentration of the second level compensation region. Finally by looking up the data, the concentration value of 0.025 is used as the lower limit of the concentration of the third level compensation area. MATLAB is applied to solve the range in the eight wind directions, as shown in the following table (Tables 12–19).
In the tables above, the distances of the three concentration levels are marked out. If there is no data, the distance is out of range. Using the distance points of the eight wind directions, the compensation level curve is fitted, and the residents near the garbage incineration plant are considered to be subjected to other pollution. Therefore, the first level of compensation is also applied to the residents within the range of 1,000 m, thereby realizing the division of the economic compensation area.
The area division map is shown in Figure 8.
The economic compensation plan for the surrounding residents is approved by the local government (street or community). The compensation target is, in principle, the original resident who was not registered in the previous year as the standard.
(1) Compensation method:
According to the level of local economic development, the minimum wage standard, and the relevant provisions of the state, the amount of compensation per person is determined.
During the operation period of the sanitation facilities, the income from the operating unit (mainly the garbage disposal fee) or the government’s finances shall be paid to the affected communities in the local area. At the same time, the community shall decide the distribution method of compensation under the supervision of the relevant department. The amount of compensation per person can be adjusted according to price changes.
Set up medical insurance compensation to protect the health of the surrounding residents.
Under the supplementation by some indirect compensation schemes, material benefits are brought to the surrounding people, such as waste treatment by-product feedback (including ash, scrap iron, electricity, steam, heat); public facilities sharing; contracting projects, procurement, employment priority; partial tax relief; compensation for falling operating income and other indirect compensation methods.
The annual satisfaction survey and market analysis change the compensation plan dynamically and promptly.
(2) Compensation standard:
According to different economic compensation areas, different economic compensation weights are set up, and the degree of pollution is proportional to the amount of compensation. The garbage incineration plant targets the minimum compensation fund and the highest satisfaction of residents. 10% of the annual profit of the incineration plant plus government financial subsidies are pooled as the total funds for economic compensation. For the residents of different regions, the compensation plan is formulated according to the local development situation, and the total compensation amount for each level of compensation area is 5:3:2.
Conclusion
By taking a medium-sized waste incineration plant in Shenzhen as an example, in this paper, mathematical models are constructed to improve the integrity and scientificity of the environmental compensation mechanism and solve the economic compensation problem for the surrounding residents. Through analysis, it can be seen that the proposed compensation scheme can satisfy the requirements of the surrounding residents.
Data availability statement
The original contributions presented in this study are included in the article/Supplementary material, further inquiries can be directed to the corresponding author.
Author contributions
YG and RG were responsible for designing the framework of the entire manuscript from topic selection to solution to experimental verification.
Conflict of Interest
The authors declare that the research was conducted in the absence of any commercial or financial relationships that could be construed as a potential conflict of interest.
The reviewer JH declared a shared affiliation RG handling editor at the time of review.
Publisher’s note
All claims expressed in this article are solely those of the authors and do not necessarily represent those of their affiliated organizations, or those of the publisher, the editors and the reviewers. Any product that may be evaluated in this article, or claim that may be made by its manufacturer, is not guaranteed or endorsed by the publisher.
References
Cao, L., and Zhang, R. (2017). Study on Site Selection, Operation and Optimization of Urban Domestic Waste Landfill Taking Maichang Waste Treatment Center in Nanchang as an Example. Sci. Technol Plaza 11, 172–176.
Chen, Y. Y. (2017). Discussion on the impact of water conservancy project construction on ecological environment.South China. Agriculture 11:111.
Dongyue, G., and Guangwei, L. (2021). Opportunities and risks faced by waste incineration power generation enterprises under the background of “dual-carbon”. Energy Energy Conserv. 10:2.
Fan, H. B. (2018). Site Selection of Waste Incineration Project: Difficulties, Causes and Solution Also on Substantial Public Participation. J. Anqing Norm. Univ. 37, 68–72.
Han, J. F. (2017). Research on the legal issues of the construction of environmental administrative compensation system in China. Chongqing: Southwest University of Political Science and Law.
Li, Q., Ma, H. M., Chen, Y. J., and Bi, Z. J. (2017). Research on Site Selection Optimization of Domestic Waste Transfer Stations in Villages and Towns. Environ. Sanit. Eng. 25, 66–69.
Liu, C., Zheng, S., Gao, H., Yuan, X., Zhang, Z., Xie, J., et al. (2022). The race to zero emissions: Can renewable energy be the path to carbon neutrality? J. Environ. Manag. 308:114648. doi: 10.1016/j.jenvman.2022.114648
Lu, K. (2017). Research on site selection of waste treatment industrial park based on AHP-GIS model. Chongqing: Chongqing University.
Ma, H., and Tsai, S. B. (2017). Design of Research on Performance of a New Iridium Coordination Compound for the Detection of Hg2+. Int. J. Environ. Res. Public Health 14:1232. doi: 10.3390/ijerph14101232
Ma, H., Zhang, X., Ju, F., and Tsai, S. B. (2018). A Study on Curing Kinetics of Nano-Phase Modified Epoxy Resin. Sci. Rep. 8:3045.
Naqvi, B., Rizvi, S. K. A., Hasnaoui, A., and Shao, X. (2022). Going beyond sustainability: The diversification benefits of green energy financial products. Energy Econ. 111:106111.
Pu, L. X., and Li, L. (2018). Demonstration of Site Selection for Waste Incineration Power Plant Taking a Domestic Waste Incineration Power Plant in Kunming as an Example. Build. Mater. Dev. Orient. 16, 104–106.
Qian, K., Huang, Z. Q., and Liu, X. F. (2017). Environmental compensation mechanism of adjacent avoidance facilities based on evolutionary game perspective. Syst. Eng. 35, 88–94.
Song, Y. Y., and Gao, H. Z. (2017). Research on Site Selection Method of Landfill Sites. Shanghai Environ. Sci. 36, 225–230.
Wang, J. (2018). Research on the verification mechanism of environmental compensation standard for domestic garbage disposal environmental park. Environ. Sanit. Eng. 26, 84–86.
Wei, X. (2017). A look at the optimization of site selection for municipal solid waste incineration power plants. Low Carbon World 23, 116–117.
Wei, Y. W., and Wen, W. (2018). On the construction of ecological environment compensation mechanism under the principle of investment and income reciprocity. Contemp. Econ. 02, 52–53.
Yang, X. F., He, X. Z., and Jin, J. D. (2018). Behavioral Logic, Multiple Dilemmas and Governance Strategies of Adjacency Avoidance Analysis of Location Scenario Based on Waste Incineration Planning. J. Party Sch. Hangzhou Municipal Committee 02, 48–54.
Yanqing, Q. C., Zhonglong, C., and Qiang, Y. (2021). The application of intelligent technology in the process of urban solid waste collection, transportation and disposal. 2021.
Yu, Y. L., Chen, H. B., Wang, J. S., Miao, Y., Liu, C., Zhu, B., et al. (2018). Research on Location Decision of Central Collecting Station for Domestic Waste Pneumatic Conveying System. Environ. Sustain. Dev. 43, 149–152.
Zhang, Y., Ma, H., and Zhao, S. (2021). Assessment of hydropower sustainability: Review and modeling. J. Clean. Prod. 321:128898. doi: 10.1016/j.jclepro.2021.128898
Zhao, L., and Ren, H. (2017). Study on the Construction of Mine Ecological Environment Compensation Mechanism in Shanxi Province. Environ. Sci. Manag. 42, 158–161.
Keywords: environmental monitoring, compensation scheme, analytic hierarchy process, elevated continuous point source diffusion model, carbon neutrality, double carbon
Citation: Gao Y and Gao R (2022) Research and analysis of environmental legal compensation mechanisms related to waste incineration in the context of “double carbon”. Front. Ecol. Evol. 10:979482. doi: 10.3389/fevo.2022.979482
Received: 27 June 2022; Accepted: 17 August 2022;
Published: 06 September 2022.
Edited by:
Xuefeng Shao, University of Newcastle, AustraliaReviewed by:
Yuexian Liu, University College London, United KingdomJingyue Han, The University of Sydney, Australia
Yijun Liu, Harbin Institute of Technology, China
Copyright © 2022 Gao and Gao. This is an open-access article distributed under the terms of the Creative Commons Attribution License (CC BY). The use, distribution or reproduction in other forums is permitted, provided the original author(s) and the copyright owner(s) are credited and that the original publication in this journal is cited, in accordance with accepted academic practice. No use, distribution or reproduction is permitted which does not comply with these terms.
*Correspondence: Yuanfei Gao, MjAxMTAxMDAxN0B4YXVmZS5lZHUuY24=
 Yuanfei Gao
 Ruosu Gao
