 Guangliang Jia1,2Yulin Dong2,3Siyu Zhang2,3,4Xingyuan He1,2Haifeng Zheng2,3Yujie Guo2,3Guoqiang Shen2,3
 Wei Chen1,2*
- 1Key Laboratory of Forest Ecology and Management, Institute of Applied Ecology, Chinese Academy of Sciences, Shenyang, China
- 2University of Chinese Academy of Sciences, Beijing, China
- 3Key Laboratory of Wetland Ecology and Management, Northeast Institute of Geography and Agroecology, Chinese Academy of Sciences, Changchun, China
- 4Guizhou Provincial Key Laboratory of Geographic State Monitoring of Watershed, Guizhou Education University, Guiyang, China
Trade-offs between ecosystem services are measures of the degree to which the changing differences between the individual ecosystem services. Although changes in ecosystem service trade-offs are critical for forest ecosystem management, spatiotemporal changes in trade-offs are currently less studied, especially under the influence of ecological engineering implementation. Therefore this study explored the spatiotemporal changes and drivers of ecosystem service trade-offs in various forest types following the implementation of the natural forest conservation project (NFCP), with the example of the Greater Khingan Mountains. Spatial analyses, and root mean square error (RMSE) were applied to investigate spatiotemporal changes in trade-offs, and geodetector was employed to assess their driving factors. The results indicated that among all ecosystem service pairs from 1990 to 2020, the trade-offs between habitat quality and net primary productivity (NPP), NPP and soil conservation showed a growing trend. However, the trade-offs between habitat quality and water conservation, NPP and water conservation, and soil conservation and water conservation showed a declining trend. The ecosystem service trade-offs of coniferous (0.47) were higher than either broad-leaved (0.37) or shrubs (0.28). Moreover, changes in the ecosystem service trade-offs of all kinds of forests were spatially heterogeneous. The drivers with the greatest explanatory power in coniferous, broad-leaved, and shrubs were land use (22.68%), land use (15.19%), and NDVI (20.63%), respectively. Environmental factors contributed great mean explanatory power (62.27–71.67%) to the trade-offs than anthropogenic activity factors. Therefore, spatiotemporal changes and drivers of trade-offs in different forests should be contemplated when conducting subsequent ecological restoration programs in the future.
Introduction
Forests are the largest natural ecosystems on Earth (FAO, 2020). They provide natural environment for humans by delivering numerous ecosystem services (Nkem et al., 2007; Mbow et al., 2014). Global climate change and increased human activities have resulted in environmental devastation and forest deterioration, such as soil erosion, water shortage, and habitat degradation (Foley et al., 2005). Habitat degradation and supply decreases in ecosystem services threaten ecosystem balance and thus human welfare (Wang et al., 2017). To tackle this issue and ensure the sustainable development of forest ecosystems, China has implemented several successively ecological projects, for instance, the natural forest conservation project (NFCP) since 2000 (Mao et al., 2019). Restoration programs have greatly improved habitat quality and ecosystem services in forest ecosystems (Benayas et al., 2009). Assessing forest ecosystem services after restoration can provide insights into future ecological projects’ implementation to maximize ecosystem service benefits (Tallis et al., 2008).
Trade-offs between ecosystem services measure the degree to which the changing differences between the individual ecosystem services (Bennett et al., 2009; Qiu et al., 2021). Trade-off interactions between forest ecosystem services may enhance or weaken by spatiotemporal changes in ecosystem services (Bennett et al., 2009). They are closely connected with spatiotemporal dynamics of ecological processes, and are spatiotemporally heterogeneous (Liu et al., 2019; Qiao J. M. et al., 2019; Qiu et al., 2021; Zhao et al., 2021). With global warming and human activities increasing, the spatiotemporal dynamic property of trade-offs makes their management more unsure and challenging (Gonzalez-Ollauri and Mickovski, 2017; Dong et al., 2020). However, most related studies were mainly focused on spatiotemporal changes in forest ecosystem services. For instance, ecosystem services provided by different forest types were significantly improved after dam construction in the Three Gorges reservoir area (Chu et al., 2019). The spatial variations of forest ecosystem services were closely connected with land use patterns (Aznar-Sánchez et al., 2018). Spatiotemporal changes in trade-offs among different forest ecosystem services can affect the increase or decrease of different ecosystem services, and thus change the ecosystem overall benefits. Comprehending the spatiotemporal disparities in trade-offs among different forest ecosystem services is relatively limited, especially the spatiotemporal changes after the ecological project implementation. Therefore, a greater comprehension of the spatiotemporal changes in forest ecosystem service trade-offs is necessary to provide an effective policy basis for forest ecosystem management.
Explicating the drivers of trade-offs is crucial for confirming corresponding solutions to alleviate trade-offs and improve ecosystem services (Power, 2010). Numerous studies indicated that the spatiotemporal dynamics of trade-offs between forest ecosystem services depended on natural factors (i.e., precipitation, elevation, slope, etc.) and anthropogenic activity factors (i.e., land use, population distribution, etc.) (Lyu et al., 2019; Peng et al., 2019). Although these studies focused on the effects of environmental factors and anthropogenic activity factors, there is still a lack of comprehensive comparison of driving factors. In addition, most of these studies used traditional correlation or regression analysis that focused on driver effects from a numerical perspective, but ignored the spatial heterogeneity of drivers themselves. Geodetector is a new tool for geographic research that can effectively analyze spatial differentiation in geographic phenomena and assess how the factors influence spatial differentiation (Han et al., 2015). The core assumption of geodetector is that if the independent variable X and the dependent variable Y have a virtual spatial correlation, they are linked (Wang et al., 2010). This approach has been progressively applied to identify the spatially stratified characteristics of land use and landscape patterns. It detects spatial differences and principal causes efficiently in geographic phenomena and can be applied to analyze the driving factors of trade-offs.
As the mainstay of the natural ecosystem in northern China, forests play a critical part in maintaining regional climate and environmental protection. The Greater Khingan Mountains are boreal forests and are necessary ecological barriers in northern China. They also play an essential role in net primary productivity (NPP), soil conservation, water conservation, and habitat quality (Mao et al., 2019; Zhang et al., 2022). To protect the ecological environment, the Chinese government has implemented the NFCP since 2000. The first phase of the NFCP ended in 2010, and the second round of the NFCP started in 2011. The effect of the NFCP on ecosystem services could guide subsequent ecological engineering. The Greater Khingan Mountains were the main area for NFCP implementation in Northeast China. Therefore, taking the Greater Khingan Mountains as an example, this paper aims to: (1) evaluate the spatiotemporal changes of forest ecosystem services in the Greater Khingan Mountains from 1990 to 2020; (2) investigate the spatiotemporal changes in ecosystem service trade-offs and their differences among various forest types; (3) measure the influence of drivers on forest ecosystem service trade-offs among various forest types using geodetector.
Materials and methods
Study area
The Greater Khingan Mountains are located at 118°14′∼127°44′E, 45°13′∼53°56′N (Figure 1). Their administrative scope includes the Hinggan League of Inner Mongolia Autonomous Region, Hulunbuir City, and the Greater Khingan Mountains area of Heilongjiang Province, with an area of about 260,000 km2. It has a temperate continental climate characterized by long, cold winters and short, rainy summers. It is rich in solar radiation resources, with a mean average temperature of –2.5 to 6.8°C and a mean annual rainfall of 310–750 mm. The vegetation types in this region are mainly coniferous, coniferous and broad-leaved mixed, broad-leaved, and shrubs. Since the areas of coniferous and broad-leaved mixed were too small, three types of forest types including coniferous, broad-leaved, and shrubs were selected in this study. The spatial patterns of the forests were digitized using the Vegetation Atlas of China (Editorial Committee for Vegetation Atlas of China, 2001).
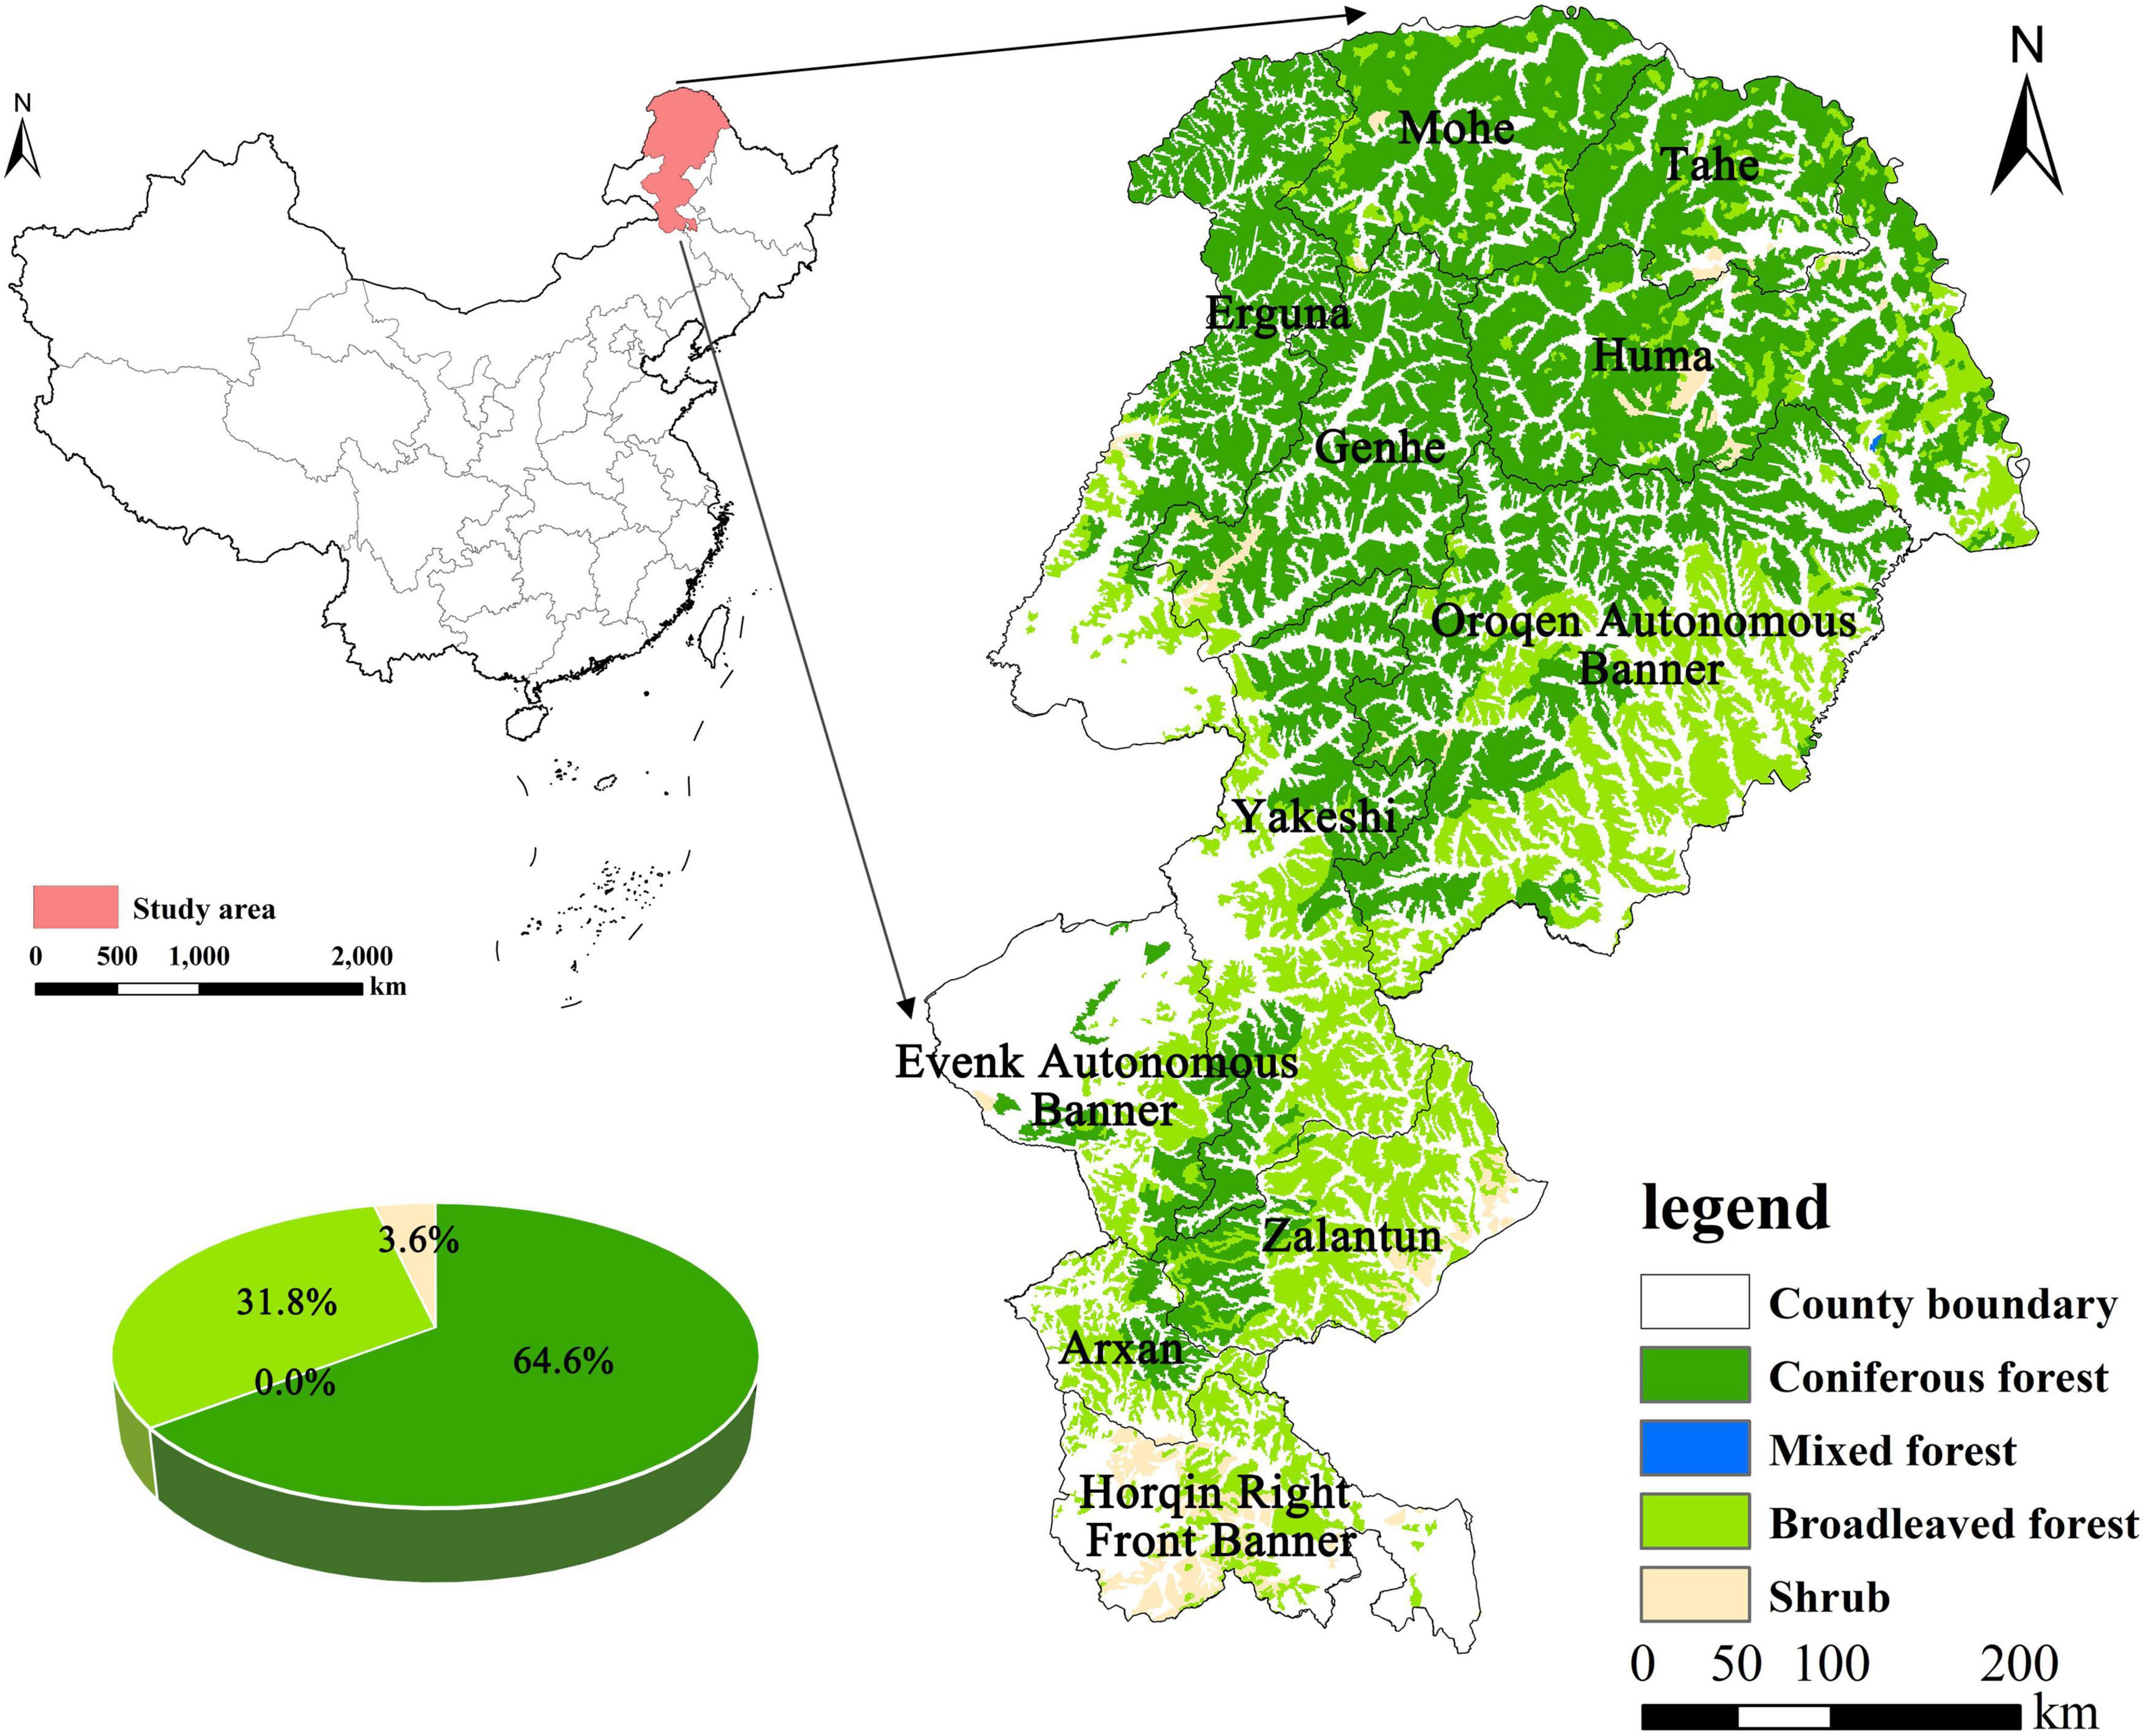
Figure 1. Location, forest types, and their percentages of the study area.
Data sources and processing
The datasets employed incorporated land use, NDVI, meteorological, elevation, soil data, GDP per land area and, population density in this paper. The specifics were shown in Table 1. Land use was used to estimate habitat quality. NDVI was used to retrieve the absorbed photosynthetic active radiation (APAR) when estimating NPP. Rainfall data were used to estimate the rainfall erosion factor. Slope, slope length, and topography factor were calculated using the elevation. Soil data were used to estimate the soil erodibility factor. All data were rescaled to 300 m to satisfy the calculation requirements.
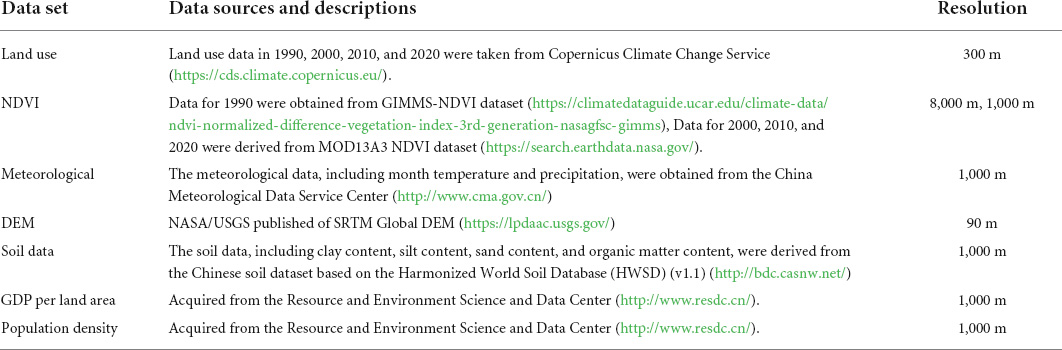
Table 1. Data sources used in this paper.
Quantification of forest ecosystem services
In recent decades, many ecological problems have been arisen in the Greater Khingan Mountains, such as soil erosion, water shortage, and habitat degradation (Mao et al., 2014). Based on previous studies and field research, we chose 4 key forest ecosystem services: NPP, soil conservation, water conservation, and habitat quality, which are highly relevant to the stakeholders in this area (Mao et al., 2019; Zhang et al., 2022).
Net primary productivity
We adopted the Carnegie-Ames-Stanford-Approach (CASA) model to estimate NPP at the grid cell scale (Potter et al., 1993). The specific calculation was as follows:
where net primary productivity (x, t) denotes the net primary productivity at points x and t, APAR (x, t) denotes the incident solar radiation received by the canopy at a particular time period (MJ⋅m–2), and ε(x, t) denotes the light energy utilization rate (gC⋅MJ–1). More information about the model can be available in the Supplementary Table 1.
Soil conservation
We employed the RUSLE model to simulate the soil conservation amount. Soil conservation was the discrepancy between potential and actual soil erosion in an ecosystem process (Ausseil et al., 2013). It was calculated using the following equation:
where SC denotes the soil conservation amount, and unit is t/(km2⋅a), R denotes the rainfall erosion force factor [MJ⋅mm/(km2⋅h⋅a)] (Fournier, 1960), K denotes the soil erodibility factor [t⋅km2⋅h/(km2⋅MJ⋅mm)] (Williams et al., 1983), LS denotes the topography factor, C denotes the cropping management factor (Cai et al., 2000), and P denotes the engineering measure factor (You and Li, 1999). More details about the model can be available in the Supplementary Table 1.
Water conservation
The water conservation module in InVEST model is grounded on the Budyko hydrothermal coupling water balance hypothesis (Budyko, 1974; Donohue et al., 2012). Taking into account the average annual rainfall and actual evapotranspiration (Zhang et al., 2001), the water yield was calculated as follows:
where Y(x) denotes the water yield in grid cell x (mm), AET(x) denotes the practical evapotranspiration in grid cell x, and P(x) denotes the annual rainfall in grid cell x (mm). More details about the model can be available in Supplementary Table 1.
Habitat quality
Habitat quality was considered as an indicator of biodiversity (Feng et al., 2018), and it was calculated as follows:
where Qxj denotes the habitat quality at grid cell x of land use type j. Dxy and Hj are overall threat degree and habitat suitability, respectively. z is set as 2.5, and k is the half-saturation constant, which has been set as 0.5. In this paper, we took farmland, urban land and highways as threats sources. More details about the model can be available in the Supplementary Table 1.
Measurement of the forest ecosystem service trade-offs
Root mean square error (RMSE) was used to quantify the trade-offs between each two ecosystem services (Bradford and D’Amato, 2012; Feng et al., 2017). It calculates trade-offs as the distance from point to line (Figure 2). The further the distance is, the greater the trade-off is. Whereas, the shorter the distance is, the more it tended to be synergistic. RMSE is a simplistic and efficient approach to express the extent of trade-offs between any two ecosystem services, regardless of their correlation. Data normalization was conducted to remove the impacts of grid cells on each ecosystem service before RMSE calculation as follows:
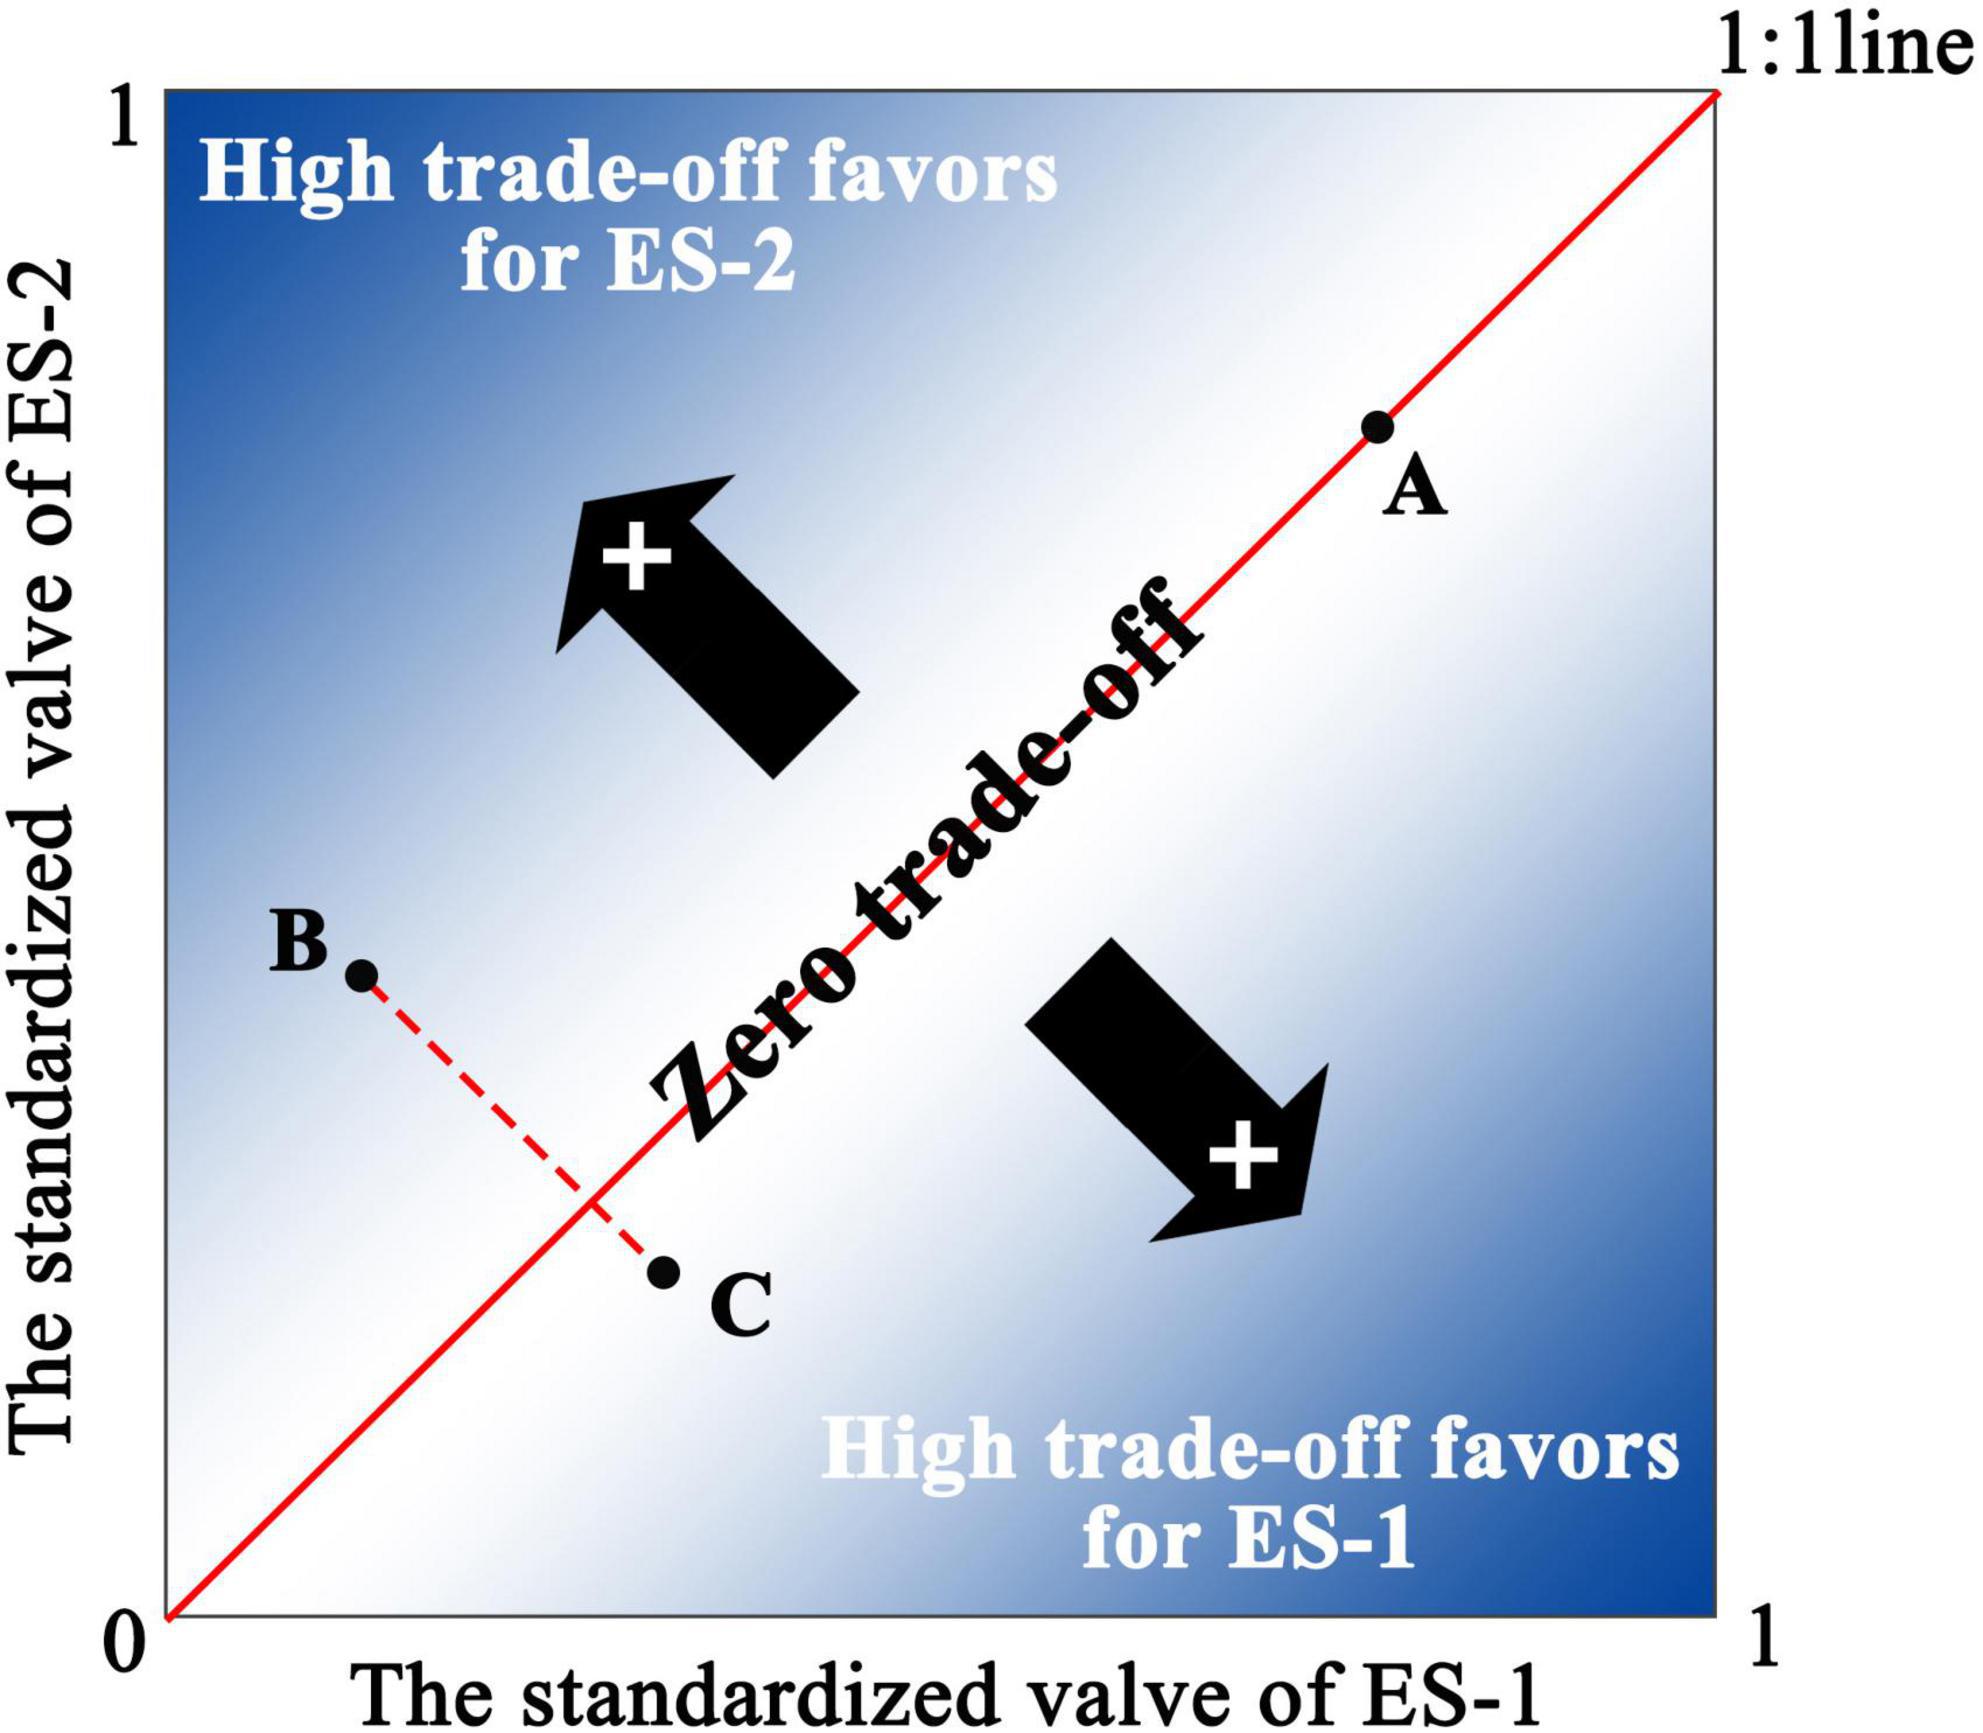
Figure 2. Illustration and example of the trade-offs between two ecosystem services. The RMSE is the distance between an ecosystem service pair’s coordinates and line 1:1, where the two ecosystem services are equal. Take Figure 2 as an example, the trade-off value at point A is 0; the trade-off value at point B is higher than that at C. Moreover, at point B the trade-off favors ES2, but at point C the trade-off favors ES1. The graph was revised based on previous studies (Bradford and D’Amato, 2012; Lu et al., 2014).
where ESstd denotes the normalized value of ecosystem services, ESobs denotes the observed value of ecosystem services, ESmin and ESmax are the minimum and maximum observed value of ecosystem services, correspondingly. The value range of ESstd is 0–1.
Then, RMSE was calculated as follows:
where ESi denotes the normalized value of ecosystem services i, and denotes the expected value of the i number of ecosystem services, n denotes the number of ecosystem service types. is the mean value of the i number of ESi (Bradford and D’Amato, 2012). The RMSE denotes the mean disparity between each ESstd and mean ESstd, and it characterizes the amplitude of scattering from the mean (Feng et al., 2017; Han et al., 2020; Xu et al., 2020). The RMSE value is between 0 and 1.
Identification of the key drivers
Nine driving factors were chosen from published studies (Lyu et al., 2019; Peng et al., 2019; Qiu et al., 2021), and they were categorized into environmental factors and anthropogenic activity factors. Environmental factors include NDVI, temperature, precipitation, elevation, slope, and soil types. Anthropogenic activity factors include land use, population density, and GDP density.
GeoDetector has particular benefit in the treatment of spatially stratified heterogeneity and categorical variables (Wang et al., 2010; Chen et al., 2020). Geodetector was applied to quantitatively identify the explanatory power of drivers for forest ecosystem service trade-offs, the value was measured by the q-value. The calculation equation is as follows:
where q denotes the explanatory power of the driving factor, n denotes the sum of sample points, σ2 denotes the sum regional variance, h = 1,2,3…L denotes the layer of factor X, nh and denote the number of sample points and variance of layer h. The q-statistic is between 0 and 1. The larger the q-statistic, the greater the explanation of ecosystem services by the influencing factors.
Results
Spatiotemporal changes in forest ecosystem services after natural forest conservation project implementation
From 1990 to 2020, all NPP, soil conservation, water conservation, and habitat quality in the Greater Khingan Mountains gradually increased. The spatial distribution of the four ecosystem services decreased from northern to southern in the Greater Khingan Mountains (Figure 3 and Table 2). Habitat quality was relatively uniform across the area. The mean value of habitat quality fluctuated between 0.57 and 0.58. The mean values of different forest types were significantly different, with values of 0.73, 0.58, and 0.42 for coniferous, broad-leaved, and shrubs, respectively. In 2000, the highest habitat quality was in the northwestern portion, and the lowest mainly focused on the southeast (Figure 3A1). In terms of temporal variation, habitat quality was relatively stable from 1990 to 2020, with small interannual variation. The mean value of habitat quality in coniferous showed a small downward trend, but small increased trends in both broad-leaved and shrubs. The stable zone (i.e., variations between –0.05 and 0.05) of habitat quality accounted for 93–98% (Figures 3A2–4). Habitat quality changed in a very small space and was less influenced by land use and threatened source changes.
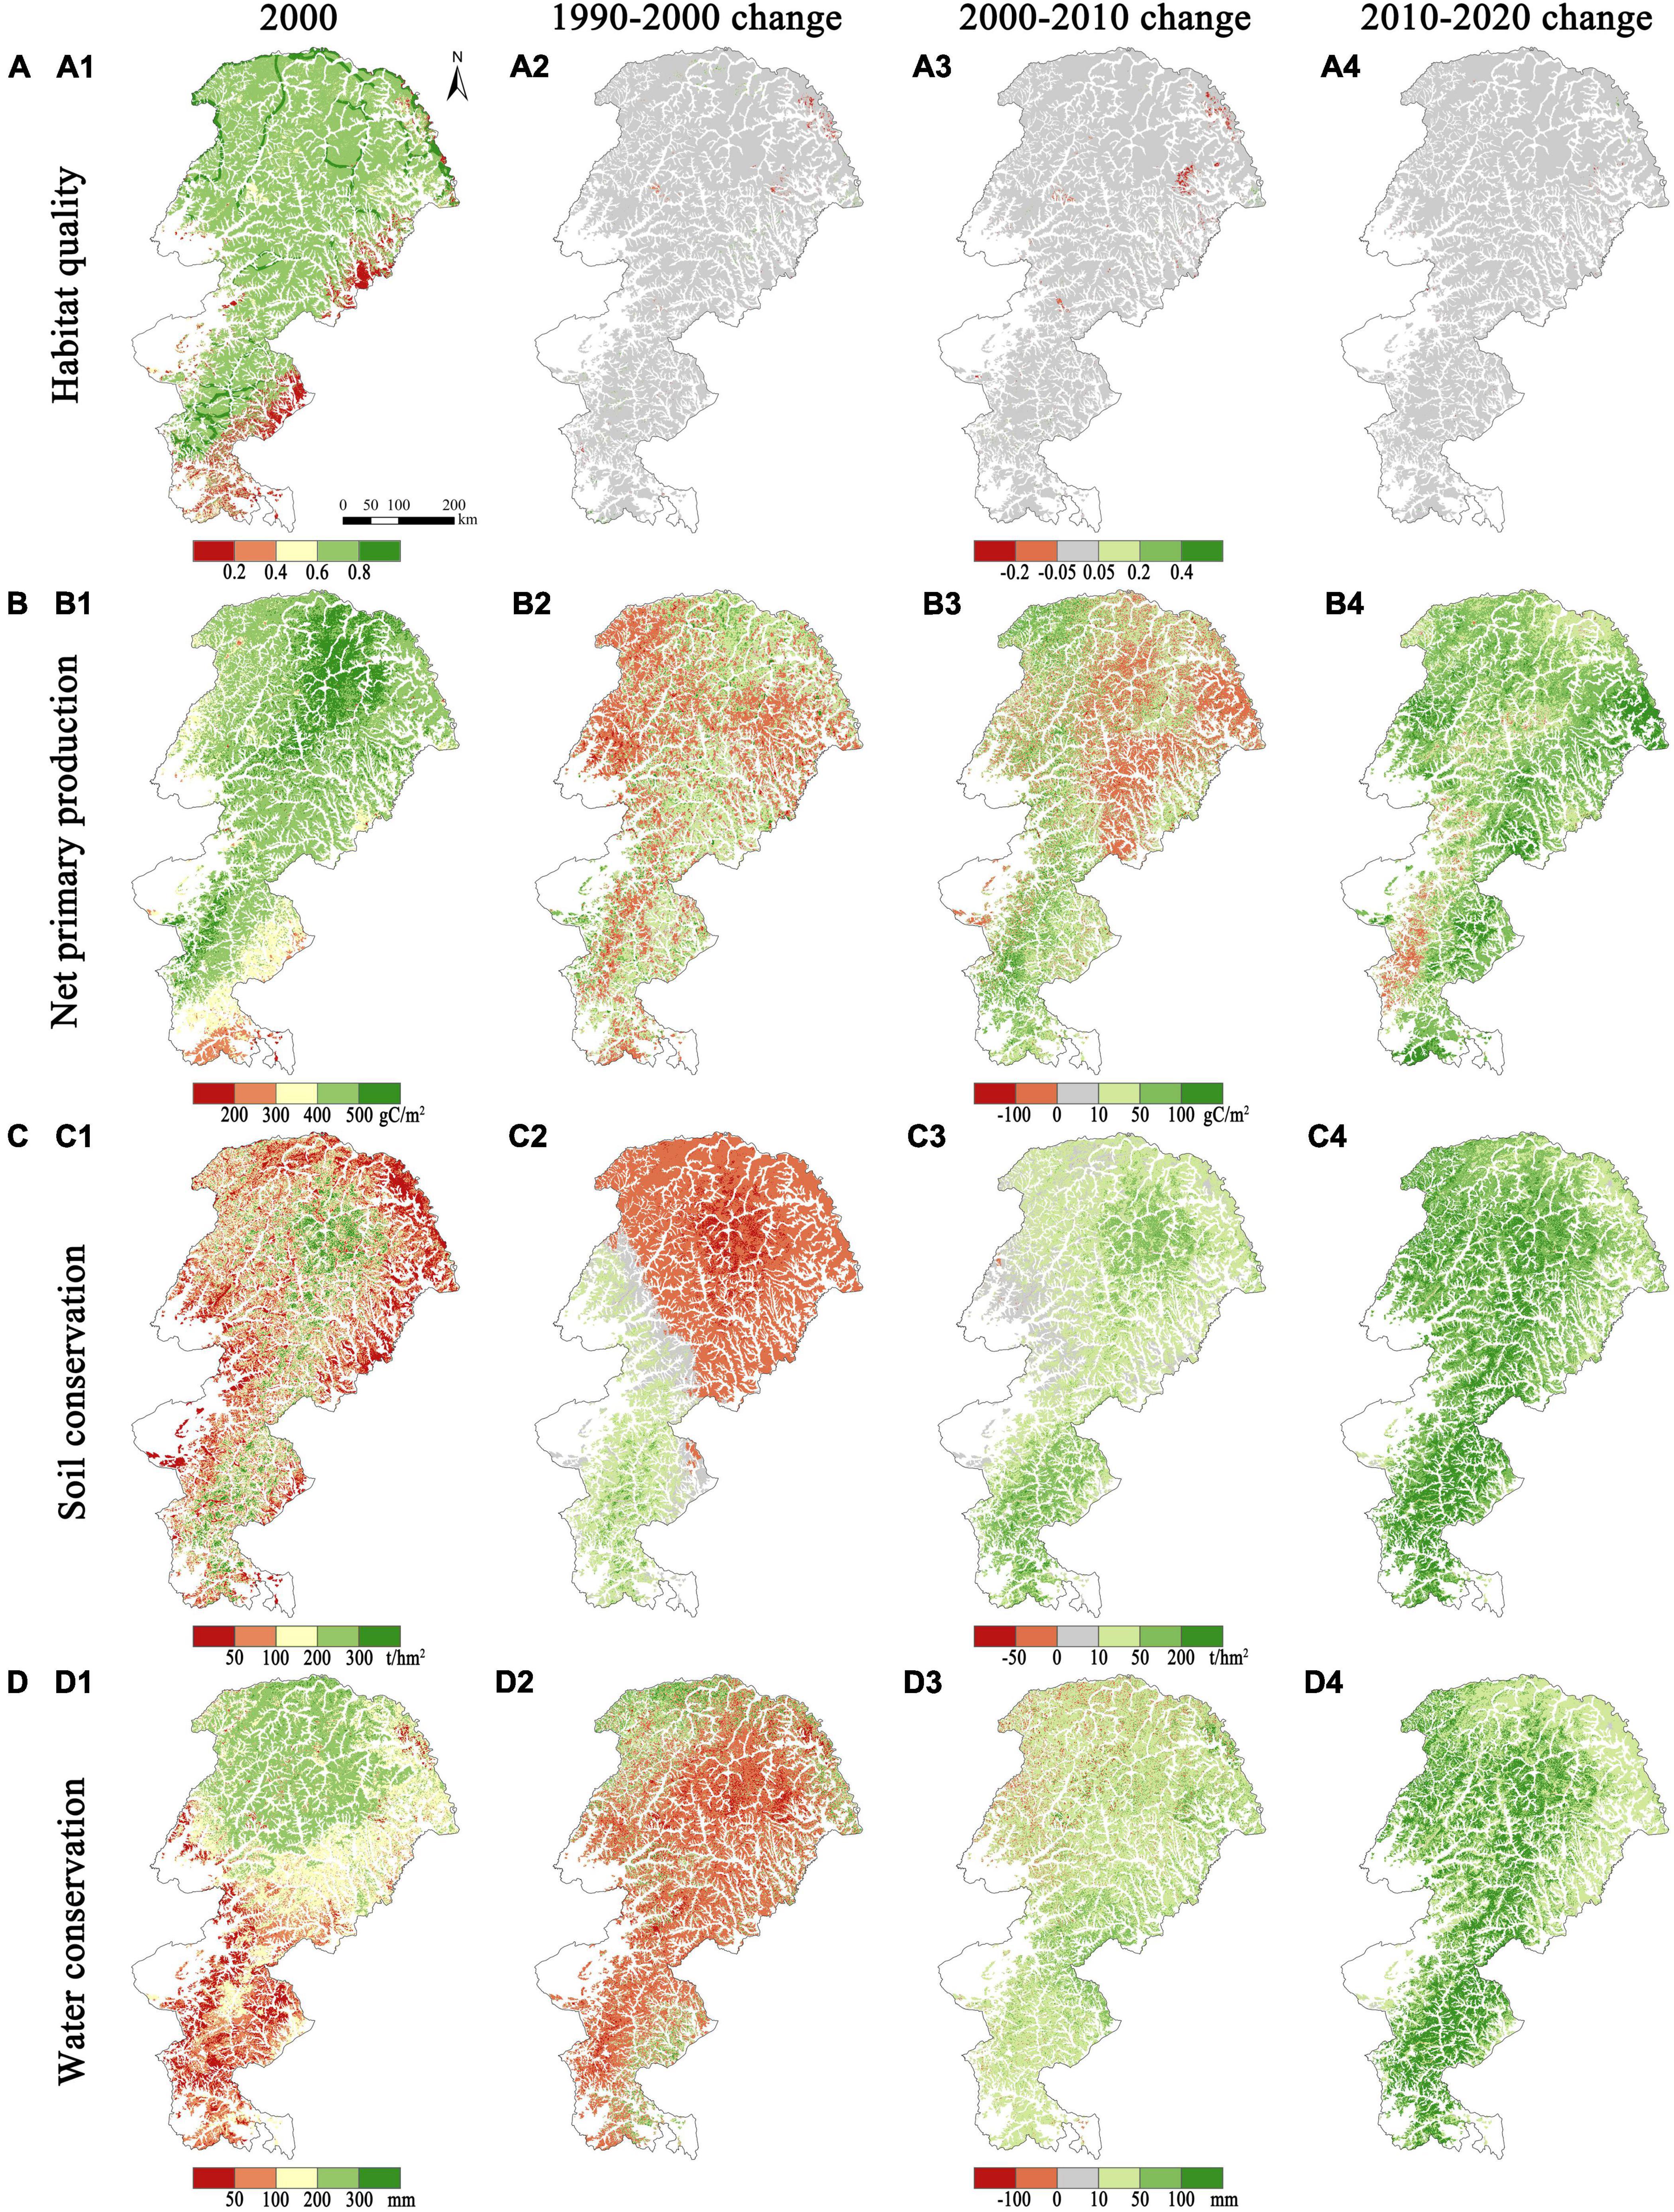
Figure 3. Changes of forest ecosystem services in the Greater Khingan Mountains from 1990 to 2020. (A) Habitat quality, (B) net primary production, (C) soil conservation, and (D) water conservation.
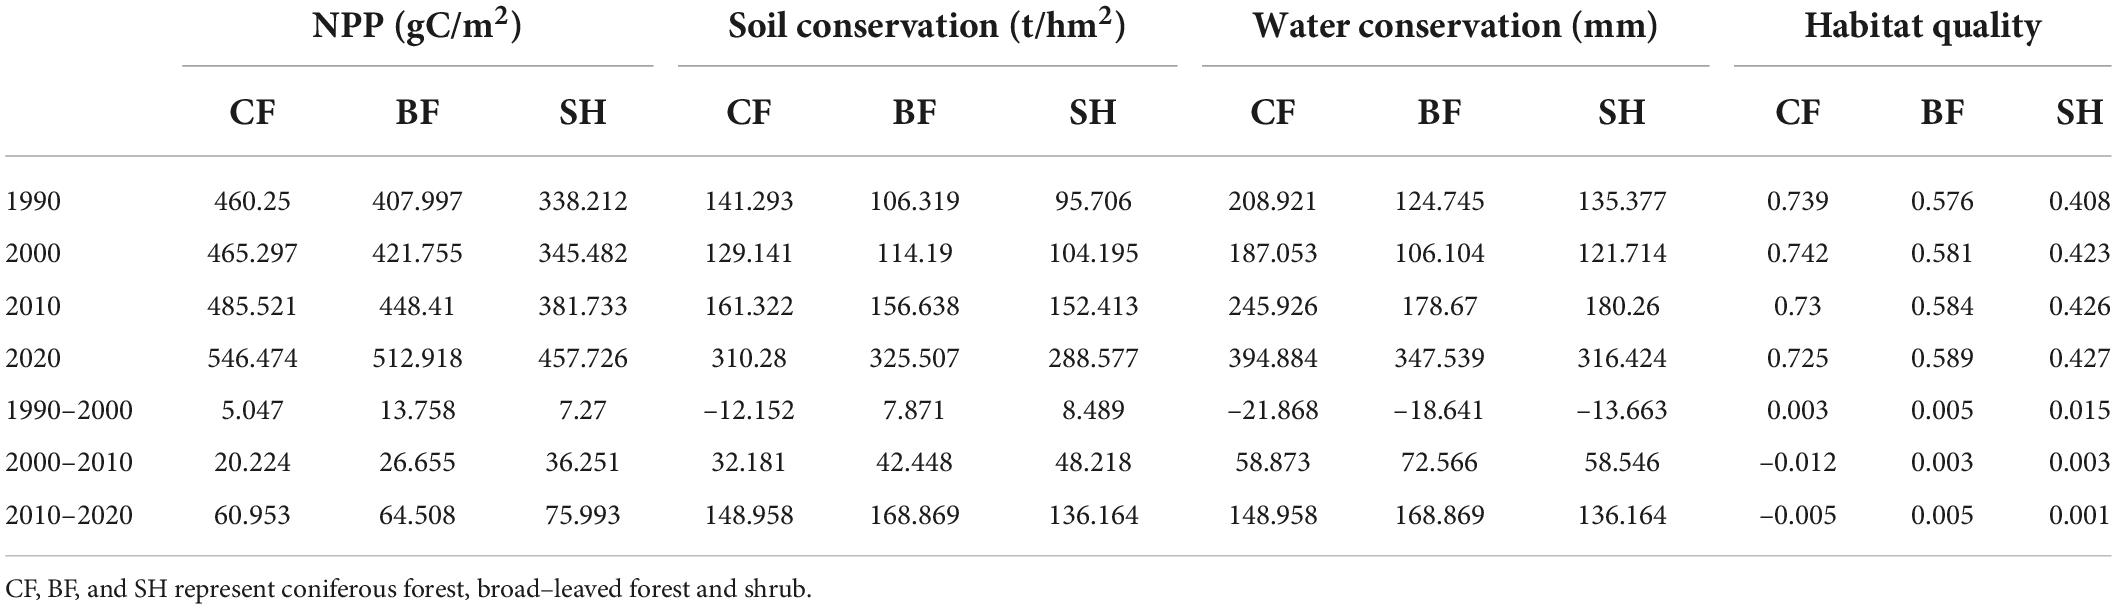
Table 2. Temporal changes of forest ecosystem services in the Greater Khingan Mountains from 1990 to 2020.
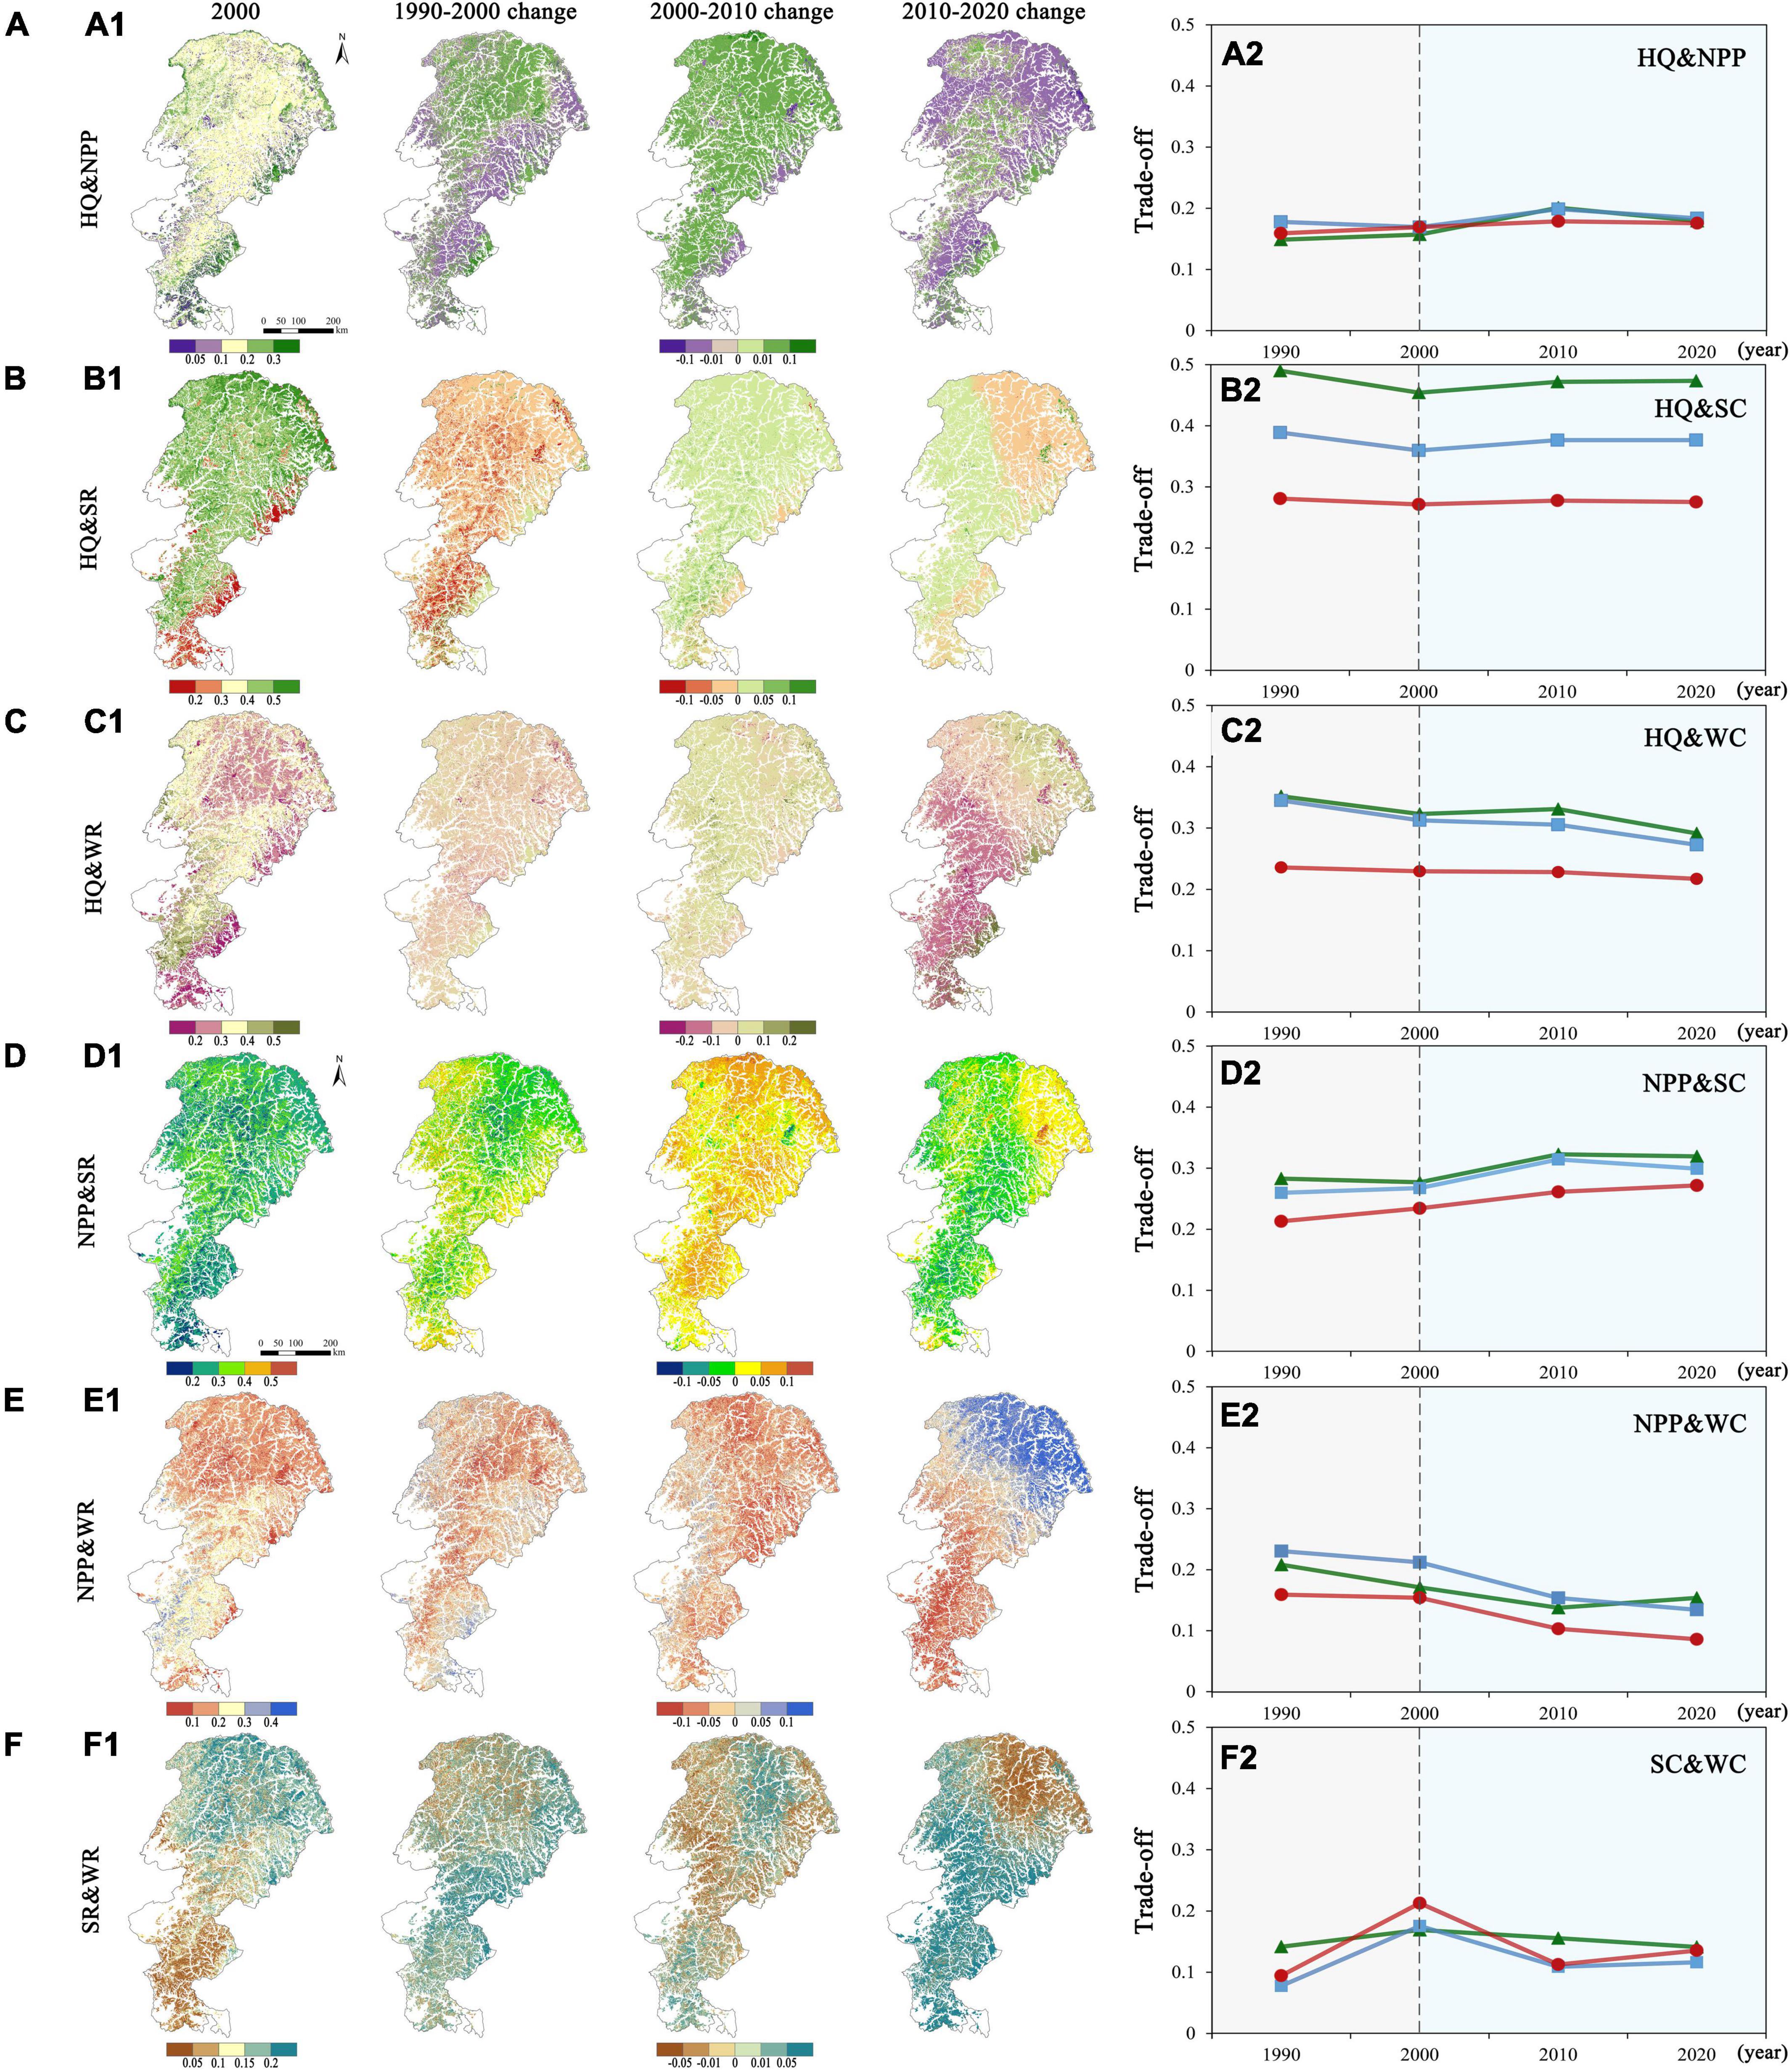
Figure 4. Spatial variations of forest ecosystem service trade-offs in the Greater Khingan Mountains from 1990 to 2020, and temporal variations in trade-offs of different forest types from 1990 to 2020. (A) HQ and NPP, (B) HQ and SC, (C) HQ and WC, (D) NPP and SC, (E) NPP and WC, (F) SC and WC. HQ, SC, and WC represent habitat quality, soil conservation, and water conservation.
The NPP showed a gradually increasing trend under various forest types. The average NPP in 1990, 2000, 2010, and 2020 were 402.15, 410.84, 438.55, and 505.71 gC/m2, respectively. The average NPP increased by 67.15 gC/m2 in 2010–2020, which was significantly higher than that in 1990–2000 (8.69 gC/m2) and 2000–2010 (27.71 gC/m2). Moreover, the increased NPP of shrubs (75.99 gC/m2) was significantly higher than that of coniferous (60.95 gC/m2) and broad-leaved (64.50 gC/m2) in 2010–2020. The average NPP of coniferous was higher than that of broad-leaved, higher than that of shrubs between 1990 and 2020. For spatial distribution, NPP gradually decreased from northeastern to southwestern in 2000. Compared with 1990–2000, the NPP in 2010–2020 increased more in the northwestern and southeastern Greater Khingan Mountains, with an increasing percentage of 48–76%, respectively.
In terms of temporal variation, soil conservation decreased and then increased from 1990 to 2020. It slightly decreased in 1990–2000, slightly increased in 2000–2010, but significantly increased in 2010–2020. The soil conservation in various forest types changed different showed different trends. Soil conservation of coniferous decreased and then increased, while soil conservation of broad-leaved and shrubs constantly increased from 1990 to 2020. In terms of spatial distribution, the highest soil conservation was in the northwestern Greater Khingan Mountains, and the lowest primarily focused on the peripheral areas in 2000. From 1990 to 2000, the proportions of the area where the soil conservation increased and decreased were 62 and 38%, respectively. The increased areas of soil conservation during 2000–2010 and 2010–2020 accounted for 83 and 92%, respectively. The increased soil conservation was associated with the NFCP implementation.
Water conservation significantly decreased and increased from 1990 to 2020 (Figure 3D). The mean value of water conservation slightly decreased from 1990 to 2000, gradually increased from 2000 to 2010, and significantly increased from 2010 to 2020. Water conservation under different forest types showed consistent temporal variations from 1990 to 2020. Among them, water conservation of coniferous had the highest average value. Water conservation of broad-leaved had the fastest growth. The highest water conservation was found in the coniferous in the northern Greater Khingan Mountains, whereas the lowest water conservation was found in the shrubs in the southwest. From 1990 to 2000, the area of decreased water conservation accounted for 68% of the region, while in 2000–2010 and 2010–2020, the area of increased water conservation accounted for 82 and 86%, respectively.
Spatiotemporal changes in forest ecosystem service trade-offs after natural forest conservation project implementation
In this paper, we used the forest ecosystem service trade-offs in 2000 as a reference to compare the trade-off changes after NFCP implementation (Figure 4). From 1990 to 2020, the trade-offs between habitat quality and NPP, NPP and soil conservation, and soil conservation and water conservation increased, while the trade-offs between habitat quality and water conservation, NPP and water conservation decreased. The trade-off between habitat quality and soil conservation were relatively stable before and after NFCP implementation. Moreover, all the trade-offs of three forest types showed clear stratifications. The RMSE of coniferous (0.47) was higher than that of broad-leaved (0.37), was higher than that of shrub (0.28). The trade-off between habitat quality and soil conservation in coniferous and broad-leaved decreased by 0.06 and 0.07 from 1990 to 2020, respectively. While the trade-off between habitat quality and soil conservation in shrubs remained essentially unchanged. Both the NPP and soil conservation trade-offs in 1990–2000 and in 2000–2020 increased. The trade-off between NPP and soil conservation in shrubs increased by 0.06 over 30 years, which was higher than in coniferous and broad-leaved. The soil conservation and water conservation trade-offs increased and then decreased from 1990 to 2020. The trade-offs between soil conservation and water conservation decreased after NFCP implementation.
In terms of spatial distribution, the trade-offs between pairs of ecosystem services showed significant spatial heterogeneity in the three forest types. From 2000 to 2010, the trade-off between habitat quality and NPP increased in the 84% areas of the Greater Khingan Mountains. The trade-off between habitat quality and soil conservation in 2000 decreased from northern to southern. The highest values were found in northern coniferous, while the lowest values were in the southeastern shrubs. The trade-off between habitat quality and water conservation decreased in the 71% areas of the region from 2010 to 2020. The trade-offs between NPP and soil conservation increased in 64, 92, and 53% areas of the region during 1990–2000, 2000–2010, and 2010–2020, respectively. The spatial heterogeneity trade-offs between soil conservation and water conservation from 1990 to 2020 were higher than that between any other two ecosystem services. It suggested that the trade-offs between soil conservation and water conservation were more affected by the NFCP than between other ecosystem services.
The trade-offs between each two ecosystem services were considerably different among the three forest types (Figure 5A). In the histogram, the trade-offs in coniferous were significantly higher than either in broad-leaved or in shrubs (Figure 5B). The points in the soil conservation-water conservation scatter plot mostly fell on the 1:1 line, indicating a slight trade-off between soil conservation and water conservation (0.13). Moreover, the points in the soil conservation-water conservation scatter plot of shrubs were relatively far away from the 1:1 line, showing high trade-offs between soil conservation and water conservation in shrubs. In addition, the trade-offs between NPP and water conservation were low (0.15). The points in the NPP-soil conservation, and habitat quality-water conservation scatter plot were somewhat away from line 1:1, suggesting appropriate trade-offs (0.28 and 0.29, respectively). The trade-offs between habitat quality and soil conservation (0.37) were significantly higher than the trade-offs between any other two ecosystem services. RMSE between habitat quality and soil conservation in coniferous and broad-leaved exceeded 0.4.
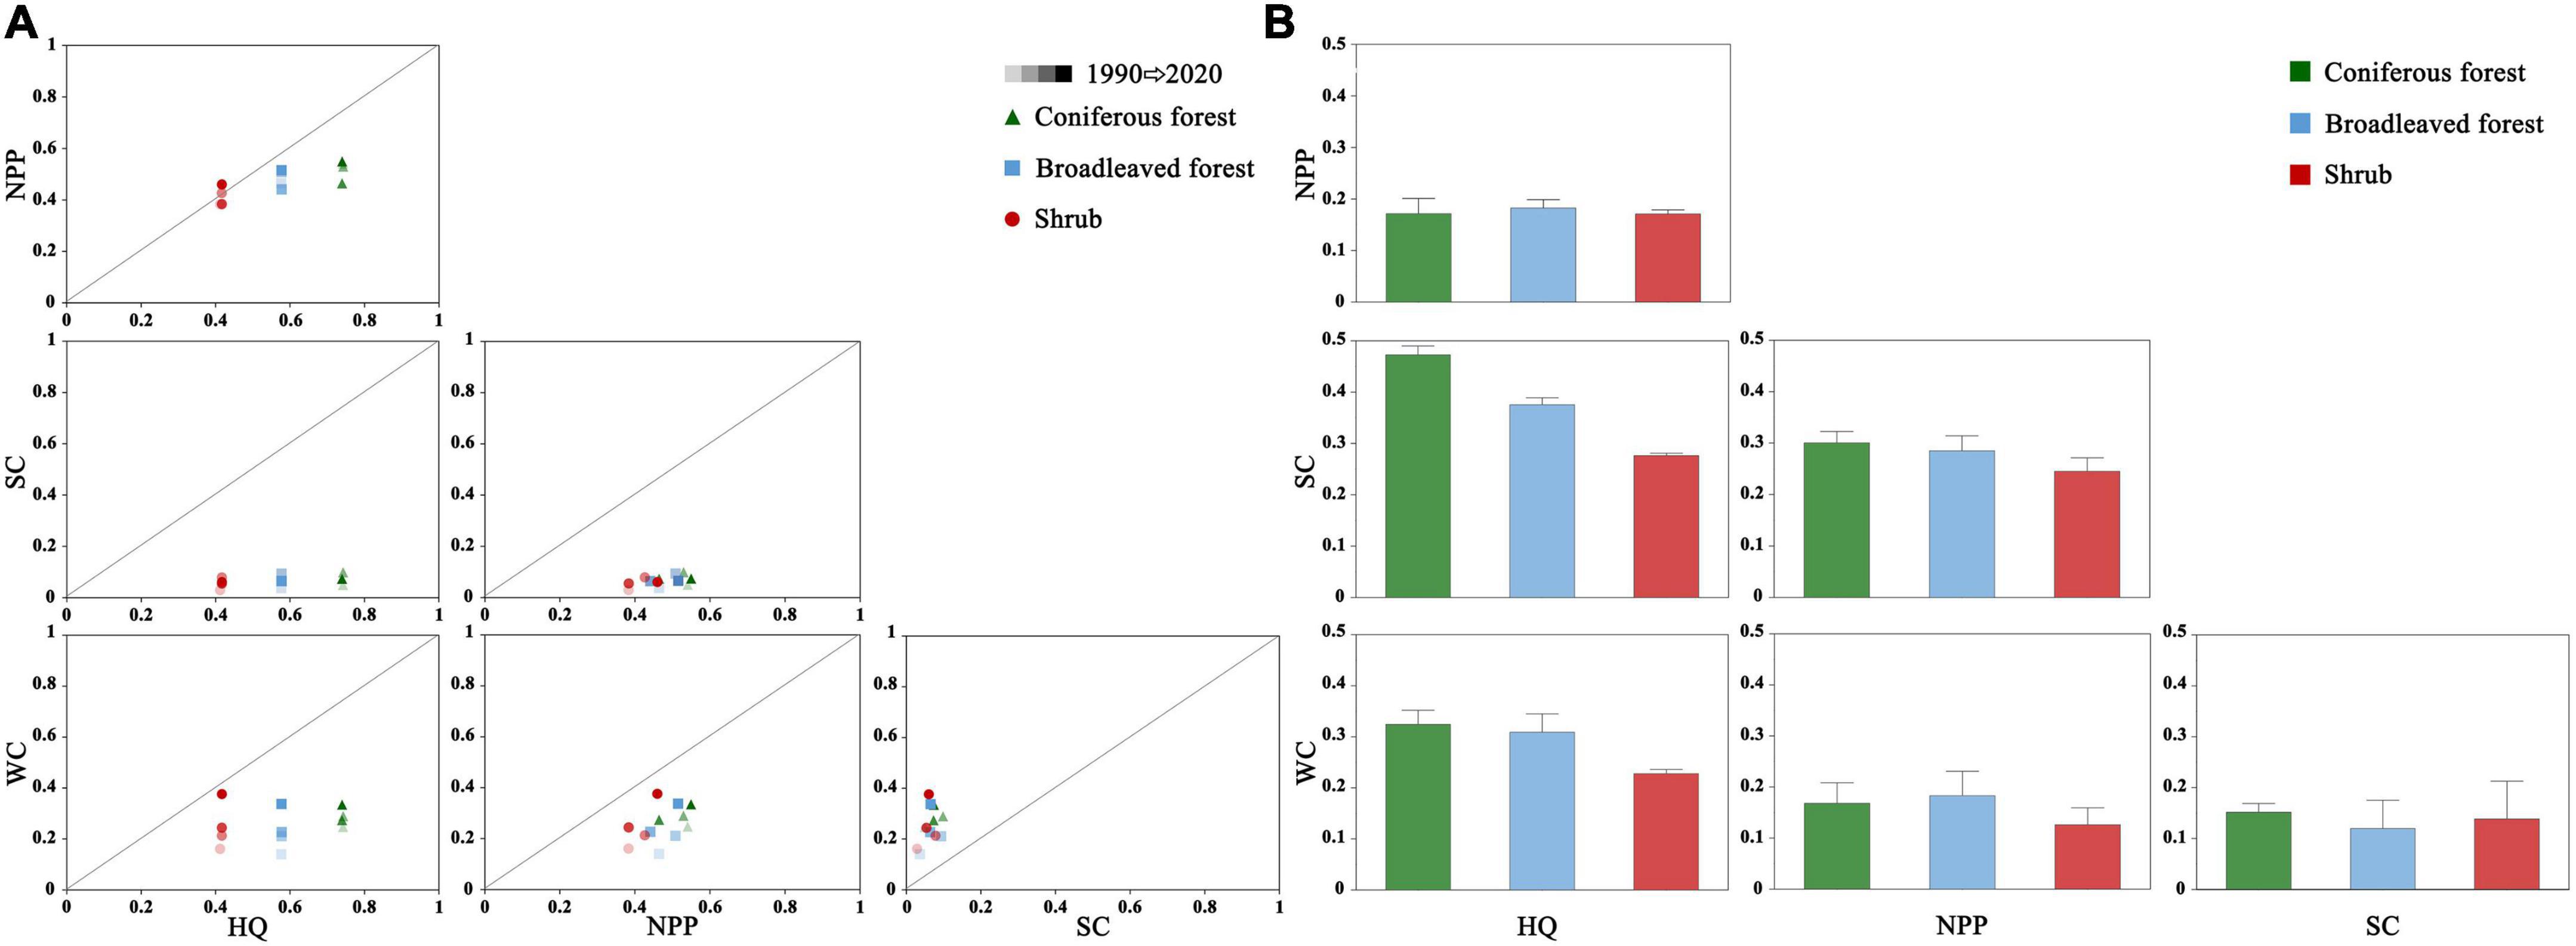
Figure 5. (A) Scatter plots and (B) trade-off values of pairwise forest ecosystem services under different forest types. HQ, SC, and WC represent habitat quality, soil conservation, and water conservation.
Influence of drivers on forest ecosystem service trade-offs
Overall, the effects of the drivers differed significantly among the three forest types (Figure 6). In coniferous, the explanatory power of temperature and land use on habitat quality and soil conservation trade-offs were significantly higher than other factors (52 and 55%, respectively). In broad-leaved, land use influenced habitat quality-soil conservation trade-offs most (54%). In shrubs, land use and NDVI influenced habitat quality-soil conservation tradeoffs more than the other factors (44 and 34%, respectively). The explanatory power of land use on habitat quality-soil conservation trade-offs (45%), habitat quality-water conservation trade-offs (32%), NPP-soil conservation trade-offs (29%), and NPP water conservation trade-offs (31%) were higher than the other factors. Precipitation could explain 15, 30, and 26% of habitat quality-soil conservation, NPP-soil conservation, and soil conservation-water conservation trade-offs, respectively. It was noteworthy that habitat quality-NPP trade-offs were less influenced by the drivers. It might be related to the low trade-offs between them.
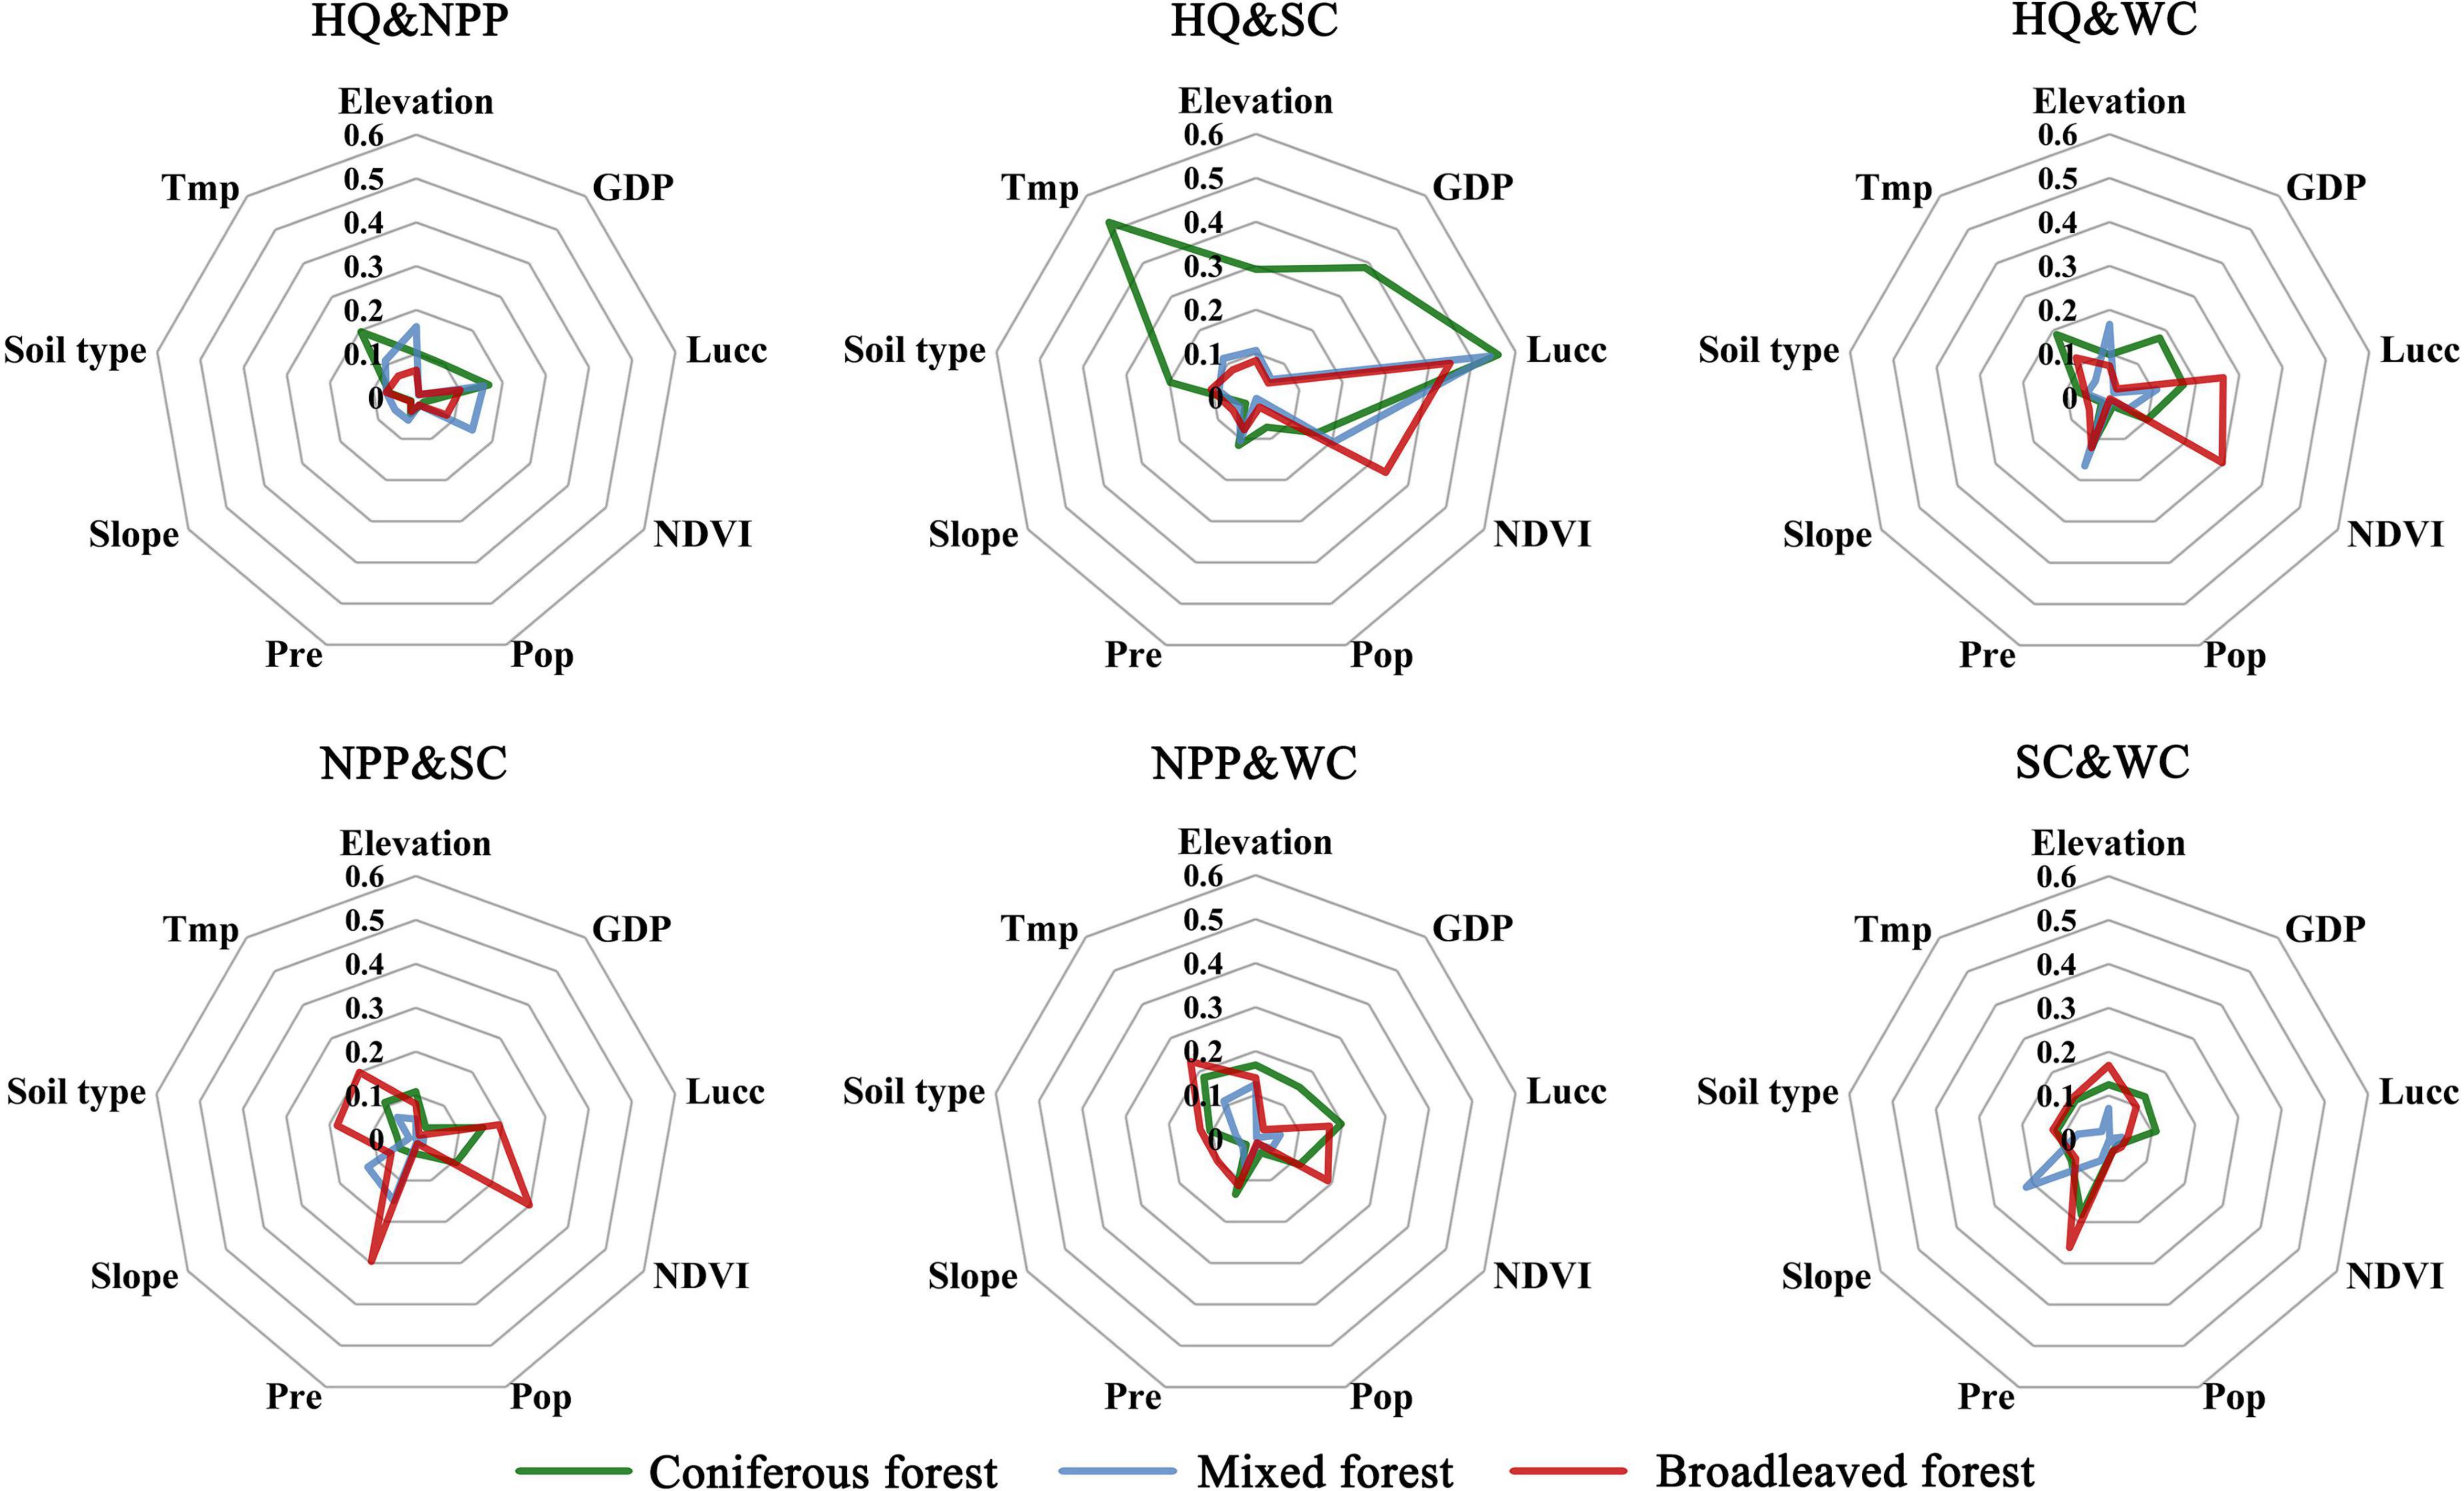
Figure 6. Influence of drivers on forest ecosystem service trade-offs. GDP, Gross Domestic Product; Lucc, land use type; Pop, population density; Pre, precipitation, and Tmp, temperature.
The average explanatory power of anthropogenic activities factors on ecosystem service trade-offs was 10%. This indicated a low influence of anthropogenic activities on forest ecosystem services. For environmental factors, the explanatory power of NDVI on trade-offs differed significantly among coniferous (9%), broad-leaved (8%), and shrubs (20%). The explanatory power of temperature on habitat quality-soil conservation trade-offs (52%) was considerably higher than on any other two ecosystem services. Moreover, soil type was of little importance to trade-offs. The result indicated that the influence of environmental factors on forest ecosystem service tradeoffs was regular and high variation from 1990 to 2020.
Discussion
Generally, ecosystem services in the Greater Khingan Mountains increased after NFCP implementation. This result was in line with the published research, which also indicated a crucial increase in forest ecosystems after the implementation of the NFCP (Wang et al., 2017; Mao et al., 2019). But soil conservation and water conservation decreased and then increased from 1990 to 2020. These two ecosystem services were more affected by rainfall factors (Wang and Dai, 2020). The rainfall instability exacerbated the change magnitude in these two ecosystem services before and after the NFCP implementation. The ecosystem services of the three forest types showed different degrees of increase after the NFCP implementation in this study. It increased more in broad-leaved than in the other two forest types, which may be related to spatial distribution and area of broad-leaved. The spatial distribution, interrelationships and, drivers of ecosystem services were impacted by spatial scale nature (He et al., 2019; Sun et al., 2020). It was notable that the trade-offs during the second phase of the NFCP increased more than during the first phase. The forest ecosystem gradually entered a period of rapid growth after the first decade of recovery, which was in line with the trend of secondary ecosystem evolution. In addition, the Chinese government paid more attention to forest protection in recent years. It launched several ecological restoration programs, for instance, the grain to green project, the three north shelter forest system project, and the national nature reserves (Mao et al., 2019). Moreover, great promotions of ecological civilization and increased public awareness of environmental protection were also important in promoting the continuous improvement of forest ecosystems during the second phase (Zhao et al., 2017; Dong et al., 2021; Yang et al., 2021).
The forest ecosystem service trade-offs in coniferous and broad-leaved was higher than in shrubs. Published research has explored the ecosystem service’s interrelationships in terms of spatiotemporal variations (Qiao X. et al., 2019; Qiu et al., 2021). Nevertheless, few research investigated their discrepancies among different forest types. The results of this study indicated that the trade-offs in coniferous were higher than both in broad-leaved and shrubs. It may be due to their large distribution area and relatively low intensity of anthropogenic activities in coniferous. Coniferous was the highest total of ecosystem services than broad-leaved and shrubs. The high trade-offs in coniferous were detrimental to the sustainability of ecosystem benefits (Bradford and D’Amato, 2012).
Ecosystem service trade-offs in various regions changed spatiotemporally after the ecological project implemented (Li et al., 2018; Qiao X. et al., 2019). The trade-offs between different ecosystem services were different in the Greater Khingan Mountains during 1990–2020. The trade-off relationships involving NPP increased, while the trade-offs related to water conservation decreased from 1990 to 2020. It has shown that understanding trade-off mechanisms requires an integrated consideration of multiple ecosystem services in one ecosystem (Bradford and D’Amato, 2012; Lu et al., 2014). The change rates of ecosystem services were not the same between 1990–2000 and 2000–2020 (Figure 3). Similar findings were reported for the spatiotemporal variances in other ecosystem services after ecological projects (Wang et al., 2021). Uneven changes in forest ecosystem services at different project phases might be the main reason for spatiotemporal variations of trade-offs.
The ecosystem service trade-offs were closely related to climatic factors (Runting et al., 2017; Qiu et al., 2021). Topographical and soil type factors also affected trade-offs to some extent (Feng et al., 2017). This study showed that the influence of environmental factors on trade-offs were more than anthropogenic activities in the Greater Khingan Mountains. This might be related to the different sensitivity of ecosystem service trade-offs to drivers in the Greater Khingan Mountains. The result was in line with published research (Wang et al., 2021; Chen et al., 2022). Generally, changes in forest ecosystems after the project were mainly influenced by environmental factors, rather than anthropogenic activities. However, certain anthropogenic activity factors had a crucial influence on trade-offs. For instance, land use was the most important factor on the trade-offs from 1990 to 2020. It was owing to the prominent effects of land use on four ecological services. The rapid spread of urbanization was an important reason for forest ecosystem destruction, and the transformation of land use types was closely connected with the rapid urbanization (Yang et al., 2020; Han et al., 2021). In addition, population density and GDP density were also significant driving factors in the trade-offs, which was consistent with previously published studies (Yang et al., 2017; Zhang et al., 2020).
Several limits ought to be recognized in this study. Firstly, although NPP, soil conservation, water conservation, and habitat quality were considered as the forest ecosystem services in the Greater Khingan Mountains, wood production was not involved. Because of corresponding data missing and inconsistent statistical calibration standards across provinces. There are some challenges to the rasterization of statistical data because the study area was not a complete administrative region. Secondly, due to the constraints of data collection, it is not possible to simulate ecosystem services with high accuracy due to the constraints of data collection. Finally, the RMSE approach could not accommodate the issue of non-linear interactions and thresholds between forest ecosystem services (Qiao J. M. et al., 2019; Wang et al., 2021). Thus, inflection points and thresholds of ecosystem trade-offs should be investigated for the guidance of ecosystem management in the future.
Conclusion
The study evaluated the spatiotemporal changes of forest ecosystem service trade-offs and their drivers in the Greater Khingan Mountains after NFCP implementation. All of the ecosystem services in the three forest types increased after the project. The trade-offs between habitat quality and NPP, NPP and soil conservation increased, while the trade-offs between habitat quality and water conservation, NPP and water conservation, and soil conservation and water conservation decreased after the project. The ecosystem service trade-offs in coniferous was higher than in broad-leaved and shrubs. The explanatory power of the drivers (except for soil type) was significant different among the three forest types. The most important drivers for the trade-offs in coniferous and broad-leaved regions were land use, while the most important drivers were NDVI and precipitation in shrubs. Environmental factors affected the ecosystem service trade-offs more than anthropogenic activities in the Greater Khingan Mountains. Among all anthropogenic activity factors, land use was the most important one. Overall, exploring the ecosystem service trade-off changes after NFCP provides valuable insights for future policy development and subsequent ecological project implementation.
Data availability statement
The original contributions presented in this study are included in the article/Supplementary material, further inquiries can be directed to the corresponding author.
Author contributions
WC conceived the article. GJ and YD wrote the first draft. WC and SZ edited subsequent drafts. All authors contributed to the manuscript and approved the submitted version.
Funding
This study was funded by the Major Science and Technology Projects in Jilin Province (Grant No. 20200503001SF) and the National Natural Science Foundation of China (Grant No. 32130068).
Conflict of interest
The authors declare that the research was conducted in the absence of any commercial or financial relationships that could be construed as a potential conflict of interest.
Publisher’s note
All claims expressed in this article are solely those of the authors and do not necessarily represent those of their affiliated organizations, or those of the publisher, the editors and the reviewers. Any product that may be evaluated in this article, or claim that may be made by its manufacturer, is not guaranteed or endorsed by the publisher.
Supplementary material
The Supplementary Material for this article can be found online at: https://www.frontiersin.org/articles/10.3389/fevo.2022.978145/full#supplementary-material
References
Ausseil, A. E., Dymond, J. R., Kirschbaum, M., Andrew, R. M., and Parfitt, R. L. (2013). Assessment of multiple ecosystem services in New Zealand at the catchment scale. Environ. Model. Softw. 43, 37–48. doi: 10.1016/j.envsoft.2013.01.006
Aznar-Sánchez, J. A., Belmonte-Ureña, L. J., López-Serrano, M. J., and Velasco-Muñoz, J. F. (2018). Forest ecosystem services: An analysis of worldwide research. Forests 9:453. doi: 10.3390/f9080453
Benayas, J., Newton, A. C., Diaz, A., and Bullock, J. M. (2009). Enhancement of biodiversity and ecosystem services by ecological restoration: A meta-analysis. Science 325, 1121–1124. doi: 10.1126/science.1172460
Bennett, E. M., Peterson, G. D., and Gordon, L. J. (2009). Understanding relationships among multiple ecosystem services. Ecol. Lett. 12, 1394–1404. doi: 10.1111/j.1461-0248.2009.01387.x
Bradford, J. B., and D’Amato, A. W. (2012). Recognizing trade-offs in multi-objective land management. Front. Ecol. Environ. 10, 210–216. doi: 10.1890/110031
Cai, C. F., Ding, S. W., Shi, Z. H., Huang, L., and Zhang, G. Y. (2000). Study of applying USLE and geographical information system IDRISI to predict soil erosion in small watershed. J. Soil Water Conserv. 14, 19–24.
Chen, T., Feng, Z., Zhao, H., and Wu, K. (2020). Identification of ecosystem service bundles and driving factors in Beijing and its surrounding areas. Sci. Total Environ. 711:134687. doi: 10.1016/j.scitotenv.2019.134687
Chen, T., Peng, L., and Wang, Q. (2022). Response and multiscenario simulation of trade-offs/synergies among ecosystem services to the Grain to Green Program: A case study of the Chengdu-Chongqing urban agglomeration, China. Environ. Sci. Pollut. Res. Int. 29, 33572–33586. doi: 10.1007/s11356-021-18336-y
Chu, X. L., Li, L., Zeng, L. X., Huang, Z. L., Liu, C. F., and Xiao, W. F. (2019). Dynamics of forest ecosystem services before and after dam construction in the three gorges reservoir area. Resour. Environ. Yangtze Basin 28:8.
Dong, Y. L., Ren, Z. B., Fu, Y., Yang, R., Sun, H. C., and He, X. Y. (2021). Land use/cover change and its policy implications in typical agriculture-forest ecotone of Central Jilin Province, China. Chin. Geogr. Sci. 31, 261–275. doi: 10.1007/s11769-021-1189-5
Dong, Y. L., Ren, Z. B., Wang, Z. M., Yu, Q. Y., Zhu, L., Yu, H., et al. (2020). Spatiotemporal patterns of forest changes in Korean Peninsula using landsat images during 1990–2015: A comparative study of two neighboring countries. IEEE Access 8, 73623–73633. doi: 10.1109/access.2020.2988122
Donohue, R. J., Roderick, M. L., and McVicar, T. R. (2012). Roots, storms and soil pores: Incorporating key ecohydrological processes into Budyko’s hydrological model. J. Hydrol. 436–437, 35–50. doi: 10.1016/j.jhydrol.2012.02.033
Editorial Committee for Vegetation Atlas of China (2001). Vegetation atlas of China. Beijing: China Science Press.
FAO (2020). Global forest resources assessment 2020: Main report. Rome: Food & Agriculture Org, 164.
Feng, Q., Zhao, W., Fu, B., Ding, J., and Wang, S. (2017). Ecosystem service trade-offs and their influencing factors: A case study in the Loess Plateau of China. Sci. Total Environ. 607–608, 1250–1263. doi: 10.1016/j.scitotenv.2017.07.079
Feng, S., Sun, R., and Chen, L. (2018). Spatio-temporal variability of habitat quality based on land use pattern change in Beijing. Acta. Ecol. 38, 4167–4179.
Foley, J. A., DeFries, R., Asner, G. P., Barford, C., Bonan, G., Carpenter, S. R., et al. (2005). Global consequences of land use. Science 309, 570–574. doi: 10.1126/science.1111772
Gonzalez-Ollauri, A., and Mickovski, S. B. (2017). Providing ecosystem services in a challenging environment by dealing with bundles, trade-offs, and synergies. Ecosyst. Serv. 28, 261–263. doi: 10.1016/j.ecoser.2017.10.004
Han, H. Q., Liu, Y., Gao, H. J., Zhang, Y. J., Wang, Z., and Chen, X. Q. (2020). Tradeoffs and synergies between ecosystem services: A comparison of the karst and non-karst area. J. Mt. Sci. 17, 1221–1234. doi: 10.1007/s11629-019-5667-5
Han, J., Liu, Y., and Zhang, Y. (2015). Sand stabilization effect of feldspathic sandstone during the fallow period in Mu Us Sandy Land. J. Geogr. Sci. 25, 428–436. doi: 10.1007/s11442-015-1178-7
Han, J. H., Dong, Y. L., Ren, Z. B., Du, Y. X., Wang, C. C., Jia, G. L., et al. (2021). Remarkable effects of urbanization on forest landscape multifunctionality in urban peripheries: Evidence from Liaoyuan City in Northeast China. Forests 12:1779. doi: 10.3390/f12121779
He, B. J., Zhao, Z. Q., Shen, L. D., Wang, H. B., and Li, L. G. (2019). An approach to examining performances of cool/hot sources in mitigating/enhancing land surface temperature under different temperature backgrounds based on landsat 8 image. Sustain. Cities Soc. 44, 416–427. doi: 10.1016/j.scs.2018.10.049
Li, B. Y., Chen, N. C., Wang, Y. C., and Wang, W. (2018). Spatio-temporal quantification of the trade-offs and synergies among ecosystem services based on grid-cells: A case study of Guanzhong Basin, NW China. Ecol. Indic. 94, 246–253. doi: 10.1016/j.ecolind.2018.06.069
Liu, L. B., Wang, Z., Wang, Y., Zhang, Y. T., Shen, J. S., Qin, D. H., et al. (2019). Trade-off analyses of multiple mountain ecosystem services along elevation, vegetation cover and precipitation gradients: A case study in the Taihang Mountains. Ecol. Indic. 103, 94–104. doi: 10.1016/j.ecolind.2019.03.034
Lu, N., Fu, B. J., Jin, T. T., and Chang, R. Y. (2014). Trade-off analyses of multiple ecosystem services by plantations along a precipitation gradient across Loess Plateau landscapes. Landsc. Ecol. 29, 1697–1708. doi: 10.1007/s10980-014-0101-4
Lyu, R. F., Clarke, K. C., Zhang, J. M., Feng, J. L., Jia, X. H., and Li, J. J. (2019). Spatial correlations among ecosystem services and their socio-ecological driving factors: A case study in the city belt along the Yellow River in Ningxia, China. Appl. Geogr. 108, 64–73. doi: 10.1016/j.apgeog.2019.05.003
Mao, D. H., He, X. Y., Wang, Z. M., Tian, Y. L., Xiang, H. X., Yu, H., et al. (2019). Diverse policies leading to contrasting impacts on land cover and ecosystem services in Northeast China. J. Clean. Prod. 240:117961. doi: 10.1016/j.jclepro.2019.117961
Mao, D. H., Wang, Z. M., Wu, C. S., Song, K. S., and Ren, C. Y. (2014). Examining forest net primary productivity dynamics and driving forces in northeastern China during 1982–2010. Chin. Geogr. Sci. 24, 631–646. doi: 10.1007/s11769-014-0662-9
Mbow, C., Noordwijk, M. V., Luedeling, E., Neufeldt, H., Minang, P. A., and Kowero, G. (2014). Agroforestry solutions to address food security and climate change challenges in Africa. Curr. Opin. Environ. Sustain. 6, 61–67. doi: 10.1016/j.cosust.2013.10.014
Nkem, J., Santoso, H., Murdiyarso, D., Brockhaus, M., and Kanninen, M. (2007). Using tropical forest ecosystem goods and services for planning climate change adaptation with implications for food security and poverty reduction. J. Semi. Arid Trop. Agric. Res. 4, 1–23.
Peng, J., Hu, X. X., Wang, X. Y., Meersmans, J., Liu, Y. X., and Qiu, S. J. (2019). Simulating the impact of Grain-for-Green Programme on ecosystem services trade-offs in Northwestern Yunnan, China. Ecosyst. Serv. 39:100998. doi: 10.1016/j.ecoser.2019.100998
Potter, C. S., Randerson, J. T., Field, C. B., Matson, P. A., Vitousek, P. M., Mooney, H. A., et al. (1993). Terrestrial ecosystem production: A process model based on global satellite and surface data. Glob. Biogeochem. Cycle 7, 811–841. doi: 10.1029/93gb02725
Power, A. G. (2010). Ecosystem services and agriculture: Tradeoffs and synergies. Philos. Trans. R. Soc. Lond. B Biol. Sci. 365, 2959–2971. doi: 10.1098/rstb.2010.0143
Qiao, J. M., Yu, D. Y., Cao, Q., and Hao, R. F. (2019). Identifying the relationships and drivers of agro-ecosystem services using a constraint line approach in the agro-pastoral transitional zone of China. Ecol. Indic. 106:105439. doi: 10.1016/j.ecolind.2019.105439
Qiao, X., Gu, Y., Zou, C., Xu, D., Wang, L., Ye, X., et al. (2019). Temporal variation and spatial scale dependency of the trade-offs and synergies among multiple ecosystem services in the Taihu Lake Basin of China. Sci. Total Environ. 651, 218–229. doi: 10.1016/j.scitotenv.2018.09.135
Qiu, M. L., Voorde, T. V., Li, T., Yuan, C. C., and Yin, G. Y. (2021). Spatiotemporal variation of agroecosystem service trade-offs and its driving factors across different climate zones. Ecol. Indic. 130:108154. doi: 10.1016/j.ecolind.2021.108154
Runting, R. K., Bryan, B. A., Dee, L. E., Maseyk, F. J., Mandle, L., Hamel, P., et al. (2017). Incorporating climate change into ecosystem service assessments and decisions: A review. Glob. Change Biol. 23, 28–41. doi: 10.1111/gcb.13457
Sun, X. Y., Shan, R. F., and Liu, F. (2020). Spatio-temporal quantification of patterns, trade-offs and synergies among multiple hydrological ecosystem services in different topographic basins. J. Clean. Prod. 268:122338. doi: 10.1016/j.jclepro.2020.122338
Tallis, H., Kareiva, P., Marvier, M., and Chang, A. (2008). An ecosystem services framework to support both practical conservation and economic development. Proc. Natl. Acad. Sci. U.S.A. 105, 9457–9464.
Wang, J., Peng, J., Zhao, M., Liu, Y., and Chen, Y. (2017). Significant trade-off for the impact of Grain-for-Green Programme on ecosystem services in North-western Yunnan, China. Sci. Total Environ. 574, 57–64. doi: 10.1016/j.scitotenv.2016.09.026
Wang, J. F., Li, X. H., Christakos, G., Liao, Y. L., Zhang, T., Gu, X., et al. (2010). Geographical detectors-based health risk assessment and its application in the neural tube defects study of the Heshun Region, China. Int. J. Geogr. Inf. Sci. 24, 107–127. doi: 10.1080/13658810802443457
Wang, Y. H., and Dai, E. (2020). Spatial-temporal changes in ecosystem services and the trade-off relationship in mountain regions: A case study of Hengduan Mountain region in Southwest China. J. Clean. Prod. 264:121573. doi: 10.1016/j.jclepro.2020.121573
Wang, Y. H., Dai, E. F., Ge, Q. S., Zhang, X. Z., and Yu, C. Q. (2021). Spatial heterogeneity of ecosystem services and their trade-offs in the Hengduan Mountain region, Southwest China. Catena 207:105632. doi: 10.1016/j.catena.2021.105632
Williams, J. R., Renard, K. G., and Dyke, P. T. (1983). EPIC: A new method for assessing erosion’s effect on soil productivity. J. Soil Water Conserv. 38, 381–383.
Xu, J. Y., Chen, J. X., and Liu, Y. X. (2020). Partitioned responses of ecosystem services and their tradeoffs to human activities in the Belt and Road region. J. Clean. Prod. 276:123205. doi: 10.1016/j.jclepro.2020.123205
Yang, J., Ren, J. Y., Sun, D. Q., Xiao, X. M., Xia, J. H., Jin, C., et al. (2021). Understanding land surface temperature impact factors based on local climate zones. Sustain. Cities Soc. 69:102818. doi: 10.1016/j.scs.2021.102818
Yang, J., Sun, J., Ge, Q. S., and Li, X. (2017). Assessing the impacts of urbanization-associated green space on urban land surface temperature: A case study of Dalian, China. Urban For. Urban Green. 22, 1–10. doi: 10.1016/j.ufug.2017.01.002
Yang, J., Wang, Y. C., Xiu, C. L., Xiao, X. M., Xia, J. H., and Jin, C. (2020). Optimizing local climate zones to mitigate urban heat island effect in human settlements. J. Cleaner Prod. 275:123767. doi: 10.1016/j.jclepro.2020.123767
You, S. C., and Li, W. Q. (1999). Estimation of soil erosion supported by GIS a case study in Guanji township, Taihe, Jiangxi. J. Nat. Resour. 14, 62–68.
Zhang, L., Dawes, W. R., and Walker, G. R. (2001). Response of mean annual evapotranspiration to vegetation changes at catchment scale. Water Resour. Res. 37, 701–708. doi: 10.1029/2000WR900325
Zhang, T., Lyu, X., Zou, Y., Liu, J., Jiang, M., and Xu, C. (2022). Value assessment of wetland ecosystem services in the Da Hinggan Mountains, China. Chin. Geogr. Sci. 32, 302–311. doi: 10.1007/s11769-022-1268-2
Zhang, Z. Y., Liu, Y. F., Wang, Y. H., Liu, Y. L., Zhang, Y., and Zhang, Y. (2020). What factors affect the synergy and tradeoff between ecosystem services, and how, from a geospatial perspective? J. Clean. Prod. 257:120454. doi: 10.1016/j.jclepro.2020.120454
Zhao, Z., Sharifi, A., Dong, X., Shen, L., and He, B. J. (2021). Spatial variability and temporal heterogeneity of surface urban heat island patterns and the suitability of local climate zones for land surface temperature characterization. Remote Sens. 13:4338. doi: 10.3390/rs13214338
Keywords: natural forest conservation project, forest ecosystem service, trade-off, spatiotemporal changes, driving factors
Citation: Jia G, Dong Y, Zhang S, He X, Zheng H, Guo Y, Shen G and Chen W (2022) Spatiotemporal changes of ecosystem service trade-offs under the influence of forest conservation project in Northeast China. Front. Ecol. Evol. 10:978145. doi: 10.3389/fevo.2022.978145
Received: 25 June 2022; Accepted: 23 August 2022;
Published: 20 September 2022.
Edited by:
Jun Yang, Northeastern University, ChinaReviewed by:
Likai Zhu, East China Normal University, ChinaDecheng Zhou, Nanjing University of Information Science and Technology, China
Copyright © 2022 Jia, Dong, Zhang, He, Zheng, Guo, Shen and Chen. This is an open-access article distributed under the terms of the Creative Commons Attribution License (CC BY). The use, distribution or reproduction in other forums is permitted, provided the original author(s) and the copyright owner(s) are credited and that the original publication in this journal is cited, in accordance with accepted academic practice. No use, distribution or reproduction is permitted which does not comply with these terms.
*Correspondence: Wei Chen, Y2hlbndlaUBpYWUuYWMuY24=