 Ryohei Sawaura
 Yuri Kimura
 Mugino O. Kubo
95% of researchers rate our articles as excellent or good
Learn more about the work of our research integrity team to safeguard the quality of each article we publish.
Find out more
ORIGINAL RESEARCH article
Front. Ecol. Evol. , 20 October 2022
Sec. Paleoecology
Volume 10 - 2022 | https://doi.org/10.3389/fevo.2022.975283
This article is part of the Research Topic Reconstructing Paleodiets: Challenges and Advances View all 15 articles
Dental microwear analysis is an oft-used paleodietary estimation method, and the impression molds or resin casts are often analyzed rather than the original tooth surfaces. A choice of silicone products for dental impressions is crucial because the quality of microwear data is affected by the impression accuracy of the molds. For this reason, microwear researchers have heavily depended on a few commercial products such as “President” (Coltène/Whaledent AG, Switzerland) to avoid analytical errors caused using different silicone materials. Considering that the production business might be terminated, however, heavy reliance on specific products could be a potential weakness in the field. In this study, we aimed at identifying specific indexes of physical properties of silicone materials with satisfactory accuracy. For this purpose, we measured dynamic viscoelasticity and shrinkage rates of various silicone compounds, including the standard impression material President and other eight affordable dental silicones. We scanned both original tooth surface and dental impression molds with a confocal laser microscope and conducted dental microwear texture analysis (DMTA) to quantitatively compare the scanned surfaces. The results showed relationships between the material properties of silicones and impression accuracy, indicating that the materials that cured slowly and began to shrink relatively early in the hardening process were less accurate. Some of these dental impression molds showed blurred surfaces, implying that molds were peeled off from the tooth surface at the microscopic level, as the shrinkage speed might exceed the curing speed. The following indices provided in the product information were found to be helpful in the search for substitutes: (1) medium viscosity, (2) short curing time after mixing (5–6 min), and (3) delayed change in shrinkage.
Microscopic use-wear marks on tooth surfaces (microwear) are important as a morphological indicator for estimating the diets of extinct and extant animals and have long been investigated using scanning electron microscopes or light microscopes (reviewed in Ungar, 2015). In the early stages of dental microwear research, optical microscopy and SEM were the main methods of observation. Even when the same area was analyzed, the observation settings and inter- or intra-observer errors were often problematic (Grine et al., 2002; Galbany et al., 2005; Purnell et al., 2006). So, dental microwear was difficult to evaluate quantitatively. However, the recent progress in the evaluation of microwear by optical profilometers has generated a new field of microwear research (Ungar et al., 2003; Scott et al., 2005; Schulz et al., 2010). Currently, an increasing number of studies reported characteristics of microscopic 3D topography, that is dental microwear texture (DMT), of various types of vertebrates (Krueger et al., 2008, 2017; Caporale and Ungar, 2016; DeSantis and Patterson, 2017; Aiba et al., 2019; Kubo and Fujita, 2021).
In the studies of 3D dental microwear texture analysis (DMTA) on anthropological and paleontological materials, impression molds and resin casts are analyzed rather than the original tooth surfaces. Two major reasons are considered. First, large specimens, such as teeth in the jawbone, cannot be placed properly on a microscope stage. Second, cultural and paleontological resources may be protected under laws and regulations, and thus casts and molds are the best alternatives for further analyses in laboratories. Therefore, the accuracy of dental silicones is crucial in DMTA. In previous studies, microwear researchers have utilized a few commercial products of silicone compounds such as President (Coltène/Whaledent AG, Switzerland) to avoid analytical errors caused by using different materials. However, such an effort of analytical quality control (i.e., relying on certain products) is a fundamental weakness in the field, considering that the production business might be terminated for miscellaneous reasons as in the case of President.
A few studies have tested the President silicone in the method of DMTA. Goodall et al. (2015) tested some substitutes for President and reported that silicone compounds with medium viscosity were more accurate than low viscosity (Speedex, MM913, and Accutrans) and high viscosity (Microset 101 RF and MM240TV). They detected a few differences of statistical significance between the original specimen and casts made with President. On the other hand, Mihlbachler et al. (2019) used President to examine differences between the original specimen and casts in higher magnification scans (150×) and reported many significant differences. Their contradictory conclusions indicate that different choices of molding and casting materials, the surface textures analyzed, and scanning magnifications may have affected the results.
In this study, we aim at identifying the physical properties of silicones to find appropriate silicones, which mold the tooth surface with satisfactory accuracy, by examining the reproducibility of DMT among various silicone compounds, including President and other affordable dental silicones. In addition to comparing the general properties of the tested silicones provided by product companies, we measured changes in viscosity and shrinkage over time, which are important properties in the process of making impression molds.
We used an isolated right mandibular second molar of a Pleistocene Japanese macaque (Macaca fuscata) (lower right of Figure 1). The analyzed specimen (NMNS PV 6166-7) was originally reported by Hasegawa et al. (1968) and is now stored in the Department of Geology and Paleontology at the National Museum of Nature and Science, Japan. Following the standard of primate dental microwear studies (Kay and Hiiemae, 1974), facet 9 of Phase II was observed for the analysis. Three arbitrary sites on facet 9 (f9-1, f9-2, and f9-3) were selected based on the accessibility to the focal points, which had characteristic landmarks (e.g., pits, scratches, and cracks) (Figure 1).
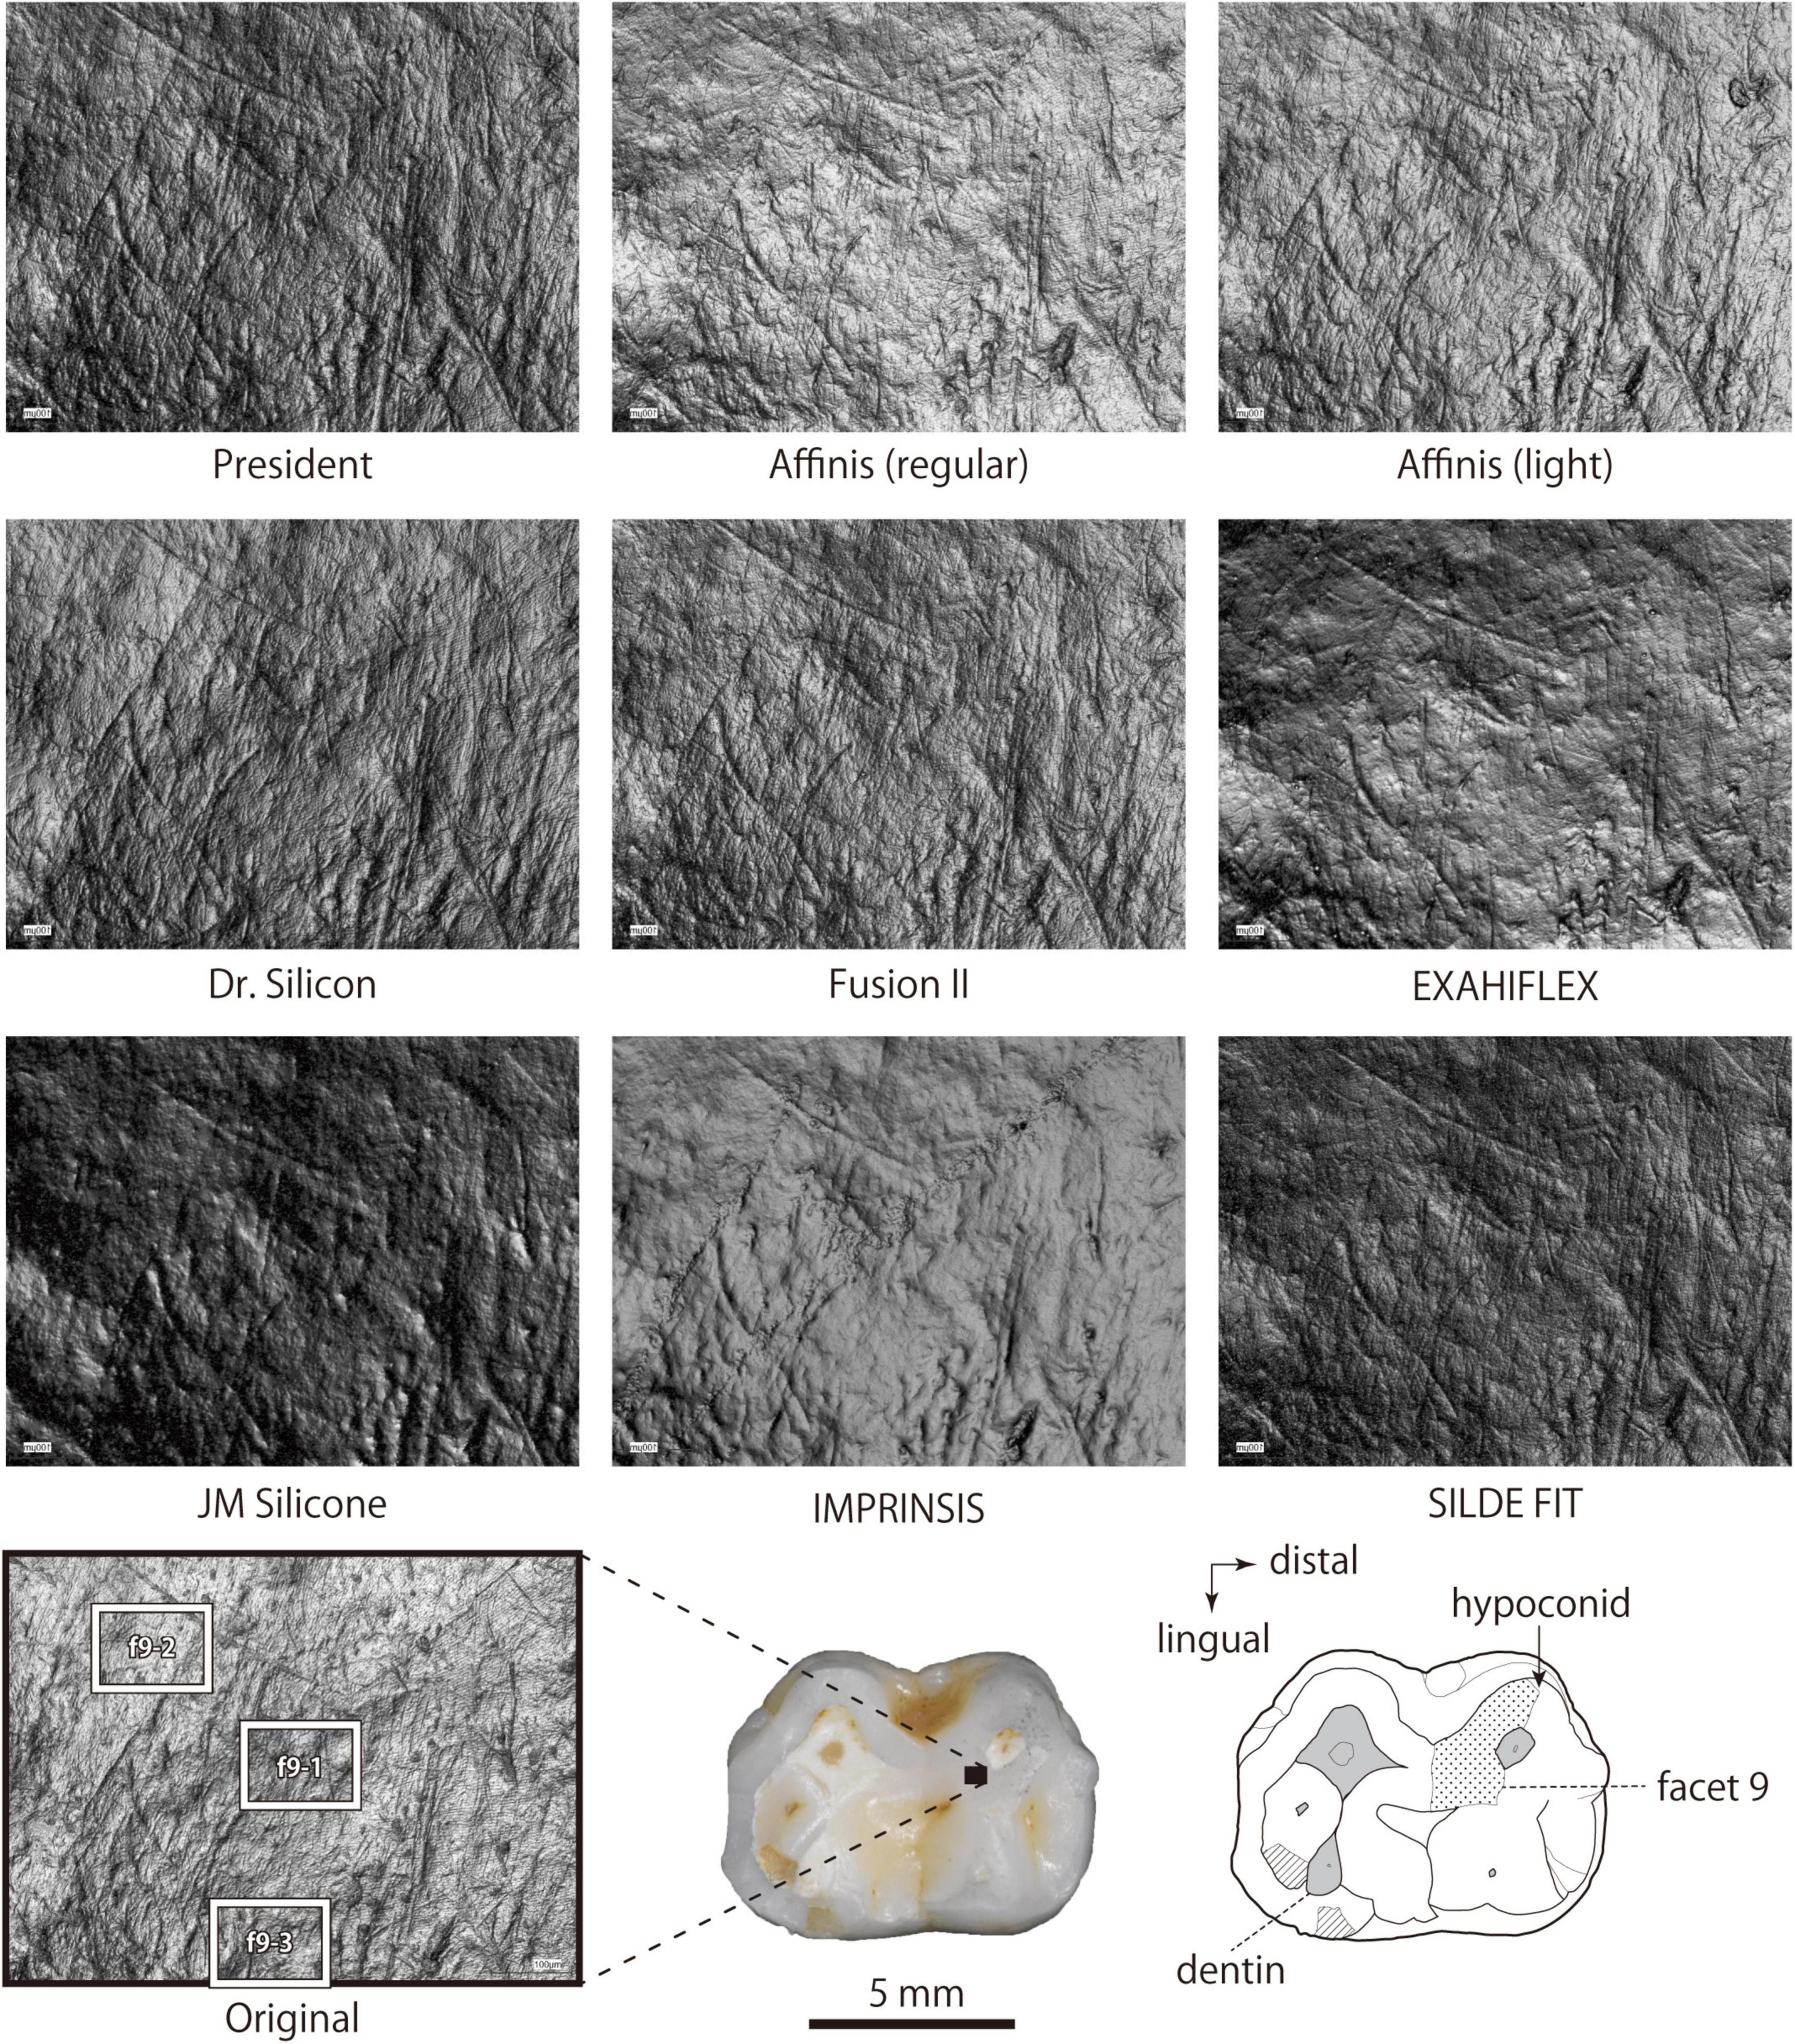
Figure 1. Comparison of dental impressions among nine impression materials. 2D images were obtained by a confocal laser microscope equipped with a 20× objective lens. The size of each image is 540 μm × 725 μm. An occlusal view of the right lower second molar of the Japanese macaque used in this study is shown in the right lower photo and schema. The black rectangle on the tooth photo indicates the area where we obtained silicone impression molds. The white rectangles in the 20× tooth surface image obtained from the original tooth indicate the locations (f9-1, 2, and 3) where higher magnification images and 3D texture data were acquired. Wear state and location of facet 9 are shown in the schema.
We used the following nine dental silicone compounds including the standard silicone impression material (President Regular Body) in microwear research (Table 1): President Regular Body, Affinis regular body, Affinis light body (Coltène/Whaledent AG, Switzerland), Dr. Silicon regular (BSA Sakurai, Japan), Fusion II wash, EXAHIFLEX regular (GC, Japan), JM Silicone (Nissin Dental Products INC., Japan), IMPRINSIS regular (Tokuyama Dental Corporation, Japan), and SILDE FIT regular (Shofu INC., Japan). Dr. Silicon is a local product mainly in East Asia, whereas others are commercially available worldwide. However, President Regular Body was no longer available in Japan and was replaced by the subsequent product line called Affinis. Therefore, we imported it from the United Kingdom in 2017. Around that time, the “President” series became a new product line, “PRESIDENT The Original.” Since this material was not available (and still is not in Japan) at the time we initiated this study, we did not include it but used the older “President.”
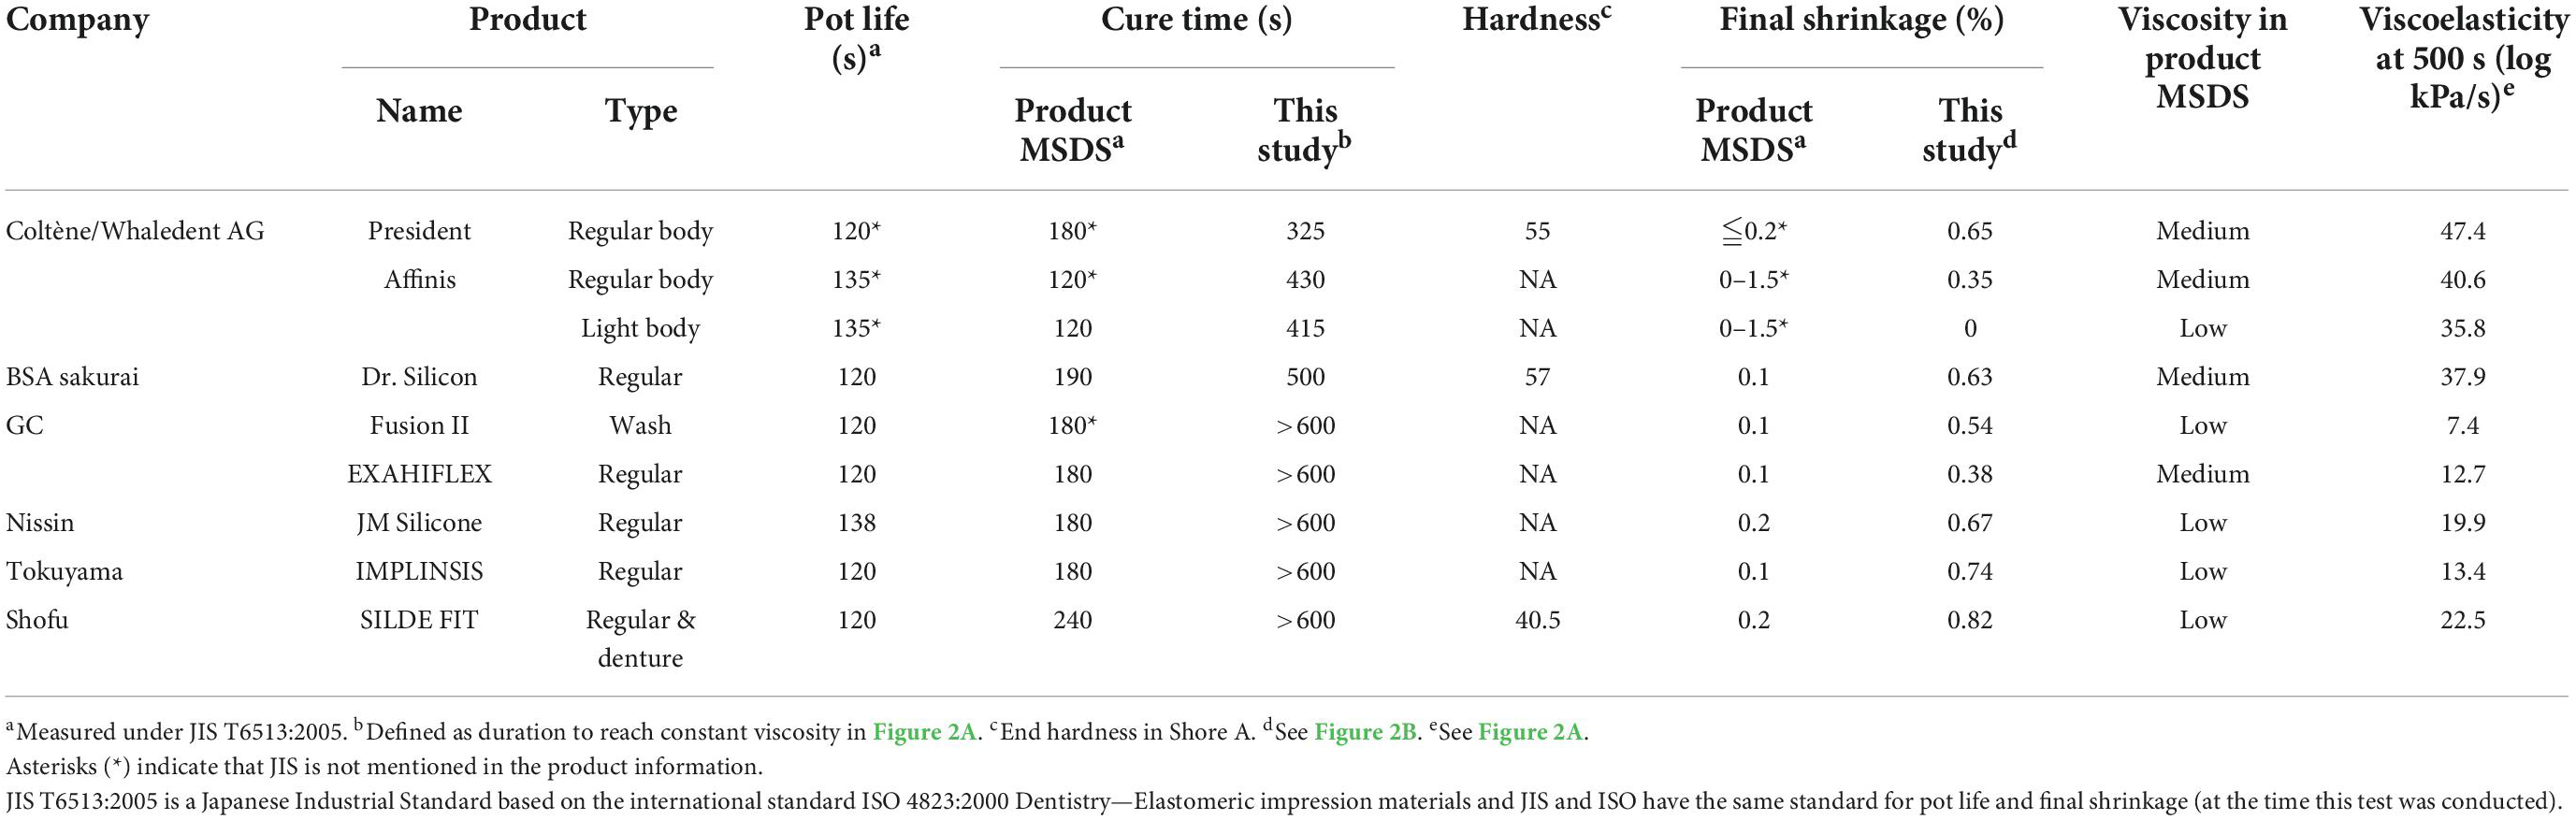
Table 1. Silicone materials tested in this study and their physical properties shown in their product material safety data sheet (MSDS) and obtained through the measurements in this study.
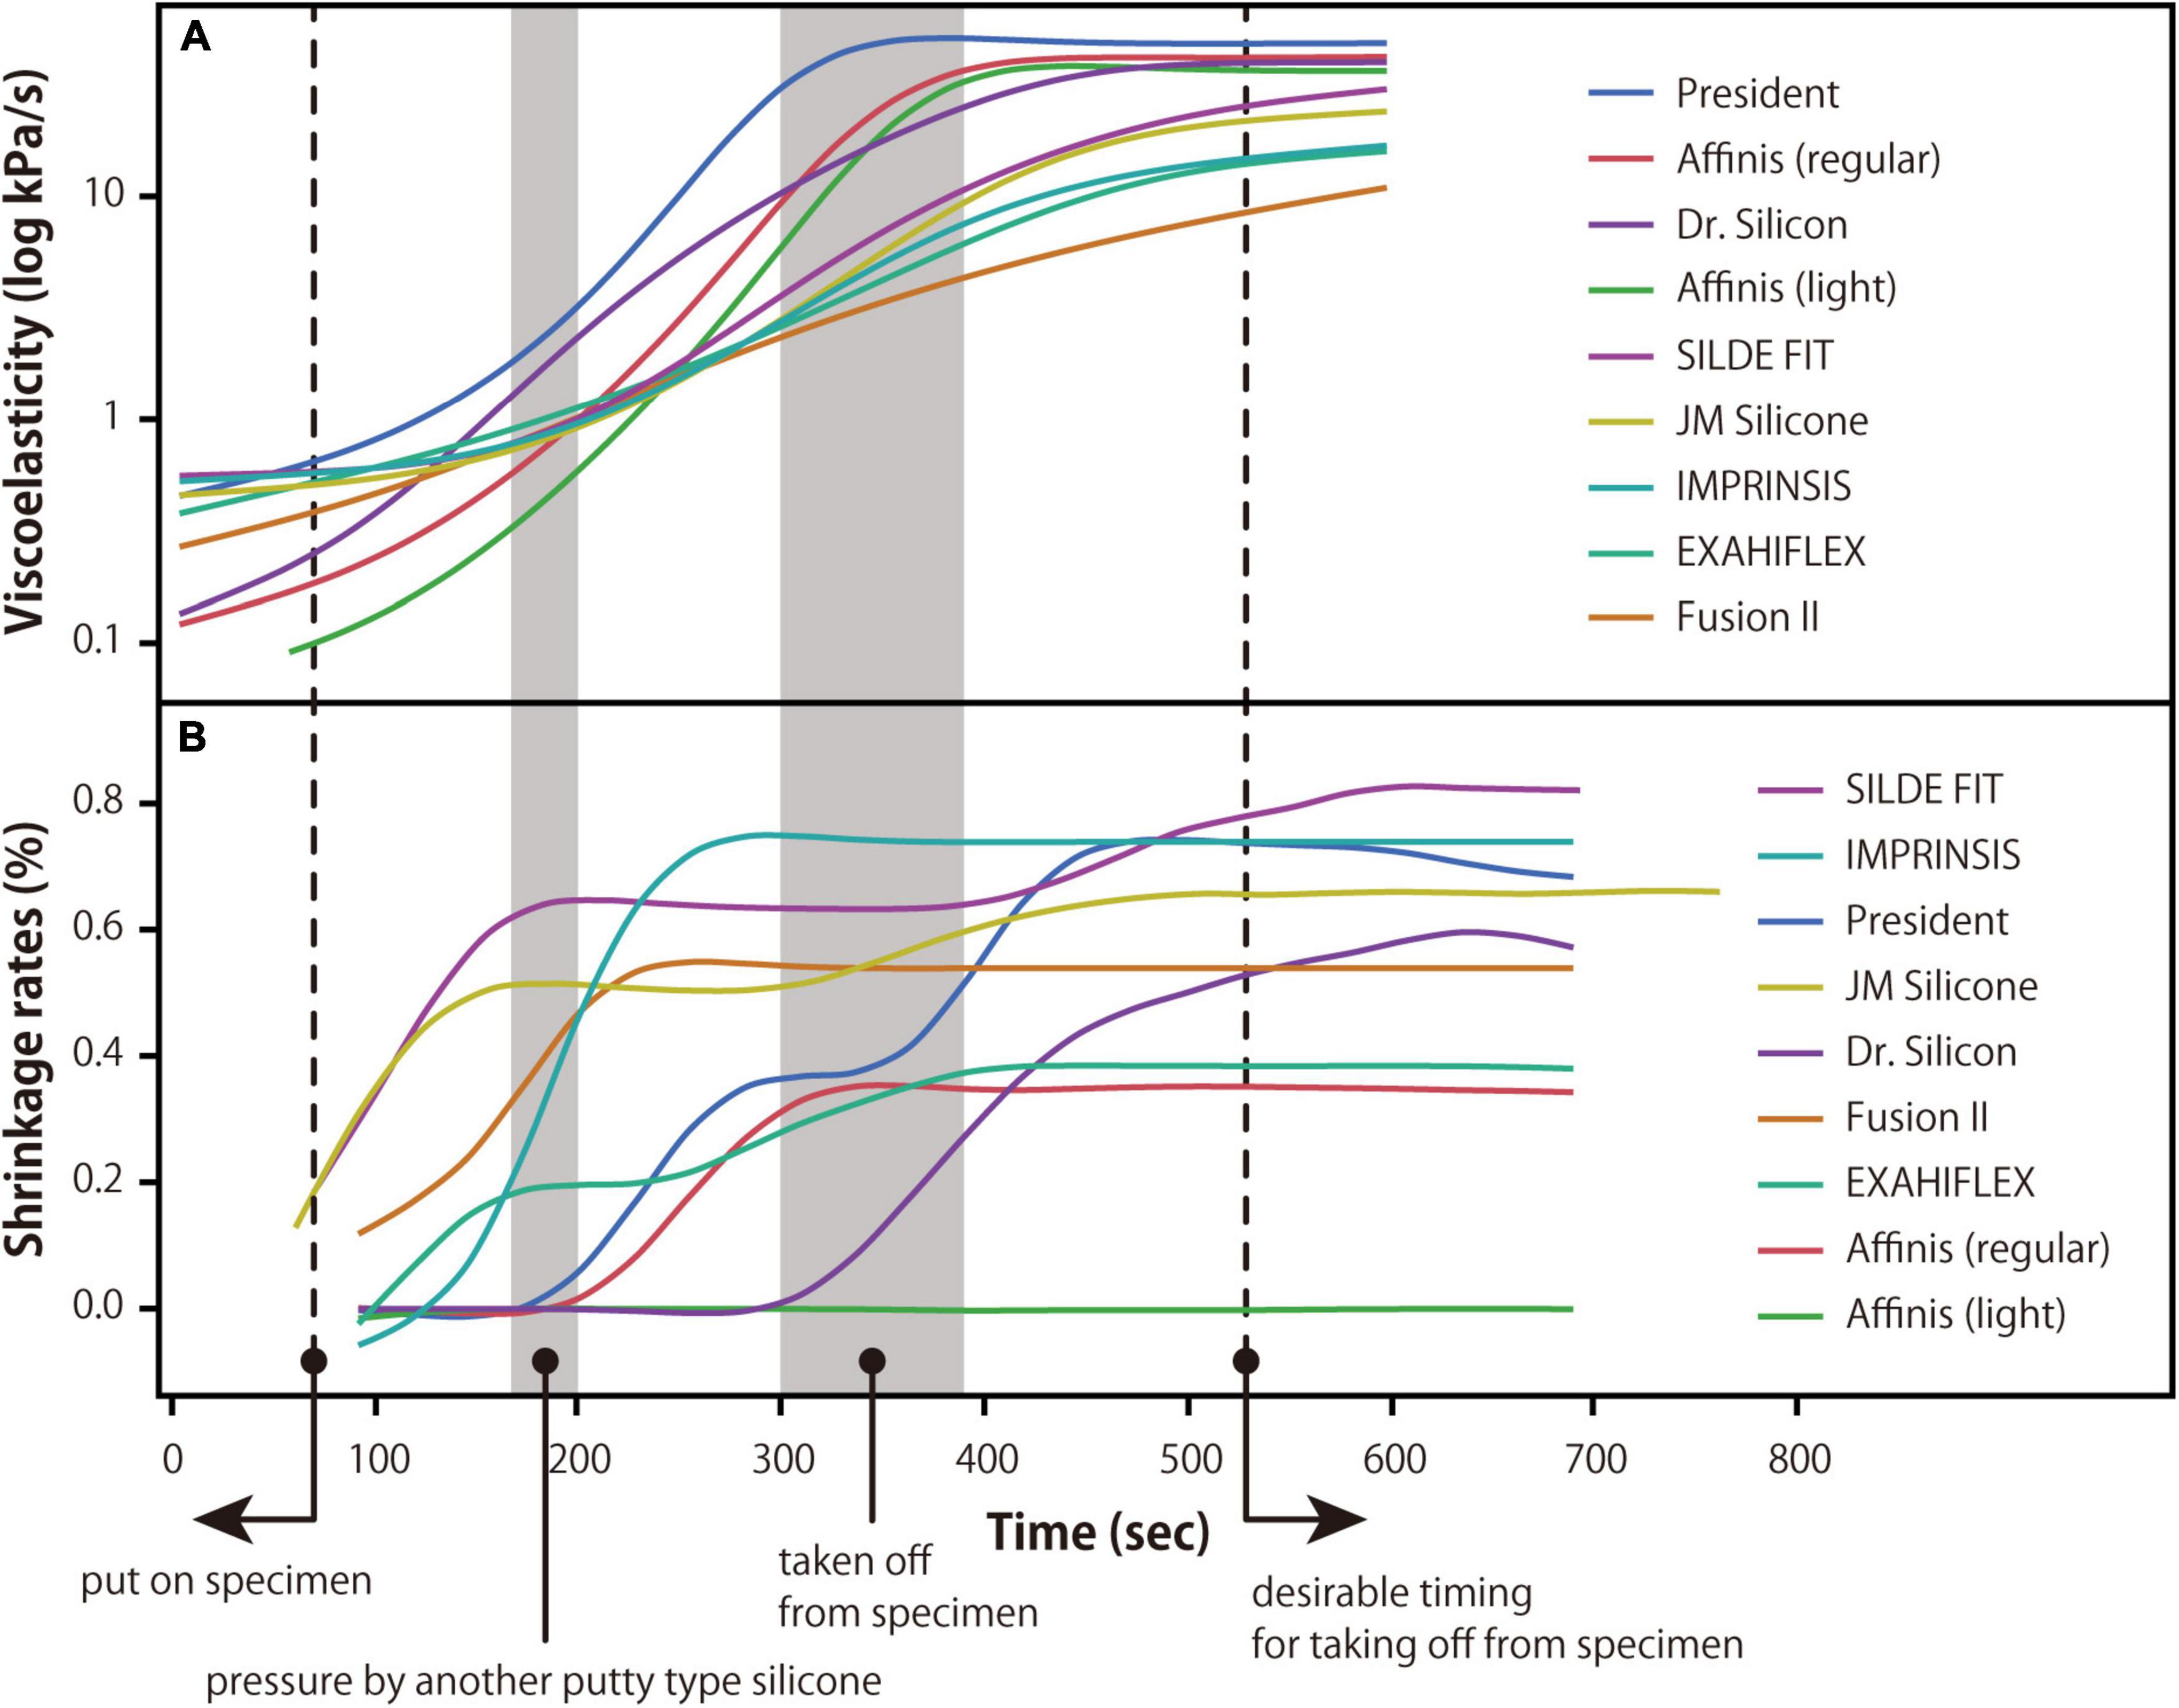
Figure 2. Dynamic viscoelastic properties and shrinkage rates of silicone materials. (A) Chronological change of viscoelasticity after mixing. (B) Chronological change of shrinkage rates after mixing. The dashed and gray areas in the figure show the timing of silicon application, pressing, and removal.
All products are cartridge-type in dentistry quality, and their material properties such as shrinkage rate and cure time are provided by the companies. High-viscosity materials were excluded in this study because Goodall et al. (2015) reported poor accuracy with high-viscosity materials. For mixing, we used a cartridge dispenser and mixing tips. We made sure to apply the silicones well before their expiration date to avoid the impact of quality deterioration on the results.
To monitor the time-dependent elastic behaviors of the silicone materials after mixing, we measured the dynamic viscoelasticity and shrinkage rate of the silicone materials. Dynamic viscoelasticity was measured by a rheometer (HAAKE Mars III, Thermofisher Scientific) at the Tokyo Metropolitan Industrial Technology Research Institute. For every measurement, about 3 ml of silicone material was tested and monitored for 10 min. Nagrath et al. (2014) reported that humidity at curing affects impression accuracy. In this study, dynamic viscoelasticity measurements were performed under average room temperature and humidity conditions.
Time-sequential change of shrinkage was monitored under a room temperature of 25°C and ambient humidity by a Custron device (AcroEdge, Tokyo, Japan) for 10 min, starting 90 s after silicone materials were drawn on a discal pit (diameter = 10 mm and depth = 1 mm) in a glass plate.
Each silicone was applied to the targeted area of the tooth surface and then pressed against its surface with a small ball of silicone putty (EXAFINE PUTTY TYPE, GC) to assure that details are imprinted on the silicone mold. This procedure was done as an imitation of the common one when taking dental impressions in clinical situations: (1) a dentist applies an impression material using a cartridge dispenser on the teeth of a patient, and (2) the patient bites a clinic tray filled with putty-type silicon. The mold was taken off from the specimen in 5–6.5 min. Before applying the next silicone material, we cleaned the specimen surface with 2% NaOCl-soaked cotton sheets followed by rubbing with acetone-soaked industrial cotton swabs. After taking off from the specimen, we trimmed the silicon mold to an appropriate size using a knife and attached it to a sliding glass using superglue for laser microscope observation.
The original specimen and silicone molds were scanned with a confocal laser microscope (VK-9700, Keyence, Osaka, Japan) housed in the Department of Natural Environmental Studies, Graduate School of Frontier Sciences, the University of Tokyo. We used lower magnification lenses (20× and 50×) to identify the scan locations (i.e., f9-1, f9-2, and f9-3). Then we used a 100× long-distance lens (N.A. = 0.95) to scan the focal sites and generated 3D surface texture data by lateral (x, y) sampling with an interval of 0.138 μm and a vertical resolution (z) of 0.001 μm. For each scan, 3D surface data of an area of 140 μm × 105 μm was obtained. Moreover, grayscale photographs of the tooth surfaces were procured for graphical comparison. We scanned both the original tooth surface and the silicone molds with dental impressions by the following procedures. We first placed the original specimen on the stage of the laser microscope and scanned the focal sites. To replicate the process, we took the specimen out of the stage and then replaced it on the stage to scan the same targeted area again. The relocation was done manually by finding common features (see Supplementary Figures 1–3), so this may have influenced the results to some extent. The scanning was repeated at least three times for each site. We scanned the silicone molds in the same way, but for every scanning, we made new impression molds to take the intrasample errors of impression molds into account. The original tooth was scanned repeatedly on different days to check intrapersonal variation in the choice of the targeted area. The accessibility to the focal scan points varied among the samples because it was difficult to find the same scan points in the molding samples with less precise surface replication. Therefore, the number of repeated scans differed among the molding materials (Table 2). Note that the scanning of molds was done within 1–2 weeks after molding, so there is little need to consider the effects of dimensional changes as reported in Rodriguez and Bartlett (2011) on the acquired data.
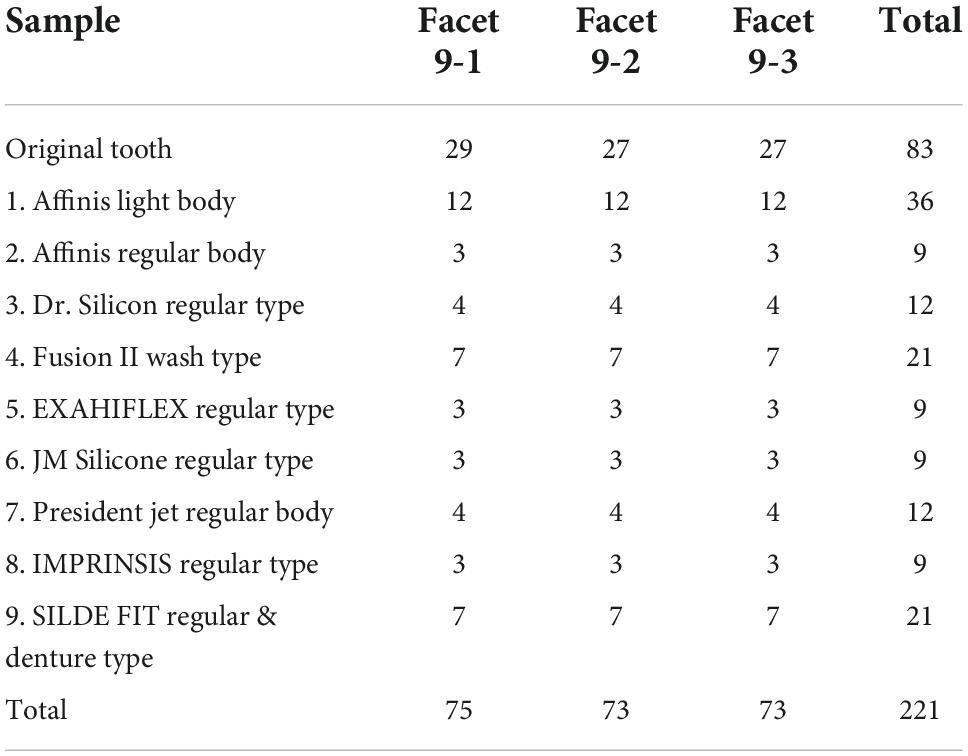
Table 2. The number of repeated scans for each sample and scan location.
For a simple evaluation of the accuracy and precision of the silicone impression molds, we first checked air bubble contamination and surface smoothing on 2D images obtained by the 100 × lens.
We analyzed the 3D data obtained by the confocal laser microscope using Mountains Map Imaging Topography (version 9.0.9653, Digital Surf, Besançon, France). The 3D data were preprocessed to remove measurement noises and outliers by the following procedure described in Aiba et al. (2019), which included (1) mirroring (only for molds), (2) leveling (least square plane by subtraction), (3) application of S-filter (a robust Gaussian filter with a cutoff value of 0.8 μm, as defined in ISO 25178), (4) form removal function (polynomial of increasing power = 2) to remove large-scale curvature of enamel bands (F-operation in ISO 25178), (5) outlier removal with a slope >80°, (6) application of a threshold removing the upper and lower 0.1% of the data, and (7) filling of the non-measured points. After data cleaning, 30 parameters of ISO 25178-2 and two (fractal complexity Asfc and length-scale anisotropy epLsar) from scale-sensitive fractal analysis (SSFA) were calculated (Table 3).
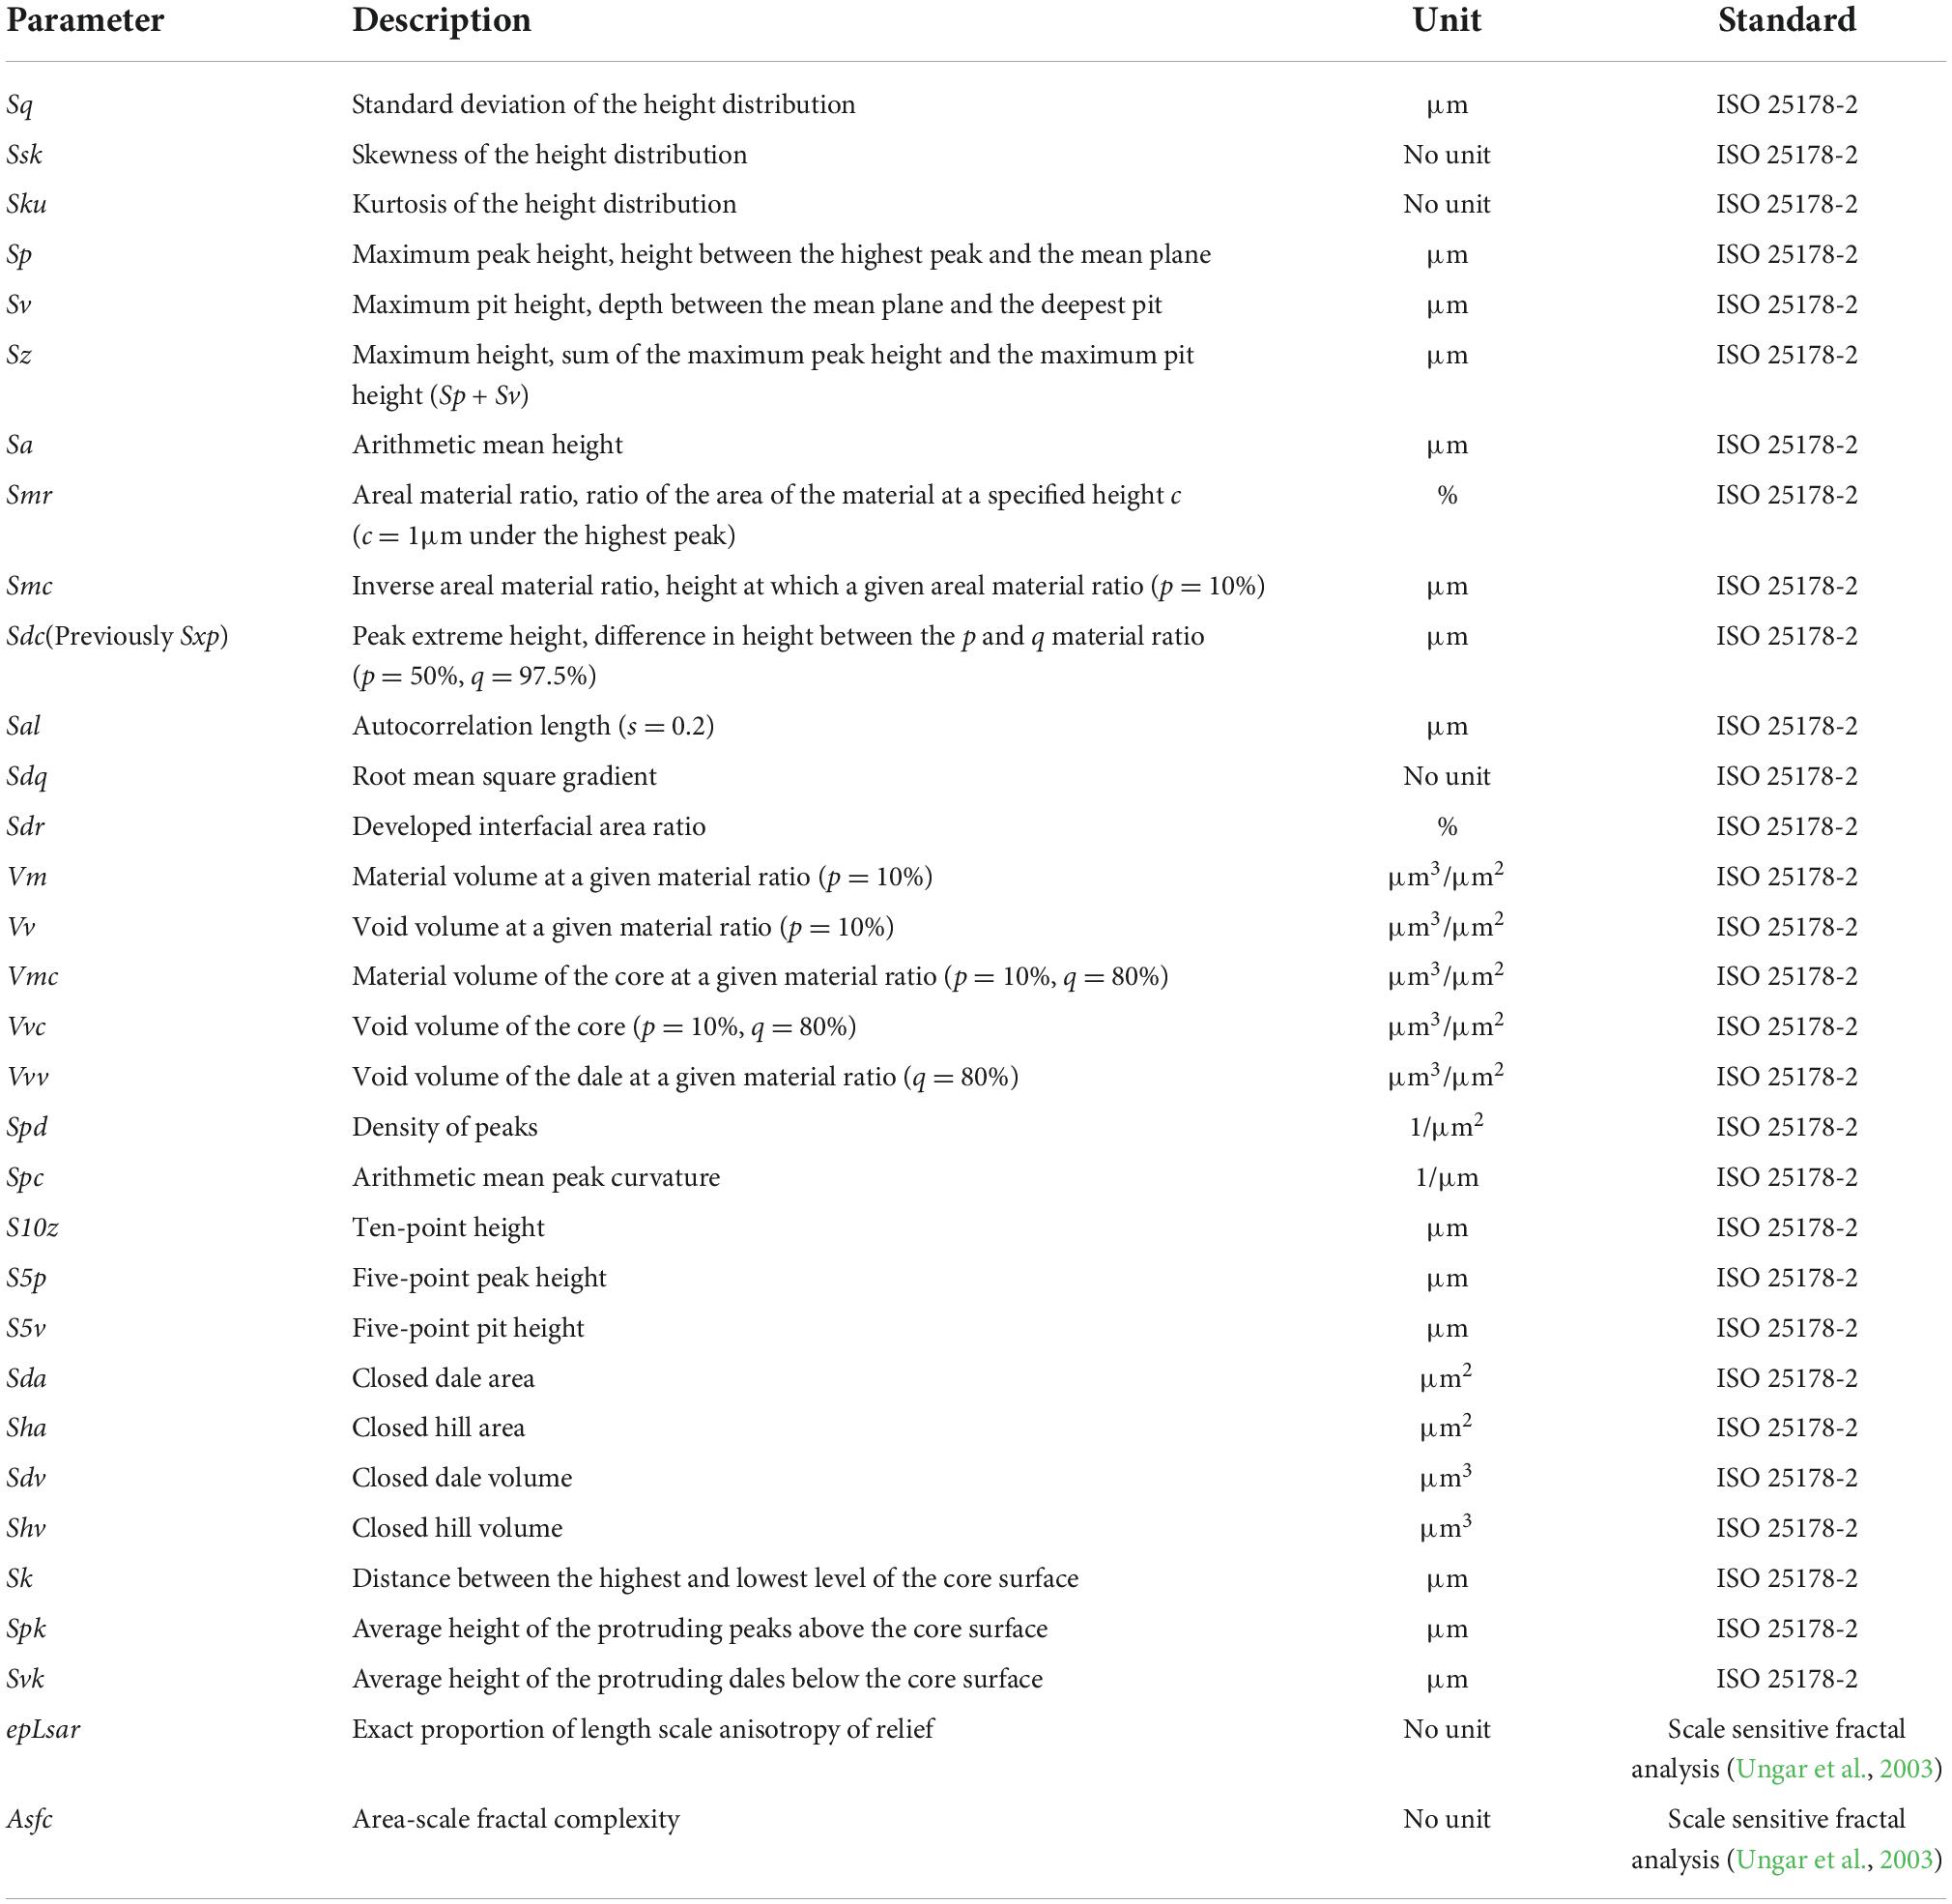
Table 3. Names and descriptions of dental microwear texture parameters used in this study.
For non-parametric pair-wise tests between the parameter values from the original tooth surface and those from the silicone molds, Steel’s multiple-comparison test was performed with the original surface scan as a control treatment. The number of significant differences was counted for each of the nine impression materials at each scan location (f9-1, f9-2, and f9-3). To visualize the variation of surface roughness among original tooth surfaces and the molds, we conducted principal component analysis (PCA) with Varimax rotation for the 32 DMT parameters (30 ISO and 2 SSFA parameters), which are presented as scatter plots along the principal component (PC) axes. All statistical analyses were conducted using JMP Pro 16.0.0 (SAS Institute Inc.).
Figure 2A shows the dynamic viscoelasticity (log kPa/s) of silicone materials measured by a rheometer. The analyzed silicone materials are categorized into two types based on viscoelastic behaviors during hardening.
Four products of silicone compounds are included, which are President, Affinis (regular), Dr. Silicon, and Affinis (light) in this order. Of these, Dr. Silicon, Affinis (regular), and Affinis (light) have low initial viscoelasticity. The hardening of President was completed 6 min after mixing of main and cure agents. The final viscosity of President is the highest of all. The hardening of Affinis (regular), Dr. Silicon, and Affinis (light) has completed about 7 min after mixing. Noticeably, these four products with rapid completion of hardening have high impression accuracy by qualitative evaluation of two-dimensional microscopic images (Supplementary Figures 1–3).
The remaining five products are categorized in this type: SILDE FIT, JM Silicone, IMPRINSIS, EXAHIFLEX, and Fusion II had higher viscosity in this order. The hardening of these products did not complete perfectly even 10 min after mixing.
Figure 2B shows the shrinkage rate changes of silicone materials during cure time. More complicated patterns are observed for shrinkage than for dynamic viscosity. However, they are largely categorized into two types with a threshold of 0.2% in 200 seconds (s) as follows.
The shrinkage rates exceed 0.2% after 200 s, showing more gradual curves of shrinkage compared to the fast shrinkage type. This includes President (two-step slope with an initial shrinkage starting in 180 s after mixing and reaching 0.74% in 480 s), Affinis regular (one-step slope with an initial shrinkage starting in 200 s after mixing and reaching 0.35% in 330 s), and Dr. Silicon (one-step gradual slope, with an initial shrinkage starting in 280 s and reaching at 0.58% after 650 s). Final shrinkage rates fall between 0.35 and 0.65%. Irregularly, no shrinkage was observed for Affinis light, which could be an unknown analytical error since its final shrinkage rate provided by the company was comparable to that of Affinis regular (Table 1). Alternatively, this result on Affinis light could be batch-dependent, but due to the budget and time available for this study, we were not able to repeat the measurements.
The shrinkage rates exceed 0.2% within 200 s, showing increased shrinkage rates immediately after mixing. This group includes JM Silicone (1st slope, reaching a shrinkage rate of 0.5% in 200 s, followed by the 2nd gradual slope), SILDE FIT (1st slope, reaching 0.6% in 200 s, followed by the 2nd gradual slope), Fusion II (one-step steep slope, reaching 0.55% in 250 s), IMPRINSIS (one-step steep slope, reaching 0.74% in 280 s), and EXAHIFLEX (1st slope, staying at 0.2% until ∼240 s and reaching at 0.38% after 420 s, followed by the 2nd gradual slope between 300 and 400 s). Final shrinkage rates range from 0.38 to 0.82%.
Though it was confirmed that there were differences in impression accuracy of silicone materials even in the lower magnification images (Figure 1), it was obvious in the higher magnification images that several impression molds (EXAHIFLEX, JM Silicone, and IMPRINSIS) had poor reproducibility of original DMT, that is, their microscopic images showed blurred surfaces and contamination of bubbles (Supplementary Figures 1–3). In all fields of f9-1, f9-2, and f9-3, blurring was observed in EXAHIFLEX, JM Silicone, and IMPRINSIS. Molds made by SILDEFIT roughly reproduced overall microwear features but had many traces of small bubbles contamination on the surfaces in all target views. Among other impression materials with relatively good accuracy, President and Dr. Silicon had the best accuracy with fine microwear features (e.g., very fine scratches).
The difference between the original surface and molds was further evaluated by statistical comparisons of 32 DMT parameters. The raw values of the DMT parameters of all scans (N = 221) used in this study are listed in Supplementary Table 1. Summary statistics (sample size, mean, and S.D.) of the DMT parameters for scan targets (i.e., the original tooth and nine impression materials) are provided in Supplementary Table 2. Results of Steel’s non-parametric test comparing the original tooth surface and dental molds are presented in Supplementary Table 3.
Figure 3 shows the number of significant differences in Steel’s non-parametric test presented for each silicone material and scan location. Thus, lower values on the vertical axis are better, capturing morphological details of the original surface. President Jet Regular body and Dr. Silicon regular type are better (= the smallest number of significant differences) than other products. The accuracy of Affinis light and SILDE FIT follows President and Dr. Silicon, and the difference is small. To present the precision of dental molds, the deviation of the parameter value of the mold from the average parameter value of the original tooth surface was obtained for each parameter (Supplementary Figure 4). In Supplementary Figure 4, the ranges of deviations (mold—original tooth surface) are wider for some impression materials (IMPRINSIS and JM Silicone), whereas others show equivalent ranges. Affinis light shows narrower ranges since it has a larger number of molding and scanning. In most cases, the ranges include zero, suggesting that there was no outstanding impression material and that all show decent levels of precision. However, as seen in the 100 × 2D images of Supplementary Figures 1–3, SILDE FIT molds contain many bubbles. And the Affinis light molds are slightly blurred. Therefore, we evaluated them not as accurate as President and Dr. Silicon. IMPRINSIS regular type is the worst among all (Figure 3), which corresponds to visual observations of 2D images (Supplementary Figures 1–3).
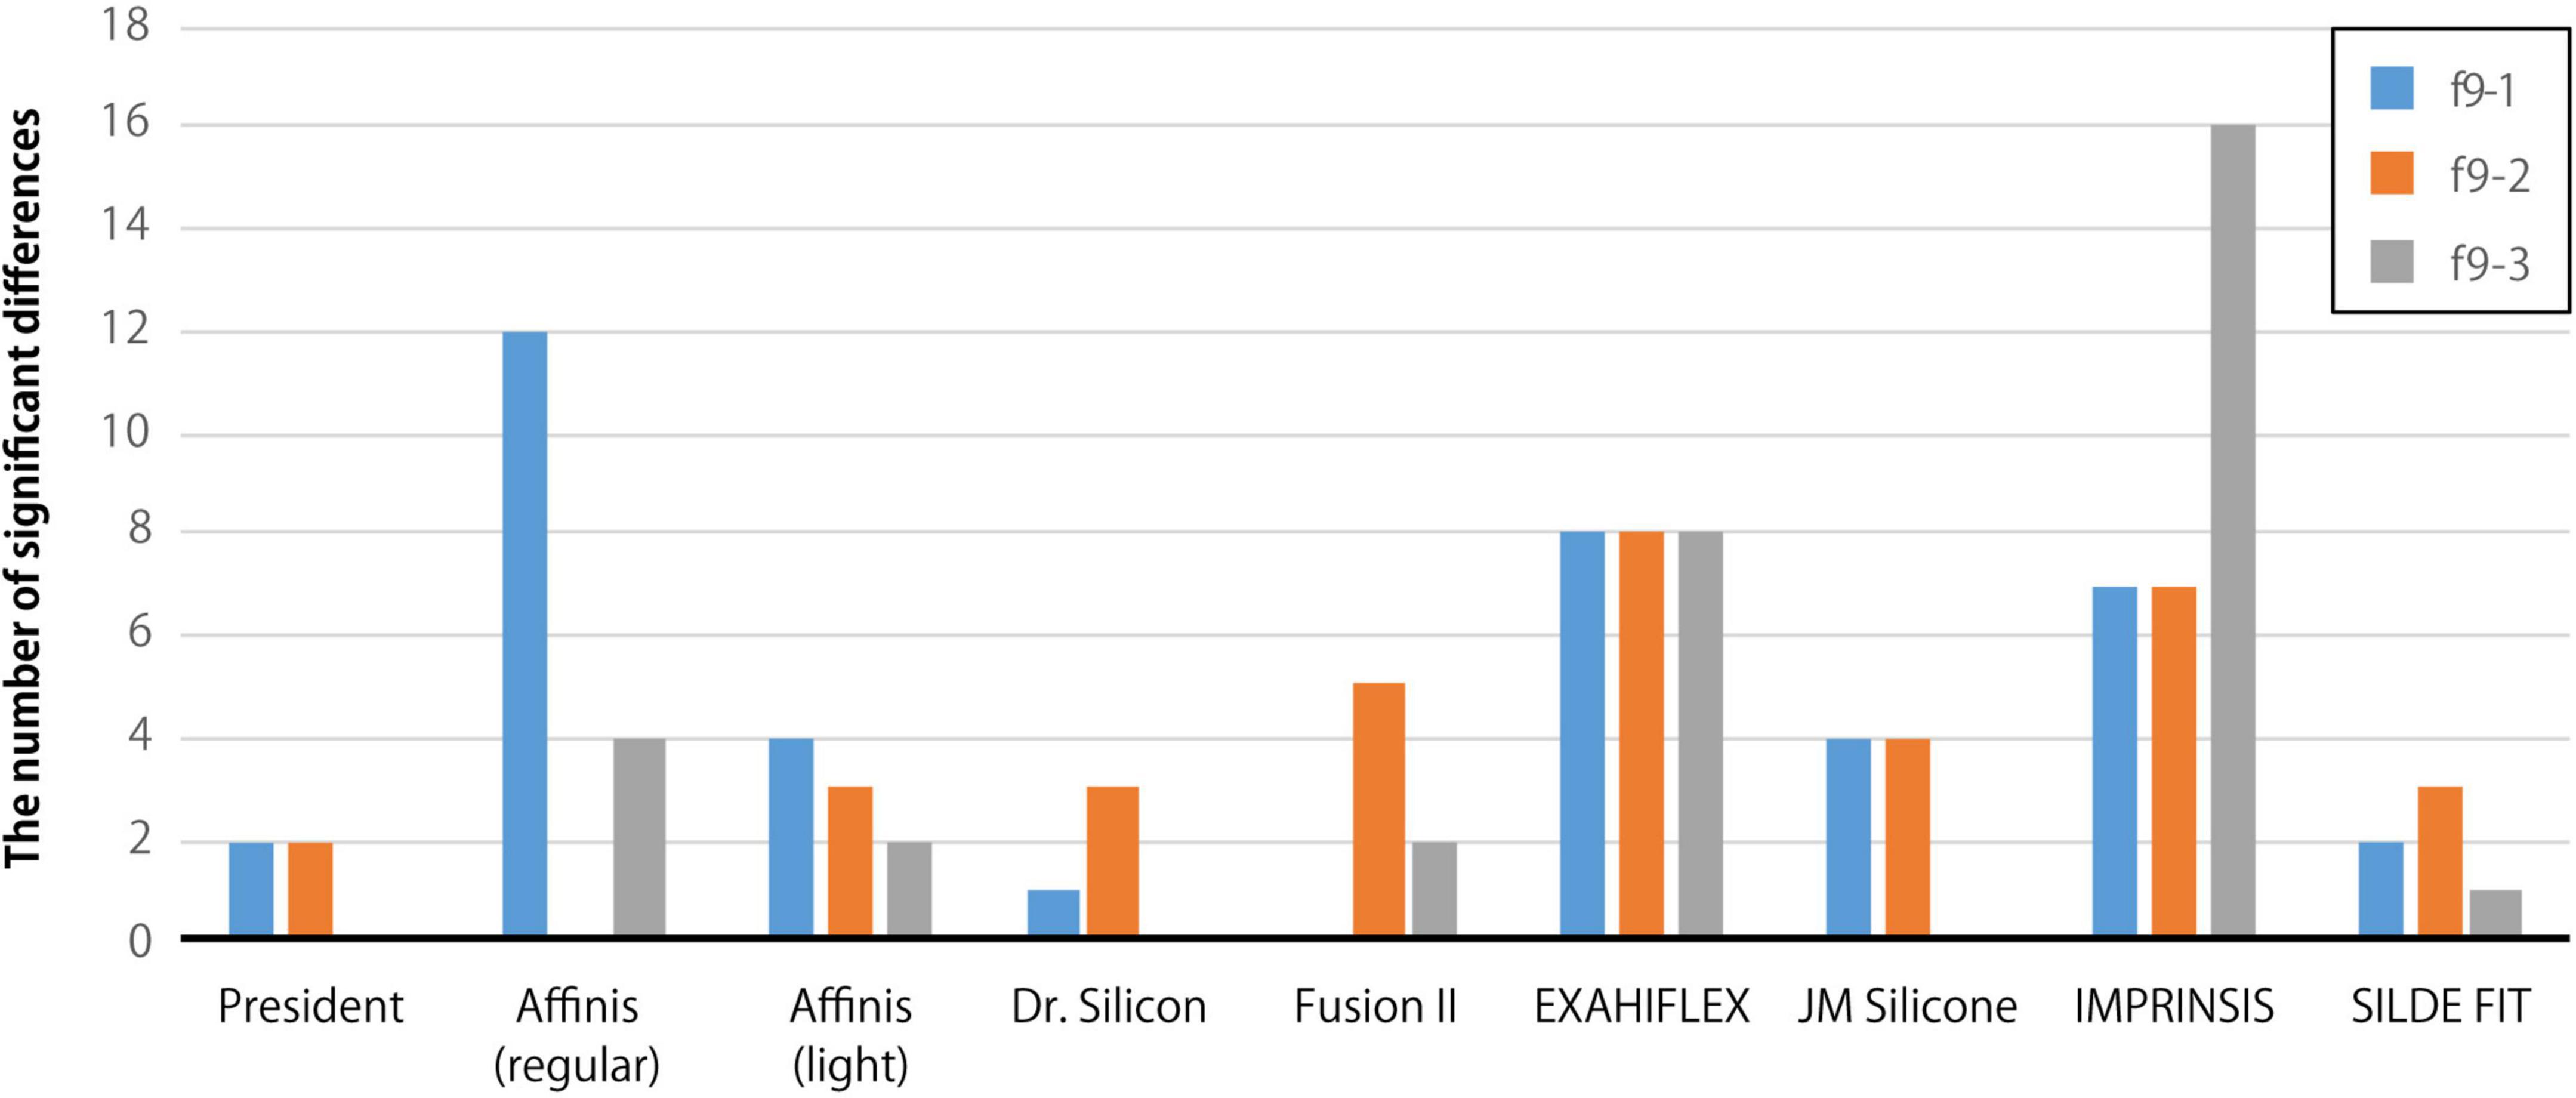
Figure 3. The number of significant differences in 32 DMT parameters between the original tooth surface and silicone molds. Pair-wise tests were conducted for each scan location on facet 9 (f9-1, f9-2, and f9-3).
PCA of the 32 DMT parameters clarified that the first and the second principal components explained 52.6 and 19.1% of the observed variation. The factor loadings of PC1 (Table 4) showed larger positive values of height and volume parameters of ISO 25178-2, indicating that PC1 could be interpreted as overall surface roughness, in other words, the size of microwear features. On the other hand, PC2 had larger positive values for Sdq, Sdr, Asfc, and Spd, which were all related to the fineness of the surface. In addition, the parameters related to surface segmentation (Sda, Sha, Svd, and Shv) showed large negative values. Therefore, the larger PC2 values indicated that the surface was characterized by finer features and segmented into smaller hills and dales. The scatter plots of PCs are shown in Figure 4. We found a non-negligible variation in repeated scans of the original tooth surface, which indicated uncontrolled errors associated with placing the tooth on the microscope stage, tilting the tooth, and searching and scanning the focal sites: all of them cannot be perfectly repeated and therefore this leads to data variation. Most of the scan data from the dental molds lay within the 90% confidence ellipses of the original tooth scans, though some departed even from the ellipses. Notably, the data of molds made by IMPRINSIS regular type, the material with the least replicability (Supplementary Figures 1–3), are placed beyond the ellipses for all three scan locations.
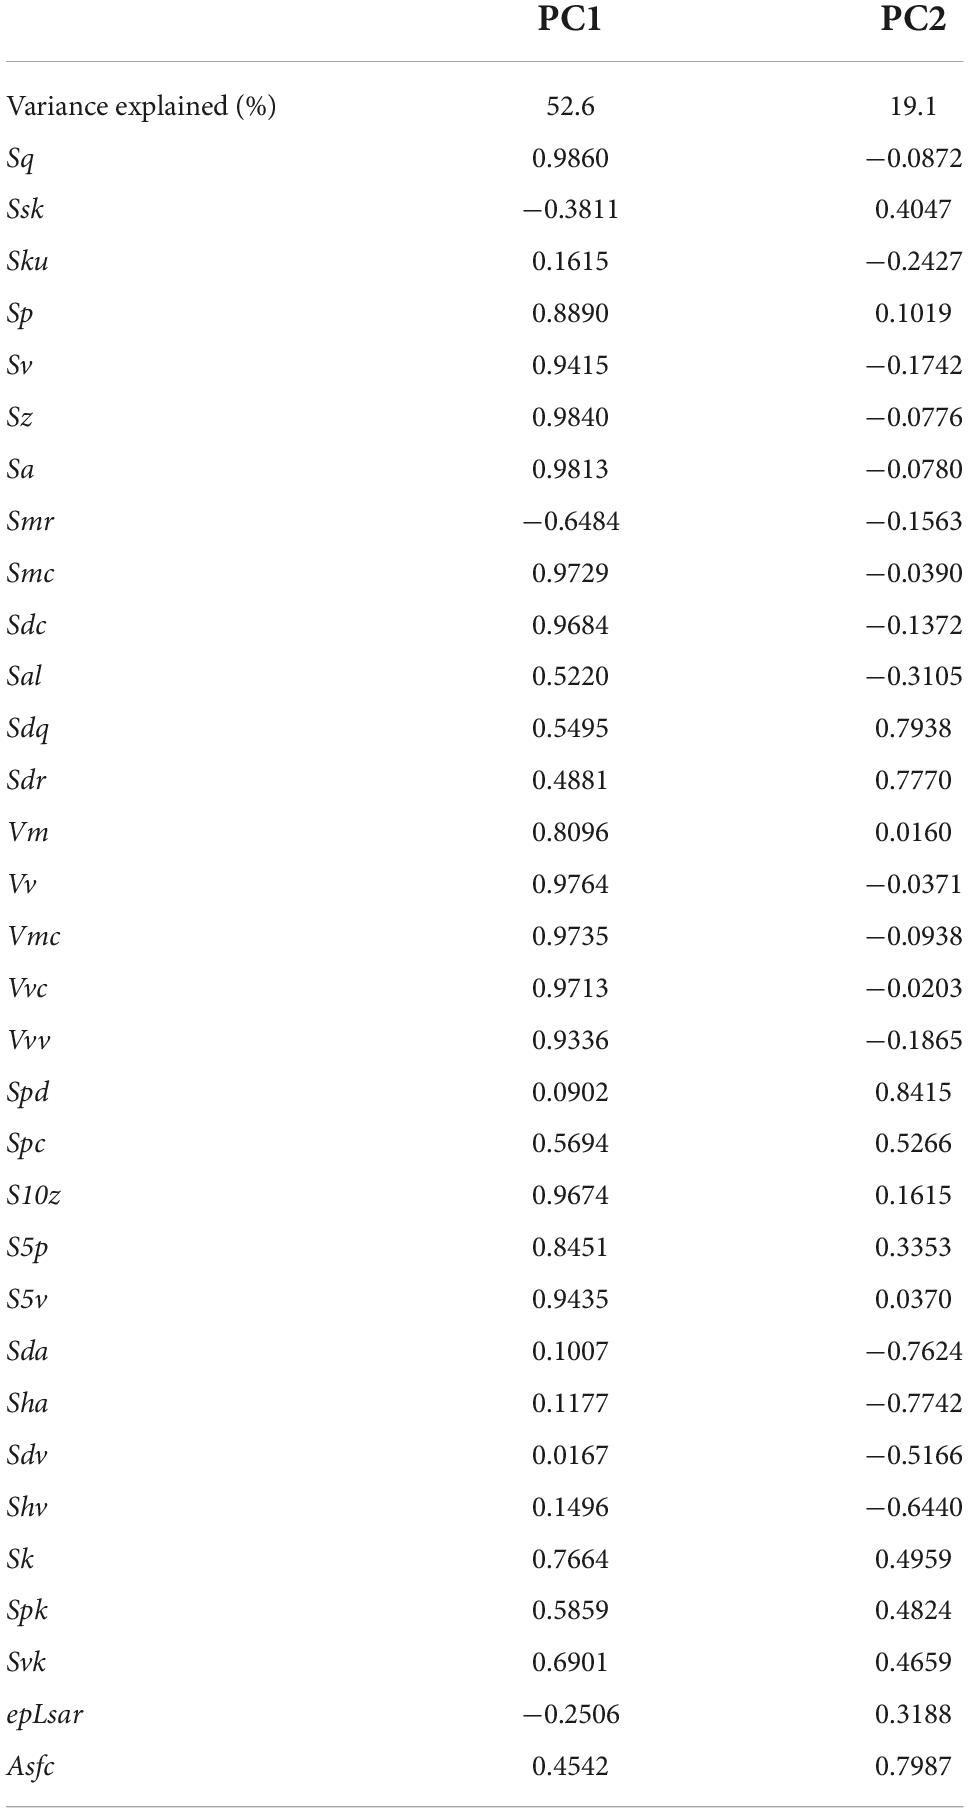
Table 4. The factor loadings obtained from a PCA using 32 DMT parameters.
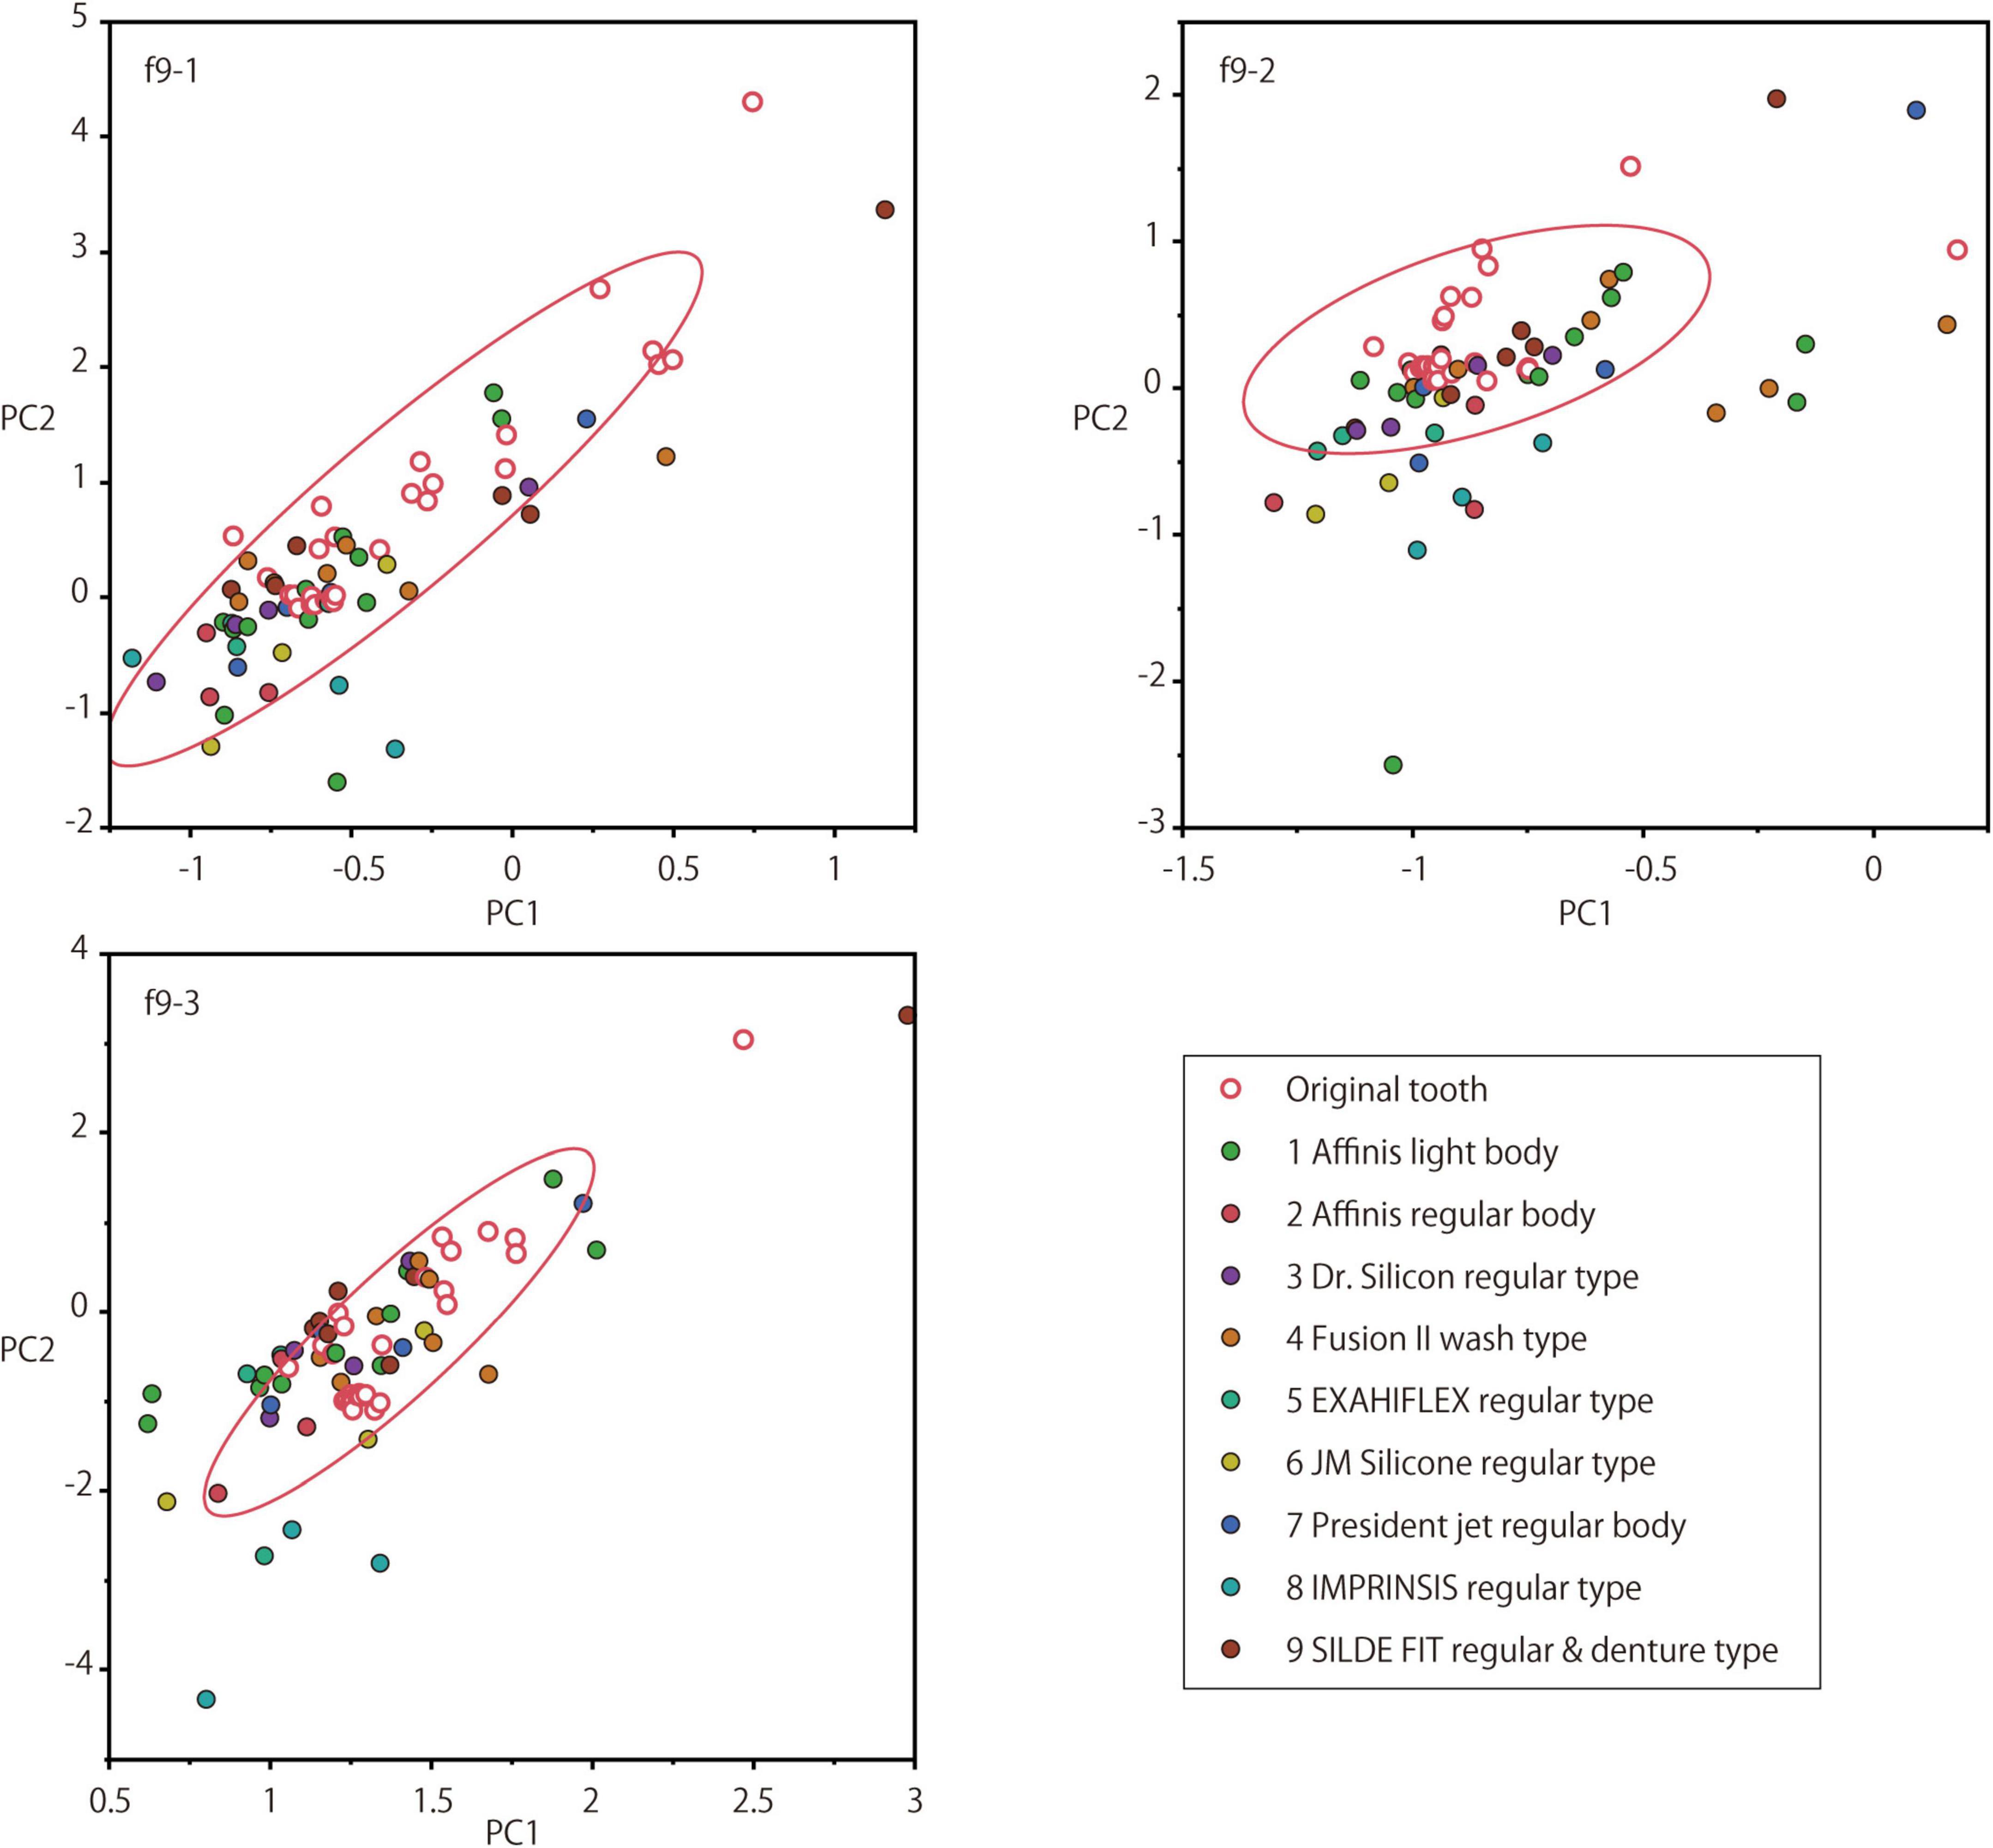
Figure 4. Scatter plots of the PC scores obtained from 32 DMT parameters, presented respectively for each scan location on facet 9 (f9-1, f9-2, and f9-3). Variation of repeated scanning of the original tooth surface was presented by the ellipses, within which 90% of the data lie. Symbols for the dental impression materials are shown in right lower corner.
Based on 2D observations and statistical results of the DMT parameters, we clearly showed dynamic viscoelasticity is the best indicator to find appropriate dental impression materials, which can mold accurately the tooth surface as President. In our study, dynamic viscoelasticity categorized the analyzed silicones into two types based on the hardening speed. Despite a wide range of initial values, the rapid completion type commonly shows steep viscoelastic curves. The silicones of this type include President, Affinis regular, Affinis light, and Dr. Silicone. They show better reproducibility of microwear features with less blurring and less air bubble contamination than the slow completion type (Figures 1, 3, 4). Especially, Dr. Silicone presents better reproducibility of fine microwear features than others. In contrast, the slow completion type, showing gradual viscoelastic curves, did not complete hardening in 600 s from the start. Nevertheless, according to the physical properties of the silicones provided by the product companies (Table 1), the range of cure time of the slow completion type does not differ from that of the rapid completion type. This finding indicates that the most conclusive and quantitative way to find suitable silicones for DMTA is to measure dynamic viscoelasticity by a rheometer and identify the product with similar curves to those of the rapid completion type.
Although dynamic viscoelasticity is the best indicator, we suggest the following criteria for silicones as reliable as President.
The silicones with rapid completion showed better impression accuracy. It may be related to the timing of removal of the impression molds from the specimen, which was set as 5–6.5 min after mixing. If the pressure with putty-type silicone had been continued until the completion of hardening, the slow completion type may have presented a better impression than the resultant impression of this study. Nevertheless, we suggest that the 5–6 min completion of curing is a reasonable time for DMTA research, considering the procedures for making many impression molds of tooth specimens in a limited working time (e.g., visiting museums). It must be noted that the data of cure time provided by companies were not concordant with dynamic viscoelasticity measured in this study; the provided cure time data of the slow completion type do not differ from those of the rapid completion type (Table 1). This is partly because the cure time in product material safety data sheet (MSDS) is idealized for the application of in vivo human dentition in the oral cavity, whose temperature is much higher than the ambient temperature condition of 25°C for measuring the dynamic viscoelasticity in this study. Also, there should be variability due to production batches. The divergence of acquired viscoelasticity and shrinkage data in the present study from product MSDS should be further investigated in future collaboration with professionals of dental materials and product manufacturers.
The analyzed silicones show more complicated patterns for the time-sequential shrinkage rate than for dynamic viscoelasticity. In our study, the silicones that do not exceed the 0.2% shrinkage in 200 s after mixing showed better impression accuracy. These products were also categorized as the rapid completion type, which is also associated with better impression accuracy. In contrast, poor impression accuracy was observed for the products that began shrinking immediately after mixing.
Delayed change in shrinkage with better impression accuracy is related to the timing of applying the silicone to the specimen (approximately 70 s after mixing) and pressing it to the specimen with another putty-type silicone (approximately 180–200 s after mixing) (Figure 2B). The delayed start of shrinkage seemed to provide enough time for silicone compounds to extend over the microscopic details. On the other hand, the materials that cured slowly and began to shrink relatively early in the hardening process were less accurate and their molds showed blurred surfaces (JM Silicone and IMPRINSIS). This implies that the molds were peeled off from the tooth surface at the microscopic level before capturing details due to the shrinkage, as the shrinkage speed might exceed the curing speed.
Among the four products categorized as the type with rapid completion of curing through the measurements of dynamic viscoelasticity, President and Affinis (regular) are medium viscosity, whereas Affinis (light) is low viscosity in the ISO 4823 classification. Although the viscosity classification is unknown for Dr. Silicone, based on handling these materials, the product is assumed to be medium viscosity. These medium viscosity products show more accurate impressions of microwear features, which is concordant with the previous finding (Goodall et al., 2015). Affinis light body was overall good in parameter values, but from our experience, this material should contain a larger amount of oil than medium viscosity materials and the oil seems to be associated with the slightly blurred surfaces of the molds.
Adhesion of air bubbles was remarkable in the materials not only with relatively high viscosity immediately after the mixing but also with slow completion of curing (EXAHIFLEX, JM Silicone, IMPRINSIS, and SILDE FIT). Exceptionally, very few bubbles were observed in President molds despite the high initial viscosity. There may be some material characteristics or components that make it difficult for bubbles to be mixed. Anyway, the factors that contribute to bubble contamination and deaeration would need to be considered with other physical properties of materials and molding procedures.
As pointed above, the materials in combination of the rapid completion type and delayed change in shrinkage result in higher impression accuracy than other materials. This was supported not only by qualitative evaluation based on comparisons of 2D images but also by quantitative evaluation based on statistical analysis using 32 DMT parameters.
For seeking dental impression materials suitable for DMTA research, this study quantitatively evaluates the physical properties of silicone impression materials (changes of viscoelasticity and shrinkage over time) and the accuracy of dental impression molds by DMTA. Our results, show that dynamic viscoelasticity is strongly related to the accuracy of silicone impression materials. On the timing of the impression molding procedure, it is important for the impression accuracy that the curing of silicone occurs immediately after mixing and completes by the time the mold is removed from the specimen, while the shrinkage starts after application to the specimen. In addition, it is suggested that the physical property information supplied by the product companies is not practical in searching for impression materials suitable for DMTA, even if it is measured according to ISO standards. Further collecting and examining the data on physical properties of other dental impression materials, which are globally or locally purchasable, is to be of use for standardizing the methodology of DMTA.
The original contributions presented in this study are included in the article/Supplementary material, further inquiries can be directed to the corresponding authors. In addition, we uploaded original raw scan data saved in “.vk3” format, all the analytical files in “.mnt” format, and processed surface 3D data in “.sur” format to the online repository Zenodo. DOI of the uploaded files is https://doi.org/10.5281/zenodo.7052345.
Ethical review and approval were not required for this study as this study used a fossil museum specimen and the investigation of the fossil was officially approved by the curator.
YK conceived the experiments. RS and YK conducted the experiments. MOK and RS analyzed the results. All authors reviewed the manuscript.
This work was funded by JSPS grants No. 18K12567 (to RS), Nos. 18K13650 and 21K15176 (to YK), and Nos. 16K18615 and 22H00027 (to MOK).
We thank Tai Kubo (The University Museum, The University of Tokyo), Eisuke Yamada (Yamanashi Prefectural Museum), and Konoka Aiba (Japan Wildlife Research Center) for supporting our study.
The authors declare that the research was conducted in the absence of any commercial or financial relationships that could be construed as a potential conflict of interest.
All claims expressed in this article are solely those of the authors and do not necessarily represent those of their affiliated organizations, or those of the publisher, the editors and the reviewers. Any product that may be evaluated in this article, or claim that may be made by its manufacturer, is not guaranteed or endorsed by the publisher.
The Supplementary Material for this article can be found online at: https://www.frontiersin.org/articles/10.3389/fevo.2022.975283/full#supplementary-material
Aiba, K., Miura, S., and Kubo, M. O. (2019). Dental microwear texture analysis in two ruminants, Japanese serow (Capricornis crispus) and sika deer (Cervus nippon), from Central Japan. Mamm. Study 44, 183–192. doi: 10.3106/ms2018-0081
Caporale, S. S., and Ungar, P. S. (2016). Rodent incisor microwear as a proxy for ecological reconstruction. Palaeogeogr. Palaeoclimatol. Palaeoecol. 446, 225–233. doi: 10.1016/j.palaeo.2016.01.013
DeSantis, L. R. G., and Patterson, B. D. (2017). Dietary behaviour of man-eating lions as revealed by dental microwear textures. Sci. Rep. 7:904. doi: 10.1038/s41598-017-00948-5
Galbany, J., Martínez, L. M., López-Amor, H. M., Espurz, V., Horaldo, O., Romero, A., et al. (2005). Error rates in buccal-dental microwear quantification using scanning electron microscopy. Scanning 27, 23–29. doi: 10.1002/sca.4950270105
Goodall, R., Darras, L., and Purnell, M. (2015). Accuracy and precision of silicon based impression media for quantitative areal texture analysis. Sci. Rep. 5:10800. doi: 10.1038/srep10800
Grine, F. E., Ungar, P. S., and Teaford, M. F. (2002). Error rates in dental microwear quantification using scanning electron microscopy. Scanning 24, 144–153. doi: 10.1002/sca.4950240307
Hasegawa, Y., Yamauti, H., and Okafuji, G. (1968). A fossil assemblage of Macaca and Homo from Ojikado-cave of Hiraodai karst plateau, northern Kyushu, Japan. Trans. Proc. Paleontol. Soc. Japan New Ser. 69, 218–229.
Kay, R. F., and Hiiemae, K. M. (1974). Jaw movement and tooth use in recent and fossil primates. Am. J. Phys. Anthropol. 40, 227–256. doi: 10.1002/ajpa.1330400210
Krueger, K. L., Scott, J. R., Kay, R. F., and Ungar, P. S. (2008). Technical note: dental microwear textures of ‘Phase I’ and ‘Phase II’ facets. Am. J. Phys. Anthropol. 137, 485–490. doi: 10.1002/ajpa.20928
Krueger, K. L., Ungar, P. S., Guatelli-Steinberg, D., Hublin, J., Pérez-Pérez, A., Trinkaus, E., et al. (2017). Anterior dental microwear textures show habitat-driven variability in Neandertal behavior. J. Hum. Evol. 105, 13–23. doi: 10.1016/j.jhevol.2017.01.004
Kubo, M. O., and Fujita, M. (2021). Diets of Pleistocene insular dwarf deer revealed by dental microwear texture analysis. Palaeogeogr. Palaeoclimatol. Palaeoecol. 562:110098. doi: 10.1016/j.palaeo.2020.110098
Mihlbachler, M. C., Foy, M., and Beatty, B. L. (2019). Surface replication, fidelity and data loss in traditional dental microwear and dental microwear texture analysis. Sci. Rep. 9:1595. doi: 10.1038/s41598-018-37682-5
Nagrath, R., Lahori, M., and Agrawal, M. (2014). A comparative evaluation of dimensional accuracy and surface detail reproduction of four hydrophilic Vinyl polysiloxane impression materials tested under dry, moist, and wet conditions-an in vitro study. J. Indian Prosthodont. Soc. 14, 59–66. doi: 10.1007/s13191-014-0365-z
Purnell, M. A., Hart, P. J. B., Baines, D. C., and Bell, M. A. (2006). Quantitative analysis of dental microwear in threespine stickleback: a new approach to analysis of trophic ecology in aquatic vertebrates. J. Ani. Ecol. 75, 967–977. doi: 10.1111/j.1365-2656.2006.01116.x
Rodriguez, J. M., and Bartlett, D. W. (2011). The dimensional stability of impression materials and its effect on in vitro tooth wear studies. Dental Mater. 27, 253–258. doi: 10.1016/j.dental.2010.10.010
Schulz, E., Calandra, I., and Kaiser, T. M. (2010). Applying tribology to teeth of hoofed mammals. Scanning 32, 162–182. doi: 10.1002/sca.20181
Scott, R. S., Ungar, P. S., Bergstrom, T. S., Brown, C. A., Grine, F. E., Teaford, M. F., et al. (2005). Dental microwear texture analysis shows within-species diet variability in fossil hominins. Nature 436, 693–695. doi: 10.1038/nature03822
Ungar, P. S. (2015). Mammalian dental function and wear: a review. Biosurf. Biotribol. 1, 25–41. doi: 10.1016/j.bsbt.2014.12.001
Keywords: dental microwear texture (DMT), accuracy of silicone molds, material properties, dynamic viscoelasticity, shrinkage rate
Citation: Sawaura R, Kimura Y and Kubo MO (2022) Accuracy of dental microwear impressions by physical properties of silicone materials. Front. Ecol. Evol. 10:975283. doi: 10.3389/fevo.2022.975283
Received: 22 June 2022; Accepted: 16 September 2022;
Published: 20 October 2022.
Edited by:
Ferran Estebaranz-Sánchez, Milá y Fontanals Institution for Research in Humanities (CSIC), SpainReviewed by:
Maria Ana Correia, University of São Paulo, BrazilCopyright © 2022 Sawaura, Kimura and Kubo. This is an open-access article distributed under the terms of the Creative Commons Attribution License (CC BY). The use, distribution or reproduction in other forums is permitted, provided the original author(s) and the copyright owner(s) are credited and that the original publication in this journal is cited, in accordance with accepted academic practice. No use, distribution or reproduction is permitted which does not comply with these terms.
*Correspondence: Ryohei Sawaura, c2F3YXVyYUBnbWFpbC5jb20=; Yuri Kimura, eWtpbXVyYS5yZXNlYXJjaEBnbWFpbC5jb20=; Mugino O. Kubo, bXVnaW5vQGsudS10b2t5by5hYy5qcA==
†These authors have contributed equally to this work
Disclaimer: All claims expressed in this article are solely those of the authors and do not necessarily represent those of their affiliated organizations, or those of the publisher, the editors and the reviewers. Any product that may be evaluated in this article or claim that may be made by its manufacturer is not guaranteed or endorsed by the publisher.
Research integrity at Frontiers
Learn more about the work of our research integrity team to safeguard the quality of each article we publish.