
95% of researchers rate our articles as excellent or good
Learn more about the work of our research integrity team to safeguard the quality of each article we publish.
Find out more
ORIGINAL RESEARCH article
Front. Ecol. Evol. , 04 August 2022
Sec. Models in Ecology and Evolution
Volume 10 - 2022 | https://doi.org/10.3389/fevo.2022.973371
 Xiaoqing Xian1†
 Haoxiang Zhao1†
 Rui Wang1Hongbin Zhang2Baoxiong Chen2Hongkun Huang2
 Wanxue Liu1*
 Fanghao Wan1
Invasive alien plants (IAPs) pose a significant threat to the ecological environment and agricultural production in China. Ageratina adenophora is one of the most aggressive IAPs in China and poses serious ecological and socioeconomic threats. Estimating the distribution pattern of A. adenophora in China can provide baseline data for preventing damage by this weed. In the present study, based on the equilibrium occurrence data of A. adenophora in China and related environmental variables, we used an ensemble model to predict the distribution pattern of A. adenophora in China under climate change. Our findings indicated that true skill statistic (TSS), area under the receiver operating characteristic (ROC) curve (AUC), and Cohen’s Kappa (KAPPA) values for the ensemble model were 0.925, 0.993, and 0.936, respectively. The prediction results of the ensemble model were more accurate than those of the single models. Temperature variables had a significant impact on the potential geographical distribution (PGD) of A. adenophora in China. The total, high, and moderate suitability habitat areas of A. adenophora in China were 153.82 × 10⁴, 92.13 × 10⁴, and 21.04 × 10⁴ km2, respectively, accounting for 16.02, 9.60, and 2.19% of the Chinese mainland area, respectively. The PGD of A. adenophora in China under the current climate is mainly located in southwestern and southeastern China, which are located in the tropical and subtropical zone. The high-suitability habitat areas of A. adenophora decreased under the future climate scenarios, mainly by changing to moderately suitable habitats in Southwest China. The geographical distribution of A. adenophora in southwestern China is currently saturated and will spread to southeastern China under climate change in the future. More attention should be paid to early warning and monitoring of A. adenophora in southeastern China to prevent its further spread.
Invasive alien plants (IAPs) substantially affect natural ecosystems worldwide and are independently or jointly influenced by multiple factors, such as climate warming, enhanced human activities, and global trade integration (Pyšek et al., 2010; Chapman et al., 2016; Petitpierre et al., 2016). Climate warming shifts the distribution pattern of IAPs and promotes plant invasions by increasing the survival rate and providing unoccupied ecological niches (Merow et al., 2017; Turbelin and Catford, 2021). Climate warming has rendered the natural environment more vulnerable to IAPs by intensifying stressors, thereby augmenting the risk of global plant invasions (Turbelin and Catford, 2021). IAPs pose great harm to the ecological environment and agricultural production in China (Weber and Li, 2008; Bai et al., 2013). Among the IAPs, Ageratina adenophora (Spreng.) R.King & H.Rob. pose a great threat to farmland, grassland, and forestry ecosystems in China (Liu et al., 2012; Li et al., 2019). Rapid climate warming has increased their long-term negative impacts (Tu et al., 2021). Therefore, the distribution patterns of IAPs under climate warming conditions must be elucidated to formulate early warning, prevention, and control strategies in China.
Ageratina adenophora (Asteraceae; synonym: Eupatorium adenophorum Spreng.; common name: crofton weed), an aggressive IAP worldwide, is native to Mexico, and widely distributed in Asia, Oceania, Africa, and Europe (Poudel et al., 2019). Ageratina adenophora was as an ornamental plant introduced to the United Kingdom (Europe) in 1826 (Auld and Martin, 1975). Each plant produces more than 10,000 seeds, which can disperse rapidly by wind or water, and also get mixed in with agricultural products intended for export (Wang et al., 2011). Ageratina adenophora can grow up to a height of 2 m, and produced apomictically without fertilization (Parsons and Cuthbertson, 2001). It was suitable for roadsides, railway embankments, banks of water bodies, crop fields, grasslands, plantations and forests (Liu et al., 2007; Baral et al., 2017). In the 1940s, A. adenophora successfully invaded southwestern China (Yunnan Province) (Yan et al., 2000). Currently, this plant is widely distributed in Yunnan, Sichuan, Chongqing, Guizhou, and Guangxi (Sang et al., 2010), and has reduced the local biodiversity (Lu et al., 2006), destroyed the ecological community structure (Fu et al., 2018), and impeded the development of agriculture, forestry, and animal husbandry in southwestern China (Poudel et al., 2019). Therefore, it was listed as a key management IAP under the administration of the Ministry of Agriculture and Rural Affairs, Ministry of Natural Resources, and Ministry of Ecology and Environment. Clarifying the distribution pattern of A. adenophora using equilibrium occurrence data under climate change can accurately illustrate the dynamics of its potential geographical distribution (PGD) and guide its prevention and control in China.
Species distribution models (SDMs), including the maximum entropy model (Maxent), CLIMEX, generalized linear model (GLM), genetic algorithm for rule-set prediction (GARP), multiple adaptive regression spline (MARS) model, surface range envelope (SRE), flexible discriminant analysis (FDA), categorical regression tree analysis (CTA), gradient boosting model (GBM), random forest (RF), and artificial neural network (ANN) (Lantschner et al., 2019), are powerful tools for identifying the PGD of IAPs under current and future climate change (Bazzichetto et al., 2018; McMahon et al., 2021). The Biomod platform, developed in 2003, is generally used to improve the accuracy of the prediction results of SDMs (Thuiller et al., 2003). Numerous studies have identified the PGD of IAPs using a single SDM or ensemble model (EM) in the current biomod2 platform (César de Sá et al., 2019; Fang et al., 2021). Previous studies frequently used a single model, such as the Maxent or GARP, for predicting the PGD of IAPs (Qin et al., 2015; Thapa et al., 2018). In subsequent studies, the EM gained increasing interest for predicting the PGD of IAPs as it provided more reliable results than the single models (Gong et al., 2020; Lázaro-Lobo et al., 2021).
The present study used eight single models and the EM to predict the PGD of A. adenophora in China under current and future climate change. We formulate the hypothesis that the PGD of A. adenophora in southwestern China was saturated, and will shift to higher latitude areas in the future. Therefore, we (1) selected SDM as the optimal model, which showed high precision following a simulation test; (2) analyzed the significant environmental variables affecting the PGD of A. adenophora; (3) predicted the PGD of A. adenophora under the current climate and four future climate change scenarios in the 2050s and 2070s using the optimal model; and (4) analyzed the changes in the PGD and distributional centroids of the high-suitability habitat of A. adenophora between the current and the 2050s and 2070s climate conditions. Our results can help identify prevention and control strategies for A. adenophora infestation in China.
The 20 occurrences of A. adenophora were obtained from the Global Biodiversity Information Facility (GBIF, http://www.gbif.org/), the 56 occurrences of A. adenophora were obtained from Chinese Virtual Herbarium (CVH, http://www.cvh.ac.cn), the 80 occurrences of A. adenophora were obtained from National Specimen Information Infrastructure (NSII, http://www.nsii.org.cn), and the 2620 occurrences of A. adenophora were obtained from our field survey data. Finally, the total of 2776 occurrences of A. adenophora in China were obtained from online databases and our field survey data in China. We thereafter selected the occurrence data in the database since 1940, andremoved the occurrence data that did not have detailed geographic information. ENMTools was used to screen the occurrence data so that only one distribution point was retained within each 5 km × 5 km raster (Warren et al., 2010). Finally, we obtained 2,484 occurrences of A. adenophora for modeling the PGD in China using SDMs (Figure 1).
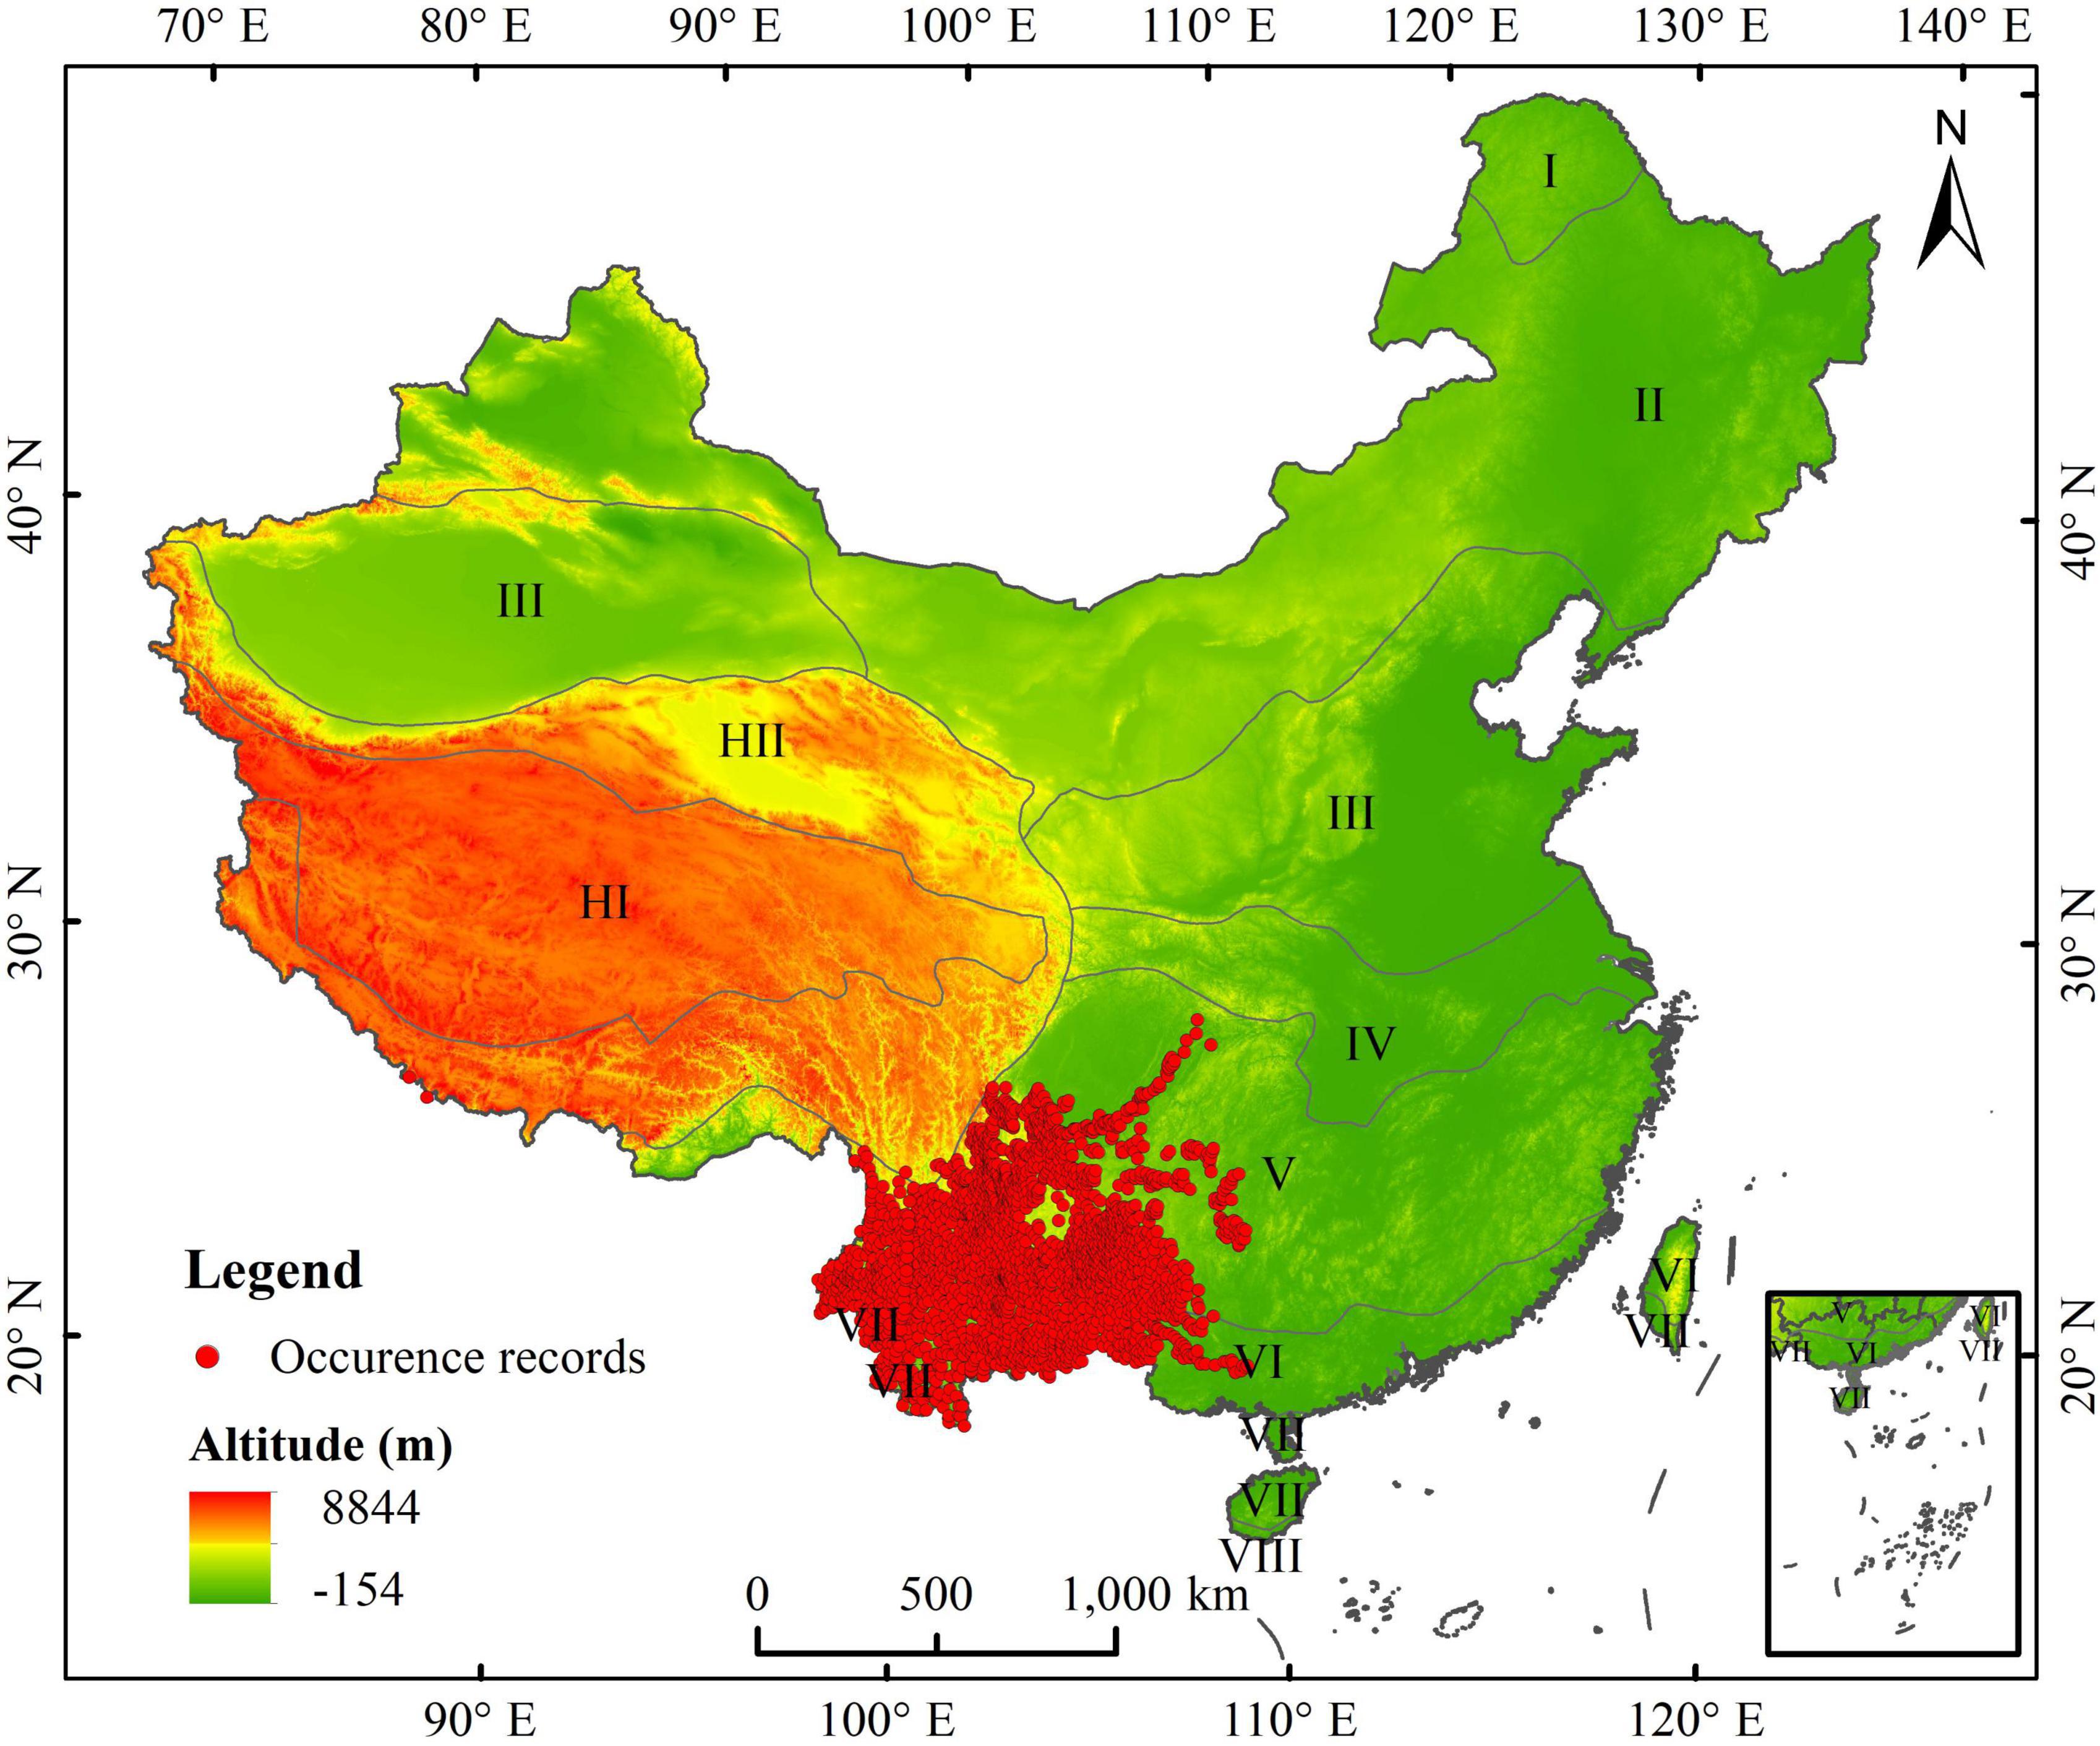
Figure 1. Occurrence data of Ageratina adenophora in China, comprehensively obtained from online databases and field surveys. I: cool temperate zone; II: middle temperate zone; III: warm temperate zone; IV: north subtropical zone; V: middle subtropical zone; VI: south subtropical zone; VII: edge of tropical zone; IX: equatorial tropical zone; HI: subfrigid zone of plateau; HII: temperate zone of plateau.
We obtained the current climate data from the PaleoClim database (http://www.paleoclim.org) with a resolution of 2.5’(Brown et al., 2018). The dataset of parameters based on high-resolution monthly temperature and precipitation values for 1979-2013 is broadly used in ecological applications worldwide. Future climate data, and altitude data were downloaded from the WorldClim database version 1.4 (http://www.worldclim.org) (Hijmans et al., 2005). The current and future climate data included 19 bioclimatic variables (Table S1). The future climate data with the Community Climate System Model (CCSM) 4.0 for the 2050s and the 2070s included two representative concentration pathways (RCP2.6 and RCP8.5). Multicollinearity between the bioclimatic and altitude variables can result in model overfitting. Therefore, we used ENMTools to calculate the correlation coefficients of bioclimatic and altitude variables (Warren et al., 2010). For two environmental variables with a correlation coefficient greater than 0.8 (| r| > 0.8), the more meaningful one was retained (Supplementary Figure 1). Finally, eight environmental variables were retained: mean diurnal range (bio2), isothermality (bio3), minimum temperature of the coldest month (bio6), temperature annual range (bio7), mean temperature of the warmest quarter (bio10), precipitation seasonality (coefficient of variation) (bio15), precipitation of the coldest quarter (bio19), and altitude.
In the present study, based on the occurrence data and environmental variables, we modeled the PGD of A. adenophora under climate change using eight different algorithms (GLM, GBM, CTA, ANN, SRE, FDA, RF, and MaxEnt) in the biomod2 package (Thuiller et al., 2016) in R Studio 4.1.3. For each modeling process, 75% of the distribution records were randomly selected as the training dataset while the remaining 25% were used as the testing dataset. The division of the training and testing data was repeated five times. In addition, 1,000 pseudoabsence points were randomly selected; this process was repeated three times. Finally, 120 models were obtained. After assessing the accuracy of the eight models, we selected four individual models with average values exceeding 0.9 to construct an EM. We then predicted the PGD of A. adenophora under various climate change conditions using the constructed EM.
In general, the true skill statistic (TSS), area under the receiver operating characteristic (ROC) curve (AUC), and Cohen’s Kappa (KAPPA) values are used to evaluate model accuracy. TSS considers the missing average error and is unaffected by the size of the verification dataset (Allouche et al., 2006). The ROC curve is an acceptance curve, with the horizontal coordinate indicating the false-positive rate (1-specificity) and the vertical coordinate indicating the true-positive rate (1-omission rate) (Peterson et al., 2008). KAPPA is affected by the incidence of occurrence data and thresholds, and determines the accuracy of predictions relative to random occurrences (Monserud and Leemans, 1992). Generally, the higher the values of these three indicators, the higher is the accuracy of the species distribution model results.
From the results of the EM, the ASCII raster layer was generated based on the probability (P) of the presence of A. adenophora, which ranged from 0 to 1,000. Finally, the PGD of A. adenophora was classified into four types using ArcGIS: high-suitability habitat (500 ≤ P ≤ 1000), moderate-suitability habitat (300 ≤ P < 500), low-suitability habitat (100 ≤ P < 300), and unsuitable habitat (0 ≤ P < 100).
The shifts in the distributional centroids of highly suitable habitat were used the species distribution model tool (SDM tool, http://www.sdmtoolbox.org) to detect between current and future climate. SDM tool can be integrated into ArcGIS software for calculating, which can analyze the shifts in the distributional centroids under different climate scenarios (Brown, 2014). The threshold of distributional centroids was the threshold of high-suitability habitat.
In the present study, we calculated the evaluation accuracy of various species distribution models, including GLM, GBM, CTA, ANN, SRE, FDA, RF, MaxEnt, and EM. For A. adenophora, our results indicated that GLM, GBM, FDA, and RF were more accurate than CTA, ANN, SRE, and MaxEnt (Figure 2). The mean TSS values for GLM, GBM, FDA, and RF were 0.891, 0.892, 0.886, and 0.895, respectively. The mean AUC values for GLM, GBM, FDA, and RF were 0.961, 0.963, 0.950, and 0.961, respectively. The mean KAPPA values for GLM, GBM, FDA, and RF were 0.926, 0.925, 0.921, and 0.927, respectively. Therefore, we selected these four models to construct the ensemble model (EM). The mean TSS, AUC, and KAPPA values for the EM were 0.925, 0.993, and 0.936, respectively. Our results indicated that the EM improved fitting accuracy and reduced fitting uncertainty. In other words, the PGD of A. adenophora predicted using EM was more reliable than that predicted using the single models.
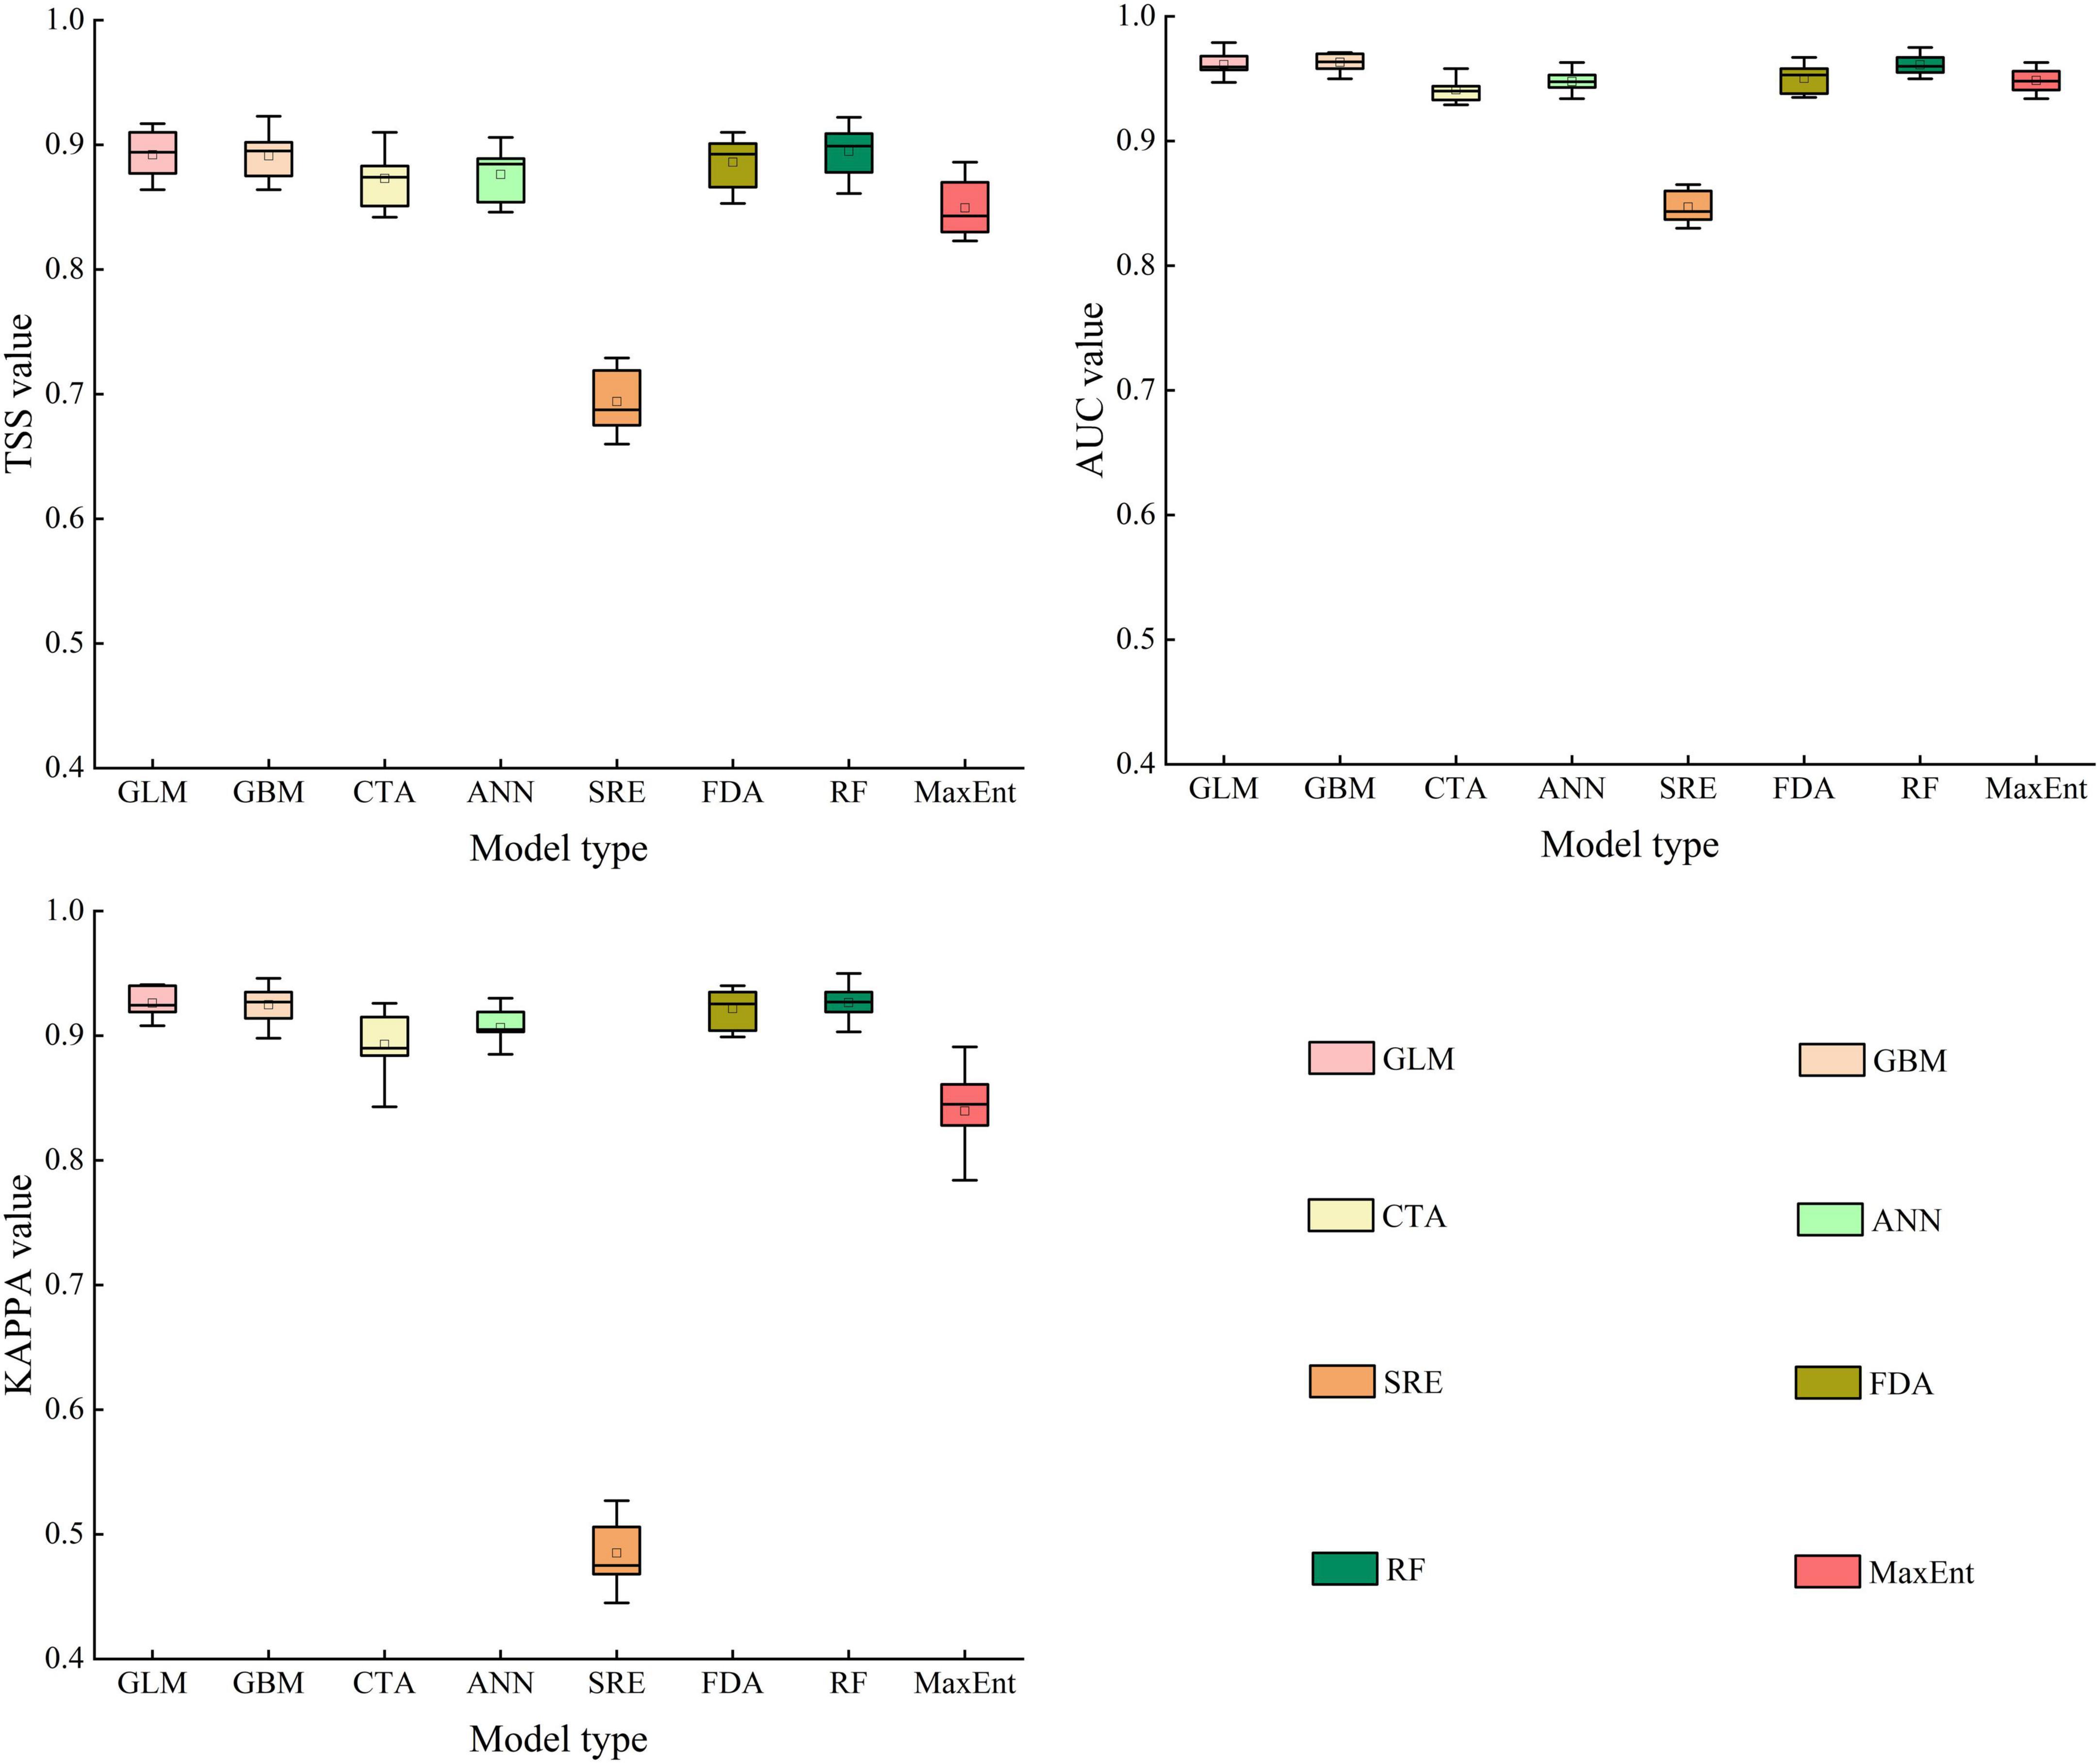
Figure 2. True skill statistics (TSS), area under the receiver operating characteristic curve (AUC), and Cohen’s Kappa (KAPPA) values of the species distribution models.
We estimated the contribution values of each environmental variable using GLM, GBM, FDA, and RF, and analyzed the variables that significantly affected the PGD of A. adenophora. Our results indicated that the top three environmental variables with the highest mean contribution values were the temperature annual range (bio7, 0.449), mean diurnal range (bio2, 0.302), and minimum temperature of the coldest month (bio6, 0.297) in the GLM, Fugure 3A; the temperature annual range (bio7, 0.522), minimum temperature of the coldest month (bio6, 0.061), and precipitation of the coldest quarter (bio19, 0.042) in the GBM, Fugure 3B; the minimum temperature of the coldest month (bio6, 0.501), temperature annual range (bio7, 0.321), and precipitation of the coldest quarter (bio19, 0.072) in the FDA, Fugure 3C; and the temperature annual range (bio7, 0.320), minimum temperature of the coldest month (bio6, 0.138), and mean diurnal range (bio2, 0.034) in the RF (Fugure 3D). In summary, the significant environmental variables affecting the PGD of A. adenophora were the mean diurnal range (bio2), minimum temperature of the coldest month (bio6), temperature annual range (bio7), and precipitation of the coldest quarter (bio19).
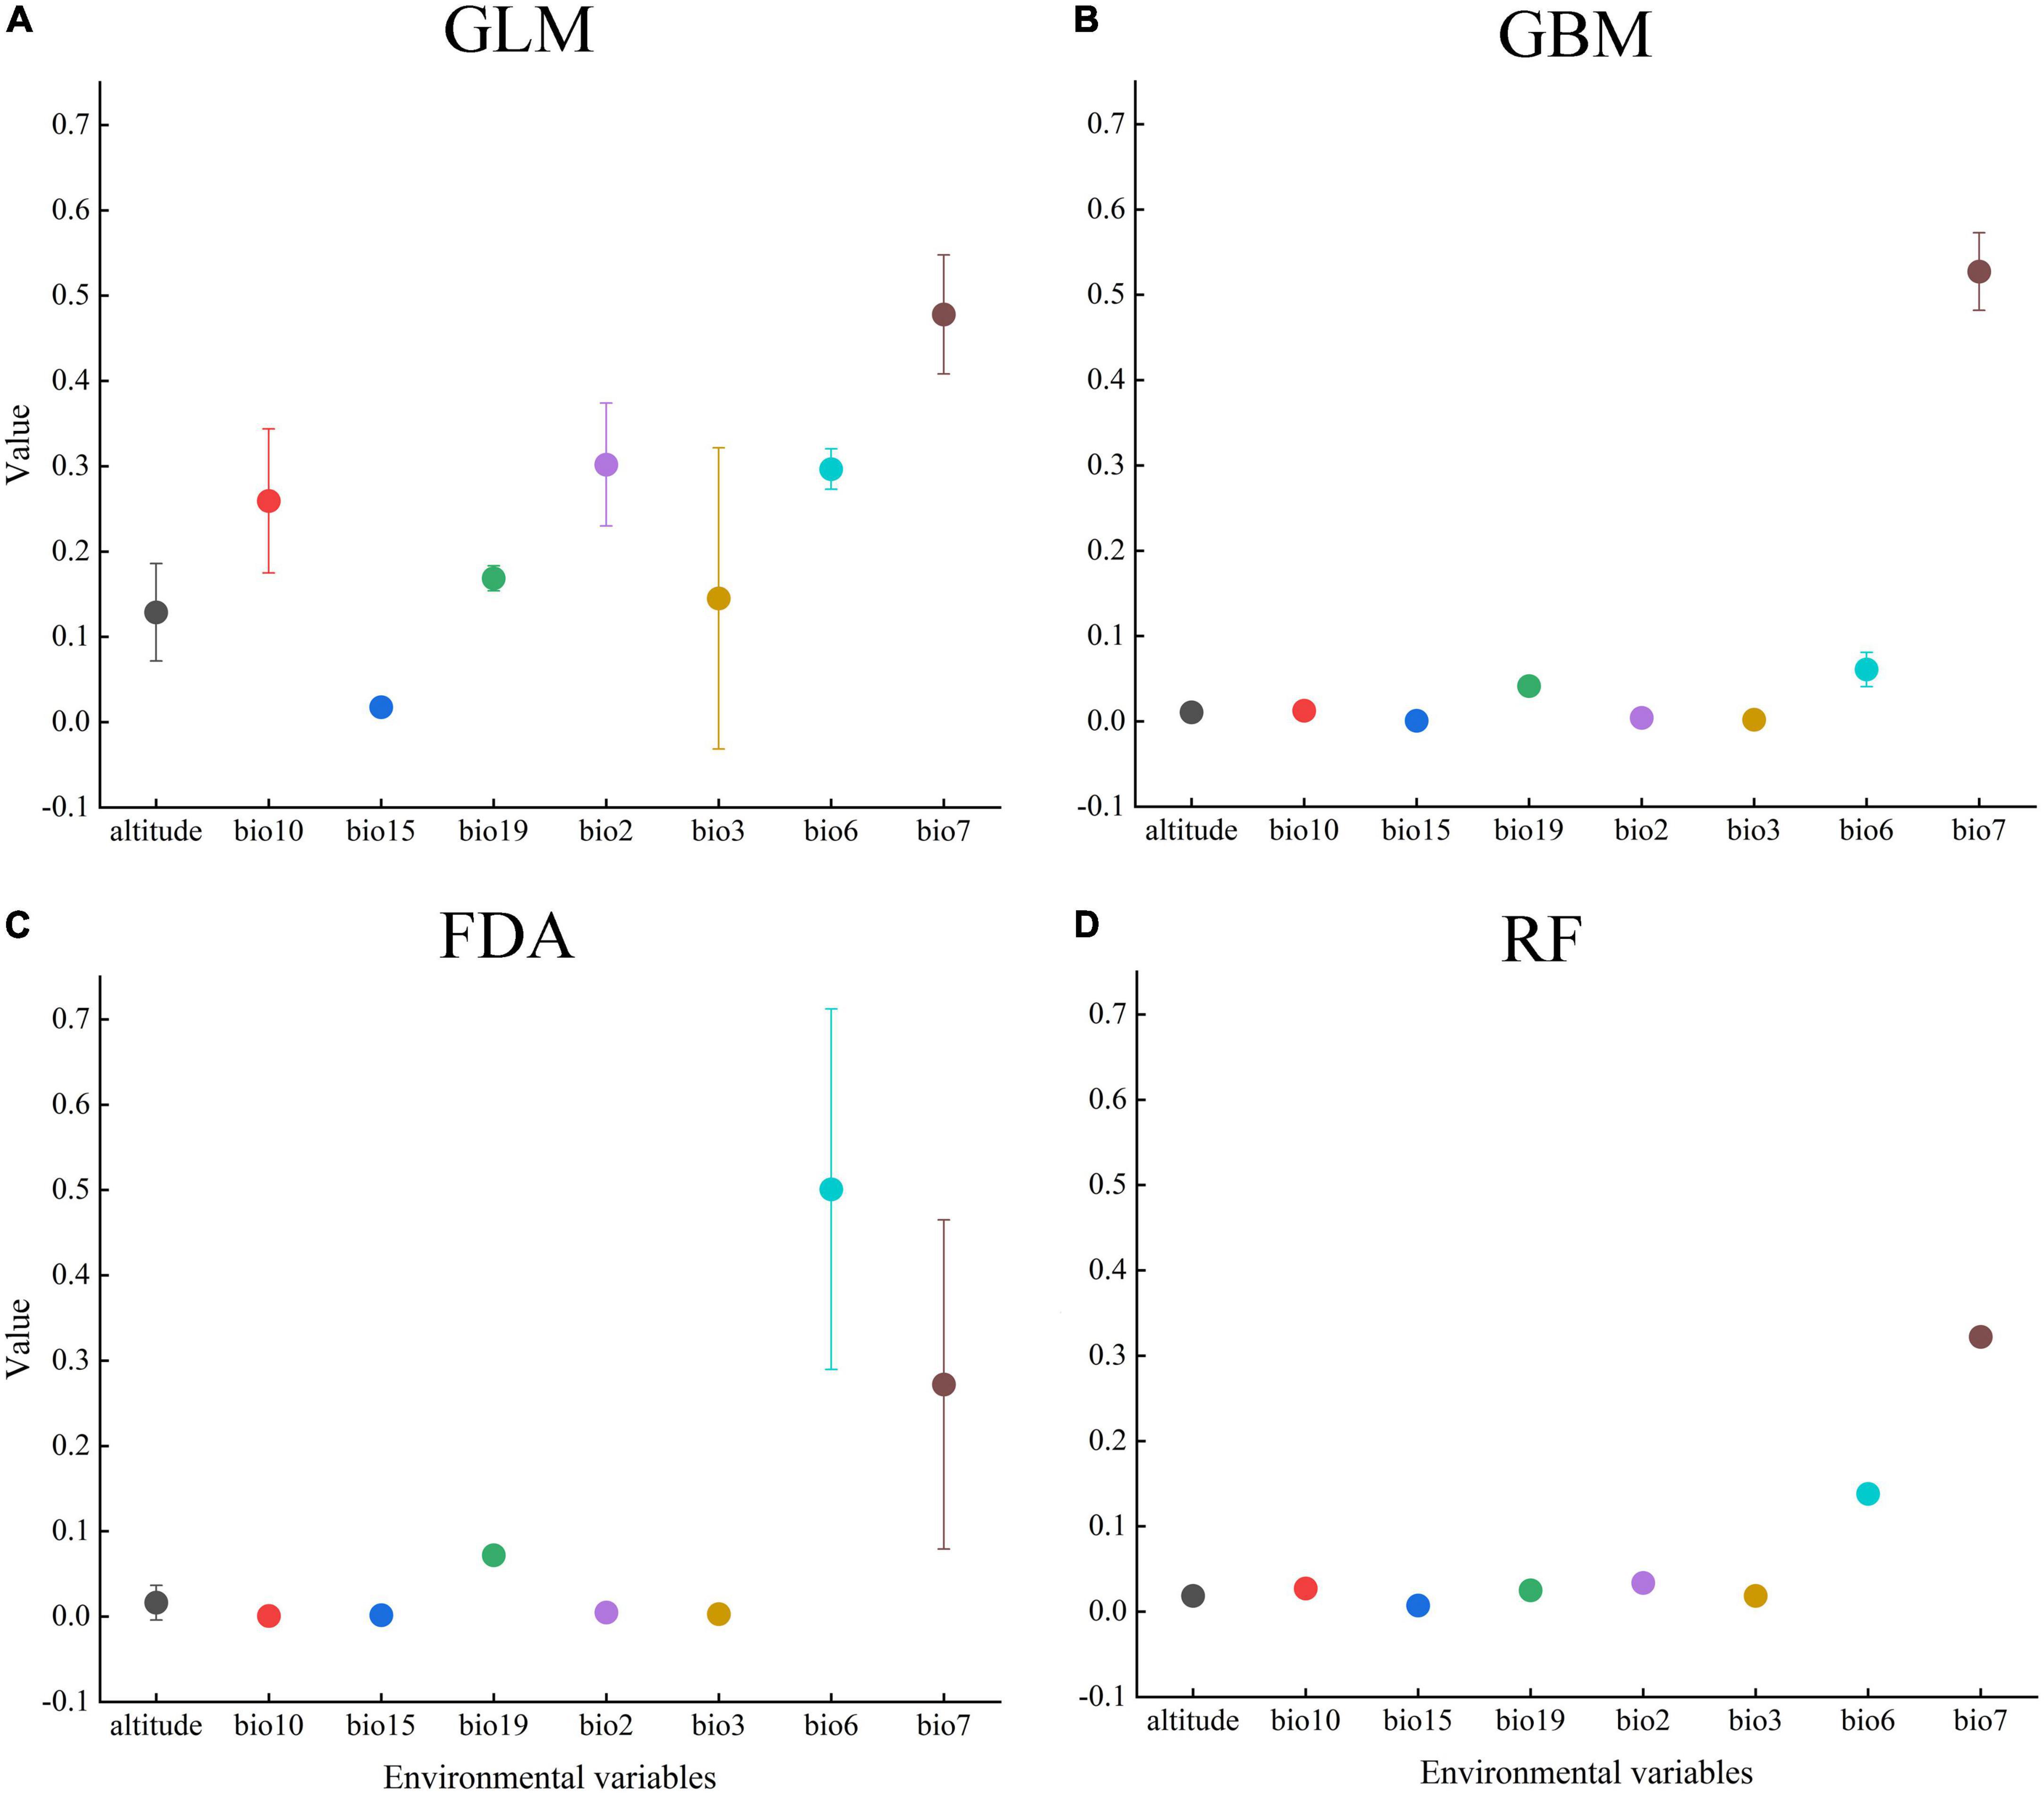
Figure 3. Contribution values of the environmental variables in (A) (GLM), (B) (GBM), (C) (FDA), and (D) (RF).
We predicted the PGD of A. adenophora in China under the current climate based on nine SDMs in biomod2 (Figure 4). Our results indicated that the PGD of A. adenophora predicted using the GLM, GBM, FDA, RF, and EM was more consistent with the actual geographic distribution than that predicted using the other SDMs. The accuracy of the EM based on TSS, AUC, and KAPPA was higher than that of GLM, GBM, FDA, and RF. Therefore, we selected the PGD of A. adenophora predicted using the EM to analyze its PGD in China under the current climate (Figure 4I). The PGD of A. adenophora under the current climate was mainly distributed in southwestern and southeastern China under different climate zones, such as the tropical edge, north subtropical, middle subtropical, and south subtropical zones. The total, high, and moderate suitability habitat areas of A. adenophora in China were 153.82 × 10⁴, 92.13 × 10⁴, and 21.04 × 10⁴ km2, respectively, accounting for 16.02, 9.60, and 2.19% of the Chinese mainland area, respectively.
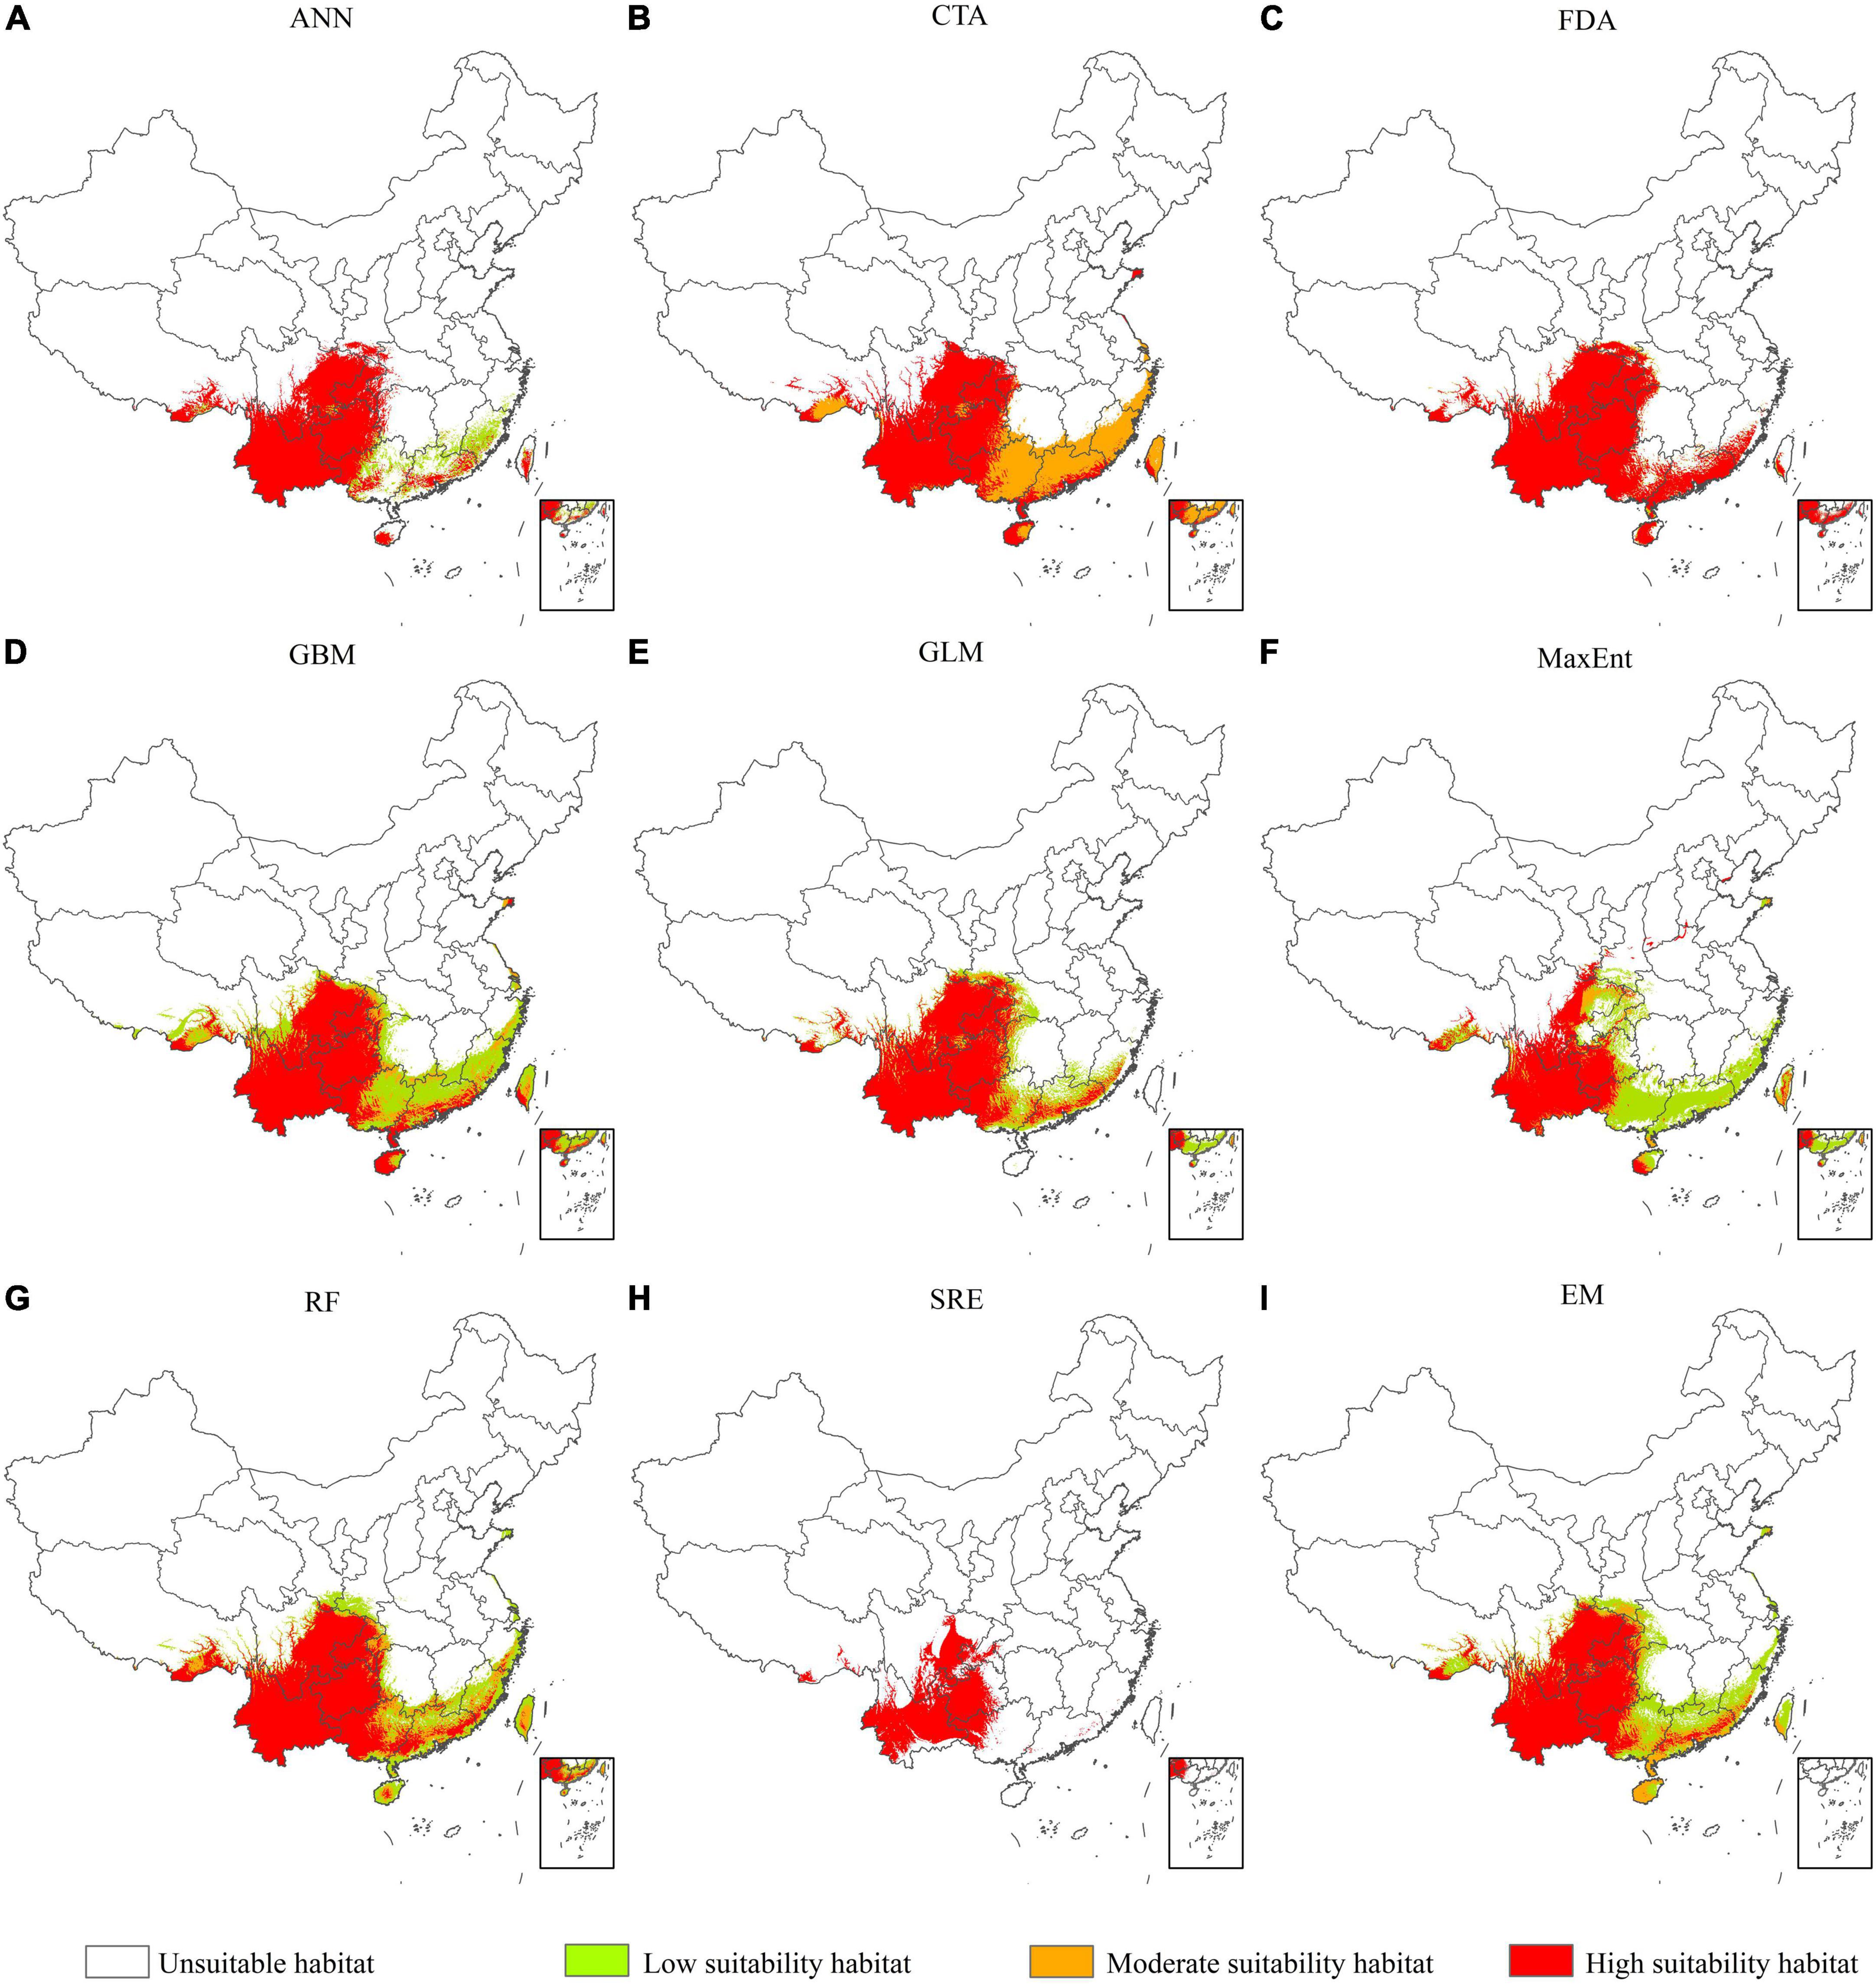
Figure 4. Potential geographical distribution of A. adenophora in China under current climate conditions based on nine species distribution models (A-I).
The PGD of A. adenophora under RCP2.6 and RCP8.5 in the 2050s and the 2070s are presented in Figure 5. The gain, loss, and stable areas of highly suitable habitat were shown in Supplementary Figure 2. The PGD of A. adenophora under the future climate change scenarios was also distributed in Southwest and Southeast China. The range of high-suitability habitats for A. adenophora under the current climate was quite different from that under the future climate. The highly suitable habitat in Southwest China, which was distributed at the edge of the tropical and middle subtropical zones, shifted to moderately suitable habitat under the future climate change.
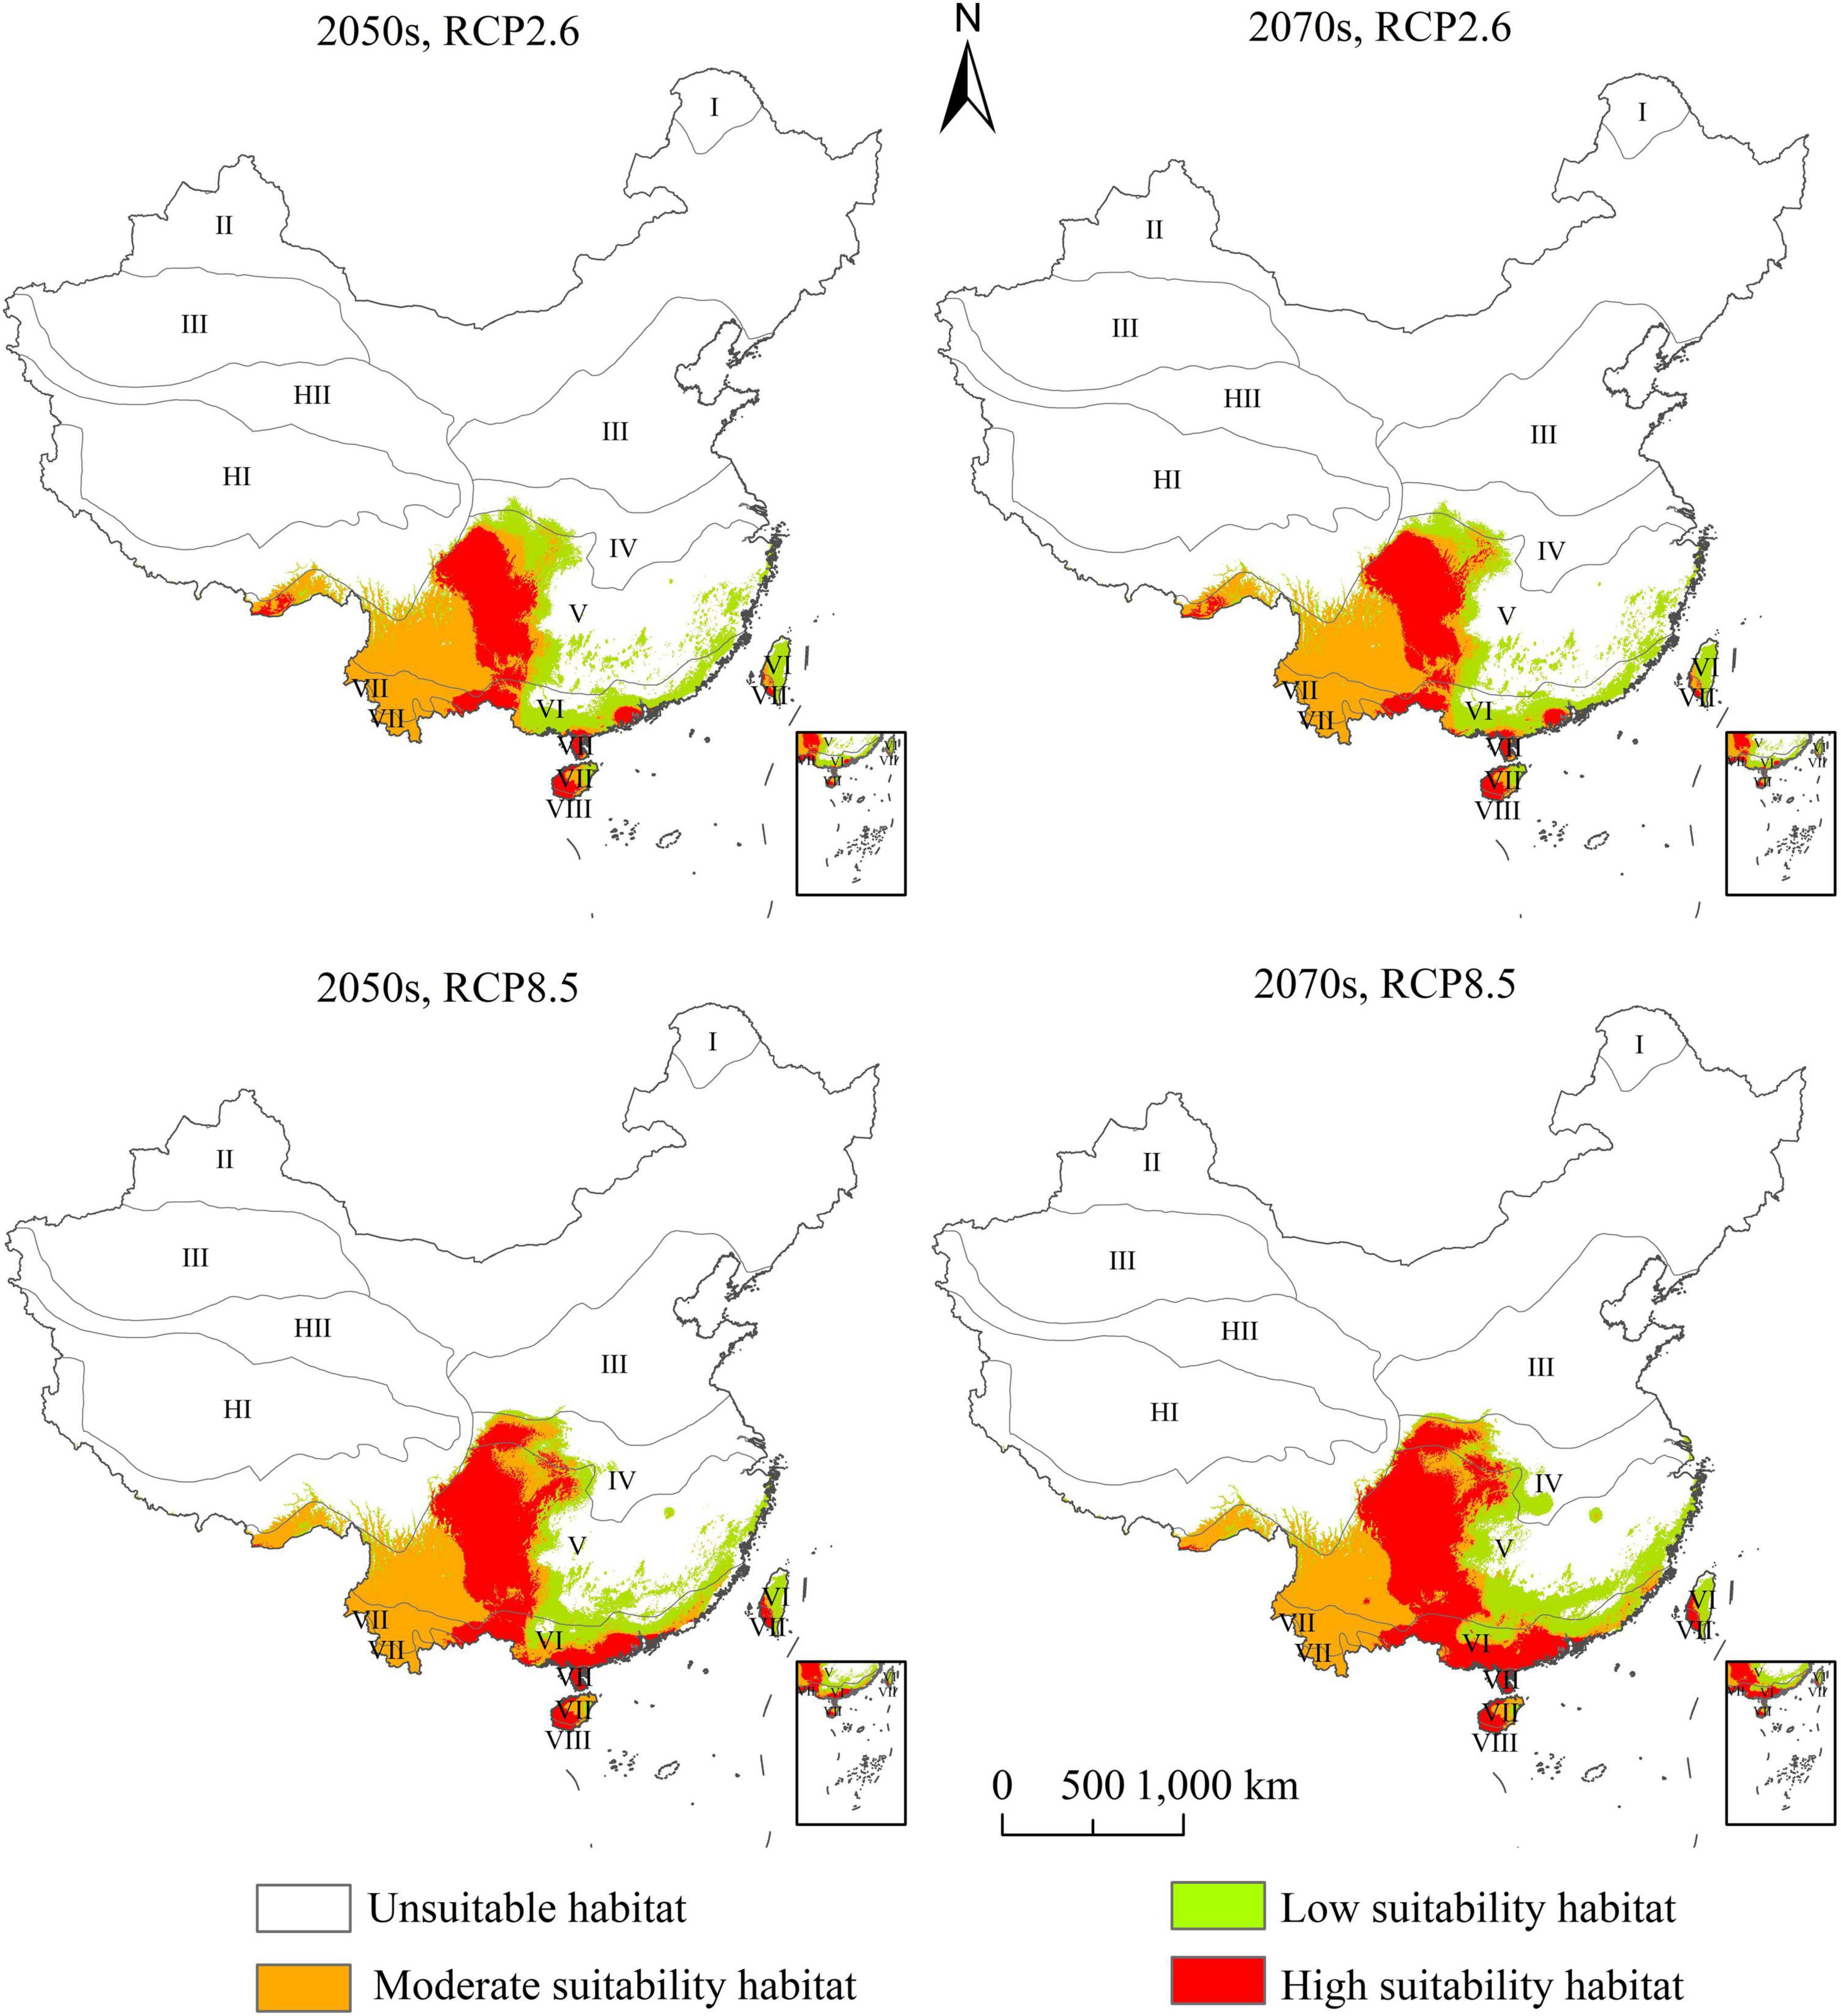
Figure 5. Potential geographical distribution of Ageratina adenophora in China under future climate based on the ensemble model.
The low-suitability habitat areas of A. adenophora for the 2050s and 2070s were 36.57 × 10⁴ and 34.24 × 10⁴ km2, respectively, under RCP2.6 (accounting for 3.81 and 3.57% of the Chinese mainland area, respectively), and 35.41 × 10⁴ and 40.59 × 10⁴ km2, respectively, under RCP8.5 (accounting for 3.69, and 4.23% of the Chinese mainland area, respectively). The low-suitability habitat areas showed a decreasing trend from the current to the 2050s and the 2070s, and decreased significantly under RCP2.6 in the 2070s (Figure 6).
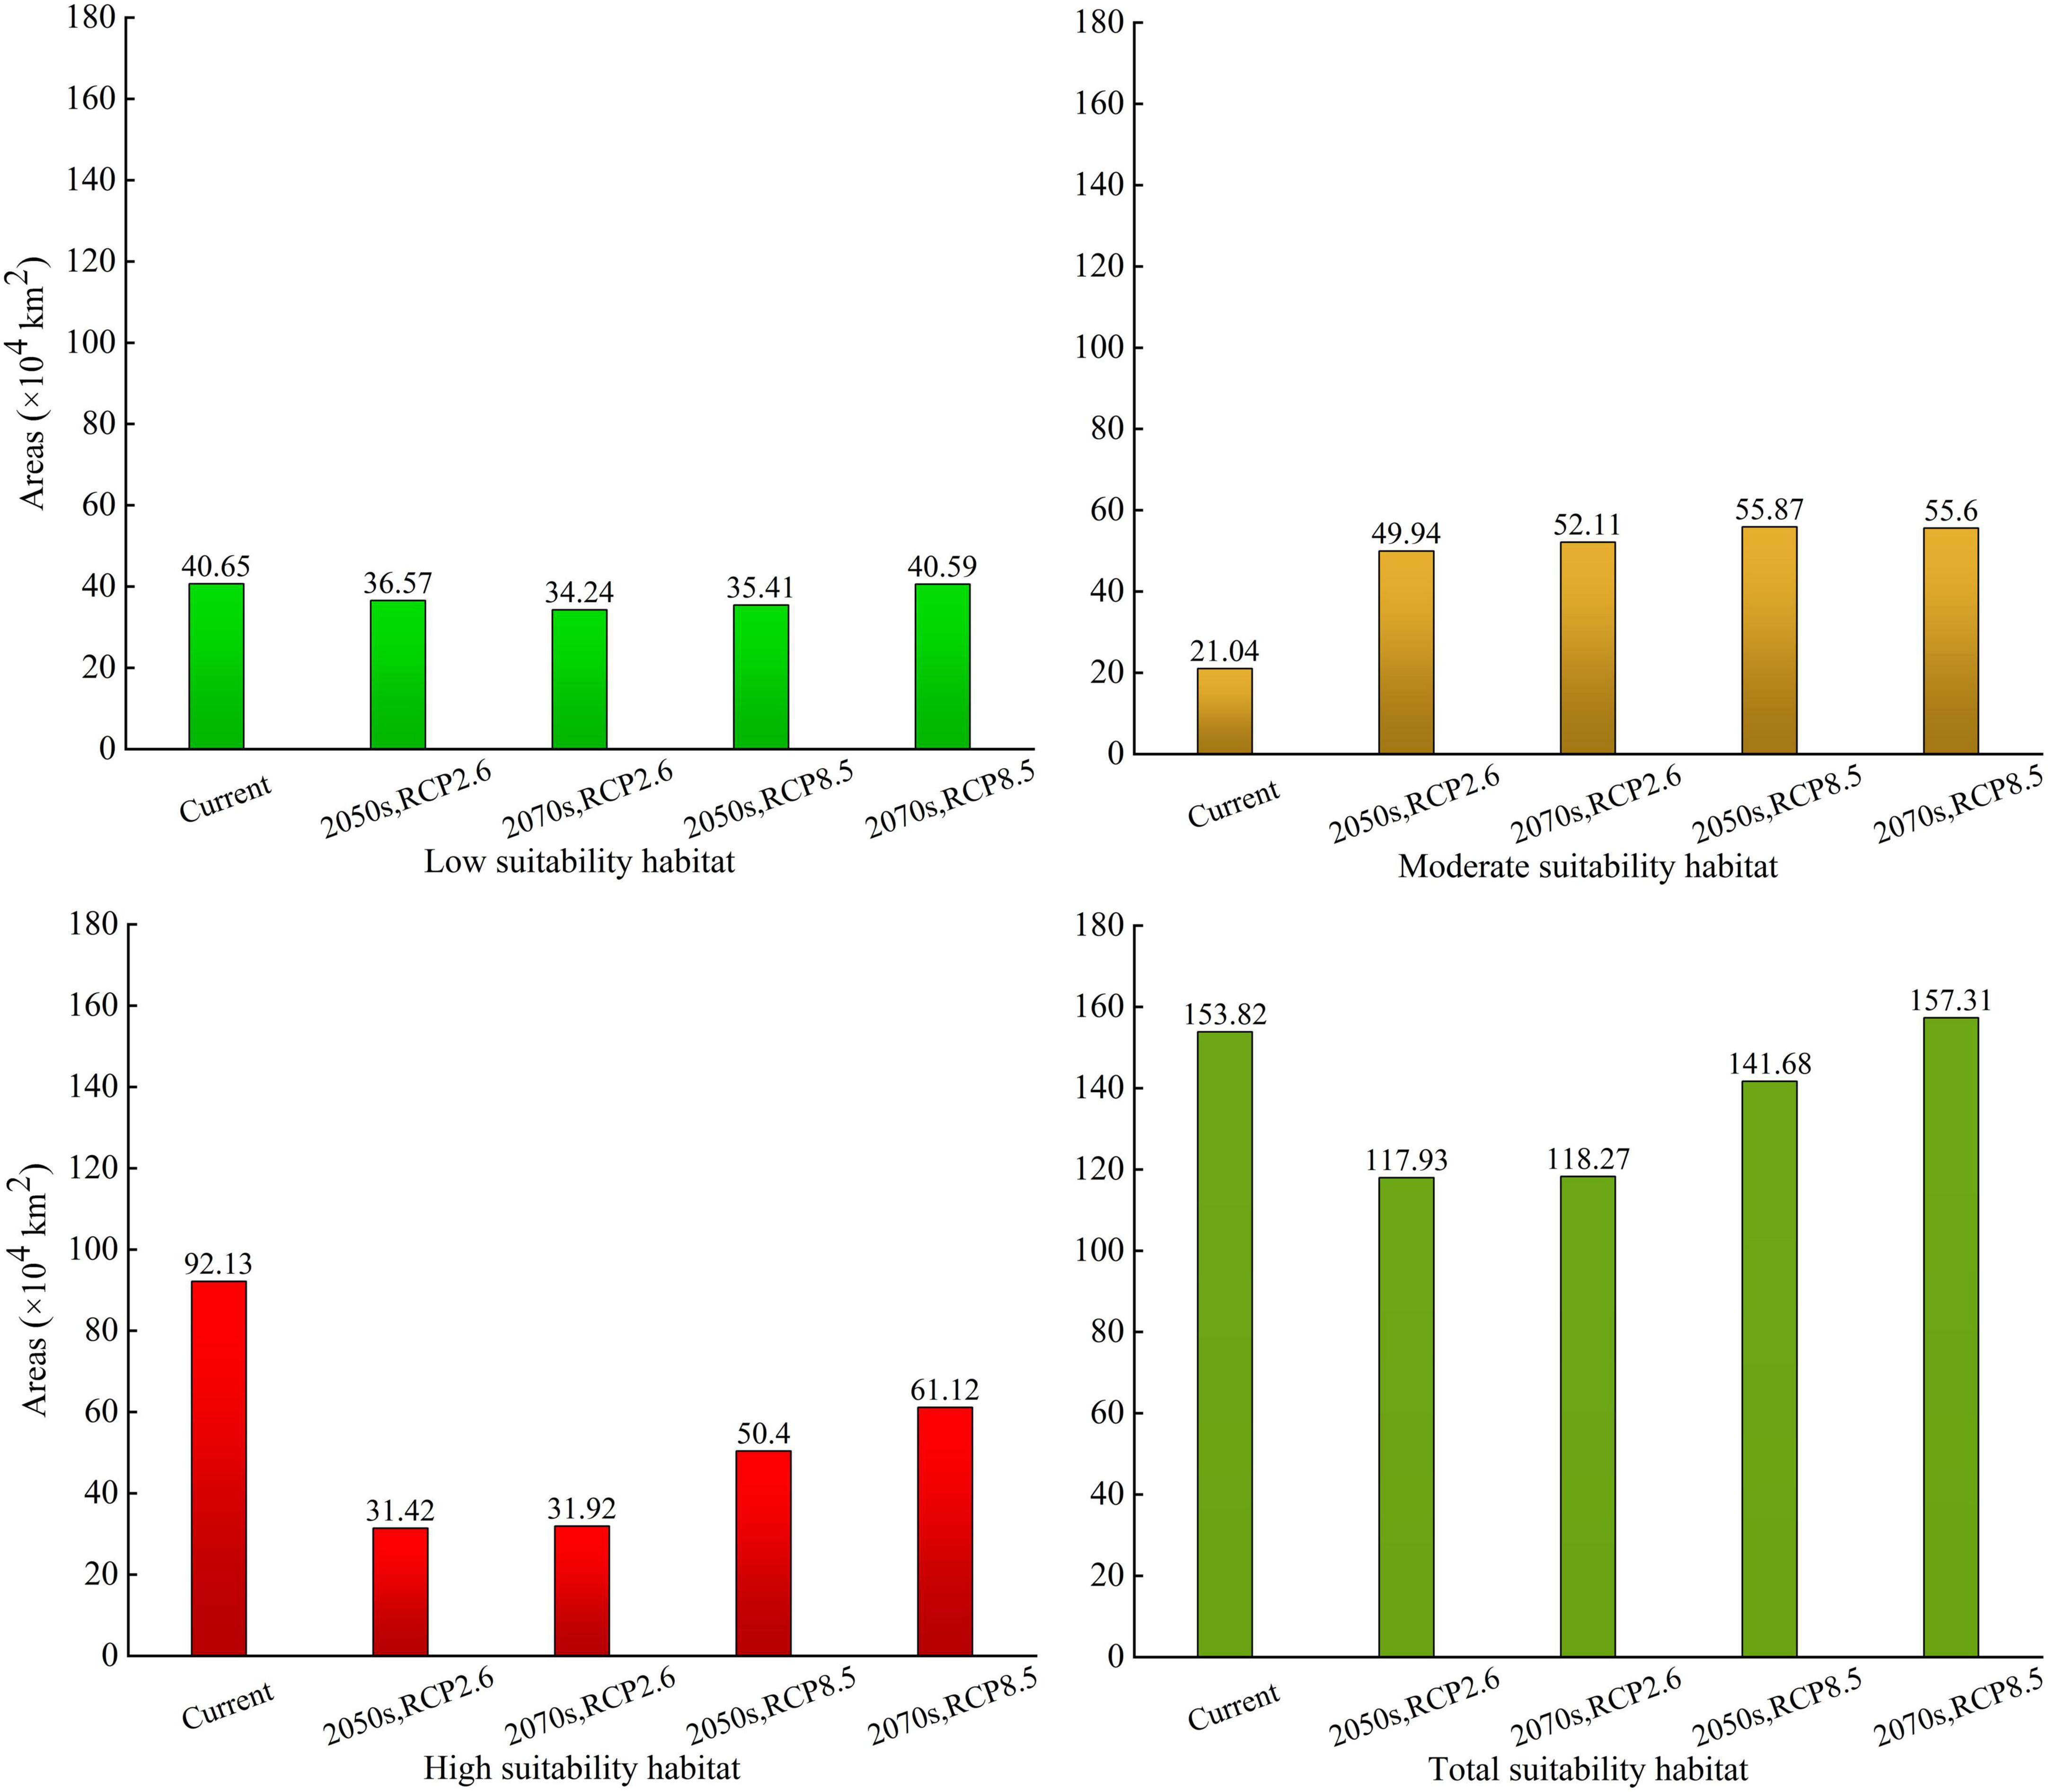
Figure 6. The suitability habitat areas of Ageratina adenophora in China under current and future climate conditions based on the ensemble model.
The moderate-suitability habitat areas of A. adenophora for the 2050s and 2070s were 49.94 × 10⁴ and 52.11 × 10⁴ km2, respectively, under RCP2.6 (accounting for 5.20 and 5.43% of the Chinese mainland area, respectively), and 55.87 × 10⁴ and 55.6 × 10⁴ km2, respectively, under RCP8.5 (accounting for 5.82 and 5.79% of the Chinese mainland area, respectively). The moderate-suitability habitat areas showed an increasing trend from the current to the 2050s and the 2070s, and increased significantly under RCP8.5 in the 2050s (Figure 6).
The high-suitability habitat areas of A. adenophora for the 2050s and 2070s were 31.42 × 10⁴ and 31.92 × 10⁴ km2, respectively, under RCP2.6 (accounting for 3.27 and 3.33% of the Chinese mainland area, respectively), and 50.4 × 10⁴ and 61.12 × 10⁴ km2, respectively, under RCP8.5 (accounting for 5.25 and 6.37% of the Chinese mainland area, respectively). The high-suitability habitat areas showed a decreasing trend from the current to the 2050s and the 2070s, and decreased significantly under RCP2.6 in the 2050s (Figure 6).
The total-suitability habitat areas of A. adenophora for the 2050s and 2070s were 117.93 × 10⁴ and 118.27 × 10⁴ km2, respectively, under RCP2.6 (accounting for 12.28 and 12.32% of the Chinese mainland area, respectively), and 141.68 × 10⁴ and 157.31 × 10⁴ km2, respectively, under RCP8.5 (accounting for 14.76 and 16.39% of the Chinese mainland area, respectively). Compared with the current climate, the total-suitable habitat areas in the 2050s under RCP2.6 and RCP8.5, and the 2070s under RCP2.6, showed a decreasing trend, and decreased significantly in the 2050s under RCP2.6. Under RCP8.5, the total suitability habitat area in the 2070s increased compared to that in the current climate.
The centroid of the high-suitability habitat was determined to be located at the point with coordinates 104.35°E, 26.77°N under the current climate. In the 2050s, under RCP2.6 and RCP8.5, the centroid of the high suitability habitat shifted from its current position to 105.83°E, 26.95°N, and 105.85°E, 27.17°N, respectively, shifting 144.33 and 24.86 km, respectively. In the 2070s, under RCP2.6 and RCP8.5, the centroid of the high suitability habitat shifted from its current position to the points with coordinates 106.81°E, 27.23°N and 107.08°E, 27.13°N, respectively, shifting 249.44 and 30.15 km, respectively. Therefore, the centroid of the highly suitable habitat of A. adenophora tended to shift to the northeast and southeast and to higher latitudes under future climate change (Figure 7).
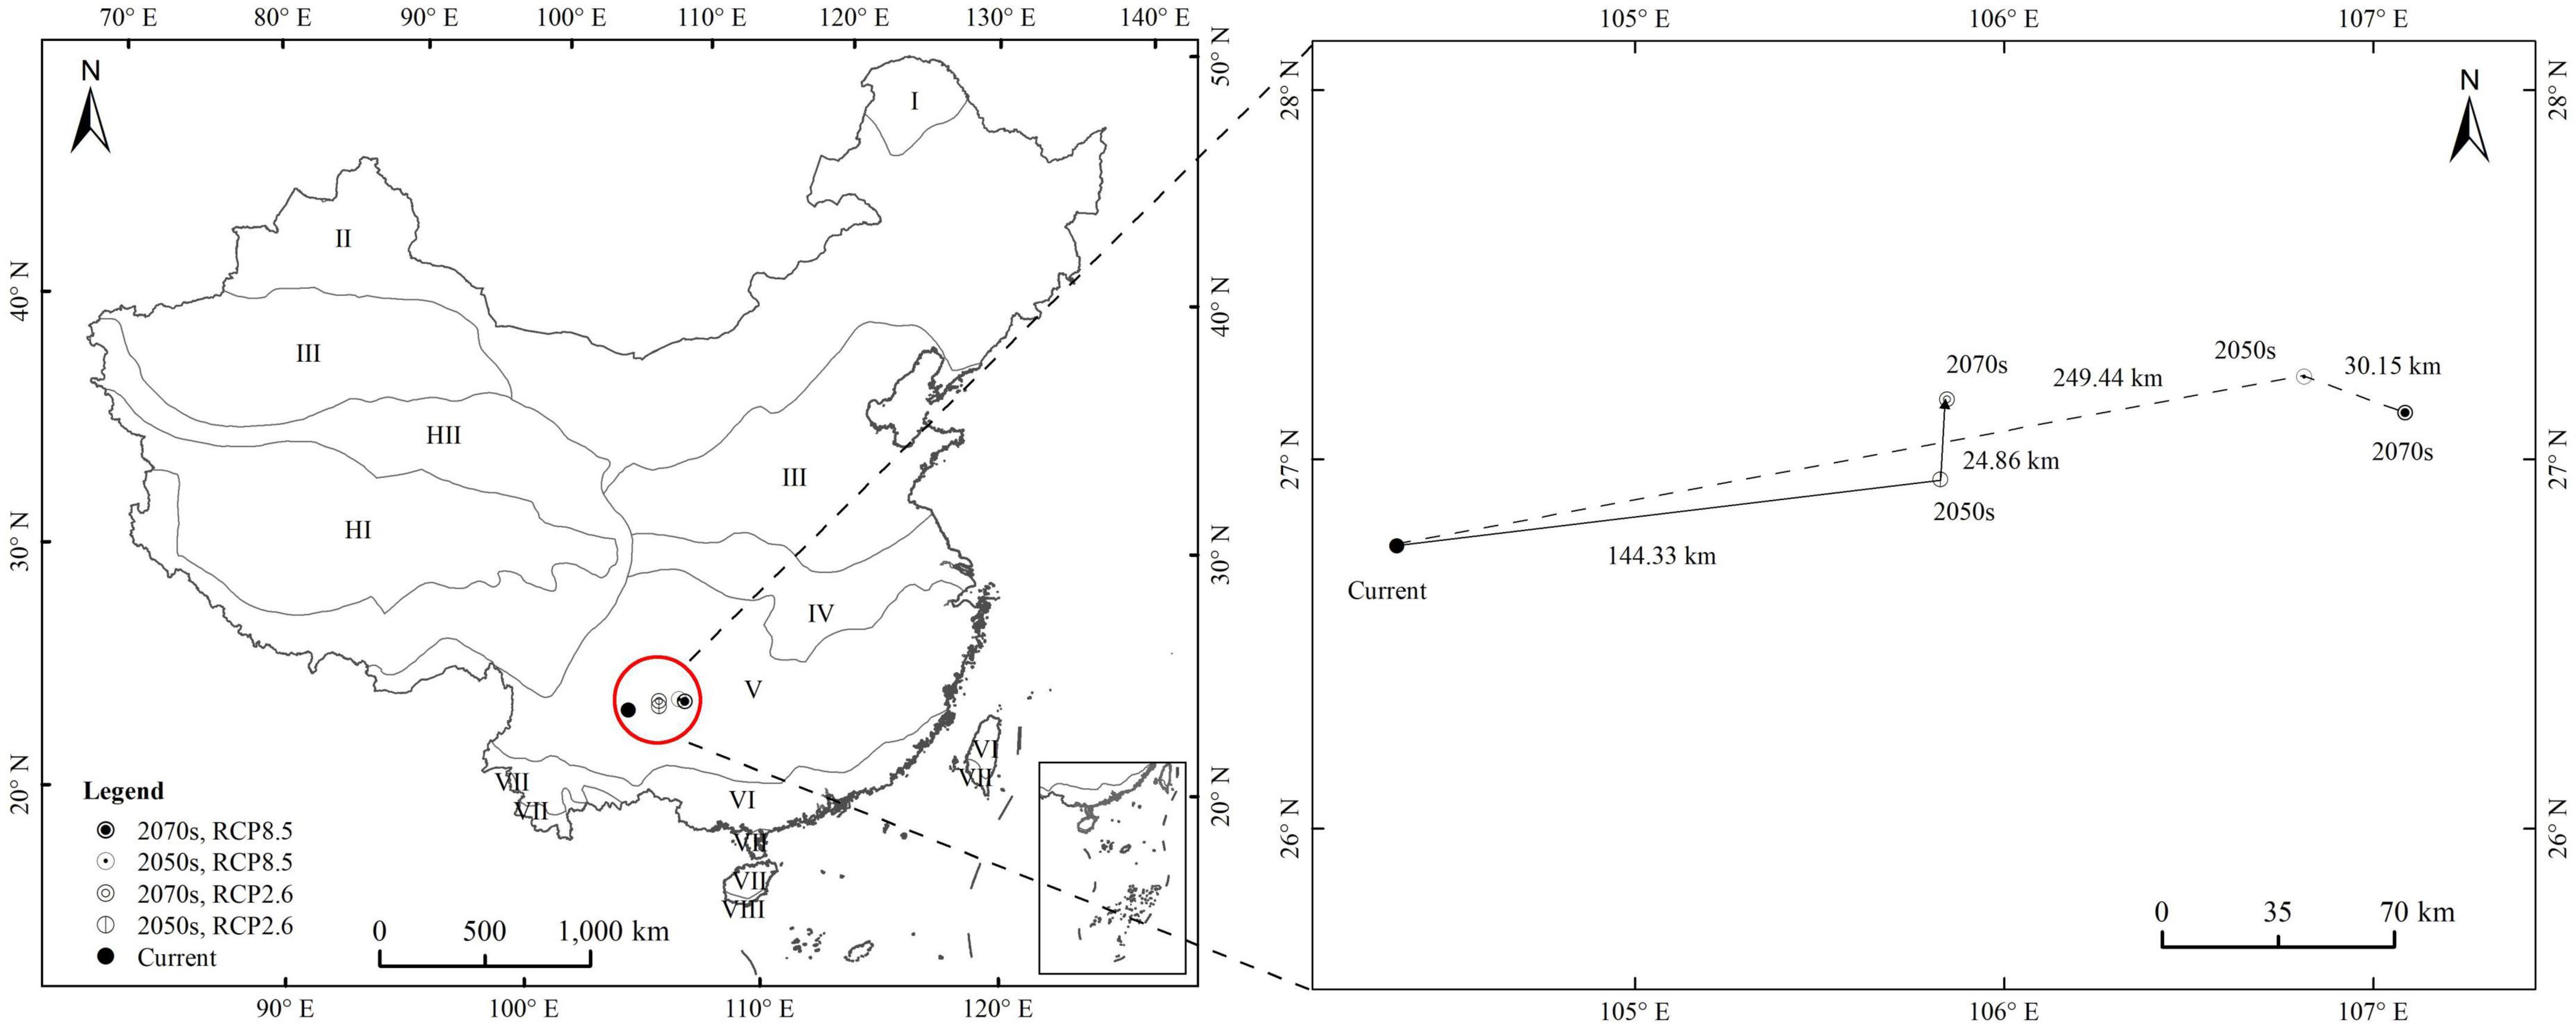
Figure 7. The centroid distribution shifts of Ageratina adenophora under climate change.
SDMs are frequently being used to predict the PGD of IAPs; however, prediction results based on non-equilibrium occurrence data can lead to inaccurate model outputs (Jiménez-Valverde et al., 2008; Briscoe Runquist et al., 2019). The quantity and quality of input data are still crucial issues in terms of the reliability of predictive distributional modeling efforts (Welk, 2004). The non-equilibrium occurrence data of IAPs do not include data representative of all climatic tolerances. When IAPs are still in the process of biological invasion, the background points cannot be used in any SDM to classify locations beyond the existing range of the IAPs as (pseudo) absence data (Václavík and Meentemeyer, 2012). This is because such regions do not represent the absence of IAPs; rather, the IAPs have yet to occupy such regions. Therefore, we should use the equilibrium occurrence data to construct reliable SDMs for predicting the PGD of IAPs. For example, a study on the PGD of Lythrum salicaria in North America based on the currently known occurrence data and the occurrence data recorded before 1988 indicated that it was unreasonable to predict the PGD of this species based on the occurrence data recorded before 1988 (Welk, 2004). In the present study, we used the equilibrium occurrence data of A. adenophora (the occurrence data from online databases and our field survey data until 2021) and the EM constructed using GLM, GBM, and FDA to predict the PGD of A. adenophora under climate change in China. The mean TSS, AUC, and KAPPA values for the EM were 0.925, 0.993, and 0.936, respectively, indicating that the prediction results of this model were accurate. Our findings provide a framework for preventing and controlling the spread of A. adenophora under climate change conditions in China.
In our study, the PGD of A. adenophora was mainly distributed in southwestern and southeastern China, which is also located in the tropical and subtropical zones. The minimum temperature of the coldest month in the PGD of A. adenophora is above −3°C and the annual precipitation is usually between 800 and 1500 mm (Zhen-Feng et al., 2013). Our results indicated that temperature variables, such as the mean diurnal range, minimum temperature of the coldest month, and annual temperature range, were the most important variables affecting the PGD of A. adenophora in China, followed by precipitation (precipitation of the coldest quarter) and altitude. The successful invasion of A. adenophora can be mainly attributed to the synergy of temperature, precipitation, and altitude variables. Suitable environmental variables, including temperature, precipitation, and light, played key roles in the survival and growth of A. adenophora in the invasive zones, and the individuals from invasive populations showed greater plant height, stem diameter, leaf length, leaf breadth, and leaf area than those from native populations (Feng et al., 2009). The epigenetic modifications can lead A. adenophora to spread into the cooler zones of China (Zhu et al., 2007). For instance, A. adenophora preferred lower temperatures in the invasive areas compared with in the native areas (Tererai and Wood, 2014).
Previous studies have indicated that the winter temperature and minimum temperature of the coldest month have a significant impact on the distribution of A. adenophora in China and Nepal (Poudel et al., 2020; Fang et al., 2021). In general, A. adenophora prefers to grow in warm temperature conditions, such as between 10–25°C (Sun et al., 2004; Tererai and Wood, 2014). Compared with the native surroundings, experimental warming enhanced the biomass output and canopy of A. adenophora and decreased its mortality (He et al., 2012). In invasive zones, epigenetic modifications can facilitate the spread of A. adenophora to cooler regions, such that it prefers lower temperatures than normal (Huang et al., 2009). Therefore, temperature changes have a significant effect on the distribution patterns of A. adenophora. In brief, climate warming promotes environmental tolerance of A. adenophora and accelerates its invasion. The findings of these studies further verify the accuracy of our findings. Our findings showed that the precipitation of the coldest quarter also affected the PGD of A. adenophora. Climate change has altered precipitation patterns globally, while also profoundly affecting the invasion process of IAPs, such as increasing the invasibility of the community (Kreyling et al., 2008). Some evidence has shown that shifts in precipitation patterns attributed to climate change have accelerated the invasion process of IAPs such as Bromus hordeaceus in the arid habitats of North America (Hobbs et al., 2007). In the present study, we selected only the bioclimatic and altitude variables to predict the PGD of A. adenophora in China because A. adenophora has strong adaptability and low requirements for soil conditions. As long as the temperature and precipitation conditions are suitable, they flourish (Cao et al., 2004).
Some studies have indicated that the distribution areas of the IAPs have expanded or contracted under climate change. For example, the PGD of 11 IAPs is likely to expand in China under different climate change scenarios (Guan et al., 2020). The PGD of 108 IAPs is expected to decrease in Brazil in the future (Fulgêncio-Lima et al., 2021). In the 2050s and the 2070s, the total suitable habitat of A. adenophora in China is projected to decrease under RCP 2.6. The total suitable habitat areas of A. adenophora will increase under RCP 8.5 in the 2070s compared with that under the current climate. Some studies have indicated that the PGD of A. adenophora will expand by 45.3% and 2% under RCP 8.5 in India and Nepal, respectively (Poudel et al., 2020; Chaudhary et al., 2021). Our findings were consistent with this pattern.
Under climate warming, some IAPs will shift toward higher altitudes and latitudes (Petitpierre et al., 2016; Shrestha and Shrestha, 2019). The spread of IAPs is a result of synergy between abiotic and biotic variables. The interplay of multiple factors contributing to the rapid spread of A. adenophora in China has also been mainly attributed to the interaction of multiple factors. For instance, owing to the small size and light weight of its seeds, A. adenophora disperses over long distances through water and wind (Wang et al., 2011). Previous studies have indicated that flooding facilitates the invasion of A. adenophora into China. In particular, the great flood in 1998 along the Jinshajiang-Yangtze River significantly increased the spread rate of A. adenophora in China (Wang et al., 2011; Horvitz et al., 2014). The mechanism of the synergy of multiple factors increased the risk of invasion and spread in China. The findings of the present study indicate that the PGD of A. adenophora will spread to southeastern China under climate change conditions. The degree of suitability and invasion risk in southwestern China will decrease under climate change. This seems to be due to the saturated geographical distribution of A. adenophora in southwestern China. The high-suitability habitat of A. adenophora indicated a trend of spreading to southeastern China as a result of climate warming. Therefore, more attention should be paid to prevent its further spread in southeastern China. Our findings indicate that early warning and monitoring measures for A. adenophora in southeastern China should be formulated. In the present study, we estimated the distribution pattern and invasion risk areas under future climate scenarios. The results strongly support the need for developing appropriate and efficient strategies to prevent or minimize the invasion and spread potential in China.
The assumption of niche conservatism is the standard working postulate in SDMs. Therefore, the equilibrium occurrence data of IAPs are key to studying the prediction of PGD. Based on the equilibrium occurrence data of A. adenophora and environmental variables, we used EM to predict its PGD in China and to determine the significant environmental variables affecting its PGD. Our findings showed that the distribution pattern of A. adenophora in China was a result of synergy between temperature and precipitation variables; this indicates that temperature variables played a critical role in its invasion in China. The PGD of A. adenophora in China under the current climate is mainly distributed in southwestern China, and will spread in southeastern China under climate change. Hence, more attention should be paid to prevent its further spread in southeastern China.
The raw data supporting the conclusions of this article will be made available by the authors, without undue reservation.
XX, HXZ and WL: conception and design of the research. XX and HXZ: acquisition of data, analysis and interpretation of data, statistical analysis, and drafting the manuscript. RW, BC, HBZ, HH and FW: manuscript revision. All authors contributed to the article and approved the submitted version.
This project was funded by the National Natural Science Foundation of China (grant no. 31501709), National Key R&D Program of China (grant no. 2021YFC2600400), Technology Innovation Program of Chinese Academy of Agricultural Sciences (grant no. caascx-2017-2022-IAS), and Key R&D Program of Yunnan province (202103AF140007).
The authors declare that the research was conducted in the absence of any commercial or financial relationships that could be construed as a potential conflict of interest.
All claims expressed in this article are solely those of the authors and do not necessarily represent those of their affiliated organizations, or those of the publisher, the editors and the reviewers. Any product that may be evaluated in this article, or claim that may be made by its manufacturer, is not guaranteed or endorsed by the publisher.
The Supplementary Material for this article can be found online at: https://www.frontiersin.org/articles/10.3389/fevo.2022.973371/full#supplementary-material
Allouche, O., Tsoar, A., and Kadmon, R. (2006). Assessing the accuracy of species distribution models: Prevalence, kappa and the true skill statistic (TSS). J. Appl. Ecol. 43, 1223–1232. doi: 10.1111/j.1365-2664.2006.01214.x
Auld, B., and Martin, P. (1975). The autecology of Eupatorium adenophorum Sprengel. in Australia. Weed Res. 15, 27–31. doi: 10.1111/j.1365-3180.1975.tb01092.x
Bai, F., Chisholm, R., Sang, W., and Dong, M. (2013). Spatial Risk Assessment of Alien Invasive Plants in China. Environ. Sci. Technol. 47, 7624–7632. doi: 10.1021/es400382c
Baral, S., Adhikari, A., Khanal, R., Malla, Y., Kunwar, R., Basnyat, B., et al. (2017). Invasion of alien plant species and their impact on different ecosystems of Panchase Area, Nepal. Banko Janakari 27, 31–42. doi: 10.3126/banko.v27i1.18547
Bazzichetto, M., Malavasi, M., Bartak, V., Acosta, A. T. R., Rocchini, D., and Carranza, M. L. (2018). Plant invasion risk: A quest for invasive species distribution modelling in managing protected areas. Ecol. Indic. 95, 311–319. doi: 10.1016/j.ecolind.2018.07.046
Briscoe Runquist, R. D., Lake, T., Tiffin, P., and Moeller, D. A. (2019). Species distribution models throughout the invasion history of Palmer amaranth predict regions at risk of future invasion and reveal challenges with modeling rapidly shifting geographic ranges. Sci. Rep. 9:2426. doi: 10.1038/s41598-018-38054-9
Brown, J. (2014). SDM toolbox: A python-based GIS toolkit for landscape genetic, biogeographic and species distribution model analyses. Methods Ecol. Evol. 5, 694–700. doi: 10.1111/2041-210X.12200
Brown, J., Hill, D., Dolan, A., Carnaval, A., and Haywood, A. (2018). PaleoClim, high spatial resolution paleoclimate surfaces for global land areas. Nat. Sci. Data 5:180254. doi: 10.1038/sdata.2018.254
Cao, H. L., Ge, X. J., and Ye, W. H. (2004). The Distribution and Damage of Eupatorium odoratum in Guangdong. For. Sci. Technol. 2, 57–59.
César de Sá, N., Marchante, H., Marchante, E., Cabral, J. A., Honrado, J. P., and Vicente, J. R. (2019). Can citizen science data guide the surveillance of invasive plants? A model-based test with Acacia trees in Portugal. Biol. Invasions 21, 2127–2141. doi: 10.1007/s10530-019-01962-6
Chapman, D. S., Makra, L., Albertini, R., Bonini, M., Páldy, A., Rodinkova, V., et al. (2016). Modelling the introduction and spread of non-native species: International trade and climate change drive ragweed invasion. Glob. Chang. Biol. 22, 3067–3079. doi: 10.1111/gcb.13220
Chaudhary, A., Sarkar, M. S., Adhikari, B. S., and Rawat, G. S. (2021). Ageratina adenophora and Lantana camara in Kailash Sacred Landscape, India: Current distribution and future climatic scenarios through modeling. PLoS One 16:e0239690. doi: 10.1371/journal.pone.0239690
Fang, Y., Zhang, X., Wei, H., Wang, D., Chen, R., Wang, L., et al. (2021). Predicting the invasive trend of exotic plants in China based on the ensemble model under climate change: A case for three invasive plants of Asteraceae. Sci. Total Environ. 756:143841. doi: 10.1016/j.scitotenv.2020.143841
Feng, Y., Lei, Y., Wang, R., Callaway, R., Valiente-Banuet, A., and Inderjit, et al. (2009). Evolutionary trade offs for nitrogen allocation to photosynthesis versus cell walls in an invasive plant. Proc. Natl. Acad. Sci. U.S.A. 106, 1853–1856. doi: 10.1073/pnas.0808434106
Fu, D., Wu, X., Huang, N., and Duan, C. (2018). Effects of the invasive herb Ageratina adenophora on understory plant communities and tree seedling growth in Pinus yunnanensis forests in Yunnan, China. J. For. Res. 23, 112–119. doi: 10.1080/13416979.2018.1429202
Fulgêncio-Lima, L. G., Andrade, A. F. A., Vilela, B., Lima-Júnior, D. P., de Souza, R. A., Sgarbi, L. F., et al. (2021). Invasive plants in Brazil: Climate change effects and detection of suitable areas within conservation units. Biol. Invasions 23, 1577–1594. doi: 10.1007/s10530-021-02460-4
Gong, X., Chen, Y., Wang, T., Jiang, X., Hu, X., and Feng, J. (2020). Double-edged effects of climate change on plant invasions: Ecological niche modeling global distributions of two invasive alien plants. Sci. Total Environ. 740:139933. doi: 10.1016/j.scitotenv.2020.139933
Guan, B. C., Guo, H. J., Chen, S. S., Li, D. M., Liu, X., Gong, X., et al. (2020). Shifting ranges of eleven invasive alien plants in China in the face of climate change. Ecol. Inform. 55:101024. doi: 10.1016/j.ecoinf.2019.101024
He, W. M., Li, J. J., and Peng, P. H. (2012). A congeneric comparison shows that experimental warming enhances the growth of invasive Eupatorium adenophorum. PLoS One 7:e35681. doi: 10.1371/journal.pone.0035681
Hijmans, R., Cameron, S., Parra, J., Jones, P., and Jarvis, A. (2005). Very high resolution interpolated climate surfaces for global land areas. Int. J. Climatol. 25, 1965–1978. doi: 10.1002/joc.1276
Hobbs, R. J., Yates, S., and Mooney, H. A. (2007). Long-Term Data Reveal Complex Dynamics in Grassland in Relation to Climate and Disturbance. Ecol. Monogr. 77, 545–568. doi: 10.1890/06-1530.1
Horvitz, N., Wang, R., Zhu, M., Wan, F. H., and Nathan, R. (2014). A simple modeling approach to elucidate the main transport processes and predict invasive spread: River-mediated invasion of Ageratina adenophora in China. Water Resour. Res. 50, 9738–9747. doi: 10.1002/2014WR015537
Huang, W., Wan, F. H., Guo, J., Gao, B., Xie, B., and Peng, D. (2009). AFLP analyses of genetic variation of Eupatorium adenophorum (Asteraceae) populations in China. Can. J. Plant Sci. 89, 119–126. doi: 10.4141/CJPS07162
Jiménez-Valverde, A., Lobo, J. M., and Hortal, J. (2008). Not as good as they seem: The importance of concepts in species distribution modelling. Divers. Distrib. 14, 885–890. doi: 10.1111/j.1472-4642.2008.00496.x
Kreyling, J., Beierkuhnlein, C., Ellis, L., and Jentsch, A. (2008). Invasibility of Grassland and Heath Communities Exposed to Extreme Weather Events: Additive Effects of Diversity Resistance and Fluctuating Physical Environment. Oikos 117, 1542–1554. doi: 10.1111/j.0030-1299.2008.16653.x
Lantschner, M. V., de la Vega, G., and Corley, J. C. (2019). Predicting the distribution of harmful species and their natural enemies in agricultural, livestock and forestry systems: An overview. Int. J. Pest Manag. 65, 190–206. doi: 10.1080/09670874.2018.1533664
Lázaro-Lobo, A., Ramirez-Reyes, C., Lucardi, R. D., and Ervin, G. N. (2021). Multivariate analysis of invasive plant species distributions in southern US forests. Landsc. Ecol. 36, 3539–3555. doi: 10.1007/s10980-021-01326-3
Li, F., van Kleunen, M., Li, J., Liu, X., Gao, K., Zhu, J., et al. (2019). Patterns of genetic variation reflect multiple introductions and pre-admixture sources of common ragweed (Ambrosia artemisiifolia) in China. Biol. Invasions 21, 2191–2209. doi: 10.1007/s10530-019-01966-2
Liu, J., Chen, H., Kowarik, I., Zhang, Y., and Wang, R. (2012). Plant invasions in China: An emerging hot topic in invasion science. NeoBiota 15:27. doi: 10.3897/neobiota.15.3751
Liu, J., Cui, B., Dong, S., Wang, J., and Zhao, S. (2007). The changes of community components and their horizontal patterns caused by highway construction in the longitudinal range- Gorge region. Chin. Sci. Bull. 52, 213–224. doi: 10.1007/s11434-007-7024-2
Lu, S., Xu, C., Dong, X., Duan, Y., and Wang, Y. (2006). The impacts of the alien invasive plants on biodiversity in longitudinal range–gorge region of southwest China. Acta Bot. Yunnan. 28, 607–614.
McMahon, D. E., Urza, A. K., Brown, J. L., Phelan, C., and Chambers, J. C. (2021). Modelling species distributions and environmental suitability highlights risk of plant invasions in western United States. Divers. Distrib. 27, 710–728. doi: 10.1111/ddi.13232
Merow, C., Bois, S. T., Allen, J. M., Xie, Y., and Silander, J. A. (2017). Climate change both facilitates and inhibits invasive plant ranges in New England. Proc. Natl. Acad. Sci. U.S.A. 114, E3276–E3284. doi: 10.1073/pnas.1609633114
Monserud, R. A., and Leemans, R. (1992). Comparing global vegetation maps with the Kappa statistic. Ecol. Model. 62, 275–293. doi: 10.1016/0304-3800(92)90003-W
Parsons, W., and Cuthbertson, E. (2001). Noxious Weeds of Australia, 2nd Edn. Collingwood: CSIRO Publishing, 239–242.
Peterson, A. T., Papeş, M., and Soberón, J. (2008). Rethinking receiver operating characteristic analysis applications in ecological niche modeling. Ecol. Model. 213, 63–72. doi: 10.1016/j.ecolmodel.2007.11.008
Petitpierre, B., McDougall, K., Seipel, T., Broennimann, O., Guisan, A., and Kueffer, C. (2016). Will climate change increase the risk of plant invasions into mountains? Ecol. Appl. 26, 530–544. doi: 10.1890/14-1871
Poudel, A. S., Jha, P. K., Shrestha, B. B., and Muniappan, R. (2019). Biology and management of the invasive weed Ageratina adenophora (Asteraceae): Current state of knowledge and future research needs. Weed Res. 59, 79–92. doi: 10.1111/wre.12351
Poudel, A. S., Shrestha, B. B., Joshi, M. D., Muniappan, R., Adiga, A., Venkatramanan, S., et al. (2020). Predicting the current and future distribution of the invasive weed Ageratina adenophora in the Chitwan–Annapurna landscape, Nepal. Mt. Res. Dev. 40:R61. doi: 10.1659/MRD-JOURNAL-D-19-00069.1
Pyšek, P., Jarošík, V., Hulme, P. E., Kühn, I., Wild, J., Arianoutsou, M., et al. (2010). Disentangling the role of environmental and human pressures on biological invasions across Europe. Proc. Natl. Acad. Sci. U.S.A. 107, 12157–12162. doi: 10.1073/pnas.1002314107
Qin, Z., Zhang, J.-E., Ditommaso, A., Wang, R., and Wu, R.-S. (2015). Predicting invasions of Wedelia trilobata (L.) Hitchc. with Maxent and GARP models. J. Plant Res. 128, 763–775. doi: 10.1007/s10265-015-0738-3
Sang, W., Zhu, L., and Axmacher, J. C. (2010). Invasion pattern of Eupatorium adenophorum Spreng in southern China. Biol. Invasions 12, 1721–1730. doi: 10.1007/s10530-009-9584-3
Shrestha, U. B., and Shrestha, B. B. (2019). Climate change amplifies plant invasion hotspots in Nepal. Divers. Distrib. 25, 1599–1612. doi: 10.1111/ddi.12963
Sun, X., Lu, Z., and Sang, W. (2004). Review on studies of Eupatorium adenophoruman important invasive species in China. J. For. Res. 15, 319–322. doi: 10.1007/BF02844961
Tererai, F., and Wood, A. R. (2014). On the present and potential distribution of Ageratina adenophora (Asteraceae) in South Africa. S. Afr. J. Bot. 95, 152–158. doi: 10.1016/j.sajb.2014.09.001
Thapa, S., Chitale, V., Rijal, S. J., Bisht, N., and Shrestha, B. (2018). Understanding the dynamics in distribution of invasive alien plant species under predicted climate change in Western Himalaya. PLoS One 13:e0195752. doi: 10.1371/journal.pone.0195752
Thuiller, W., Araújo, M. B., and Lavorel, S. (2003). Generalized models vs. classification tree analysis: Predicting spatial distributions of plant species at different scales. J. Veg. Sci. 14, 669–680. doi: 10.1111/j.1654-1103.2003.tb02199.x
Thuiller, W., Georges, D., Engler, R., and Breiner, F. (2016). Package “biomod2”. Ensemble Platform for Species Distribution Modeling Version 3. 3–7. Available Online at: https://cran.r-project.org/web/packages/biomod2/biomod2.pdf. (accessed Nov 5, 2016).
Tu, W., Xiong, Q., Qiu, X., and Zhang, Y. (2021). Dynamics of invasive alien plant species in China under climate change scenarios. Ecol. Indic 129:107919. doi: 10.1016/j.ecolind.2021.107919
Turbelin, A., and Catford, J. A. (2021). “Invasive plants and climate change,” in Climate Change, ed. T. M. Letcher (Amsterdam: Elsevier), 515–539. doi: 10.1016/B978-0-12-821575-3.00025-6
Václavík, T., and Meentemeyer, R. K. (2012). Equilibrium or not? Modelling potential distribution of invasive species in different stages of invasion. Diver. Distrib. 18, 73–83. doi: 10.1111/j.1472-4642.2011.00854.x
Wang, R., Wang, J. F., Qiu, Z. J., Meng, B., Wan, F. H., and Wang, Y. Z. (2011). Multiple mechanisms underlie rapid expansion of an invasive alien plant. New Phytol. 191, 828–839. doi: 10.1111/j.1469-8137.2011.03720.x
Warren, D. L., Glor, R. E., and Turelli, M. (2010). ENMTools: A toolbox for comparative studies of environmental niche models. Ecography 33, 607–611. doi: 10.1111/j.1600-0587.2009.06142.x
Weber, E., and Li, B. (2008). Plant Invasions in China: What Is to Be Expected in the Wake of Economic Development? BioScience 58, 437–444. doi: 10.1641/B580511
Welk, E. (2004). Constraints in range predictions of invasive plant species due to non-equilibrium distribution patterns: Purple loosestrife (Lythrum salicaria) in North America. Ecol. Model. 179, 551–567. doi: 10.1016/j.ecolmodel.2004.04.020
Yan, X., Zhenyu, L., Gregg, W. P., and Dianmo, L. (2000). Invasive species in China - an overview. Biodivers. Conserv. 10, 1317–1341. doi: 10.1023/A:1016695609745
Zhen-Feng, M., Liu, J., Zhang, S., Chen, W., and Yang, S. (2013). Observed Climate Changes in Southwest China during 1961–2010. Adv. Clim. Chang. Res. 4, 30–40. doi: 10.3724/SP.J.1248.2013.030
Keywords: invasive alien plants, climate change, Ageratina adenophora, potential geographical distribution, ensemble model
Citation: Xian X, Zhao H, Wang R, Zhang H, Chen B, Huang H, Liu W, Wan F (2022) Predicting the potential geographical distribution of Ageratina adenophora in China using equilibrium occurrence data and ensemble model. Front. Ecol. Evol. 10:973371. doi: 10.3389/fevo.2022.973371
Received: 20 June 2022; Accepted: 19 July 2022;
Published: 04 August 2022.
Edited by:
Donald DeAngelis, United States Geological Survey (USGS), United StatesReviewed by:
Mohamed Abdelaal, Mansoura University, EgyptCopyright © 2022 Xian, Zhao, Wang, Zhang, Chen, Huang, Liu, Wan. This is an open-access article distributed under the terms of the Creative Commons Attribution License (CC BY). The use, distribution or reproduction in other forums is permitted, provided the original author(s) and the copyright owner(s) are credited and that the original publication in this journal is cited, in accordance with accepted academic practice. No use, distribution or reproduction is permitted which does not comply with these terms.
*Correspondence: Wanxue Liu, bGl1d2FueHVlQGNhYXMuY24=
†These authors have contributed equally to this work
Disclaimer: All claims expressed in this article are solely those of the authors and do not necessarily represent those of their affiliated organizations, or those of the publisher, the editors and the reviewers. Any product that may be evaluated in this article or claim that may be made by its manufacturer is not guaranteed or endorsed by the publisher.
Research integrity at Frontiers
Learn more about the work of our research integrity team to safeguard the quality of each article we publish.