
94% of researchers rate our articles as excellent or good
Learn more about the work of our research integrity team to safeguard the quality of each article we publish.
Find out more
ORIGINAL RESEARCH article
Front. Ecol. Evol., 10 October 2022
Sec. Environmental Informatics and Remote Sensing
Volume 10 - 2022 | https://doi.org/10.3389/fevo.2022.967593
This article is part of the Research TopicRemote Sensing of Aquatic Environment and Its Implication for Environmental ManagementView all 8 articles
 Xiaodong Li1,2
 Ge Liu3*
Estuarine wetlands provide an especially ecological home for various flora and fauna, with fragile ecological structures and functions easily affected by the external disturbances of both anthropogenic and natural activities. Recently, wetlands (such as water and marsh) of the Bohai Rim region have been, and continue to be, lost or altered under the influence of both local urbanization and economic development. There is an increasing need for crucial essential wetland change detection as one of the most critical works for relevant research. The paper’s objective focuses on detecting the annual and interannual changes at a large spatial scale for understanding the mainly changed cover type of estuarine wetlands and measuring its impact on coastline ecological factors. Two typical study areas, including the Shuangtai Estuary wetland and Yellow River Delta, are selected for the assessment of changes to wetlands in Bohai Rim region, China. Additionally, Landsat TM/OLI images between 2005 and 2015, as the standard years for change detection, are used as the experimental data resources. To realize the rapid and automatic detection of change to wetland at a larger scale, a method is constructed to extract the change information from satellite images integrating the dynamic ratio and the max-difference algorithm. Based on the remote sensing base ecological index (RSEI), three ecological indexes include water body index, vegetation index, and soil index, calculated the annual maximum difference and the inter-annual dynamic rate of change to wetland. Furthermore, wetland changes are graded and evaluated five significant levels from the annual yearly and interannual scales. Results show several significant findings: (1) from 2005 to 2015, the ecological change with an overall improvement trend was in two monitoring areas of Bohai Rim region. The annual change of ecological factors in the positively changed area (improve) was more and more significant, with the mainly converted type of the expansion of paddy field. In the negatively changing area (degrade), annual ecological change was more and more insignificant, with the main expansion of bare land. (2) The significantly increased accumulation of normalized difference vegetation index (NDVI) was the main ecological change feature of the Shuangtai Estuary wetland. The significant regional changes in the Yellow River Delta were the interaction of ecological factors, included modified normalized difference water index (MNDWI), NDVI, and normalized difference soil index (NDSI). The study on the change detection of wetland and its influence on ecological factors in Bohai Rim region between two different periods enriches remote sensing monitoring technology of change to wetlands, betters quantitative evaluation of ecological factors, and provides updated data support for the wetland natural resource inventory at the various scales.
Ecological change to wetlands is a spatio-temporal accumulation process of ecological factors under the external disturbance, which occurs with human economic development (Qin et al., 2013). Improving the rate and accuracy of wetland change monitoring is advantageous to environmental protection and the scientific management of wetland resources. It ultimately contributes to coordinating the human-earth relationship (Xu H. et al., 2019; Yu et al., 2020). Over the past 20 years, with the rapid economic development in coastal areas of the Bohai Rim region, wetland ecology has been, and continue to be, degraded or altered at the large-scale under the process of industrialization and urbanization (Xu W. et al., 2019). Due to land reclamation and urbanization, coastal wetlands with outstanding ecological value have significantly been occupied as the construction land. Therefore, it is urgent to monitor wetland changes in real-time and dynamically. However, due to the fluctuation of seawater level and the complexity of wetland vegetation ecological restoration, remote sensing monitoring of coastal wetland has always been a hot topic (Mao et al., 2018).
Estuarine wetland in the Bohai Rim region belong to the coastal wetland ecosystem in the temperate monsoon climate zone, such as the Yellow River Delta (YRD) and Shuangtai Estuary wetland. Estuarine wetland, which is generally located in the delta area downstream of the river with obvious geographical location advantages, not only has the demand for ecological protection and the driving force of high-quality development but also own a good foundation for local economic development (Bai, 2020). Recently, the terrestrial ecology of the YRD has undergone drastic changes. Reclamation activities, in particular, led to the degradation of wetland ecosystem in the YRD, as the increasing intensity of interference activities (Yang et al., 2020). Specifically, the vegetation succession activity is under the direct and indirect influence of both seawater erosion and invasive species, which can result in a large number of deaths of the original salt-tolerant vegetation in coastal wetlands (Yang et al., 2017). The decrease of incoming water and sediment from rivers leads to regional water shortage, and wetland in the estuary delta shrinks due to water shortage (Xu et al., 2014). In the Shuangtai Estuary wetland, the increasing expansion of agricultural land aggravates the salinization and secondary salinization of estuarine wetland (Liu, 2018). River–ocean–land interaction forms a unique geographical environment of coastal wetland (Yang et al., 2019; Wang et al., 2021). At the same time, under the river–land–ocean interactions of the YRD, especially the interaction of various environmental factors and the exchange of material and energy, the coastal wetland changes dramatically (Ouyang et al., 2020). In general, how ecological factors (such as water, soil, and vegetation) in the study area affect the structure and function of estuarine wetland ecosystem, and thus change its landscape pattern, which needs to be analyzed and evaluated by integrating multi-scale data of ecosystem and watershed for wetland ecological changes. It is of great theoretical significance to select the estuarine wetland in the YRD and Shuangtai Estuary wetland as the vital area for wetland ecological change detection and its influence research.
Under the tremendous potential development of remote sensing detection technology, the innovation of change detection methods is gradually put on the agenda. Spatial change detection for real-time tracking of wetland ecological status is one of the essential setups for the ecological restoration and health assessment of wetlands in eastern China (Mao et al., 2020). Therefore, how to automatically and quickly extract change information of wetland, which provide the updated data support for the wetland inventory, is a challenge faced environmental remote sensing that needs to be resolved. Geographic ecosystem reflects the spatial pattern and relationship of terrestrial resources, including climate, topography, water, soil, and vegetation. Terrestrial cover types in similar ecological communities are relatively stable in a certain period.
Meanwhile, the dynamic variation of multi-ecological factors such as water, vegetation, and soil most directly reflect terrestrial ecological changes. More methods based on multi-ecological indexes are proposed for the rapid automatic detection of terrestrial ecological changes: remote sensing base ecological index (RSEI) to quantify surface ecological status in Changting country, Fujian (Xu H. et al., 2019), and a newly developed stress indicator (rapidly assessed wetland stress index, RAWSI) for rapidly assessing wetland ecological change by combining Landsat 8 and Sentinel SAR data (Walter and Mondal, 2019). To improve the monitoring accuracy of change to wetland, the ecological factors of wetlands (such as temperature, humidity, vegetation, altitude, slope, etc.) in the study areas are selected as the primary research data and used to construct a reasonable rule database for the change detection process (Zhu et al., 2019). The change detection study, applied in the geographical and ecological research field, mainly focuses on surface feature change and varying ecological conditions in the study areas. The normally applied research of surface ecological change is mainly to evaluate the regional ecological status based on a single time-phase image (Coppin et al., 2004; Lu et al., 2004). This paper focuses on using the multi-temporal dataset and the comprehensive multi-dimensional ecological index (remote sensing based ecological index, RSEI) to jointly quantify the change to wetland at the level of the wetland class, improving the extraction accuracy of wetland change information.
Based on the remote sensing detection technology of change to wetland and Landsat TM/OLI images, the study aims to discover significant ecological change areas of coastal wetlands in north China. Under the combination between the ecological change detection method and the principal component analysis (PCA), the changed areas were divided into the positively/negatively changed areas, corresponding to the improvement and degradation of change to wetland, respectively. Meanwhile, according to the change direction of ecological factors, we further explore the specific terrestrial transformation types caused by the significant ecological changes and their impact on the spatial accumulation of ecological factors such as water, vegetation, and soil.
In this study, two typical wetland-cover areas in the Bohai Rim region were selected to detect new change features of wetland ecological factors. All study areas are located in the temperate monsoon zone of Eastern Asia and include new economic development hotspots and coastal development zone.
The Shuangtai Estuary wetland in the southern Liaohe alluvial plain occupies around 1,942 km2 and lies between 40°41′N-41°27′N latitude and 121°31′E-122°28′E longitude (Figure 1). The main wetland types include reed marshland, salt flats, and paddy fields. The study area is a temperate continental monsoon climate zone, with an average annual temperature is 8.6°C and a mean annual precipitation of 631 mm (Wang et al., 2015).
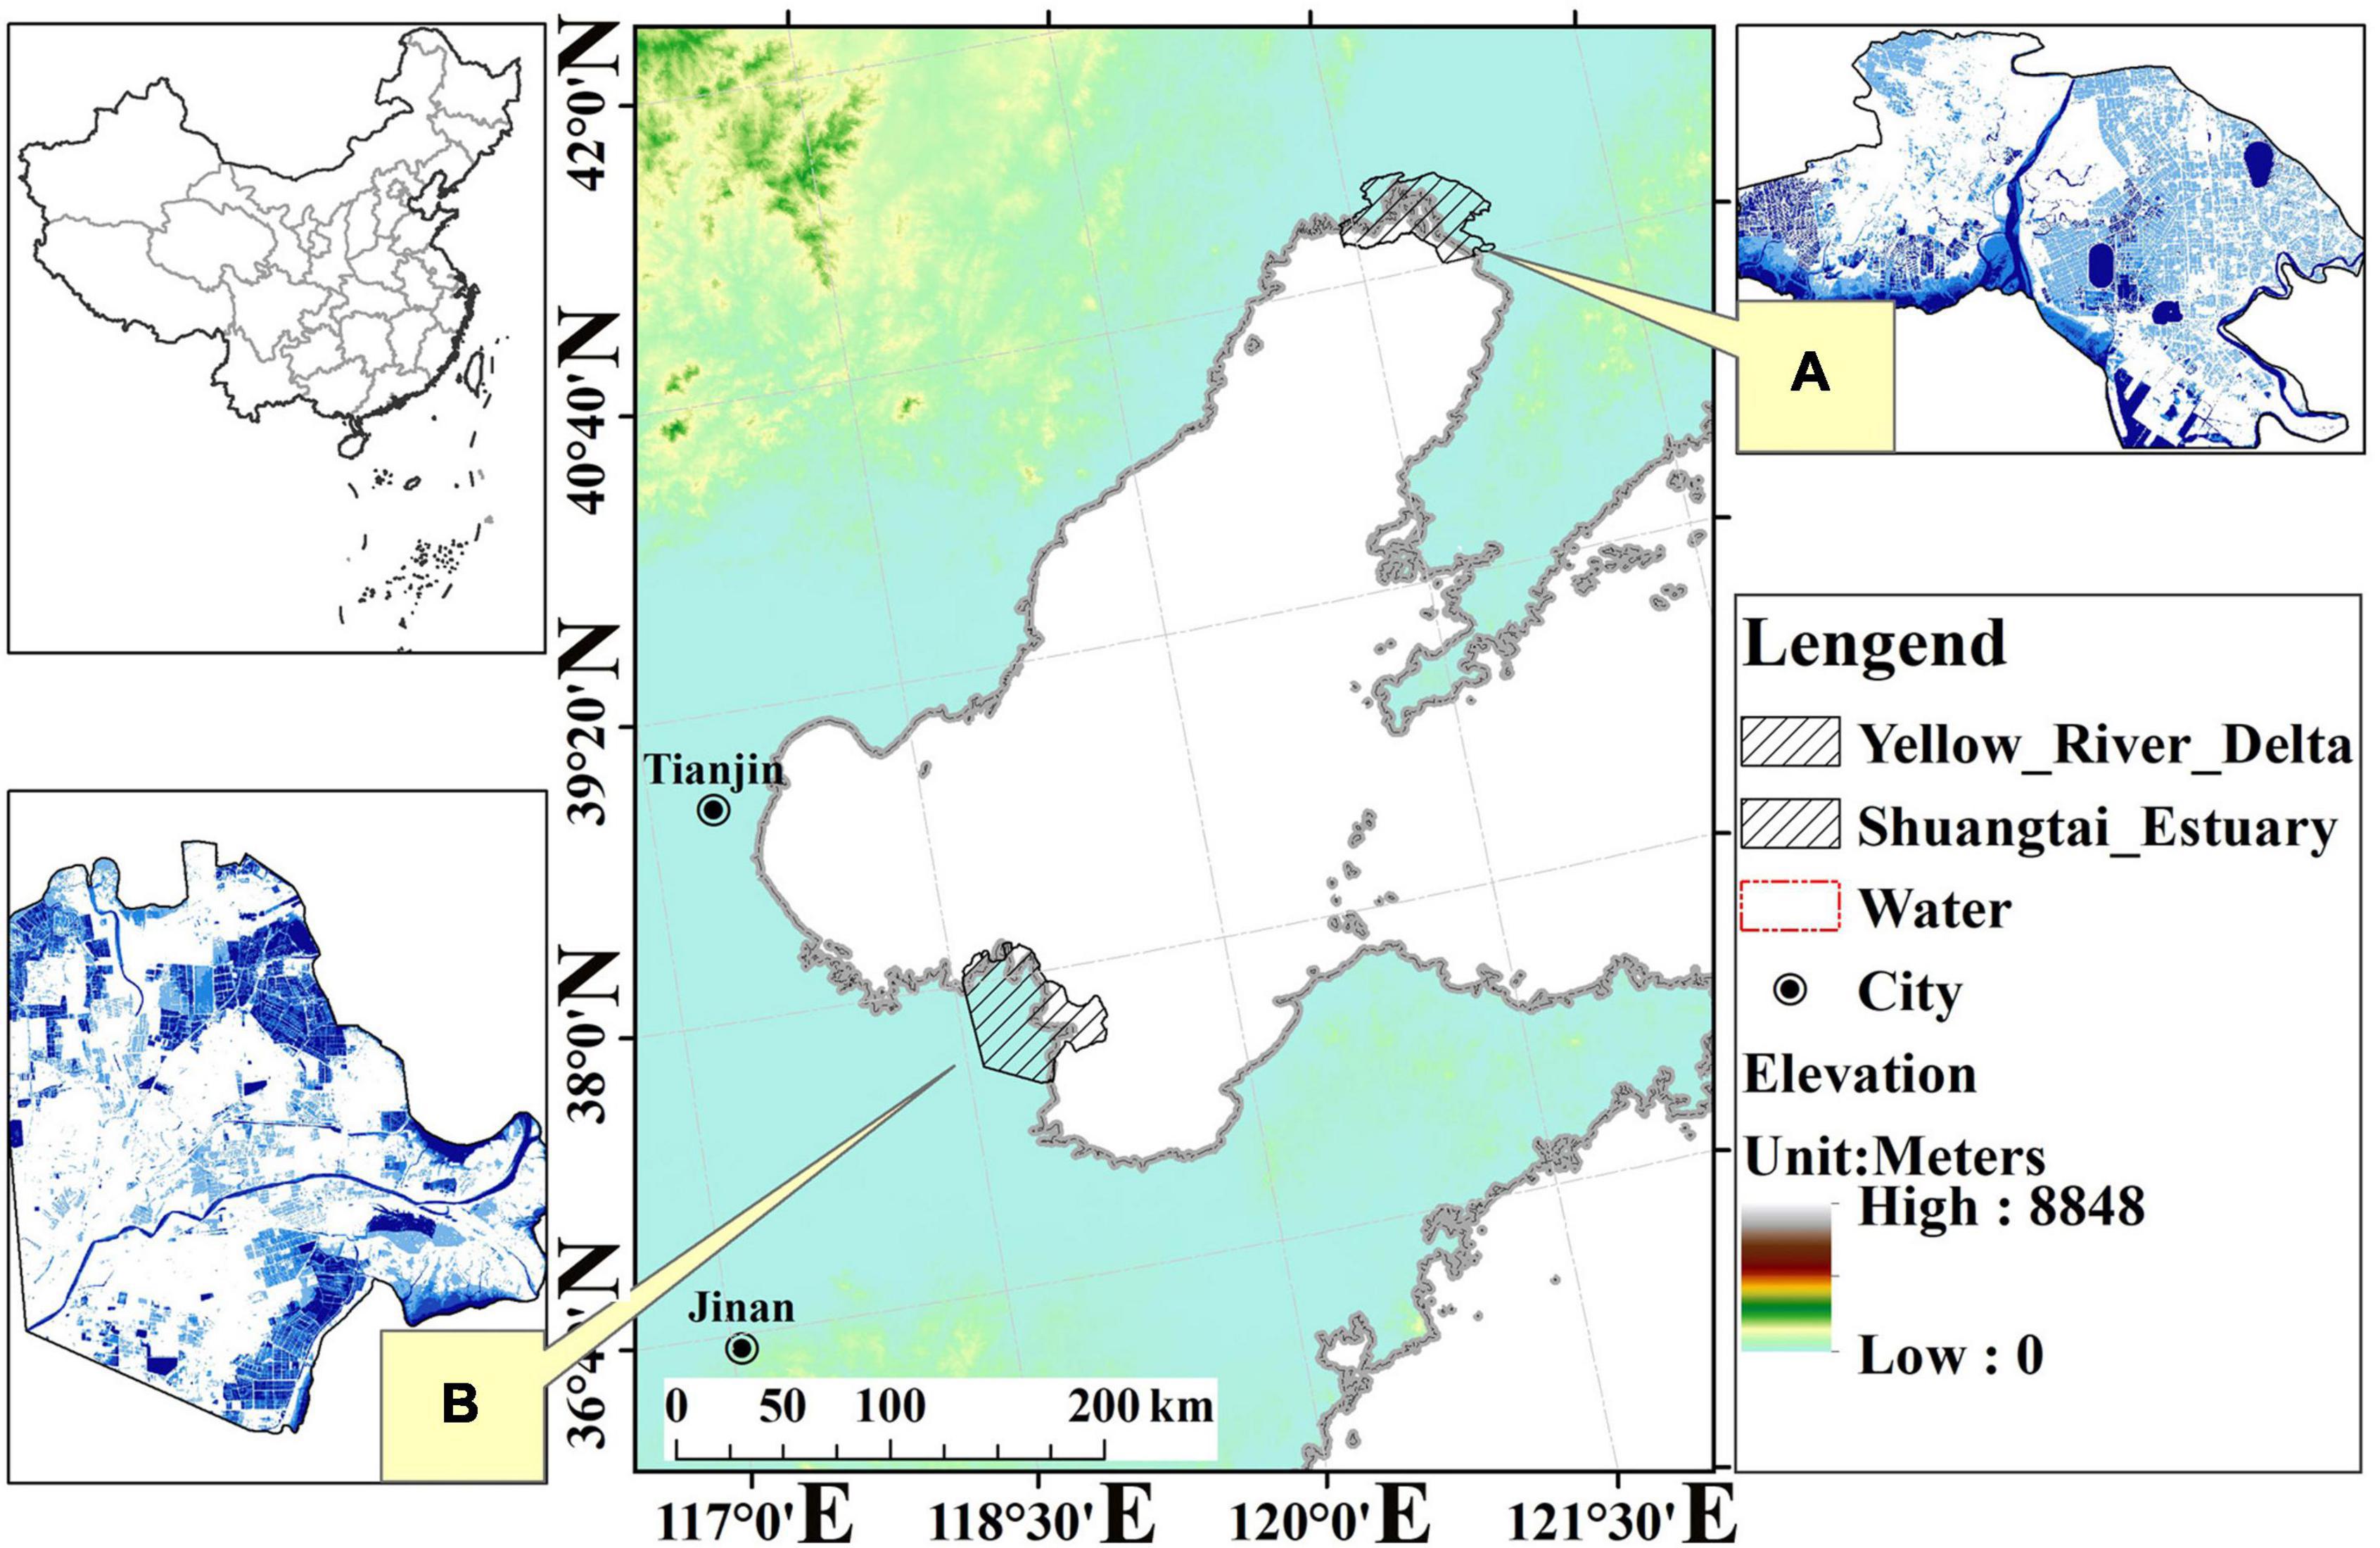
Figure 1. Distribution of the study area: (A) Shuangtai River Estuary, and (B) Yellow River Delta.
The YRD (36°48′N-38°24′N, 117°59′E-120°36′E), located to the north of Shandong Province, includes the eastern section of Binzhou and Dongying cities and has an area of 2,928 km2 (Figure 1). The climate feature of this region is a temperate continental monsoon climate, with an annual average temperature of 12.1°C and annual average precipitation of 551.6 mm. Due to the flat terrain and high groundwater table, this region is composed of wet and saline soil. Thus, the natural vegetation in this area consists of salt-tolerant herbs, grasses, and shrubs (Su et al., 2020).
Routinely available Landsat imagery provides an effective way to detect ecological change over large scales and at regular intervals. In this study, we employed Landsat multi-temporal surface reflectance composites between 2005 and 2015. These Landsat TM/OLI images were provided by the United States Geological Survey (USGS)1 and the Earth Resources Observation and Science center (EROS) are used in this study. In total, 16 Landsat images (8 Landsat-5 TM and 8 Landsat-8 OLI), path/row 120/032, and 121/034 acquired from 2004 to 2016 are used to cover the Shuangtai Estuary and YRD in north China (Table 1).
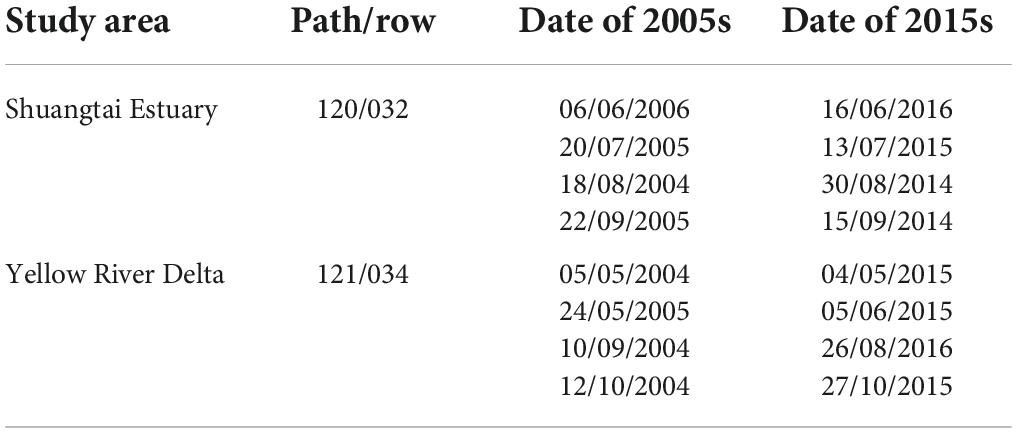
Table 1. Acquisition dates of Landsat images.
The monthly dataset from April to October of every year was collected for extracting the change information of wetland-covers in the growing season. The available images in different years should be gathered in the same month as much as possible. Considering the actual collected condition of satellite images (Table 1), 2005 and 2015 are determined as the best base years for the classification of land cover in the Bohai Rim region. Most clear and available satellite data is from the growing season from April to October. To reduce the influence of single time-phase images on the classification results of the base years, cloud-free (<10% cloud cover) TM and OLI images, with a 2-year time-span, are used as the time-serial data before and after the base years (2005 and 2015).
Satellite imagery processing involved radiometric calibration, atmospheric correction, geometric precision correction, and relative radiometric correction. Notably, radiometric correction involved the conversion of an original image’s digital number (DN) into the top of atmosphere reflection (TOA) at the sensor to reduce the reflection difference between images in different years. The FLAASH model from ENVI 5.3 software (Exelis Visual Information Solutions, Inc., Boulder, CO, USA) was used to calculate surface reflectance for Landsat images acquired between 2005 and 2015. Meanwhile, to maintain the consistency of reflected values of bi-temporal and multi-temporal images, we adopt the relative radiation correction method, carried out by referencing samples that were used as the pseudo-invariant feature points, such as bare land and construction land (Xiao et al., 2016). The quadratic polynomial method and nearest neighbor resampling algorithm are used for geometric correction between different time-series images. Ultimately, the square root error of the results is less than 0.5 pixels. Furthermore, the map parameters of images were transformed into the World Geodetic System 1984 (WGS-84) geographic coordinate system and the Universal Transverse Mercator (UTM) projection, with the zone 50N of the YRD and the zone 51N of the Shuangtai Estuary, respectively.
The normalized first principal component (PCA-1), extracted by the imagery transformation and base-pixel calculation such as the annual max-difference and the inter-annual dynamic ratio, is used for quantitatively measuring the annual and inter-annual ecological change range and direction based on modified normalized difference water index (MNDWI), NDVI, and NDSI.
The main monitoring contents of change to wetland-cover types include (1) the inter-annual change direction and range; (2) the inter-annual spatial pattern of the primary wetland-cover types such as reed marsh and water; and (3) the significant levels of the annual terrestrial ecological variation. The implementation process of the change detection method is shown in Figure 2:
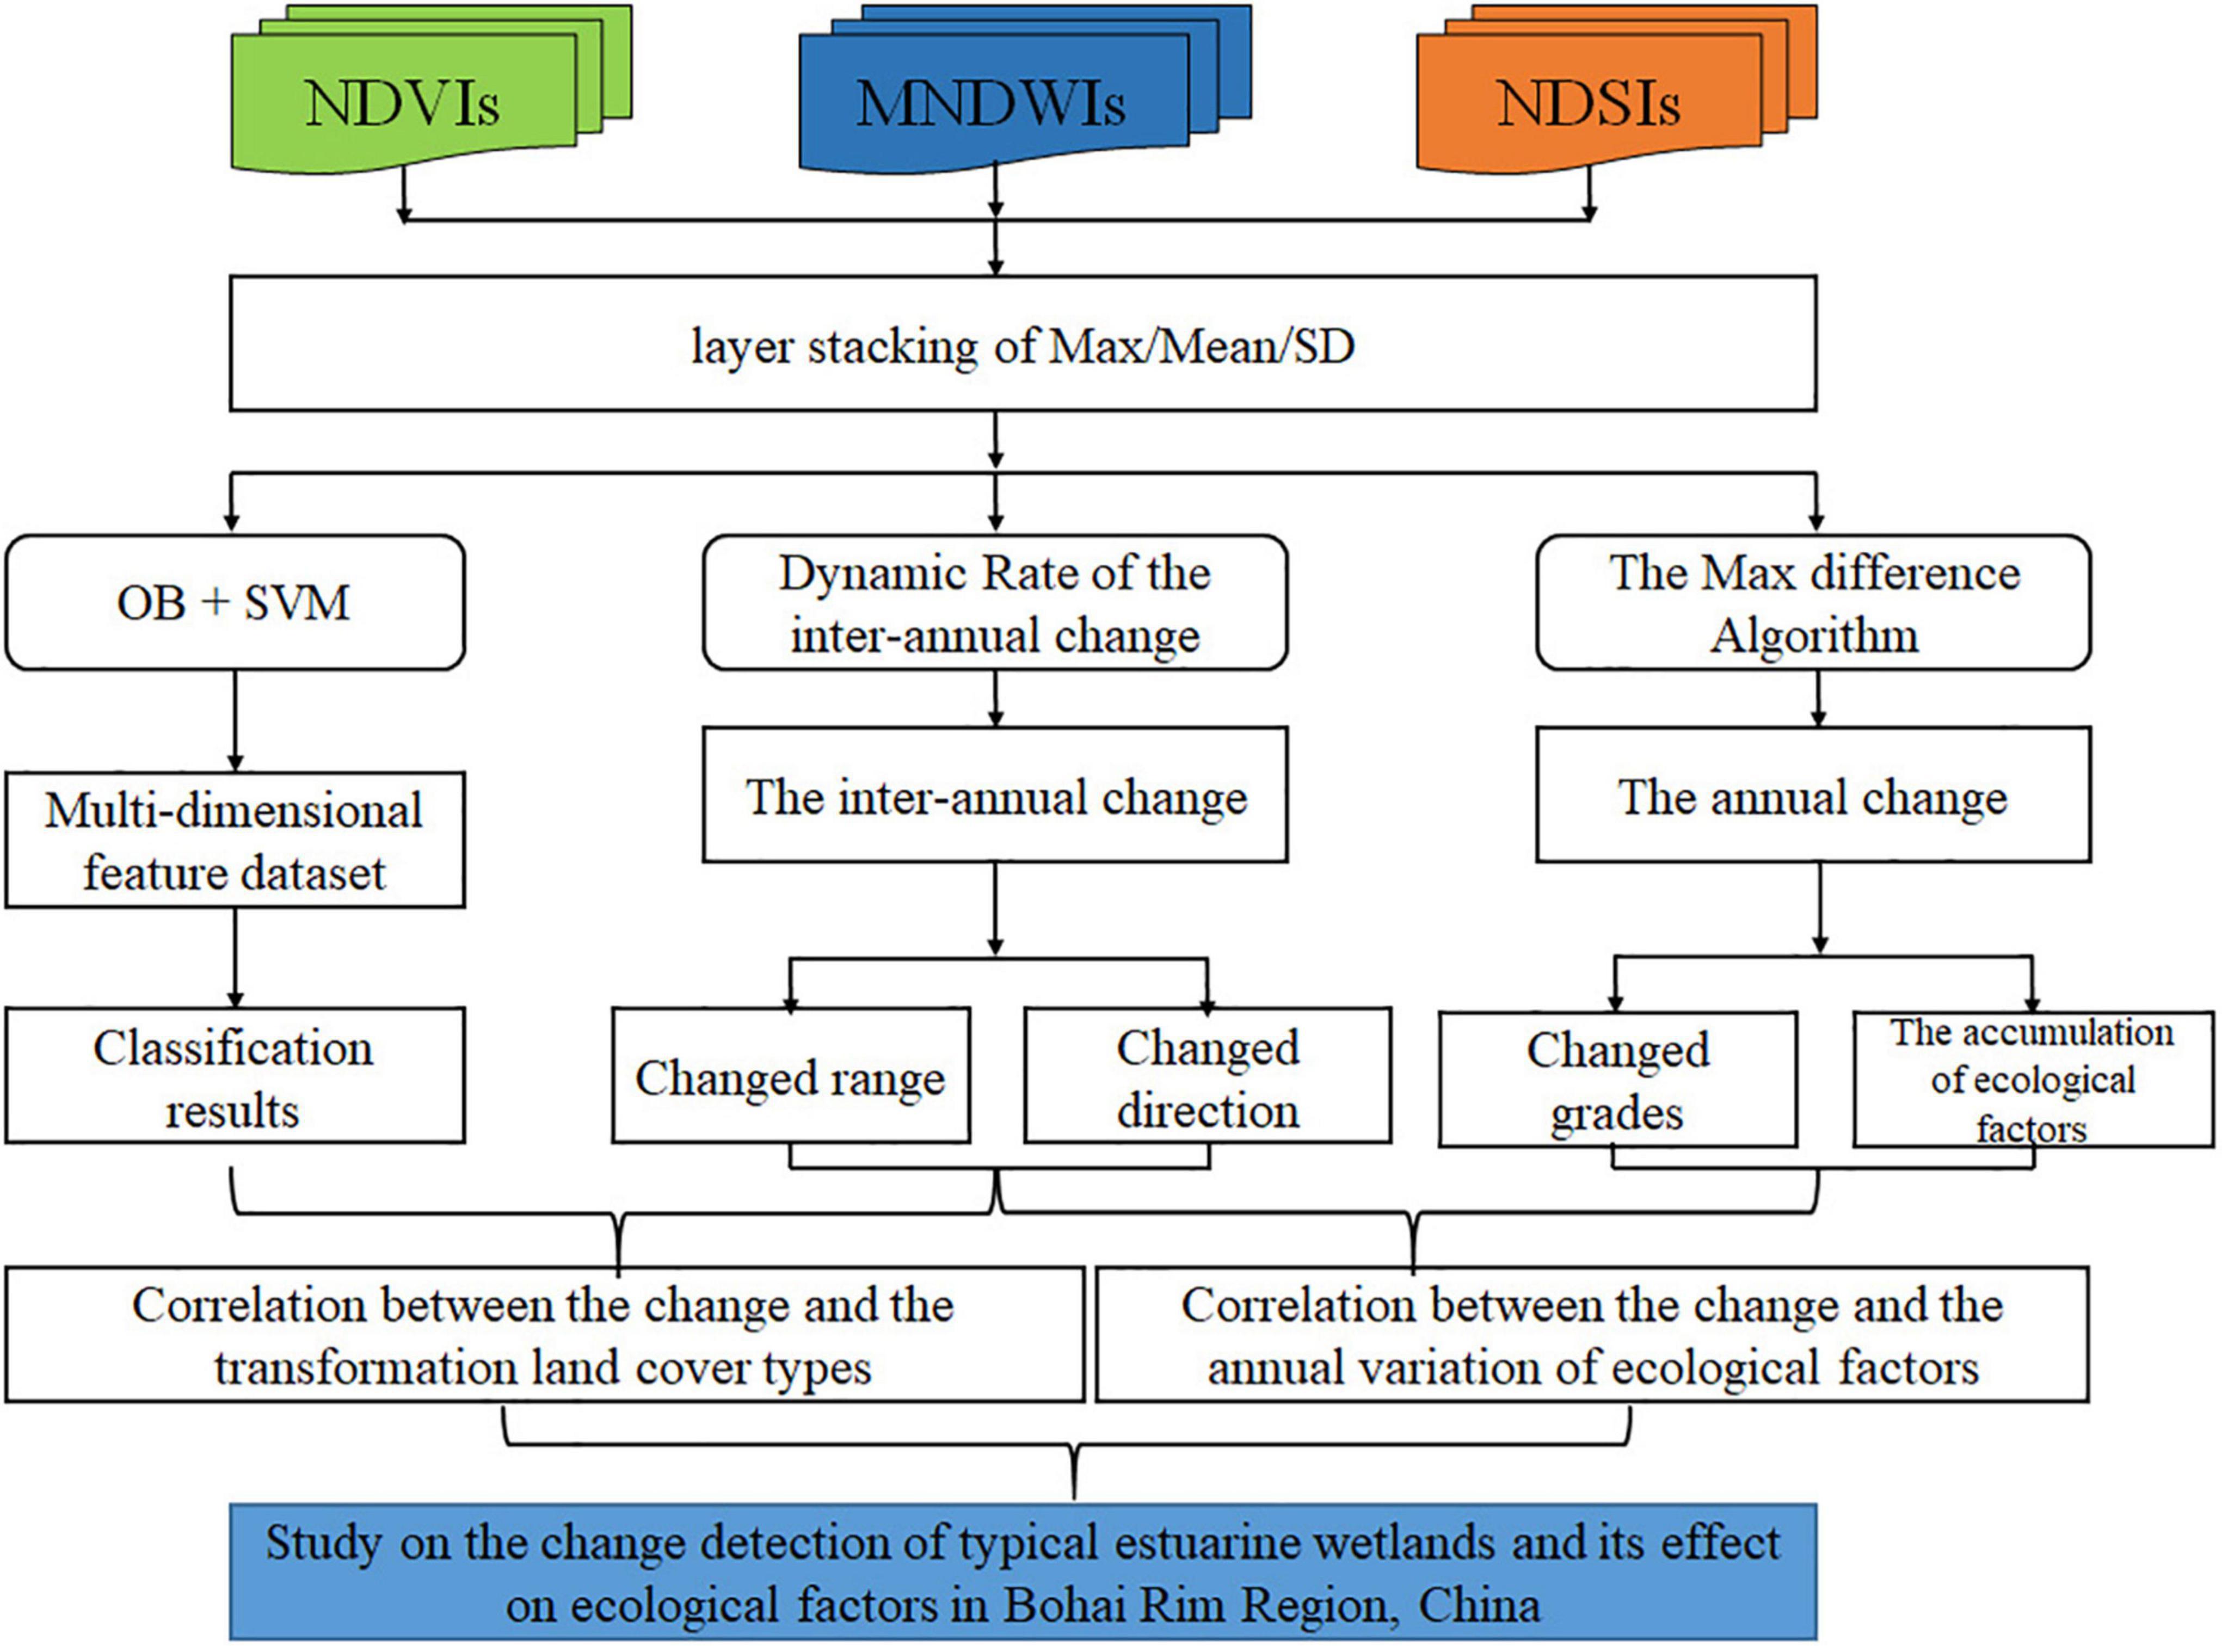
Figure 2. The flowchart of the change detection.
The normalized difference vegetation index (NDVI) represents surface greenness in the study area. It is the most widely used vegetation index for measuring vegetation productivity due to its simplicity and robustness. The NDVI is calculated using the following equation (Rouse et al., 1973):
where Red represents the red band and NIR is the near-infrared band. The NDVI is mainly used for monitoring vegetation ecological status, ranging from −1 to 1; positive values indicate the strong signal of vegetation coverage while negative values indicate weaker vegetation, or interference from clouds, water, snow, rocks, etc.
The MNDWI quantifies important attributes of water bodies and soil moisture. The MNDWI is calculated using the following equation (Xu, 2006):
where Green denotes the reflection of the green band and SWIR1 is the shortwave-infrared spectrum of Landsat.
The ecological status is greatly affected by human activities. The normalized difference soil index (NDSI) is more sensitive to land degradation and development caused by the impervious surface. The NDSI is known as the conventional soil index, which was used for extracting the impervious surface distribution (Zha et al., 2003; Deng et al., 2015). NDSI negative values are non-bare land information, but they usually contain soil moisture information.
The ratio is based on the NIR and the short-wave infrared (SWIR1) bands of remote sensing image data.
To shrink the difference of three ecological indicators from two time periods, the histogram matching and the relative radiation correction method was considered to selected the method for constructing the consistent relationship between Landsat-5 TM and Landsat-8 OLI band data (Jiao et al., 2003; Xiao et al., 2005). Meanwhile, the changing trend based on the Max-Difference-MNDWI/NDVI/NDSI reflects the seasonal variation characteristics of surface ecological factors in the study area. Finally, the integrated ecological index (EI) includes the surface water body index (MNDWI), the terrestrial vegetation index (NDVI), and the land soil index (NDSI).
where, Max-Differencei represents the maximum difference of the ecological factors in the study area from April to October. The EIi,j is the i-th ecological factor (MNDWI/NDVI/NDSI) data in the j-th month.
The RSEI is an integrated value that is used to evaluate local ecological quality via PCA of the superposition results, which includes the vegetation, water body, and soil. In general, the RSEI is converted into an 85-point or 100-point scale and further divided equally into five gradients corresponding to five ecological levels: very poor, poor, normal, good, and very good (Xu H. et al., 2019).
The first principal component (PC-1) of the max-difference based on the monthly MNDWI/NDVI/NDSI dataset is normalized to the interval ranging from 0 to 1. Then, PC-1 is further divided into the wetland change levels: [0, 0.2), [0.2, 0.4), [0.4, 0.6), [0.6, 0.8), and [0.8, 1), which represent extremely insignificant change (L-1), insignificant change (L-2), relative stability (L-3), significant change (L-4), and extremely significant change (L-5), respectively.
According to the discernment ability of remote sensing data and the ecological condition of land-cover types, the mean value of ecological indexes of bi-temporal images are used to represent the constant status at the same location, and the difference of data sets represent the variation range of ecological situations.
where EI1 and EI2 denote the ecological status of wetlands in different periods. Finally, the algorithm used for monitoring the surface ecological change is described as the dynamic ratio method. The EIi is the i-th ecological factor extracting the first principal component (PC-1) of the annual max-difference based on the monthly MNDWI/NDVI/NDSI dataset.
The dynamic ratio of bi-temporal images was used to measure and analyze the change direction and the significant variation levels of ecological factors. Based on three ecological factors (MNDWI, NDVI, and NDSI) in 2005 and 2015, the first principal component of the dynamic ratio, as the primary monitoring method, was used to quantitatively measure the inter-annual change direction of ecological factors in the study area. And then the significant levels were further divided into the ecological change levels: [−1, −0.6), [−0.6, −0.4), [−0.4, 0.4], (0.4, 0.6], and (0.6, 1], which represent significant negative change direction, negative change direction, stability, positive change direction, and significant positive change direction, respectively. Finally, the significant change range included [−1, −0.6) and (0.6, 1] were the positively/negatively changed area, respectively.
Land-cover types in the study area are identified and determined based on China’s National Standard of Land Classification (GB/T 24708-2009), as well as auxiliary data that includes the global surface coverage remote sensing data products (GlobeLand30) and Google Earth high-resolution images. The main wetland classes are seen in Table 2, including marsh, water, salt-flat, pond, shoreline, and paddy.
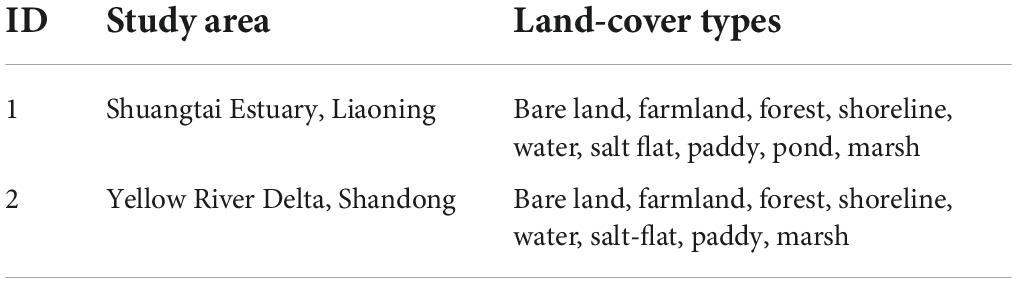
Table 2. The main change detection types of land-cover types.
A multi-dimension-feature dataset is constructed to interpret remote sensing data from wetland types based on three indexes (NDVI, MNDWI, and NDSI), representing the surface vegetation information and water body information and soil information, respectively. The specific design scheme is as follows: monthly NDVI’s mean value + NDVI’s max value + NDVI’s SD + month-NDSI’s mean value + NDSI’s max value + NDSI’s SD + month-MNDWI’s mean value + MNDWI’s max value + MNDWI’s SD in the growing season + DEM + the object-oriented SVM.
In total, 214 samples were obtained by field sampling or visual interpretation of personnel who did not participate in the training sample collection (97 and 117 samples). Test samples obtained from a field investigation in 2016 and 2019 used global positioning systems (GPS), a camera, and a laptop. These samples were used to construct the error matrix and calculate the detection accuracy index. The wetland types recorded by two field sampling processes were typically water bodies, marsh, paddy, and aquaculture ponds in the four typical study areas. Samples include longitude, latitude, altitude, and land cover types.
Quantitative evaluation of the change detection result includes the overall accuracy (OA), Kappa coefficient (KC), false detection rate (FDR), and missed detection rate (MDR). FDR is the proportion of the unchanged samples taken as changed samples and therefore reflects the probability of false change in the results. The false detection ratio is the proportion of the changed samples detected as unchanged ones, which reflects the probability of missing the changed samples in the change detection results (Zhuang et al., 2018). The selected samples are randomly divided into two parts: 70% of the samples are used for classification, and 30% are used for the accuracy evaluation.
The classification accuracy of results is evaluated through the confusion matrix calculated by the ENVI5.3 platform (Exelis Visual Information Solutions, Inc., Boulder, CO, USA). The OA and KC of the classification results reached 80.69 and 0.78, respectively (Table 3).
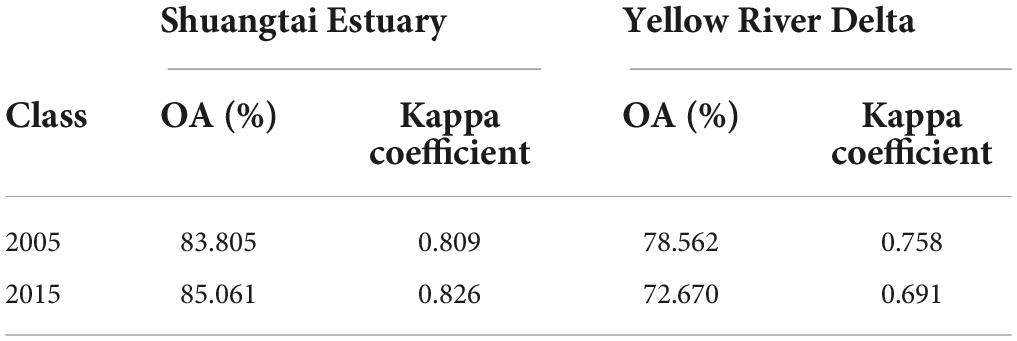
Table 3. The accuracy assessment of classification in north China.
By combining the mapping of land cover types, which are made using the bi-temporal remote sensing images, we obtained the grid transformation diagram of land types. Using DRM, we calculated the regional change in studied wetlands:
where Y represents the conversion results of major land cover types. The T1 and T2 represent the land cover-types between the T1 and T2 stage by the type-coding, respectively.
The results show (Figure 3) that the total area of mainly monitoring region which is 1,942.18 and 2,928.16 km2, respectively. Meanwhile, different percentages of ecological changed areas accounted for 11.18 and 18.3% of the total area in the Shuangtai River Estuary (STEST) and YRD, respectively.
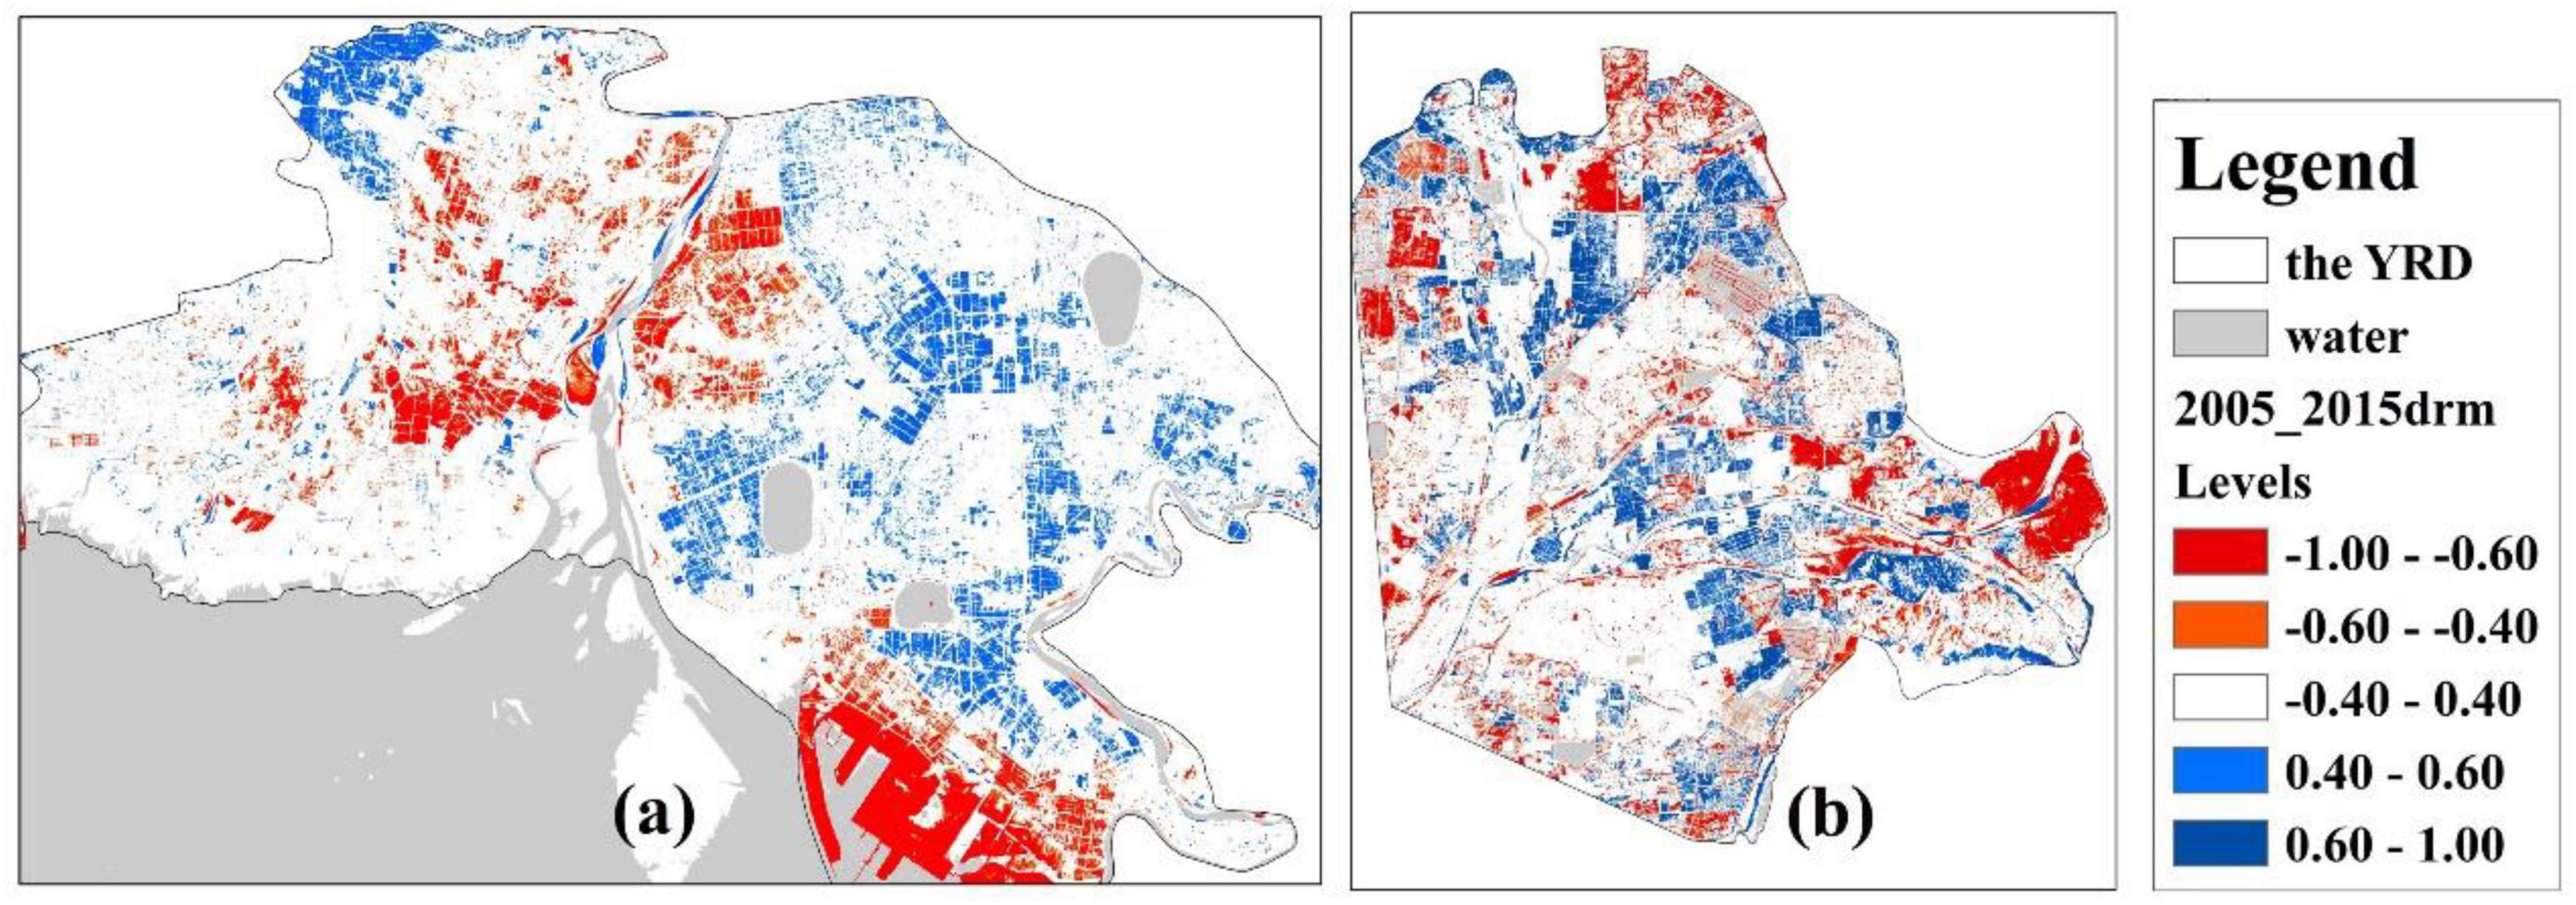
Figure 3. The assessment of inter-annual changes to Ecological factors in (a) Shuangtai Estuary, and (b) Yellow River Delta, 2015.
Generally, ecological changes in this area are characterized by negative and positive changes, corresponding to the improvement and degradation of wetland, respectively. The terrestrial ecological changes in the Shuangtai Estuary are stable on the whole. Meanwhile, the tidal flat of the YRD has mainly been used to a reclaimed area of both farmland and paddy fields. Notably, the urban expansion of the Shuangtai Estuary and the loss of the tidal flat in the YRD are characterized by ecological degradation, highlighted in the red label.
The results were obtained by the change detection method-DRM (Table 4), with the highest detection accuracy (94.02%). Therefore, the classification results can represent the actual changes of land-cover types in the study area.
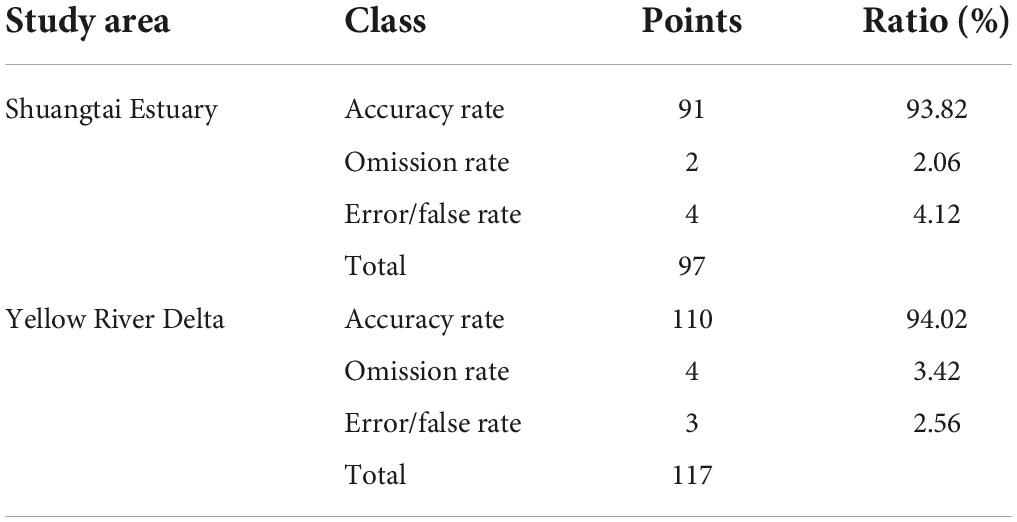
Table 4. The classification accuracy analysis based on DRM methods.
The rate of different ecological changed areas is corresponding to the improvement (positively change) and degradation (negatively change) of wetland, respectively, and the final results showed that (Table 5):

Table 5. The percentage of different ecological changed areas.
The drastic changes of ecological factors during the observation period between 2005 and 2015 were the YRD, with the changed areas of 536 km2. Meanwhile, the positive changes of terrestrial ecological factors were the main change feature, accounting for 62.16 and 60.69% of changed areas in the YRD and Shuangtai Estuary, respectively.
Principal component analysis is a classical and generally mathematical statistical analysis method. According to the contribution percent of each factor, to determine the weight of the principal component is used to avoid unnecessary errors caused by manual weighting. Correlation analysis between the annual maximum difference of three ecological indexes (MNDWI, NDVI, and NDSI) and the first principal component is conducted to be shown in Table 6 and Figure 4.
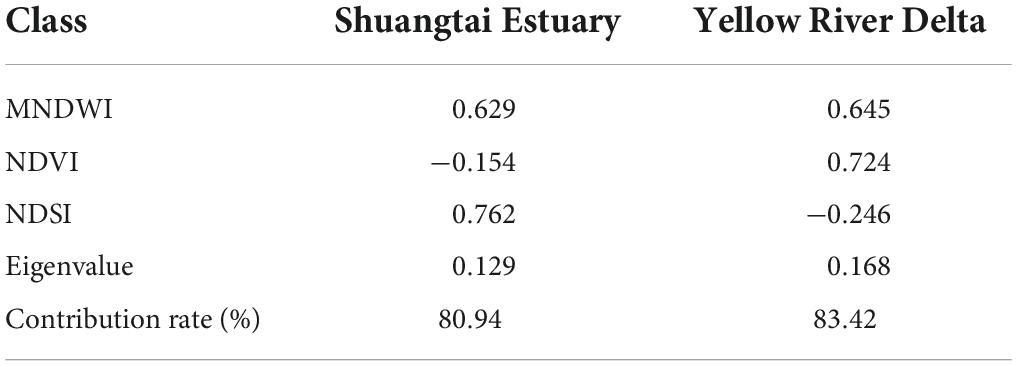
Table 6. The principal component analysis of three ecological factors.
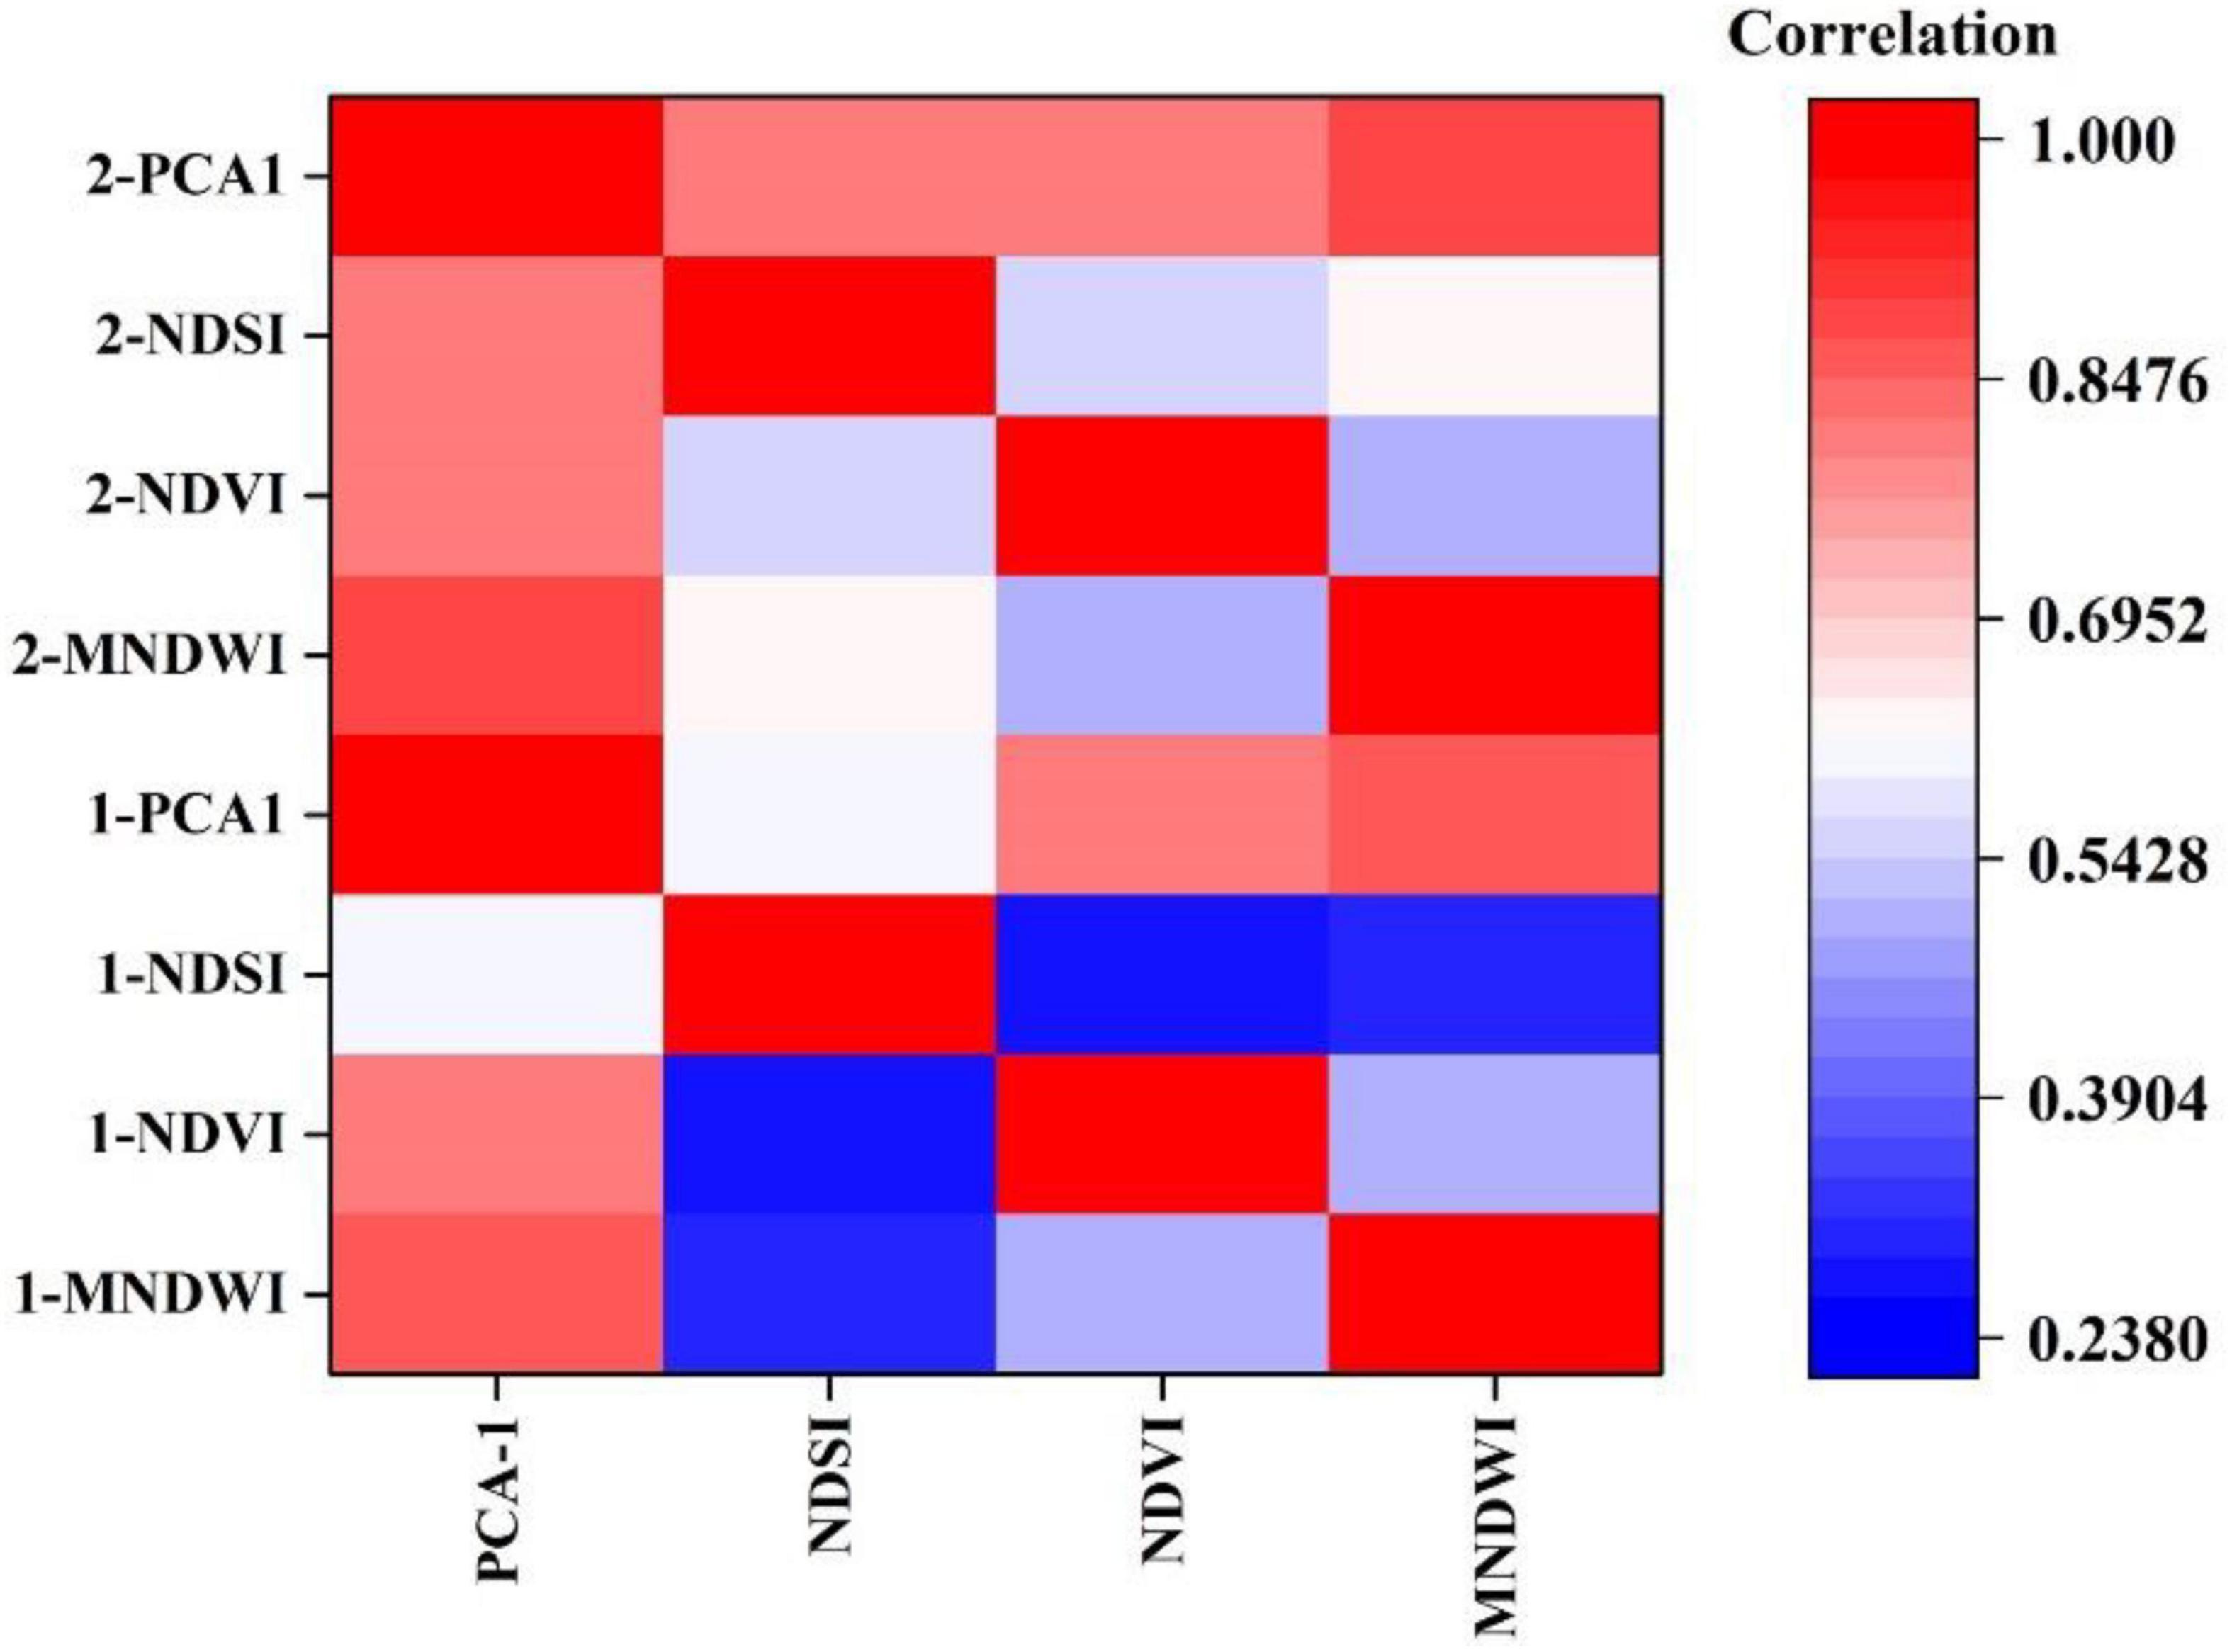
Figure 4. The correlation matrix of PC-1 and three factors. 1-, Shuangtai Estuary; 2-, Yellow River Delta.
The first principal component based on the maximum difference of land ecological indexes (MNDWI/NDVI/NDSI) in the study area that has the following analyzed results: (1) the contribution rate of PC-1 is greater than 80.00%, with a high correlation between the PC-1 and three ecological indexes (the correlation coefficient >0.70), which represent the PC-1 retains most of the annual variation information of three ecological factors. (2) The positive correlation between the NDVI/MNDWI and the PC-1 indicates that these ecological factors such as NDVI and MNDWI had positive contributions to the annual variation of the ecological status in the study area. The soil index showed negative value, which indicated that the bared-land can accelerate the land degradation.
According to the analysis of the ecological fluctuation level from 2005 to 2015 (Figure 5), the percentage of the annual-variation range belong to the highly significant change (L-5) accounted for 84.2% in the improved area of the Shuangtai Estuary wetland, in 2015; the percentage of change area belong to the relative stability (L-3) is 55.2% in the ecological degradation area of the Shuangtai Estuary wetland, in 2015. The changing area in the YRD with the max-percentage (63.4%) in the improved range belongs to the highly significant change (L-5); meanwhile, the annual-change area in the degraded ecological range belongs to the relative stability (L-3) accounted for 35.3%, in 2015. Compared to 2005, the annual-variation of wetland in the degradation area decreased significantly in 2015, with the relative stability level (L-3). The obviously enhanced seasonal variation of terrestrial ecological factors in the improved region belongs to the highly significant change (L-5) in 2015, excepted the Figure 5B which represented a relatively stable ecological improvement area between 2005 and 2015.
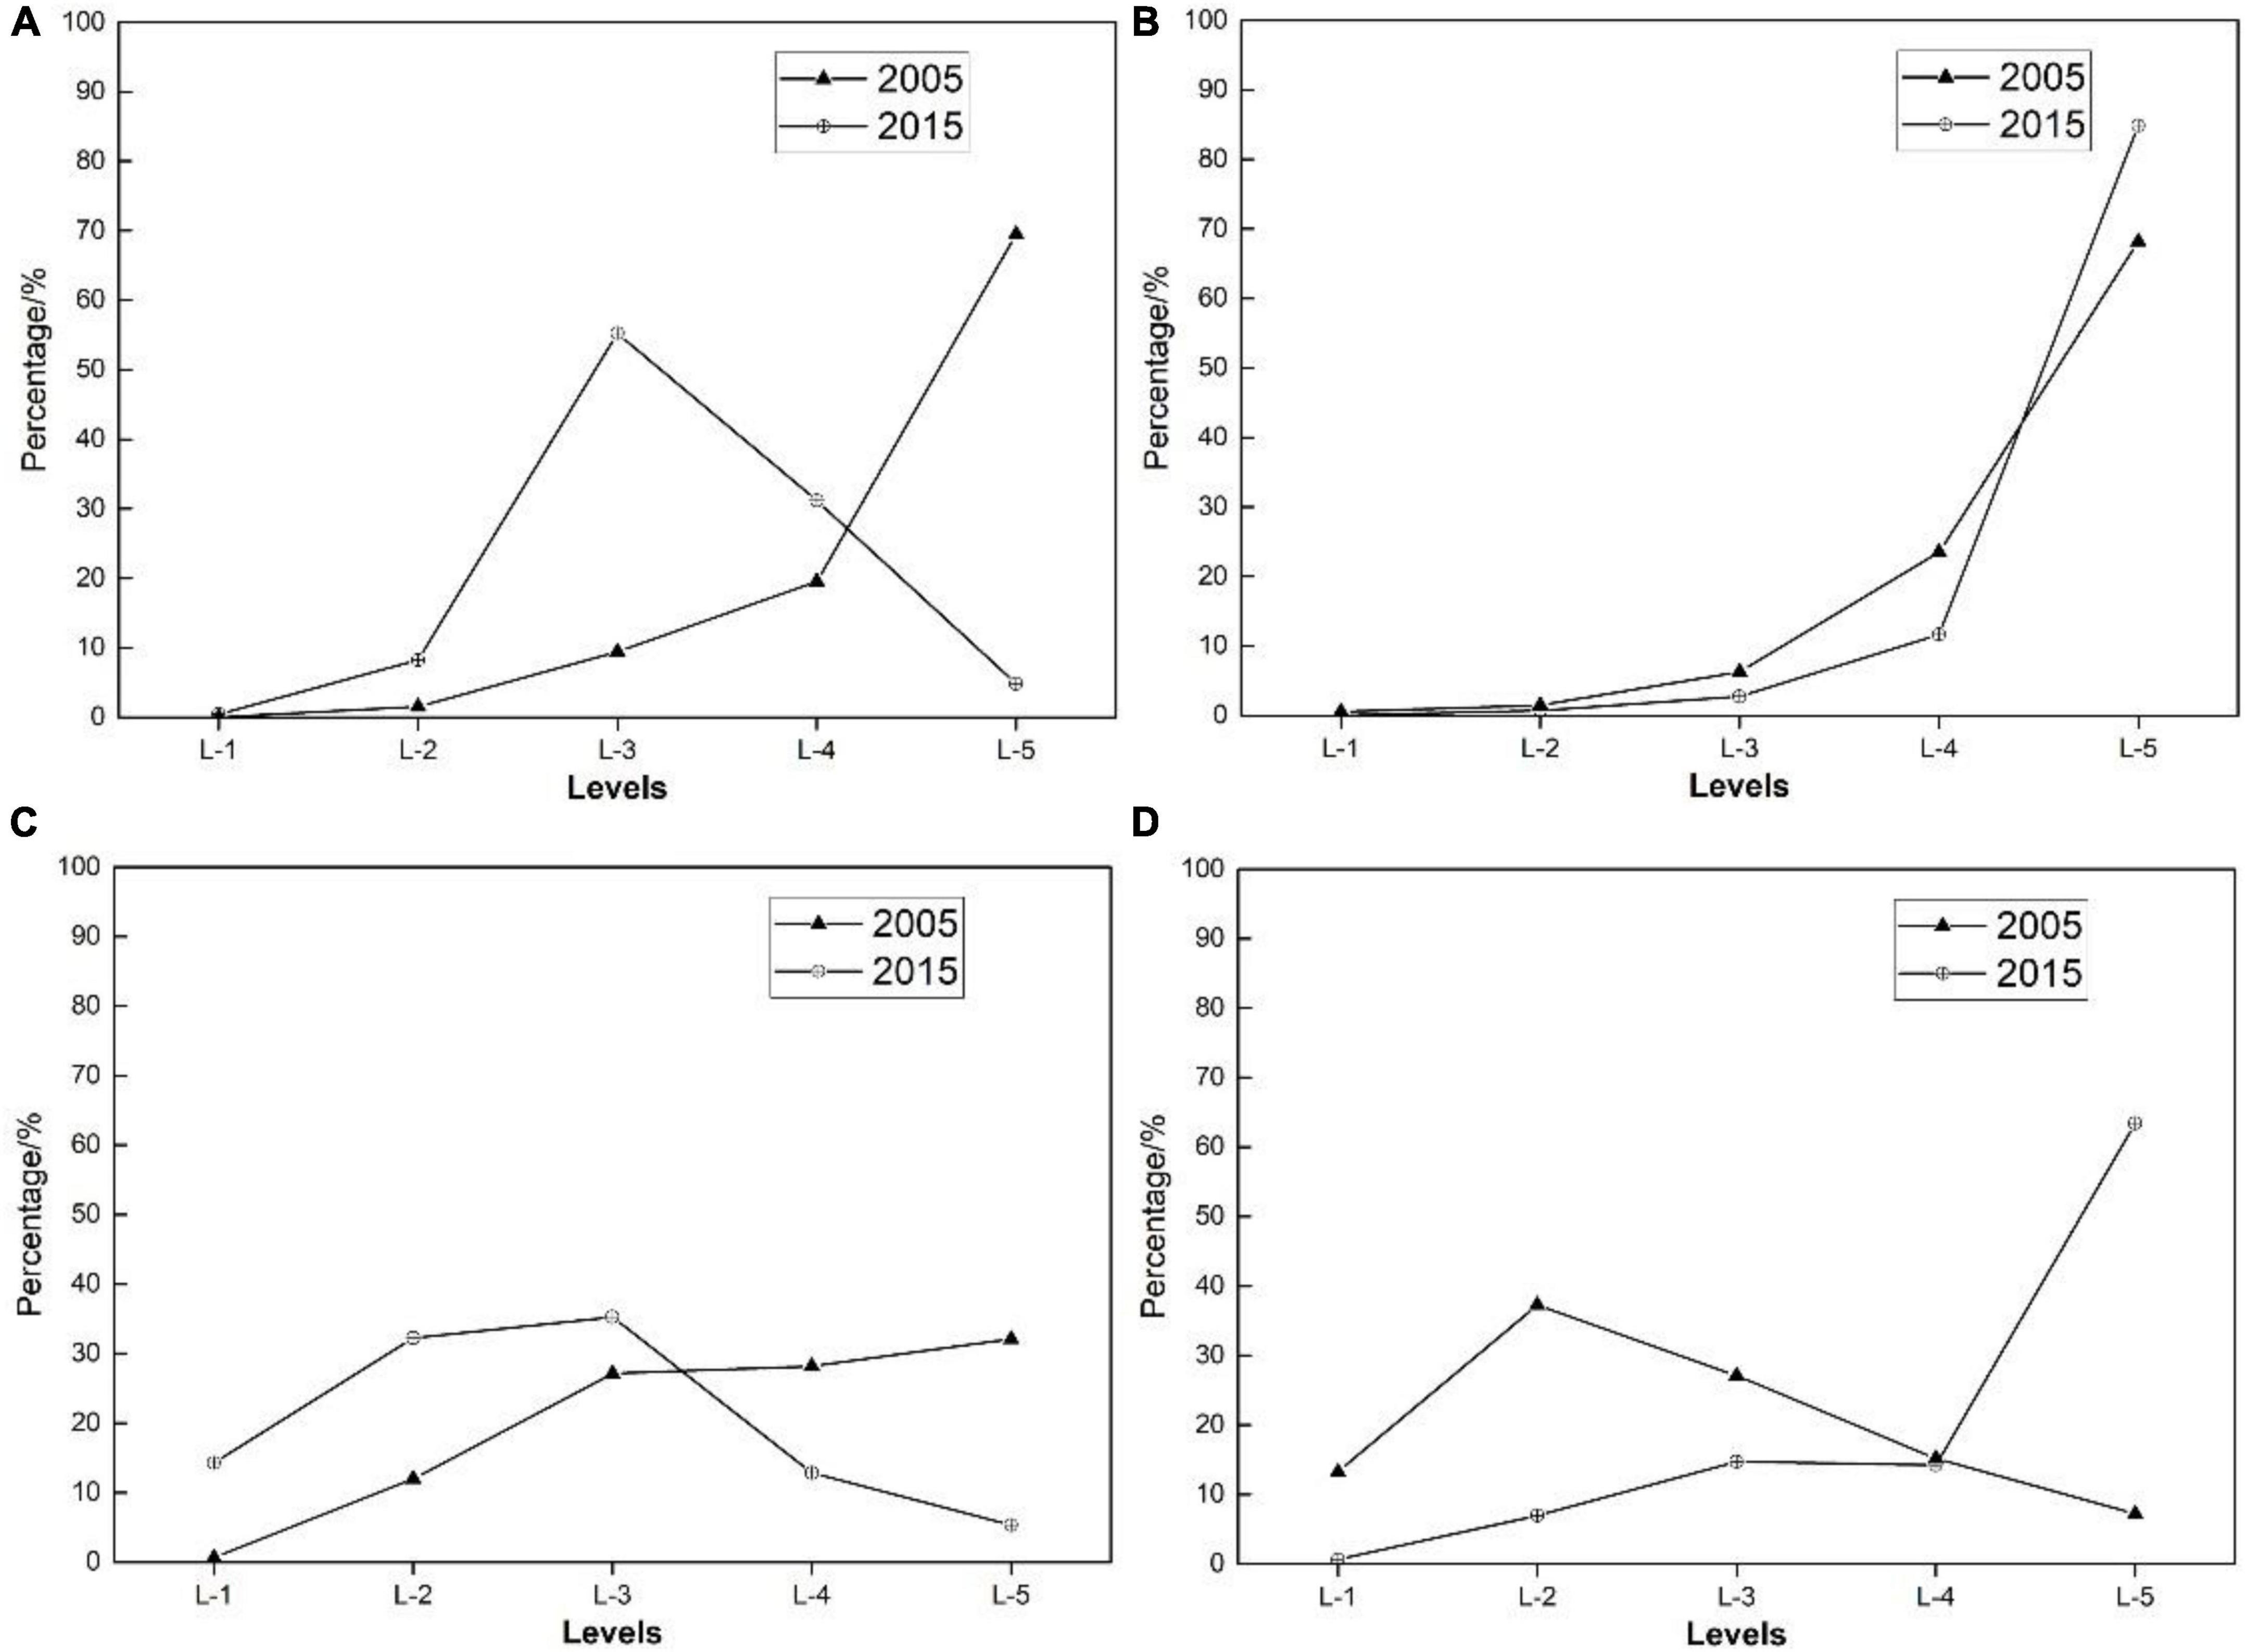
Figure 5. The percentage of wetland at the annual-variation level, in the changed terrestrial region. Panels (A,B) are an ecological fluctuation grade of the Shuangtai River Estuary. Panels (C,D) are in the Yellow River Delta. Additionally, Panels (A,C) are the significant analysis results of wetland ecology in the degradation (negatively change) area. Compared to 2005, the ecological status of the study area showed a trend of significant improvement in 2015; meanwhile, Panel (D) is the significant analysis results in the improvement (positively change) area; in particular, Panel (B) is always a relatively stable ecological improvement area between 2005 and 2015. The X-axis is the annual change grades, including L-1, -2, -3, -4, and -5, corresponding to the highly insignificant level, insignificant level, normal level, significant level, and extremely significant level. The Y-axis is the percentage (%) of the changing area with a certain variation level.
Moving down from the normal level to the extremely insignificant level in the negatively changed area in 2015 indicates that the monthly differences of ecological indicators (MNDWI/NDVI/NDSI) are getting smaller and smaller, which further represents the degradation of terrestrial ecology. However, the ecological fluctuation, which shifts from the normal level to the highly significant level in the positively changed area, is an improvement of wetland ecology, with the more and more obviously month-differences in 2015. Within the ecological change region, the more significant the annual fluctuation is, the more obvious the seasonal changes are. The terrestrial vegetation and soil moisture have obvious seasonal variation in the improved coastal wetland area in the Bohai Rim region.
In the monitoring duration from 2005 to 2015, the decreased accumulation of MNDWI (−0.6, 2015) mainly represents the annual-change feature of ecological factors in the Shuangtai Estuary, especially the change of water bodies in ecological degradation area (−1.51, 2015) (Table 7). The increased NDVI (2.38, 2015) is in the negatively changed area. Meanwhile, the decreased accumulation of NDVI in the positively changed area belongs to the local change.
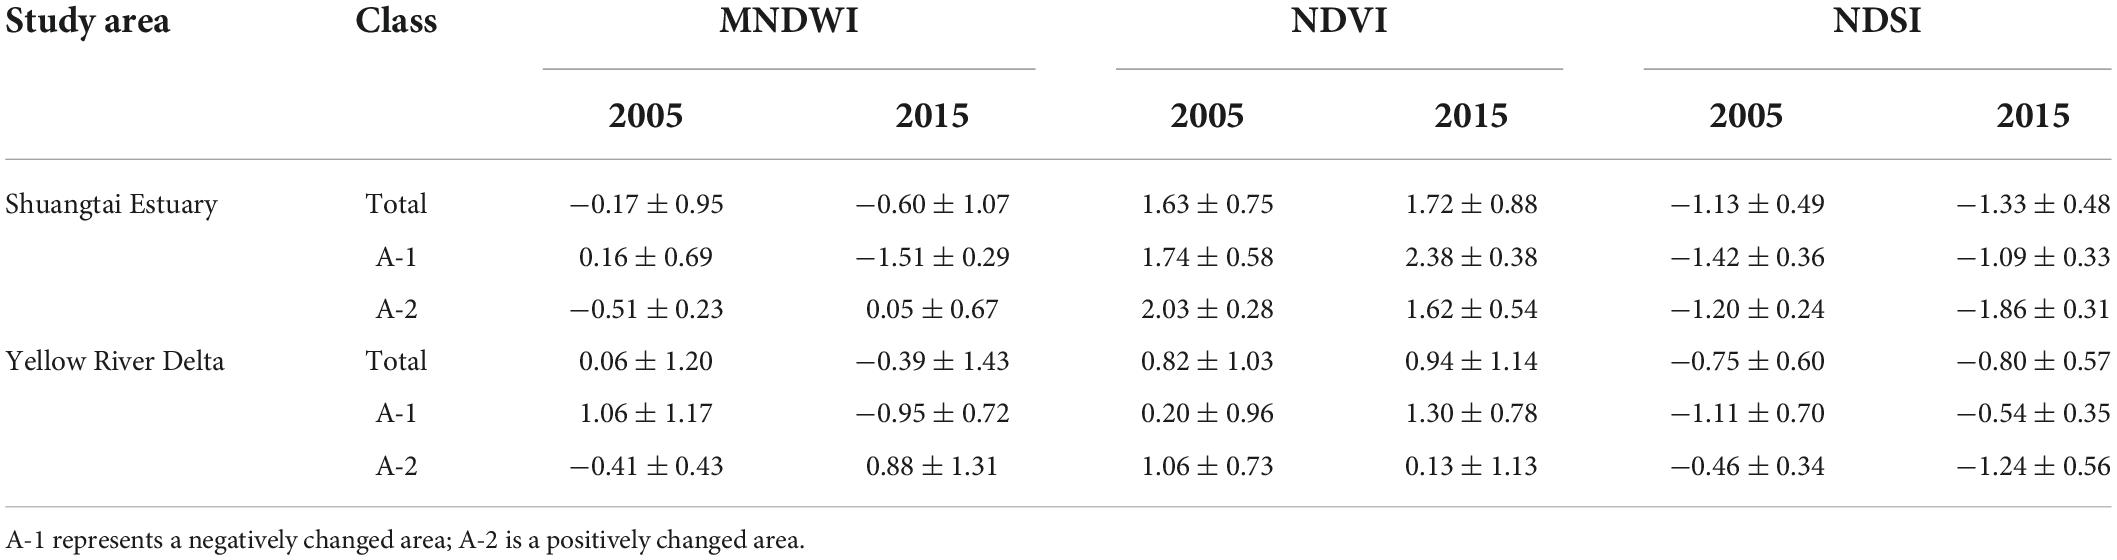
Table 7. The spatial accumulation of ecological indicators in the changing area.
Over the past 10 years, the changes to ecological factors in the positively changed area of the YRD included the increased accumulation of MNDWI (0.88, 2015), the decreased accumulation of NDVI, and the increased accumulation of NDSI (−1.24, 2015). Meanwhile, the ecological factors in the negatively changed area show obvious opposite characteristics, with the decreased MNDWI, and the increased NDVI, and the decreased NDSI.
In conclusion, the hydrological fluctuation was one of ecological change factors in Shuangtai Estuary and YRD, with the obvious regional difference such as the increased MNDWI in the positively changed area and the decreased MNDWI in the negatively changed area. The terrestrial vegetation was one of the main changing ecological factors in the Shuangtai Estuary wetlands, with the obvious local change feature.
The multi-dimensional dataset is constructed with land-surface ecological indexes such as MNDWI, NDVI, and NDSI, which were conducted to extract the land-cover types in 2005 and 2015. SVM algorithm is used as the classification method based on the multi-dimensional dataset. The classification results and classification accuracy are shown in Figure 6. From 2005 to 2015, the constructed area in the Shuangtai Estuary wetland increased to 16.25%, mainly contributed by reclaiming land from the sea. The main wetland types included paddy and marsh, the spatial distribution areas of which were relatively stable, accounting for 24 and 32%, respectively. The wetland cover types in the YRD were relatively complex, and the main change form was the large-scale expansion of the paddy field area from 1.7 to 6.39%.
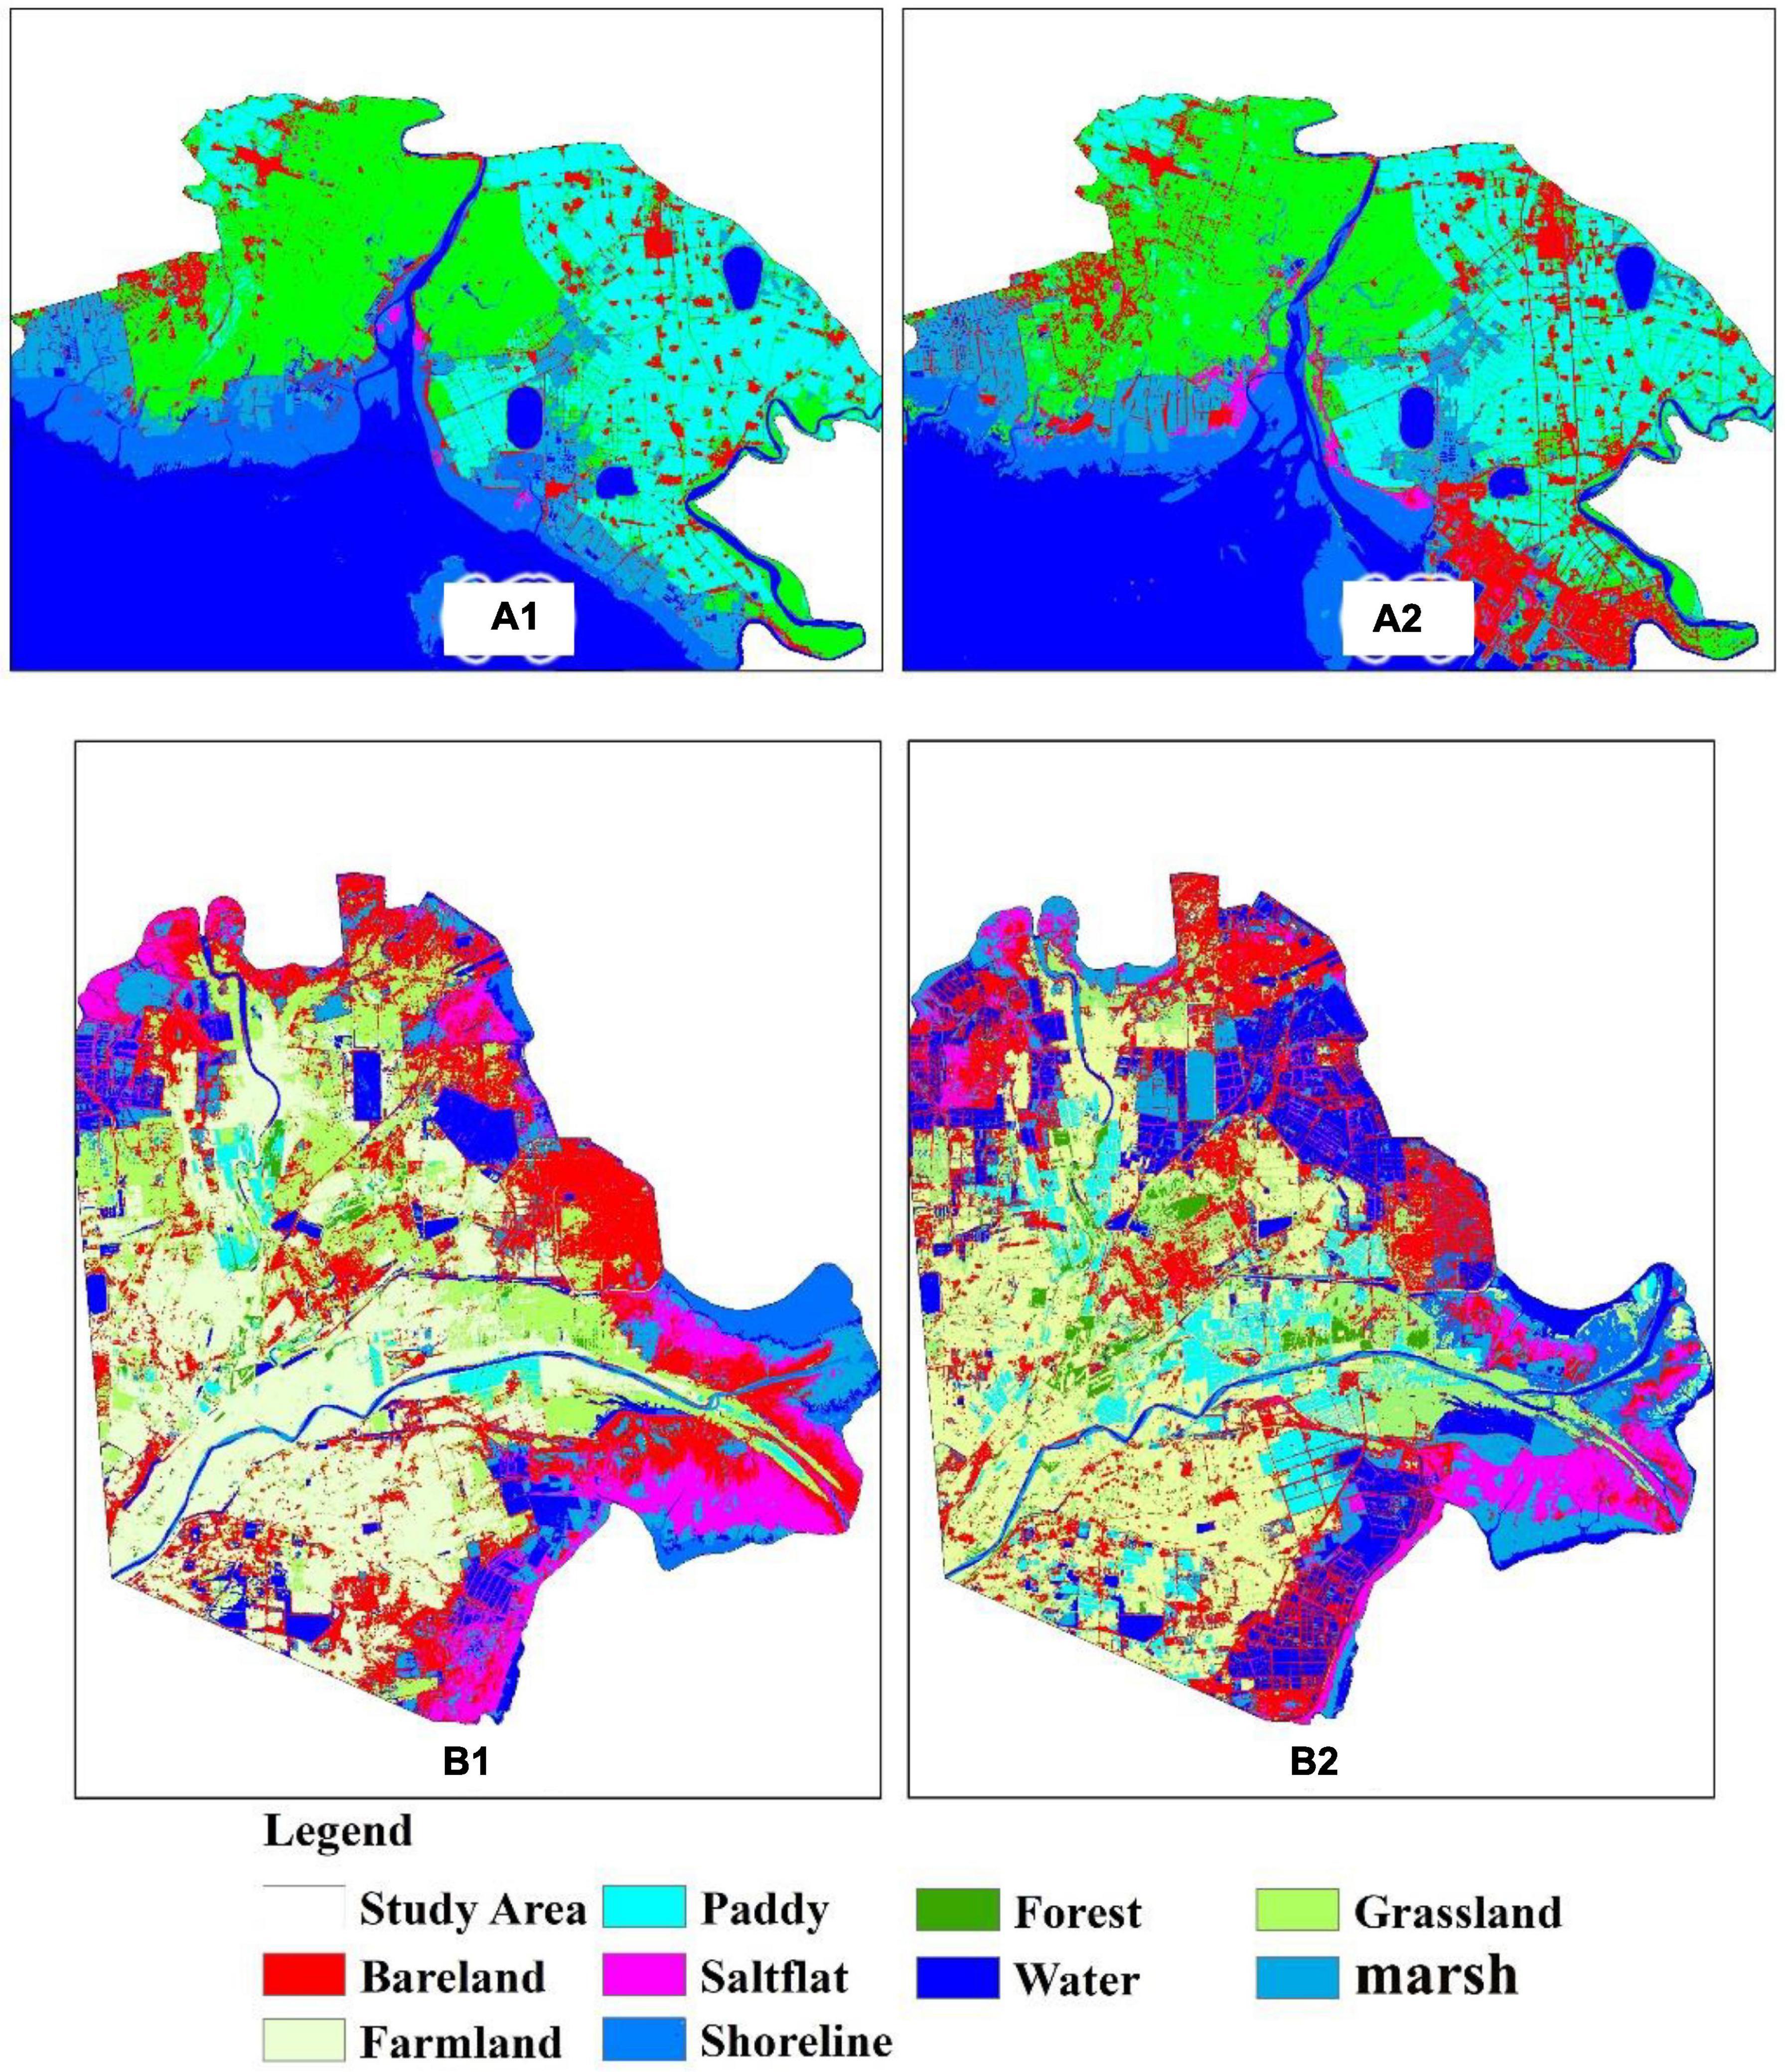
Figure 6. Classification results of (A) Shuangtai Estuary and (B) Yellow River Delta. (A1,B1) and (A2,B2) represents 2005 and 2015, respectively.
Combining the inter-annual significant level analysis and land-cover classification between 2005 and 2015, the superposition map of land-cover transformation is finally determined. To facilitate statistical analysis of the inter-annual transformation types of land-cover in the study area, the actual transformation of land-cover types is divided into four categories: the change of land-cover types converted into bare land (i.e., construction land, bare land, and salinized land), the change of land-cover types converted into forest/grassland, the change of land-cover types converted into water/wetlands (including marsh wetlands, reed wetlands, shoreline, and constant water bodies such as rivers and lakes), the change of land-cover types converted into farmland (rain-fed lands), and the change of land-cover types converted into paddy (Figure 7).
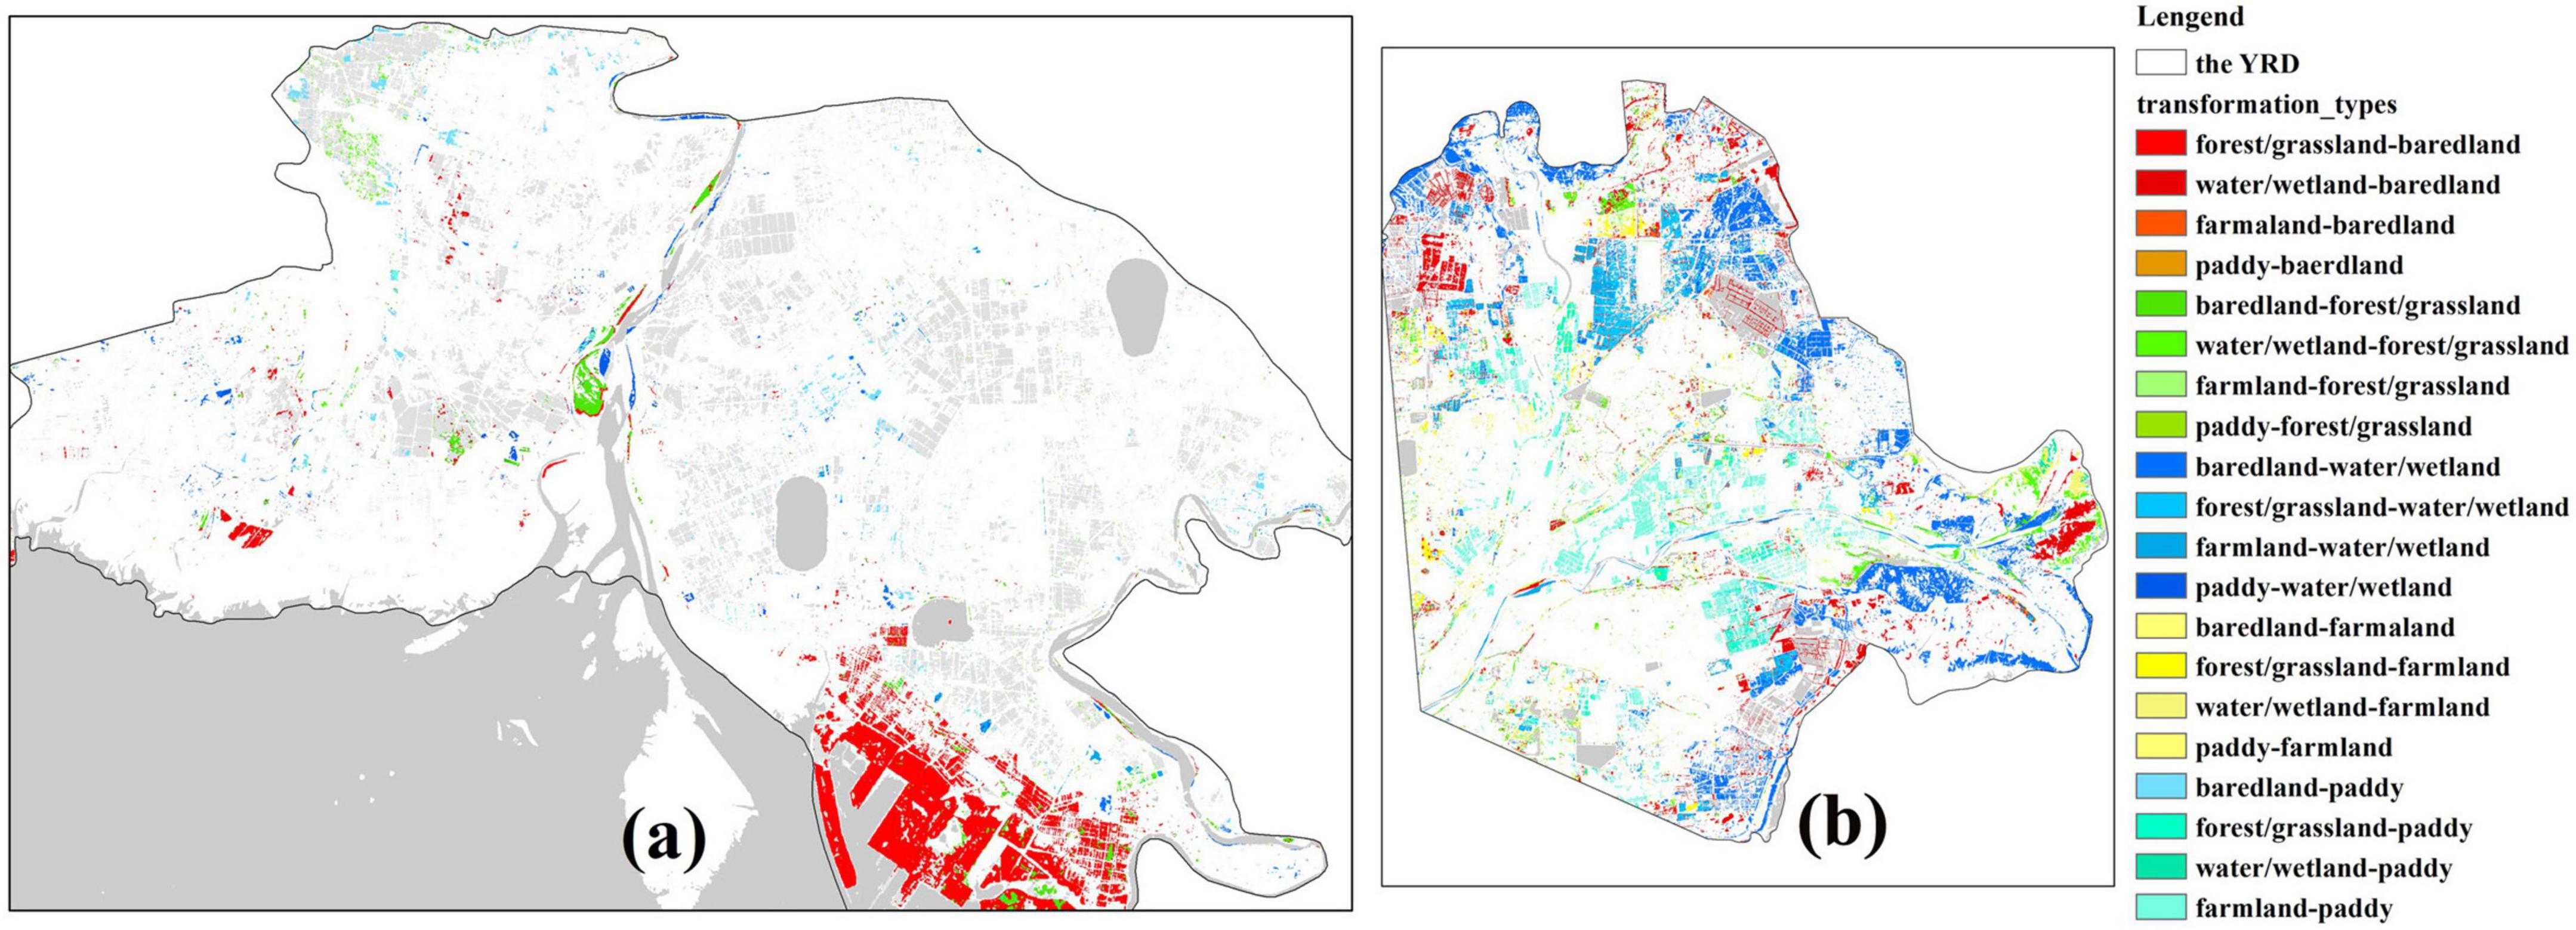
Figure 7. The inter-annual transformation types of land-cover from 2005 to 2015 in the (a) Shuangtai Estuary and (b) Yellow River Delta.
The changing area of land-cover in STEST was 217 km2. The main changed land type was the expansion of the urban area, accounting for 69.15% of the total change area. The changing area in the YRD was 536 km2. The expansion of natural water areas and the variation of soil dry-wet degree are the main driving factors for the change of land cover type in the changing area. The expansion of both water and paddy accounted for 43.93% of the total change area.
The S-1, -2, -3, and -4 is a percentage of land-cover types in the STEST and YRD, represents the change of land-cover types converted into bare land, converted into forest/grassland, converted into water/wetlands, and converted into farmland (rain-fed lands and paddy), respectively. The change in 2005 represents the transfer-out type of a land cover in the changing area; 2015 represents the transfer-into type of a land cover.
The mainly transferred land-cover types converted into constant water bodies, and marsh accounted for 91.08% of the negatively changed areas in the Shuangtai River Estuary wetland (Figure 8).
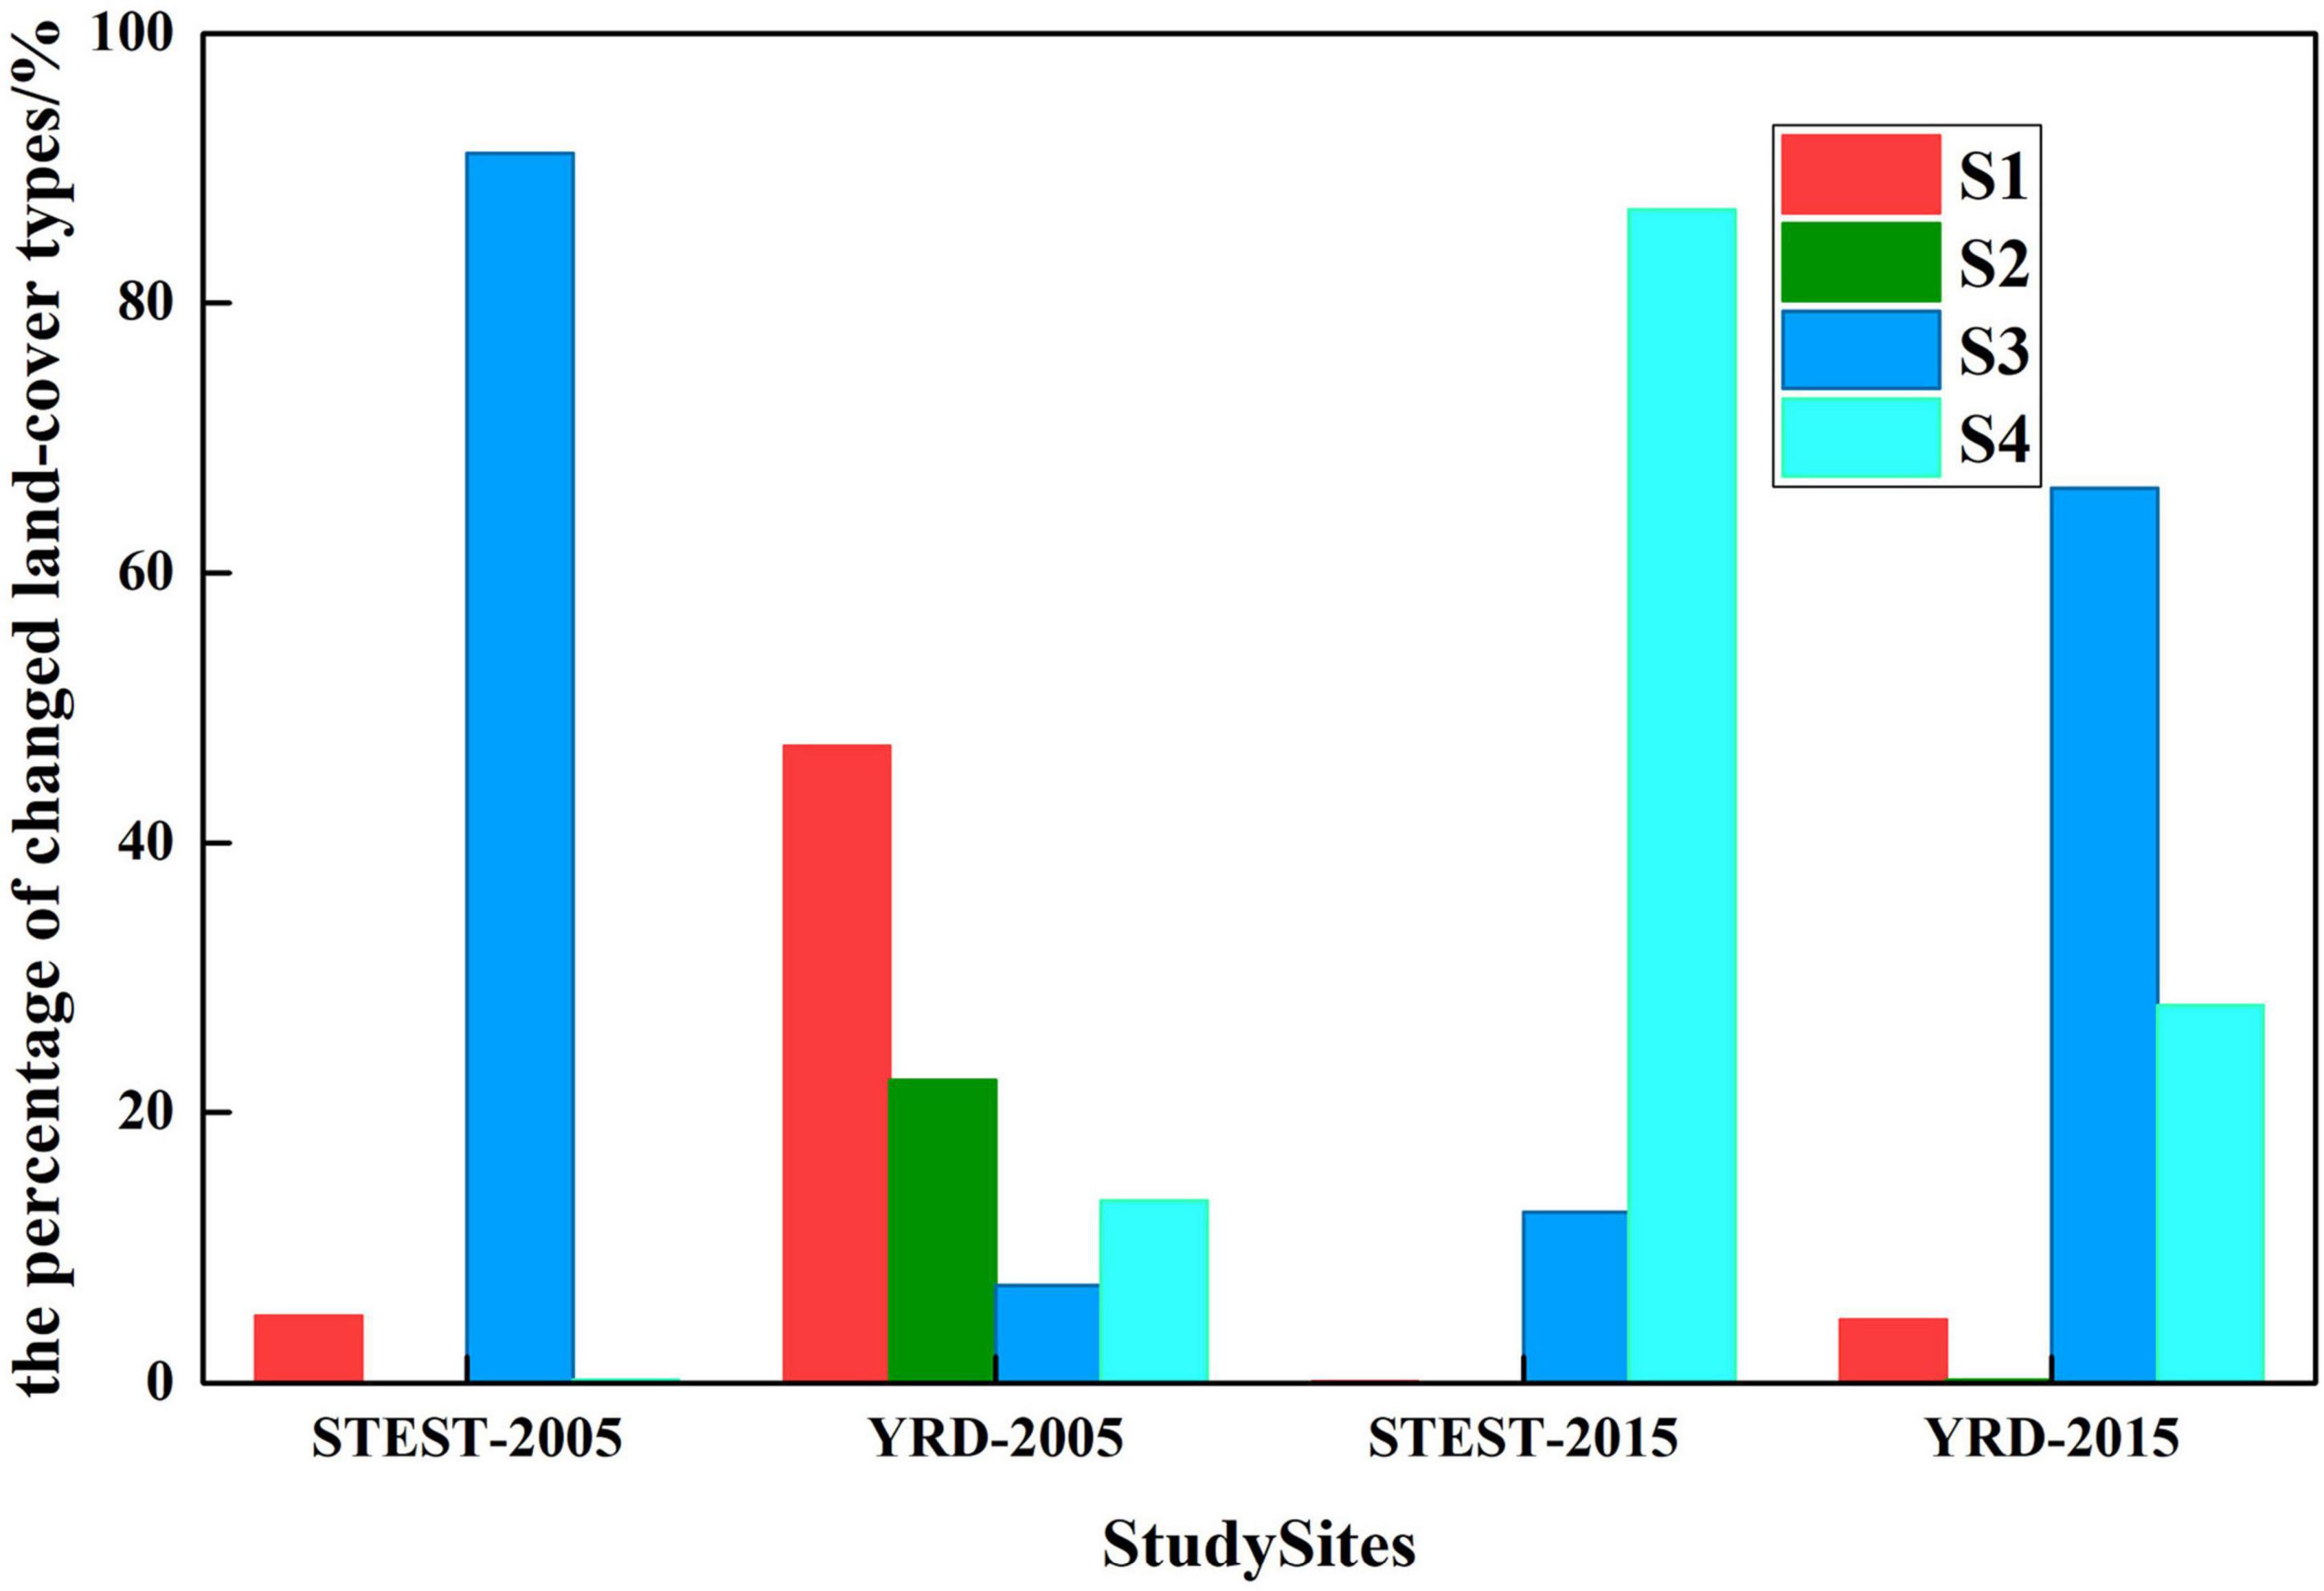
Figure 8. The percentage of transferred land-cover types in the changing area.
The expanded constant-water areas were the mainly changed form of land-cover types in the positively changed areas of both the STEST and YRD, with the percentage of 86.93 and 27.94%, respectively. In addition, the expanded constant-water areas of marshland accounted for 12.61 and 66.29% of the positively changed areas, respectively (Figure 8).
Combined with the transformation results of land-covers from 2005 to 2015 (Figure 8), the improvement of wetlands between the STEST and YRD have significant form. The expansion of reed wetland in the STEST is the mainly changed form of wetland, with the decreased accumulation of MNDWI (−0.52 ± 0.84, 2015) and the increased spatial accumulation of NDVI (1.92 ± 0.54, 2015) (Table 8). However, the expansion of constant water bodies in YRD is the mainly changed form of wetland, with the increased accumulation of MNDWI (1.42 ± 1.27, 2015) and the decreased spatial accumulation of NDVI (−0.41 ± 0.93, 2015). The increase of paddy field is the common characteristic of the study area, and its impact on the ecological environment is also very consistent, with the increased spatial accumulation of MNDWI (−0.13 ± 0.49, STEST; −0.37 ± 0.47, YRD) and the decreased accumulation of NDVI (1.69 ± 0.27, STEST; 1.43 ± 0.29, YRD). The expansion of the paddy field in the study area increased the spatial distribution and accumulation of MNDWI to a certain extent. It is worth mentioning that the expansion of forest/grassland significantly increased the surface biomass (2.07 ± 0.36, YRD), especially in the YRD.
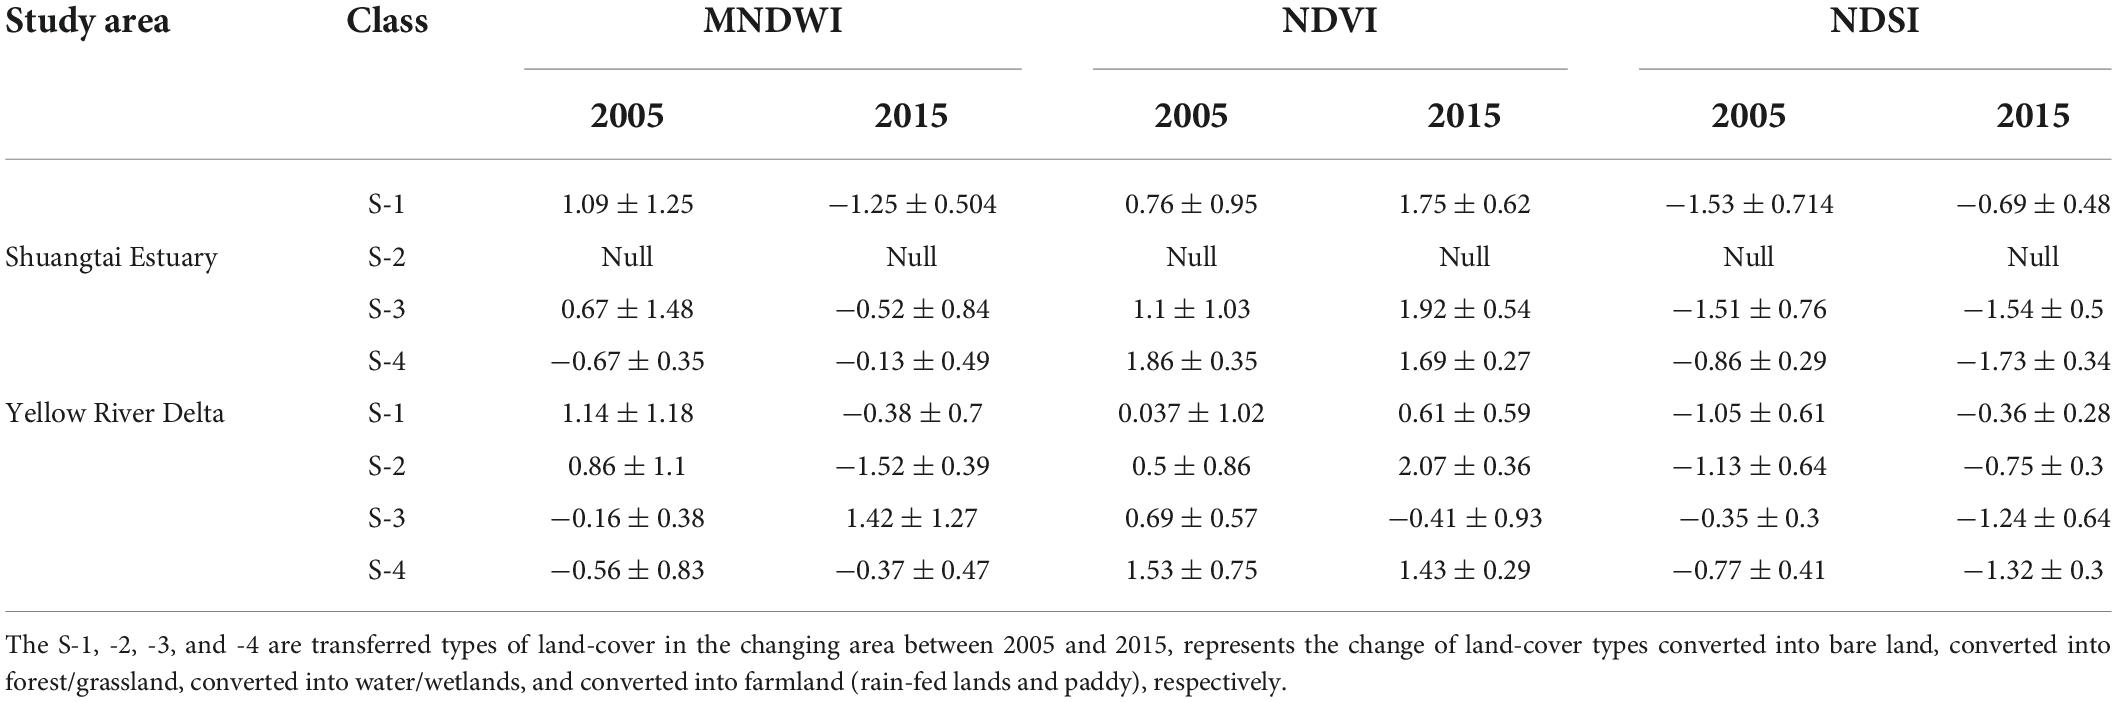
Table 8. The spatial accumulation of ecological indicators and the transferred land cover-types in the changing area.
All coastal provinces and metropolises in China have experienced severe ecological degradation of coastal wetland, related to land ecological security caused by rapid economic growth and urbanization (Tian et al., 2016). Ren et al. (2018) confirmed the conversions from mudflat to aquaculture ponds led to the loss of natural wetland, accounting for 30% of the coastal zone in China. And then, the growing rate of aquaculture ponds varied, with a particularly rapid increase occurring between 2010 and 2015, from 11 to 16% of the total area and being 93.5 km2 per year. Meanwhile, natural wetlands were the largest cover type that was changed to the aquaculture ponds and accounted for 55% of the gain area of aquaculture ponds in the Yellow River Estuary. Ma et al. (2015) reported that aquaculture ponds in the coastal region of the YRD kept rising from 1983 to 2015 with an average speed of 42.70 km2 per year (Ren et al., 2019). Previous studies and our study have found a similar change feature in the increase of coastal farmland area and also validated that the duration of rapid expansion at hotspots was consistent with national scale statistics (Ma et al., 2015). Under the development policy of national agriculture, advances in irrigation further altered regional hydrological conditions and facilitated the expansion of paddy fields in Inland alluvial plains, China (Zou et al., 2018a,b). Therefore, paddy field reclamation accounted for 9.15 and 18.3% of the total change area in STEST and YRD, respectively.
This study, together with current works (Ge et al., 2016; Zhang et al., 2022), to a certain extent, is a contribution to the coastal wetland resource study. However, we must also recognize that the species invasion resulted in the complexity and uncertainty of wetland change detection to some extent. For example, Spartina alterniflora is an invasive species of coastal wetlands that can expand to 40°N latitude, causing a decrease in both native population diversity and ecosystem function. In contrast, the rapid expansion of S. alterniflora would make it the leading contributor to primary production in the coastal marshes, especially because they have higher photosynthesis efficiency, higher LAI, and longer growing season (Pekel et al., 2016; Wang et al., 2020).
In addition, the image quality and the amount of Landsat data remain to be a concern. Due to Landsat’s 16-day revisit cycle, it is uncertain whether to be detected some instantaneous wetland change events, such as intertidal wetland (Ge et al., 2016; Zhang et al., 2022). Some wetland changes are smaller than the resolution of 30 m and thus could not be mapped by Landsat. For this reason, the areas of seasonal and ephemeral wetland changes are likely to be underestimated.
It is found that different conversions of land cover types have different effects on the accumulation of MNDWI, NDVI, and NDSI in the study area. The influence of wetland change on ecological environment factors is far more than that. The coastal wetland loss will also cause great changes in soil physical and chemical properties due to the destruction of the habitat (Musseau et al., 2017; Spivak et al., 2019). Bai et al. (2013) found that the EC of the paddy field was significantly higher than that in other land cover-types, possibly because the application of irrigated water from adjacent ditches led to an increase in and accumulation of soil salinity in surface soils. Additionally, the pH of the wetland is sensitive to land management techniques such as fertilization (Kalbitz et al., 2012). Increasing the pH of wetland that occurs during coastal reclamation normally hurts soil organic matter. This is because high wetland pH, only observed in reed marsh and rain-fed farmland, usually limits the plant growth, leading to a decrease of plant carbon source into soils (Zhang et al., 2016).
The phenological information in the wetland change detection has been increasingly concerned (Wiski and Pennings, 2014). The significant changes in the phenological information of wetlands are mainly caused by invasive species. For example, earlier emergence, later senescence, or both, which often result in a longer growth period (Liao et al., 2007; Fridley, 2012). Additionally, Zhang et al. (2022) quantitatively studied wetland changes caused by plant invasion from the perspective of phenological information. In the invasion of S. alterniflora into the intertidal zone, the ecological changes of coastal wetland showed significant zonal patterns in latitudinal phenology variation with the increase of accumulated biomass.
A study highlights that the population of shorebirds in Austria declines is occurring despite high levels of intertidal habitat protection (Dhanjal-Adams et al., 2016). These findings pointed out that the impact of wetland degradation on the ecological environment was far-reaching and even difficult to change for a while, and it is not easy to achieve protection effect (Song et al., 2020). So that immediate and concerted effort is needed both nationally and internationally to effectively habitat conservation.
Terrestrial land-cover annual change detection is achieved by the combination of the maximum difference, which was used to calculate the annual variation of ecological factors in the study area and the analysis of the normalized PC-1. The inter-annual change detection is divided into ranges calculated by the dynamic ratio, and the change direction was determined through PCA. The inter-annual transformation type of land cover is obtained by combining classification results and the dynamic change range.
(1) The OA and KC of the classification results in Shuangtai Estuary and YRD reached 84.433% (0.8175) and 75.616% (0.7245), respectively. The ecological environment in the study area is affected by human activities and natural factors. It has complex land-cover types, which is ideal for the accuracy verification of ecological change detection methods. The Shuangtai Estuary is a reed marsh and a rice-producing region and the main coastal economic development zone in north China. The YRD is one of the fastest-growing wetlands in the world.
(2) From 2005 to 2015, the ecological change of two monitoring areas in northern China was an improvement trend on the whole. The percentage of the positively changed areas in the Shuangtai Estuary and the YRD accounted for 60.69 and 62.16%, respectively. Meanwhile, the annual ecological fluctuation grades were significantly enhanced in the improved range of ecological factors in the study area, with the obvious seasonal variation characteristics of ecological factors.
(3) In this change detection between 2005 and 2015, conversing from non-wetland into the natural wetland positively affects the ecological environment, such as the increased accumulation of MNDWI and NDVI. Meanwhile, the changes converted into farmland (rain-fed lands and paddy) negatively affect the ecological environment in the study area, with the decreased accumulation of NDVI. The increased accumulation of water/vegetation related to the conversion from land cover-types into natural wetlands to a certain extent, but which was far less than the effect of forest and grassland on the ecological factors in the study area. At the same time, the cumulative effect of wetland on ecological factors was significantly different in various regions. Different wetland changes have different effects on terrestrial MNDWI, NDVI, and NDSI.
The dynamic ratio method provides improved accuracy and efficiency during large-scale resource inventories and environmental surveys. DRM provides improved accuracy and efficiency during large-scale resource inventories and environmental surveys.
The original contributions presented in the study are included in the article/supplementary material, further inquiries can be directed to the corresponding author.
XL: conceptualization, methodology, and writing–original draft. GL: formal analysis, editing, supervision, and funding acquisition. Both authors contributed to the article and approved the submitted version.
This study was supported in part by research grants from the Key Laboratory of Coastal Salt Marsh Ecosystems and Resources, Ministry of Natural Resources (KLCSMERMNR2021103), the Doctoral Research Foundation of Binzhou University (801002020107), and the National Key Research and Development Project of China (2016YFB0501502).
We would like to thank the reviewers for their constructive suggestions and comments.
The authors declare that the research was conducted in the absence of any commercial or financial relationships that could be construed as a potential conflict of interest.
All claims expressed in this article are solely those of the authors and do not necessarily represent those of their affiliated organizations, or those of the publisher, the editors and the reviewers. Any product that may be evaluated in this article, or claim that may be made by its manufacturer, is not guaranteed or endorsed by the publisher.
Bai, C. (2020). Scientific and technological innovation leads high-quality development of agriculture in the Yellow River Delta. Bull. Chin. Acad. Sci. 35, 138–144.
Bai, J., Xiao, R., Zhang, K., Gao, H., Cui, B., and Liu, X. (2013). Soil organic carbon as affected by land use in young and old reclaimed regions of a coastal estuary wetland, China. Soil Use Manage. 29, 57–64. doi: 10.1111/sum.12021
Coppin, P., Jonckheere, I., Nackaerts, K., Muys, B., and Lambin, E. (2004). Digital change detection methods in ecosystem monitoring: A review. Int. J. Remote Sens. 25, 1565–1596. doi: 10.1080/0143116031000101675
Deng, Y., Wu, C., Li, M., and Chen, R. (2015). RNDSI: A ratio normalized difference soil index for remote sensing of urban/suburban environments. Int. J. Appl. Earth Obs. Geoinf. 39, 40–48. doi: 10.1016/j.jag.2015.02.010
Dhanjal-Adams, K. L., Hanson, J. O., Murray, N. J., Phinn, S. R., Wingate, V. R., Mustin, K., et al. (2016). The distribution and protection of intertidal habitats in Australia. EMU Austral Ornithol. 116, 208–214. doi: 10.1071/MU15046
Fridley, J. D. (2012). Extended leaf phenology and the autumn niche in deciduous forest invasions. Nature 485, 359–362. doi: 10.1038/nature11056
Ge, Z., Guo, H., Zhao, B., Zhang, C., Peltola, H., and Zhang, L. (2016). Spatiotemporal patterns of the gross primary production in the salt marshes with rapid community change: A coupled modeling approach. Ecol. Model. 321, 110–120. doi: 10.1016/j.ecolmodel.2015.11.003
Jiao, Y., Xiao, D., Ma, M., and Yang, G. (2003). Comparative research on the patterns of the landscapes in the Typical Oases in the Hexi Corridor -A case study in the Zhangye, Linze, Gaotai and Jiuquan Oases. Arid Zone Res. 2, 81–85.
Kalbitz, K., Kaiser, K., Fiedler, S., Kölbl, A., Amelung, W., Bräuer, T., et al. (2012). The carbon count of 2000 years of rice cultivation. Glob. Change Biol. 19, 1107–1113. doi: 10.1111/gcb.12080
Liao, C., Luo, Y., Jiang, L., Zhou, X., Wu, X., Fang, C., et al. (2007). Invasion of spartina alterniflora enhanced ecosystem carbon and nitrogen stocks in the Yangtze estuary, China. Ecosystems 10, 1351–1361. doi: 10.1007/s10021-007-9103-2
Liu, J. (2018). A study on collaborative extraction method of typical land surface types and the evaluation of ecological environment in the Yellow River Delta using remote sensing. Beijing: University of Chinese Academy of Sciences.
Lu, D., Mausel, P., Brondízio, E., and Moran, E. (2004). Change detection techniques. Int. J. Remote Sens. 25, 2365–2401. doi: 10.1080/0143116031000139863
Ma, T., Liang, C., Li, X., Xie, T., and Cui, B. (2015). Quantitative assessment of impacts of reclamation activities on coastal wetlands in China. Wetl. Sci. 13, 653–659.
Mao, D., Wang, Z., Du, B., Li, L., Tian, Y., Jia, M., et al. (2020). National wetland mapping in China: A new product resulting from object-based and hierarchical classification of Landsat 8 OLI images. ISPRS J. Photogram. Remote Sens. 164, 11–25. doi: 10.1016/j.isprsjprs.2020.03.020
Mao, D., Wang, Z., Wu, J., Wu, B., Zeng, Y., Song, K., et al. (2018). China’s wetlands loss to urban expansion. Land Degrad. Dev. 29, 2644–2657. doi: 10.1002/ldr.2939
Musseau, R., Beslic, S., and Kerbiriou, C. (2017). Importance of intertidal wetlands for the French coastal endemic Bluethroat Cyanecula svecica namnetum and conservation implications in the context of global changes. Ardeola 64, 325–345. doi: 10.13157/arla.64.2.2017.ra3
Ouyang, Z., Wang, H., Lai, J., Wang, C., Liu, Z., Sun, Z., et al. (2020). New approach of high-quality agricultural development in the Yellow River Delta. Bull. Chin. Acad. Sci. 35, 145–153.
Pekel, J. F., Cottam, A., Gorelick, N., and Belward, A. S. (2016). High-resolution mapping of global surface water and its long-term changes. Nature 540, 418–422. doi: 10.1038/nature20584
Qin, Y., Niu, Z., Chen, F., Li, B., and Ban, Y. (2013). Object-based land cover change detection for cross-sensor images. Int. J. Remote Sens. 34, 6723–6737. doi: 10.1080/01431161.2013.805282
Ren, C., Wang, Z., Zhang, B., Li, L., Chen, L., Song, K., et al. (2018). Remote Monitoring of Expansion of Aquaculture Ponds along Coastal Region of the Yellow River Delta from 1983 to 2015. Chin. Geogr. Sci. 28, 430–442. doi: 10.1007/s11769-017-0926-2
Ren, C., Wang, Z., Zhang, Y., Zhang, B., Chen, L., Xi, L., et al. (2019). Rapid expansion of coastal aquaculture ponds in China from Landsat observations during 1984-2016. Int. J. Appl. Earth Obs. Geoinf. 82:101902. doi: 10.1016/j.jag.2019.101902
Rouse, J. W., Haas, R. H., Schell, J. A., and Deering, D. W. (1973). “Monitoring vegetation systems in the Great Plains with ERTS,” in Proceedings of the 1973 Third ERTS Symposium, NASA SP-351, Washington DC, 309–317.
Song, S., Wu, Z., Wang, Y., Cao, Z., and Su, Y. (2020). Mapping the rapid decline of the intertidal wetlands of china over the past half century based on remote sensing. Front. Earth Sci. 8:16. doi: 10.3389/feart.2020.00016
Spivak, A. C., Sanderman, J., Bowen, J. L., Canuel, E. A., and Hopkinson, C. S. (2019). Global-change controls on soil-carbon accumulation and loss in coastal vegetated ecosystems. Nat. Geosci. 12, 685–692. doi: 10.1038/s41561-019-0435-2
Su, F., Liu, H., Zhu, D., Li, L., and Wang, T. (2020). Sustainability assessment of the Liaohe Estuary wetland based on emergy analysis. Ecol. Indic. 119:106837. doi: 10.1016/j.ecolind.2020.106837
Tian, B., Wu, W. T., Yang, Z. Q., and Zhou, Y. (2016). Drivers, trends, and potential impacts of long-term coastal reclamation in China from 1985 to 2010. Estuar. Coast. Shelf Sci. 170, 83–90. doi: 10.1016/j.ecss.2016.01.006
Walter, M., and Mondal, P. (2019). A rapidly assessed wetland stress index (RAWSI) using landsat 8 and sentinel-1 radar data. Remote Sens. 11:2549. doi: 10.3390/rs11212549
Wang, D., Hu, K., Ma, P. F., and Liu, X. (2015). Land use and land cover change and their driving forces in the nature reserve of Shuangtai River Estuary in the past 30 years. J. Mar. Sci. 33, 51–61.
Wang, S., Liu, Y., Chen, L., Yang, H., Wang, G., Wang, C., et al. (2021). Effects of excessive nitrogen on nitrogen uptake and transformation in the wetland soils of Liaohe estuary, northeast China. Sci. Total Environ. 791:148228. doi: 10.1016/j.scitotenv.2021.148228
Wang, X., Xiao, X., Zou, Z., Dong, J., Qin, Y., Doughty Russell, B., et al. (2020). Gainers and losers of surface and terrestrial water resources in China during 1989-2016. Nat. Commun. 11:3471. doi: 10.1038/s41467-020-17103-w
Wiski, K., and Pennings, S. C. (2014). Climate drivers of spartina alterniflora saltmarsh production in Georgia, USA. Ecosystems 17, 473–484. doi: 10.1007/s10021-013-9732-6
Xiao, D. N., Li, X. Y., and Song, D. M. (2005). Landscape changes and ecological reconstruction in Minqin Huqu Oasis. Acta Ecol. Sin. 25, 2477–2483.
Xiao, P., Zhang, X., Wang, D., Yuan, M., Feng, X., and Kelly, M. (2016). Change detection of built-up land: A framework of combining pixel-based detection and object-based recognition. ISPRS J. Photogram. Remote Sens. 119, 402–414. doi: 10.1016/j.isprsjprs.2016.07.003
Xu, H., Wang, Y., Guan, H., Shi, T., and Hu, X. (2019). Detecting Ecological Changes with a Remote Sensing Based Ecological Index (RSEI) Produced Time Series and Change Vector Analysis. Remote Sens. 11:2345. doi: 10.3390/rs11202345
Xu, H. Q. (2006). Modification of normalized difference water index (NDWI) to enhance open water features in remotely sensed imagery. Int. J. Remote Sens. 27, 3025–3033. doi: 10.1080/01431160600589179
Xu, W., Fan, X., Ma, J., Pimm, S. L., Kong, L., Zeng, Y., et al. (2019). Hidden loss of wetlands in China. Curr Biol. 29, 3065–3071. doi: 10.1016/j.cub.2019.07.053
Xu, X., Zhao, M., and Min, X. (2014). Main progress and prospect of Urban expansion study. Ecol. Sci. 33, 619–624.
Yang, H., Xing, L., and Zhang, L. (2020). Study on green development model and approach of blue agriculture in the Yellow River Delta. Bull. Chin. Acad. Sci. 35, 175–182.
Yang, J., Ma, Y., Ren, G., Zhang, J., and Fan, Y. (2017). Monitoring method of invasive vegetation Spartina alterniflora in modern Yellow River delta based on gf remote sensing data. Mar. Environ. Sci. 36, 596–602.
Yang, W., Jin, Y.-W., Sun, L., Sun, T., and Shao, D.-D. (2019). Determining the intensity of the trade-offs among ecosystem services based on production-possibility frontiers: Model development and a case study. J. Nat. Resour. 34, 2516–2528. doi: 10.31497/zrzyxb.20191203
Yu, J., Liu, Y., Ren, Y., Ma, H., Wang, D., Jing, Y., et al. (2020). Application Study on Double-Constrained Change Detection for Land Use/Land Cover Based on GF-6 WFV Imageries. Remote Sensing. 12, 2943. doi: 10.3390/rs12182943
Zha, Y., Ni, S. X., and Yang, S. (2003). An effective approach to automatically extract urban land-use from TM imagery. J. Remote Sens. 7, 37–40.
Zhang, H., Wu, P., Yin, A., Yang, X., Zhang, X., Zhang, M., et al. (2016). Organic carbon and total nitrogen dynamics of reclaimed soils following intensive agricultural use in eastern China. Agric. Ecosyst. Environ. 235, 193–203. doi: 10.1016/j.agee.2016.10.017
Zhang, X., Xiao, X., Qiu, S., Xu, X., Wang, X., Chang, Q., et al. (2022). Quantifying latitudinal variation in land surface phenology of Spartina alterniflora saltmarshes across coastal wetlands in China by Landsat 7/8 and Sentinel-2 images. Remote Sens. Environ. 269:112810. doi: 10.1016/j.rse.2021.112810
Zhu, L., La, Y. X., Shi, R. M., and Peng, S. (2019). “Land cover spurious change detection using a geo-eco Zoning Rule Base,” in Proceeding of the 2019 IEEE International Geoscience and Remote Sensing Symposium, Yokohama, 28–31. doi: 10.1109/IGARSS.2019.8898124
Zhuang, H., Fan, H., Deng, K., and Yao, G. (2018). A spatial-temporal adaptive neighborhood-based ratio approach for change detection in SAR images. Remote Sens. 10:1295. doi: 10.3390/rs10081295
Zou, Y. C., Duan, X., Xue, Z. S., Sun, M., Lu, X., Jiang, M., et al. (2018a). Water use conflict between wetland and agriculture. J. Environ. Manage. 224, 140–146. doi: 10.1016/j.jenvman.2018.07.052
Keywords: the change detection, the dynamic ratio, the Shuangtai Estuary wetland, the Yellow River Delta, Bohai Rim region
Citation: Li X and Liu G (2022) Study on the change monitoring of typical estuarine wetland and its effect on ecological factors in Bohai Rim region, China. Front. Ecol. Evol. 10:967593. doi: 10.3389/fevo.2022.967593
Received: 13 June 2022; Accepted: 29 August 2022;
Published: 10 October 2022.
Edited by:
Sijia Li, Northeast Institute of Geography and Agroecology (CAS), ChinaReviewed by:
Zhigang Cao, Nanjing Institute of Geography and Limnology (CAS), ChinaCopyright © 2022 Li and Liu. This is an open-access article distributed under the terms of the Creative Commons Attribution License (CC BY). The use, distribution or reproduction in other forums is permitted, provided the original author(s) and the copyright owner(s) are credited and that the original publication in this journal is cited, in accordance with accepted academic practice. No use, distribution or reproduction is permitted which does not comply with these terms.
*Correspondence: Ge Liu, bGl1Z2VAaWdhLmFjLmNu
Disclaimer: All claims expressed in this article are solely those of the authors and do not necessarily represent those of their affiliated organizations, or those of the publisher, the editors and the reviewers. Any product that may be evaluated in this article or claim that may be made by its manufacturer is not guaranteed or endorsed by the publisher.
Research integrity at Frontiers
Learn more about the work of our research integrity team to safeguard the quality of each article we publish.