 Takeru Nakazato
 Utsugi Jinbo
- 1Database Center for Life Science (DBCLS), Joint Support-Center for Data Science Research (ROIS-DS), Research Organization of Information and Systems (ROIS), Mishima, Japan
- 2Center for Collections, National Museum of Nature and Science, Tsukuba, Japan
Museomics is an approach to the DNA sequencing of museum specimens that can generate both biodiversity and sequence information. In this study, we surveyed both the biodiversity information-based database BOLD (Barcode of Life System) and the sequence information database GenBank, by using DNA barcoding data as an example, with the aim of integrating the data from these two databases. DNA barcoding is a method of identifying species from DNA sequences by using short genetic markers. We surveyed how many entries had biodiversity information (such as links to BOLD and specimen IDs) by downloading all fish, insect, and flowering plant data available from the GenBank Nucleotide, and BOLD ID was assigned to 26.2% of entries for insects. In the same way, we downloaded the respective BOLD data and checked the status of links to sequence information. We also investigated how many species do these databases cover, and 7,693 species were found to exist only in BOLD. In the future, as museomics develops as a field, the targeted sequences will be extended not only to DNA barcodes, but also to mitochondrial genomes, other genes, and genome sequences. Consequently, the value of the sequence data will increase. In addition, various species will be sequenced and, thus, biodiversity information such as the evidence specimen photographs used as a basis for species identification, will become even more indispensable. This study contributes to the acceleration of museomics-associated research by using databases in a cross-sectional manner.
Introduction
Museomics is, in very simple terms, an approach to DNA sequencing on museum specimens (Raxworthy and Smith, 2021). Museomics research generates both biodiversity and sequence information. Therefore, it is necessary to use these two data in an integrated manner. In this study, we surveyed both BOLD (Barcode of Life System; a biodiversity-based database)1 (Ratnasingham and Hebert, 2007) and GenBank2 (a sequence information database) (Sayers et al., 2022b), by using DNA barcoding data as an example, and attempted to merge the data obtained from these two databases.
DNA barcoding technology has been used in order to identify species from DNA sequences as short genetic markers (Hebert et al., 2003). The most commonly used barcode region for animals is a portion of the cytochrome c oxidase I (COI or COX1) gene, found in mitochondrial DNA. Other genes suitable for DNA barcoding are the internal transcribed spacer (ITS) rRNA (often used for fungi) and RuBisCO (used for plants). In addition, the development of massively parallel sequencing technology, also called “next-generation sequencing technology” (NGS), has also made it possible to comprehensively identify the biological flora in the observed environment (Buerki and Baker, 2016; Miya, 2022). Metagenome analysis is a technique used for profiling 16S rRNA and detecting functional genes by sequencing environmental samples on a large scale, without isolating or culturing the microorganisms contained in the samples. For animals, plants, and fungi, a method of large-scale detection of DNA barcodes with NGS can also be used in the form of metabarcoding, by combining DNA barcoding and NGS (Adamowicz et al., 2019; DeSalle and Goldstein, 2019). DNA barcoding technology interests not only biodiversity researchers such as taxonomists and phylogeneticists, but also molecular biologists and bioinformaticians involved in the performance of metagenomics.
DNA barcoding requires a database for querying sequences of DNA barcodes as genetic markers, and the species information identified by the DNA barcode (or the specimen information required in order to identify the species). BOLD (see text footnote 1) is a popular database of DNA barcodes for animals and plants (Ratnasingham and Hebert, 2007), and so is UNITE3 for fungi (Nilsson et al., 2019). DNA barcodes also include DNA sequence aspects; thus, DNA barcodes have also been deposited in the NCBI (National Center for Biotechnology Information, US) GenBank Nucleotide (see text footnote 2); a database of nucleotide sequences. BOLD and GenBank Nucleotide collect DNA barcode data separately, and import the data from each other. However, the contents are different due to the difference in their backgrounds.
BOLD is an informatics workbench aiding the acquisition, storage, analysis, and publication of DNA barcode records; it was launched in 2005 (Ratnasingham and Hebert, 2007). BOLD provides about 11 million barcodes, thereby indexing 239,000 animals, 71,000 plants, and 24,000 fungi and other species as of May 2022. BOLD requires data with the following seven elements in order for them to qualify as a specimen record with a formal DNA barcode status: (i) species name, (ii) voucher data (catalog number and institution storing), (iii) collection record (collector, collection date, and location with GPS coordinates), (iv) identifier of the specimen, (v) barcode sequence, (vi) PCR primers used in order to generate the amplicon, and (vii) trace files (Ratnasingham and Hebert, 2007). BOLD has been widely used, especially by taxonomists and phylogeneticists, for the referencing of biodiversity information assigned to DNA barcoding due to the large archive of photographic data of evidence specimens and the richness of information on specimens enabling the user to identify or to review for identification.
DNA sequences have been collected for more than 30 years by International Nucleotide Sequence Database Collaboration (INSDC)4 (Arita et al., 2021), that consists of NCBI5, the European Bioinformatics Institute (EBI)6, and the DNA Data Bank of Japan (DDBJ)7, and are provided as databases in the NCBI GenBank (Sayers et al., 2022b), the European Nucleotide Archive (ENA)8, and DDBJ9, respectively. In recent years, DNA barcodes, mitochondrial genomes, whole genomes, and other gene sequences have been obtained for various organisms, and sequence information has been archived in these databases. In addition, NGS data (including metagenomics and metabarcoding) are also collected by INSDC in the form of a Sequence Read Archive (SRA)10 (Sayers et al., 2022a). Molecular biologists and bioinformaticians usually perform their research from DNA sequence aspects, and make extensive use of the NCBI services dealing with DNA sequences.
Recently, it has become possible to register occurrence information based on sequences such as environmental DNA (eDNA) in the Global Biodiversity Information Facility (GBIF)11 ; the major database of biodiversity information (Andersson et al., 2020). In addition, GenBank is now also able to record much biodiversity information. In this study, we focus on DNA barcode data as an actual use scene of museomics, and point out the necessity of integrated use of BOLD and GenBank and the associated problems. We also propose that GenBank will become a useful resource for species identification by gene sequences other than the current DNA barcode region in the future. We believe that our work will accelerate future life science- and museomics-associated research employing biodiversity and sequence data (Groom et al., 2021).
Methods
Downloading GenBank data from national center for biotechnology information
We obtained all data on the base sequence of fish from NCBI. NCBI GenBank provides data on other vertebrates except mammals in the form of VRT divisions (for reference, they are distributed as HUM for humans, ROD for rodents, and MAM for mammals). We downloaded all VRT division data (gbvrt###.seq.gz, ### = 1–277) from the GenBank FTP site12 (as of December 2021). The files are distributed in FASTA format (Supplementary Figure 1). Subsequently, we extracted the entry containing “Actinopterygii” in the taxonomy hierarchy from the downloaded files, and created the entire data of the base sequence of fish.
As with fish, we downloaded the invertebrate data file provided as an INV division (gbinv###.seq.gz, ### = 1–461), as well as the plant and fungi data file distributed as a PLN division (gbpln###.seq.gz, ### = 1–723) from the NCBI FTP site. Subsequently, we extracted only the entries containing “Insecta” and “Magnoliopsida” in taxonomy tree from the downloaded data, respectively, and used them as insect and flowering plants data for the subsequent analyses.
Data extraction from GenBank
Data submitters can label their sequence as DNA barcoding data by describing “BARCODE” in the KEYWORD field of the GenBank entry (Supplementary Figure 1). We counted the number of data containing this description.
Moreover, the BOLD ID is listed in the db_xref qualifier in the “Features” field as the ID of the external database (Supplementary Figure 1). We extracted such BOLD IDs from the downloaded GenBank files. The BOLD ID is written after the description of “BOLD.” We looked at the number of BOLD IDs mentioned in GenBank and compared them with the BOLD data. GenBank provides qualifiers in order to record biodiversity information for the registration of gene sequences derived from specimens: voucher_specimen, lat_lon (latitude and longitude), altitude, collection_date, collected_by, identified_by, and country (Supplementary Figure 1). We surveyed how many entries were given these qualifiers related to biodiversity information. Finally, we especially extracted the specimen IDs listed in the specimen_voucher qualifier of the “Features” field.
Downloading barcode of life system data
We downloaded the public data of the DNA barcode of fish (Animals; Chordata; Actinopterygii)13 from the BOLD database. Herein, we downloaded the combined data in a tab-delimited format, containing both specimen and sequence data.
As with fish, we downloaded the data of flowering plants (Plants; Magnoliophyta; Magnoliopsida, see text footnote 13).
In addition, we attempted to obtain data on insects (Animals; Arthropoda; Insecta, see text footnote 13). However, BOLD’s web pages and APIs are so slow to respond, and the insect data are so extensive that it often seemed that the process had finished before all the data were downloaded. Therefore, we downloaded the specimen and sequence data separately instead of downloading them in the form of combined data. We, herein, attempted to download the data twice, and after confirming that the same data were obtained, the subsequent analysis was performed.
Data extraction from barcode of life system
From the downloaded BOLD data, we extracted BOLD IDs (Specimen ID, Sequence ID), data sources, taxonomic classifications (such as species_name and genus), linked GenBank IDs, and gene names. Especially, BOLD has imported data from GenBank and has labeled them as “Mined from GenBank, NCBI” in the institution_storing field.
Comparison of referring status to each other’s IDs for barcode of life system and GenBank
We created pairs of GenBank Accession numbers and BOLD IDs described in the db_xref qualifier from the GenBank data on fish. We also created pairs of BOLD sequence IDs and referring GenBank Accession numbers from the BOLD data. We then compared these two groups of pairs in order to investigate whether the GenBank and the BOLD data refer to each other (Figure 2). In BOLD, the barcode sequences of multiple different genes obtained from one specimen are often registered. In order to distinguish these, the “specimen ID.gene name” style was used as the ID of BOLD (e.g., BCF519-07.COI-5P), but some GenBank entries refer to BOLD by only the specimen ID. We, therefore, extracted the gene names in addition to the BOLD IDs from GenBank, and restored the “specimen ID.gene name” style ID.
Comparison of biological classifications between barcode of life system and GenBank
National center for biotechnology information GenBank uses NCBI Taxonomy as Taxonomy data, and BOLD seems to be based on the GBIF Backbone Taxonomy. We downloaded both these data. We downloaded the new_taxdump.tar.gz file from the FTP site as NCBI Taxonomy data. We used names.dmp, rankedlineage.dmp, and nodes.dmp files among the uncompressed files, and extracted the scientific name, the taxonomy ID, and the taxonomy tree information. We also downloaded the GBIF Backbone Taxonomy from the GBIF website (GBIF Secretariat, 2021). The file is distributed in the form of a tab-delimited format, and we used TaxonID, scientific name, and taxonomy classification information.
Subsequently, we compared the biological taxonomy information described in BOLD and GenBank, and the identified level of classification (such as species, genus, and class). The description written as a species name may include sp. (species: no valid published scientific description or lack of information), aff. (affinis: the identity of a distinct biological species is unknown, but it has a striking similarity or close relation with a known species), or cf. (confer: the specimen resembles the named species very closely, but has certain minor features not found on the type specimens). Since these have not been identified as a species level, we excluded species names containing these suffixes, and treated such data as species level names.
We also surveyed how much of those data accounted for in the taxonomy database. As a biological taxonomy database, GenBank uses NCBI Taxonomy, and BOLD uses a GBIF Backbone Taxonomy-based classification.
Extraction of new DNA barcode candidates from the GenBank data
There are many entries in GenBank that do not have a BOLD ID, but have a sample ID in voucher_specimen. We regarded these sequences as new candidates for DNA barcodes, and extracted these data. We extracted data from voucher_specimen, but without the BOLD ID from db_xref from the sequence data of all fish and flowering plants previously created from the GenBank Nucleotide. In the GenBank data, the gene name is written in the gene qualifier in the “Features” field (Supplementary Figure 1). We have summarized the generated DNA barcode candidate gene data by gene name. Since the described gene name could be freely described by the submitters, there were cases where the same gene had a different description (e.g., COI, COX1, and CO1). Text mining technology can solve this problem, but this time we have simply listed the genes described without it. In addition, species names were extracted from these candidate data, and were compared with the list of species covered by existing DNA barcode data.
Results
DNA barcode data in GenBank
GenBank Nucleotide is originally a database of DNA sequences, and DNA barcoding data are also registered in GenBank as they are nucleotide sequences. DNA barcode data are increasingly being used in order to monitor fish as “environmental DNA” (Miya, 2022). In this study, we obtained all GenBank Nucleotide data for fish and extracted the DNA barcoding data for trend analysis and comparison with those of BOLD. In addition, a large amount of DNA barcode data has been accumulated for insects. On the other hand, BOLD collects not only animal data, but plant data as well. Thus, similar analyses were also performed for insects and flowering plants.
All GenBank Nucleotide data used in this study consisted of 1,272,272 entries for fish, 7,010,856 entries for insects, and 1,356,592 entries for flowering plants. There is a way to write the “BARCODE” description in the KEYWORD section so as to indicate that the entry refers to DNA barcoding data in GenBank (Supplementary Figure 1). We extracted this description from fish, insect, and flowering plant data, and found that it was present in 50,373 (4.0%), 768,010 (11.0%), and 17,377 (0.8%) of the entries, respectively (Figure 1B). In addition, there are entries in GenBank that provide a more direct link to BOLD data. The BOLD ID can be found in the db_xref qualifier in the Features field of GenBank (Supplementary Figure 1). We surveyed how many GenBank entries referred to BOLD IDs: 90,927 (7.1%) for fish, 1,836,440 (26.2%) for insects, and 10,249 (0.8%) for flowering plants (Figure 1). The most major data registration source was iBOL (International Barcode of Life): 9,070 entries (10.0% of entries with BOLD ID) for fish, 283,215 entries (15.4%) for insects, and 485 entries (4.7%) for flowering plants.
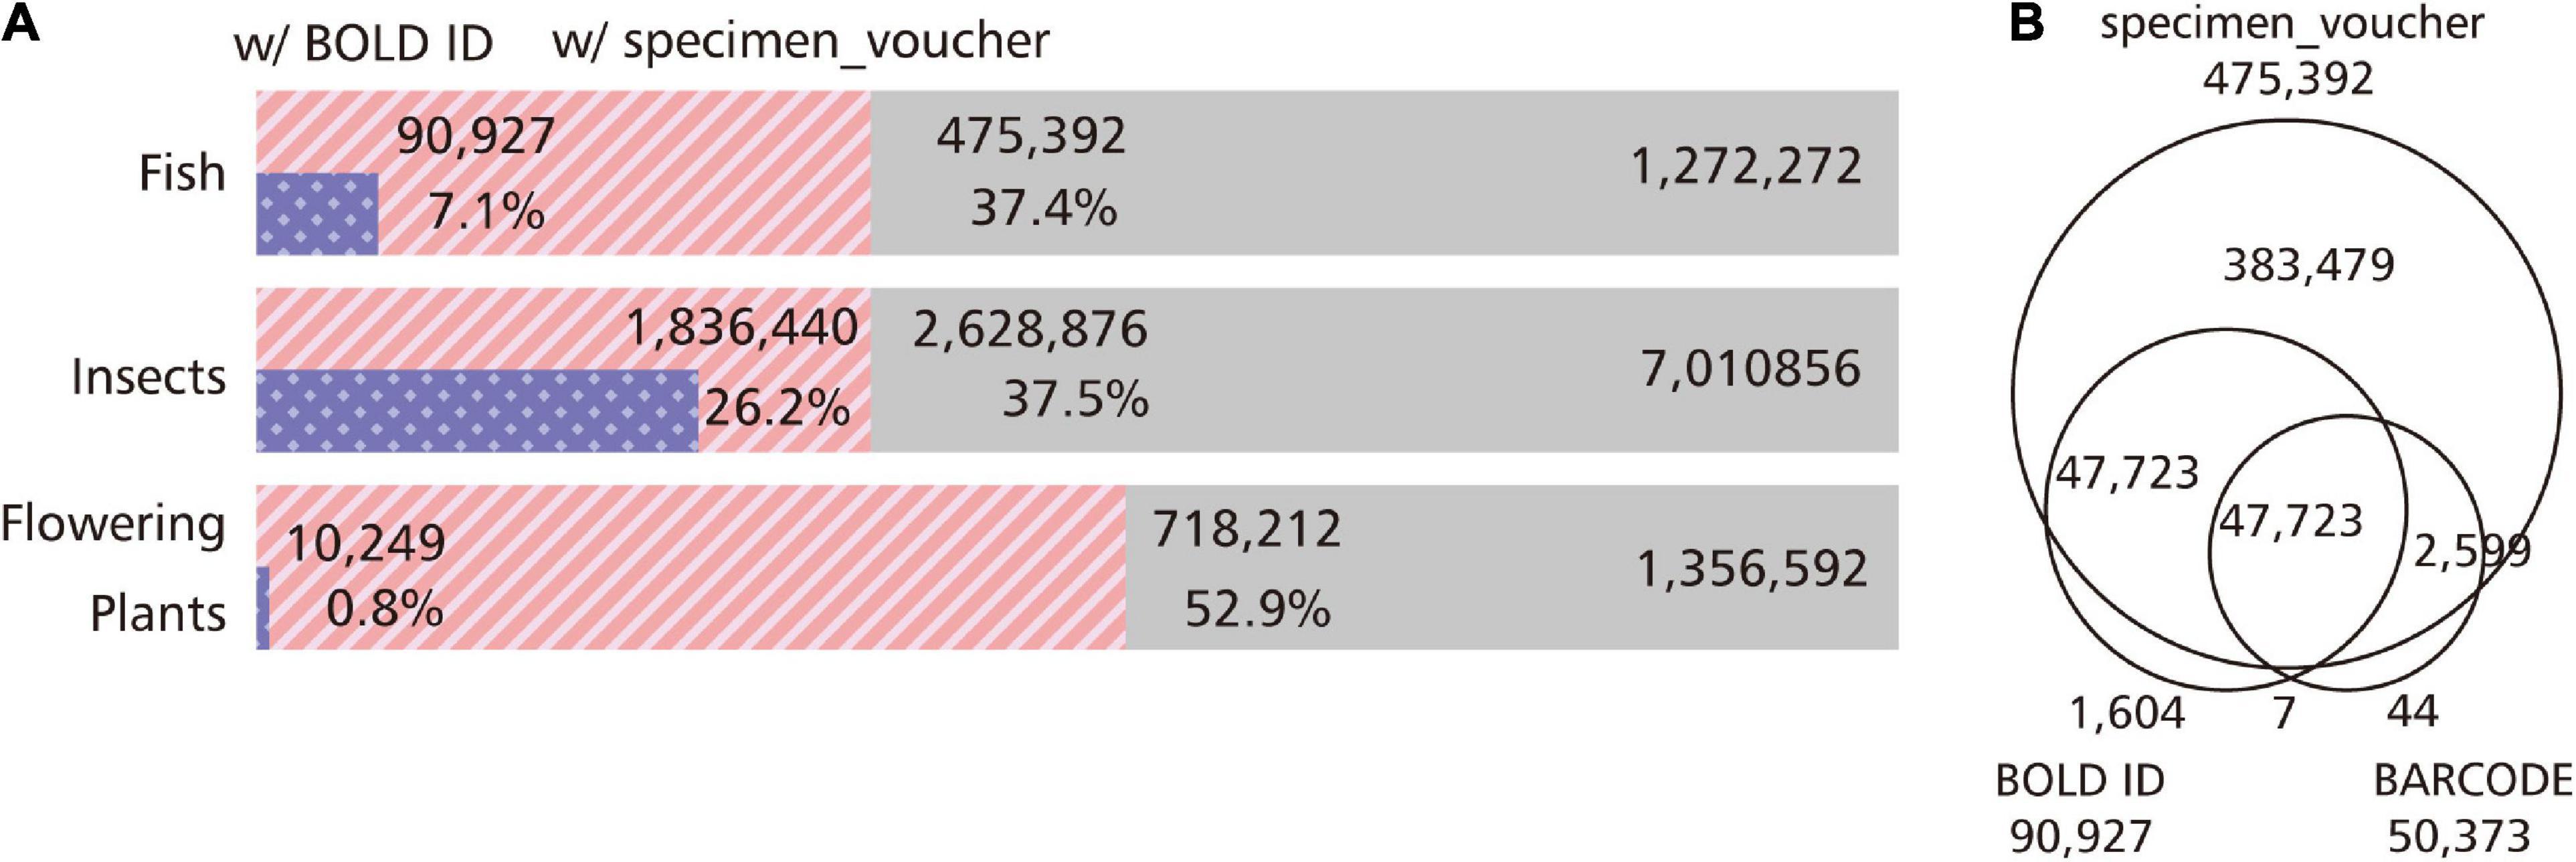
Figure 1. Status of entries with information related to the DNA barcoding in GenBank. By using GenBank, we extracted the BARCODE from the KEYWORD section, the BOLD ID referenced as the ID of the external database in the db_xref qualifier, and the sample ID written in the specimen_voucher qualifier as information related to DNA barcoding. (A) Percentage of entries with BOLD ID and the specimen_voucher qualifier. We examined the proportion of entries with BOLD ID and the specimen_voucher information in fish, insects, and flowering plants. In insects, a quarter of the entries correspond to barcode sequences with links to BOLD, and rich barcode information can be obtained from GenBank. Plants, on the other hand, have poor links to BOLD, but half of the entries are assigned specimen IDs, and DNA barcode candidates may be hidden in these entries. (B) Venn diagram of entries with BARCODE keyword, BOLD ID, and specimen_voucher qualifier. We examined the overlap of entries with the BARCODE keyword, BOLD ID, and sample ID in the GenBank fish data. In order to extract the entry corresponding to the DNA barcode, not only the BARCODE in the KEYWORD section must be extracted, but also the entry with the BOLD ID as the external database ID.
In addition to the nucleotide sequence, the specimen information as the basis for identification is essential for DNA barcoding data. GenBank has several qualifiers for describing biodiversity information such as altitude, collection_date, and country (Supplementary Figure 1). GenBank has a specimen_voucher qualifier for entering the sample ID, and if a re-identification is required, it is theoretically possible to trace the sample information based on this qualifier. We examined the number of entries with specimen_voucher information in GenBank. We found 475,392 (37.4%) entries for fish, 2,628,876 (37.5%) entries for insects, and 718,212 (52.9%) entries for flowering plants (Figure 1A). These are more than the entries identified with the use of the “BARCODE” description in the KEYWORD section (Figure 1B).
Link to GenBank in barcode of life system data
We obtained Public Data from the BOLD website and examined the links to GenBank for fish, insects, and flowering plants. The total number of specimens was 274,717 for fish, 7,122,873 for insects, and 258,436 for flowering plants.
We counted the data imported from GenBank by checking the description of those “Mined from GenBank, NCBI” in the institution_storing field, and we identified 138,050 (50.3%) fish, 542,035 (7.6%) insects, and 180,146 (69.7%) flowering plants indexed for such data.
Of the fish data registered in BOLD, GenBank IDs were assigned to 234,491 sequences in 213,088 specimens. These correspond to 215,806 GenBank entries.
The number is reduced because multiple sequence entries from the same specimen (e.g., GBMTG999-16.COI-5P, GBMTG999-16.ND5-0, and GBMTG999-16.CYTB) refer to the same GenBank entry (e.g., NC_008679: Schistura balteata mitochondrion, complete genome).
Of the 234,491 sequences with GenBank IDs, 4,330 GenBank entries were in the “suppressed state” (e.g., HM379807). NCBI labels the data as a “suppressed state” in cases where there is doubt or inadequate registration. We were not able to find corresponding data in the “suppressed state” by keyword search, but we were able to see them by specifying the Accession ID. In this case, these data did not qualify for the iBOL/GenBank early release agreement due to the lack of tentative taxonomic identifications (National Library of Medicine [NLM], 2009). In addition, some GenBank entries have been assigned with the “WITHDRAWN” label.
Mismatch between barcode of life system data and GenBank data
We compared these two groups of pairs in order to investigate whether the GenBank and the BOLD data refer to each other by creating GenBank-BOLD ID pairs from GenBank and BOLD data, respectively.
We present the obtained referring status in Figure 2. Of the 234,491 ID pairs with GenBank Accession linked from BOLD, 80,878 GenBank entries (34.5%) contained a description of the BOLD ID. Of these, 71,314 pairs referred to each other for the same ID in both GenBank and BOLD (Figure 2A). The 9,564 pairs had different BOLD IDs that refer to GenBank, and BOLD IDs that refer to GenBank. Herein, we found that IDs for specimens (e.g., FOA941-05) and IDs for barcode sequences (e.g., FOA941-05.COI-5P) coexist in the writing style of GenBank. For fish, 9,162 specimens were written in the former style and 81,676 specimens were written in the latter. Of 9,567 pairs, 8,720 BOLD IDs in GenBank were written in a BOLD Specimen ID format, so the IDs were actually the same. It can be said that they actually refer to each other (Figure 2B). For the 844 pairs, the BOLD ID of the reference source and the BOLD ID of the reference target are completely different. For example, BOLD: ANGBF29940-19.COI-5P refers to GenBank: KY570698, but GenBank: KY570698 refers to GAMBA659-12.COI-5P. This seems to be a case where both direct submission data and imported data from GenBank exist in BOLD because the researchers submitted the same data in both the BOLD and the GenBank databases (Figure 2C). In past cases, these duplications have been resolved, and it is assumed that BOLD is taking some action regarding this issue.
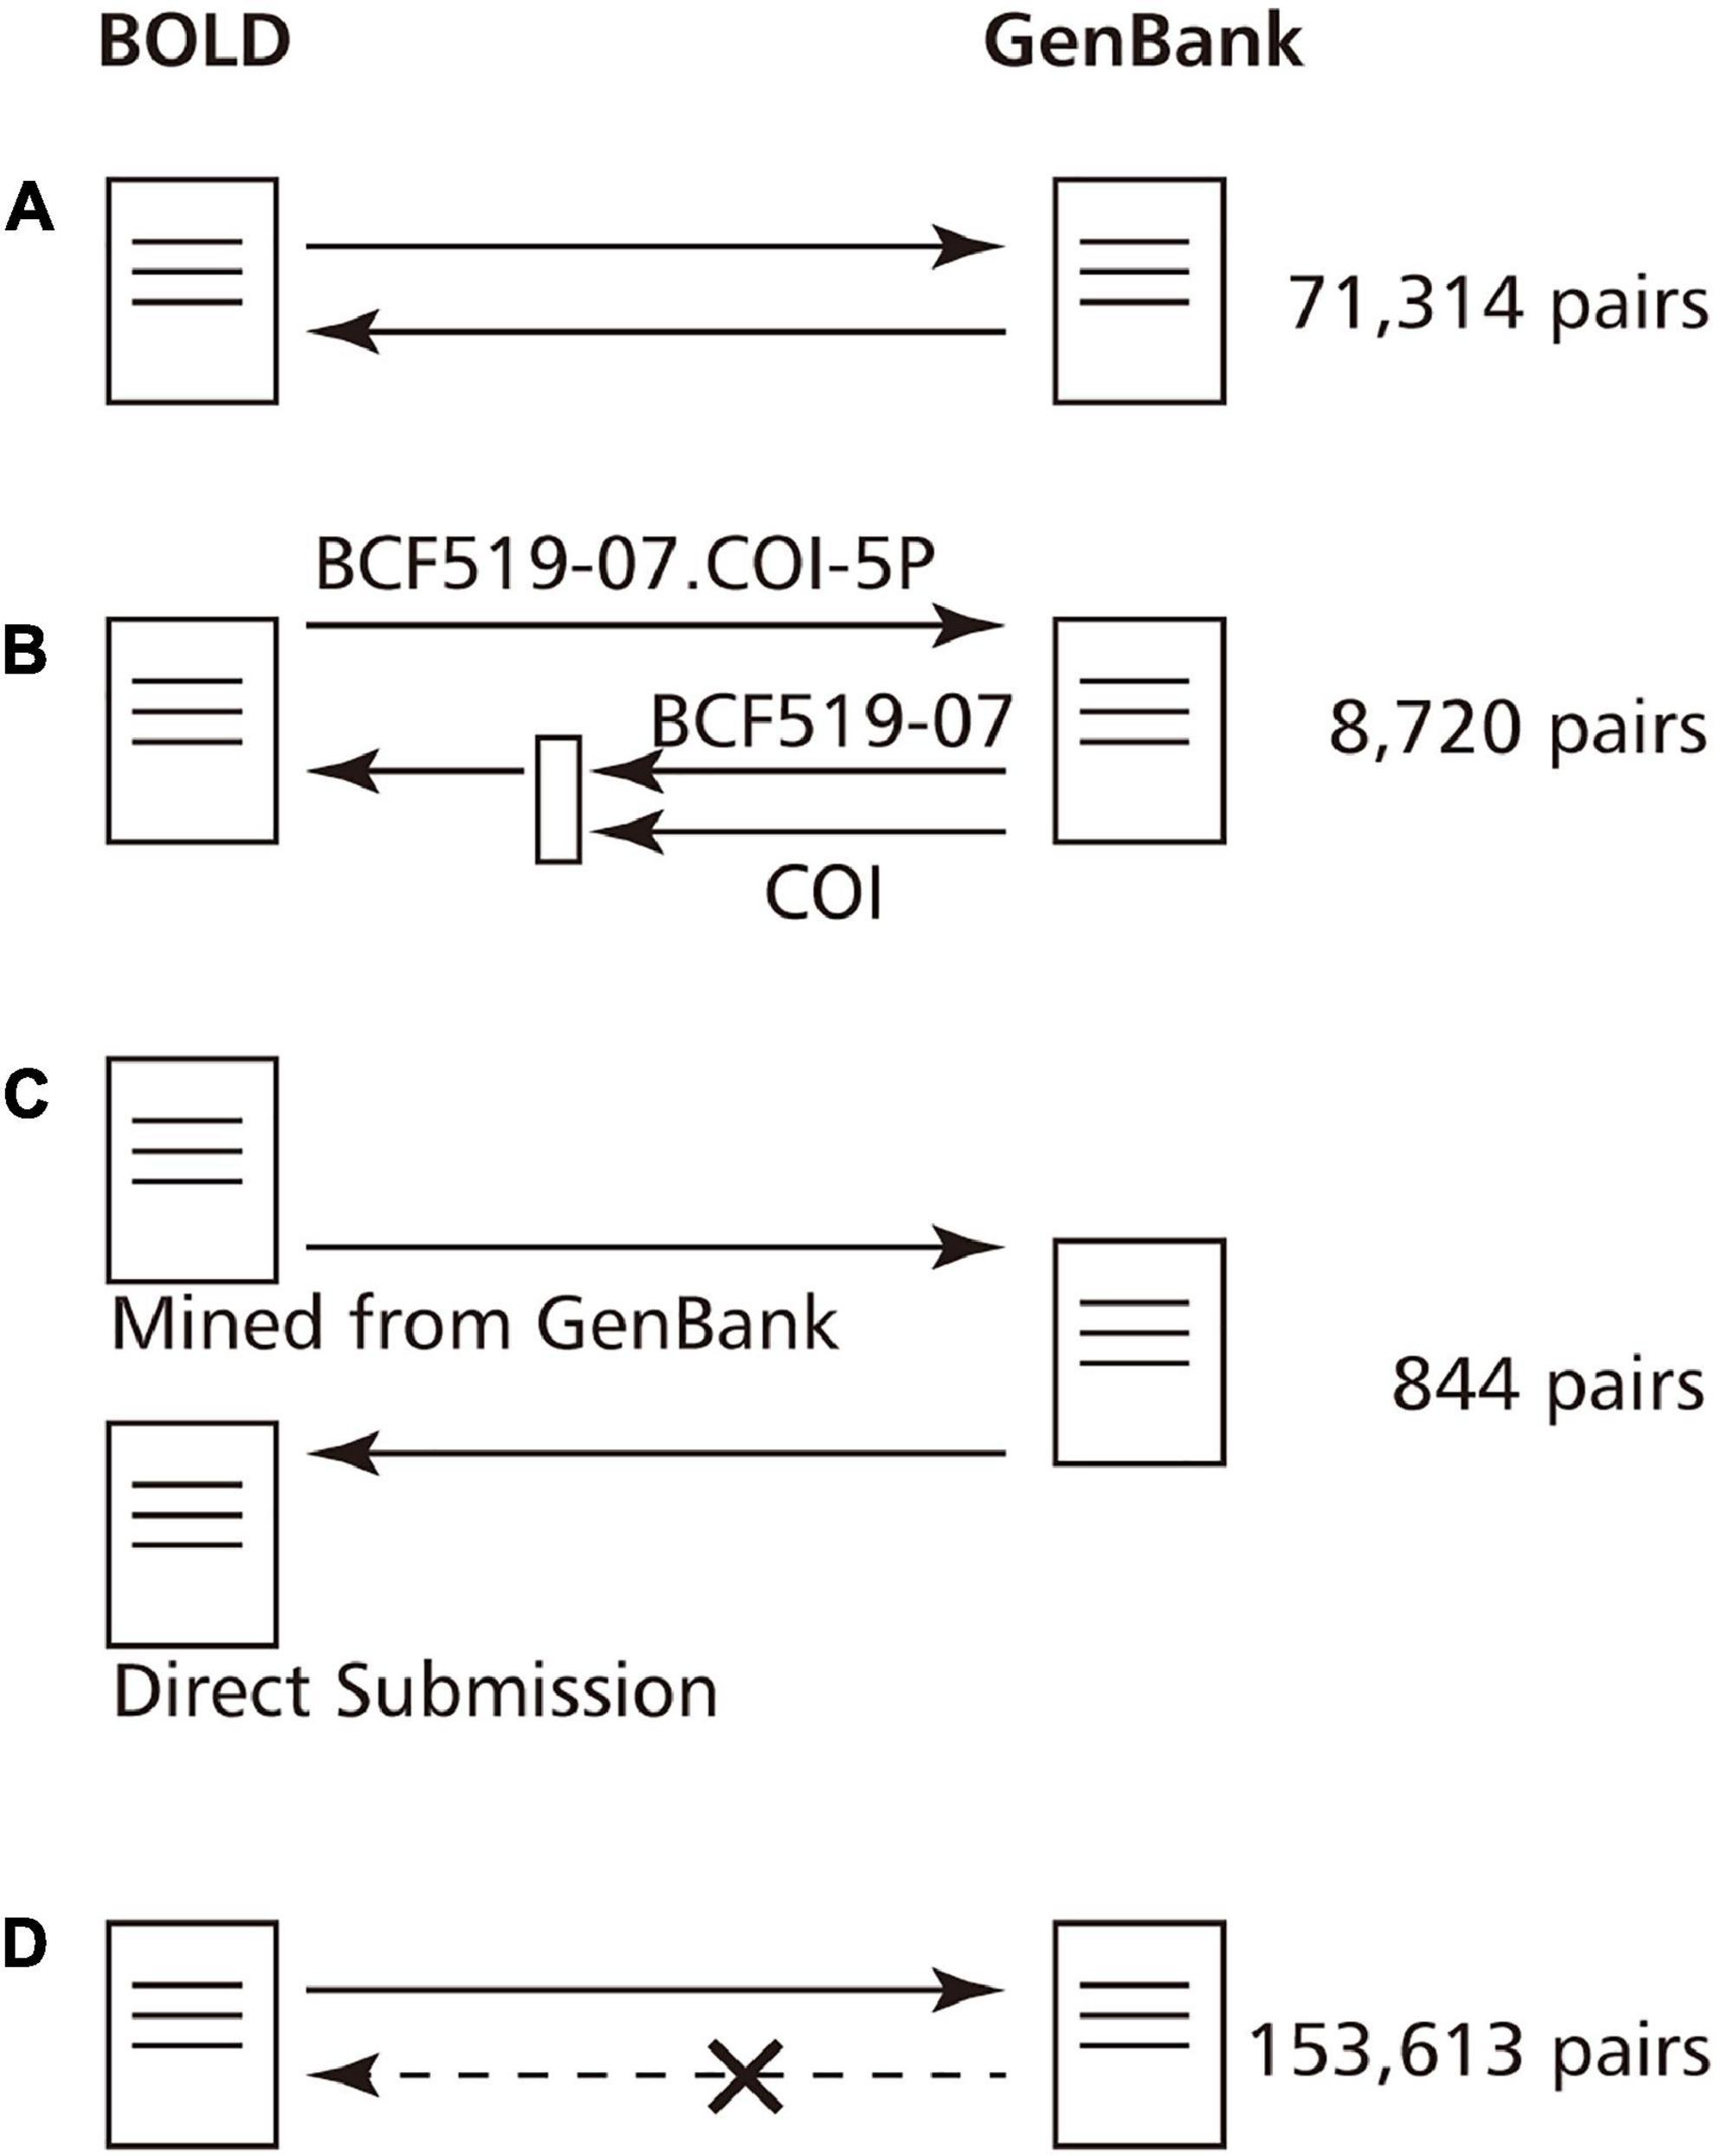
Figure 2. Reference status of the BOLD entry and the GenBank entry to each other. Since GenBank and BOLD import data from each other, their IDs are often mentioned in their entries. However, the references may not be reciprocal due to ambiguity in the description or duplicate registrations. (A) ID references are reciprocal. (B) GenBank refers to the ID of the specimen from which the DNA barcode is derived, but the BOLD Barcode ID can be recovered by extracting the gene name as well. (C) The case where the ID of a direct submission and the import data exist because the data were registered in both GenBank and BOLD. In past examples, these will be unified later. (D) BOLD ID is not described in GenBank.
Species covered by barcode of life system and GenBank
We investigated the number of species covered by BOLD data in the case of fish. There were 274,717 sample data entries in total, of which 238,633 entries (86.9%) had data as species_name. This number corresponds to 20,660 types of descriptions, but it has not been identified down to the species level, and contains an entry with the genus name followed by sp./aff./cf. By excluding these, 224,742 entries (81.8%) corresponding to 15,882 species of fish were identified down to the species level (Figure 3). Similarly, there were 251,540 (91.6%) entries at the genus level, 255,094 (92.9%) at the family level, and 270,539 (98.5%) entries at the order level. We also looked at the number of species covered by the GenBank entries referencing the BOLD ID. As a result, 12,251 types of descriptions were found in GenBank. After excluding sp./aff./cf. from here, GenBank covered 8,744 species of fish with its DNA barcoding data (Figure 3). In addition, we found that some GenBank data were described up to the species level or the species name with a BIN ID (e.g., Platycephalus sp. 1 BOLD:ACT2912) (Ratnasingham and Hebert, 2013), whereas BOLD data were described up to the genus level.
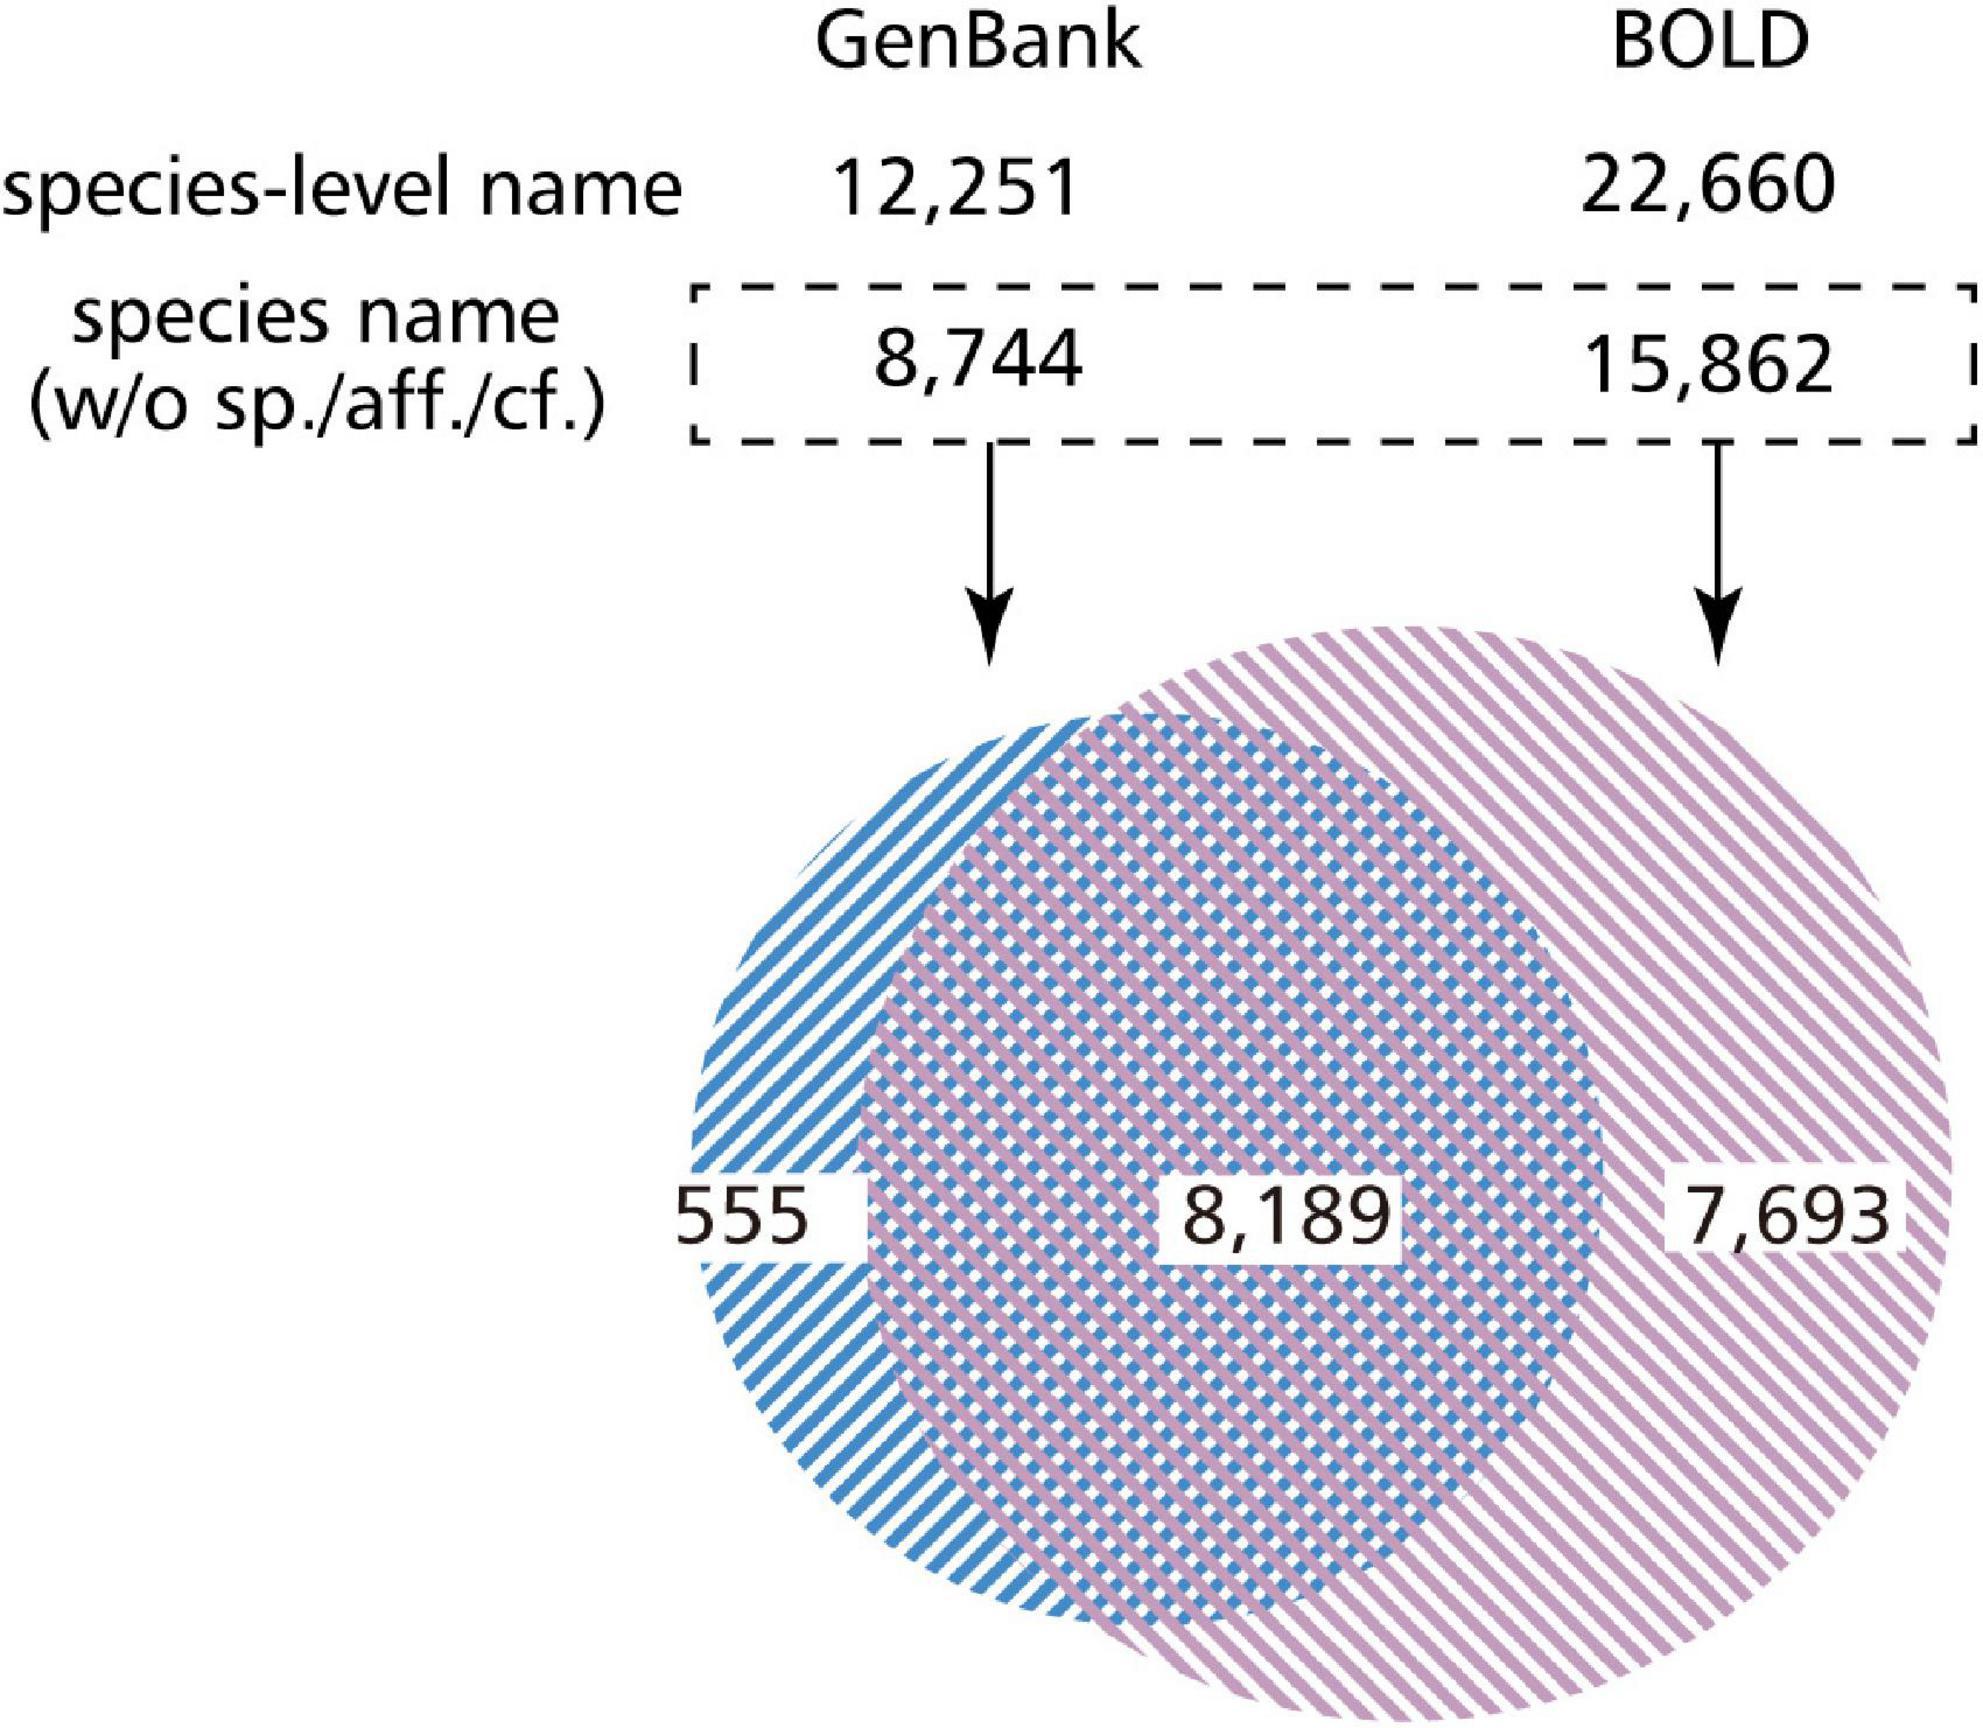
Figure 3. Venn diagram of overlapping species covered by GenBank and BOLD DNA barcode entries. We investigated how many species do BOLD and GenBank cover, and how many species overlap in these databases with regard to the fish DNA barcode data. Even if there are data in the species field, they are often not identified to the species level (such as sp. or aff.). Most of the species covered by GenBank are also covered by BOLD, which may be because BOLD imports GenBank data.
We then compared how many species did these species cover in the NCBI Taxonomy14 (Schoch et al., 2020) and the GBIF Backbone Taxonomy15 in the case of the fish. NCBI Taxonomy includes 22,041 species and subspecies. By comparing these with the 15,882 species that appear in BOLD, the descriptions of 14,505 matched (Table 1). Among the 1,377 descriptions that did not match, there were some that did not produce a hit because their description in BOLD was synonym, and so the percentage of matches was actually higher. If this synonym is not taken into account, then one could say that BOLD covers 65.8% of the NCBI Taxonomy species. In addition, GenBank covers 39.7%. The GBIF Backbone Taxonomy includes 104,767 species and subspecies of fish. By comparing these with the 15,882 species that appear in BOLD, the descriptions of 15,608 matched (Table 1). This is simply equivalent to 14.9% of the GBIF Backbone Taxonomy (Table 1). Of the 274 descriptions that did not produce a hit, 69 referred to hybrids. Moreover, of the 8,744 species that appeared in GenBank, 8,668 descriptions matched those of the GBIF Backbone Taxonomy. This is equivalent to 8.3% of the GBIF Backbone Taxonomy entries (Table 1).
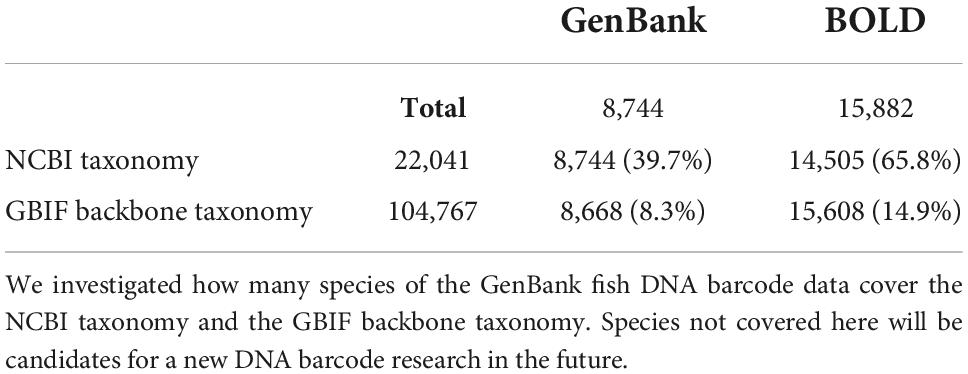
Table 1. Species coverage by the GenBank and BOLD DNA barcode entries.
Subsequently, we compared the similarities and the differences of the organisms covered by BOLD and GenBank. By comparing the list of species identified down to the species level, 8,189 descriptions were found to be common between BOLD and GenBank, and 7,693 descriptions were found to exist only in BOLD. Moreover, GenBank covered the description of 555 descriptions on its own (Figure 3).
New DNA barcode sequence candidates in GenBank
As mentioned earlier, a specimen_voucher qualifier is provided in GenBank in order to record the specimen ID. The number of entries with data here is much larger than the number of entries that refer to BOLD IDs (Figure 1B). Such entries without BOLD IDs but with specimen_voucher are potential candidates for new DNA barcode sequences, and we extracted these data from GenBank Nucleotide. There were 386,078 GenBank entries for fish with no BOLD IDs, but with data in the specimen_voucher field. Table 2 shows a list of candidate genes for DNA barcodes extracted from these entries, including COI, ND2, and RAG1. The candidate gene list in Table 2 contains descriptions representing the same genes because the various patterns of the gene names described by the submitters are not unified by text mining (e.g., COI and COX1, and cytb and Cytb).
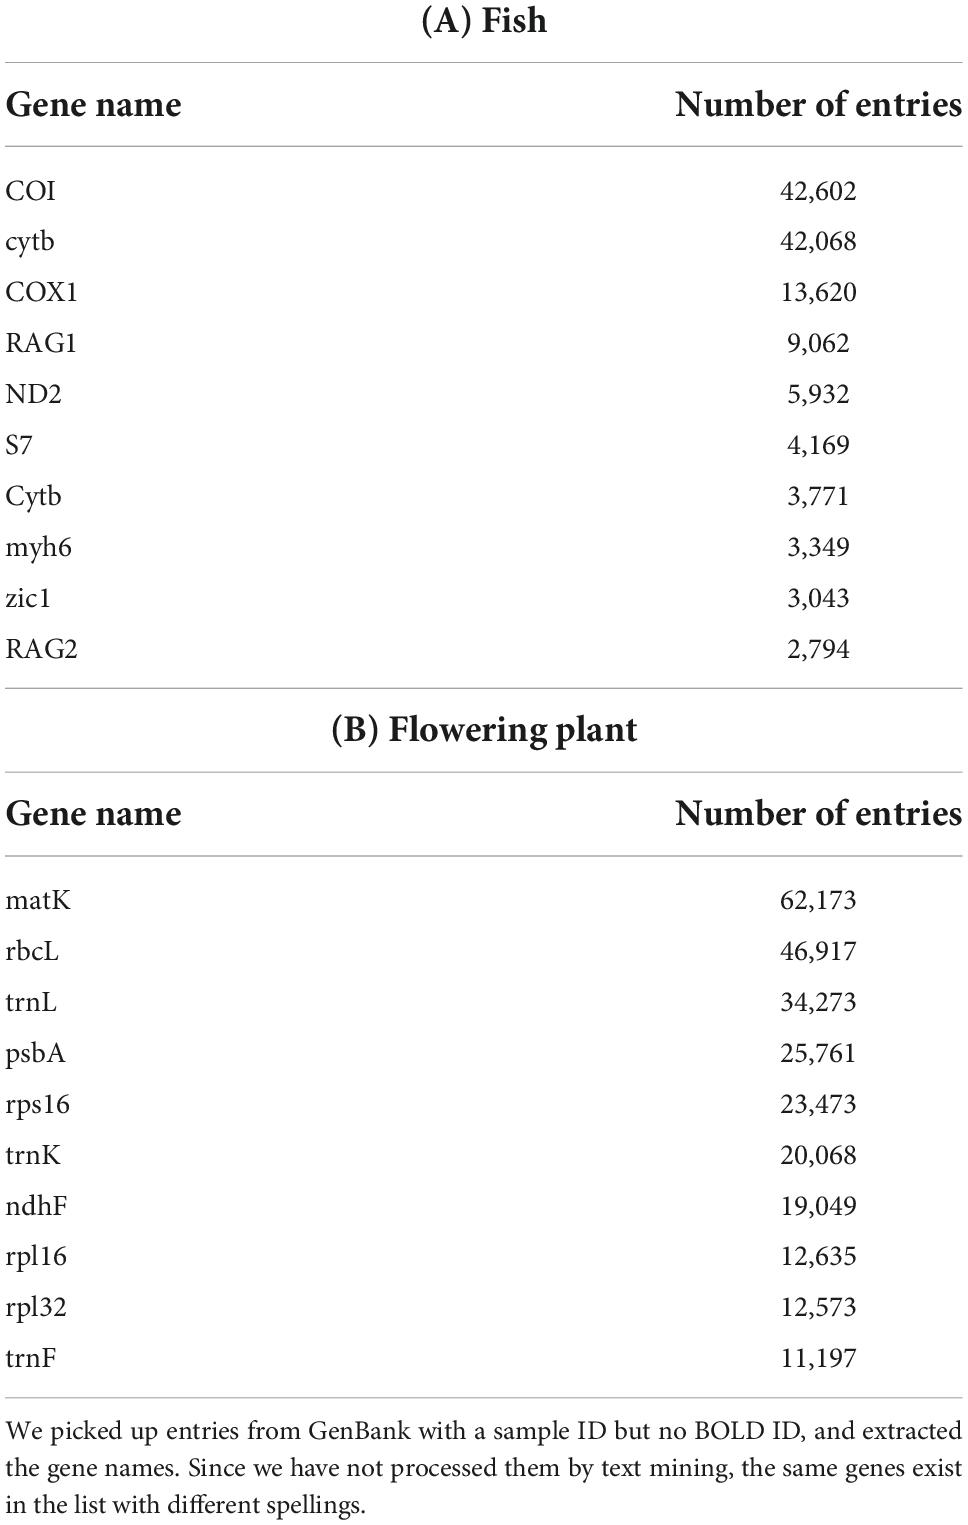
Table 2. Candidate list of DNA barcodes in GenBank.
Moreover, we surveyed how these candidate data would increase the species coverage. There are data on candidate barcode genes for 4,089 new organisms when compared to GenBank entries with BOLD IDs and BOLD data, and for 685 organisms when limited to data with gene name as “COI.” In addition, the same analysis was performed on flowering plants, and entries for genes such as matK, rbcL, and trnL were obtained.
Discussion
Data import between barcode of life system and GenBank
Researchers can use BOLD and GenBank Nucleotide as databases for DNA barcodes. However, the two are different in nature: BOLD is the workbench for DNA barcoding projects, while INSDC (including GenBank Nucleotide) is a public repository of DNA data. In addition, the use of these databases differs between biodiversity researchers focusing on specimens, and molecular biologists focusing on nucleotide sequences.
Researchers often submit the same data in both databases. This should not be prohibited, and the Earth BioGenome Project16 (Lewin et al., 2022) recommends submitting data to both databases (Lawniczak et al., 2022). This suggests the convenience of using the two databases in an integrated manner, and emphasizes the differences in format and description.
BOLD imports DNA barcode sequences from GenBank. For the submission to both databases, we found an example where both the direct submission data and the imported data from GenBank for the same DNA barcode exist in the BOLD database (e.g., GAMBA659-12.COI-5P and ANGBF29940-19.COI-5P). We have previously reported examples of data directly being registered with BOLD (JBOL054-11) and data imported from GenBank (GBDP15012-14) (Nakazato, 2019). In these data, there was a difference in the description contents due to the differences in the formats applied by BOLD and by GenBank (Supplementary Figure 2). However, these duplicated data have now been resolved and unified to JBOL054-11.
Differences between barcode of life system and GenBank descriptions
GenBank utilizes BOLD IDs, but two types of writing style coexist: IDs for specimens (e.g., FOA941-05) and IDs for barcode sequences (e.g., FOA941-05.COI-5P). Specimen IDs often have multiple barcode genes assigned, thus GenBank should probably refer to IDs in the style of IDs for barcode sequences (i.e., FOA941-05.COI-5P). In order to solve this problem, the INSDC may need to check the format upon submission, or a secondary integration site may be required to do so. BOLD records data on a Darwin Core17 (Wieczorek et al., 2012) basis, while GenBank records data in its own format; biodiversity information can also be described within GenBank: voucher_specimen, lat_lon (latitude and longitude), altitude, collection_date, collected_by, idetified_by, and country (Supplementary Figure 1). GenBank has been collecting sequences for over 30 years (Sayers et al., 2022b), so it will be difficult to comply with the Darwin Core anytime soon. NCBI and other bioinformatics organizations are working on data standardization and Semantic Web activities, thereby including data integration with the biodiversity field (Chawuthai et al., 2016; Groom et al., 2021; Nakazato, 2021).
Differences in taxonomy between barcode of life system and GenBank
GenBank and BOLD have different taxonomies: sequencing data-indexing GenBank uses the NCBI Taxonomy as its species list, while biodiversity databases such as GBIF and BOLD usually use the GBIF Backbone Taxonomy. For example, in BOLD, one level above Magnoliopsida as a class one will find Magnoliophyta (flowering plants) as a phylum, while in GenBank, the phylum is Streptophyta (green plants), and there are several hierarchical terms designed between the phylum and the class. We used Actinopterygii for fish, Insecta for insects, and Magnoliopsida for flowering plants in this study, which was the result of a careful selection of a common biological classification group for both BOLD and GenBank.
It should also be noted that the NCBI Taxonomy is a list of organisms for which sequences have been archived in INSDC, and it is not intended to cover all species. In addition, the NCBI Taxonomy may have the wrong species name because the submitter made a mistake when submitting the sequence (e.g., Scarabaeus typhon with Taxonomy ID: 1685123 should have been Scarabaeus typhon).
In this study, we have not normalized the descriptions of the NCBI Taxonomy and the GBIF Backbone Taxonomy. This is because the two databases are so different that the integrating of their data would be a big project by itself. However, we are able to assign the species that the DNA barcode indicates to the species in each database, and we have compared the assigned species. Currently, taxonomic information can only be confirmed by NCBI Taxonomy in GenBank and by the GBIF Backbone Taxonomy in BOLD. The integration of GenBank and BOLD data will make it easier to confirm the taxonomy of organisms in both the NCBI Taxonomy and the GBIF Backbone Taxonomy, and will enrich the information on the species indicated by the DNA barcode.
Further usefulness of using GenBank for the mining of DNA barcode data
In the field of DNA barcoding, DNA metabarcoding by using NGS is also performed (Adamowicz et al., 2019; Miya, 2022), and these data are archived in the SRA. The sequences assembled from these results will also be deposited in the NCBI database. Moreover, GenBank has rich literature information, and the use of this information is another advantage of data integration.
In addition, GenBank data were described up to the species level or the species name with BIN IDs (e.g., Platycephalus sp. 1 BOLD:ACT2912) (Ratnasingham and Hebert, 2013), whereas BOLD data were described up to the genus level. GenBank may be less reliable in identifying species than BOLD, since GenBank data are usually submitted by molecular biologists who are not experts in taxonomy (Leray et al., 2019; Meiklejohn et al., 2019; Pentinsaari et al., 2020). However, combining data from BOLD and GenBank would generate more detailed data that would complement each other. In this case, the identified_by field may increase the reliability of the obtained data.
Some of these may contain sequences corresponding to BOLD simply because there is no link from GenBank to BOLD, but they represent new possibilities for GenBank.
In animals, COI genes are currently used primarily as barcodes, but in the future other genes, mitochondrial genomes, and whole genomes will be used as sources of barcodes. The value of using GenBank entries other than COI genes with specimen IDs will also increase. In fact, many gene sequences with specimen_voucher information are archived in GenBank, and it is expected that more data will be added through future museomics-associated research.
In this study, it was very difficult for us to download insect DNA barcoding data from BOLD in bulk. In order to solve this, there is a way to allow BOLD data downloadable from FTP sites for each taxonomic group. Alternatively, a further collaboration with GenBank would make it easier to do the research we have done here by processing the data provided by NCBI.
The Earth BioGenome Project (see text footnote 16) (Lewin et al., 2022) is another example that produces both sequences containing genomes and biodiversity information. They provide reports on various standards on their web page (see text footnote 16), and the information regarding the data registration in “IT and Informatics Standards18” is a particularly useful resource. The summaries of those reports have also been published in the form of a journal article (Lawniczak et al., 2022).
DNA barcoding research accelerates museomics
Museomics is a method of obtaining gene sequences from museum specimens. Museomics makes it possible to ascertain the phenotype (such as morphology and color), and the genotype (by gene sequence) of an organism of interest without the need to sample at the right time and place so as to obtain a living organism. In addition, sequence information can be used in order to distinguish between species and populations of organisms, which was not previously known from morphology. By sequencing older specimens, one gains the ability to perform a phylogenetic analysis of how evolution and differentiation occurred from both morphological and genetic aspects. This way, gene sequences are now an indispensable resource even in the field of biodiversity. The development of molecular biology in the last half-century may have brought about an unfortunate division in the life science fields: DNA-central molecular biology and bioinformatics, and non-DNA-central ecology and taxonomy. Museomics can fill these gaps, and DNA barcoding is also an important technology that bridges these two fields. The integration of biodiversity and sequence data will make these studies easier, and our current study will facilitate the application of museomics and bring the biological world together.
Data availability statement
Publicly available datasets were analyzed in this study. This data can be found here: https://ftp.ncbi.nlm.nih.gov/genbank/, https://www.boldsystems.org/index.php/TaxBrowser_Home, https://ftp.ncbi.nlm.nih.gov/pub/taxonomy/.
Author contributions
TN conceived the idea, carried out the analyses, and wrote the first draft of the manuscript. UJ supervised the analyses and provided critical feedback on the manuscript. Both authors contributed to the article and approved the submitted version.
Funding
This work was supported by ROIS-DS-JOINT (004RM2017 and 009RM2018).
Acknowledgments
We would like to thank Hiromi Matsumae, Tsuyoshi Hosoya, Masaaki Kotera, and Ai Muto-Fujita for their very meaningful discussions regarding the writing of this manuscript.
Conflict of interest
The authors declare that the research was conducted in the absence of any commercial or financial relationships that could be construed as a potential conflict of interest.
Publisher’s note
All claims expressed in this article are solely those of the authors and do not necessarily represent those of their affiliated organizations, or those of the publisher, the editors and the reviewers. Any product that may be evaluated in this article, or claim that may be made by its manufacturer, is not guaranteed or endorsed by the publisher.
Supplementary material
The Supplementary Material for this article can be found online at: https://www.frontiersin.org/articles/10.3389/fevo.2022.966605/full#supplementary-material
Footnotes
- ^ https://www.boldsystems.org/
- ^ https://www.ncbi.nlm.nih.gov/nuccore
- ^ https://unite.ut.ee/
- ^ https://www.insdc.org/
- ^ https://ncbi.nlm.nih.gov/
- ^ https://www.ebi.ac.uk/
- ^ https://www.ddbj.nig.ac.jp/
- ^ https://www.ebi.ac.uk/ena/browser/
- ^ https://www.ddbj.nig.ac.jp/ddbj/
- ^ https://ncbi.nlm.nih.gov/sra
- ^ https://www.gbif.org/
- ^ http://ftp.ncbi.nlm.nih.gov/genbank/
- ^ https://www.boldsystems.org/index.php/Taxbrowser_Taxonpage?taxid=77
- ^ https://www.ncbi.nlm.nih.gov/taxonomy
- ^ https://www.gbif.org/dataset/d7dddbf4-2cf0-4f39-9b2a-bb099caae36c
- ^ https://www.earthbiogenome.org/
- ^ https://dwc.tdwg.org/
- ^ https://www.earthbiogenome.org/it-and-informatics-standards
References
Adamowicz, S. J., Boatwright, J. S., Chain, F., Fisher, B. L., Hogg, I. D., Leese, F., et al. (2019). Trends in DNA barcoding and metabarcoding. Genome 62:v–viii. doi: 10.1139/gen-2019-0054
Andersson, A. F., Bissett, A., Finstad, A. G., Fossøy, F., Grosjean, M., and Hope, M. (2020). Publishing Sequence-Derived Data Through Biodiversity Data Platforms. V1.0. Copenhagen: GBIF Secretariat, doi: 10.35035/doc-vf1a-nr22
Arita, M., Karsch-Mizrachi, I., and Cochrane, G. (2021). The international nucleotide sequence database collaboration. Nucl. Acids Res. 49:D121–D124. doi: 10.1093/nar/gkaa967
Buerki, S., and Baker, W. J. (2016). Collections-based research in the genomic era. Biol. J. Linn. Soc. 117, 5–10. doi: 10.1111/bij.12721
Chawuthai, R., Takeda, H., Wuwongse, V., and Jinbo, U. (2016). Presenting and preserving the change in taxonomic knowledge for linked data. Semant. Web 7, 589–616. doi: 10.3233/SW-150192
DeSalle, R., and Goldstein, P. (2019). Review and interpretation of trends in DNA barcoding. Front. Ecol. Evol. 7:302. doi: 10.3389/fevo.2019.00302
Groom, Q. J., Dillen, M., Huybrechts, P., Johaadien, R., Kyriakopoulou, N., and Fernandez, F. J. Q. (2021). Connecting molecular sequences to their voucher specimens. BioHackrXiv [Preprint]. doi: 10.37044/osf.io/93qf4
Hebert, P. D., Cywinska, A., Ball, S. L., and deWaard, J. R. (2003). Biological identifications through DNA barcodes. Proc. Biol. Sci. 270, 313–321. doi: 10.1098/rspb.2002.2218
Lawniczak, M., Durbin, R., Flicek, P., Lindblad-Toh, K., Wei, X., Archibald, J. M., et al. (2022). Standards recommendations for the Earth BioGenome Project. Proc. Natl. Acad. Sci. U.S.A. 119:e2115639118. doi: 10.1073/pnas.2115639118
Leray, M., Knowlton, N., Ho, S. L., Nguyen, B. N., and Machida, R. J. (2019). GenBank is a reliable resource for 21st century biodiversity research. Proc. Natl. Acad. Sci. U.S.A. 116, 22651–22656. doi: 10.1073/pnas.1911714116
Lewin, H. A., Richards, S., Lieberman Aiden, E., Allende, M. L., Archibald, J. M., Bálint, M., et al. (2022). The earth BioGenome project 2020: starting the clock. Proc. Natl. Acad. Sci. U.S.A. 119:e2115635118. doi: 10.1073/pnas.2115635118
Meiklejohn, K. A., Damaso, N., and Robertson, J. M. (2019). Assessment of BOLD and GenBank - Their accuracy and reliability for the identification of biological materials. PLoS One 14:e0217084. doi: 10.1371/journal.pone.0217084
Miya, M. (2022). Environmental DNA metabarcoding: a novel method for biodiversity monitoring of marine fish communities. Annu. Rev. Mar. Sci. 14, 161–185. doi: 10.1146/annurev-marine-041421-082251
Nakazato, T. (2019). Current situation of DNA Barcoding data in biodiversity and genomics databases and data integration for museomics. Biodivers. Inf. Sci. Stand. 3:e35165. doi: 10.3897/biss.3.35165
Nakazato, T. (2021). knowledge extraction from specimen-derived data from GenBank to enrich biodiversity information. Biodivers. Inf. Sci. Stand. 5:e73787. doi: 10.3897/biss.5.73787
National Library of Medicine [NLM] (2009). iBOL/GenBank/Genome Canada Letter of Cooperation. Available Online at: https://www.ncbi.nlm.nih.gov/core/assets/genbank/files/iBol-Letter-of-Cooperation.pdf (accessed June 4, 2022).
Nilsson, R. H., Larsson, K. H., Taylor, A., Bengtsson-Palme, J., Jeppesen, T. S., Schigel, D., et al. (2019). The UNITE database for molecular identification of fungi: handling dark taxa and parallel taxonomic classifications. Nucl. Acids Res. 47:D259–D264. doi: 10.1093/nar/gky1022
Pentinsaari, M., Ratnasingham, S., Miller, S. E., and Hebert, P. (2020). BOLD and GenBank revisited - Do identification errors arise in the lab or in the sequence libraries? PLoS One 15:e0231814. doi: 10.1371/journal.pone.0231814
Ratnasingham, S., and Hebert, P. D. (2007). BOLD: the barcode of life data system (http://www.barcodinglife.org). Mol. Ecol. Notes 7, 355–364. doi: 10.1111/j.1471-8286.2007.01678.x
Ratnasingham, S., and Hebert, P. D. N. (2013). A DNA-based registry for all animal species: the Barcode Index Number (BIN) system. PLoS One 8:e66213. doi: 10.1371/journal.pone.0066213
Raxworthy, C. J., and Smith, B. T. (2021). Mining museums for historical DNA: advances and challenges in museomics. Trends Ecol. Evol. 36, 1049–1060. doi: 10.1016/j.tree.2021.07.009
Sayers, E. W., Cavanaugh, M., Clark, K., Pruitt, K. D., Schoch, C. L., Sherry, S. T., et al. (2022b). GenBank. Nucl. Acids Res. 50:D161–D164. doi: 10.1093/nar/gkab1135
Sayers, E. W., Bolton, E. E., Brister, J. R., Canese, K., Chan, J., Comeau, D. C., et al. (2022a). Database resources of the national center for biotechnology information. Nucl. Acids Res. 50:D20–D26. doi: 10.1093/nar/gkab1112
Schoch, C. L., Ciufo, S., Domrachev, M., Hotton, C. L., Kannan, S., Khovanskaya, R., et al. (2020). NCBI Taxonomy: a comprehensive update on curation, resources and tools. Database 2020:baaa062. doi: 10.1093/database/baaa062
Keywords: sequencing data, voucher specimen, DNA barcode, biodiversity information, taxonomy database
Citation: Nakazato T and Jinbo U (2022) Cross-sectional use of barcode of life data system and GenBank as DNA barcoding databases for the advancement of museomics. Front. Ecol. Evol. 10:966605. doi: 10.3389/fevo.2022.966605
Received: 11 June 2022; Accepted: 26 September 2022;
Published: 24 October 2022.
Edited by:
Jonathan J. Fong, Lingnan University, Hong Kong SAR, ChinaReviewed by:
Marta Álvarez-Presas, University of Bristol, United KingdomSolange Sotuyo, Department of Botany, Institute of Biology, National Autonomous University of Mexico, Mexico
Copyright © 2022 Nakazato and Jinbo. This is an open-access article distributed under the terms of the Creative Commons Attribution License (CC BY). The use, distribution or reproduction in other forums is permitted, provided the original author(s) and the copyright owner(s) are credited and that the original publication in this journal is cited, in accordance with accepted academic practice. No use, distribution or reproduction is permitted which does not comply with these terms.
*Correspondence: Takeru Nakazato, bmFrYXphdG9AZGJjbHMucm9pcy5hYy5qcA==