 Xinzhong Jia
- School of Industry and Commerce, Shandong Management University, Jinan, China
In order to further cope with climate change, achieve green and low-carbon economic development and further improve the construction of ecological civilization, a research method for optimization of cold chain logistics distribution path of agricultural products e-commerce from the perspective of carbon neutrality was proposed. This method takes full account of the requirements of distribution path optimization, it is based on ecological theory and applies ecological methods to study the structure, function and dynamics of human-centered urban ecosystems, as well as the laws of interaction between system components and between the system and the surrounding ecosystems, which is in line with the optimization goal of minimizing distribution operating costs, and the ant colony algorithm is used to construct the cost optimization model of cold chain logistics distribution path based on the weight limit of distribution vehicles and the time window limit. By comparison of simulation experiments, the best parameter solution is 2,873.9931. The difference with other combinations is only 1–2%, and the optimal parameter matching of the algorithm isα = 1,β = 2,ρ = 0.5. Experiments show that the optimal parameter combination is determined on the basis of reflecting different distribution results.
Introduction
In September 2020, in order to better cope with the negative impact of global climate change, achieve green and low-carbon economic development in a better and faster way, and improve the construction of ecological civilization in a more scientific way, China put forward the long-term development goals of “carbon peak” by 2030 and “carbon neutral” by 2060 (Chen, 2021; Cui et al., 2021). The concept of “carbon neutral” is a huge adjustment and strategic deployment China has made to cope with global climate change, achieve green and low-carbon development and improve ecological civilization construction in the new historical period. It is an important starting point for implementing and implementing the new development concept, as shown in Figure 1. Our goal is to limit carbon emissions more scientifically through a scientific peak regulation, and ultimately achieve a balance between emissions and absorption. Under the influence of the carbon
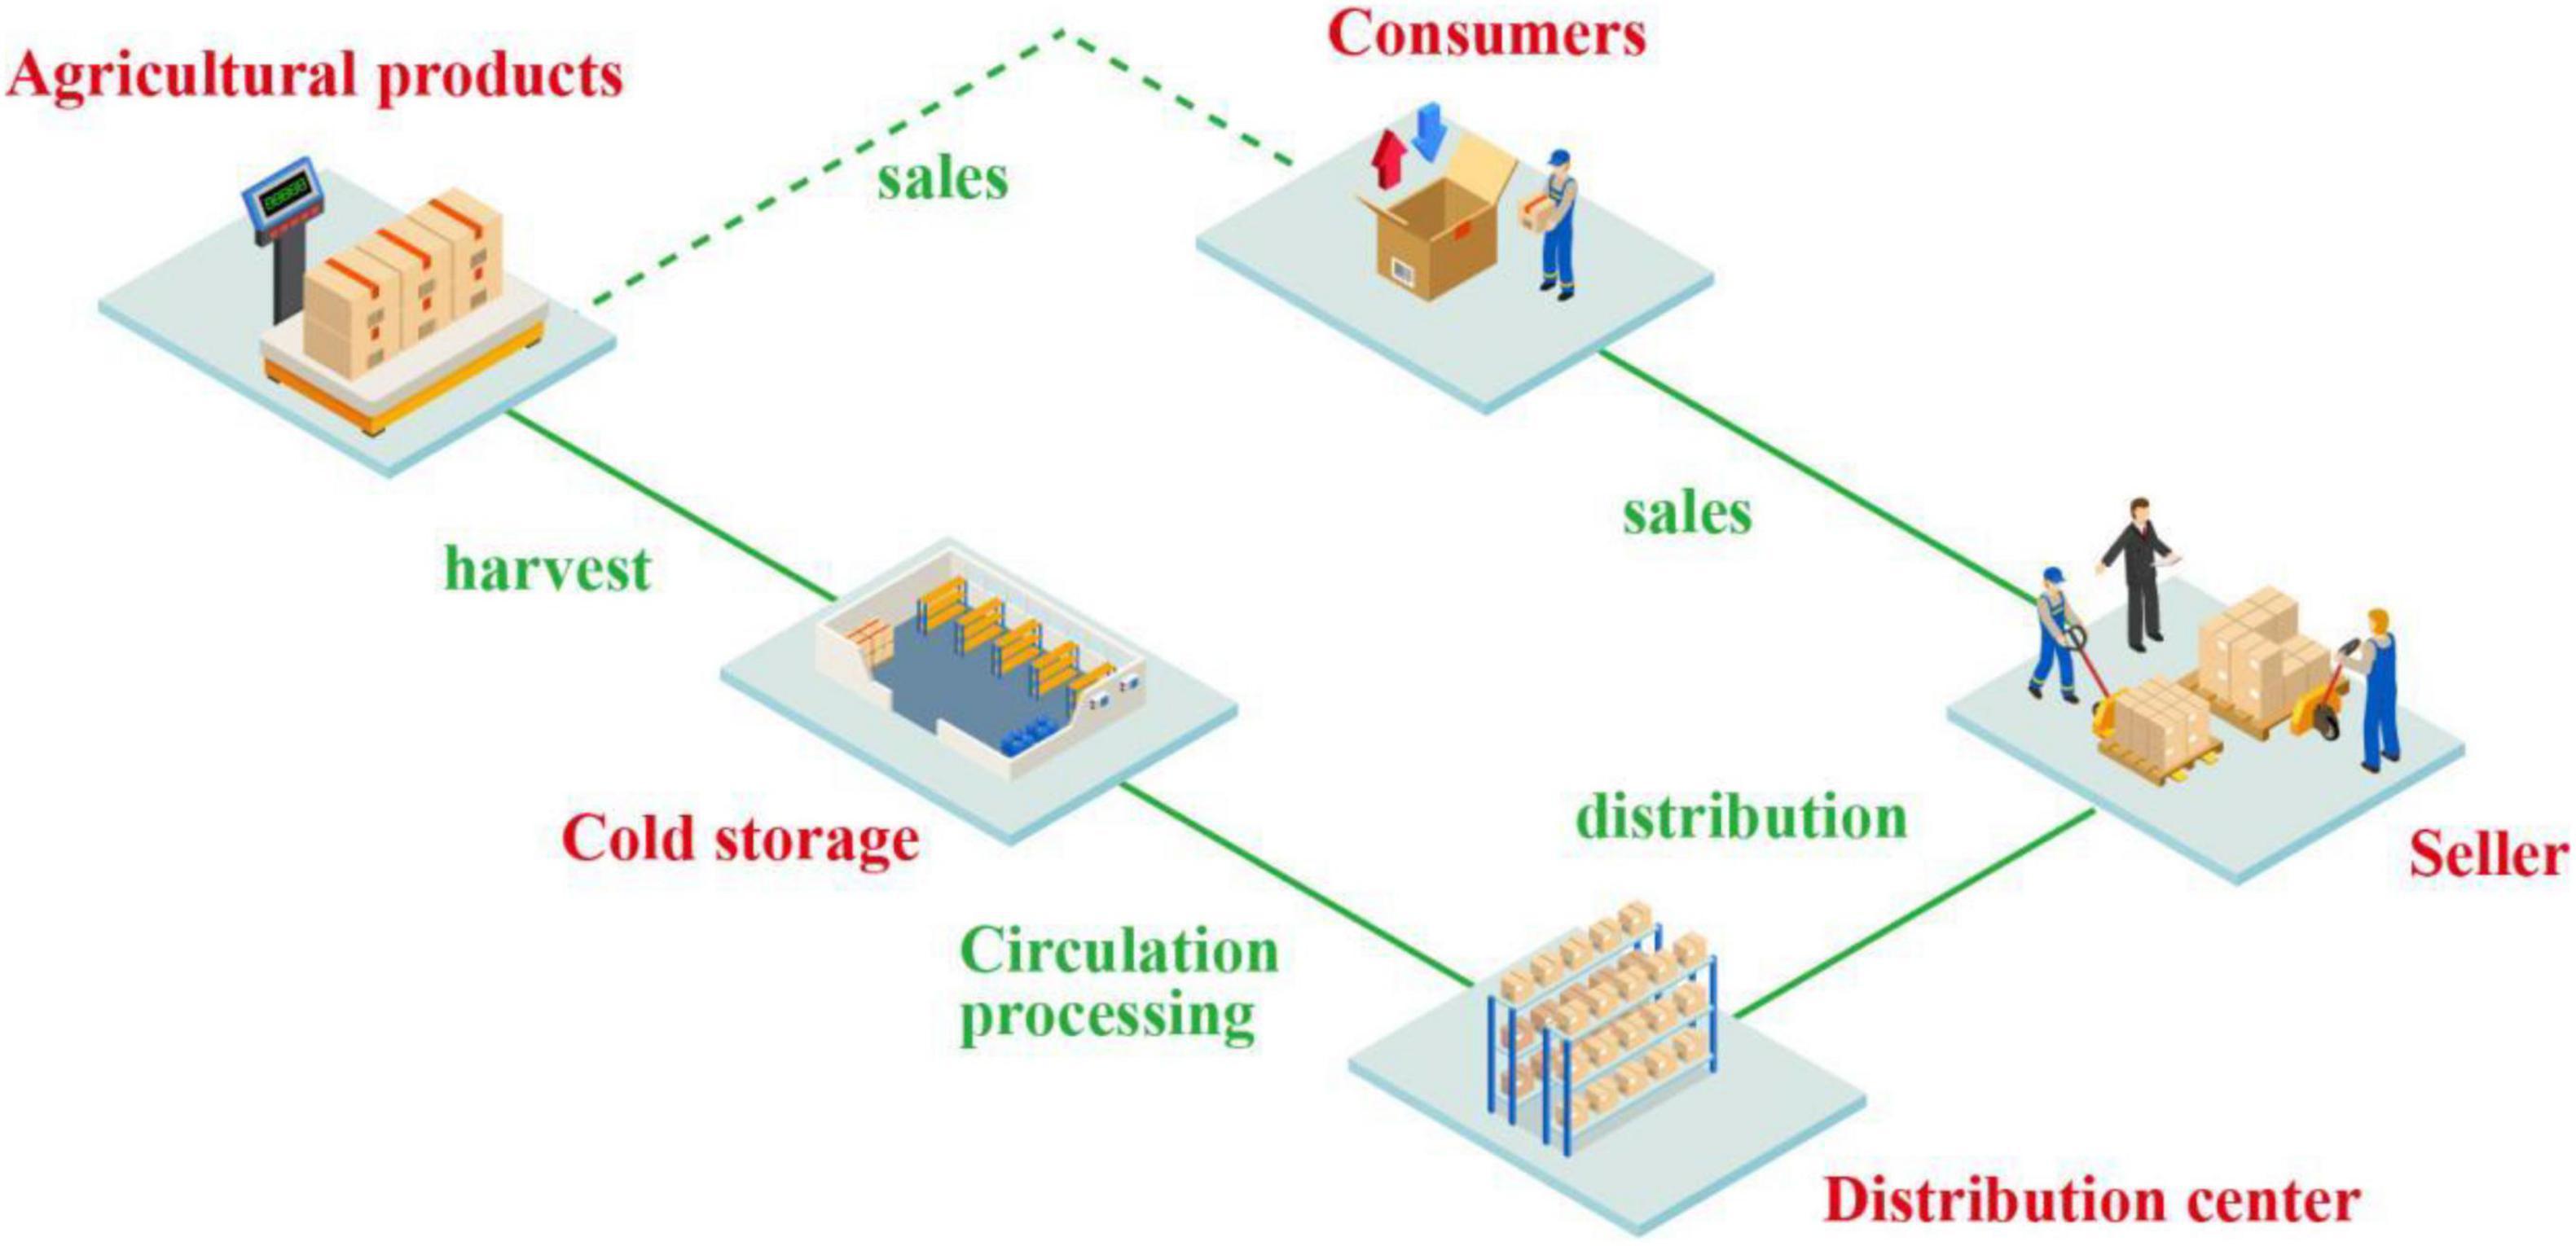
Figure 1. Agricultural cold chain logistics structure diagram high-end diagram.
neutral concept, all walks of life must be regulated in a timely manner. However, in the field of traditional cold chain logistics distribution of agricultural products, the traditional cold chain logistics distribution process has difficulties such as high cost and unreasonable transportation and distribution routes. In order to further optimize the distribution cost, this paper develops a distribution cost optimization model of cold chain logistics based on the weight limit of the distribution vehicle and the time window limit (Rollo et al., 2020; Li et al., 2022). With the upgrading and adjustment of the agricultural industry, the output of China’s main agricultural products has increased steadily year by year, which greatly meets the daily needs of the people and promotes the development of the agricultural cold chain logistics industry. But at the same time, my country’s agriculture is also faced with the new goals and tasks of accelerating the reform of the ecological civilization system, promoting green development, and building a beautiful China, which requires vigorously developing a low-carbon economy. The cold chain logistics of agricultural products has the characteristics of high energy consumption and high carbon emissions, and the impact on the ecological environment is more prominent. The introduction of the low-carbon concept into the cold chain logistics of agricultural products has very important practical significance for adapting to the development requirements of the new era.
Urban Ecology: Based on ecological theory, applying ecological methods to study the structure, function, and dynamics of human-centered urban ecosystems, as well as the laws of interaction between system components and between the system and the surrounding ecosystems, and Using these laws to optimize the structural system, adjust the system relationship, improve the efficiency of material transformation and energy utilization, and improve the environmental quality, it is a comprehensive discipline that realizes reasonable structure, efficient function and coordinated relationship. Research on the application of related technologies in cold chain logistics in various countries mainly includes: related technologies in cold chain logistics mainly include temperature monitoring technology, traceability system, information system and equipment, etc., and the research focuses on temperature monitoring. Some scholars put forward the application of wireless network in cold chain logistics traceability system. The advanced multi-temperature combined distribution system aims to provide a new continuous temperature control solution for cold chain logistics (Sharma and Kumar, 2019; Li et al., 2021a). RFID sensor technology is used to monitor the temperature of cold chain food in time, and based on the detection information, a neural network prediction model is developed to prevent load loss. The validity of the prediction model is confirmed by the actual operation of the South African cold chain.
The research on the optimization of cold chain logistics route mainly includes the following aspects: The impact of transportation time on the rapid deterioration of new food is used as a model for optimizing cold chain distribution routes, and the tabu search method is used to solve the optimal solution of the problem; A mixed integer linear programming (MILP) model for the design of a new agricultural product cold chain logistics distribution network was developed, and the distribution network was optimized as a whole by combining the hybrid optimization simulation and simulation methods; in order to develop the sustainability of the new agricultural product supply chain, an analysis of Windows time constraints on dual-track optimization,and the multi-objective optimization model is set up, to design a kind of multi-objective variable domain based on adaptive search and multi-objective particle swarm optimization algorithm with the combination of hybrid optimization algorithms, and to provide a more effective method for solving the model (Li et al., 2021b; Qu and Sun, 2022).
My country’s cold chain logistics research cycle is very short, but with the rapid development of cold chain logistics, it has attracted experts, scientists and other stakeholders, and the results of these demand research are amazing. The research on cold logistics distribution types includes: traditional cold chain logistics distribution types are not suitable for the storage and sales of new agricultural products, but also easy to cause the waste of enterprise transport capacity and ecological environment pollution. Based on this, some scientists have proposed that the integration process of various temperatures in agricultural products can be said to be effective and efficient storage of agricultural products and environmental protection of influenza. Logistics and transportation links. Taking frozen food as an example, it is pointed out that the joint distribution mode of cold chain logistics is the best green logistics distribution mode suitable for low carbon economy. Through the discussion and analysis of the export of agricultural products in a certain city, an integrated model is introduced to solve the problems in the development of cold chain logistics of agricultural products in Guiyang. They believe that the new e-commerce industry has the potential to expand and analyze export data of new agricultural e-commerce products based on various business models (Dai and Ye, 2022; Shi, 2022). On this basis, fresh e-commerce logistics distribution model is innovated, which provides a new perspective to deal with the “last mile” logistics distribution problem of fresh electricity suppliers. To sum up, the research on the two fields of agricultural cold chain logistics and low-carbon vehicle routing in various countries has been quite in-depth, but there are still few literatures directly focusing on the combination of the two, and the quantitative analysis of carbon emission calculation is also lacking. Therefore, this paper combines these two issues to study the distribution path optimization of the cold chain logistics of agricultural products e-commerce in urban ecosystems from the perspective of carbon neutrality.
Problems Related to Distribution Path Optimization
It is based on the viewpoint of the ecosystem, using the theories and methods of ecology and environmental science, to comprehensively analyze and evaluate the structure, function and coordination of the urban ecosystem to determine the development level, development potential, and restrictive factors of the system. Compared with temperature logistics, the products of cold chain logistics are the most perishable, it needs less heat, and the whole cold chain, so cold chain infrastructure and time need more. Cold chain logistics, as a form of logistics with special requirements for time, quality, temperature, and humidity, not only has common characteristics of ordinary normal temperature logistics, but also has its own unique characteristics. First, the demand for temperature in each link of the cold chain is high, so it must be fed into cryogenic equipment, such as cold storage, refrigerating vehicles and refrigeration equipment. Secondly, the operation cost of cold chain logistics is high. Refrigeration requires continuous cooling and keeping the temperature constant, leading to high electricity bills (He and Kusiak, 2017; Liu and Ahmadi, 2021). Refrigerated cars also need cooling to keep temperatures stable, which requires more energy. So the distribution problem is unique.
Definition of Distribution Path Optimization Problem
Vehicle routing problem (VRP) has always been an important research direction in the field of logistics distribution, which relates to the total operating cost of logistics enterprises and is of great significance. In the export study, the basis and goal of the road improvement program is how to control storage costs, transportation costs and transit times. The product distribution optimization problem can be explained in terms of the concept of load. Plan and arrange necessary shipping to ensure efficient shipping. In addition, requirements related to vehicle capacity constraints, customer needs, delivery times, distance constraints, time constraints, etc., will be met, to achieve certain goals, such as shortest distance, lowest cost, shortest time, minimum number of vehicles, etc.
Components of Distribution Route Problem
Distribution Center
Distribution center is a modern circulation facility engaged in goods equipping (collecting goods, processing, sorting goods, picking goods, distributing goods) and delivering goods to users. It must meet the following requirements: (1) Mainly applicable to specific users. (2) The distribution function is good. (3) Perfect information network. (4) The radiation range is low. (5) There are many varieties and small packaging. (6) Mainly for distribution and storage. Distribution center has storage function, distribution function, sorting function, processing function, connection function, information function, and so on. Its internal area can be divided into receiving area, storage area, sorting and preparation area, distribution and packing area, external transport and delivery area, processing area and office management area.
Customer
The customer is the object of distribution service, which can be either a large shopping mall or a single consumer. Customer attributes mainly include: customer location, goods demand, delivery time requirements, etc., which have an important impact on route layout (Shui and Li, 2020; Zhou et al., 2021). The distribution center should comprehensively consider the specific requirements of customers, reasonably plan the distribution route and arrange vehicles to provide services for customers, and achieve customer requirements to the greatest extent.
Distribution Tools
Distribution tools mainly refer to the means of carrying goods, is a necessary component of the distribution process. The attributes of distribution vehicles mainly include: load capacity, driving distance and vehicle characteristics, etc. Due to the different characteristics of carrying vehicles, vehicles are mainly selected according to the requirements of transport objects. This article mainly studies the cold chain transport of agricultural products (Huang et al., 2021; Li, 2022a). In order to transport agricultural products at low temperature, distribution vehicles with refrigeration function are selected.
The Goods
Goods are indispensable elements in the distribution process, and its attributes mainly include: weight, volume, vulnerable to decay and other characteristics. The attributes of goods will also affect distribution services, so in the process of distribution, we should fully consider the attributes and characteristics of goods, and arrange the distribution path rationally and scientifically.
Optimize Your Goals
Optimization objective mainly refers to setting the objective function of distribution path optimization according to the actual demand, which is generally divided into single objective and multi-objective function. Single objective function mainly refers to: shortest total path, minimum total cost, least total delivery time, least delivery vehicles, highest customer satisfaction, etc. A multi-objective function is one that considers two or more optimization objectives. In the study of VRP, the objective function and the number of objectives of the model should be constructed according to the specific problems to optimize the objectives to the maximum extent (Ross et al., 2020; Li, 2022b).
Constraints
According to the different optimization objectives, the constraints involved are also different, and reasonable constraints should be set according to the specific problem when solving the problem. General constraints usually include: the number of vehicles in the distribution center, delivery window required by customers, vehicle load, vehicle speed and travel time, etc. As the real world becomes more complex, the VRP problem will be subject to more and more constraints (Cui, 2021; Guo and Xiao, 2021).
Ant Colony Algorithm Principle
Distribution Cost Analysis
Distribution costs are the costs incurred by suppliers when they distribute goods to retailers. In this article, the delivery cost is further refined, and the labor cost related to the delivery time is increased. That is, the distribution cost includes the vehicle start-up cost, vehicle driving cost and labor cost (calculated by working hours), so the distribution cost generated when the supplier places goods to the retailer in the first cycle can be expressed as:
Objective Function and Constraint Conditions
According to the above analysis and the transformation between the corresponding formulas, the inventory-path optimization model based on the model belongs to the mixed integer programming model.
The formula above represents the total cost in the planning period, including inventory cost and distribution cost. The first two items are inventory cost, including retailer inventory holding cost and out-of-stock cost caused by random demand, respectively. The last three are distribution costs, including vehicle start-up cost, vehicle running cost, and labor cost, respectively.
The above formula represents the relationship between the initial inventory of retaileriin period (t + 1) and the initial inventory, distribution quantity, demand, and quantity out of stock in period t.
The formula above represents the quantity out of stock of retaileriin periodt.
The above formula represents the distribution quantity of retaileriin period (t + 1). When the initial inventory of the retailer is lower than the replenishment point ri, suppliers supply to retailers. The allocated quantity is the difference between the upper level inventory Mi and the initial inventory level Iti. Otherwise, no distribution will be carried out.
The above formula means that each retailer can be delivered at most once within a cycle.
The above formula shows that each vehicle can only be returned to the supplier after it leaves the supplier’s distribution center and ends the delivery service.
The above formula means that the vehicle visits the retailer and leaves after its service, that is, to ensure that there is no loop in the distribution line of each vehicle.
The above formula shows that the conveying volume of each vehicle does not exceed the maximum load at any time.
The above formula represents the value constraint of decision variable .
Transfer Probability
Let τij(t) represent the amount of information on path (i,j)at time t, bi(t) represent the number of ants at element i at time t, n represent TSP scale, and m represent the total number of ants, which can be expressed as:
Formula (12) represents the set of residual information on Iij pairily connected by element (city) in set C at time t. Each path has the same amount of information at the initial moment. Suppose τij(0) = C,The basic ant colony algorithm finds the optimal path through a directed graph (Equation 13).
Ant k(k = 1,2,…,m) determines the direction of movement according to the information on each path. The set of cities currently traversed by ant kcan be represented by tabu table (Equation 14):
This package dynamically adjusts as it evolves. During the movement, the ants calculate the migration probability based on the heuristic data and the information of each path. represents the state transition probability of ant k transferring from element (city) ito element (city) jat time t, which is expressed as follows:
Among which:
The above formula represents the city that the ant k can choose next, β is a promising heuristic factor and underscores the importance of recognizing the importance of heuristic data in ant selection. As the value increases, the change of government will be closer to the rule of greed α it is an information heuristic factor that represents the relative importance of trajectories and reflects the role of information accumulated during ant movement (Liu et al., 2021; Ning et al., 2021). The larger the value, the stronger the cooperation of the ants, because the ants tend to choose the paths of other ants. ηij(t) is the heuristic function, and its expression is as follows:
In the above formula, dij represents the distance between two adjacent nodes. This function represents the degree to which the ant is expected to move from elementi (city) to elementj (city).
This paper starts with the concept of carbon neutral proposed in the previous section, and uses the ant colony algorithm to solve the optimization problem of the cold chain logistics distribution system of agricultural products.
An Optimization Model of Cold Chain Logistics Distribution Chain Based on Carbon Neutrality
Distribution Route of Cold Chain Logistics
In order to reduce the overall cost of logistics transportation, it is necessary to rationalize the part of the cost that affects the optimization goal for the problem of cold logistics deployment. The real cold logistics distribution problem is more difficult, and there are many things to consider. In order to facilitate the research and model establishment, it needs to be simplified. Therefore, the following hypotheses are proposed for the cold chain distribution center and distribution vehicles: First, there may be multiple distribution centers in the actual logistics transportation. This article ignores the number of distribution centers and assumes that only one distribution center conducts the corresponding cold chain logistics transportation. Second, in the actual distribution and transportation of cold chain logistics, there is no specific requirement for the speed of cold chain vehicles (Jani, 2021; Lian, 2021). This article assumes that the distribution vehicle vehicles are moving at a uniform speed. Third, in the process of distribution and transportation, the distance between nodes may be different, or there is a single circle, or flat, or both together, this paper assumes that the distance from the distribution point to the consumer is a straight line; fourth, in the manufacturing process For refrigeration equipment and transportation services, the quantity and area required for each are known. Fifth, while carrying out cold chain logistics distribution and transportation services, this paper ensures a sufficient number of trucks and the same type of truck tanks with refrigeration functions; Sixth, this paper assumes that the damage to the cold storage equipment is the same, and the cold chain logistics transportation vehicles are The temperature does not change during transportation, and the material damage is only the processing time; 5. The refrigerated chain logistics must return to the delivery site after completing the delivery service, and the carrying capacity of the refrigerated truck shall not exceed its maximum level (Aboulfotouh et al., 2021).
Construction of the Basic Model of Cold Chain Logistics Distribution Path Optimization
The classification problem of logistics viruses has been identified as a NP problem, usually represented by a mathematical model. These few sentences only solve the improvement of the cold logistics problem, and describe the meaning and changes of the optimization model accordingly, as shown in the following figure, as shown in Table 1.
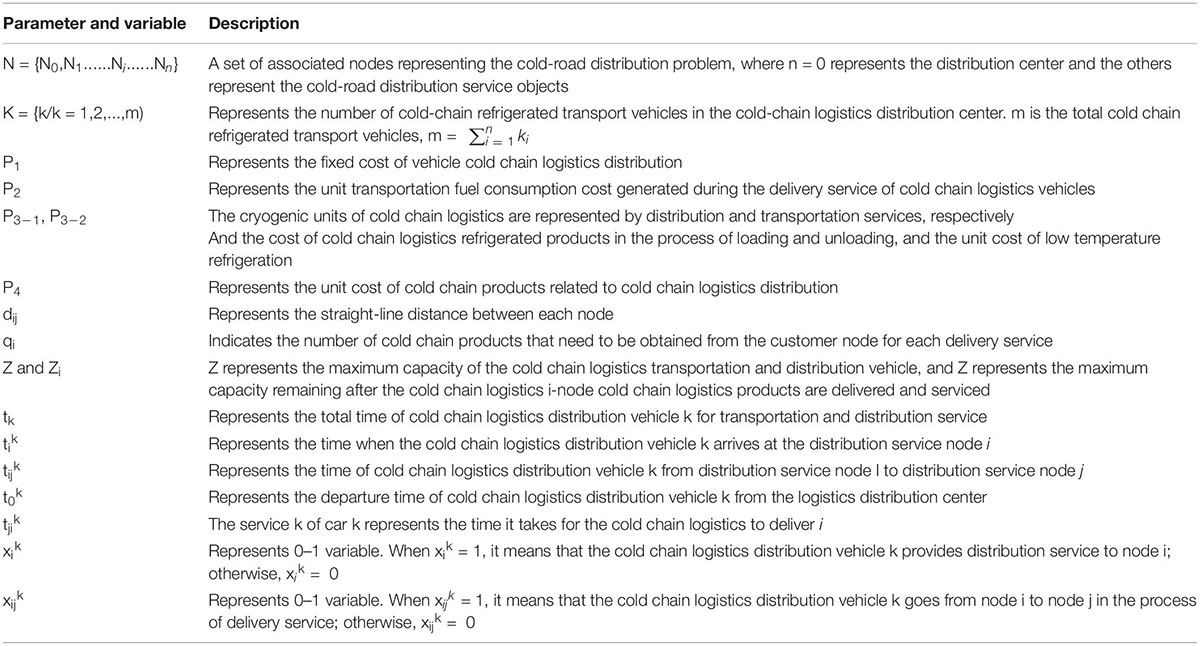
Table 1. Parameters and variables involved in the distribution path optimization model of cold chain logistics.
The basic model for optimizing cold chain logistics distribution paths focuses on fixed costs C1 of cold chain logistics in the process of distribution service. Transportation fuel consumption costC2 generated by cold chain distribution vehicles for logistics distribution services. Low temperature refrigeration cost C3 generated by cold chain logistics in the process of distribution and transportation services. Damage cost C4 of cold chain products formed by cold chain logistics in the delivery service.
The fixed costs of cold chain refrigerated distribution vehicles are as follows:
Transportation fuel consumption costs of cold chain distribution vehicles:
Cold chain logistics distribution and transportation services with low refrigeration costs:
Cold chain logistics in distribution and transportation because all consumers want more than the latest cold chain refrigeration equipment, composite materials for refrigeration equipment in the distribution process, etc. Reasons may incur similar costs:
The model aims to optimize the lowest cost of logistics distribution, the optimal design model for cold chain logistics distribution is as follows:
Selection of Low-Carbon Indicators
Based on the above-mentioned characteristics of optimizing the cold chain logistics distribution process from the low-carbon side, the optimization system of the cold chain logistics distribution network is changing, moving closer to the demand for low-carbon production. In the research, we usually carry out distribution planning and select the vehicle model and distribution method that are most suitable for the vehicle configuration in the distribution area. According to the actual operation of electronic components and the operation process of distribution personnel, the real problems are abstracted into mathematical models with special restrictions to solve the problem, so as to reduce the cost of refrigerated trucks and meet the demand. of consumers.
In the process of operation, cold chain logistics needs a large number of cold chain refrigerated motor vehicles for distribution and transportation services, and the exhaust emissions of these vehicles will bring corresponding air pollution. Due to the timely change of temperature, cold chain logistics may cause damage and decay of certain cold chain products in the process of distribution and transportation services,in addition, if these damaged rotten products are not properly handled, they will bring the corresponding solid and liquid pollution; In the process of distribution and transportation service, cold chain logistics will bring corresponding noise pollution when cold chain vehicles carry out low-temperature refrigeration power work, when transportation vehicles run against the ground, and when drivers of transportation vehicles brake horn. Based on the above description, select low-carbon parameters to optimize the cold chain logistics distribution chain to reduce carbon emissions, and select three dimensions of gas, solid and liquid, and noise to construct the cost target of pollutant emission.
Examples and Analysis of Cold Chain Logistics Distribution Path Optimization
Due to the promotion of Cold Chain Logistics Co., Ltd., we are improving the distribution of new agricultural cold chain logistics products through joint ventures, various strategies, and using ant colony algorithm and MATLAB software for calculation and analysis. price. The actual cold chain distribution process of the company is shown in Table 2.
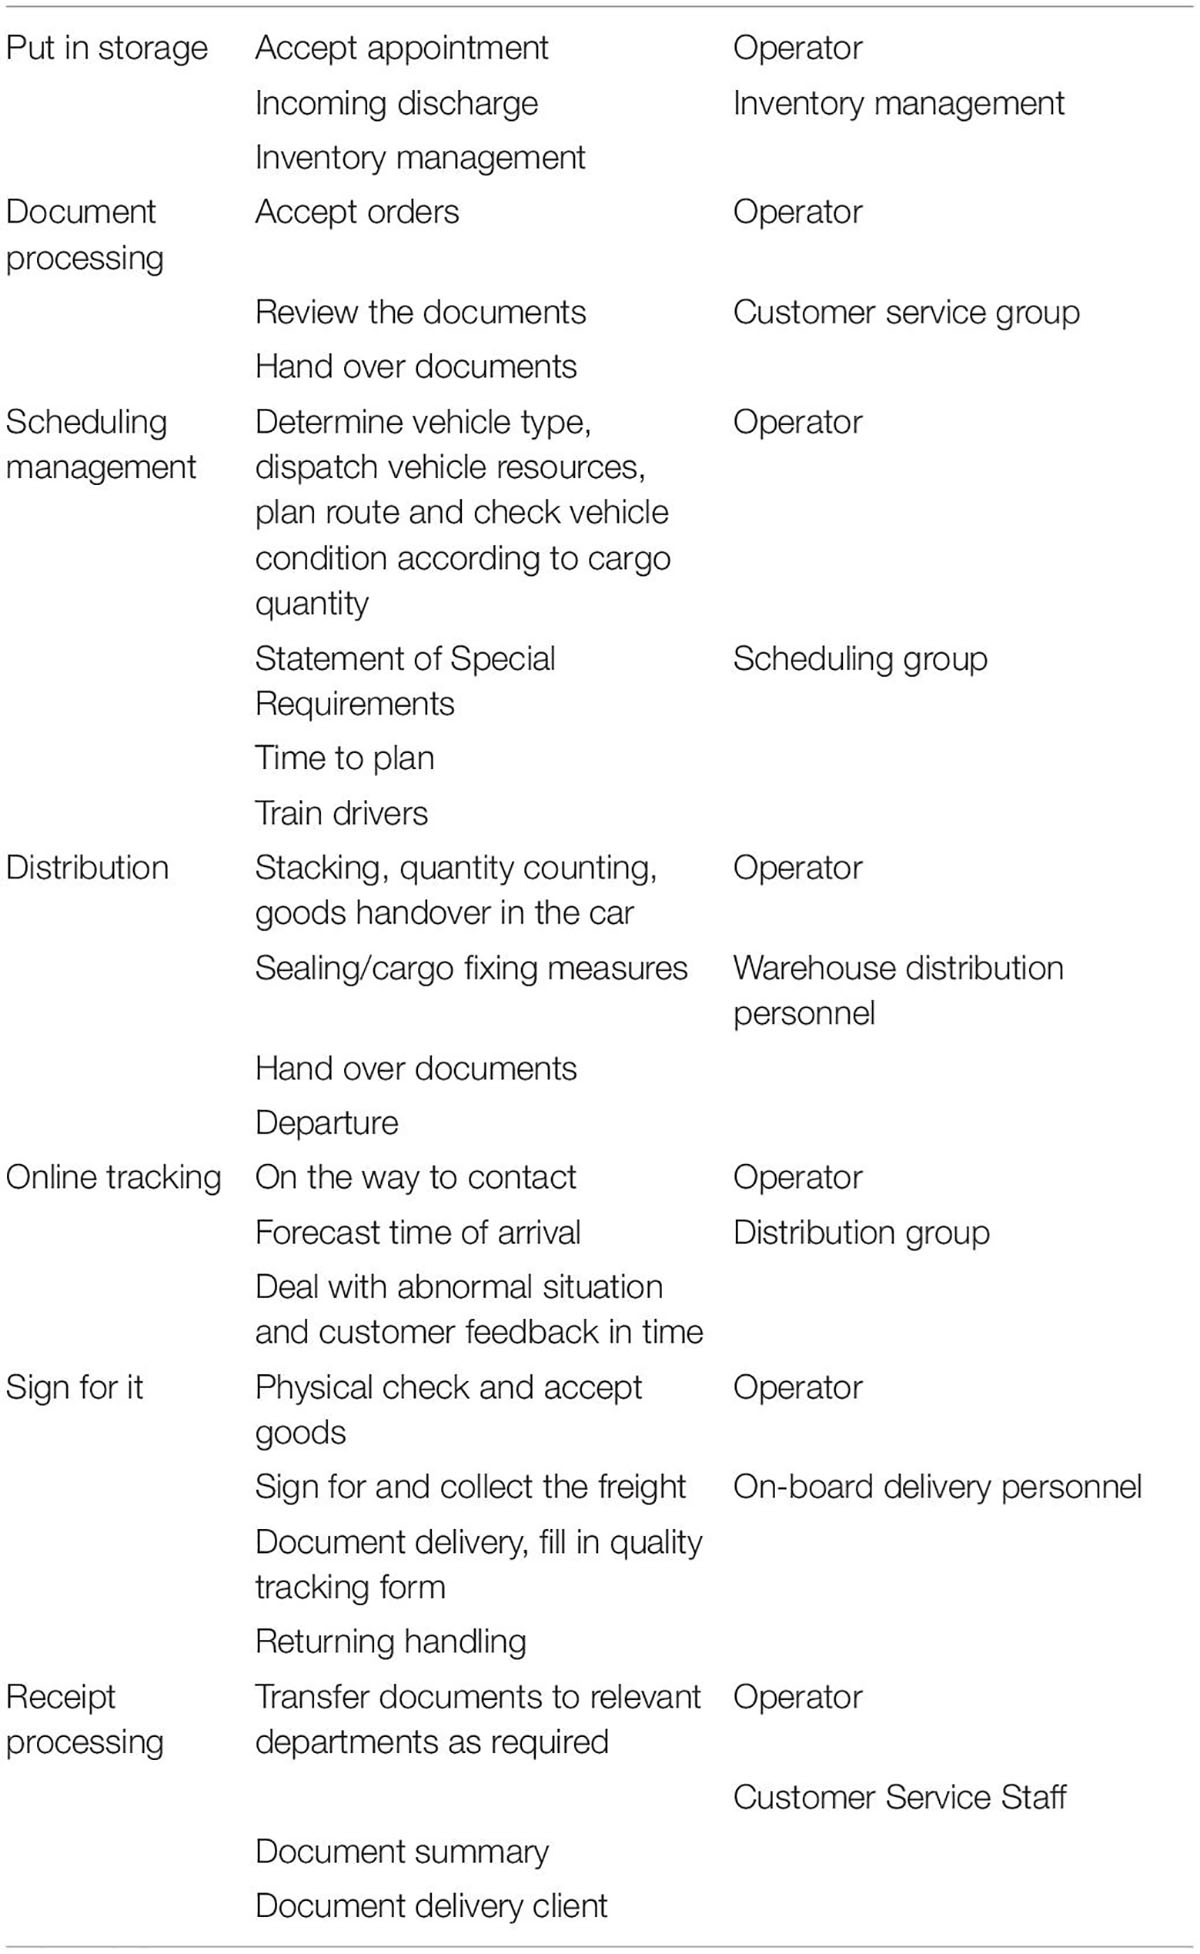
Table 2. Operation process.
The MATLAB code looks like this:
MATLAB main command summary MATLAB function reference appendix 1.1 Management commands.
function name function description function name function description addpath add a search path.
rmpath removes a search path.
demo Run the Matlab demo program.
type lists.M files.
doc loads a hypertext document.
version Displays the version number of Matlab help start online help what lists the relevant files in the current directory lasterr Displays the last message.
whatsnew shows new features of Matlab.
lookfor search keyword help which constructs the directory path where the function and file are located Set or query the Matlab path.
Basic Parameter Settings
Delivery of Refrigerated Vehicles
The main configuration is as follows is shown in Table 3.
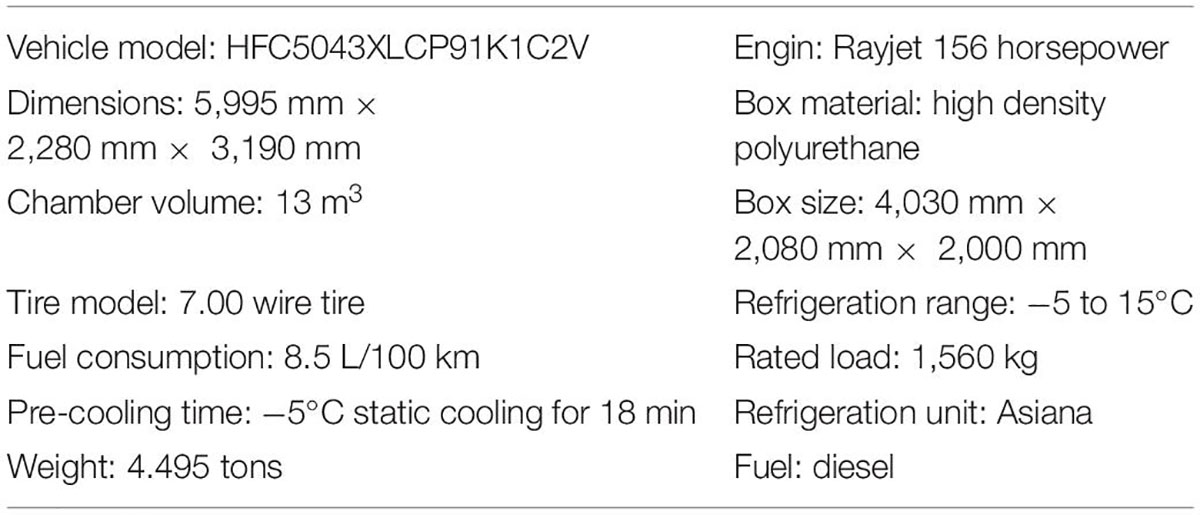
Table 3. Refrigerator vehicle configuration.
Setting of Relevant Parameters in the Mathematical Model
The related parameters are shown in Table 4. It is assumed that fuel is national fifth standard diesel, ambient temperature >24 degrees, low humidity (<50%), vehicle speed range (40–80 km/h), high altitude and other conditions.
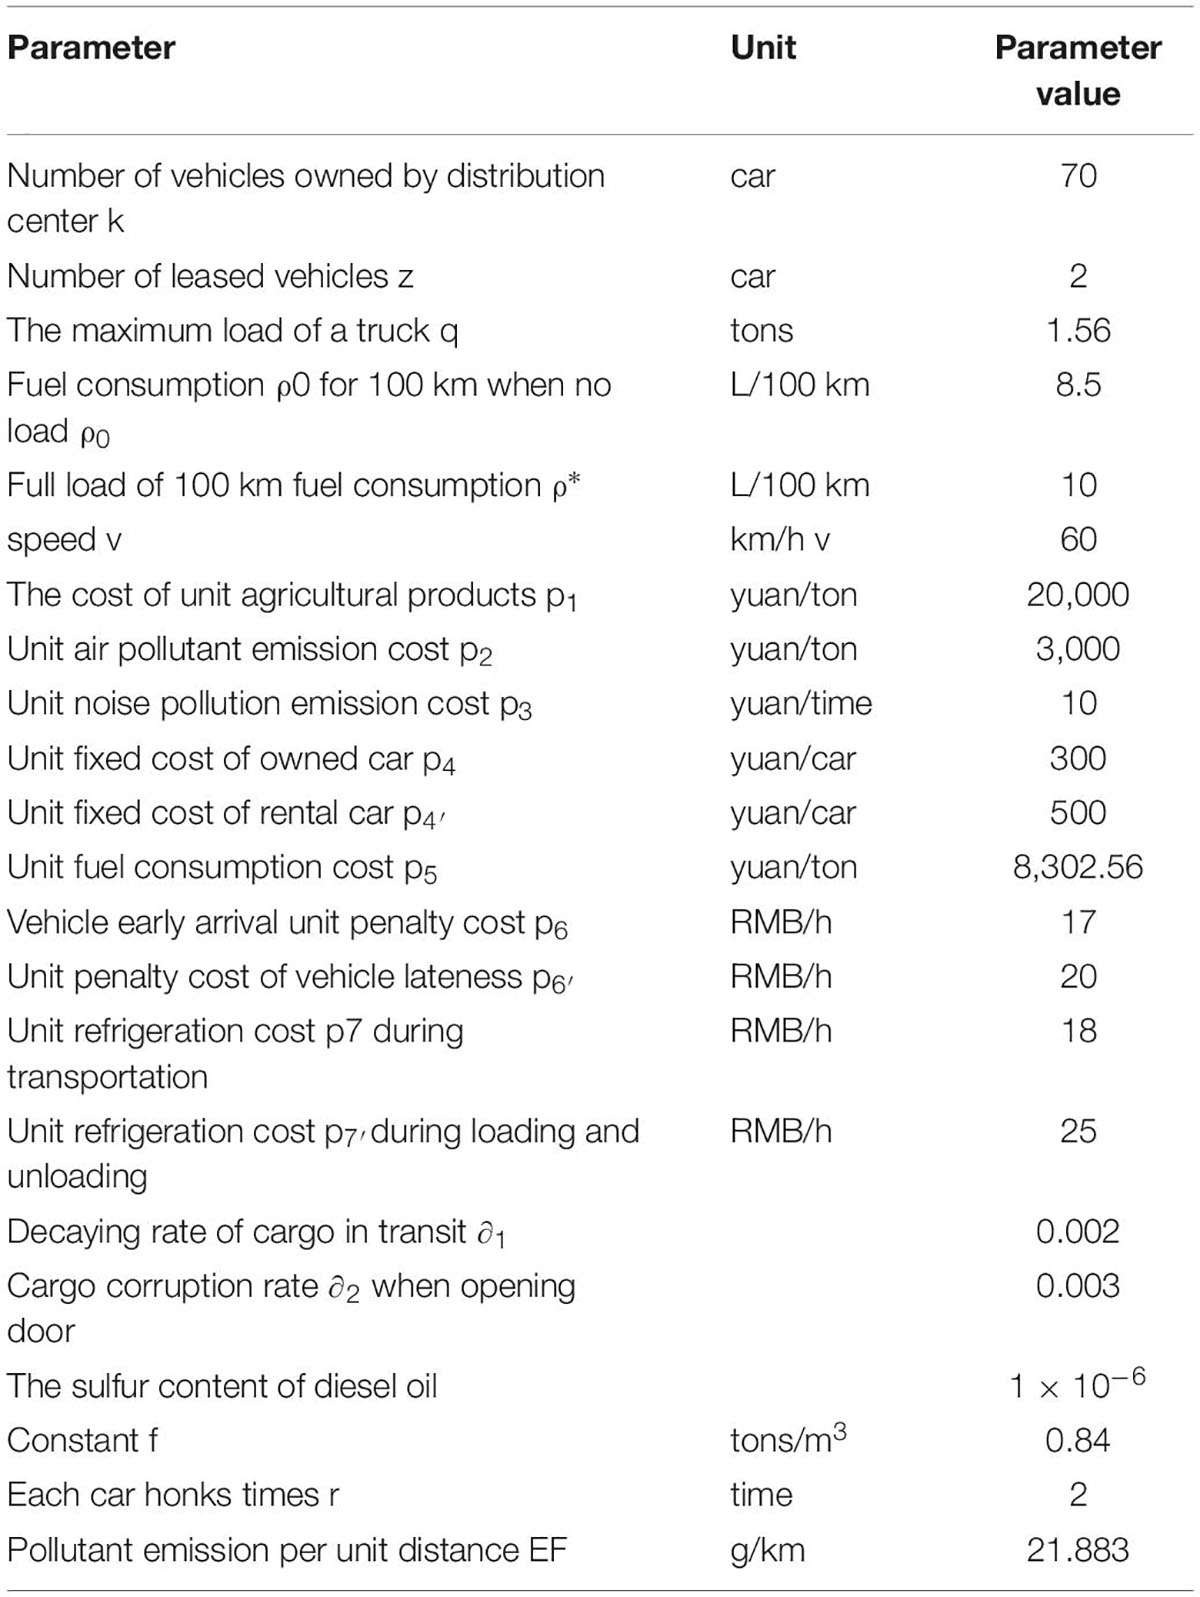
Table 4. Related parameter settings in the model.
Data Sources
The rise of big data science can provide a key boost for the development of urban ecology. Under the influence of high population concentration in cities, urban-centric economic production methods and rapidly expanding networks, communications and the Internet of Things, urban It has become a huge data factory. This paper builds a model based on the cold chain logistics distribution of fresh agricultural products by Cold Chain Logistics Co. Ltd. Due to the large number of service stores and the difficulty of data analysis, only 14 cooperative retailers and distribution centers are selected as the research objects for the demand for cold chain logistics distribution services of agricultural products studied in this paper. The cold chain logistics company meets 14 needs and maintains the distribution of new products. The distribution center and store are numbered 0, 1, 2…, 14, respectively.
When the distribution center performs the distribution tasks of various fresh produce stores, its main goal is to provide customer satisfaction with the service. Therefore, fresh agricultural products must be delivered in the time specified by each demand store. If the delivery service arrives in more time than the time specified by the demand store, due to the economic loss brought to the store by the delayed delivery, the corresponding delivery will be punished according to the exceeded time. The location of each store is shown in Table 5, and the distance between the delivery area and each store is shown in Table 6. The demand and service time of each store need to be reported in Table 7.
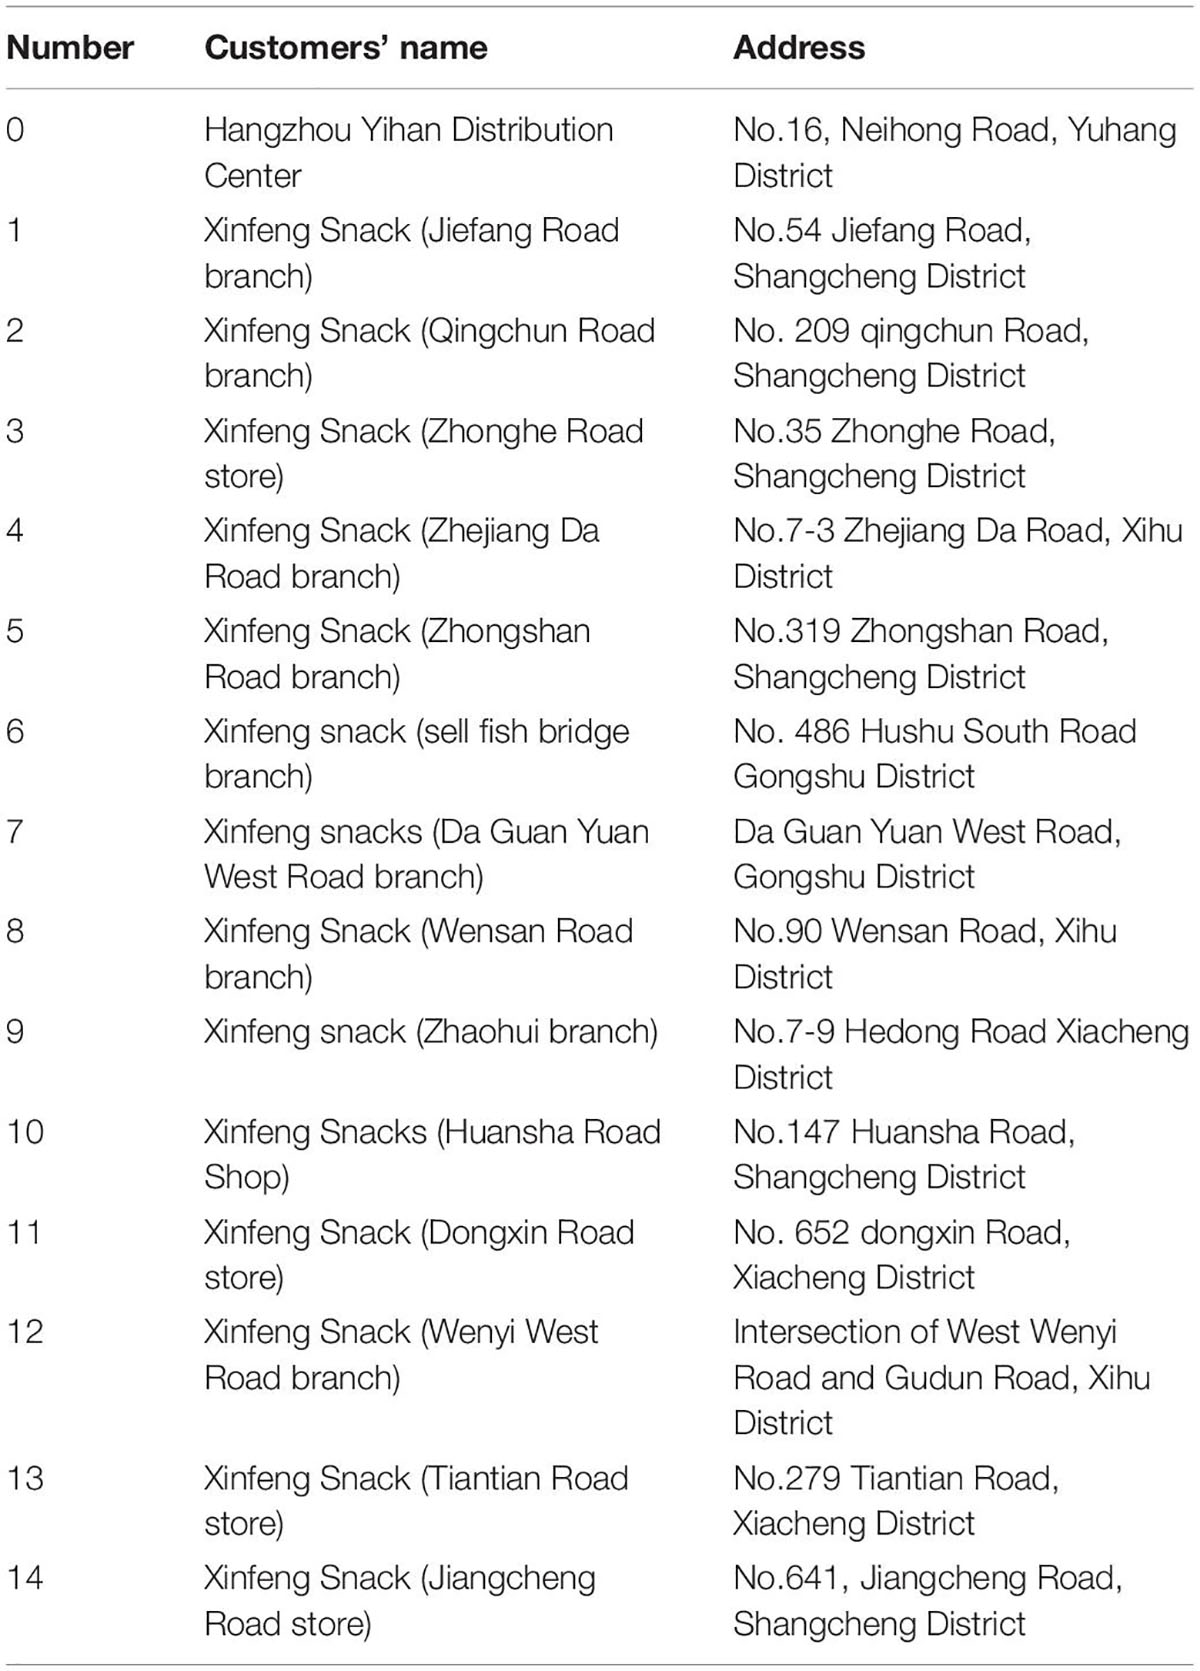
Table 5. Geographical location of each store.
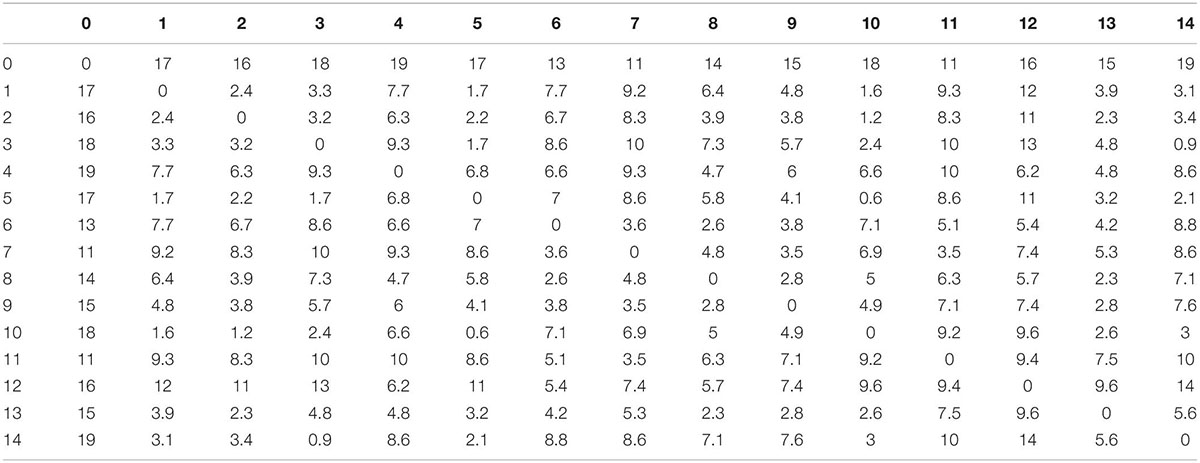
Table 6. Distribution distance between distribution center and stores (km).
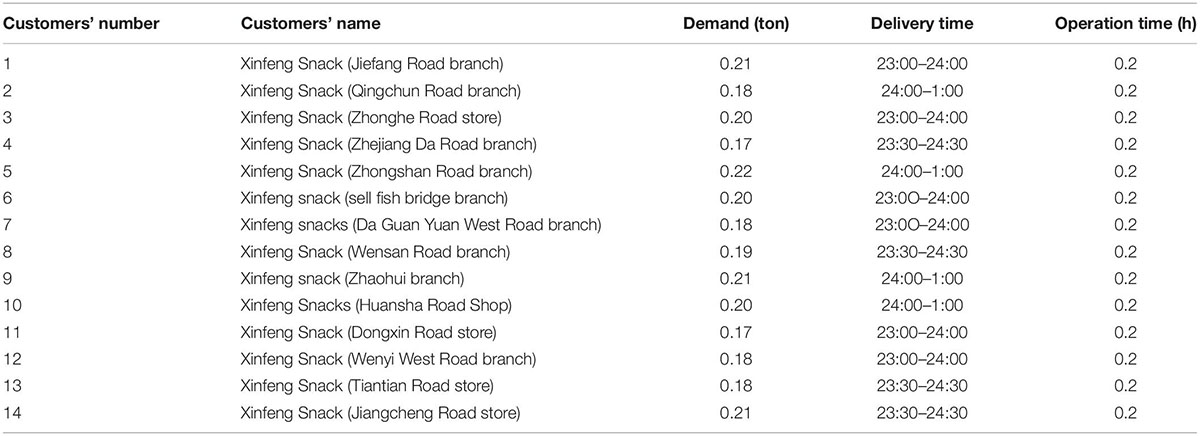
Table 7. Demand and service window time of each demand store.
The ant colony algorithm is used, and MATLAB programming is used to solve the road optimization mathematical model, and the distribution distance between the distribution center and each store, the demand information of each store, and hourly information are input into the program matrix. Furthermore, the information heuristic factor α = 1 the expected heuristic factor β = 2, the pheromone volatilization coefficient ρ=0.5, the number of ants is 20, and the maximum number of iterations is 100. The optimal solution and cost variation under common and green perspectives are considered respectively.
The Optimal Solution Under the Common Perspective
From the common perspective, that is, the total cost does not consider the pollution cost. The optimal solution is obtained by using MATLAB, as shown in Table 8, and the cost variation diagram is shown in Figure 2.
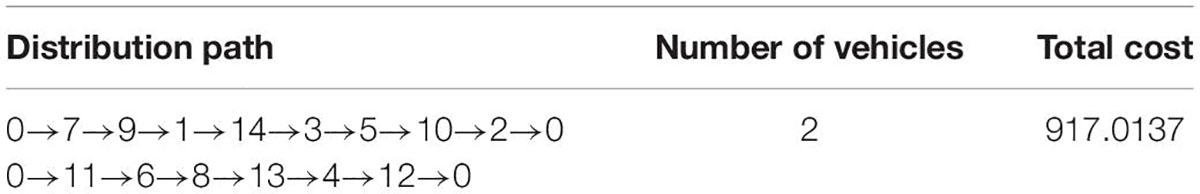
Table 8. Optimal results of path optimization model from common perspective.
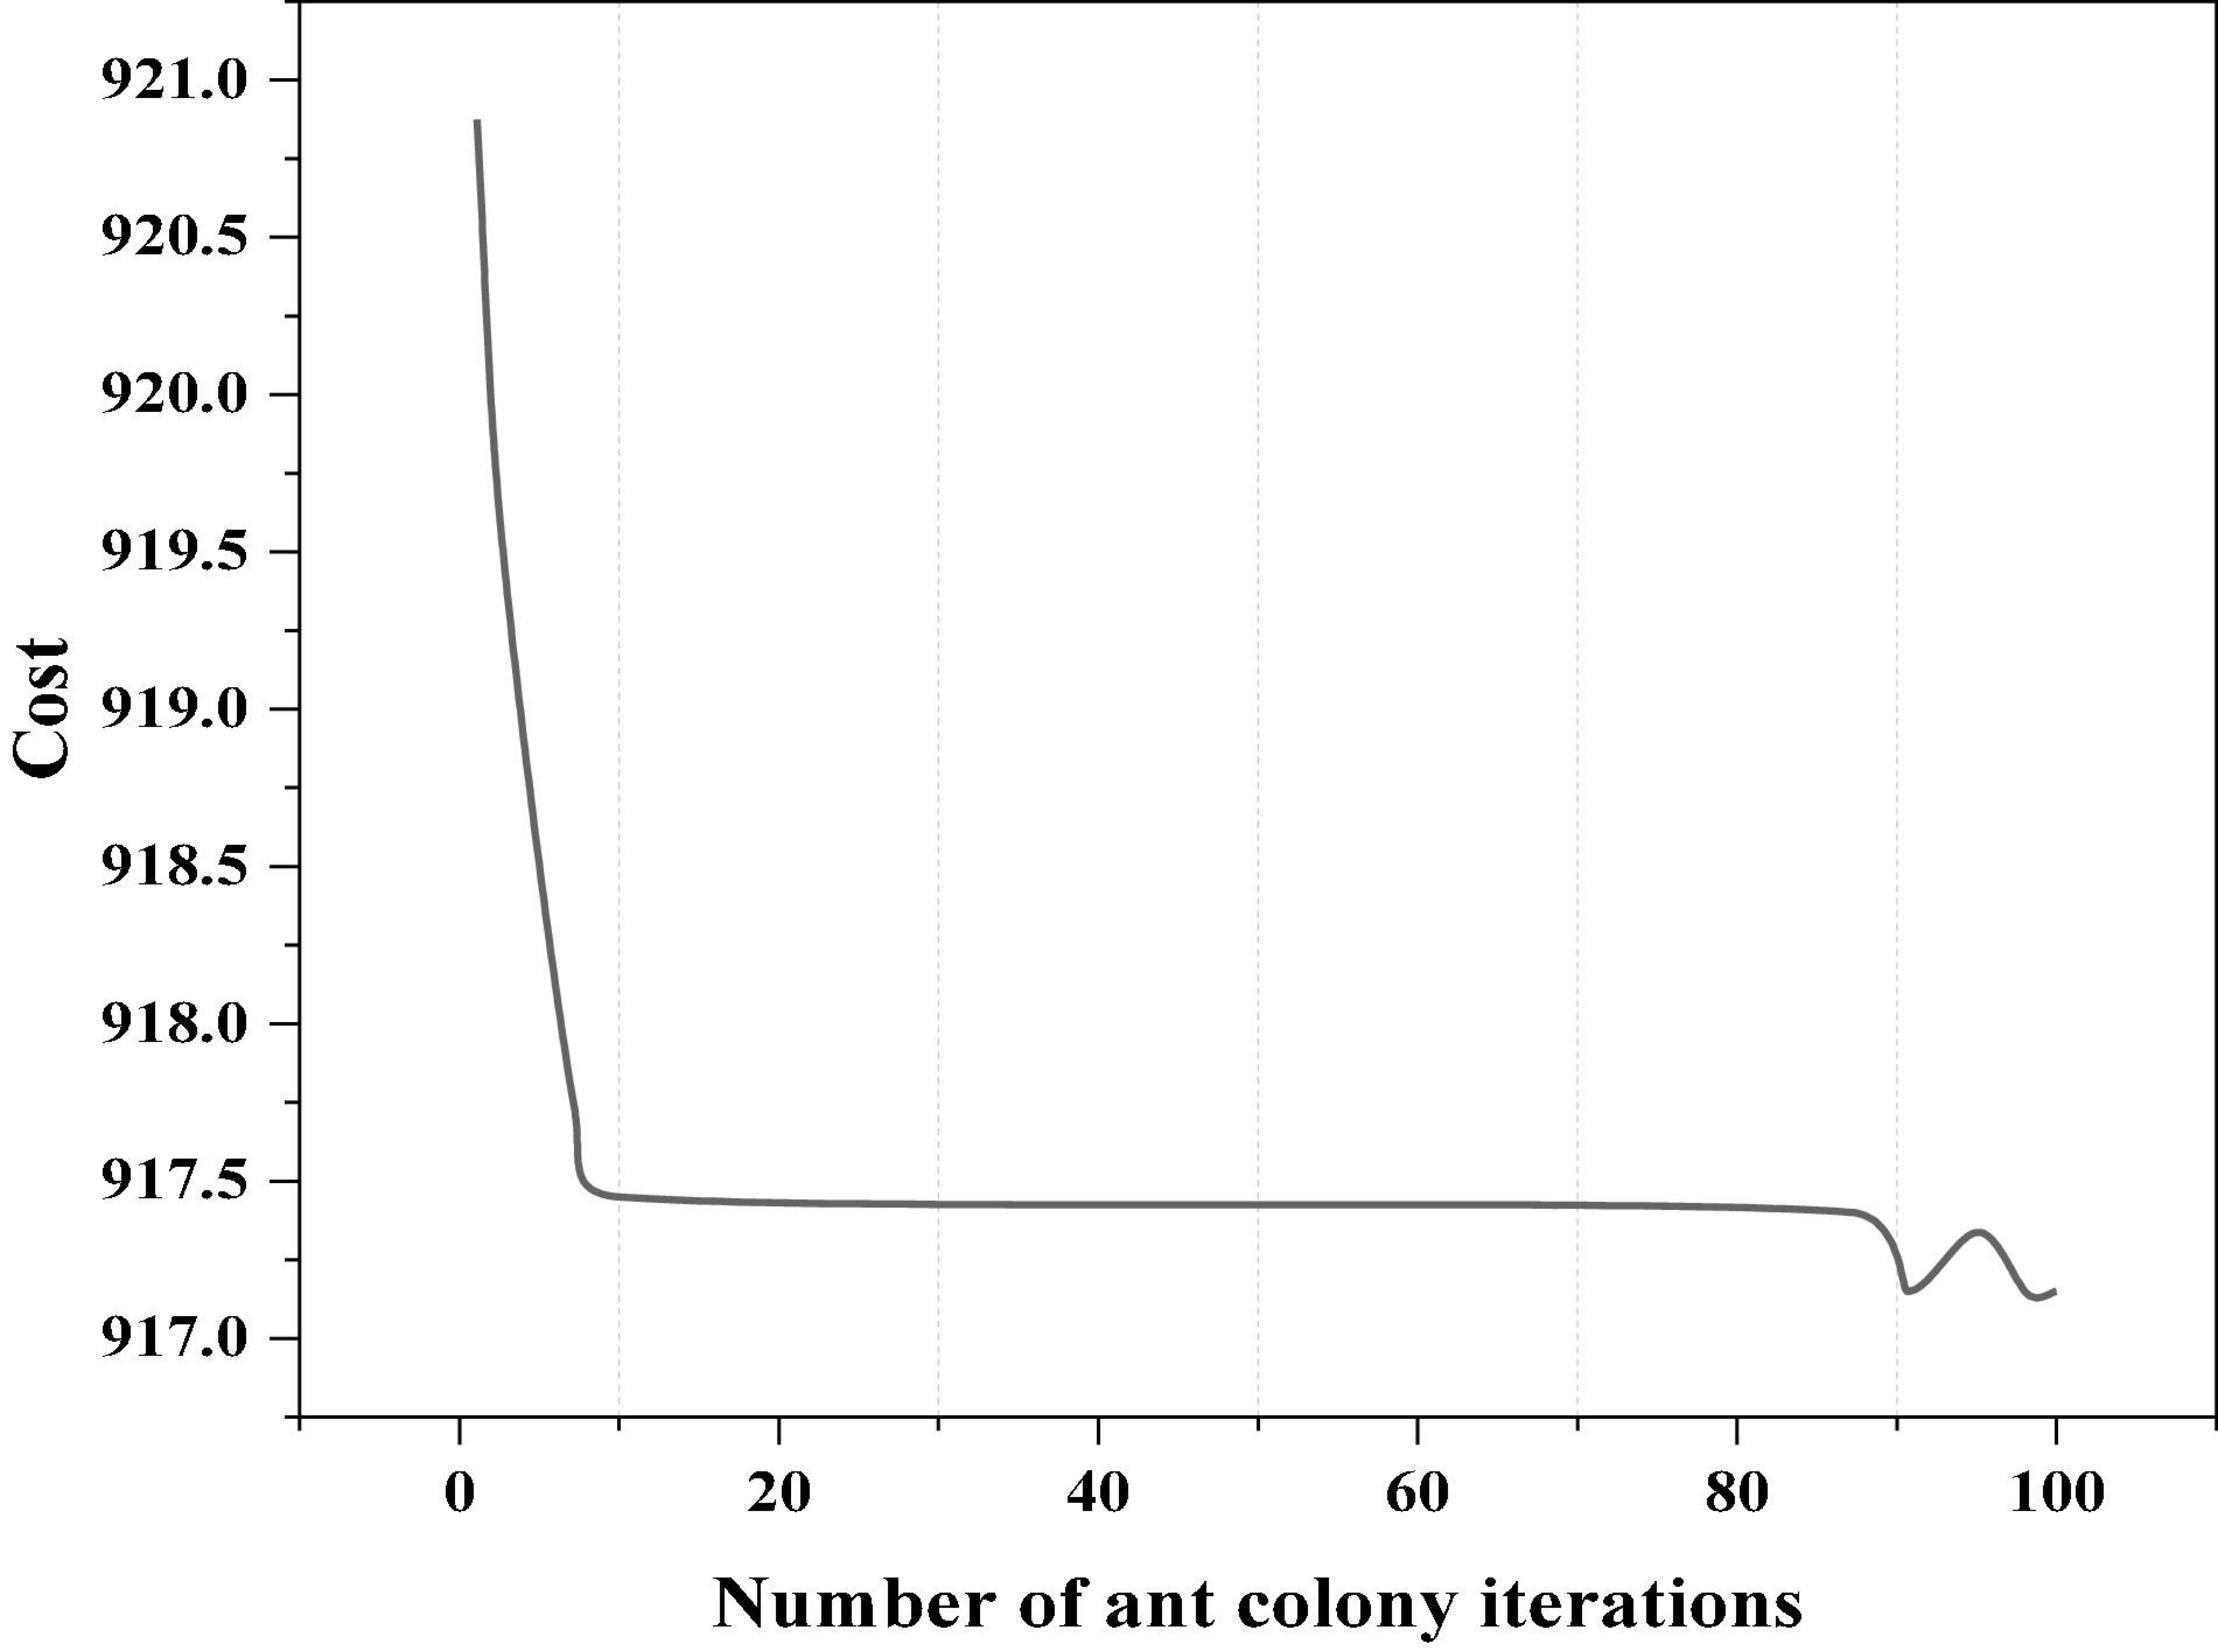
Figure 2. Cost variation from a common perspective.
Optimal Solution From the Green Perspective
From the green perspective, not only the general cost is considered, but also the pollution cost is mainly considered from three aspects of gas, solid and liquid and noise pollution. The optimal solution obtained by MATLAB is shown in Table 9, and the cost variation diagram is shown in Figure 3.
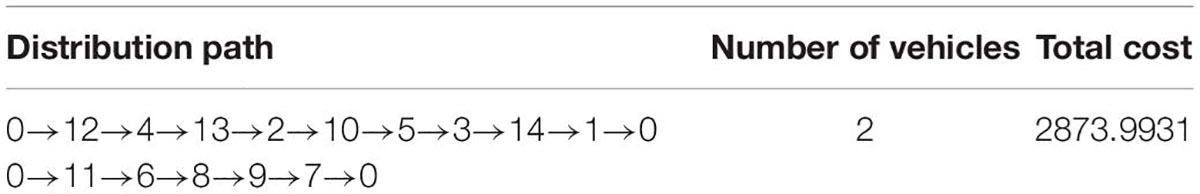
Table 9. Optimal results of the path optimization model from the green perspective.
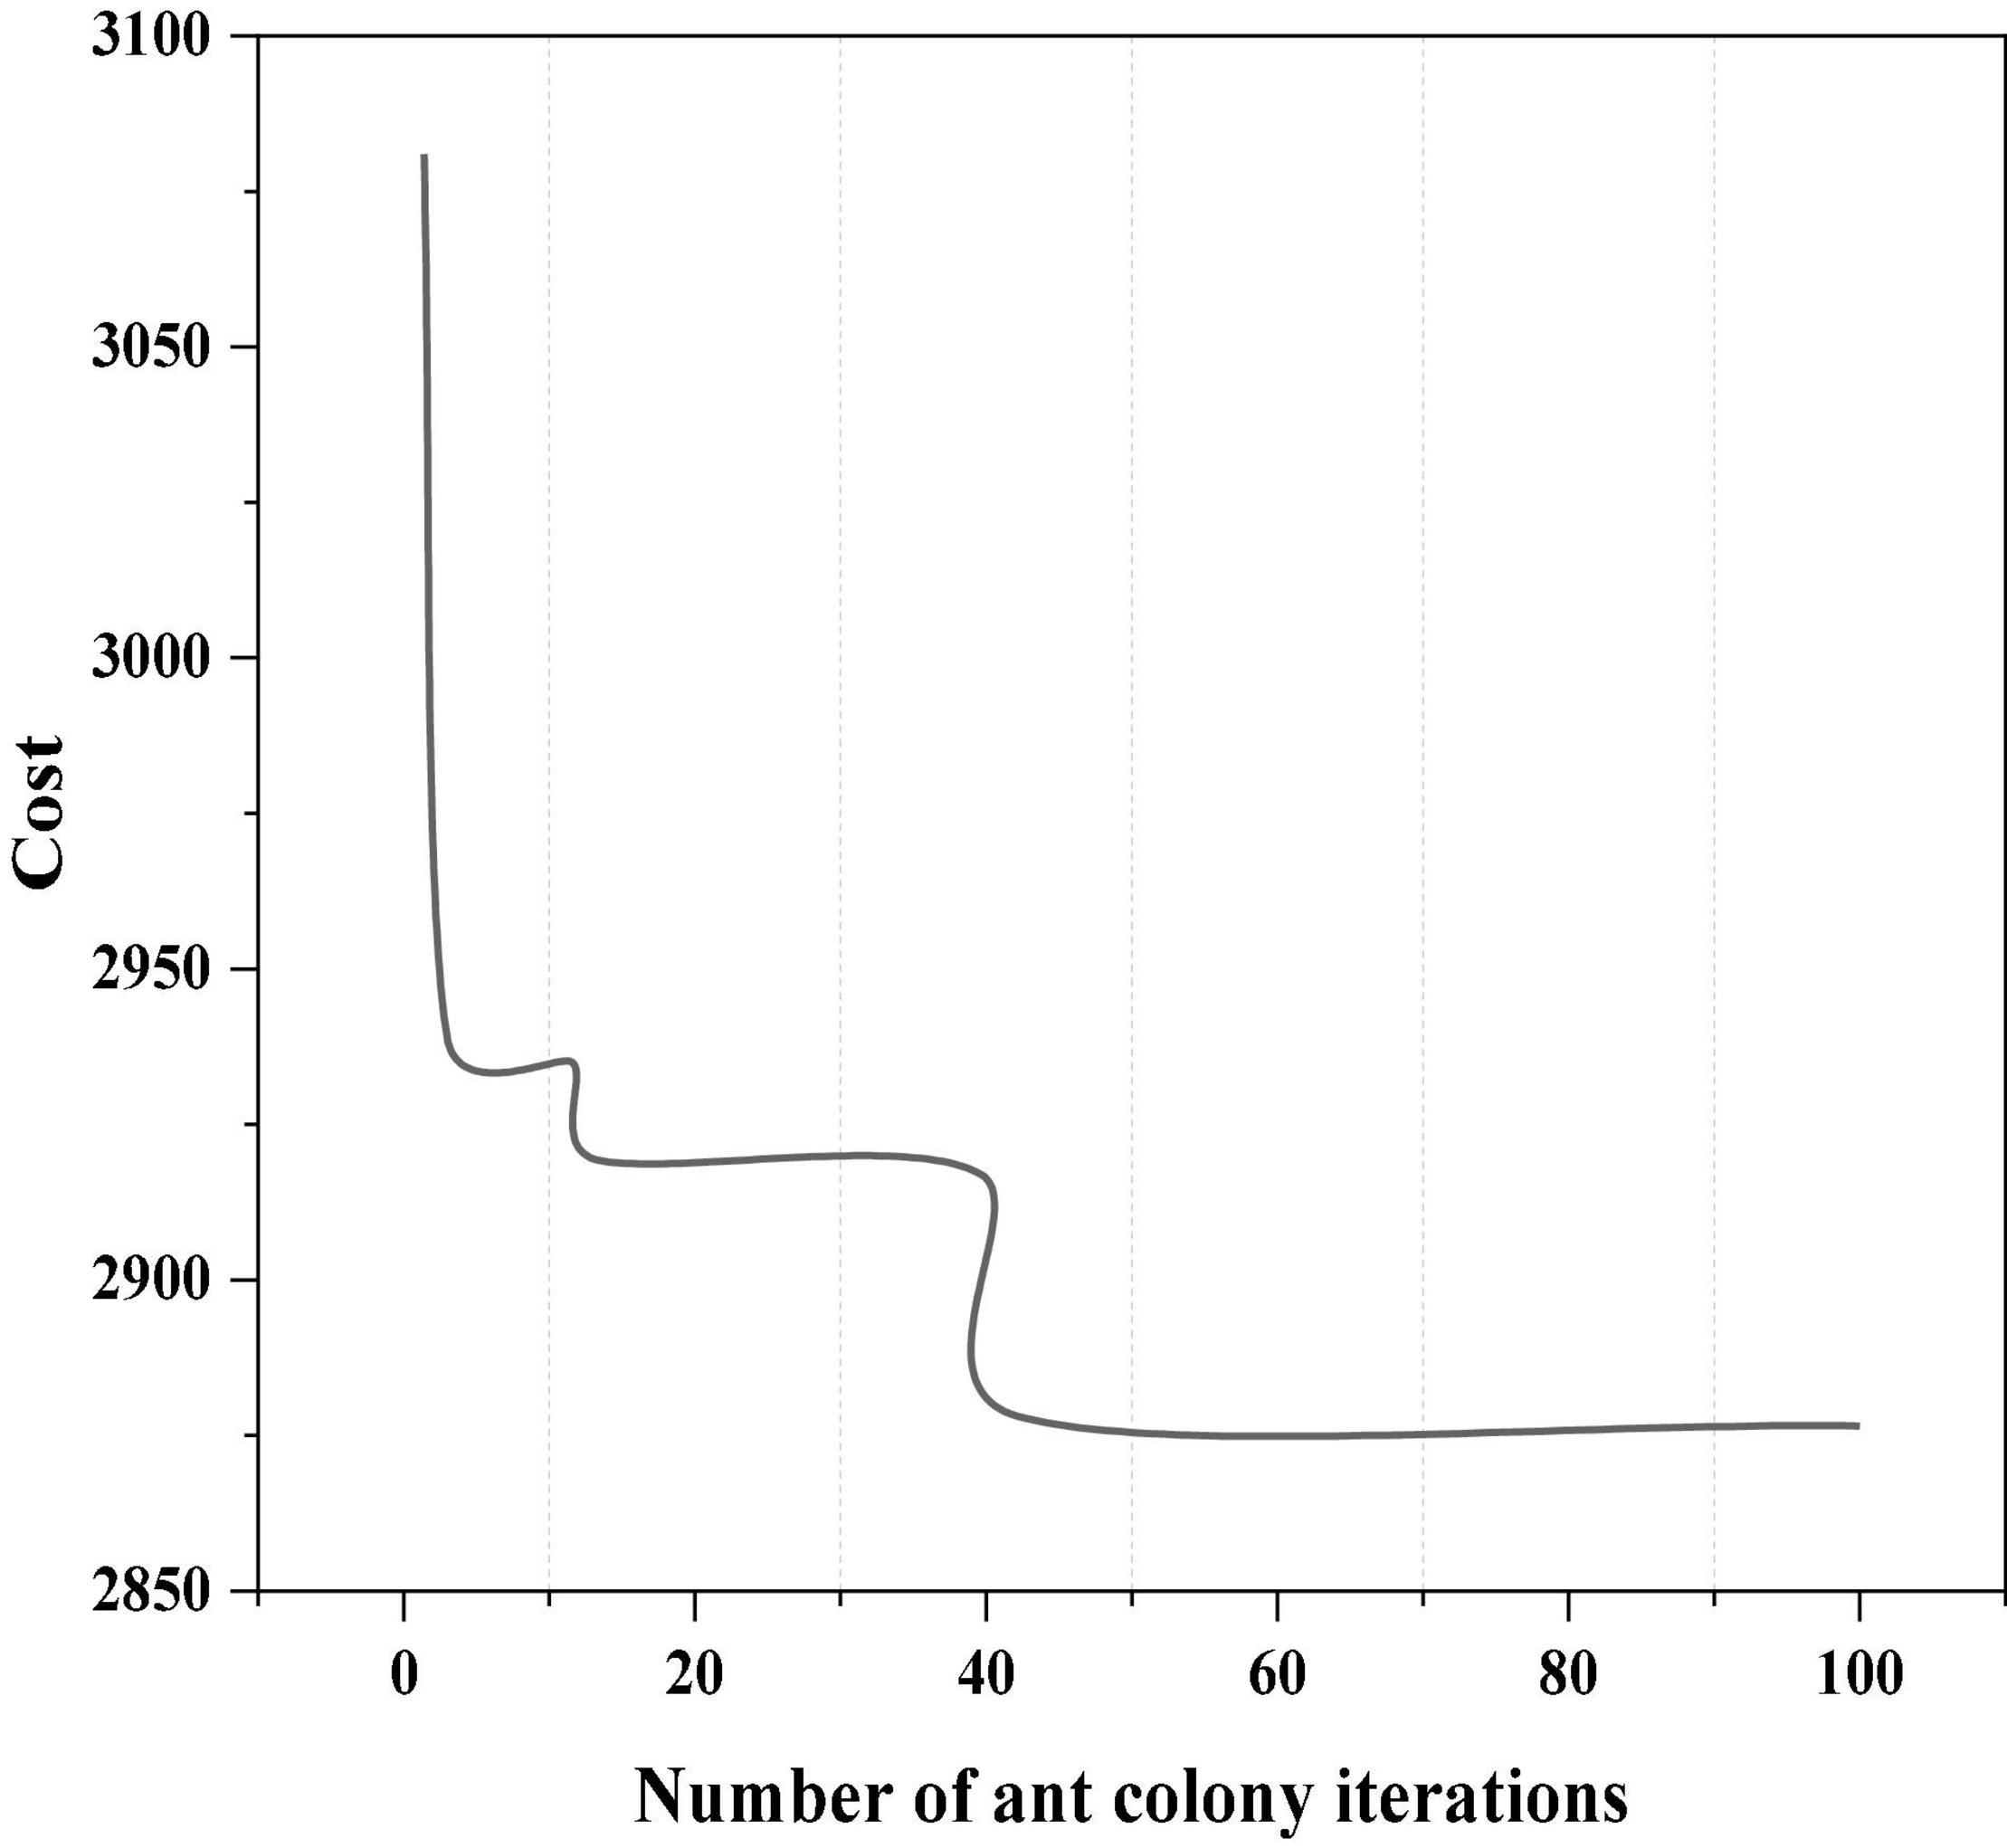
Figure 3. Cost variation from the green perspective.
It can be found from Tables 8, 9 that when completing the cold chain distribution task, the distribution center still only needs to allocate two trucks. We can find that the distribution route of each truck has changed. From a common perspective, trucks will be arranged to serve customers with large demands as much as possible. In this way, the total cost can be reduced, while the cost of pollution is ignored. The study is relatively simple, and only the basic cost of distribution is considered. From the green perspective, truck not only considers customer demand and distance, but also mainly considers the cost of gas, solid liquid and noise pollution in the process of vehicle distribution. The situation is more specific and complex, which is more in line with the research requirements of green environmental protection, so it has more research value.
Analysis of Path Optimization Results
α Influence on Optimization and Solution of Distribution Path
The information heuristic factor α determines the relative influence of pheromones. When the α value is relatively large, the pheromone influence is large, and the randomness of the algorithm decreases, because the positive feedback effect is enhanced, and ants tend to choose the path they have taken before. This will cause the algorithm to converge prematurely. When the α value is relatively small, the algorithm is easy to fall into the local optimal solution. The influence of α on the optimization solution of distribution path is shown in Table 10.
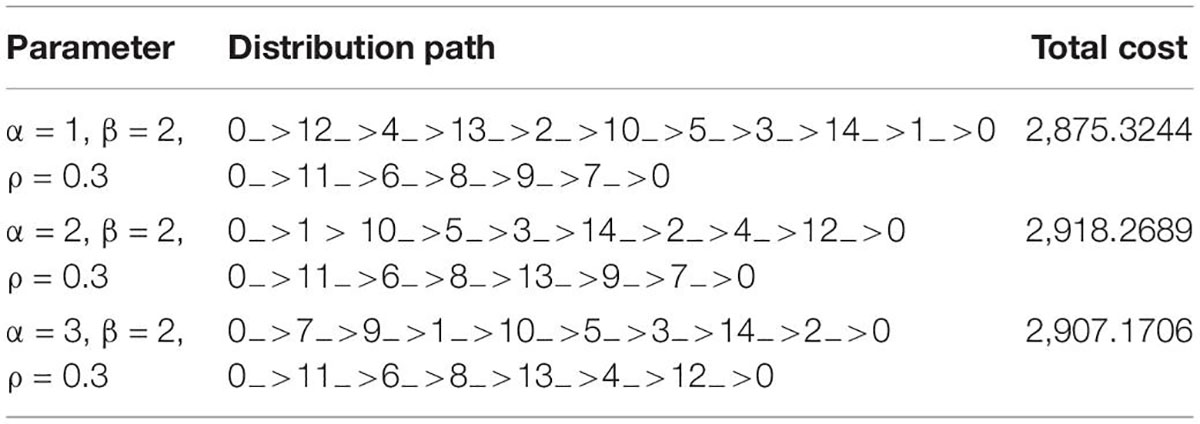
Table 10. α’s influence on the optimization solution of distribution path.
It can be clearly seen from Table 10 that the total cost when α = 2 is greater than that when α = 1, indicating premature convergence of the algorithm. And when α = 1, it’s not globally optimal.
The Influence of β on Distribution Path Optimization
The expected value heuristic factor β determines the relative importance of heuristic information. When the value of β is small, the influence of pheromone is weakened, and the ants lose the perception judgment, and they are easy to fall into the random search. When the value of β is high, the ant will tend to choose the previous path, which is easy to fall into the local optimal solution. The influence of β on the optimization solution of distribution path is shown in Table 11.
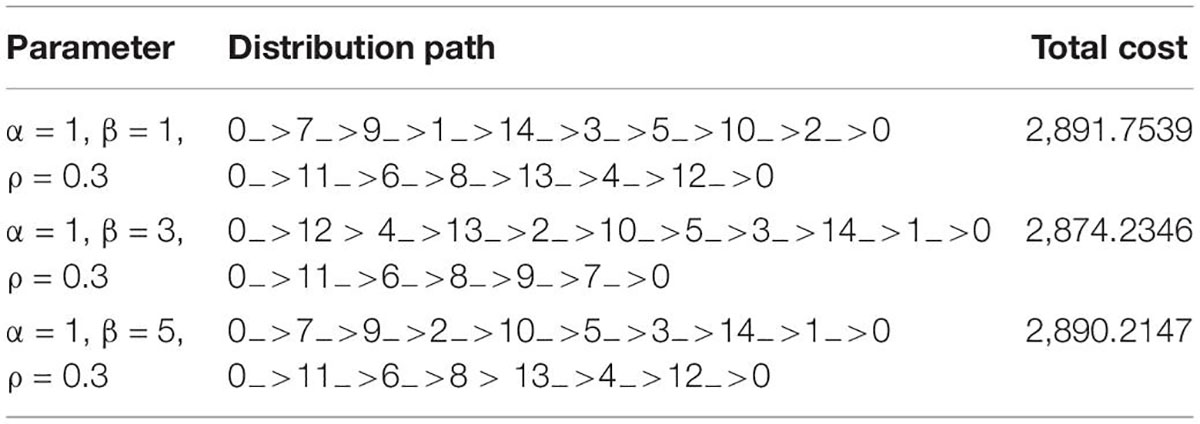
Table 11. Influence of β on optimization solution of distribution path.
It can be clearly seen from the above table that when β = 5, the total cost is greater than that when β = 3, indicating premature convergence of the algorithm, and when β = 1, it is not the global optimal solution.
The Influence of ρ on the Optimization Solution of Distribution Path
Pheromone volatilization coefficient ρ affects the global searching ability and convergence speed of ant colony algorithm. When the value of ρ is relatively large, ants tend to choose the path they have taken before, so that they are easy to fall into the local optimal solution. If the value of ρ is small, the global search ability can be improved, but the convergence speed will be slow. The influence of ρ on the optimization solution of distribution path is shown in Table 12.
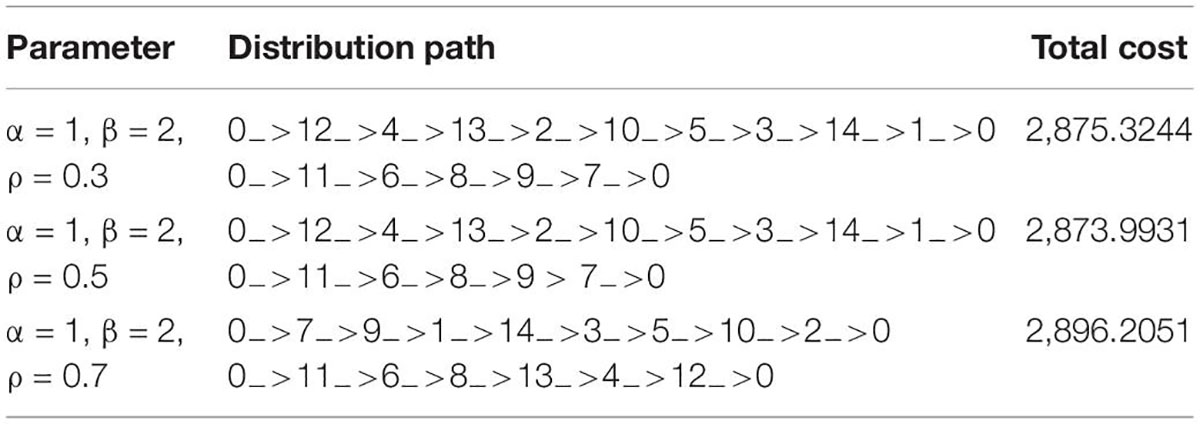
Table 12. ρ’s influence on optimization solution of distribution path.
It can be clearly seen from the above table that when ρ = 0.7, the total cost is greater than that when ρ = 0.5, indicating premature convergence of the algorithm, while whenρ = 0.3, it is not the global optimal solution.
Determine the Optimal Parameter Combination
Through the comparison and analysis of the above simulation results, the more appropriate value of a single parameter is basically determined. However, the combination of these values may not be the optimal parameter combination, so it is necessary to conduct simulation analysis on the parameter combination according to the results in Tables 10, 12. The better solution of the problem with different parameter combinations is shown in Table 13.
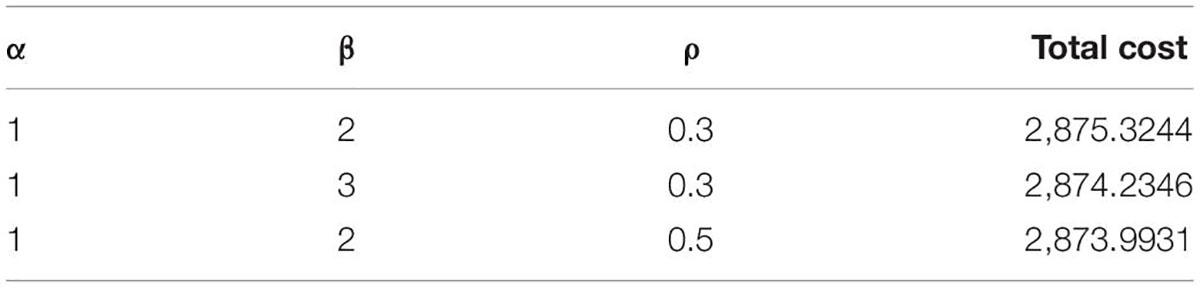
Table 13. Better solutions of the problem under different parameter combinations.
As can be seen from the above table, the best solution is 2,873.9931, while other solutions are very close to the best solution, with a difference of only 1–2%. Therefore, the value range of algorithm parameters is α∈[1,2], β∈[2,3], ρ∈[0.3,0.5]. Therefore, the optimal parameter combination for solving the 14 distribution point problem is α = 1, β = 2, ρ = 0.5.
In this section, through the program implementation of ant colony algorithm, the optimization results of the distribution path under two perspectives are obtained. In addition, we use the method of controlling a single variable to conduct a simulation experiment, reflecting the influence of different factors α,β,ρ on the results of the distribution scheme, and determine the optimal parameter combination.
Conclusion
Under the influence of the concept and economic background of carbon neutrality and green logistics, the cold chain logistics of agricultural products is a large energy consumption in the logistics industry. Based on this, when exploring the establishment of a model for the cold chain distribution of fresh agricultural products, the cost of pollution, including atmospheric air Pollutant emission cost, solid and liquid pollutant emission cost and noise pollution cost. The ant colony algorithm is designed and realized by MATLAB software, and the algorithm is run independently to obtain the optimal distribution plan. Through the comparison of simulation experiments, the best parameter solution is 2,873.9931, which is only about 1–2% different from other combinations. The optimal parameter combination is determined on the basis of reflecting different distribution results. The experimental results show that the green index is the main consideration factor in the total cost of cold chain distribution, which can not only achieve the goal of controlling the cost of logistics distribution, but also detect the green environmental protection level of the whole distribution process, and effectively improve the greening of cold chain logistics distribution of agricultural products. Logistics enterprises choose an optimal distribution path that is both economical and green.
Data Availability Statement
The original contributions presented in this study are included in the article/supplementary material, further inquiries can be directed to the corresponding author.
Author Contributions
The author confirms being the sole contributor of this work and has approved it for publication.
Conflict of Interest
The author declares that the research was conducted in the absence of any commercial or financial relationships that could be construed as a potential conflict of interest.
Publisher’s Note
All claims expressed in this article are solely those of the authors and do not necessarily represent those of their affiliated organizations, or those of the publisher, the editors and the reviewers. Any product that may be evaluated in this article, or claim that may be made by its manufacturer, is not guaranteed or endorsed by the publisher.
References
Aboulfotouh, K., Cui, Z., and Williams, R. O. (2021). Next-generation covid-19 vaccines should take efficiency of distribution into consideration. AAPS PharmSciTech 22:126. doi: 10.1208/s12249-021-01974-3
Chen, Y. (2021). Location and path optimization of green cold chain logistics based on improved genetic algorithm from the perspective of low carbon and environmental protection. Fresenius Environ. Bull. 30, 5961–5973.
Cui, H. (2021). Intelligent coordination distribution of the whole supply chain based on the internet of things. Complexity 2021, 1–12. doi: 10.1155/2021/5555264
Cui, S., Pei, X., Jiang, Y., Wang, G., Fan, X., Yang, Q., et al. (2021). Liquefaction within a bedding fault: understanding the initiation and movement of the Daguangbao landslide triggered by the 2008 Wenchuan Earthquake (Ms = 8.0). Eng. Geol. 295:106455. doi: 10.1016/j.enggeo.2021.106455
Dai, Z., and Ye, C. (2022). Analysis and evaluation of key elements of optimal regulation of green supply chain from the perspective of low carbon. Wirel. Commun. Mob. Comput. 2022, 1–11. doi: 10.1155/2022/8196756
Guo, Z., and Xiao, Z. (2021). Research on online calibration of lidar and camera for intelligent connected vehicles based on depth-edge matching. Nonlinear Eng. 10, 469–476. doi: 10.1515/nleng-2021-0038
He, Y., and Kusiak, A. (2017). Performance assessment of wind turbines: data-derived quantitative metrics. IEEE Trans. Sustain. Energy 9, 65–73. doi: 10.1109/TSTE.2017.2715061
Huang, R., Zhang, S., Zhang, W., and Yang, X. (2021). Progress of zinc oxide-based nanocomposites in the textile industry. IET Collab. Intell. Manuf. 3, 281–289. doi: 10.1049/cim2.12029
Jani, D. B. (2021). Supply cold chain and logistics in food industries. Sci. Technol. Built Environ. 16, 18–21.
Li, H. (2022a). Short-term wind power prediction via spatial temporal analysis and deep residual networks. Front. Energy Res. 10:920407. doi: 10.3389/fenrg.2022.920407
Li, H. (2022b). SCADA data based wind power interval prediction using LUBE-based deep residual networks. Front. Energy Res. 10:920837. doi: 10.3389/fenrg.2022.920837
Li, H., Deng, J., Feng, P., Pu, C., Arachchige, D., and Cheng, Q. (2021a). Short-term nacelle orientation forecasting using bilinear transformation and ICEEMDAN framework. Front. Energy Res. 9:780928. doi: 10.3389/fenrg.2021.780928
Li, H., Deng, J., Yuan, S., Feng, P., and Arachchige, D. (2021b). Monitoring and identifying wind turbine generator bearing faults using deep belief network and EWMA control charts. Front. Energy Res. 9:799039. doi: 10.3389/fenrg.2021.799039
Li, H., He, Y., Xu, Q., Deng, J., Li, W., and Wei, Y. (2022). Detection and segmentation of loess landslides via satellite images: a two-phase framework. Landslides 19, 673–686. doi: 10.1007/s10346-021-01789-0
Lian, J. (2021). An optimization model of cross-docking scheduling of cold chain logistics based on fuzzy time window. J. Intell. Fuzzy Syst. 41, 1901–1915. doi: 10.3233/JIFS-210611
Liu, X., and Ahmadi, Z. (2021). H2O and H2S adsorption by assistance of a heterogeneous carbon boron nitrogen nanocage: computational study. Main Group Chem. 21, 185–193. doi: 10.3233/MGC-210113
Liu, Z., Guo, H., Zhao, Y., Hu, B., and Huang, B. (2021). Research on the optimized route of cold chain logistics transportation of fresh products in context of energy-saving and emission reduction. Math. Biosci. Eng. 18, 1926–1940. doi: 10.3934/mbe.2021100
Ning, T., An, L., and Duan, X. (2021). Optimization of cold chain distribution path of fresh agricultural products under carbon tax mechanism: a case study in china. J. Intell. Fuzzy Syst. 40, 10549–10558. doi: 10.3233/JIFS-201241
Qu, X., and Sun, X. (2022). How to improve the function of government carbon tax in promoting enterprise carbon emission reduction: from the perspective of three-stage dynamic game. Environ. Sci. Pollu. Res. 29, 31348–31362. doi: 10.1007/s11356-021-18236-1
Rollo, A. M., Rollo, A., and Mora, C. (2020). The tree-lined path to carbon neutrality. Nat. Rev. Earth Environ. 1:332. doi: 10.1038/s43017-020-0069-3
Ross, J. C., Saidu, Y., NZuobontane, D., Voukings, M. Z., and Embrey, S. R. (2020). Application of the remaining vaccine vial monitor life calculation to field temperature monitoring data to improve visibility into cold chain equipment performance. Vaccine 38, 7683–7687. doi: 10.1016/j.vaccine.2020.09.078
Sharma, A., and Kumar, R. (2019). Risk-energy aware service level agreement assessment for computing quickest path in computer networks. Int. J. Reliab. Saf. 13, 96–124. doi: 10.1504/IJRS.2019.097019
Shi, M. (2022). Forecast of china’s carbon emissions under the background of carbon neutrality. Environ. Sci. Pollu. Res. 29, 43019–43033. doi: 10.1007/s11356-021-18162-2
Shui, W., and Li, M. (2020). Integrated pricing and distribution planning for community group purchase of fresh agricultural products. Sci. Program. 2020, 1–15. doi: 10.1155/2020/8839398
Keywords: carbon neutralization, cold chain logistics, distribution path, urban ecosystem, optimization
Citation: Jia X (2022) Research on the Optimization of Cold Chain Logistics Distribution Path of Agricultural Products E-Commerce in Urban Ecosystem From the Perspective of Carbon Neutrality. Front. Ecol. Evol. 10:966111. doi: 10.3389/fevo.2022.966111
Received: 10 June 2022; Accepted: 23 June 2022;
Published: 28 July 2022.
Edited by:
Yusen He, Grinnell College, United StatesCopyright © 2022 Jia. This is an open-access article distributed under the terms of the Creative Commons Attribution License (CC BY). The use, distribution or reproduction in other forums is permitted, provided the original author(s) and the copyright owner(s) are credited and that the original publication in this journal is cited, in accordance with accepted academic practice. No use, distribution or reproduction is permitted which does not comply with these terms.
*Correspondence: Xinzhong Jia, dXNlcjA1MzMwNTMzQDEyNi5jb20=