- 1Department of Earth and Environmental Sciences, College of Literature, Science, and the Arts, University of Michigan, Ann Arbor, MI, United States
- 2Museum of Paleontology, University of Michigan, Ann Arbor, MI, United States
- 3Institute of Vertebrate Paleontology and Paleoanthropology, Chinese Academy of Sciences (CAS), Beijing, China
- 4Department of Ecology and Evolutionary Biology, College of Literature, Science, and the Arts, University of Michigan, Ann Arbor, MI, United States
The stable carbon-isotope composition of mammalian tooth enamel is a powerful tool for reconstructing paleodiet and paleoenvironment. Its application in the fossil record relies on a thorough understanding of the isotopic composition of mammalian diets in modern ecosystems. We compiled and evaluated a global dataset of the carbon-isotope values of artiodactyl tooth enamel, supplemented by new samples, for 79 extant species. After correcting for differences in atmospheric carbon-isotope composition, body mass, and digestive physiology, we compared the inferred carbon-isotope values of ingested forage (δ13Cdiet) among seven feeding categories. The artiodactyl herbivore dietary spectrum is expressed through a wide range of δ13Cdiet values, with the most depleted mean value in frugivores and the most enriched in obligate grazers. In general, grazing species have a broader range of isotope values than browsing species, suggesting a wider dietary niche breadth. Notably, variable grazers exhibit a bimodal distribution of δ13Cdiet values, with North American and Asian taxa consuming C3 diets and African taxa consuming C4 diets, reflecting the amount of C4 vegetation in the environment. Variation in δ13Cdiet values also occurs among terrestrial ecoregions and artiodactyl clades. Grassland ecoregions differ significantly from forest ecoregions. We detected a low but significant phylogenetic signal in the mean δ13Cdiet values of extant species, with some of the oldest ruminant lineages having maintained C3 feeding and pure C4 diets being restricted to two bovid clades. Determining variation in δ13Cdiet values in different feeding categories and lineages will help refine paleoecological and paleoenvironmental reconstructions from the rich fossil record of artiodactyls.
Introduction
Stable isotopes are one of nature’s great ecological recorders and have been widely used to study organisms and ecosystems across time and space (West et al., 2006; Clementz, 2012). Among the animal tissues that are commonly sampled for stable isotope analyses of mammals (tooth enamel, dentin, bone collagen, hair, blood), only tooth enamel is resistant to long-term fossilization processes and diagenesis (Wang and Cerling, 1994; Koch et al., 1997; Lee-Thorp, 2002). Therefore, data generated from modern mammal teeth can be readily applied to the interpretation of deep-time records. Isotope data from extant ungulates have contributed substantial insights into our understanding of herbivore dietary ecology and have laid the foundations for a large body of literature inferring paleodiet and paleoenvironment from fossil herbivore teeth (e.g., Koch et al., 1991; Bocherens et al., 1996; Cerling and Harris, 1999; Passey and Cerling, 2002; Cerling et al., 2003, 2010; Sponheimer et al., 2003; Sponheimer and Cerling, 2014). Extant terrestrial ungulates are represented by over 250 species of artiodactyls and 18 species of perissodactyls (Burgin et al., 2018). Artiodactyls are naturally widespread in the ecosystems of Africa, Eurasia, North America, and South America. The taxonomic and ecological diversity of this family renders them good modern analogs for many extinct ungulates.
Carbon isotopes in tooth enamel
The stable isotope composition of carbon (δ13C) in the enamel of mammalian herbivores provides information about the animals’ feeding ecology and vegetation present in the habitat. Plants that use different photosynthetic pathways differ in their fractionation of atmospheric CO2 during photosynthesis. The resulting δ13C values in plant tissues are lowest in plants using the C3 pathway, intermediate in plants using the crassulacean acid metabolism (CAM) pathway, and highest in plants using the C4 pathway (O’Leary, 1988; Cerling et al., 1997). When plants are consumed by mammalian herbivores and incorporated into their body tissues, tooth enamel bioapatites are systematically enriched in δ13C relative to bulk plant diet with measurable enrichment factors (Lee-Thorp and van der Merwe, 1987; Cerling and Harris, 1999; Passey et al., 2005). Thus, the carbon isotope composition of enamel reliably reflects the values in the ingested plants. Pure C3 and C4 consumers have non-overlapping δ13C values, while mammals with mixed C3-C4 diets have intermediate δ13C values (Cerling et al., 1997, 2015; Koch, 1998). CAM plants commonly grow in xeric habitats (Ehleringer et al., 1991) and are not typically consumed by ungulates. Therefore, they are not usually considered when interpreting the carbon isotopic values of modern or fossil ungulates.
Isotopic variability among C3 plants is generally greater than that in C4 plants (e.g., Cerling et al., 1997). In general, higher (more enriched) values of the carbon isotope composition of tooth enamel of herbivorous mammals are representative of open-canopy, drier habitats (such as shrubland and grassland), while low values represent closed-canopy habitats (such as woodlands and forests) (O’Leary et al., 1992; Koch, 1998; Cerling and Harris, 1999; Feranec and MacFadden, 2006; Feranec, 2007; Secord et al., 2008). Resource partitioning in diet and habitat use may be revealed through stable isotope analysis (Feranec and MacFadden, 2006) and has been documented for medium-to large-bodied herbivores in both modern and ancient environments in which a mixture of C3 and C4 plants is present (e.g., Wang et al., 1994; MacFadden and Cerling, 1996; Koch, 1998; Feranec and MacFadden, 2006; Kita et al., 2014; Wang and Secord, 2020).
The browser–grazer spectrum
Most artiodactyls are herbivorous, and they are typically classified as browsers, grazers, or mixed feeders. Browsers primarily feed on dicotyledonous material, such as leaves, fruits, and twigs; grazers primarily feed on monocotyledonous material, such as grasses or sedges, which are generally more abrasive than dicotyledonous material; and mixed feeders consume a mixture of dicotyledonous and monocotyledonous materials across space and seasons (Hofmann and Stewart, 1972). Much of the existing literature classifies living and fossil herbivores using these categories. Finer dietary classifications have been used in some studies to capture more details in the foraging behavior of various artiodactyls (e.g., Janis and Ehrhardt, 1988; Spencer, 1995; Sponheimer et al., 1999; Mendoza et al., 2002). These studies show promise for differentiating artiodactyl feeding categories beyond three broad categories, giving consideration to the specialization or generality of species’ diets, the canopy-cover of feeding environment, and sometimes the level (height from the ground) that species feed at. Other studies in recent years have used the percentage of grass in species’ diets to place species quantitatively along a dietary continuum. This approach overcomes the potential weaknesses of categorical trait data and conceptualizes diet as a spectrum with two end members: browsers and grazers (e.g., Clauss et al., 2003).
Research questions
Recent research has identified gaps in our knowledge of the stable isotope ecology of large mammals and its application in the fossil record, such as what factors influence enrichment processes and how much variability in resource partitioning exists among different faunas (Tejada-Lara et al., 2018; DeSantis et al., 2020; Tejada et al., 2020). These findings highlight the need for more data from a range of modern ecosystems for better understanding of processes and factors that affect the isotopic signatures in mammal tissues. In addition, stable-isotope ratios of ungulate tooth enamel can be compared to the dental hypsodonty index, dental mesowear (sharpness of tooth cusps), dental microwear (microscopic abrasion patterns on the occlusal surface), ecomorphological analysis of craniomandibular features, as well as stomach- and fecal contents and other types of data that are used to document ungulate dietary ecology. It has been shown that combining results from multiple methods improves accuracy of paleoecological reconstructions (e.g., Rivals and Ziegler, 2018; Sewell et al., 2019). Such cross-method comparisons capture dietary behaviors and adaptations recorded through different processes and over different time scales, thus providing more reliable and detailed dietary information for extant and fossil species (e.g., Sponheimer et al., 2003; Boisserie et al., 2005; Merceron et al., 2006; Louys et al., 2012; Bradham et al., 2018; Uno et al., 2018; Gong et al., 2020).
In this study, we compile and compare the carbon-isotope data published to date from the tooth enamel of extant artiodactyls. To build on existing data and increase the range and distribution of isotopic values across taxa and regions, we additionally sampled and analyzed 80 tooth specimens from 23 species of artiodactyls. Each species was chosen either because it had not been previously analyzed for stable isotopes of enamel or because existing isotope data for the species included small sample sizes from restricted locations. The resulting dataset includes published and new isotope data for 79 artiodactyl species, covering a range of habitats and dietary ecology. We adopt a more detailed classification scheme of herbivore diets than what is commonly used in the literature. This classification scheme includes seven feeding categories and provides more information about dietary habits than the three broad categories of browsing, grazing, and mixed feeding. Combining the isotope data from artiodactyl enamel, dietary data derived from other studies, and the environmental setting of localities, we address the following research questions: (1) How do species with different dietary habits compare in the mean and range of δ13C values of their diet? (2) How do artiodactyl diets in different ecoregions of the world compare in the mean and range of δ13C values? (3) How do phylogenetic groups of artiodactyls compare in the mean and range of δ13C values?
Materials and methods
We compiled a global dataset of the carbon-isotope values of artiodactyl tooth enamel (δ13CE) from the literature, supplemented by 80 newly analyzed samples to expand the taxonomic and geographic coverage of our data (Figure 1 and Table 1). After correcting for differences in atmospheric carbon-isotope composition (δ13Catm), body mass, and digestive physiology, the inferred carbon-isotope values of the vegetation that artiodactyls fed on (δ13Cdiet) were compared among seven feeding categories, 11 terrestrial ecoregions, and phylogenetic groups.
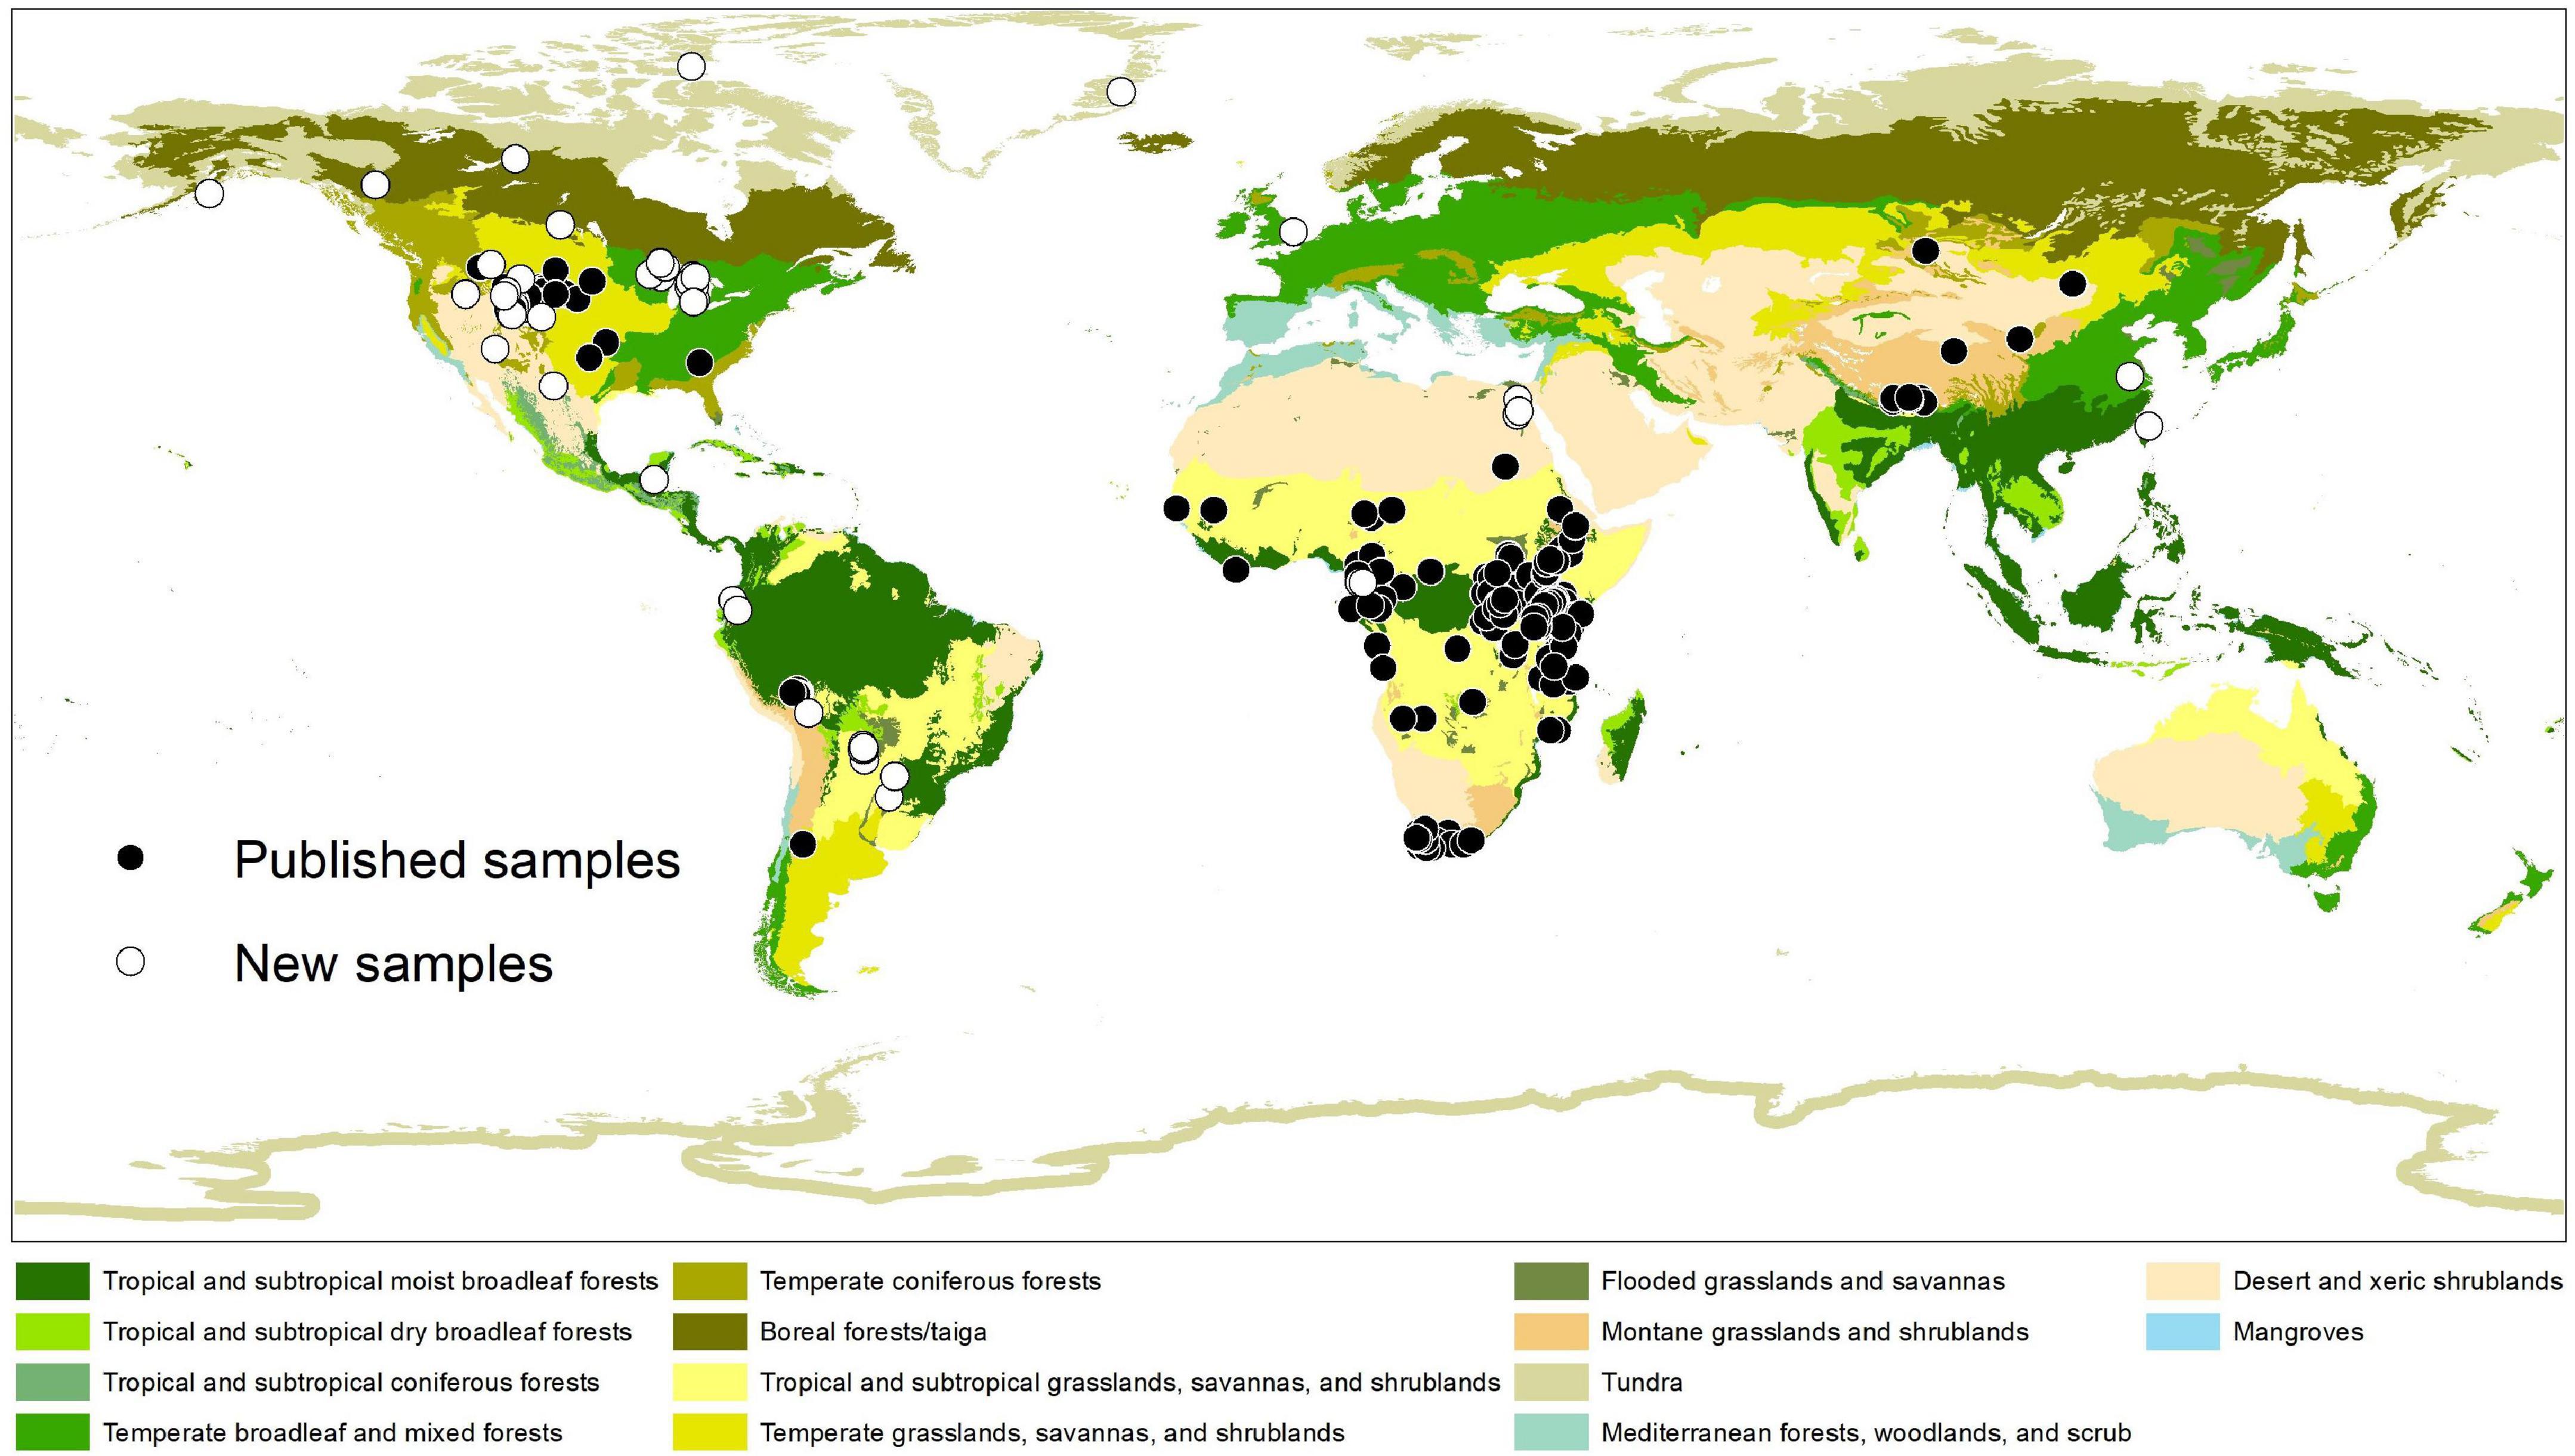
Figure 1. Collecting locations of tooth enamel samples used in this study. Ecoregions of the world follow Olson et al. (2001). See Table 1 for sources of published samples. Note that sampling effort is highly uneven among geographic regions and ecoregions of the world.
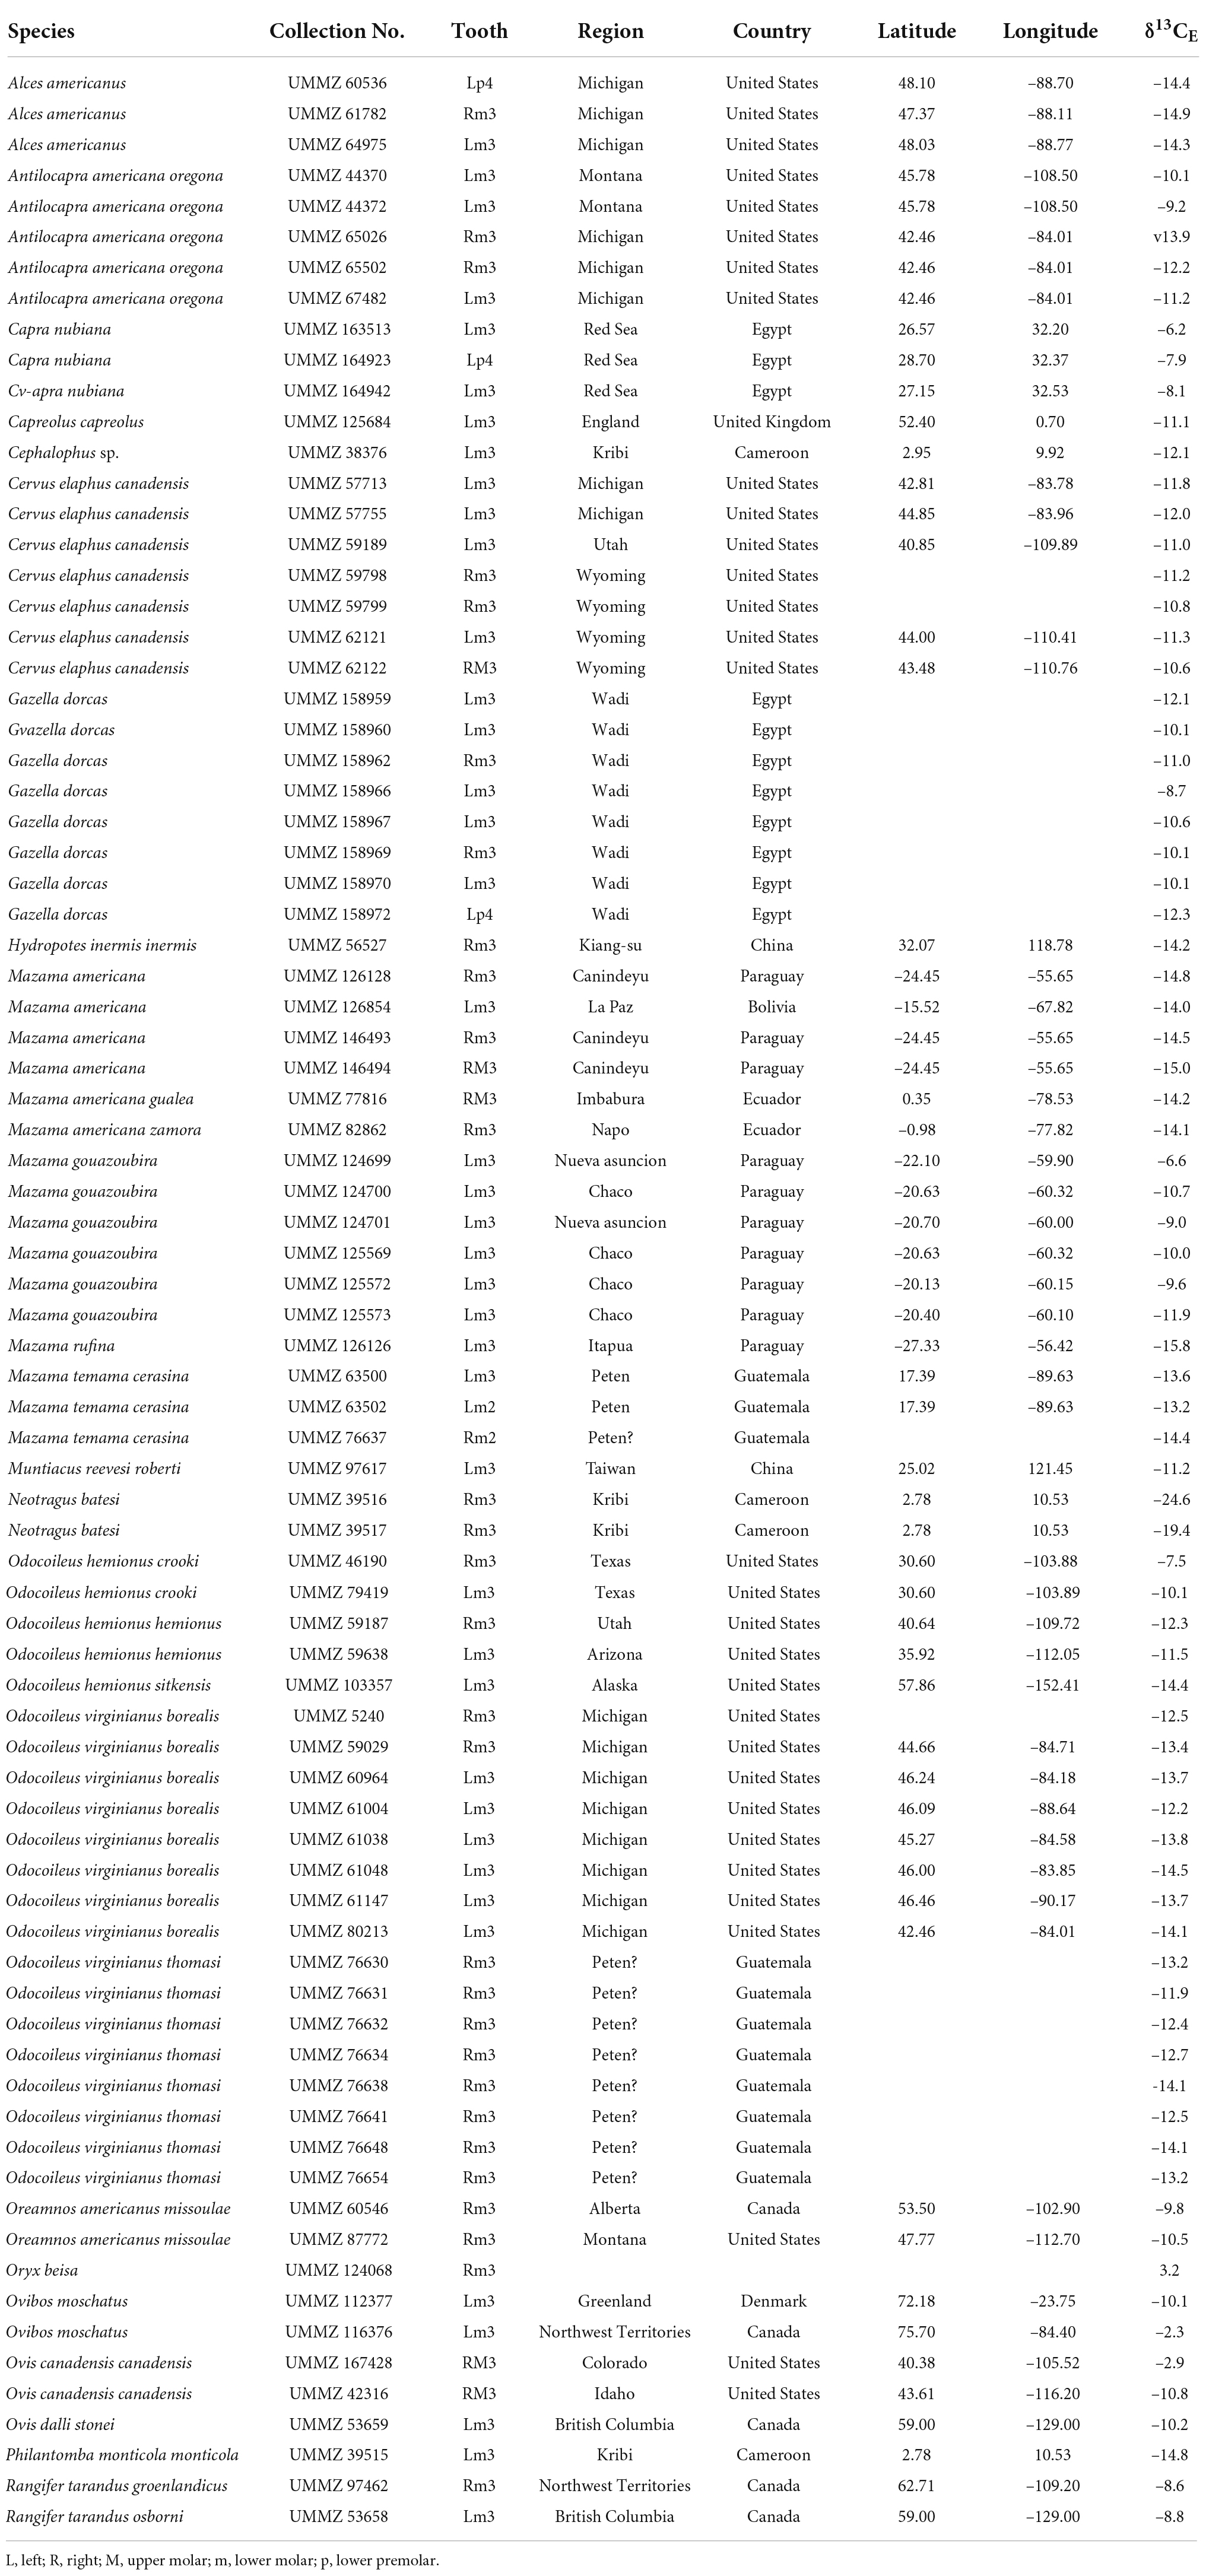
Table 1. Eighty new samples of artiodactyl tooth enamel collected from specimens housed in the University of Michigan Museum of Zoology (UMMZ) and analyzed for carbon-isotope composition (δ13CE).
Published δ13CE data
We assembled published δ13CE values of extant artiodactyls from 24 primary sources (Table 2). Data from paleontological or archeological sites or from other body tissues were not included. In most instances, we considered only samples from wild animals. Two exceptions are studies of free-range livestock (Wang et al., 2008; Lazzerini et al., 2021), included to increase the sample size from Asia. Along with published δ13CE data, we collected the following information from the literature whenever available: taxonomic identification, sample identification number (field number or museum catalog number), provenance (locality name, geographic coordinates, elevation), year of collection from the field, sampled element (tooth position), method of sampling (serial or bulk), and whether or not samples were pretreated before analysis. If multiple samples were taken from the same tooth or duplicates were run for the same bulk sample, then average values for the tooth were used. If multiple teeth were sampled from an individual animal, then samples taken from teeth that erupted late in the sequence (more posteriorly positioned in the premolar or molar row) were used, as these teeth are among the last ones to develop (Hillson, 2005), thereby avoiding a weaning signal. Some data have appeared in multiple studies or review papers since they were first published, in which case we traced them back to the original publication. Only studies that reported original δ13CE data of extant artiodactyls were cited as primary sources.
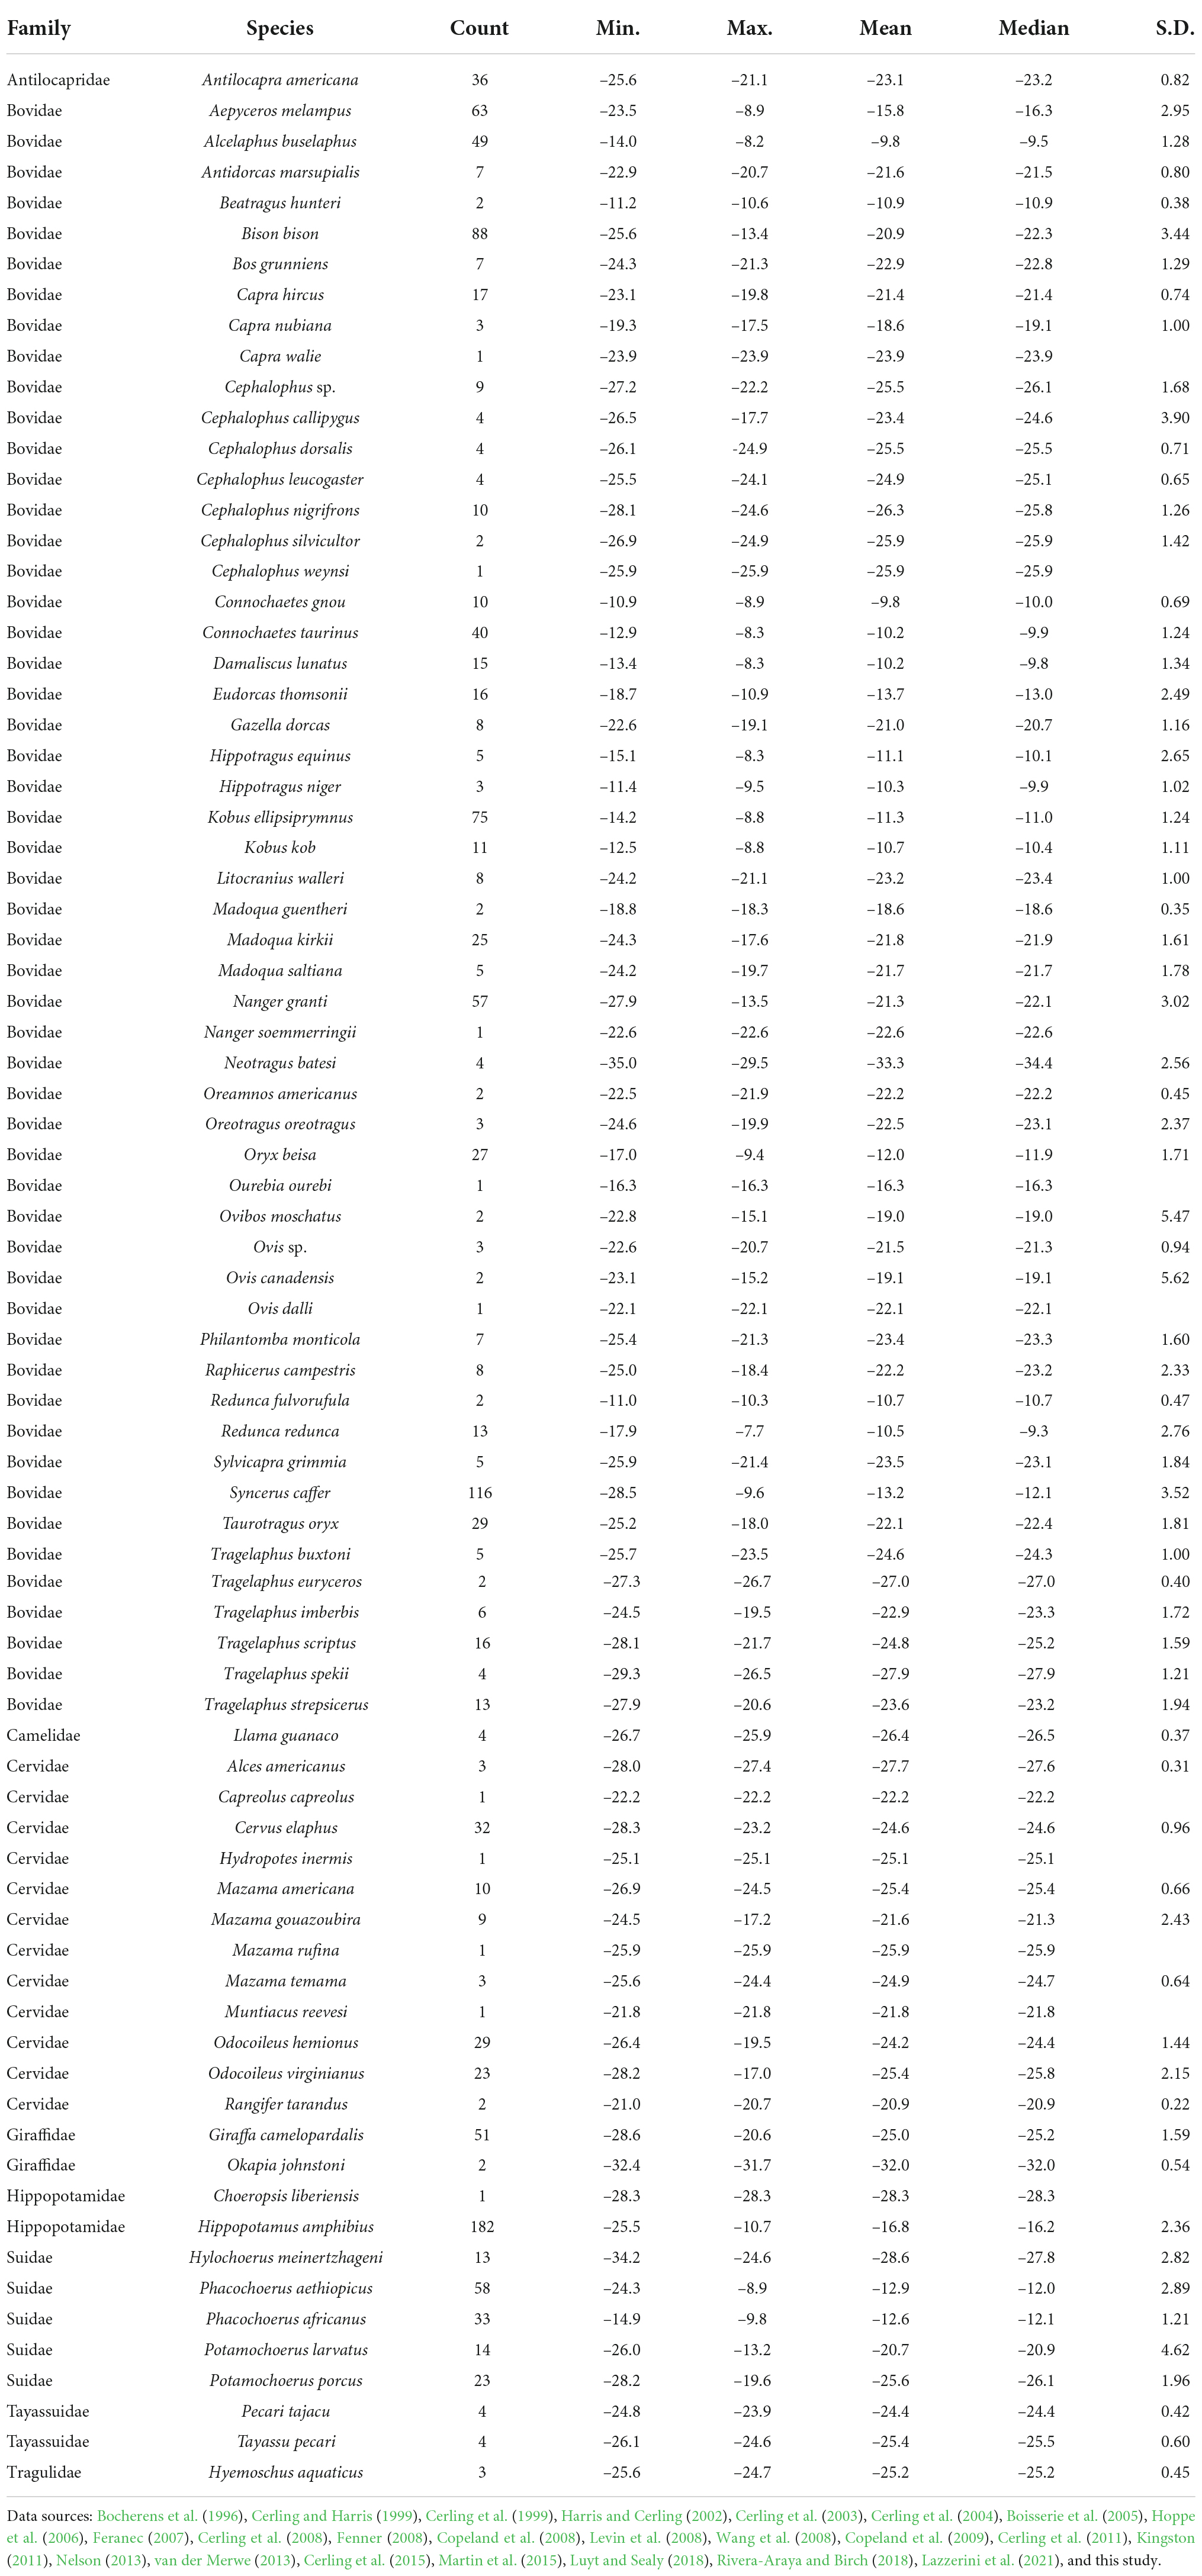
Table 2. Summary statistics for calculated δ13Cdiet values of 79 species of artiodactyls documented in this study.
New δ13CE data
Eighty enamel samples from 23 species of extant artiodactyls were gathered from specimens housed in the University of Michigan Museum of Zoology (UMMZ). We chose samples with consideration for their prior taxonomic representation and geographic coverage in the literature, as well as the availability and abundance of specimens in the UMMZ collection.
The general method for sampling and pretreating tooth enamel followed Koch et al. (1997). Bulk samples were gathered by drilling approximately 5 mg of pristine enamel powder on the lateral surface of the tooth parallel to the growth axis. Sampling was done using a portable dental drill with a 1-mm diamond burr. All samples were taken from third molars or fourth premolars. Samples were treated with 3% reagent grade NaOCl for 24 h to remove organic matter and with 1M buffered acetic acid for 24 h to remove non-structural carbonate. Each treatment was followed by centrifuging and rinsing five times with deionized water. Samples were dried by lyophilization. At the University of Michigan Stable Isotope Laboratory, samples were reacted at 77° ± 1°C with anhydrous phosphoric acid for 8 min in a Thermo Scientific Kiel IV preparation device coupled directly to the inlet of a Thermo Delta V triple collector isotope ratio mass spectrometer, which measured the resultant CO2. Analytical precision was better than ± 0.1‰ (1 S.D.), based on international standards for carbonate (NBS-18, NBS-19). Isotope values are expressed in standard δ-notation: δ13CE = [(Rsample/Rstandard) - 1] × 1000, where R = 13C/12C. The δ13CE values are reported relative to the Vienna PeeDee Belemnite (VPDB) standard.
Correcting for the Suess effect and calculating δ13C of dietary sources
Sampled tooth specimens in our data compilation were collected from the field as long ago as 1891 to as recently as 2017 (Supplementary Table 1). During this time interval, δ13Catm has decreased by ∼1.8‰ due to anthropogenic activities (Suess effect). To account for this effect, all δ13CE data were corrected to the preindustrial δ13Catm level of the year 1750 (δ13C1750, taken to be –6.3‰). Correction values were based on δ13C data from Antarctic ice cores, fern samples, and direct measurements of air (Rubino et al., 2013; Keeling et al., 2017). These records show that change in δ13Catm since 1750 occurred in three stages (Supplementary Table 2). The first 130 years witnessed a slow decrease, bringing δ13Catm from –6.3 to –6.7‰ by 1880. Another 0.4‰-decrease took only over 80 years, with a rate of ∼0.005‰ per year during this interval. From the early 1960s to the early 2010s, δ13Catm dropped by 1.3‰, meaning an accelerated annual decrease of 0.025‰. Based on these observed trends, we corrected the δ13CE value of each sample with the offset in δ13Catm between its collection year and 1750. For some samples, the exact year of collection was not reported, so the correction value could not be accurately determined. In these cases, we estimated the correction value based on year of publication or other information provided in the primary study. These samples constitute a small proportion (2.5%) of the dataset and should not affect the overall analytical results.
The δ13C values of the ingested vegetation (δ13Cdiet) were calculated from δ13C1750 to facilitate cross-species comparison of forage selection. Conventionally, an average enrichment factor between diet and enamel (ε*diet–bioapatite) of 14.1 ± 0.5‰, derived by Cerling and Harris (1999), have been used in paleodietary reconstructions of large ungulate mammals. Recently, Tejada-Lara et al. (2018) found that fractionation between diet and enamel increases with species’ body mass and is also affected by digestive physiology (foregut vs. hindgut fermentation). Because our dataset covers artiodactyls with a range of body sizes, we use equations derived by Tejada-Lara et al. (2018) to determine the ε*diet–bioapatite for each species based on its average body mass and digestive physiology. For foregut fermenters, ε*diet–bioapatite = 2.34 + 0.05(BM), where (BM) is the natural log of body mass in kg. For hindgut fermenters, ε*diet–bioapatite = 2.42 + 0.032(BM). Resulting ε*diet–bioapatite values range from 11.0 (Neotragus batesi, 3 kg) to 15.0‰ (Hippopotamus amphibius, 1500 kg). When comparing the calculated δ13Cdiet values, we use −17‰ to separate C3 and C4 vegetation, based on plant data collected since the late 20th century (Cerling and Ehleringer, 2000; Sponheimer and Cerling, 2014). Mixed C3-C4 feeders would have δ13Cdiet close to this value.
Comparing δ13Cdiet values among feeding categories and ecoregions
We assigned species to one of seven feeding categories based on published dietary information (Supplementary Table 3). The feeding categories include one omnivorous category (omnivore) and six herbivorous categories (frugivore, browser, browser–grazer intermediate, variable grazer, and obligate grazer). Assignment of species into herbivorous categories is based on the relative abundance of fruit, dicots, and monocots in the species’ average diet, following criteria from Gagnon and Chew (2000) and Wang et al. (2022). The diets of frugivores and browsers consist of >70% fruit and >70% dicots, respectively. Variable grazers and obligate grazers have diets that include 60–90% and >90% monocots, respectively. Browser–grazer intermediates consume <70% dicots, < 60% monocots, and < 20% fruit, while generalists consumed >20% of all three food types. This six-category classification scheme captures more information about the dietary preference and dietary selectivity of herbivores than the traditional three-category classification of browsers, mixed feeders, and grazers.
Each sampled locality was assigned to one of the Global 200 terrestrial ecoregions, which were established on the bases of biodiversity dynamics and environmental conditions (Olson et al., 2001). Different ecoregions provide different habitats and different plants for artiodactyls to feed on. Therefore, δ13Cdiet values are expected to vary among ecoregions.
Box and whisker plots were used to illustrate the summary statistics for feeding categories (Figure 2) and for ecoregions (Figure 3). Histograms of δ13Cdiet values illustrate the total dataset for each feeding category and for each ecoregion with sufficiently large sample size (> 100 samples, Figures 2–5). These diagrams allow for comparison of the differences and similarities in the range and frequency of δ13Cdiet values that each feeding category or ecoregion represents. Parametric (ANOVA) and non-parametric statistical tests (Kruskal–Wallis) were used to compare the difference between group-means, using PAST v4.03 (Hammer et al., 2001). Because some feeding categories and ecoregions are more geographically widespread than others, we also evaluate the composition of continental origin of the samples.
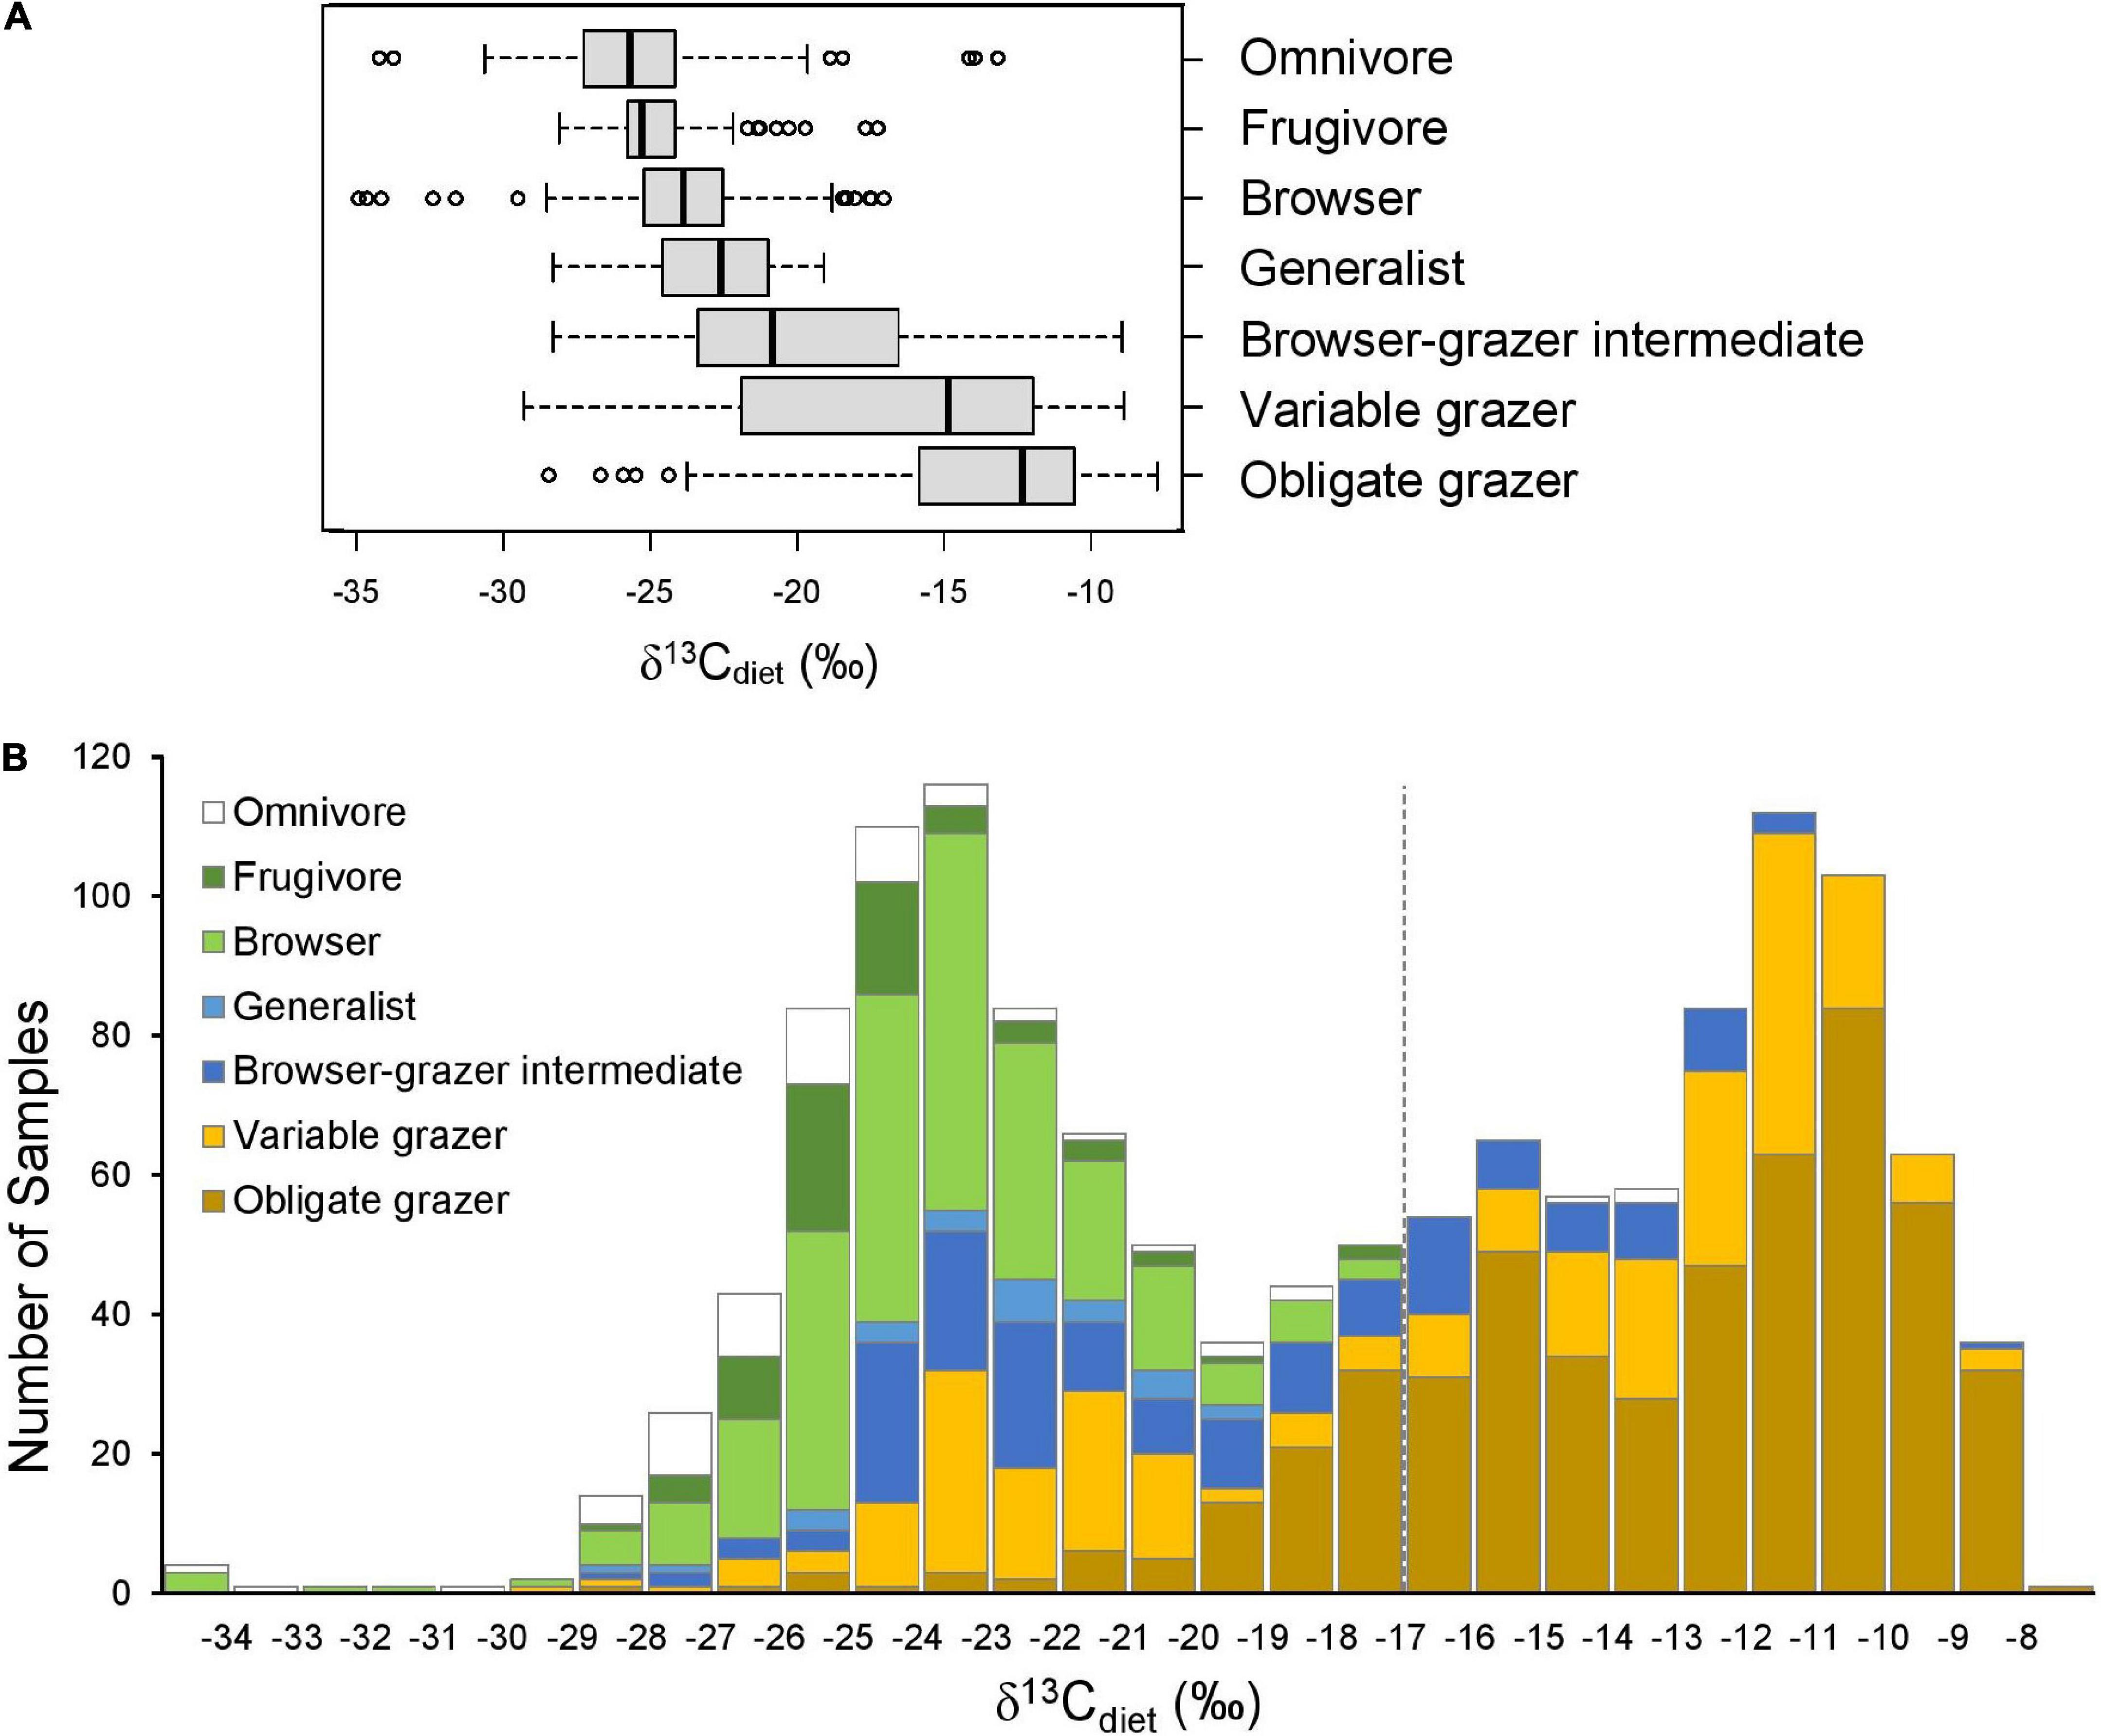
Figure 2. Comparison of δ13Cdiet values among seven artiodactyl feeding categories. (A) Boxplots showing the (non-outlier) range (whiskers), first and third quartiles (box), median (vertical line), and outliers (circles) of δ13Cdiet values in each ecoregion. (B) Histogram of δ13Cdiet values of the feeding categories. Dashed line is the C3-C4 boundary.
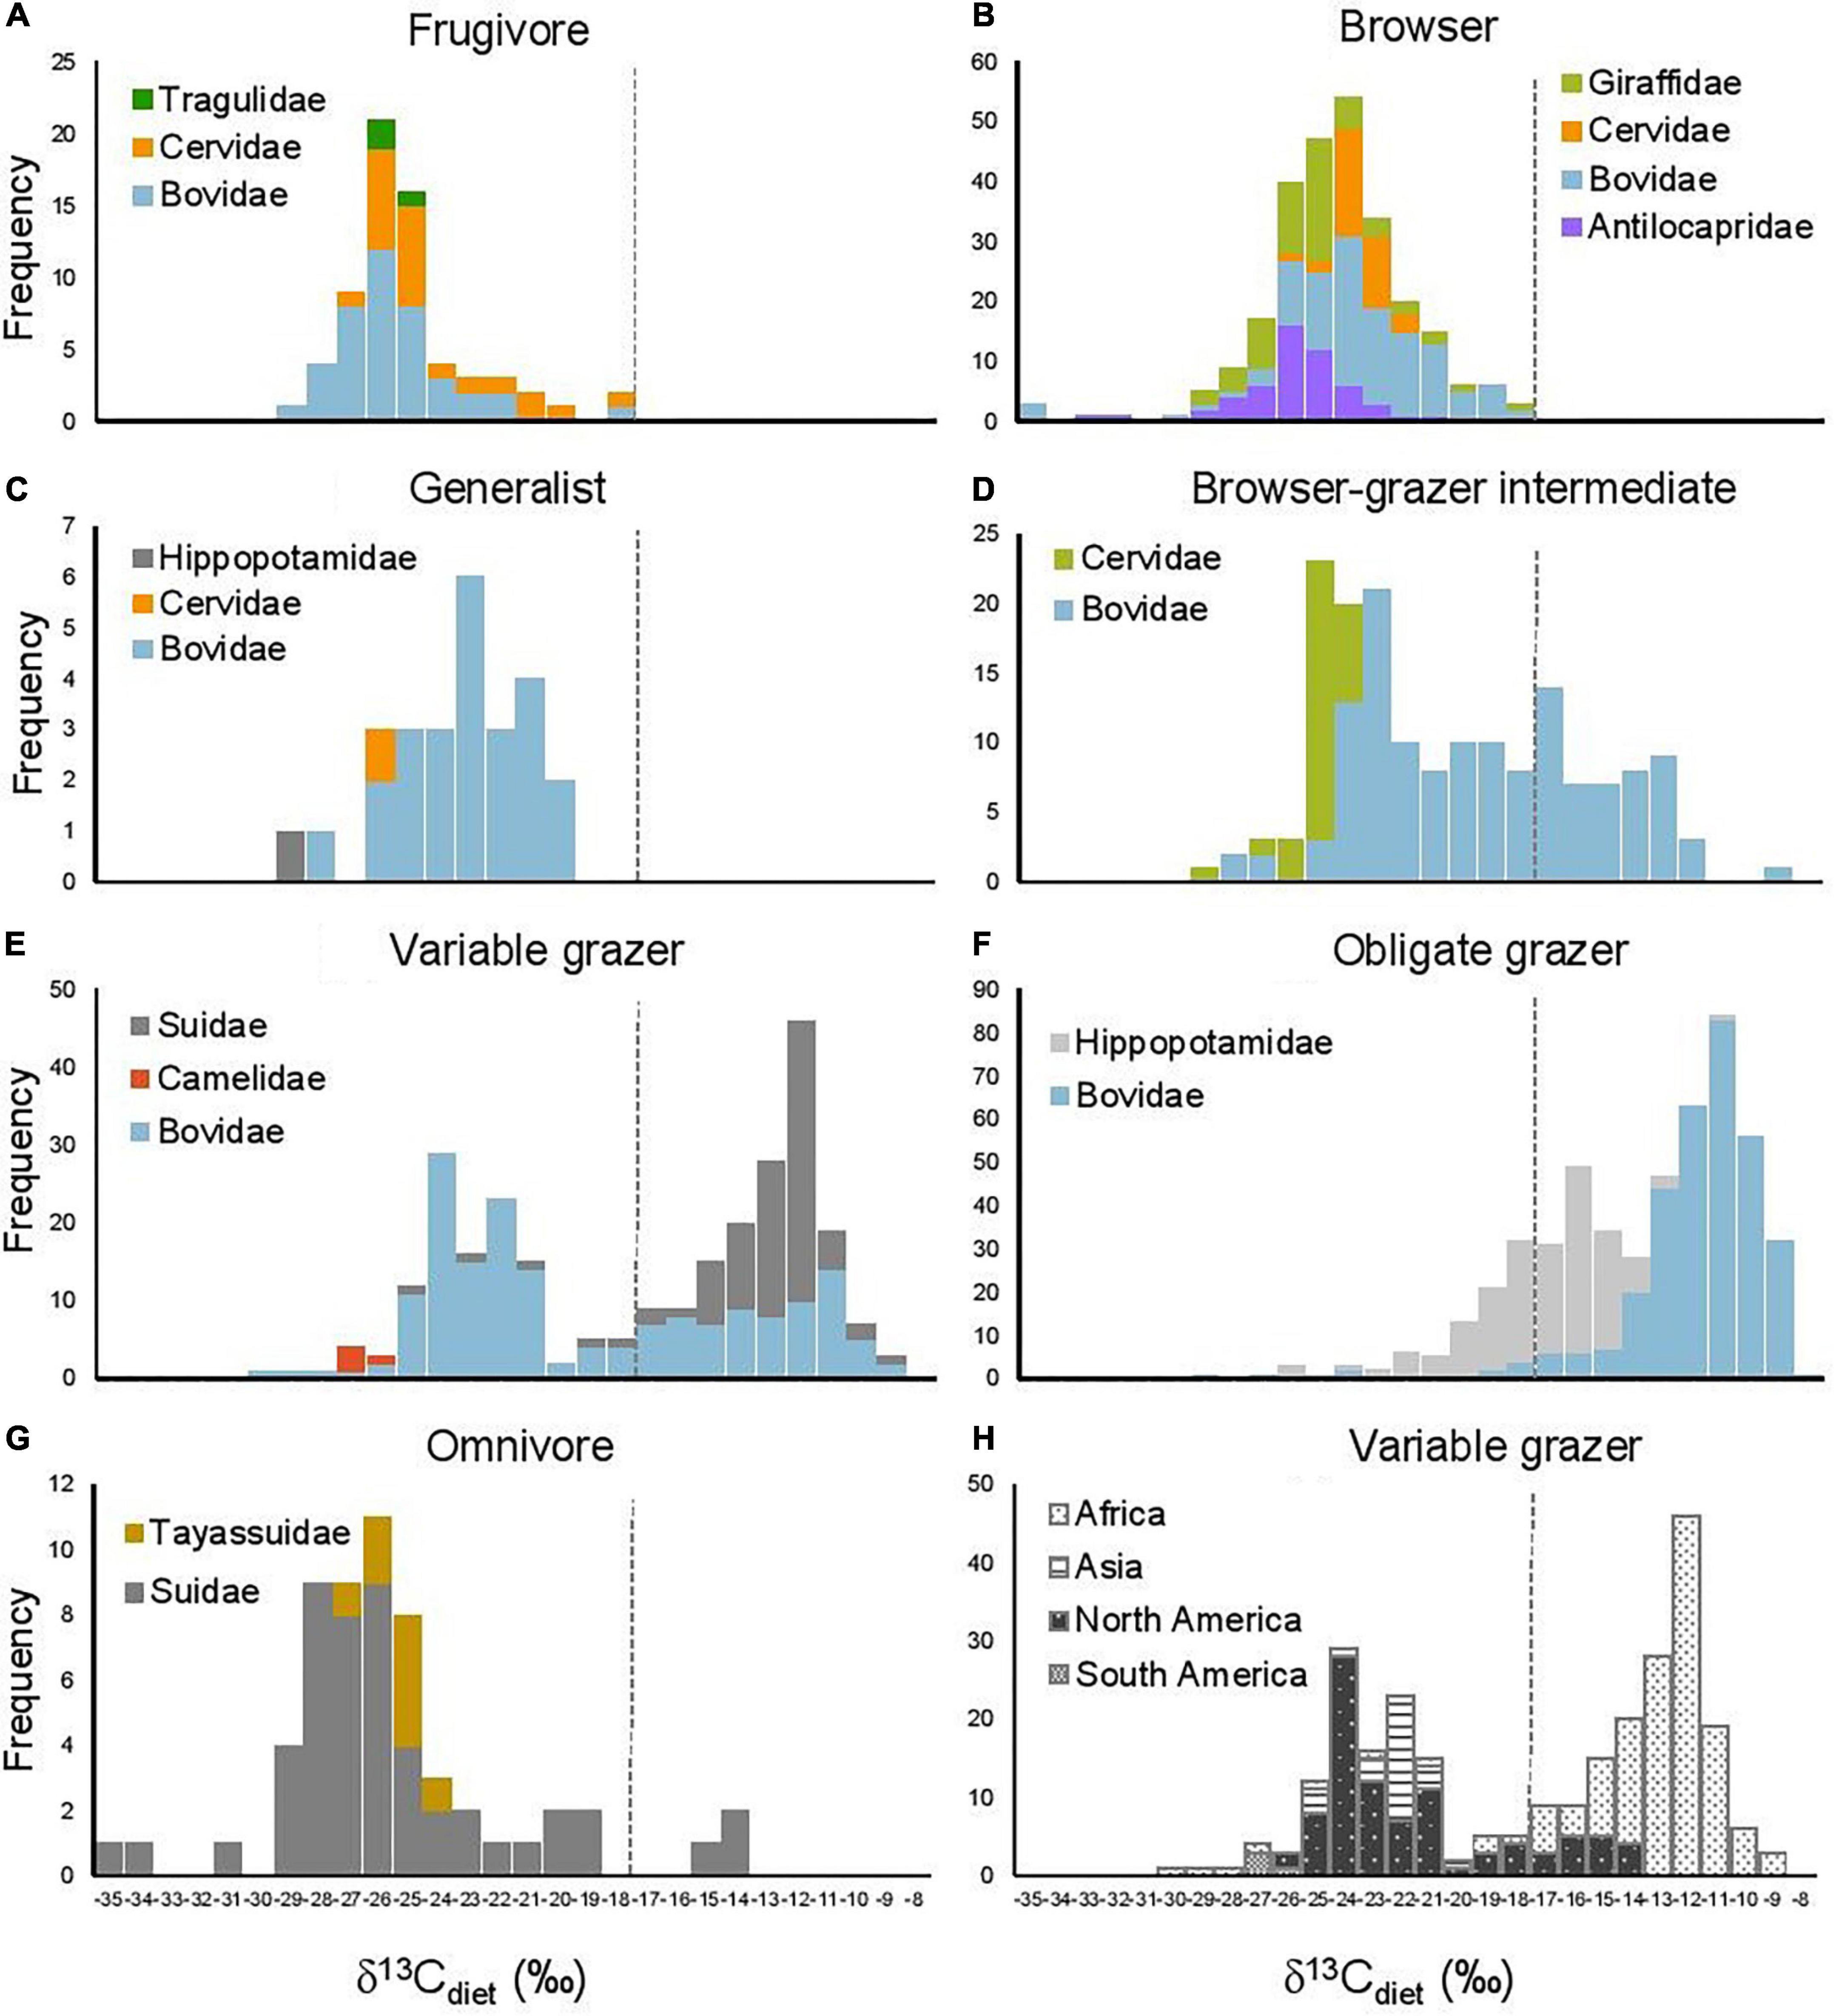
Figure 3. Histograms of δ13Cdiet values in seven artiodactyl feeding categories in relation to (A–G) taxonomic group and (H) continent. Dashed line is the C3-C4 boundary.
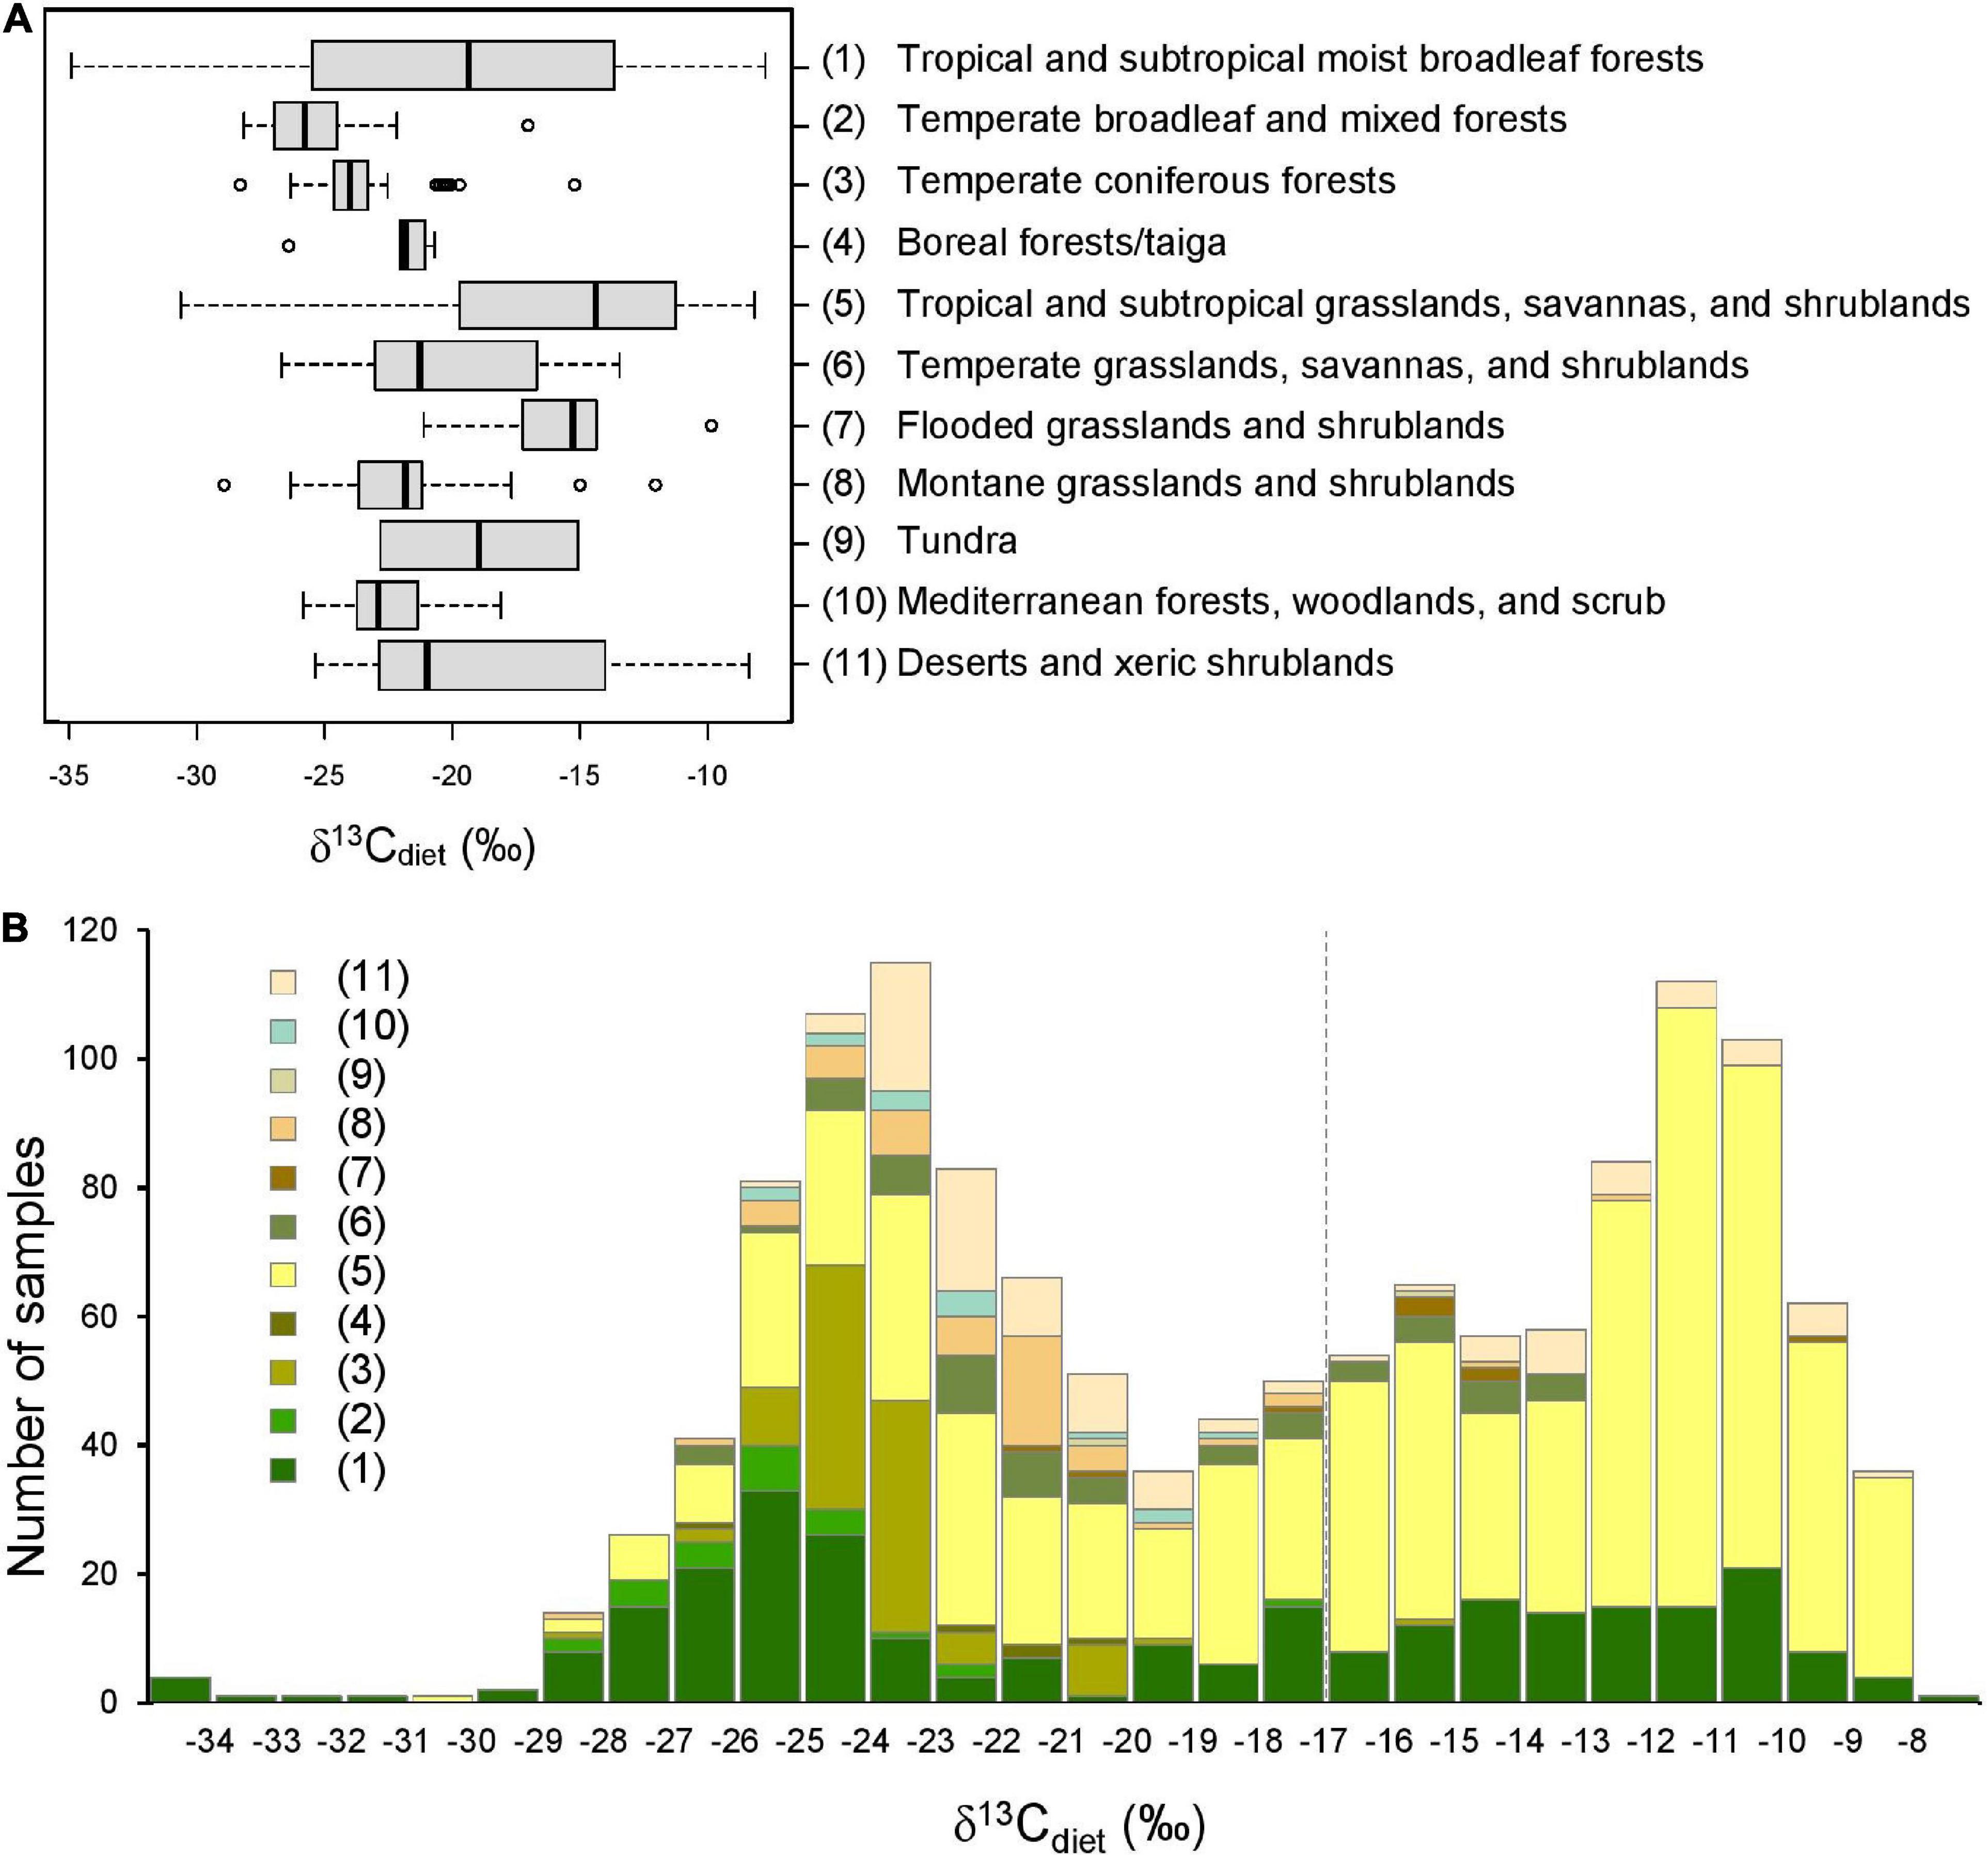
Figure 4. Comparison of δ13Cdiet values among 11 terrestrial ecoregions. (A) Boxplots showing the (non-outlier) range (whiskers), first and third quartiles (box), median (vertical line), and outliers (circles) of δ13Cdiet values in each ecoregion. (B) Histogram of δ13Cdiet values of the ecoregions. Numbers in legend correspond to ecoregions in (A), and the color scheme corresponds to that of Figure 1. Dashed vertical line is the C3-C4 boundary.
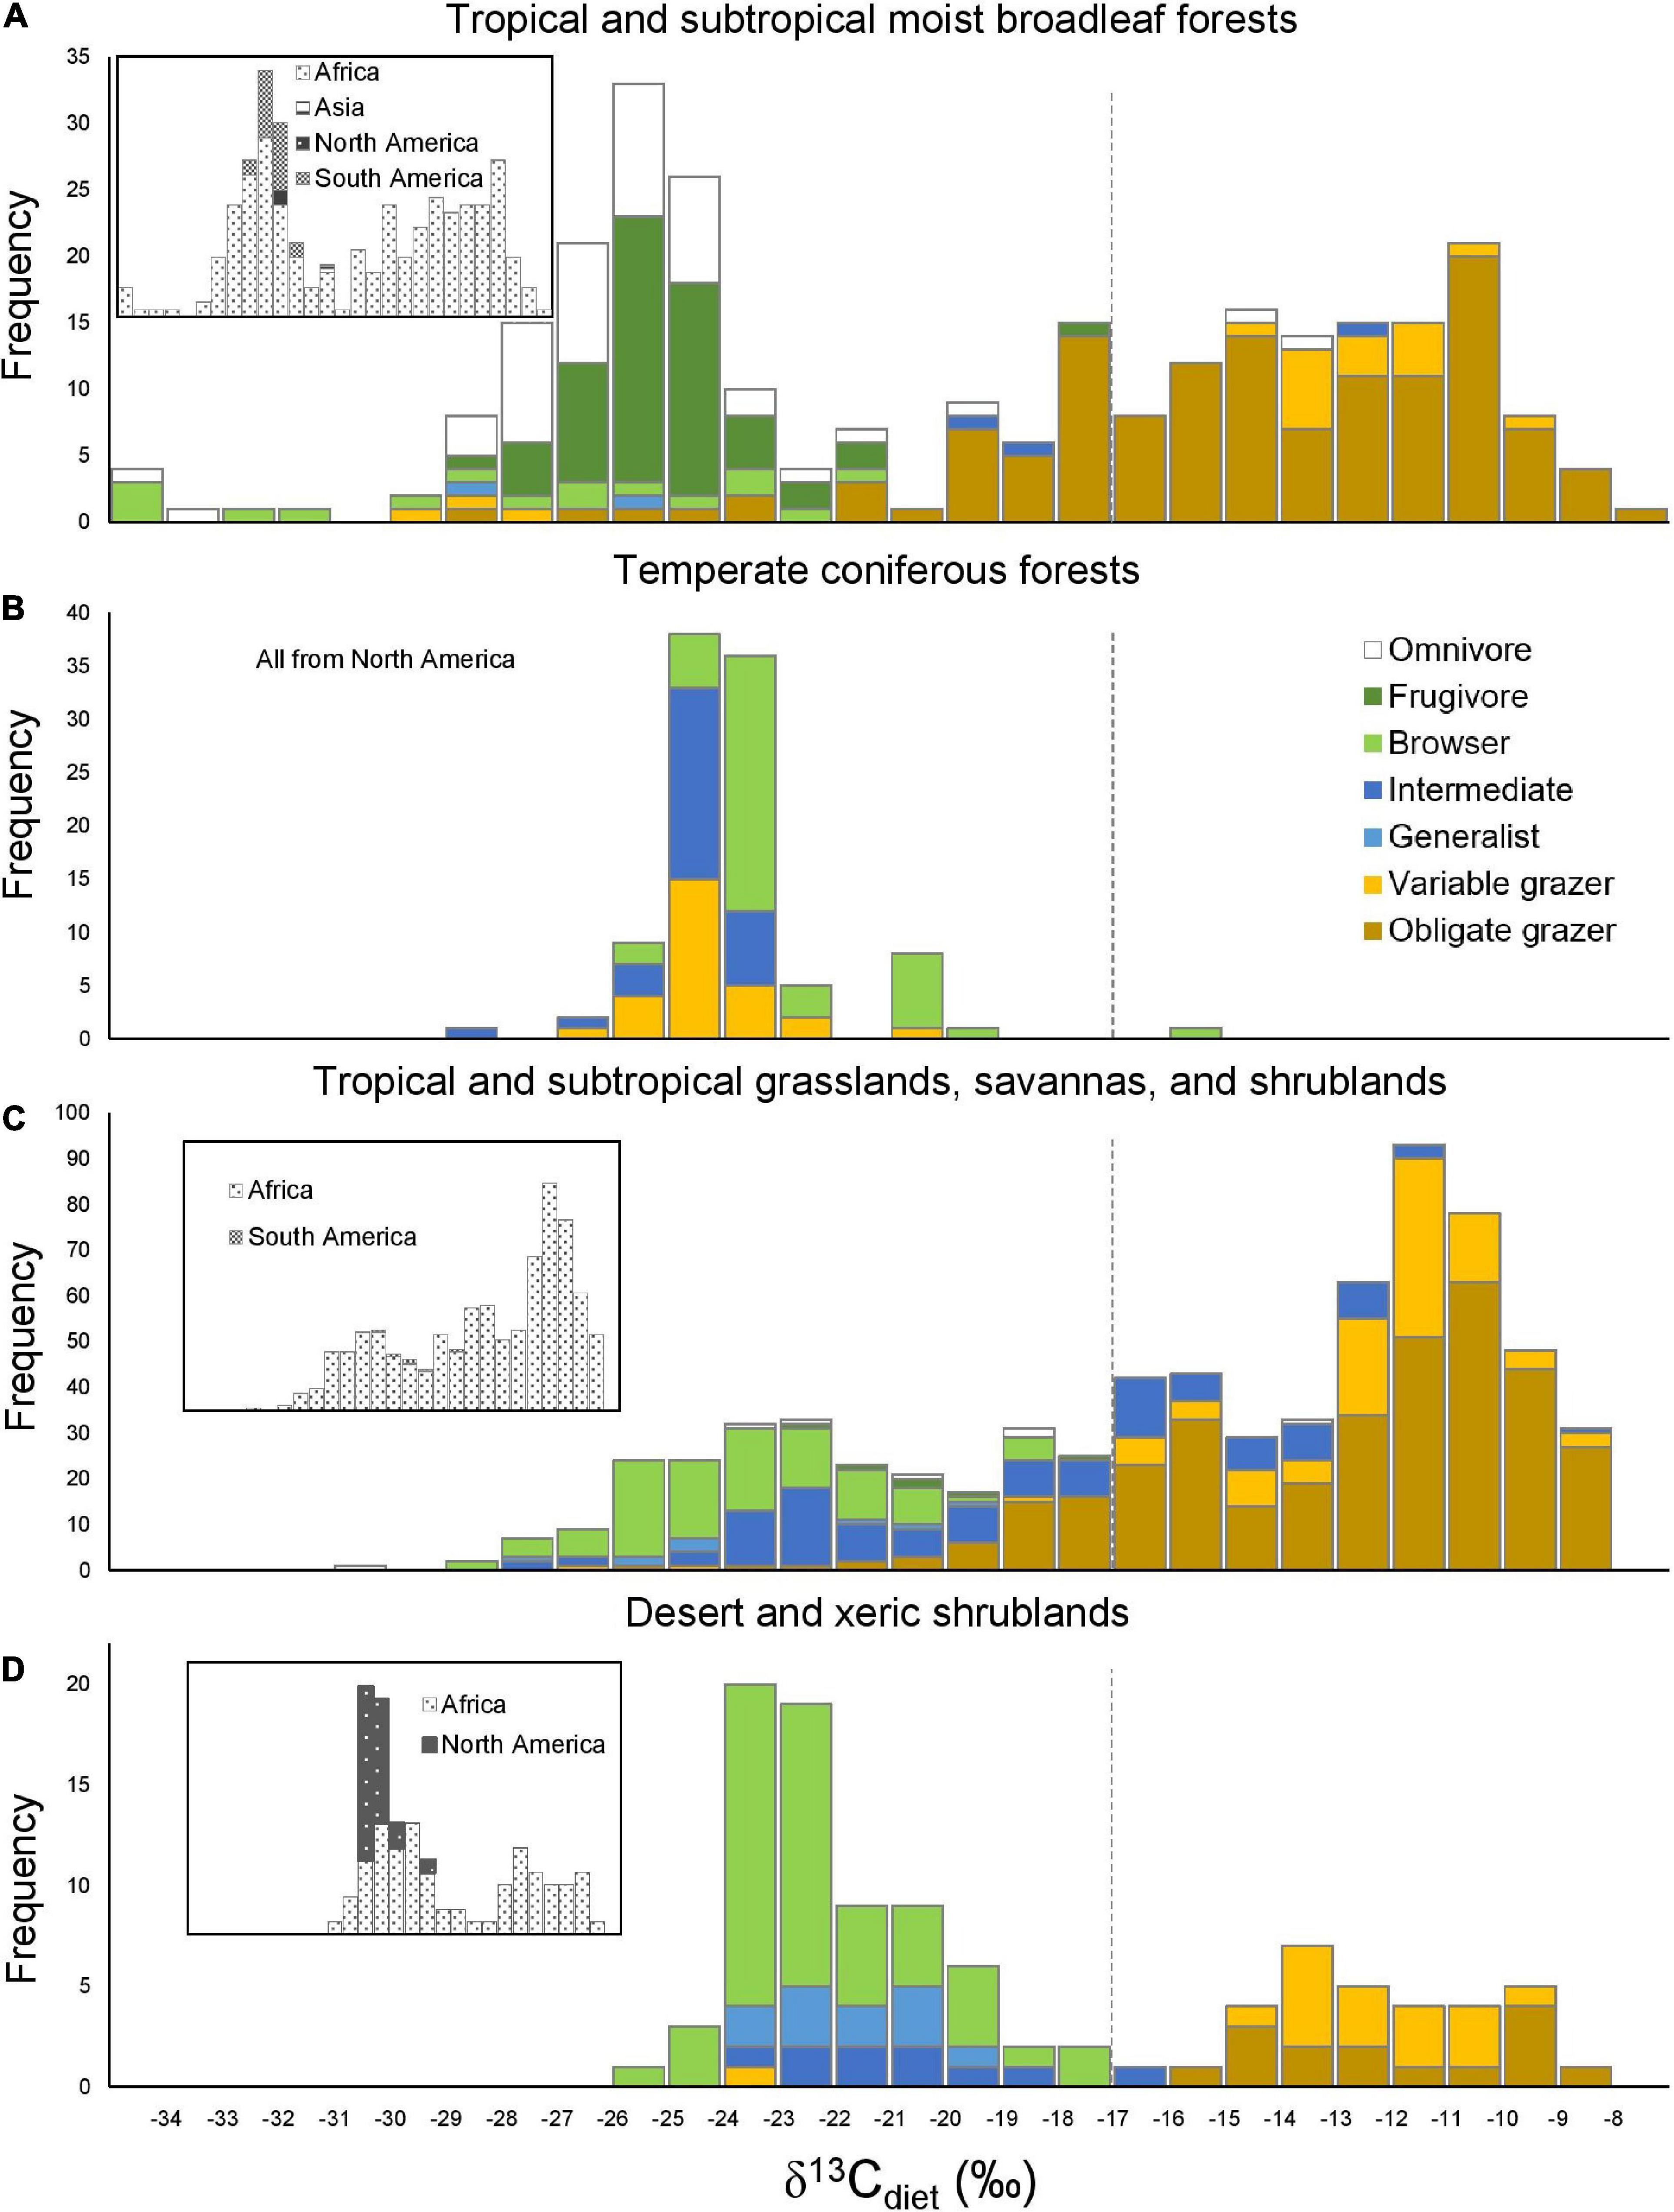
Figure 5. Histograms of δ13Cdiet values in the four best-sampled ecoregions in relation to feeding categories (A,B) (main panels) and continent (C,D) (inset panels). Dashed line is the C3-C4 boundary.
Since sampling is highly uneven among geographic regions (Figure 1) and among taxa (Table 2), the δ13Cdiet values of well-sampled species from certain locations could have an oversize impact on the overall distribution of δ13Cdiet values. Therefore, we repeated the comparison among feeding categories using mean δ13Cdiet values of species, both with and without controlling for phylogeny. Non-phylogenetic analyses are the same as detailed above. A phylogenetic ANOVA was conducted using the “phylANOVA” function from the R package “phytools” (Revell, 2012).
Phylogenetic signal of δ13Cdiet values
To examine the δ13Cdiet variation among phylogenetic groups, we obtained a sample of 1000 node-dated consensus trees of artiodactyls from Upham et al. (2019) and generated a maximum clade credibility tree using TreeAnnotator (Drummond et al., 2012). The phylogeny and the isotope dataset share 76 species. We then estimated the phylogenetic signal in species’ mean δ13Cdiet values with Blomberg’s K (1000 permutations) using the function “phylosig” from “phytools”. The K value can be either less than 1, equal to 1, or greater than 1. A K < 1 suggests that δ13Cdiet values are less similar in closely related species than expected under neutral Brownian model, while K > 1 suggests that δ13Cdiet values are more similar in phylogenetically closely related species than expected under a Brownian motion (Blomberg et al., 2003). We also mapped the mean δ13Cdiet values of species onto the pruned artiodactyl phylogeny, using the function “contMap” from “phytools”. Because species with similar mean δ13Cdiet values could have different range and variance of δ13Cdiet values that reflect difference in dietary niche breadths, we additionally aligned box and whisker plots of species with the phenogram (Figure 6).
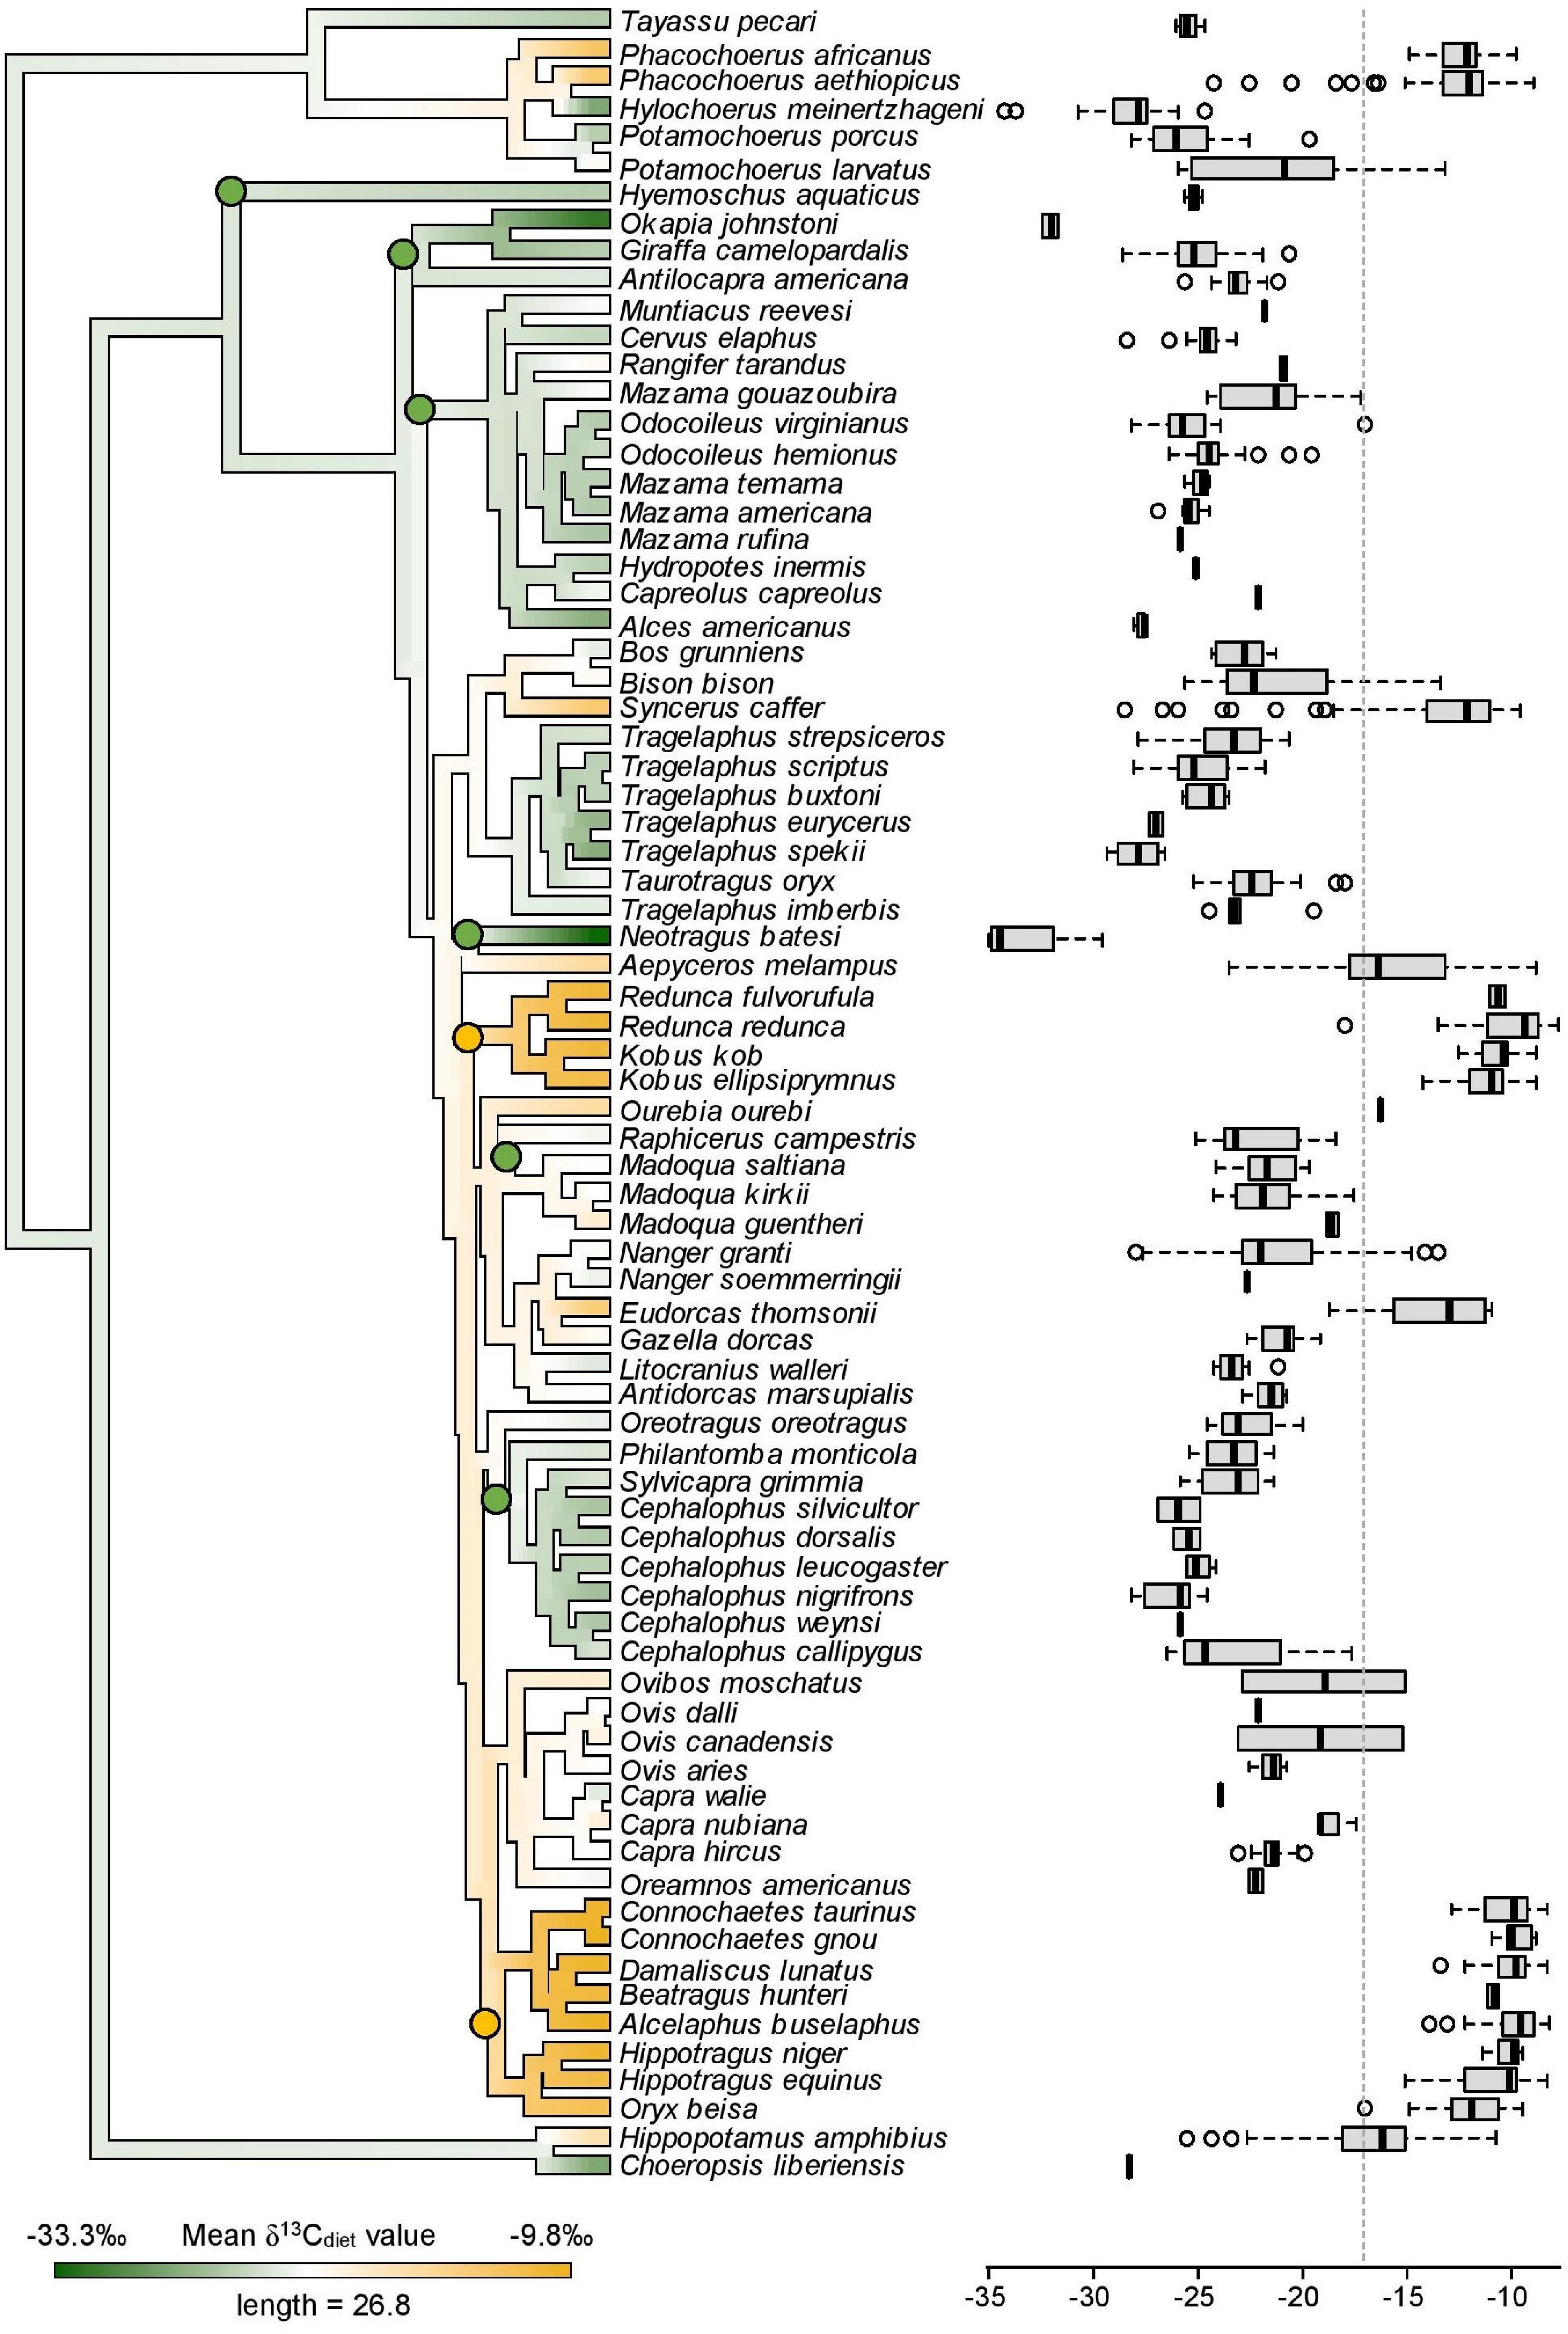
Figure 6. Mean δ13Cdiet values of 76 species mapped onto the artiodactyl phylogeny and boxplots showing the distribution of individual δ13Cdiet values in each species. A low phylogenetic signal is detected in mean δ13Cdiet values (K = 0.38, p = 0.001). Labeled nodes mark clades that are mentioned in the text. Green nodes = C3 feeders. Yellow nodes = C4 feeders. Dashed vertical line is the C3-C4 boundary.
Results
Including the new samples from this study (Table 1), the δ13Cdiet compilation results in a dataset of 1366 carbon-isotope values from 25 primary sources (Table 2). The tooth-enamel samples come from 79 species of artiodactyls sampled from Africa, Eurasia, North America, and South America, with the highest number of samples from Africa (Figure 1). Thirteen of the 23 species sampled from UMMZ (Table 1) have not been previously analyzed for δ13CE values. Other specimens were chosen to expand the geographic range of sampled species. The total dataset includes representatives from nine out of ten families of terrestrial artiodactyls, missing only the Moschidae (Table 2).
Variation in δ13Cdiet among feeding categories
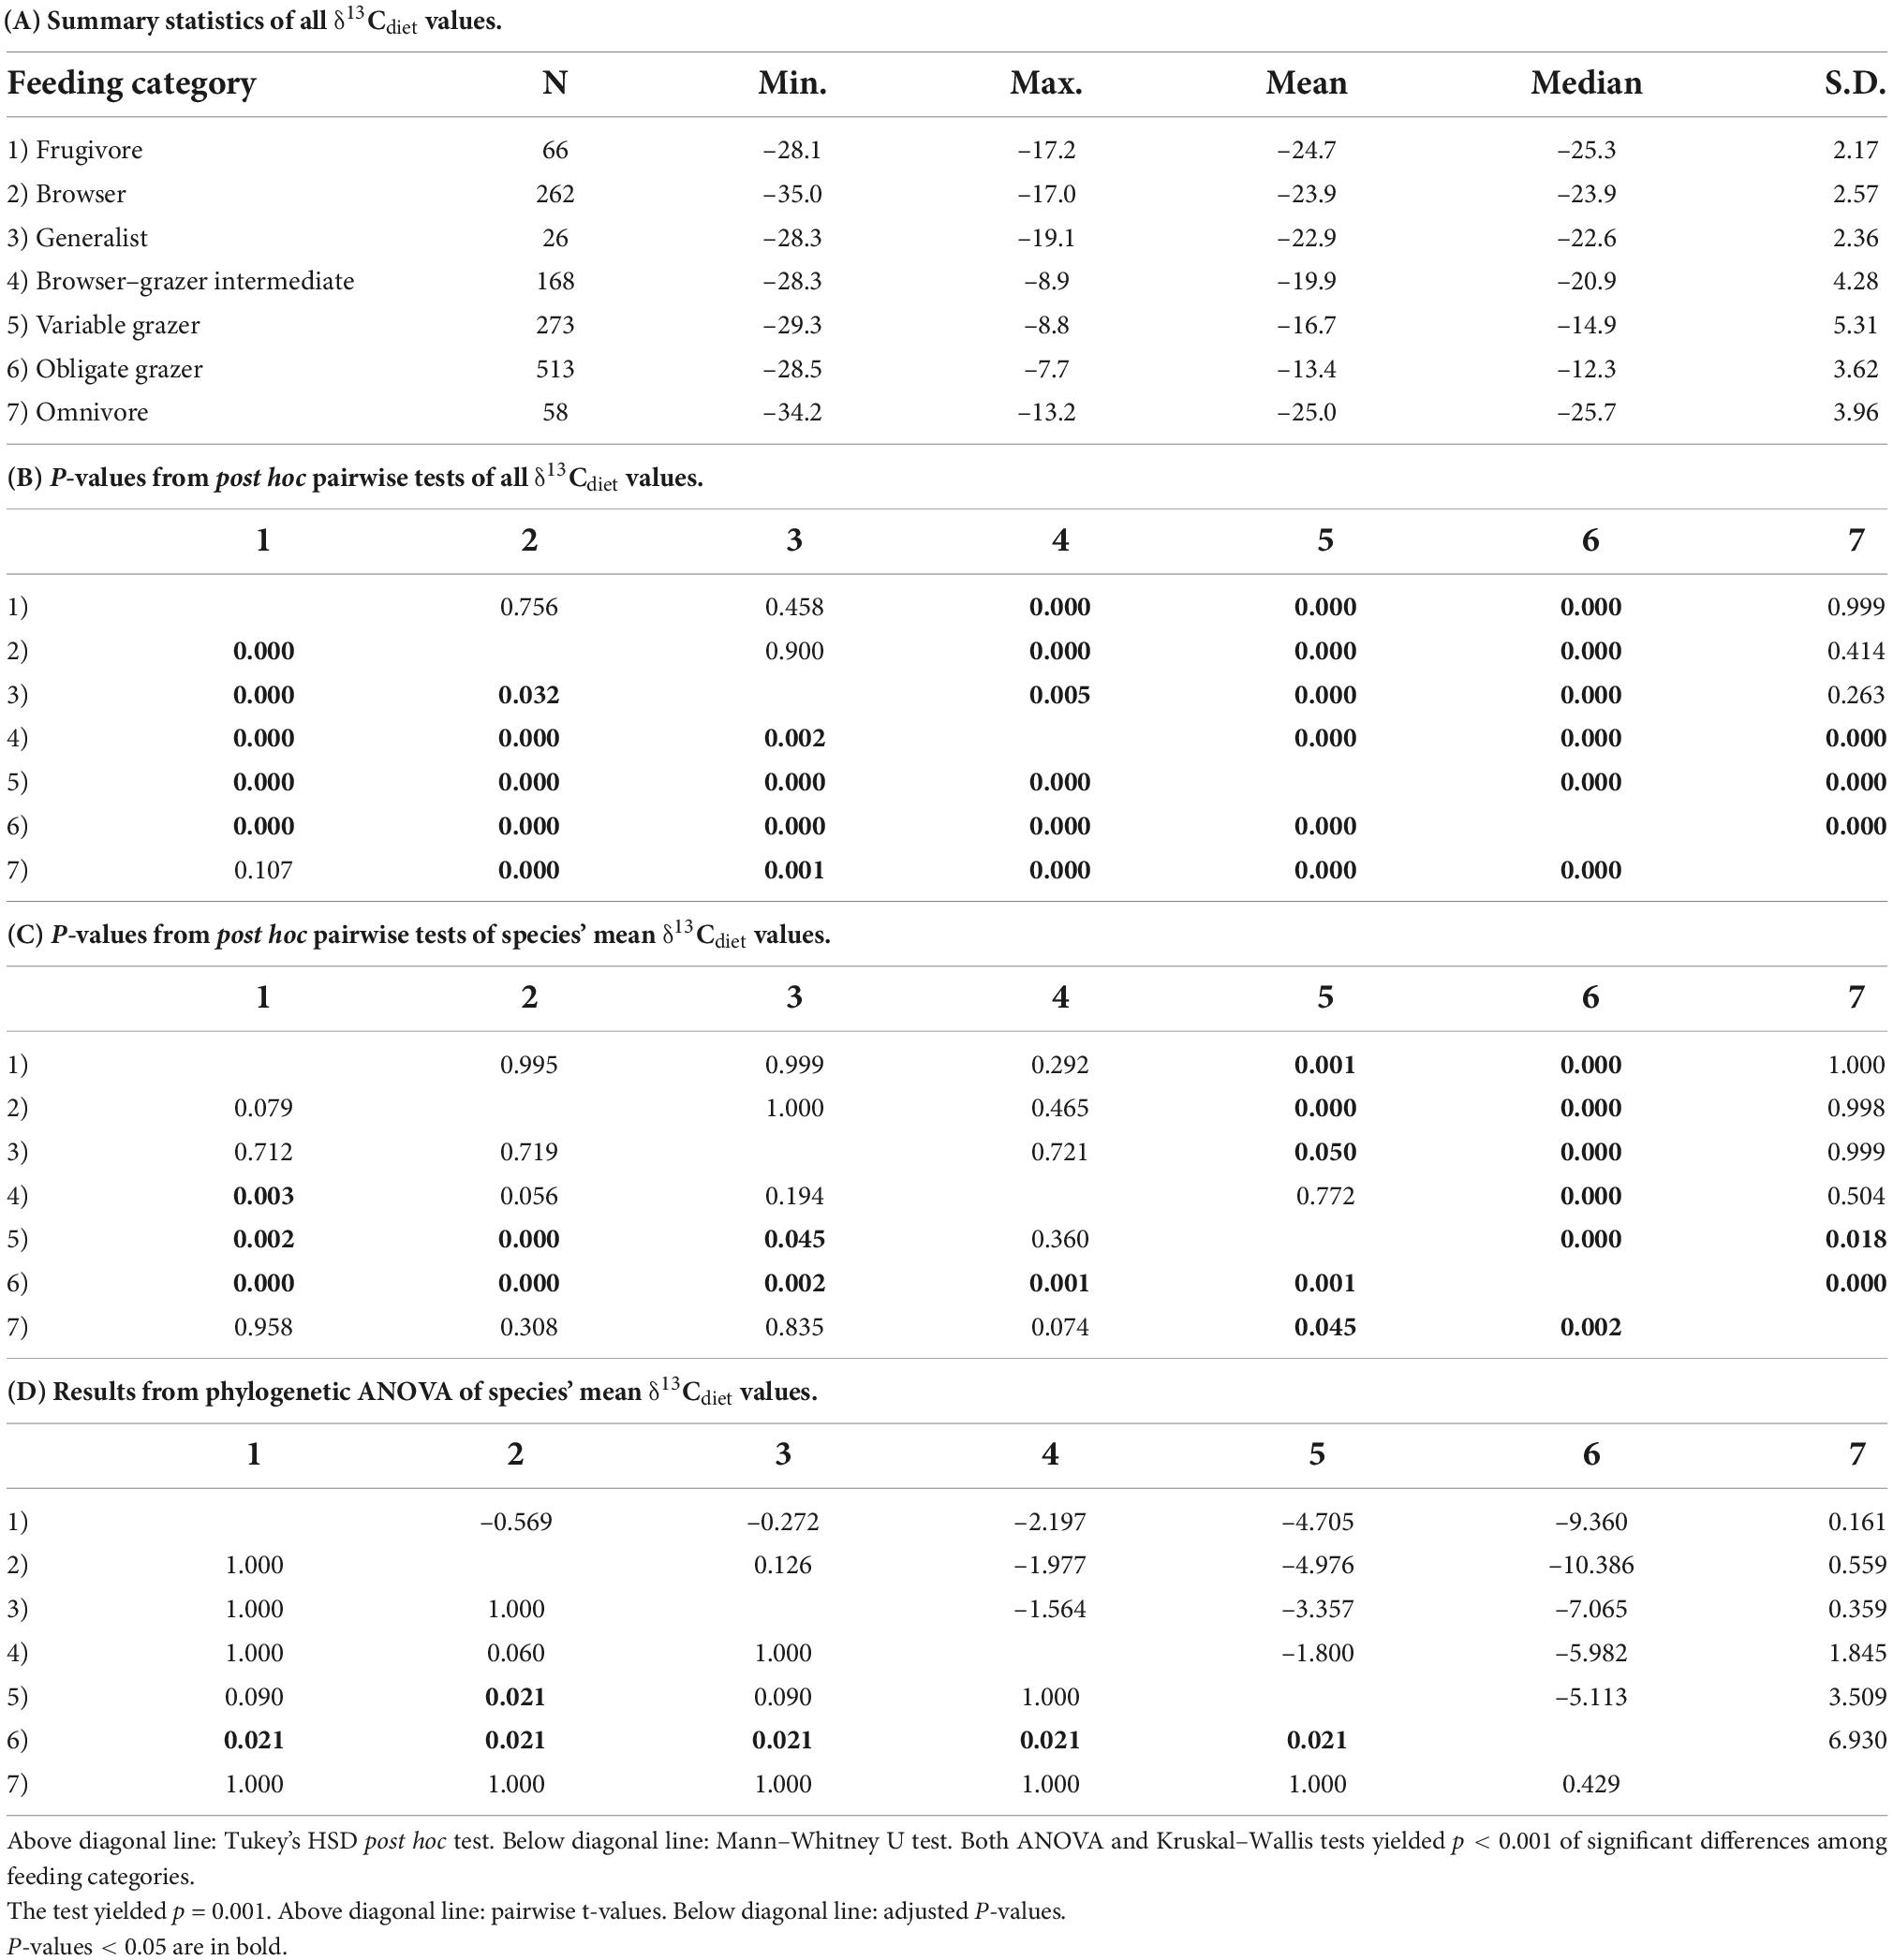
As expected, the seven artiodactyl feeding categories exhibit different ranges, means, and medians of δ13Cdiet values. Group means differ significantly from each other, using both parametric and non-parametric tests (p < 0.001). Post hoc tests show that group means differ significantly for most pairwise comparisons (p < 0.05), except for that between frugivores and browsers and a few comparisons that involve omnivores or generalists (Table 3B). When using mean δ13Cdiet values of species to reduce the bias introduced by sampling, we found that pairwise comparisons between obligate grazers and other feeding categories remain significantly different both with and without controlling for phylogeny (Tables 3C,D). Mean δ13Cdiet values of variable grazer species also differ from those of most other groups, although the differences are not significant when controlling for phylogeny. Among the six herbivorous feeding categories, mean δ13Cdiet values increase along the dietary continuum from frugivores, through browsers, the mixed feeders (generalists and browser–grazer intermediates), variable grazers, to obligate grazers (Figure 2A and Table 3A). Generalists and omnivores have smaller sample sizes than other feeding categories, but omnivores still exhibit a wide range of δ13Cdiet values, reflecting their wide dietary niche breadth (Table 3A).
The entire dataset exhibits a generally bimodal distribution in δ13Cdiet values, with a saddle around –19‰ (Figure 2B). Grazers dominate the C4 (enriched) mode of the distribution but extend considerably into the C3 realm. Mixed feeders occupy the intermediate range of values. Frugivores, browsers, and omnivores are prevalent in the C3 range. The most depleted and most enriched δ13Cdiet values are found in a browser (Neotragus batesi, the dwarf antelope) and an obligate grazer (Redunca redunca, the bohor reedbuck), respectively (Figure 2 and Table 2).
The bimodal distribution of δ13Cdiet values in the total dataset is comprised of several different patterns among artiodactyl feeding groups (Figure 3). Taxonomic composition also differs among feeding categories. Most feeding categories exhibit a unimodal distribution but vary in mean, median, mode, and peak frequency (Figure 3 and Table 3A). Obligate grazers and variable grazers exhibit patterns that differ from those of the other feeding categories. Obligate grazers, which all occur in Africa, exhibit a left-skewed bimodal distribution, with the higher peak driven primarily by the high frequency of enriched δ13Cdiet values in bovids (Figure 3F). All but one sample of Hippopotamidae are from Hippopotamus amphibius; this species makes up roughly an eighth of the total sample size (Table 2), and their δ13Cdiet values contribute to a second, lower mode in the obligate-grazer data. Variable grazers exhibit a bimodal distribution of δ13Cdiet values (Figure 3E). Within this group, bovids are the most numerous (as is the case for all herbivorous feeding categories) and are the main contributor to the bimodal pattern. Other families in this feeding category are well separated between C3-feeding camelids (llamas) and primarily C4-feeding suids (warthogs). Associated with taxonomic differentiation, the C3-C4 separation in variable grazers is strongly influenced by geography, with samples from North America being mostly in the C3 range while samples from Africa are mostly in the C4 range (Figure 3H). Variable grazers in Asia and South America are also C3-feeders.
Variation in δ13Cdiet among ecoregions
Sample localities in the dataset are distributed among 11 terrestrial ecoregions of the world (Figure 4 and Table 4). The δ13Cdiet values of species in different ecoregions differ significantly from each other, using both parametric and non-parametric tests (p < 0.001). Pairwise comparisons yielded significant differences (p < 0.05) among forest ecoregions, between grassland ecoregions and forest ecoregions, as well as between desert and xeric shrublands and most other ecoregions (Table 4B). Mesic environments (forests and woodlands from a range of temperature conditions) are more prevalent in the lower values of the δ13Cdiet spectrum while intermediate to semiarid environments (grasslands) occupy the middle and higher values (Figure 4B).
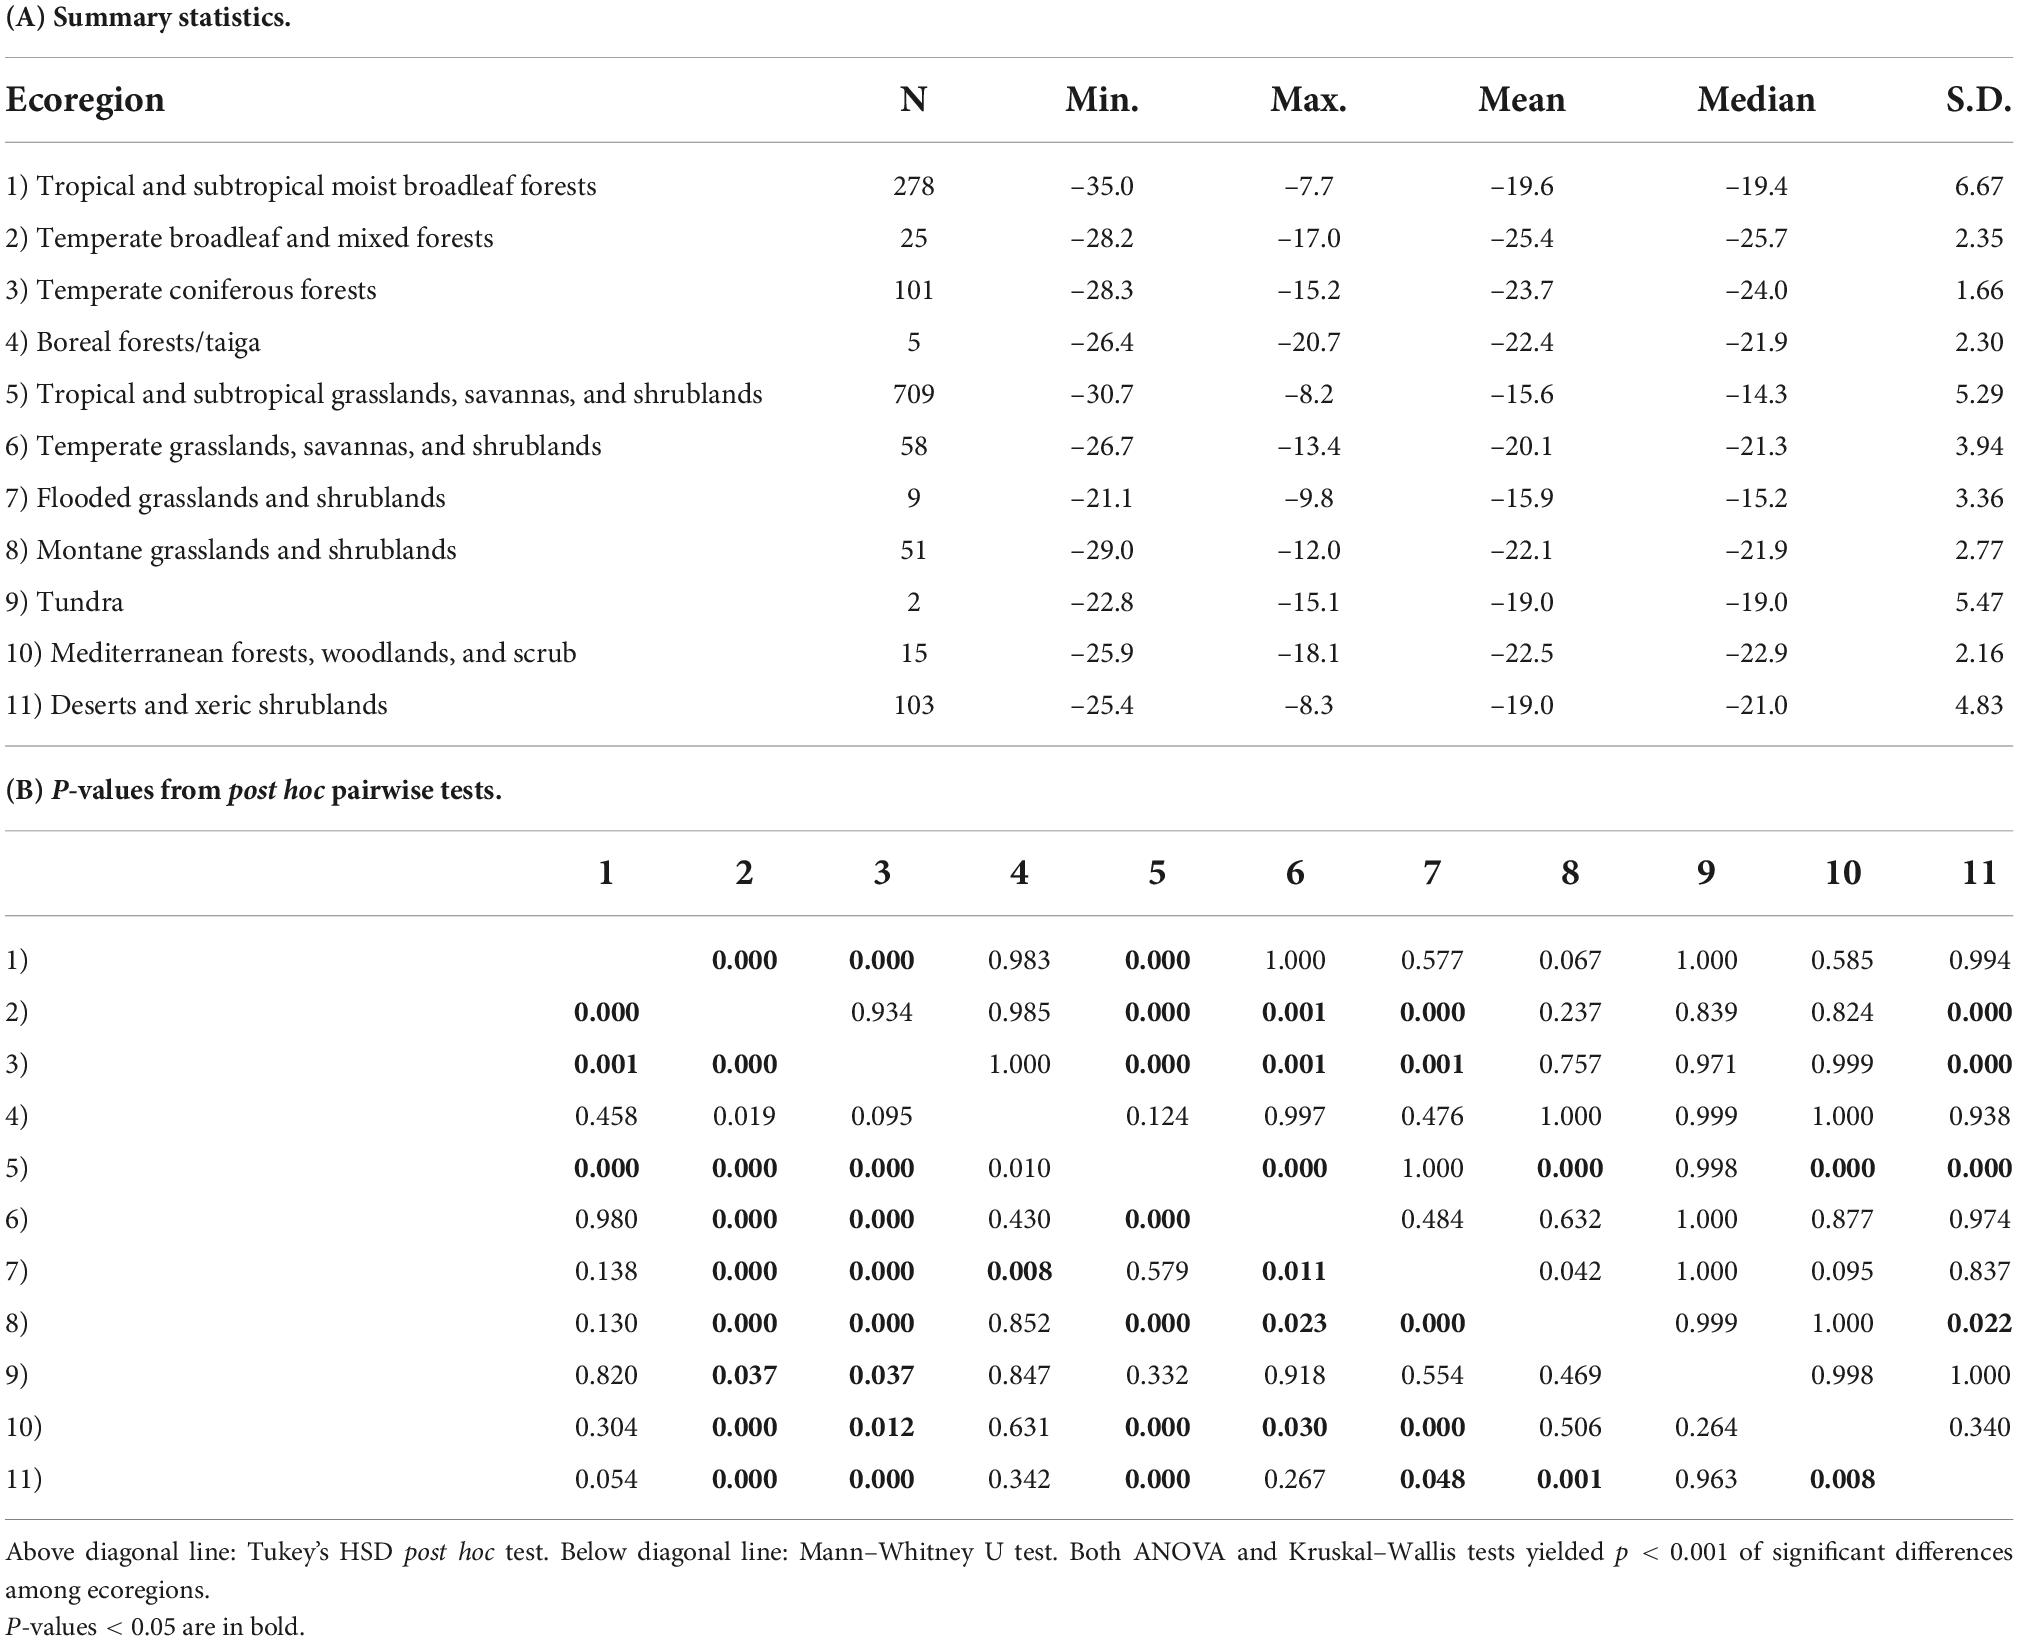
Table 4. Comparison of δ13Cdiet values of artiodactyls among 11 ecoregions, each found on multiple continents.
Because sample size is highly variable among ecoregions (Table 3A), histograms were only generated for the four ecoregions with the largest sample sizes. Tropical and subtropical moist broadleaf forests, mostly occurring in Africa, exhibit a generally bimodal distribution of δ13Cdiet values (Figure 5A). The peak in the C3 range is well-established and consists mostly of frugivores and omnivores, although other feeding categories are also present. The broad low peak in the C4 range is primarily from obligate grazers, specifically those from East Africa (Supplementary Table 1). Samples from the tropical and subtropical moist broadleaf forests of South America, North America, and Asia fall in the mid-range of the C3 realm (Figure 5A). Samples from temperate coniferous forests are all from North America (Figure 5B). There, variable grazers, browser–grazer intermediates, and browsers form a unimodal distribution of δ13Cdiet values, primarily in the C3 range. Tropical and subtropical grasslands, savannas, and shrublands are represented almost exclusively by samples from Africa (Figure 5C), showing a grazer-dominated (especially obligate grazer) distribution of δ13Cdiet values in the C4 range. Some browsers and mixed feeders are also present, forming a small mode of δ13Cdiet values in the C3 range. Desert and xeric shrublands also have a bimodal distribution of δ13Cdiet values (Figure 5D). There is a clear division between non-grazers (browsers and browser–grazer intermediates), which comprise δ13Cdiet values in the C3 range, and the grazers, which contribute to δ13Cdiet values in the C4 range. Within this ecoregion, samples from Africa include both C3- and C4-feeders, while those from North America are all C3-feeders.
Variation in δ13Cdiet among phylogenetic groups
The mean and range of δ13Cdiet values are more constrained in some artiodactyl clades than in others. Within the suborder Ruminantia, lineages with the oldest node ages (Tragulidae, Antilocapridae, Giraffidae, Cervidae) are exclusively C3 feeders, while C4 feeders appear in relatively young lineages (<13 million years old; Figure 6). Species with a pure C4 diet, corresponding to their assignment in the obligate grazer category, belong in two bovid tribes, the Reduncini and the Hippotragini. Some groups within Bovidae maintained C3 feeding, such as the Cephalophini, the Neotragini, and subgroups of the Antilopini. Other clades have a mixture of C3 feeders, C4 feeders, and mixed C3-C4 feeders. There is low phylogenetic signal in the δ13Cdiet values of artiodactyls (K = 0.38, p = 0.001). Similar δ13Cdiet values occur in multiple artiodactyl clades and individual clades show broad to narrow variation in δ13Cdiet values.
Discussion
We compiled and evaluated a global dataset of δ13Cdiet (isotope values of ingested forage) of extant artiodactyls, which documents variation among feeding categories, ecoregions, and clades. Our data compilation shows that research on artiodactyl δ13CE has covered just over 30% of species richness of extant artiodactyls. In addition, sampling is highly uneven both phylogenetically and geographically (Figure 1 and Table 2). Only one species of tragulid has been sampled, and no data are available for moschids. Although both species of extant hippopotamid have been sampled, the hippopotamus (Hippopotamus amphibious) is represented by 182 samples, making up 13% of the total number of samples, while the pygmy hippopotamus (Choeropsis liberiensis) is only represented by one sample. Sampling is dense in sub-Saharan African ecosystems (Figures 1, 5), where C4 grasslands and closed-canopy C3 environments are both extensive and artiodactyl species-richness is high. In contrast, sampling is sparse across the Eurasian continent. In East Africa, where sampling is the densest, savanna ecosystems lie adjacent to expansive tropical rainforest. Riverine and montane forest habitats and xeric shrublands also occur in patchy areas surrounded by tropical and subtropical grasslands there. Samples from this region largely contribute to the bimodal distributions in Figure 5, indicating consumption of both C3 and C4 plants by resident artiodactyls.
The herbivore dietary spectrum is expressed through a wide range of δ13Cdiet values, with the most depleted mean and median values in frugivores and the most enriched in obligate grazers. In general, grazing taxa have a broader range of dietary isotope values than browsing taxa. Notably, variable grazers exhibit a bimodal distribution of δ13Cdiet values, with North American taxa consuming C3 vegetation and African taxa consuming C4 vegetation, reflecting the different amounts of C4 biomass available in temperate versus tropical environments. Variation in δ13Cdiet values also occurs among ecoregions, taxonomic groups, and geographic regions. Grassland ecoregions differ significantly from forest ecoregions in δ13Cdiet values. Some of the oldest ruminant lineages have maintained C3 feeding, and pure C4 dietary signals are restricted to two bovid clades. The δ13Cdiet values of species and faunas also vary across geographic regions and may be related to amount of C4 vegetation in the environment. Most of the observed patterns correspond broadly with existing knowledge about stable isotope ecology, but deviations from the general trend can be identified in well-sampled taxa and regions. Additionally, we detected low phylogenetic signal (K = 0.38, p = 0.001) in the mean δ13Cdiet values of artiodactyl species. It is important to note, however, that ecology, phylogeny, biogeography, and environmental settings are often correlated, and the combination of available vegetation, ecological interactions, and physiological processes affects the δ13C values recorded in artiodactyl tooth enamel.
The herbivore dietary spectrum
The frugivore–browser–grazer dietary spectrum corresponds to an increase in group-mean δ13Cdiet values over a range of 10‰ from frugivores (–24.7‰) to obligate grazers (–13.4‰) (Figure 2 and Table 3). Feeding groups have different dietary preferences as well as niche breadths. The two herbivore dietary extremes (frugivores and obligate grazers) have the narrowest range of species-mean δ13Cdiet values, and obligate grazers can be most readily distinguished from other feeding categories (Table 3). The intermediate feeding categories (i.e., generalist and browser–grazer intermediate), by their defining criteria, have inherently wider dietary variation than the dietary extremes. Considerable variation also exists in browsers and variable grazers. The lowest δ13Cdiet values occur in two subcanopy browsers, the dwarf antelope (Neotragus batesi) and the okapi (Okapia johnstoni) (Figure 6 and Table 2). Both species inhabit closed-canopy forests in equatorial Africa. Okapis are endemic to the forests in northeastern Congo Basin. The dwarf antelope has a discontinuous range in central and western equatorial Africa. The two specimens of N. batesi from Cameroon have more variable δ13Cdiet values (–29.5‰ and –34.7‰) than do the two specimens from the Ituri Forest (–34.2‰ and –35.0‰), and more variation may be present in this group across its geographic range than previously recognized. Variable grazers exhibit a bimodal distribution of δ13Cdiet values that is distinct from the other feeding categories, and the pattern can be best explained by a distinction between the North American species feeding primarily on C3 vegetation and the African species feeding primarily on C4 vegetation (Figure 3H). In North America, variable grazers include the bison (Bison bison), muskox (Oreamnos americanus), bighorn sheep (Ovis canadensis), and the Dall sheep (Ovis dalli). Bison are sampled from a range of latitudes in the western United States; their δ13CE values vary considerably and are correlated with mean annual temperature (Hoppe et al., 2006). In Africa, warthog (Phacochoerus africanus) makes up most of the variable-grazer sample; the rest are from oryx (Oryx beisa), oribi (Ourebia ourebia), and the marshbuck (Tragelaphus spekii). Species in both continental faunas consume over 60% monocots in their average diets. Their contrasting δ13Cdiet signatures likely reflect variation in the amount of C4 biomass in the vegetation (Still et al., 2003), which is affected by both temperature and seasonality of precipitation (Boutton et al., 1980; Winslow et al., 2003; Kohn, 2010). Differentiating C3 graze from C3 browse in the fossil record would require incorporation of other kinds of data, such as morphological and use-wear traits.
Dietary breadth and flexibility
While sampled individuals may be categorized as a browser, a mixed feeder, or a grazer solely by their δ13Cdiet values (e.g., Cerling et al., 2015), it is evident from Figure 2B that there are no clear-cut boundaries among the three broad feeding types. Individuals belonging to the same phylogenetic group or feeding category can have a range of δ13Cdiet values. Consequently, the C3-C4 cutoff is frequently crossed by clades and feeding groups (Figures 2, 6). Artiodactyls have been documented to shift their diets due to geographic variation in vegetation structure, seasonal climatic and environmental changes, and ecological interactions with sympatric species (Sponheimer et al., 2003; Djagoun et al., 2013; Radloff et al., 2013; Miranda et al., 2014). Such dietary changes increase the abundance of savanna herbivore species (Staver and Hempson, 2020).
Grazing species have wider dietary niche breadths than browsing species do, as represented by their δ13Cdiet values (Figure 2 and Table 3). The difference between maximum and minimum δ13Cdiet values in browsing species (including frugivores and browsers) is ∼18‰ (∼12‰ if excluding the outliers from understory browsers), and no sample from browsing species plots in the C4 range. Grazing species (including variable grazers and obligate grazers) have a total range of over 22‰, with many samples extending well into the C3 range. Variable grazers have the widest range of mean δ13Cdiet values, ranging from –27.9‰ (Tragelaphus spekii) to –9.8‰ (Connochaetes gnou). Corresponding to this difference in extant artiodactyls, findings in the North American fossil record show that species with grazing-adapted morphology have broader diets than browsing-adapted ones and consume more browse than previously anticipated, thus morphological specialization may result in ecological generalization (Feranec, 2003; Pardi and DeSantis, 2021). Herbivores with grazing adaptations, such as hypsodont teeth, are able to consume grass but can also eat other foods when they are available. This dietary flexibility would have implications for species duration over evolutionary time scales, especially during times of climate change. For example, in the Miocene Siwalik record of Pakistan, ungulate species that were able to alter their diet (from browsing to mixed feeding or grazing) in response to vegetation change persisted substantially longer than those that were not (Badgley et al., 2008).
Future research
More isotopic data are needed for currently understudied regions and taxa to further explore the research questions posed in this study. In the current data compilation, tragulids are represented by only one species and moschids are absent. Both families are important forest dwellers in Asia and have substantial fossil records, and their δ13Cdiet values can help us investigate the resource use and partitioning in artiodactyl faunas in tropical, subtropical, and temperate forests, which may be important analogs for some paleo-ecosystems. Better sampling records from Eurasia in general are also needed. Although some isotope data from other body tissues (e.g., hair) have been reported, tooth enamel data are lacking for many regions of the continent. Due to variability in the carbon-isotope spacing between different body tissues, converting hair or bone collagen data to enamel equivalent values can confound paleodietary reconstructions (Codron et al., 2011, 2012, 2018; Bocherens et al., 2014). Therefore, δ13CE data are ideal for making direct comparisons between ungulate diets in modern and paleo ecosystems.
Incorporating different data types has proven valuable to studying paleoecology, and when reconstructing the diet of fossil species, more proxies are better than one. In addition to mandibular morphology and tooth-enamel isotopes, tooth-wear proxies should be incorporated (e.g., Codron et al., 2008; Luyt and Faith, 2014; Fillion et al., 2022). The microscopic wear patterns on the occlusal surface of teeth (microwear), for example, record feeding habits with the finest temporal resolution (daily or weekly) and can be used to detect subtle variations in broadly similar diets (e.g., Louail et al., 2021) as well as ecological responses to short-term environmental changes that would not be reflected in tooth-wear measurements (such as mesowear) or dental morphology (such as hypsodonty) (Mihlbachler et al., 2018). While carbon isotope analysis is limited in its ability to distinguish dicot fruits from leaves in a species’diet, microwear and mesowear analyses as well as mandibular morphology have proven useful for differentiating frugivores from browsers (e.g., Scott, 2012; Kaiser et al., 2013; Wang et al., 2022).
Our dataset is potentially useful for addressing many questions beyond this study. For example, how are the mean and range of δ13Cdiet values related to vegetation heterogeneity, topographic complexity, and climatic conditions? Do some species track the variation in environmental δ13C values better than other species with similar geographic ranges? If so, what aspects of their ecology can explain the difference? How do species’ δ13Cdiet values contract or expand from ecological interactions, such as co-occurrence with competitors for forage? What combination of isotopic signature and osteological characters can be used to improve paleoecological reconstructions? Some of these questions will need better sampling of targeted taxa, regions, or environmental settings, others will require more comparative data from plants.
Data availability statement
The original contributions presented in this study are included in the article/Supplementary material, further inquiries can be directed to the corresponding author.
Author contributions
BW and CB developed the research plan and wrote the manuscript. BW gathered and analyzed the data and produced the figures. Both authors contributed to the article and approved the submitted version.
Funding
This work was supported by a Graduate Student Research Grant from the Geological Society of America and a Wood Award from the Society of Vertebrate Paleontology to BW.
Acknowledgments
We thank Cody Thompson, Michael Cherney, and other members at the University of Michigan Museum of Zoology and the University of Michigan Museum of Paleontology for their kind assistance with museum access, data collection, and lab work. Isotope samples were analyzed by Lora Wingate and Kyger Lohmann at the University of Michigan Stable Isotope Laboratory in the Department of Earth and Environmental Sciences. Ethan Vanvalkenburg helped with the compilation of dietary data. This work benefited from discussions with Benjamin Passey, Laura MacLatchy, John Kingston, Matt Friedman, and Miriam Zelditch, reviews by AG and PH, and the editorial input from CM.
Conflict of interest
The authors declare that the research was conducted in the absence of any commercial or financial relationships that could be construed as a potential conflict of interest.
Publisher’s note
All claims expressed in this article are solely those of the authors and do not necessarily represent those of their affiliated organizations, or those of the publisher, the editors and the reviewers. Any product that may be evaluated in this article, or claim that may be made by its manufacturer, is not guaranteed or endorsed by the publisher.
Supplementary material
The Supplementary Material for this article can be found online at: https://www.frontiersin.org/articles/10.3389/fevo.2022.958859/full#supplementary-material
References
Badgley, C., Barry, J. C., Morgan, M. E., Nelson, S. V., Behrensmeyer, A. K., Cerling, T. E., et al. (2008). Ecological changes in Miocene mammalian record show impact of prolonged climatic forcing. Proc. Natl. Acad. Sci. U.S.A. 105, 12145–12149. doi: 10.1073/pnas.0805592105
Blomberg, S. P., Garland, T. Jr., and Ives, A. R. (2003). Testing for phylogenetic signal in comparative data: Behavioral traits are more labile. Evolution 57, 717–745. doi: 10.1111/j.0014-3820.2003.tb00285.x
Bocherens, H., Grandal-d’Anglade, A., and Hobson, K. A. (2014). Pitfalls in comparing modern hair and fossil bone collagen C and N isotopic data to reconstruct ancient diets: a case study with cave bears (Ursus spelaeus). Isot. Environ. Healt. S. 50, 291–299. doi: 10.1080/10256016.2014.890193
Bocherens, H., Koch, P. L., Mariotti, A., Geraads, D., and Jaeger, J. J. (1996). Isotopic biogeochemistry (13C, 18O) of mammalian enamel from African Pleistocene hominid sites. Palaios 11, 306–318. doi: 10.2307/3515241
Boisserie, J. R., Zazzo, A., Merceron, G., Blondel, C., Vignaud, P., Likius, A., et al. (2005). Diets of modern and late Miocene hippopotamids: evidence from carbon isotope composition and microwear of tooth enamel. Palaeogeogr. Palaeoclimatol. Palaeoecol. 221, 153–174. doi: 10.1016/j.palaeo.2005.02.010
Boutton, T. W., Harrison, A. T., and Smith, B. N. (1980). Distribution of biomass of species differing in photosynthetic pathway along an altitudinal transect in southeastern Wyoming grassland. Oecologia 45, 287–298. doi: 10.1007/BF00540195
Bradham, J. L., DeSantis, L. R. G., Jorge, M. L. S. P., and Keuroghlian, A. (2018). Dietary variability of extinct tayassuids and modern white-lipped peccaries (Tayassu pecari) as inferred from dental microwear and stable isotope analysis. Palaeogeogr. Palaeoclimatol. Palaeoecol. 499, 93–101. doi: 10.1016/j.palaeo.2018.03.020
Burgin, C. J., Colella, J. P., Kahn, P. L., and Upham, N. S. (2018). How many species of mammals are there? J. Mammal. 99, 1–14. doi: 10.1093/jmammal/gyx147
Cerling, T. E., Andanje, S. A., Blumenthal, S. A., Brown, F. H., Chritz, K. L., Harris, J. M., et al. (2015). Dietary changes of large herbivores in the Turkana Basin Kenya from 4 to 1 Ma. Proc. Natl. Acad. Sci. U.S.A. 112, 11467–11472. doi: 10.1073/pnas.1513075112
Cerling, T. E., and Ehleringer, J. R. (2000). “Welcome to the C4 world,” in Phanerozoic Terrestrial Ecosystems, eds R. A. Gastaldo and W. A. DiMichele (New Haven, CT: Yale University Press), 273–286. doi: 10.1017/S1089332600000802
Cerling, T. E., Harris, J., MacFadden, B., Leakey, M. G., Quade, J., Eisenmann, V., et al. (1997). Global vegetation change through the Miocene/Pliocene boundary. Nature 389, 153–158. doi: 10.1038/38229
Cerling, T. E., and Harris, J. M. (1999). Carbon isotope fractionation between diet and bioapatite in ungulate mammals and implications for ecological and paleoecological studies. Oecologia 120, 347–363. doi: 10.1007/s004420050868
Cerling, T. E., Harris, J. M., Hart, J. A., Kaleme, P., Klingel, H., Leakey, M. G., et al. (2008). Stable isotope ecology of the common hippopotamus. J. Zool. 276, 204–212. doi: 10.1111/j.1469-7998.2008.00450.x
Cerling, T. E., Harris, J. M., and Leakey, M. G. (1999). Browsing and grazing in modern and fossil proboscideans. Oecologia 120, 364–374. doi: 10.1007/s004420050869
Cerling, T. E., Harris, J. M., Leakey, M. G., and Mudida, N. (2003). “Stable isotope ecology of Northern Kenya, with emphasis on the Turkana Basin, Kenya,” in Lothagam: the Dawn of Humanity in Africa, eds M. G. Leakey and J. M. Harris (New York, NY: Columbia University Press), 583–603. doi: 10.7312/leak11870-023
Cerling, T. E., Harris, J. M., Leakey, M. G., Passey, B. H., and Levin, N. E. (2010). “Stable carbon and Oxygen isotopes in east African mammals: Modern and fossil,” in Cenozoic Mammals of Africa, ed. L. Werdelin (Oakland, CA: University of California Press), 941–952. doi: 10.1525/california/9780520257214.003.0048
Cerling, T. E., Hart, J. A., and Hart, T. B. (2004). Stable isotope ecology in the Ituri Forest. Oecologia 138, 5–12. doi: 10.1007/s00442-003-1375-4
Cerling, T. E., Mbua, E., Kirera, F. M., Manthi, F. K., Grine, F. E., Leakey, M. G., et al. (2011). Diet of Paranthropus boisei in the early Pleistocene of East Africa. Proc. Natl. Acad. Sci. U.S.A. 108, 9337–9341. doi: 10.1073/pnas.1104627108
Clauss, M., Lechner-Doll, M., and Streich, W. J. (2003). Ruminant diversification as an adaptation to the physicomechanical characteristics of forage. Oikos 102, 253–262. doi: 10.1034/j.1600-0706.2003.12406.x
Clementz, M. T. (2012). New insight from old bones: stable isotope analysis of fossil mammals. J. Mammal. 93, 368–380. doi: 10.1644/11-MAMM-S-179.1
Codron, D., Brink, J. S., Rossouw, L., Clauss, M., Codron, J., Lee-Thorp, J. A., et al. (2008). Functional differentiation of African grazing ruminants: an example of specialized adaptations to very small changes in diet. Biol. J. Linn. Soc. 94, 755–764. doi: 10.1111/j.1095-8312.2008.01028.x
Codron, D., Clauss, M., Codron, J., and Tütken, T. (2018). Within trophic level shifts in collagen–carbonate stablecarbon isotope spacing are propagated by diet and digestive physiology in large mammal herbivores. Ecol. Evol. 8, 3983–3995. doi: 10.1002/ece3.3786
Codron, D., Codron, J., Sponheimer, M., Bernasconi, S. M., and Clauss, M. (2011). When animals are not quite what they eat: diet digestibility influences 13C-incorporation rates and apparent discrimination in a mixed-feeding herbivore. Can. J. Zool. 89, 453–465. doi: 10.1139/z11-010
Codron, D., Sponheimer, M., Codron, J., Newton, I., Lanham, J. L., and Clauss, M. (2012). The confounding effects of source isotopic heterogeneity on consumer–diet and tissue–tissue stable isotope relationships. Oecologia 169, 939–953. doi: 10.1007/s00442-012-2274-3
Copeland, S. R., Sponheimer, M., Spinage, C. A., and Lee-Thorp, J. A. (2008). Bulk and intra-tooth enamel stable isotopes of waterbuck Kobus ellipsiprymnus from Queen Elizabeth National Park. Uganda. Afr. J. Ecol. 46, 697–701. doi: 10.1111/j.1365-2028.2008.00950.x
Copeland, S. R., Sponheimer, M., Spinage, C. A., Lee-Thorp, J. A., Codron, D., and Reed, K. E. (2009). Stable isotope evidence for impala Aepyceros melampus diets at Akagera National Park, Rwanda. Afr. J. Ecol. 47, 490–501. doi: 10.1111/j.1365-2028.2008.00969.x
DeSantis, L., Feranec, R., Southon, J., Binder, W. J., Cohen, J., Farrell, A., et al. (2020). “More tools and isotopes are better than one: Clarifying the ecology of ancient mammals at Rancho La Brea and beyond,” in Proceeding of the society of vertebrate paleontology program and abstracts meeting.
Djagoun, C. A. M. S., Kassa, B., Mensah, G. A., and Sinsin, B. A. (2013). Seasonal habitat and diet partitioning between two sympatric bovid species in Pendjari Biosphere Reserve (northern Benin): waterbuck and western kob. Afr. Zool. 48, 279–289. doi: 10.1080/15627020.2013.11407594
Drummond, A. J., Suchard, M. A., Xie, D., and Rambaut, A. (2012). Bayesian phylogenetics with BEAUti and the BEAST 1.7. Mol. Biol. Evol. 29, 1969–1973. doi: 10.1093/molbev/mss075
Ehleringer, J. R., Sage, R. F., Flanagan, L. B., and Pearcy, R. W. (1991). Climate change and the evolution of C4 photosynthesis. Trends Ecol. Evol. 6, 95–99. doi: 10.1016/0169-5347(91)90183-X
Fenner, J. N. (2008). The use of stable isotope ratio analysis to distinguish multiple prey kill events from mass kill events. J. Archaeol. Sci. 35, 704–716. doi: 10.1016/j.jas.2007.06.010
Feranec, R. S. (2003). Stable isotopes, hypsodonty, and the paleodiet of Hemiauchenia (Mammalia: Camelidae): a morphological specialization creating ecological generalization. Paleobiology 29, 230–242. doi: 10.1666/0094-8373(2003)029<0230:SIHATP¿2.0.CO;2
Feranec, R. S. (2007). Stable carbon isotope values reveal evidence of resource partitioning among ungulates from modern C3-dominated ecosystems in North America. Palaeogeogr. Palaeoclimatol. Palaeoecol. 252, 575–585. doi: 10.1016/j.palaeo.2007.05.012
Feranec, R. S., and MacFadden, B. J. (2006). Evolution of the grazing niche in Pleistocene mammals from Florida: evidence from stable isotopes. Palaeogeogr. Palaeoclimatol. Palaeoecol. 162, 155–169. doi: 10.1016/S0031-0182(00)00110-3
Fillion, E. N., Harrison, T., and Kwekason, A. (2022). A nonanalog Pliocene ungulate community at Laetoli with implications for the paleoecology of Australopithecus afarensis. J. Hum. Evol. 167:103182. doi: 10.1016/j.jhevol.2022.103182
Gagnon, M., and Chew, A. E. (2000). Dietary preferences in extant African Bovidae. J. Mammal. 81, 490–511. doi: 10.1644/1545-1542(2000)081<0490:DPIEAB¿2.0.CO;2
Gong, Y., Wang, Y., Wang, Y., Mao, F., Bai, B., Wang, H., et al. (2020). Dietary adaptations and palaeoecology of Lophialetidae (Mammalia, Tapiroidea) from the Eocene of the Erlian Basin, China: combined evidence from mesowear and stable isotope analyses. Palaeontology 63, 547–564. doi: 10.1111/pala.12471
Hammer, Ø, Harper, D. A. T., and Ryan, P. D. (2001). PAST: Paleontological statistics software package for education and data analysis. Palaeontol. Electron. 4, 1–9.
Harris, J. M., and Cerling, T. E. (2002). Dietary adaptations of extant and Neogene African suids. J. Zool. 256, 45–54. doi: 10.1017/S0952836902000067
Hofmann, R. R., and Stewart, D. R. M. (1972). Grazer or browser: a classification based on the stomach-structure and feeding habits of East African ruminants. Mammalia 36, 226–240. doi: 10.1515/mamm.1972.36.2.226
Hoppe, K. A., Paytan, A., and Chamberlain, P. (2006). Reconstructing grassland vegetation and paleotemperatures using carbon isotope ratios of bison tooth enamel. Geology 34, 649–652. doi: 10.1130/G22745.1
Janis, C. M., and Ehrhardt, D. (1988). Correlation of relative muzzle width and relative incisor width with dietary preference in ungulates. Zool. J. Linn. Soc. 92, 267–284. doi: 10.1111/j.1096-3642.1988.tb01513.x
Kaiser, T. M., Müller, D. W. H., Fortelius, M., Schulz, E., Codron, D., and Clauss, M. (2013). Hypsodonty and tooth facet development in relation to diet and habitat in herbivorous ungulates: implications for understanding tooth wear. Mammal Rev. 43, 34–46. doi: 10.1111/j.1365-2907.2011.00203.x
Keeling, R. F., Graven, H. D., Welp, L. R., Resplandy, L., Bi, J., Piper, S. C., et al. (2017). Atmospheric evidence for a global secular increase in carbon isotopic discrimination of land photosynthesis. Proc. Natl. Acad. Sci. U.S.A. 114, 10361–10366. doi: 10.1073/pnas.1619240114
Kingston, J. D. (2011). “Stable isotopic analyses of Laetoli fossil herbivores,” in Paleontology and Geology of Laetoli: Human Evolution in Context, ed. T. Harrison (Dordrecht: Springer Netherlands), 293–328. doi: 10.1007/978-90-481-9956-3_15
Kita, Z. A., Secord, R., and Boardman, G. S. (2014). A new stable isotope record of Neogene paleoenvironments and mammalian paleoecologies in the western Great Plains during the expansion of C4 grasslands. Palaeogeogr. Palaeoclimatol. Palaeoecol. 399, 160–172. doi: 10.1016/j.palaeo.2014.02.013
Koch, P. L. (1998). Isotopic reconstruction of past continental environments. Annu. Rev. Earth Planet. Sci. 26, 573–613. doi: 10.1146/annurev.earth.26.1.573
Koch, P. L., Behrensmeyer, A. K., and Fogel, M. L. (1991). The isotopic ecology of plants and animals in Amboseli National Park. Kenya. Annu. Rep. Dir. Geophys. Lab. 23, 163–171.
Koch, P. L., Tuross, N., and Fogel, M. L. (1997). The effects of sample treatment and diagenesis on the isotopic integrity of carbonate in biogenic hydroxylapatite. J. Archaeol. Sci. 24, 417–429. doi: 10.1006/jasc.1996.0126
Kohn, M. J. (2010). Carbon isotope compositions of terrestrial C3 plants as indicators of (paleo)ecology and (paleo)climate. Proc. Natl. Acad. Sci. U.S.A. 107, 19691–19695. doi: 10.1073/pnas.1004933107
Lazzerini, N., Coulon, A., Simon, L., Marchina, C., Fiorillo, D., Turbat, T. S., et al. (2021). The isotope record (δ13C, δ18O) of vertical mobility in incremental tissues (tooth enamel, hair) of modern livestock: A reference set from the Mongolian Altai. Quat. Int. 595, 128–144. doi: 10.1016/j.quaint.2021.04.008
Lee-Thorp, J. (2002). Two decades of progress towards understanding fossilization processes and isotopic signals in calcified tissue minerals. Archaeometry 44, 435–446. doi: 10.1111/1475-4754.t01-1-00076
Lee-Thorp, J. A., and van der Merwe, N. J. (1987). Carbon isotope analysis of fossil bone apatite. S. Afr. J. Sci. 83, 712–715.
Levin, N. E., Simpson, S. W., Quade, J., Cerling, T. E., and Frost, S. R. (2008). “Herbivore enamel carbon isotopic composition and the environmental context of Ardipithecus at Gona, Ethiopia,” in The Geology of Early Humans in the Horn of Africa: Geological Society of America Special Paper 446, eds J. Quade and J. G. Wynn (Boulder, CO: Geological Society of America), 215–234. doi: 10.1130/2008.2446(10)
Louail, M., Ferchaud, S., Souron, A., Walker, A. E. C., and Merceron, G. (2021). Dental microwear textures differ in pigs with overall similar diets but fed with different seeds. Palaeogeogr. Palaeoclimatol. Palaeoecol. 572:110415. doi: 10.1016/j.palaeo.2021.110415
Louys, J., Ditchfield, P., Meloro, C., Elton, S., and Bishop, L. C. (2012). Stable isotopes provide independent support for the use of mesowear variables for inferring diets in African antelopes. Proc. R. Soc. B 279, 4441–4446. doi: 10.1098/rspb.2012.1473
Luyt, J., and Faith, J. T. (2014). Phylogenetic topology mapped onto dietary ecospace reveals multiple pathways in the evolution of the herbivorous niche in African Bovidae. J. Zoolog. Syst. Evol. Res. 53, 140–154. doi: 10.1111/jzs.12080
Luyt, J., and Sealy, J. (2018). Inter-tooth comparison of δ13C and δ18O in ungulate tooth enamel from south-western Africa. Quat. Int. 495, 144–152. doi: 10.1016/j.quaint.2018.02.009
MacFadden, B. J., and Cerling, T. E. (1996). Mammalian herbivore communities, ancient feeding ecology, and carbon isotopes: a 10 million-year sequence from the Neogene of Florida. J. Vertebr. Paleontol. 16, 103–115. doi: 10.1080/02724634.1996.10011288
Martin, J. E., Vance, D., and Balter, V. (2015). Magnesium stable isotope ecology using mammal tooth enamel. Proc. Natl. Acad. Sci. U.S.A. 112, 430–435. doi: 10.1073/pnas.1417792112
Mendoza, M., Janis, C. M., and Palmqvist, P. (2002). Characterizing complex craniodental patterns related to feeding behavior in ungulates: A multivariate approach. J. Zool. 258, 223–246. doi: 10.1017/S0952836902001346
Merceron, G., Zazzo, A., Spassov, N., Geraads, D., and Kovachev, D. (2006). Bovid paleoecology and paleoenvironments from the Late Miocene of Bulgaria: Evidence from dental microwear and stable isotopes. Palaeogeogr. Palaeoclimatol. Palaeoecol. 241, 637–654. doi: 10.1016/j.palaeo.2006.05.005
Mihlbachler, M. C., Campbell, D., Chen, C., Ayoub, M., and Kaur, P. (2018). Microwear–mesowear congruence and mortality bias in rhinoceros mass-death assemblages. Paleobiology 44, 131–154. doi: 10.1017/pab.2017.13
Miranda, M., Dalerum, F., and Parrini, F. (2014). Interaction patterns within a multi-herbivore assemblage derived from stable isotopes. Ecol. Complex. 20, 51–60. doi: 10.1016/j.ecocom.2014.08.002
Nelson, S. V. (2013). Chimpanzee fauna isotopes provide new interpretations of fossil ape and hominin ecologies. Proc. R. Soc. B 280:20132324. doi: 10.1098/rspb.2013.2324
O’Leary, M. H. (1988). Carbon isotopes in photosynthesis. Bioscience 38, 328–336. doi: 10.2307/1310735
O’Leary, M. H., Madhavan, S., and Paneth, P. (1992). Physical and chemical basis of carbon isotope fractionation in plants. Plant Cell Environ. 15, 1099–1104. doi: 10.1111/j.1365-3040.1992.tb01660.x
Olson, D. M., Dinerstein, E., Wikramanayake, E. D., Burgess, N. D., Powell, G. V. N., Underwood, E. C., et al. (2001). Terrestrial ecoregions of the world: a new map of life on Earth. Bioscience 51, 933–938. doi: 10.1641/0006-3568(2001)051[0933:TEOTWA]2.0.CO;2
Pardi, M. I., and DeSantis, L. R. G. (2021). Dietary plasticity of North American herbivores: a synthesis of stable isotope data over the past 7 million years. Proc. R. Soc. B 288:20210121. doi: 10.1098/rspb.2021.0121
Passey, B. H., and Cerling, T. E. (2002). Tooth enamel mineralization in ungulates: Implications for recovering a primary isotopic time-series. Geochim. Cosmochim. Acta 66, 3225–3234. doi: 10.1016/S0016-7037(02)00933-X
Passey, B. H., Robinson, T. F., Ayliffe, L. K., Cerling, T. E., Sponheimer, M., Dearling, M. D., et al. (2005). Carbon isotope fractionation between diet, breath CO2, and bioapatite in different mammals. J. Archaeol. Sci. 32, 1459–1470. doi: 10.1016/j.jas.2005.03.015
Radloff, F. G., van der Waal, C., and Bond, A. L. (2013). Extensive browsing by a conventional grazer? Stable carbon isotope analysis reveals extraordinary dietary flexibility among Sanga cattle of North Central Namibia. Isotopes Environ. Health Stud. 49, 318–324. doi: 10.1080/10256016.2013.789025
Revell, L. J. (2012). phytools: An R package for phylogenetic comparative biology (and other things). Methods Ecol. Evol. 3, 217–223. doi: 10.1111/j.2041-210X.2011.00169.x
Rivals, F., and Ziegler, R. (2018). High-resolution paleoenvironmental context for human occupations during the Middle Pleistocene in Europe (MIS 11, Germany). Quat. Sci. Rev. 188, 136–142. doi: 10.1016/j.quascirev.2018.03.026
Rivera-Araya, M., and Birch, S. P. (2018). Stable isotope signatures in white-tailed deer as a seasonal paleoenvironmental proxy: A case study from Georgia, United States. Palaeogeogr. Palaeoclimatol. Palaeoecol. 505, 53–62. doi: 10.1016/j.palaeo.2018.05.025
Rubino, M., Etheridge, D. M., Trudinger, C. M., Allison, C. E., Battle, M. O., Langenfelds, R. L., et al. (2013). A revised 1000?year atmospheric δ13C-CO2 record from Law Dome and South Pole, Antarctica. J. Geophys. Res. Atmos. 118, 8482–8499. doi: 10.1002/jgrd.50668
Scott, J. R. (2012). Dental microwear texture analysis of extant African Bovidae. Mammalia 76, 157–174. doi: 10.1515/mammalia-2011-0083
Secord, R., Wing, S. L., and Chew, A. (2008). Stable isotopes in early Eocene mammals asindicators of forest canopy structure and resource partitioning. Paleobiology 34, 282–300. doi: 10.1666/0094-8373(2008)034[0282:SIIEEM]2.0.CO;2
Sewell, L., Merceron, G., Hopley, P. J., Zipfel, B., and Reynolds, S. C. (2019). Using springbok (Antidorcas) dietary proxies to reconstruct inferred palaeovegetational changes over 2?million?years in Southern Africa. J. Archaeol. Sci. Rep. 23, 1014–1028. doi: 10.1016/j.jasrep.2018.02.009
Spencer, L. M. (1995). Morphological correlates of dietary resource partitioning in the African Bovidae. J. Mammal. 76, 448–471. doi: 10.2307/1382355
Sponheimer, M., and Cerling, T. E. (2014). “Investigating ancient diets using stable isotopes in bioapatites,” in Treatise on Geochemistry (Second Edition), eds H. D. Holland and K. K. Turekian (Amsterdam: Elsevier), 341–355. doi: 10.1016/B978-0-08-095975-7.01222-5
Sponheimer, M., Lee-Thorp, J. A., DeRuiter, D. J., Smith, J. M., van der Merwe, N. J., Reed, K., et al. (2003). Diets of Southern African Bovidae: Stable isotope evidence. J. Mammal. 84, 471–479. doi: 10.1644/1545-1542(2003)084<0471:DOSABS¿2.0.CO;2
Sponheimer, M., Reed, K. E., and Lee-Thorp, J. A. (1999). Combining isotopic and ecomorphological data to refine bovid dietary reconstruction: A case study from the Makapansgat Limeworks hominin locality. J. Hum. Evol. 36, 705–718. doi: 10.1006/jhev.1999.0300
Staver, A. C., and Hempson, G. P. (2020). Seasonal dietary changes increase the abundances of savanna herbivore species. Sci. Adv. 6:eabd2848. doi: 10.1126/sciadv.abd2848
Still, C. J., Berry, J. A., Collatz, G. J., and DeFries, R. S. (2003). Global distribution of C3 and C4 vegetation: Carbon cycle implications. Global Biogeochem. Cycles 17:1006. doi: 10.1029/2001GB001807
Tejada, J. V., Flynn, J. J., Antoine, P. O., Pacheco, V., Salas-Gismondi, R., and Cerling, T. E. (2020). Comparative isotope ecology of western Amazonian rainforest mammals. Proc. Natl. Acad. Sci. U.S.A. 117, 26263–26272. doi: 10.1073/pnas.2007440117
Tejada-Lara, J. V., MacFadden, B. J., Bermudez, L., Rojas, G., Salas-Gismondi, R., and Flynn, J. J. (2018). Body mass predicts isotope enrichment in herbivorous mammals. Proc. R. Soc. B 285:20181020. doi: 10.1098/rspb.2018.1020
Uno, K. T., Rivals, F., Bibi, F., Pante, M., Njau, M., and de la Torre, I. (2018). Large mammal diets and paleoecology across the Oldowan–Acheulean transition at Olduvai Gorge, Tanzania from stable isotope and tooth wear analyses. J. Hum. Evol. 120, 76–91. doi: 10.1016/j.jhevol.2018.01.002
Upham, N. S., Esselstyn, J. A., and Jetz, W. (2019). Inferring the mammal tree: Species-level sets of phylogenies for questions in ecology, evolution, and conservation. PLoS Biol. 17:e3000494. doi: 10.1371/journal.pbio.3000494
van der Merwe, N. J. (2013). Isotopic ecology of fossil fauna from Olduvai Gorge at ca 1.8 Ma, compared with modern fauna. S. Afr. J. Sci. 109, 1–14. doi: 10.1590/sajs.2013/20130105
Wang, B., and Secord, R. (2020). Paleoecology of Aphelops and Teleoceras (Rhinocerotidae) through an interval of changing climate and vegetation in the Neogene of the Great Plains, central United States. Palaeogeogr. Palaeoclimatol. Palaeoecol. 542:109411. doi: 10.1016/j.palaeo.2019.109411
Wang, B., Zelditch, M., and Badgley, C. (2022). Geometric morphometrics of mandibles for dietary differentiation of Bovidae (Mammalia: Artiodactyla). Curr. Zool. 68, 237–249. doi: 10.1093/cz/zoab036
Wang, Y., and Cerling, T. E. (1994). A model of fossil tooth and bone diagenesis: implications for paleodiet reconstruction from stable isotopes. Palaeogeogr. Palaeoclimatol. Palaeoecol. 107, 281–289. doi: 10.1016/0031-0182(94)90100-7
Wang, Y., Cerling, T. E., and MacFadden, B. J. (1994). Fossil horses and carbon isotopes: new evidence for Cenozoic dietary, habitat, and ecosystem changes in North America. Palaeogeogr. Palaeoclimatol. Palaeoecol. 107, 269–279. doi: 10.1016/0031-0182(94)90099-X
Wang, Y., Kromhout, E., Zhang, C., Xu, Y., Parker, W., Deng, T., et al. (2008). Stable isotopic variations in modern herbivore tooth enamel, plants and water on the Tibetan Plateau: Implications for paleoclimate and paleoelevation reconstructions. Palaeogeogr. Palaeoclimatol. Palaeoecol. 260, 359–374. doi: 10.1016/j.palaeo.2007.11.012
West, J. B., Bowen, G. J., Cerling, T. E., and Ehleringer, J. R. (2006). Stable isotopes as one of nature’s ecological recorders. Trends Ecol. Evol. 21, 408–414. doi: 10.1016/j.tree.2006.04.002
Keywords: stable isotope, herbivore, ungulates, tooth enamel, paleodiet
Citation: Wang B and Badgley C (2022) Carbon-isotope composition of artiodactyl tooth enamel and its implications for paleodiets. Front. Ecol. Evol. 10:958859. doi: 10.3389/fevo.2022.958859
Received: 01 June 2022; Accepted: 05 September 2022;
Published: 12 October 2022.
Edited by:
Carlo Meloro, Liverpool John Moores University, United KingdomReviewed by:
Aurora Grandal-d’Anglade, Universidade da Coruña, SpainPhil Hopley, Birkbeck, University of London, United Kingdom
Copyright © 2022 Wang and Badgley. This is an open-access article distributed under the terms of the Creative Commons Attribution License (CC BY). The use, distribution or reproduction in other forums is permitted, provided the original author(s) and the copyright owner(s) are credited and that the original publication in this journal is cited, in accordance with accepted academic practice. No use, distribution or reproduction is permitted which does not comply with these terms.
*Correspondence: Bian Wang, YmlhbndhbmdAdW1pY2guZWR1
 Bian Wang
 Catherine Badgley2,4