
94% of researchers rate our articles as excellent or good
Learn more about the work of our research integrity team to safeguard the quality of each article we publish.
Find out more
ORIGINAL RESEARCH article
Front. Ecol. Evol., 18 October 2022
Sec. Population, Community, and Ecosystem Dynamics
Volume 10 - 2022 | https://doi.org/10.3389/fevo.2022.951047
This article is part of the Research TopicFood Webs and Stable Isotopes, volume IIView all 13 articles
 Philip M. Riekenberg1*
 Tjisse van der Heide2,3
 Sander J. Holthuijsen2
 Henk W. van der Veer2
 Marcel T. J. van der Meer1
The Wadden Sea is the world’s largest intertidal ecosystem and provides vital food resources for a large number of migratory bird and fish species during seasonal stopovers. Previous work using bulk stable isotope analysis of carbon found that microphytobenthos (MPB) was the dominant resource fueling the food web with particulate organic matter making up the remainder. However, this work was unable to account for the trophic structure of the food web or the considerable increase in δ15N values of bulk tissue throughout the benthic food web occurring in the Eastern regions of the Dutch Wadden Sea. Here, we combine compound-specific and bulk analytical stable isotope techniques to further resolve the trophic structure and resource use throughout the benthic food web in the Wadden Sea. Analysis of δ15N for trophic and source amino acids allowed for better identification of trophic relationships due to the integration of underlying variation in the nitrogen resources supporting the food web. Baseline-integrated trophic position estimates using glutamic acid (Glu) and phenylalanine (Phe) allow for disentanglement of baseline variations in underlying δ15N sources supporting the ecosystem and trophic shifts resulting from changes in ecological relationships. Through this application, we further confirmed the dominant ecosystem support by MPB-derived resources, although to a lesser extent than previously estimated. In addition to phytoplankton-derived particulate, organic matter and MPB supported from nutrients from the overlying water column there appears to be an additional resource supporting the benthic community. From the stable isotope mixing models, a subset of species appears to focus on MPB supported off recycled (porewater) N and/or detrital organic matter mainly driven by increased phenylalanine δ15N values. This additional resource within MPB may play a role in subsidizing the exceptional benthic productivity observed within the Wadden Sea ecosystem and reflect division in MPB support along green (herbivory) and brown (recycled/detrital) food web pathways.
Tracing the sources and fate of primary productivity as it supports an ecosystem or food web is challenging in coastal ecosystems, and stable isotope techniques have been useful tools that have allowed for further insight into these processes (Fry, 1984; Middelburg et al., 2000; Evrard et al., 2010). As shallow intertidal ecosystems are important sites for both primary production and the interception and reworking of carbon and nitrogen prior to export to shallow seas (Bauer et al., 2013a,b; Chua et al., 2022), it is important to resolve the relative incorporation of these elements into the wider food web. The world’s largest intertidal ecosystem (Compton et al., 2013), the Wadden Sea, stretches from Netherlands to Denmark behind a barrier island chain with connection to the North Sea (Postma, 1996). This intertidal ecosystem has been designated as a culturally significant UNESCO World Heritage site due to considerable biodiversity within the system as benthic productivity supports an estimated 10–12 million migratory birds across each year (Reise et al., 2010). The Wadden Sea has a long history of multiple direct impacts from human activity (Eriksson et al., 2010; Wolff, 2013) that includes land reclamation, partial damming and hydraulic changes, eutrophication, overfishing, and extensive dredging for shellfish. These impacts have resulted in a shift from a benthos dominated by seagrass, extensive bivalve reefs, and supporting apex predators toward one dominated by polychaetes, with minimal fringing bivalve reefs, and largely devoid of apex predators (Philippart et al., 2007). Despite historical and recent anthropogenic impacts, the Wadden Sea remains a very productive intertidal ecosystem and direct support of macrozoobenthos by phytoplankton has been identified as a controlling factor of benthic biomass in the Wadden Sea (Beukema et al., 2002). However, changes in higher trophic level species have coincided with shifts in the benthic community as inferred from bird species shifting from primary bivalve carnivores toward polychaete carnivores (Van Roomen et al., 2005; Eriksson et al., 2010) and the drivers of these shifts remain unclear.
Analysis of the stable isotope composition of carbon (δ13C) and nitrogen (δ15N) in animal tissues is routinely used to identify underlying resource use and trophic relationships within ecosystems (Minagawa and Wada, 1984; Fry, 1988). Through the application of trophic discrimination factors (TDFs) for carbon and nitrogen (Δ13C and Δ15N) stepwise isotopic increases that occur between a consumer’s diet and their tissues during metabolism can be accounted for (Post, 2002; McCutchan et al., 2003), allowing for the identification of the animal’s trophic level. Accounting for isotopic changes across trophic levels allows for the application of both simple and complex stable isotope mixing models (SIMMs) to be used to resolve the relative use of food resources by consumers within a food web (Fernandes et al., 2014; Stock et al., 2018). Approaches for characterizing resource use using SIMMs have typically been based on either bottom-up or top-down approaches to examine consumer resource use. Bottom-up approaches combine measured dietary resources and clearly defined TDFs to estimate resource use within ecosystems [McCormack et al. (2019) and references within, Cresson et al. (2020) and Kahma et al. (2020)] while top-down approaches rely on identification of unique consumer values within an ecosystem to identify cryptic or under-sampled resources without which the mixing envelope for all consumers in that ecosystem cannot be adequately resolved [Supplementary material 6 and references within Chi et al. (2021) and Then et al. (2021)]. For the Dutch part of the Wadden Sea, Christianen et al. (2017) identified that the majority of the biomass is supported by both pelagic phytoplankton and microphytobenthos (MPB). Their study used a two-source mixing model with a single isotopic tracer (δ13C) and clearly identified benthic productivity from MPB as an important resource supporting the benthic community. However, they may have overestimated the amount of support due to compression of the MPB end member through the use of an animal proxy instead of directly measured resources (Post, 2002).
Thus far, it has not been possible to assess the trophic structure within the Dutch Wadden Sea benthic community due to the large variability in δ15N values observed in multiple benthic species. Christianen et al. (2015) found clear trends of increased δ15N values for filter feeders (Mytilus edulis) in the eastern Dutch Wadden Sea indicating the potential for either a more positive δ15N baseline value or altered trophic structure. Potential causes for locally increased δ15N values could be (1) unaccounted for source of N to the ecosystem (e.g., terrestrial input), (2) altered trophic structure resulting in regionally increased δ15N values in benthic consumers (Durante et al., 2022), or (3) altered nitrogen cycling, e.g., increased denitrification resulting in increased δ15N values in residual pool of N supporting remineralization (Vokhshoori and McCarthy, 2014). Terrestrial inputs have been found to be limited within the Dutch Wadden Sea (Christianen et al., 2017). Intertidal areas within the German Wadden Sea have been identified as having high rates of denitrification associated with tidal pumping and long exposure times within intertidal sediments (Marchant et al., 2016, 2017, 2018). Increased porewater processing of nitrogen may coincide with the unique distribution of sandy sediments and pore sizes due to the parallel flow of tidal waters through the Wadden Sea basin. These physical attributes result in reverse grading of sediments with coarser grains toward the basin edges and finer sediment centrally deposited along with longer exposure times in the East than in West (Otto et al., 1990; Compton et al., 2013). This combination of unique physical and biogeochemical settings may contribute to increased underlying δ15N values but identifying any use of denitrification-affected N porewater resources by MPB and the food web has remained largely intractable solely using traditional bulk isotope techniques.
Microphytobenthos thrive in unvegetated sandy sediments where they can contribute significantly to the primary production supporting an ecosystem (Miller et al., 1996) as benthic diatoms fix carbon and take up nitrogen from the overlying water column and porewaters (Cook et al., 2007; Oakes et al., 2012; Riekenberg et al., 2020a). Much of the fixed carbon is excreted as extracellular polymeric substances (EPS), which are sticky, sugar-rich substrates that help to stabilize sediment and facilitate diatom motility throughout sand (Goto et al., 1999; Stal, 2010), but also serve as a labile carbon source for heterotrophic bacteria (Taylor et al., 2013). Diatom motility in sandy sediments is an adaptation to the physiochemical variations that occur within intertidal settings. Diel vertical migration of diatoms coincides with tidal cycles and available sunlight to support favorable conditions for photosynthesis at the surface (Barnett et al., 2020) and to maximize nutrient availability for cell growth and division in the subsurface (Saburova and Polikarpov, 2003). Due to the diel vertical migration of several centimeters and a strong coupling between diatoms and heterotrophic bacteria, MPB actively straddle the boundary between water column and sediment porewaters to maximize resource availability.
Food webs are often described as either green or brown depending on whether consumers are supported by herbivory of primary producers or supported by detrital reworking through the microbial loop (Middelburg, 2014; Potapov et al., 2019). MPB-supported food webs blur the line between green (MPBgreen) and brown (MPBbrown) designations as MPB-derived material that can be used by consumers comes in several forms: (1) newly fixed organic matter from water column nutrients (MPBgreen throughout), (2) MPB-derived organic matter formed from recycled detrital material by heterotrophs through oxic or anoxic pathways in sediment porewaters, or (3) detrital MPB-derived material such as reworked EPS that is still labile within the sediment (MPBbrown throughout). Microbial subsidies to MPB of both C and N from heterotrophic bacterial reworking of organic matter in porewaters blur the line between primary production and detrital resource use. Consumers such as deposit feeders have access to MPB biomass (living or dead) and EPS made using a mixture of resources derived directly from the water column or from heterotrophic processing within porewaters (e.g., denitrification affected N pools). This biogeochemical complexity can make identification of carbon and nitrogen food web support from MPB difficult to identify using bulk isotope techniques.
Application of compound-specific stable isotope analysis techniques (e.g., analysis of individual amino acid δ15N values) could allow for identification of the trophic structure of the benthic community in the Wadden Sea without requiring measurement of all primary producers and all N sources within the ecosystem. This is because amino acid δ15N values provide additional information for each sample analyzed in comparison with traditional bulk analysis due to the different fractionations that occur during metabolic reworking of trophic and source amino acids (O’Connell, 2017). Trophic amino acids such as glutamic acid (Glu) fractionate considerably between diet and the consumer resulting in a TDF ranging from 3–3.8‰ in marine mammals and sharks (Whiteman et al., 2018; Ruiz-Cooley et al., 2021) to as high as 11‰ in teleost fish fed a diet of low protein quality (McMahon et al., 2015b). δ15N values for source amino acids such as phenylalanine (Phe) are relatively preserved as they are processed throughout food webs due to a low and consistent TDF of ∼0–0.5‰ (Chikaraishi et al., 2009; McMahon et al., 2015a). Integration of source amino acid values into trophic level estimates removes the effects from baseline N variations across an ecosystem using a single chemical analytical method (Vokhshoori et al., 2019; Xing et al., 2020) instead of requiring multiple comparisons and adjustments using resource or primary consumer measurements.
In this study, we apply natural abundance stable isotope analysis of amino acid nitrogen to resolve the trophic structure for 28 species from within the Dutch part of the Wadden Sea benthic ecosystem, which was previously not possible using solely bulk isotope values. Through the application of this amino acid–based method, it should be possible to further investigate the widespread nature of the driver causing increased variability in δ15N across the ecosystem, which we have postulated as potentially being either caused by (1) changed food web complexity, (2) widespread variability in underlying biogeochemical processes (denitrification), or (3) unique sources such as freshwater inflow or groundwater influx coming from terrestrial sources.
The Wadden Sea is a large intertidal ecosystem formed behind a chain of 12 sand barrier islands that stretch from the Netherlands to Denmark (Christianen et al., 2017). It is an highly productive estuarine ecosystem formed of sedimentary tidal flats that receive direct and indirect terrestrial inputs from the Ems, Weser, Elbe, IJssel, Muse, and Rhine rivers (Eriksson et al., 2010). Extensive long-term sampling of the benthic community has occurred in the Dutch Wadden Sea with spatial coverage extending from the Marsdiep (52° 58′ 12′ N, 4° 44′ 24′′ E) to the Ems River mouth at the border of Germany (53° 19′ 48′′ N, 7° 1′ 12′′ E; Figure 1 and Supplementary Figure 1).
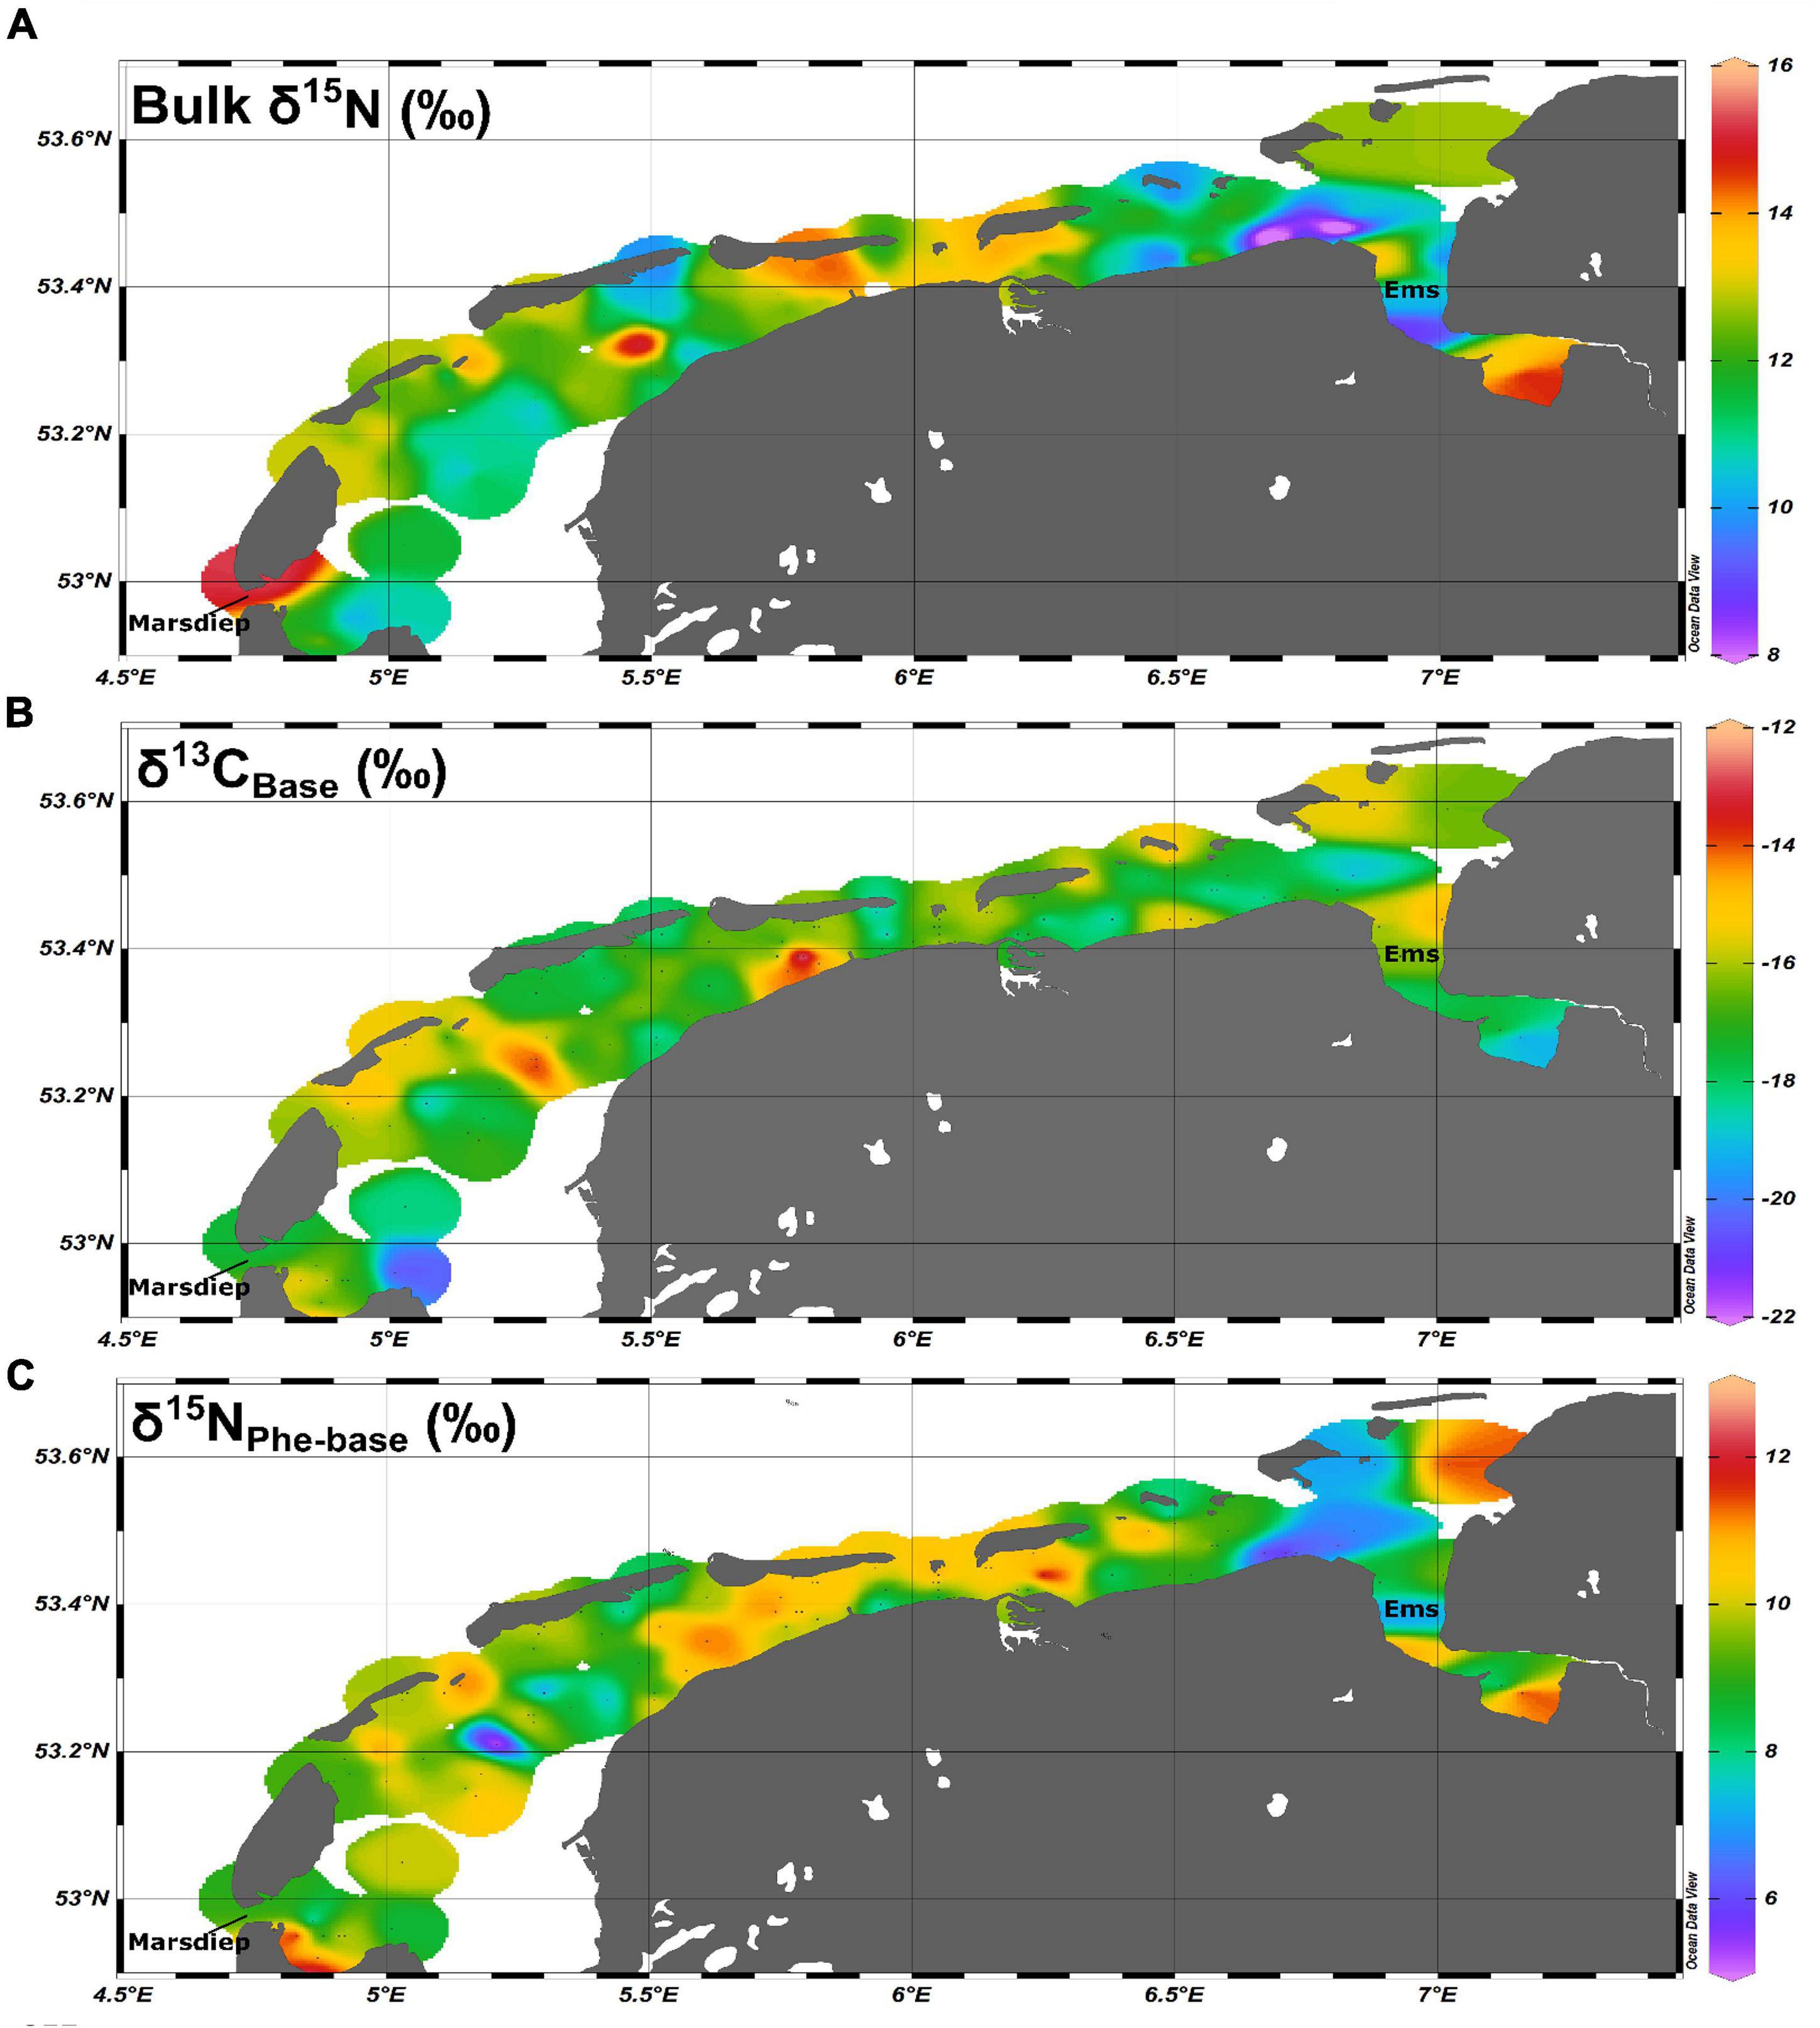
Figure 1. Spatial coverage for (A) regionally adjusted bulk δ15N values, (B) δ13CBase values, and (C) δ15NPhe–base values for the Dutch Wadden Sea.
Sampling for macrozoobenthic species occurred between June and October of 2011–2014 as part of a yearly spatially extensive long-term monitoring campaign within the Dutch Wadden Sea (SIBES, Synoptic Intertidal BEnthic Survey). The SIBES program performs core sampling of the intertidal mudflats either by foot or with the use of a rigid hulled inflatable boat, with the aim of comprehensive identification and collection of benthic species in a gridded pattern (500 m separation) throughout the Dutch Wadden Sea that are spatially randomly sampled across the sampling season to minimize the possibility of temporal effects between the years with additional random sample points that result in ∼4,500 samples per year (Bijleveld et al., 2012; Compton et al., 2013). Samples were sieved using 1-mm mesh size and all retained animals were stored frozen after collection. Identification and dissection was done either aboard the ship or in the laboratory. In addition, samples of the filter feeding community (e.g., Mytilus edulis and Balanus crenatus) were obtained from buoys in the main tidal channels in 2014 to constrain regional N variability throughout the Dutch Wadden Sea. Encrusting communities were scraped from the sides of free-standing anchored buoys and were collected, dissected, and frozen on board (Christianen et al., 2015). Fish were collected from long-term monitoring efforts from the NIOZ Fyke. For all sampling campaigns, samples of muscle tissue (fish, crustaceans, and bivalves), soft tissue (invertebrates), or whole animals (smaller specimens) were freeze-dried, homogenized, and placed in sample vials prior to bulk tissue or amino acid stable isotope analysis. Species were selected for bulk stable isotope analysis based on their contribution to total biomass within the Dutch Wadden Sea ecosystem (Christianen et al., 2017), with 35 species contributing 99% of the total benthic biomass for the system. From these samples, 28 species (25 consumers, three macroalgae) were selected for amino acid isotope analysis based on tissue availability (>3 mg), spatial representation across the Dutch Wadden Sea, and adequate replication (>5 individuals) within the data set. Also samples for particulate organic matter (POM) were collected and filtered through combusted GFF filters (Whatman). MPB were filtered onto GFF filters after migration into combusted sand through a 100-μm mesh (Eaton and Moss, 1966). This method will preferentially select for motile (epipelic) diatoms vs. sessile (episammic) diatoms. Additional sampling details for the SIBES campaigns can be found in Bijleveld et al. (2012), Compton et al. (2013), and Christianen et al. (2017).
For bulk stable isotope analysis of δ13C and δ15N values, 0.4–2 mg of freeze-dried, homogenized, and non-lipid extracted animal tissue was loaded into tin capsules. Because the presence of inorganic carbonates can greatly influence δ13C values (Androuin et al., 2019; Sturbois et al., 2022), samples were initially analyzed without acidification for δ15N and δ13C values and then re-analyzed after acidification for a δ13C value of the organic matter in tissue if (1) the animal has a shell, (2) if the animal is in contact with sediment, or (3) if C/N ratios were higher than eight. Acidification was performed through an initial addition of two drops of 2N hydrochloric acid, gentle shaking to mix, allowing time for bubbling to evolve (15 min), and then adding two more drops and gently shaking until the addition of acid does not cause bubbling. After a final addition of a few drops of acid, sample vials were then shaken overnight, repeatedly rinsed with double distilled water to a pH of five, and then freeze-dried to completely remove any remaining acid prior to analysis. Samples were analyzed with a Flash 2000 elemental analyzer coupled to a Delta V Advantage isotope ratio mass spectrometer (Thermo Scientific, Bremen, Germany). Stable isotope ratios are expressed using the δ notation in units per mil:
respectively, reported relative to Vienna Pee Dee belemnite and atmospheric N2. Certified laboratory standards of acetanilide, urea, and casein with known δ13C and δ15N values and known %TOC and %TN values calibrated against NBS-22 and IAEA-N1 were used for calibration with each sample run. Average precision for standards and replicate samples was ± 0.1‰ for δ13C and 0.2‰ for δ15N.
For analysis of δ15N values in individual amino acids, 2–5 mg of tissue was hydrolyzed and derivatized to N-pivaloyl/isopropyl (NPiP) derivatives. Analysis occurred using two different gas chromatography combustion isotope ratio mass spectrometers with similar ramp schedules, flow rates, and combustion temperatures measured at the NIOZ Royal Netherlands Institute for Sea Research between 2012 and 2019. ∼90% of the samples were analyzed in duplicate with a Trace 1310 gas chromatograph coupled to a Delta V advantage isotope ratio mass spectrometer through an IsoLink II using a modified version of the amino acid preparation and analysis method used by Chikaraishi et al. (2007) that is described in further detail in Riekenberg et al. (2020b). From this analysis, we report 12 amino acid δ15N values including alanine, aspartic acid, Glu, glycine, isoleucine, leucine, lysine, methionine, Phe, serine, threonine, tyrosine, and valine with a precision for samples and standards of <±0.5‰. Due to the conditions during hydrolysis, the terminal amines contained in glutamine and aspartamine are cleaved thereby converting to glutamine to glutamic acid and aspartamine to aspartic acid; so Glu represents a pool of combined material in this work. The remaining 10% of the samples were analyzed in duplicate on an Agilent 6890 gas chromatograph coupled to a Delta V advantage isotope ratio mass spectrometer through a combustion III interface using the method presented in Svensson et al. (2016) reporting five amino acids (alanine, glycine, norleucine, Glu, and Phe) with an average precision for standards and samples of ±1‰. We, therefore, present only Glu and Phe for the 338 amino acid analyses presented here due to the reduced precision and reduced number of reported amino acids present in 10% of the data set.
Trophic levels were estimated using single trophic and source amino acids (Glu and Phe, respectively) with the equation presented in Chikaraishi et al. (2009) modified with an ecosystem-specific TDF and β following Bradley et al. (2015) to account for the range of TDFs present from primary producers to tertiary consumers within the benthic community.
where TDF, the stepwise increase in δ15N value between a consumer and their diet, is 4.9‰ and β, the difference between Glu and Phe in the ecosystem’s primary producers, is 4.3‰. These values are obtained from the slope and intercept of the linear relationship between the difference between δ15N values for Glu and Phe and trophic position as determined by stomach content and ecological observation. This relationship was then adjusted to place primary producers at the intercept of 0 using a re-arranged version of Equation 2 as further described in Bradley et al. (2015):
where ΔGlu-Phe is the measured isotopic difference between Glu and Phe for each species and TPSCA is the trophic level as indicated by stomach content analysis or ecological determination of direct feeding and was determined for each species using FishBase for fish species (Froese and Pauly, 2000), literature determinations for invertebrates (Christianen et al., 2015, 2017; Borst et al., 2018), and estimation through interpolation of centroid placement for the remaining species relative to ecosystem trends (Table 1).
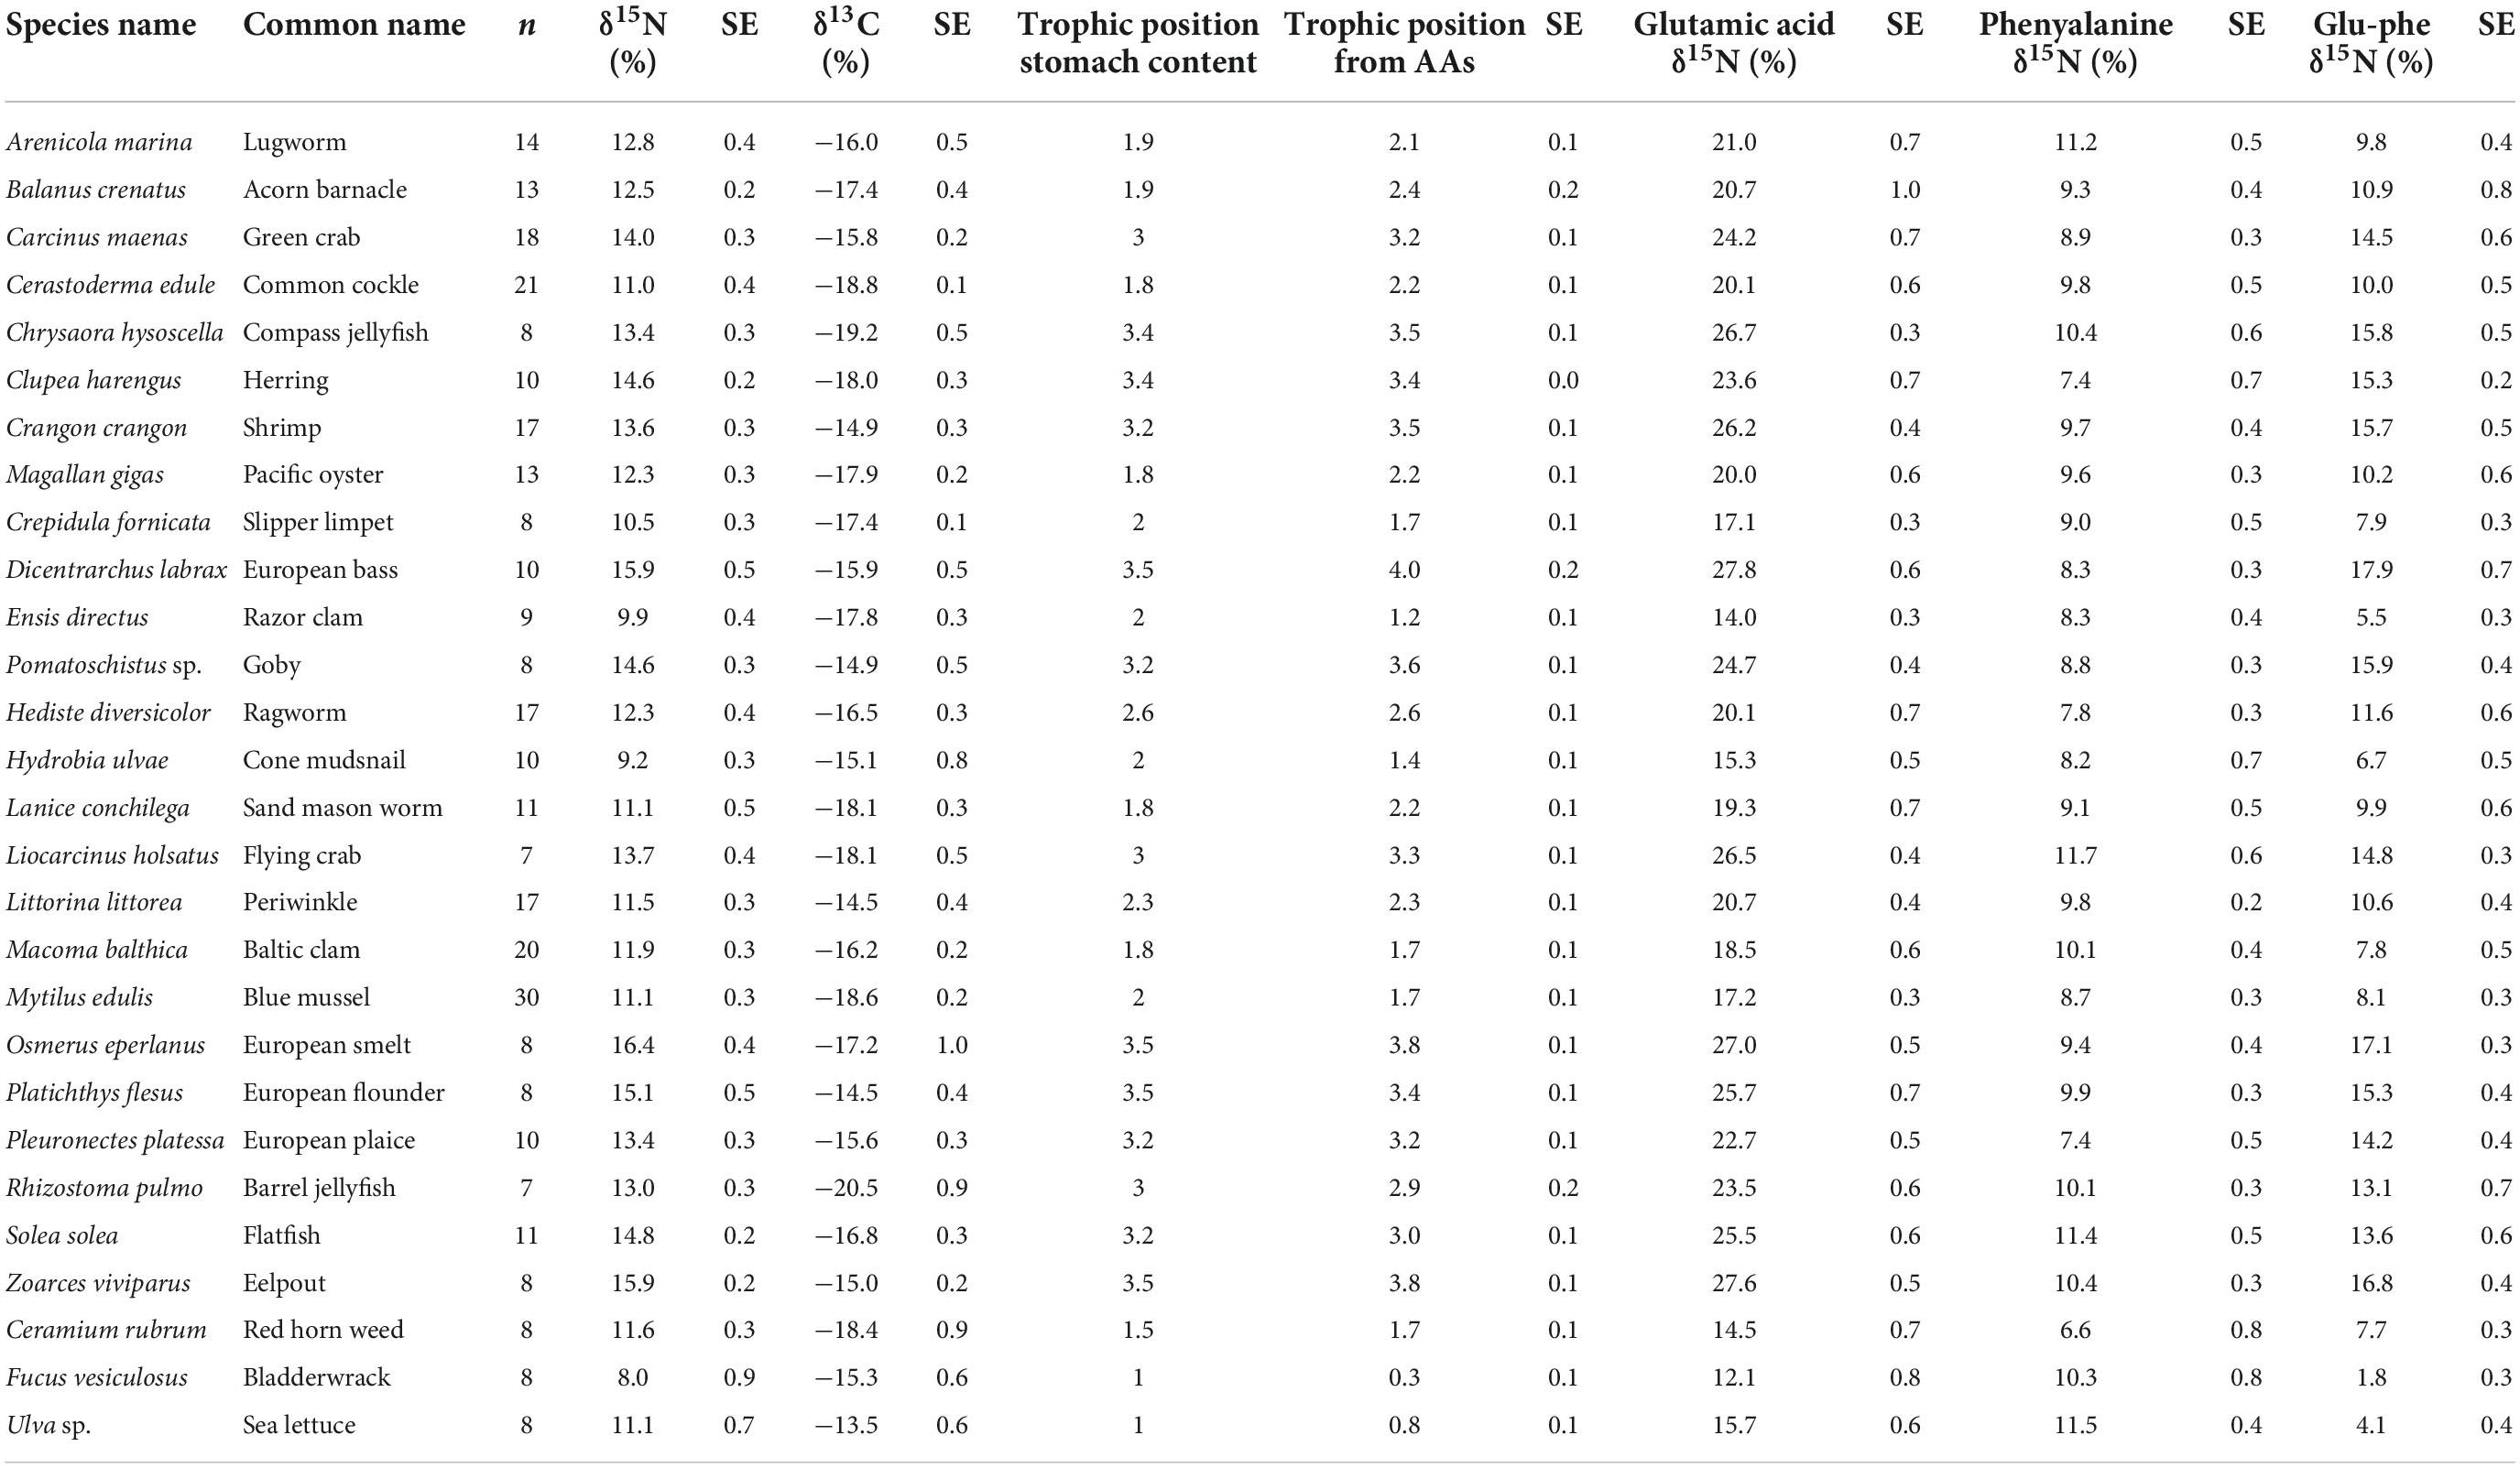
Table 1. δ15N values for bulk material, glutamic acid, and phenylalanine along with δ13C values, trophic position from stomach content and trophic position calculated from amino acids (AAs) for the subset of 25 consumers and three macroalgae species examined in this study sampled from the Dutch Wadden Sea benthic food web during SIBES and Waddensleutels campaigns spanning from 2011 to 2014 and in the NIOZ Fyke during routine monitoring.
Adjustment to account for the small trophic increase in δ15N values of the source AA phenylalanine to establish baseline δ15N values for individual species was calculated as:
which accounts for the small increase observed in the δ15NPhe (‰) value that is associated with consumer fractionation of diet during metabolism of Phe (0−0.4‰) (Chikaraishi et al., 2009; McMahon and McCarthy, 2016) and trophic level is the trophic level estimate for each individual species. Correction for the trophic increase in bulk δ13C values was calculated as:
where 0.5 is the increase observed in bulk δ13C values between diet and consumer. This value falls between the TDF values observed for bulk δ13C for whole tissue from consumers (0.3 ± 0.1‰) and consumer muscle tissues (1.3 ± 0.3‰) (McCutchan et al., 2003). Due to the wide range of animals included in this analysis ranging from invertebrate primary consumers to teleost tertiary consumers, we have found it appropriate to use a single intermediate TDF value for bulk δ13C for all consumers across the trophic structure.
Statistical analyses were performed in R (v 4.0.3) using RStudio (v 1.3.1056), OriginLab 2020b, or in Ocean Data View (5.6.0) (Schlitzer, 2022). Mixing models were performed using Food Reconstruction Using Isotope Transferred Signals (FRUITS v 2.1) and the MixSIAR package in R (Stock et al., 2018). We first used FRUITS to model the species means against measured values for end members (Tables 1, 2) for two sources (POM and MPB global averages) using δ13CBase values only and then three sources (POM, MPBgreen, and MPBbrown) using δ13CBase and δ15NPhe-Base values with SD values set to 0.2‰ for δ13C and 0.5‰ for δ15N reflecting global measurement errors. Both MPBgreen and MPBbrown end members from minimum and maximum bulk δ15N values for MPB and POM are the average measured during the sampling campaigns. Models in FRUITS were run using 50,000 updates, a burn-in of 10,000 and a minimum uncertainty of 0.001. We then proceeded to modeling individuals within species groupings in MixSIAR using end member values for δ15NPhe that allowed for the resolution of individuals within the mixing envelope between end members (Table 2b) with minimal exclusion of consumer data points (4% excluded, n = 302 remaining). For individual models using three source end members, values for N were expanded for both MPB-derived end members with δ15N values of 5.0‰ for MPBgreen and 13.0‰ for MPBbrown taken from values observed for δ15NPhe–Base for individuals from Peringia ulvae (Cone mudsnail) and Littorina littorea (Periwinkle). Models in MixSIAR were run using the “long” setting, where three Markov chain Monte–Carlo algorithms with a length of 300,000 run with a burn-in of 200,000. Results are presented from the species averages along with correlation indices comparing the two modeling approaches. Additional details about model fit are provided in the Supplementary material.
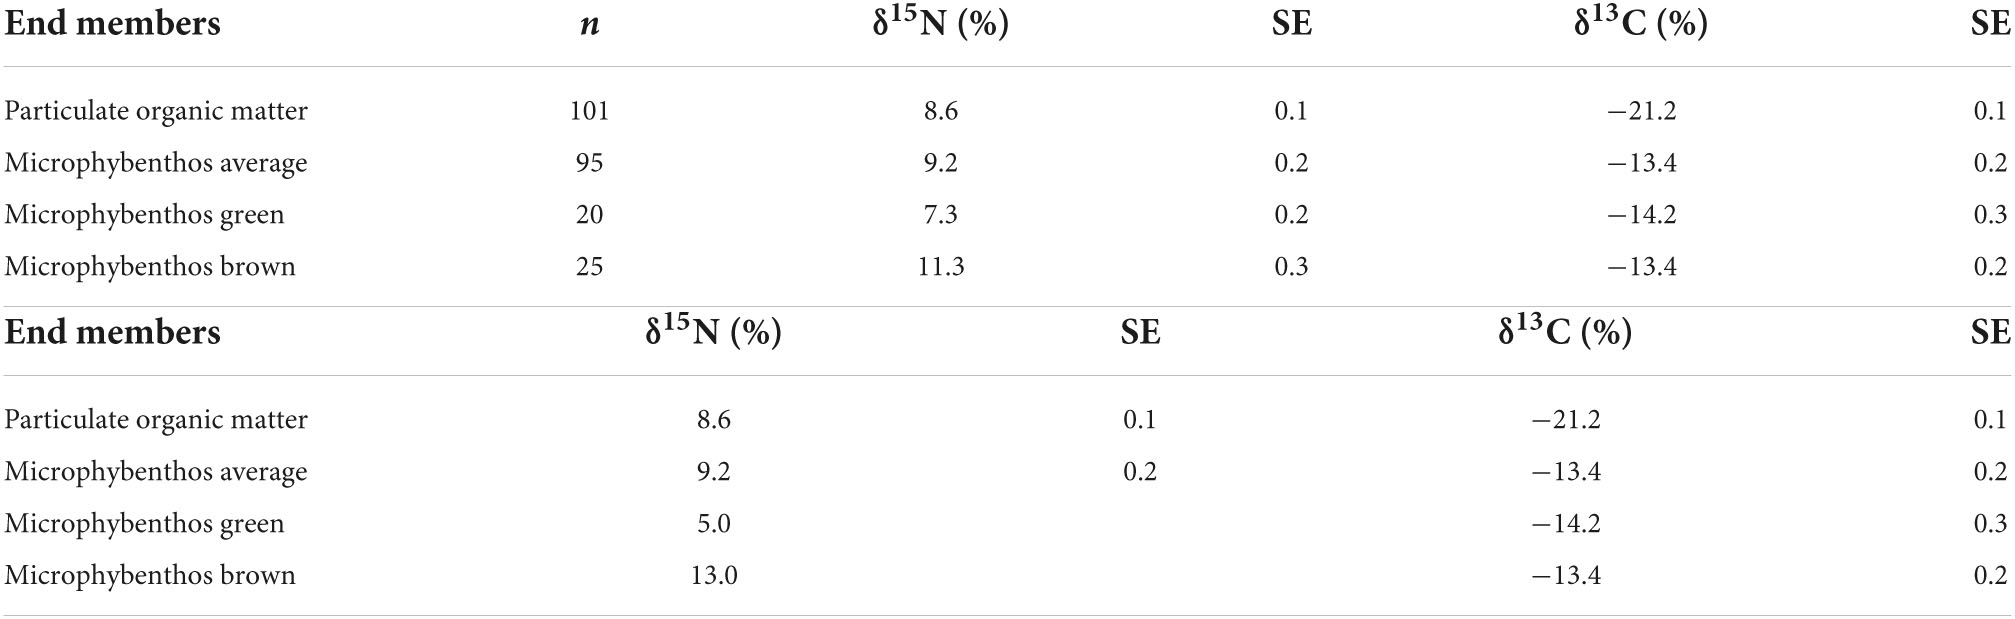
Table 2. Bulk δ15N and δ13C values for the end member values supporting the Dutch Wadden Sea benthic food web used for two and three source mixing models on species means.
Bulk δ13C and δ15N values and standard errors (SE) for the 28 species included in this study are listed in Table 1 and bulk δ13C and δ15N values and standard errors (SE) for resources identified as supporting the ecosystem are listed in Table 2a. We confirmed that bulk δ15N values were increased for samples taken from the Ems-Dollard region (eastern Dutch Wadden Sea) in comparison with other regions in the Dutch Wadden Sea and have now adjusted for this regionally observed increase in bulk δ15N values for filter feeders [−2.3‰; One-way ANOVA, F(2,43) = 6.8, p = 0.003; Supplementary Table 1]. Adjustment of δ15N values was identified as necessary in both M. edulis (blue mussel) and B. crenatus (acorn barnacle) from samples pooled into regional categories within the Wadden Sea (West < 5.5°E, East > 5.5°E, and Ems-Dollard associated with the mouth of the river Ems). Despite application of a regional adjustment, ranges for bulk δ13C and δ15N values remained large for consumers (Figures 1A,B) as well as for POM and MPB sampled from across the Dutch Wadden Sea (POM −15.4 to −21.7‰; 13.7 to 5.7‰ and MPB −10.4‰ to −16.2‰; 13.6 to 6.5‰).
Increased δ15NPhe values were observed for filter feeders sampled from Ems-Dollard in comparison with the rest of the Dutch Wadden Sea and values were adjusted in a similar manner as the bulk δ15N values [−2.1‰; One-way ANOVA, F(2,43) = 5.7, p = 0.006; Supplementary Table 1]. Values for δ15NPhe ranged from 6.6‰ observed for Ceramium vigatum (Red horn weed) to 11.7‰ for Liocarcinus holsatus (Flying crab) and mean values for species correspondingly increased with larger Glu-Phe differences reflecting the minor trophic increases expected for source amino acids (Table 1). δ15NGlu values ranged from 12.1‰ for Fucus vesiculosus (Bladderwrack) to 27.8‰ for Dicentrarchus labrax (European bass) and were higher than δ15NPhe values as expected for the larger fractionation associated with trophic amino acids. δ15N values for Glu and Phe were correlated across trophic levels (Pearson’s correlation coefficient; Figure 2; TL 1 R2 = 0.26 n = 24, p < 0.01; TL 2 R2 = 0.37 n = 166, p < 0.001; TL 3 R2 = 0.39 n = 96, p < 0.002; TL 4 R2 = 0.14 n = 34, p = 0.03), but the relationships were weaker for both TL 1 and TL 4 when compared to TL 2 and TL 3. The relationship between ΔGlu−Phe δ15N values and TPSCA −1 had a strong correlation (Figure 3; n = 337, R2 = 0.7, p < 0.001) with a slope of 4.9 ± 0.3‰ and an intercept of 4.3 ± 0.2‰ that reflect TDF and β, respectively, for the Dutch Wadden Sea benthic food web. These values for TDF and β are different than the canonical values of 7.6 and 3.4‰ found by Chikaraishi et al. (2009) and resulted in a slope of 0.99 for TL vs. TPSCA while using the canonical TDF and β resulted in a slope of 0.64 (both R2 = 0.72).
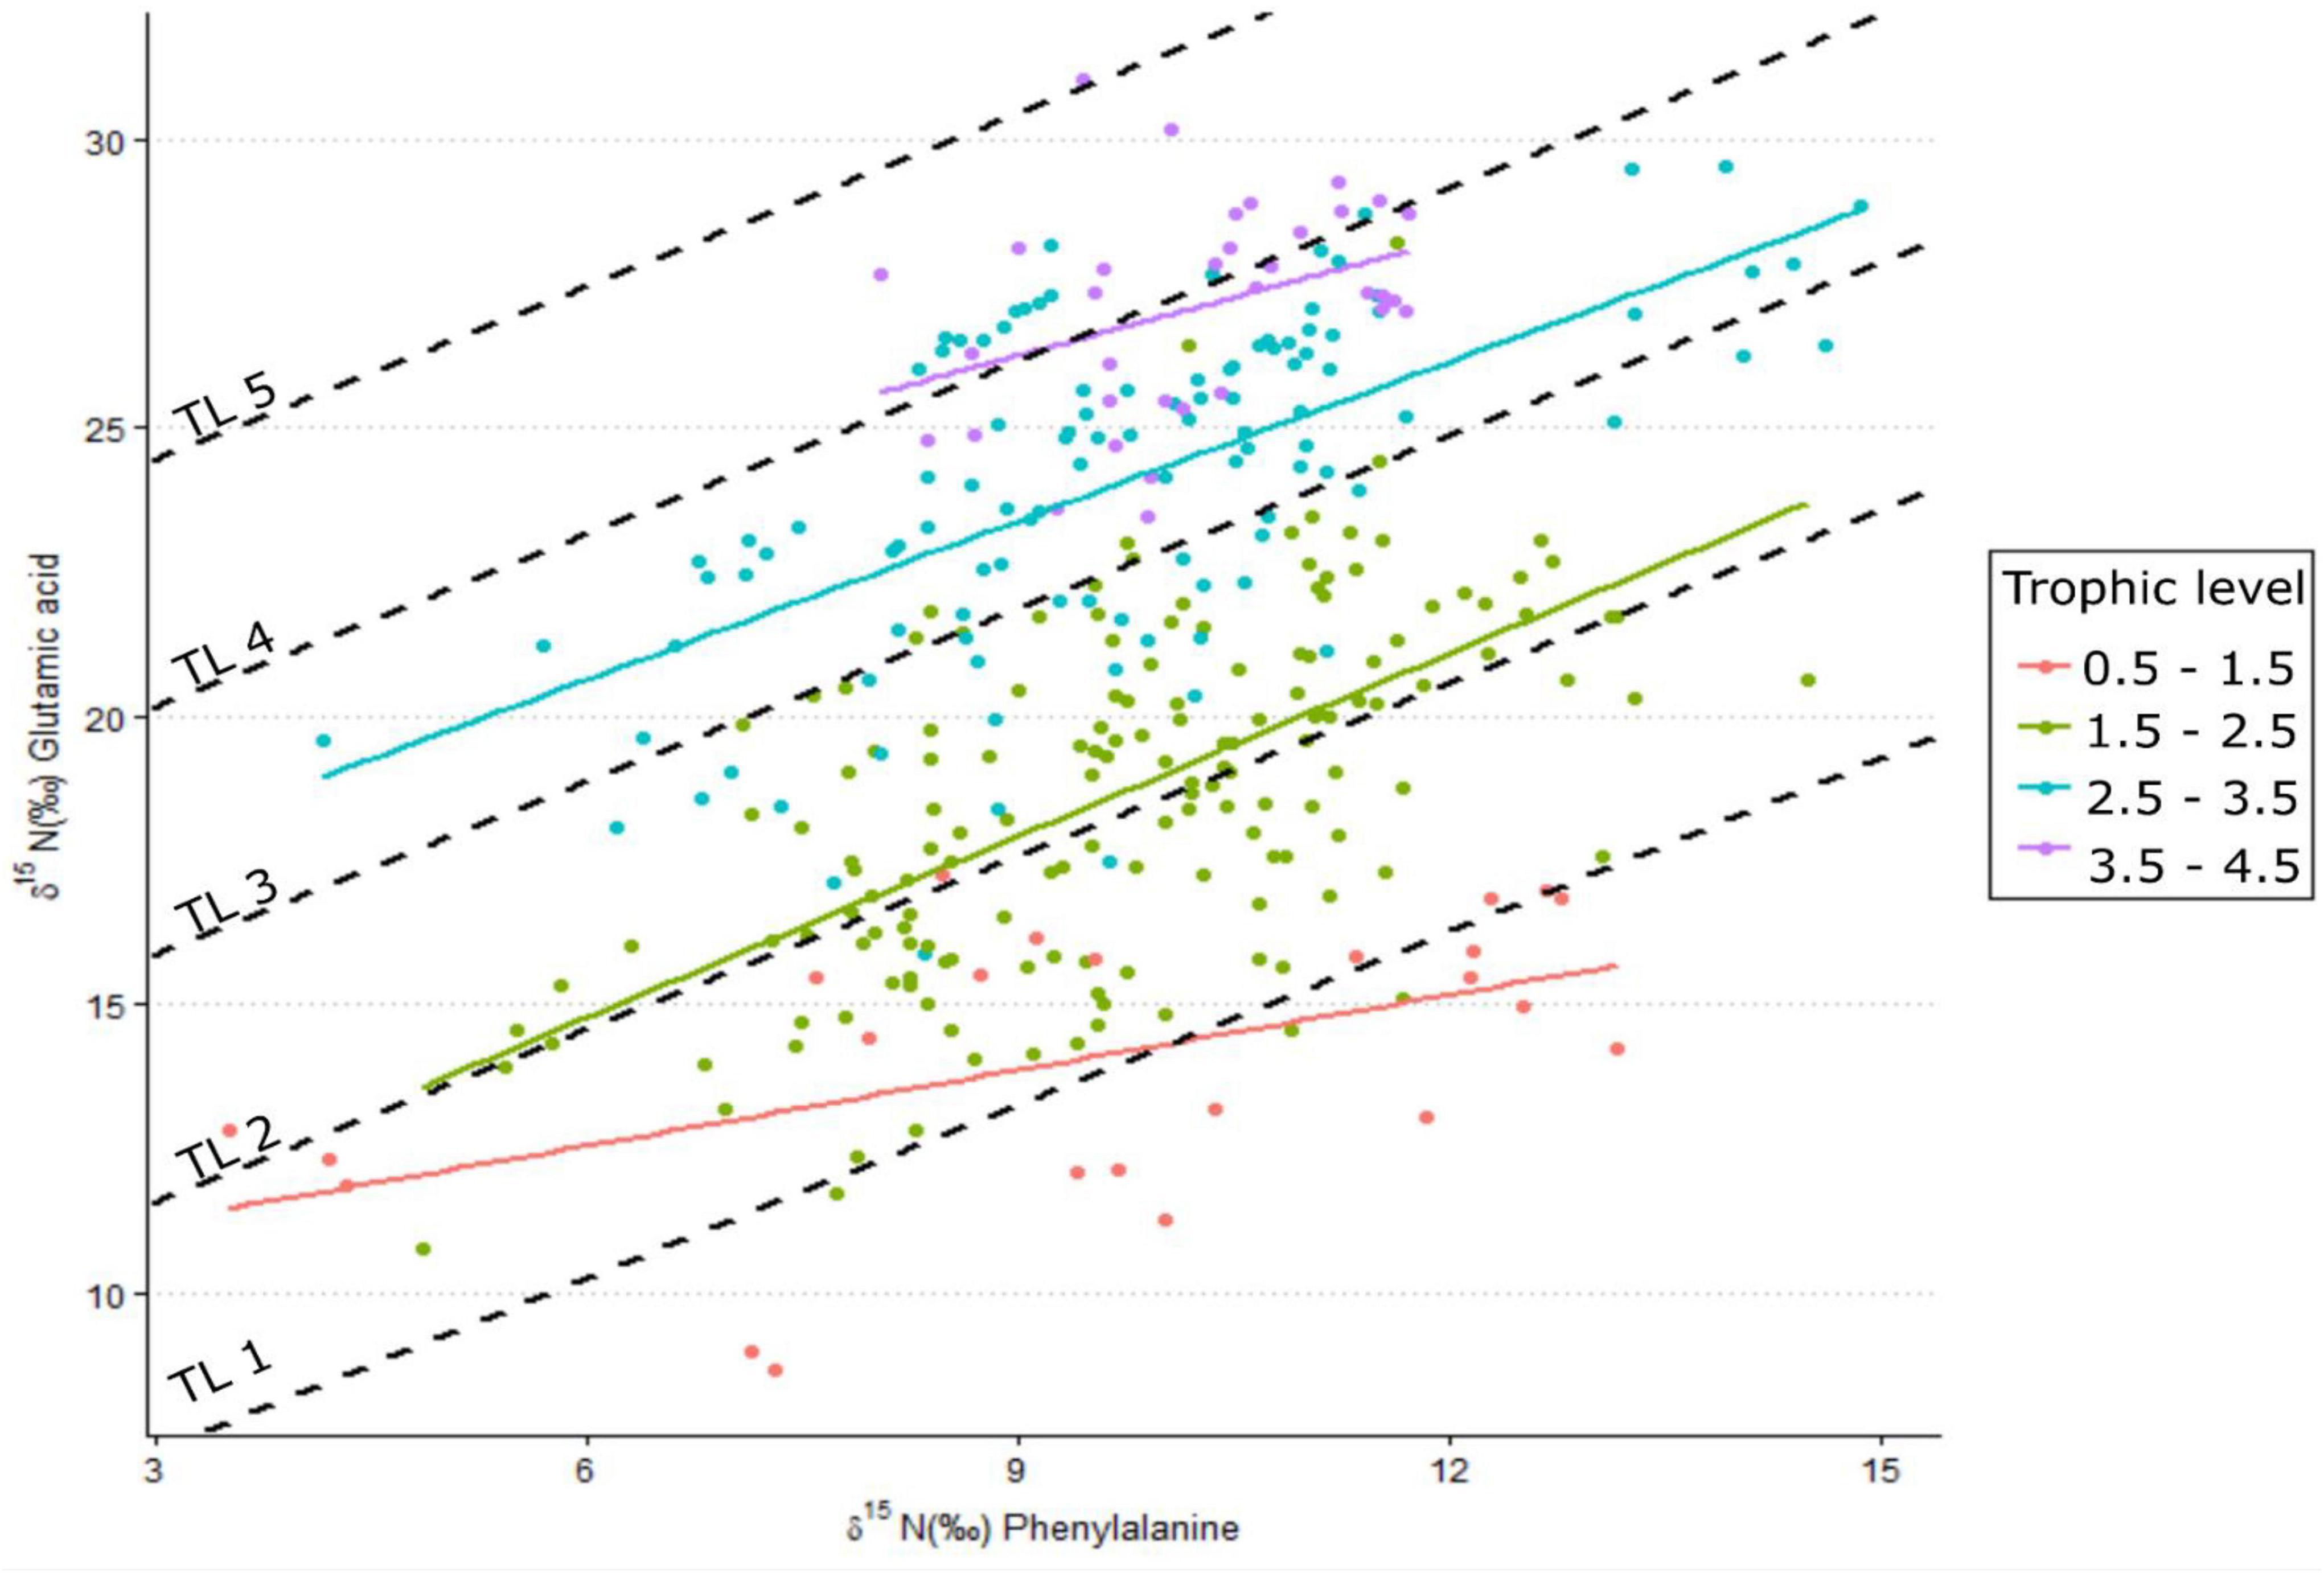
Figure 2. δ15N values for the amino acids glutamic acid and phenylalanine measured for species across different trophic levels. Dashed lines are expected linear relationships for trophic levels 1–5 using a trophic discrimination factor of 4.9% and a β of 4.3%, while colored linear regressions are trophic-level relationships by grouping trophic levels across species (n = 24–166).
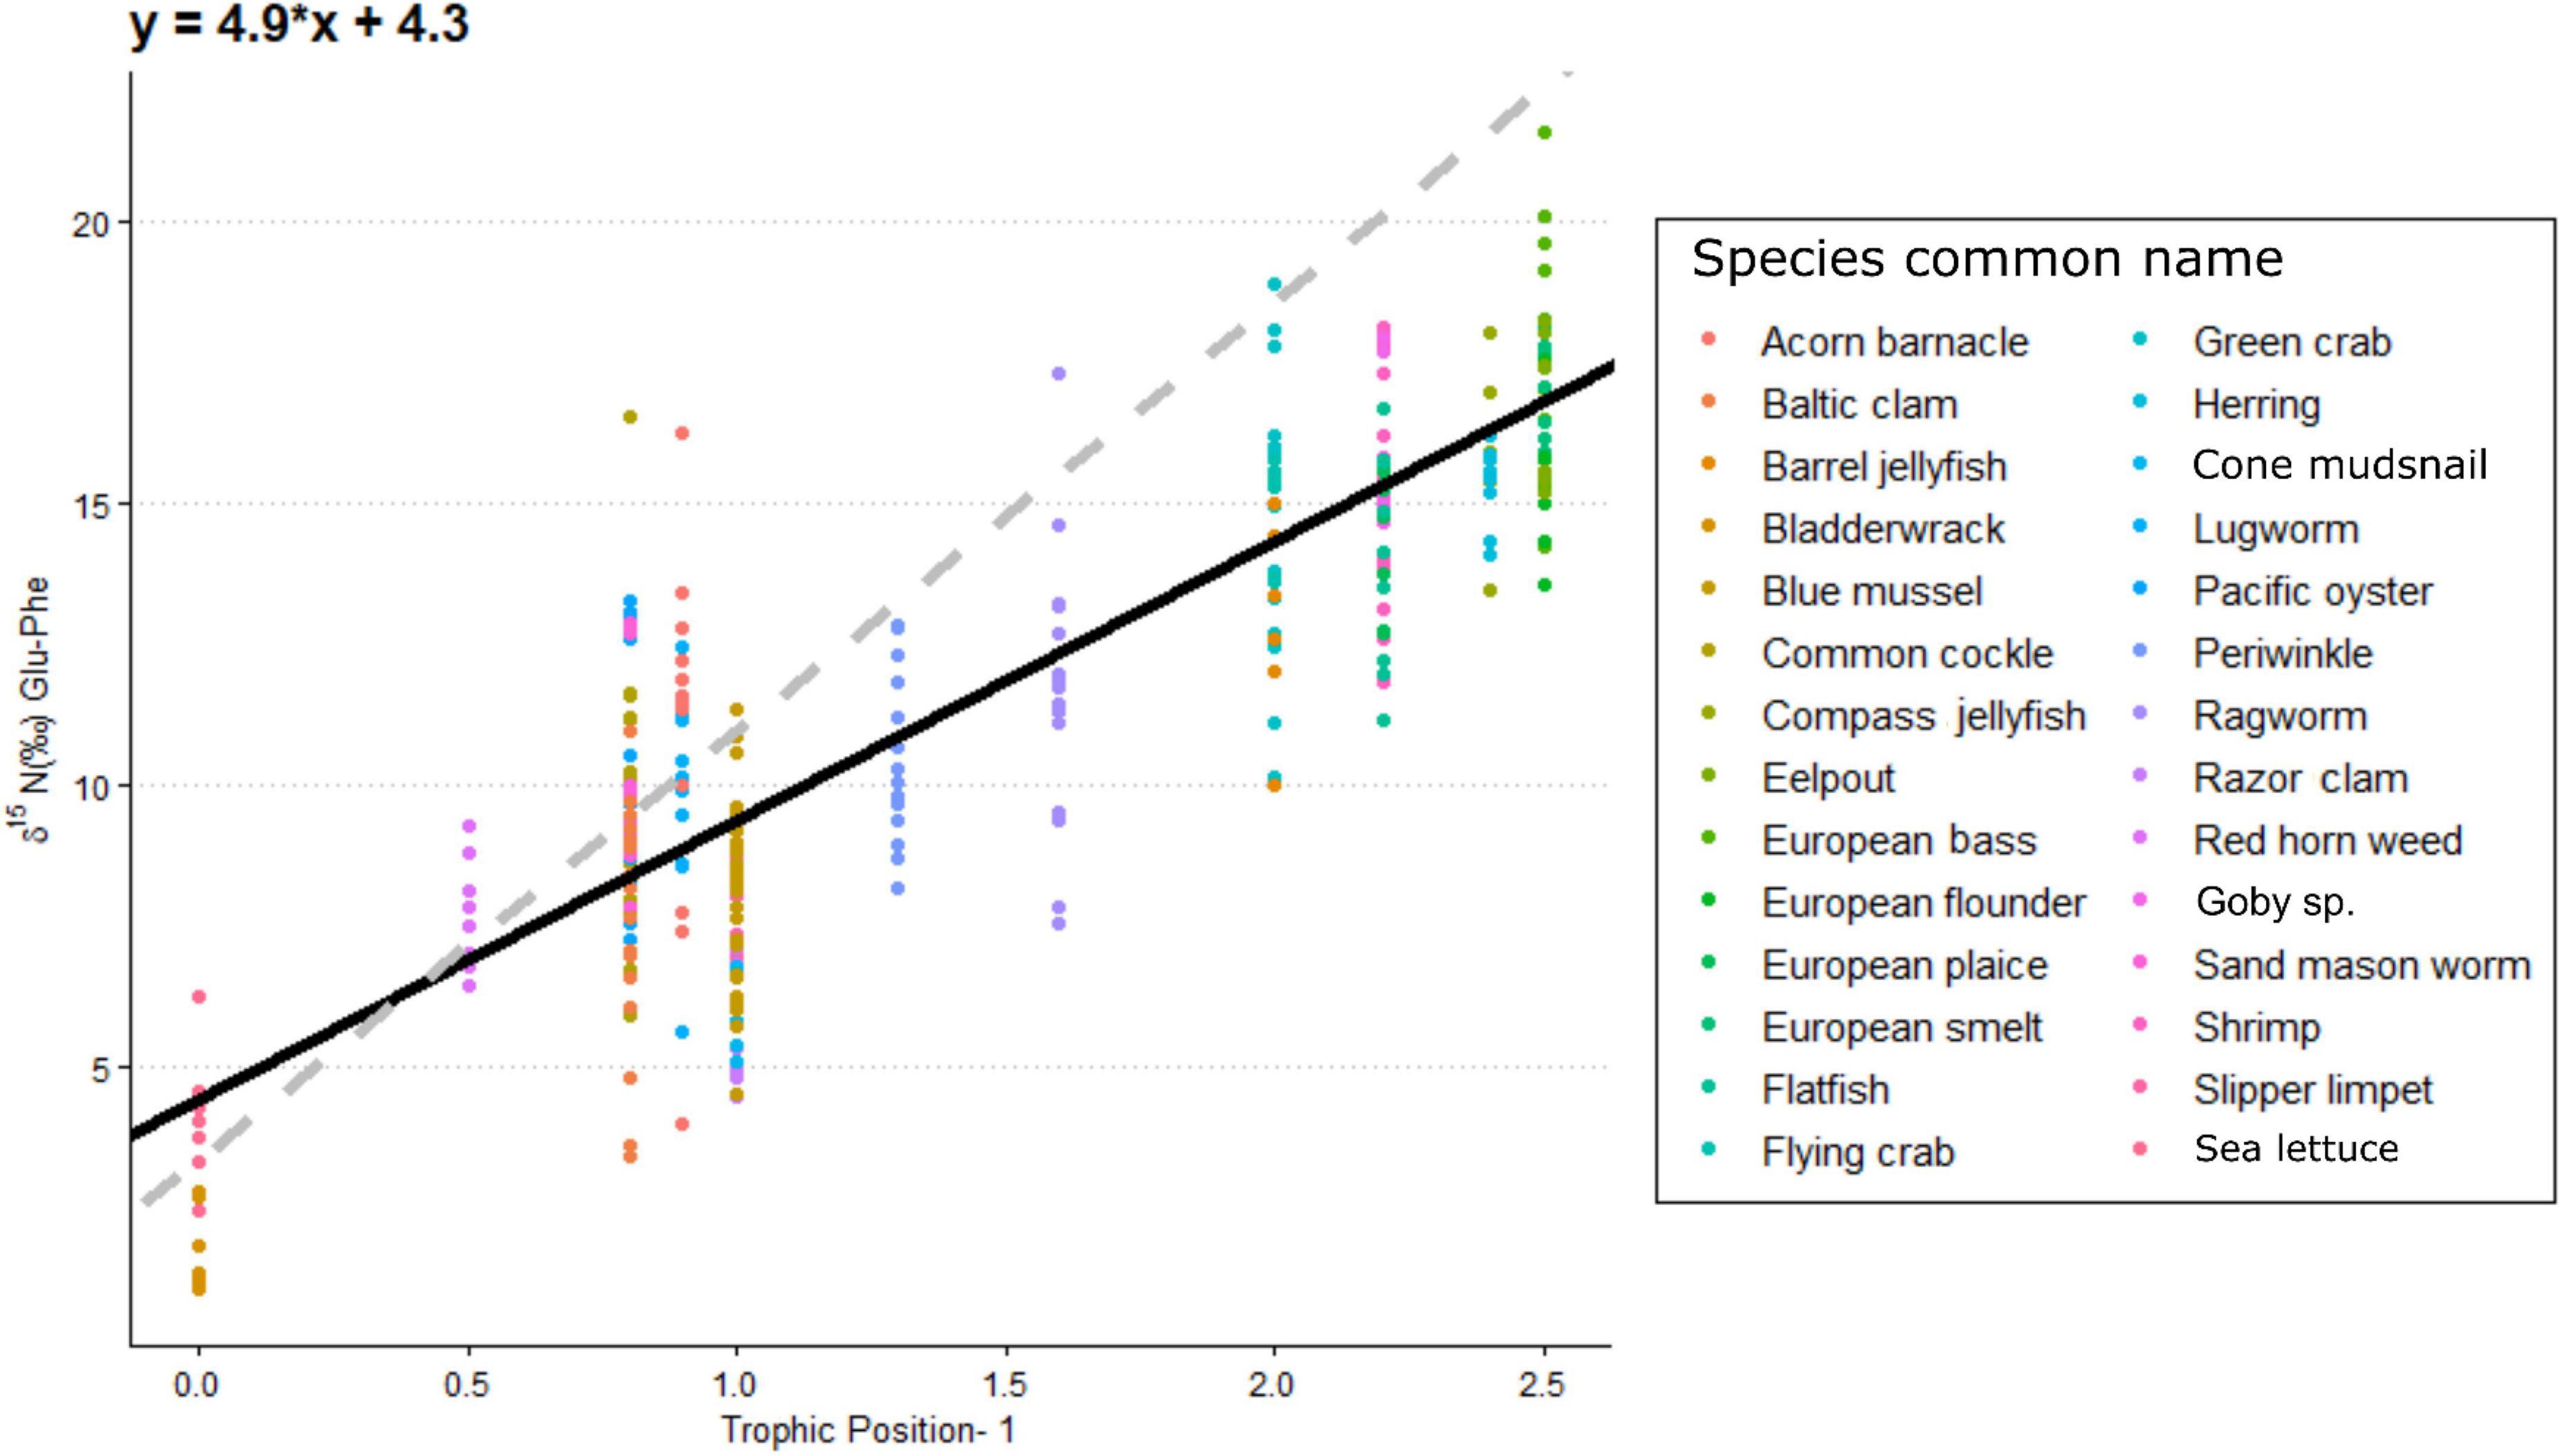
Figure 3. The per mil difference in δ15N value between glutamic acid and phenylalanine in relation to trophic levels for individual species minus one level to account for primary producers. The black line is the fitted linear regression across all species (r2 = 0.7, n = 337) with the equation presented at the top left of figure. The dashed gray line is the linear trophic level relationship using a slope of 7.6% and a β of 3.4% as presented in Chikaraishi et al. (2009).
Calculated trophic levels for primary producers ranged from 0.3 for Fucus vesiculosus (Bladderwrack) to 1.7 for C. rubrum (Figure 4). Primary consumers ranged from 1.2 for Ensis leii (Razor clam) to 2.3 for Littorina littorea (Periwinkle), secondary consumers from 2.6 for Hediste diversicolor (Ragworm) to 3.5 for Crangon crangon (shrimp) and tertiary consumers from 3.6 for Pomatoschistus sp. (Goby sp.) to 4 for D. labrax (European bass, Figure 4). No amino acid measurements were possible for POM or MPB as part of this study as the sample weights remaining after the initial bulk analysis between 2012 and 2015 were below detection limits for this analysis. Consumer δ13C values fell between the measured values for POM and MPB (−21.2 and −13.4‰). We therefore used the trophic level estimates calculated using system-specific TDF and β to account for fractionation while estimating values for δ13CBase and δ15NPhe–base.
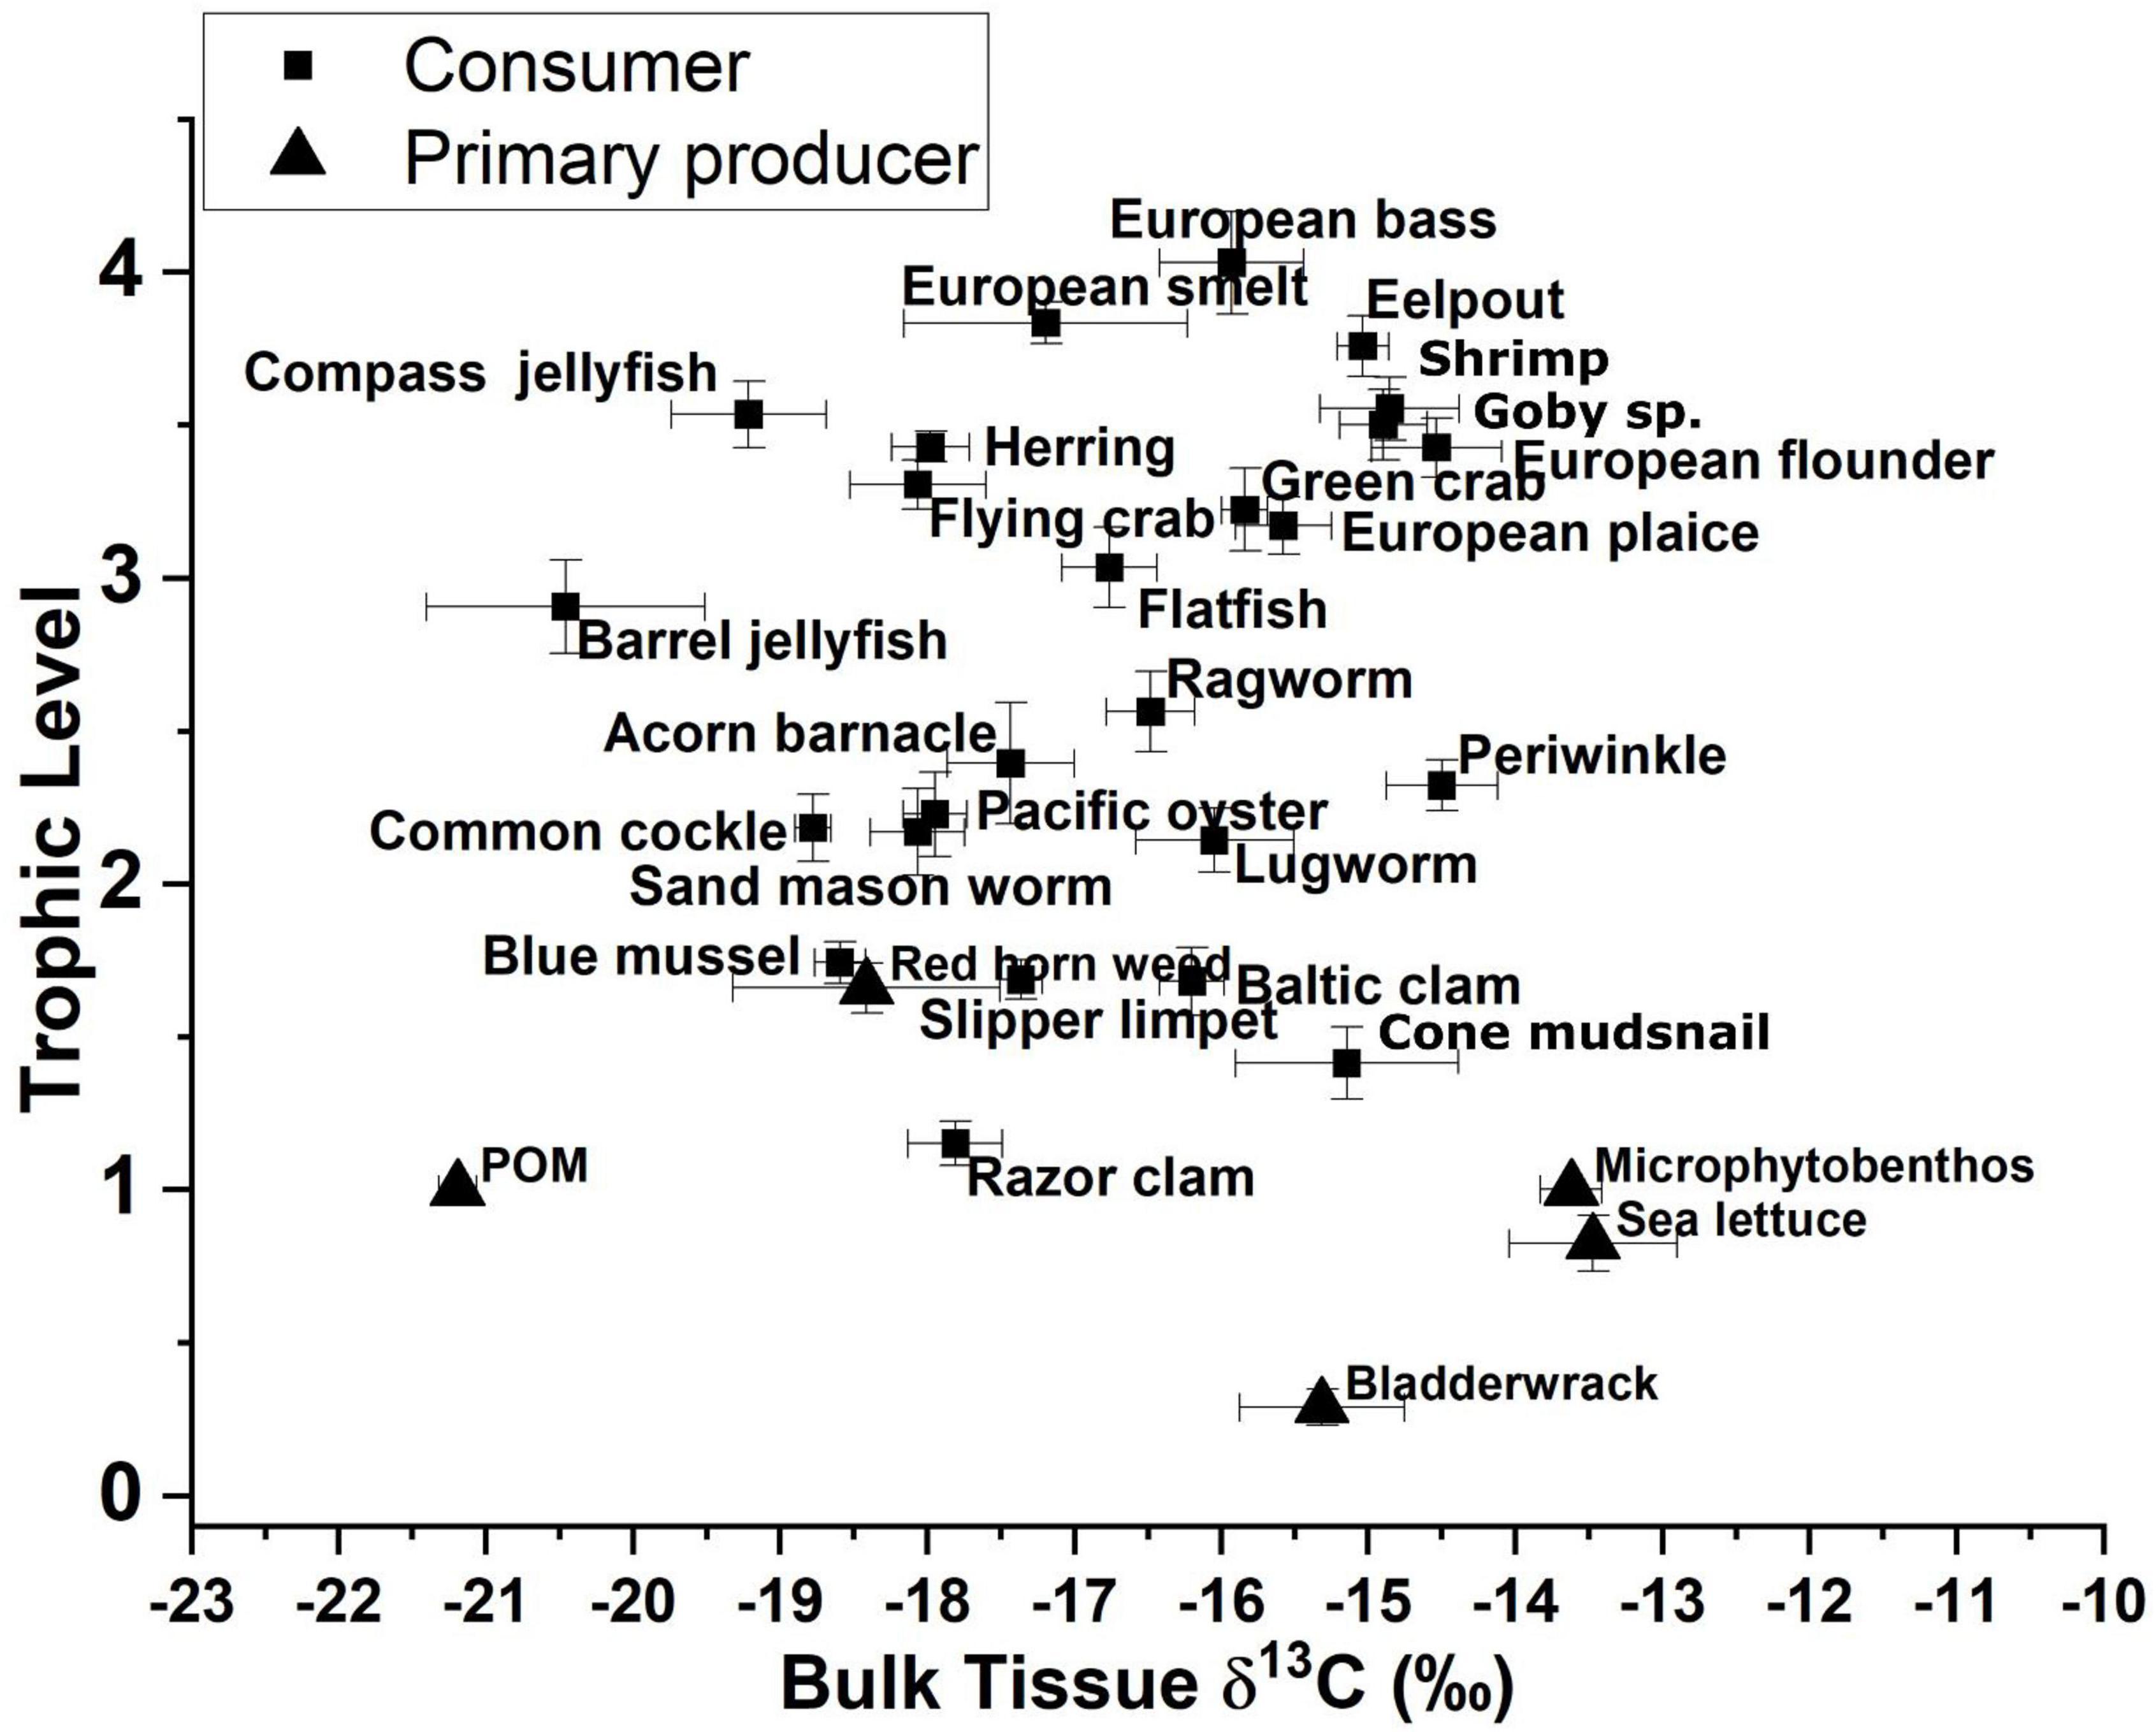
Figure 4. Trophic-level estimates from amino acid δ15N values for glutamic acid and phenylalanine vs. bulk δ13C values for both consumers and primary producers.
We then used δ13CBase values from POM and MPB (Table 2) and each consumer to calculate dietary contributions for species averages (Figure 5A) and for all individuals within each species. Dietary contributions from these two source mixing models are presented in Supplementary Table 2A and indicated use of POM (>0.5) for 11 of the 25 consumer species examined with the highest contribution being observed for Rhizostoma pulmo (Barrel jellyfish, 0.86 ± 0.09 and 0.76 ± 0.04). To further investigate the use of MPB within the ecosystem, we used δ13CBase and δ15NPhe–Base values from POM, MPBgreen, a proxy of freshly fixed MPB-derived material, and MPBbrown, a proxy of MPB-derived material using reworked N and OM associated with heterotrophic reworking of detrital OM and denitrification occurring across the tidal cycle (Table 2b), to calculate dietary contributions from species average values (Figure 5B). Similar to the two source models, dietary contribution from POM was considerable (>0.5) for 11 of the 25 consumer species with R. pulmo (Barrel jellyfish) having the highest contribution (0.78 ± 0.1). For the two MPB end members, dietary contribution of MPBgreen was considerable for six species with Pleuronectes platessa (European plaice) having the highest contribution (0.75 ± 0.1) and dietary contribution from MPBbrown was considerable for five species with Zoarces viviparus (Eelpout) having the highest contribution (0.57 ± 0.13). Dietary contributions from POM were > 0.5 for 10 species with Chrysaora hysoscella (Compass jellyfish) having the highest contribution (0.78 ± 0.04), while contributions for MPBgreen were lower with no species > 0.5, but with four species having a contribution of >0.4 with H. diversicolor (Ragworm) having the highest contribution (0.47 ± 0.05), and contributions for MPBbrown being > 0.5 for six species with Arenicola marina (Lugworm) having the highest contribution (0.67 ± 0.05). Both two-source and three-source mixing models indicated good agreement between the use of POM with a correlation between the models using species averages and individual values of 0.88 and 0.89, respectively (R2, Figure 5C).
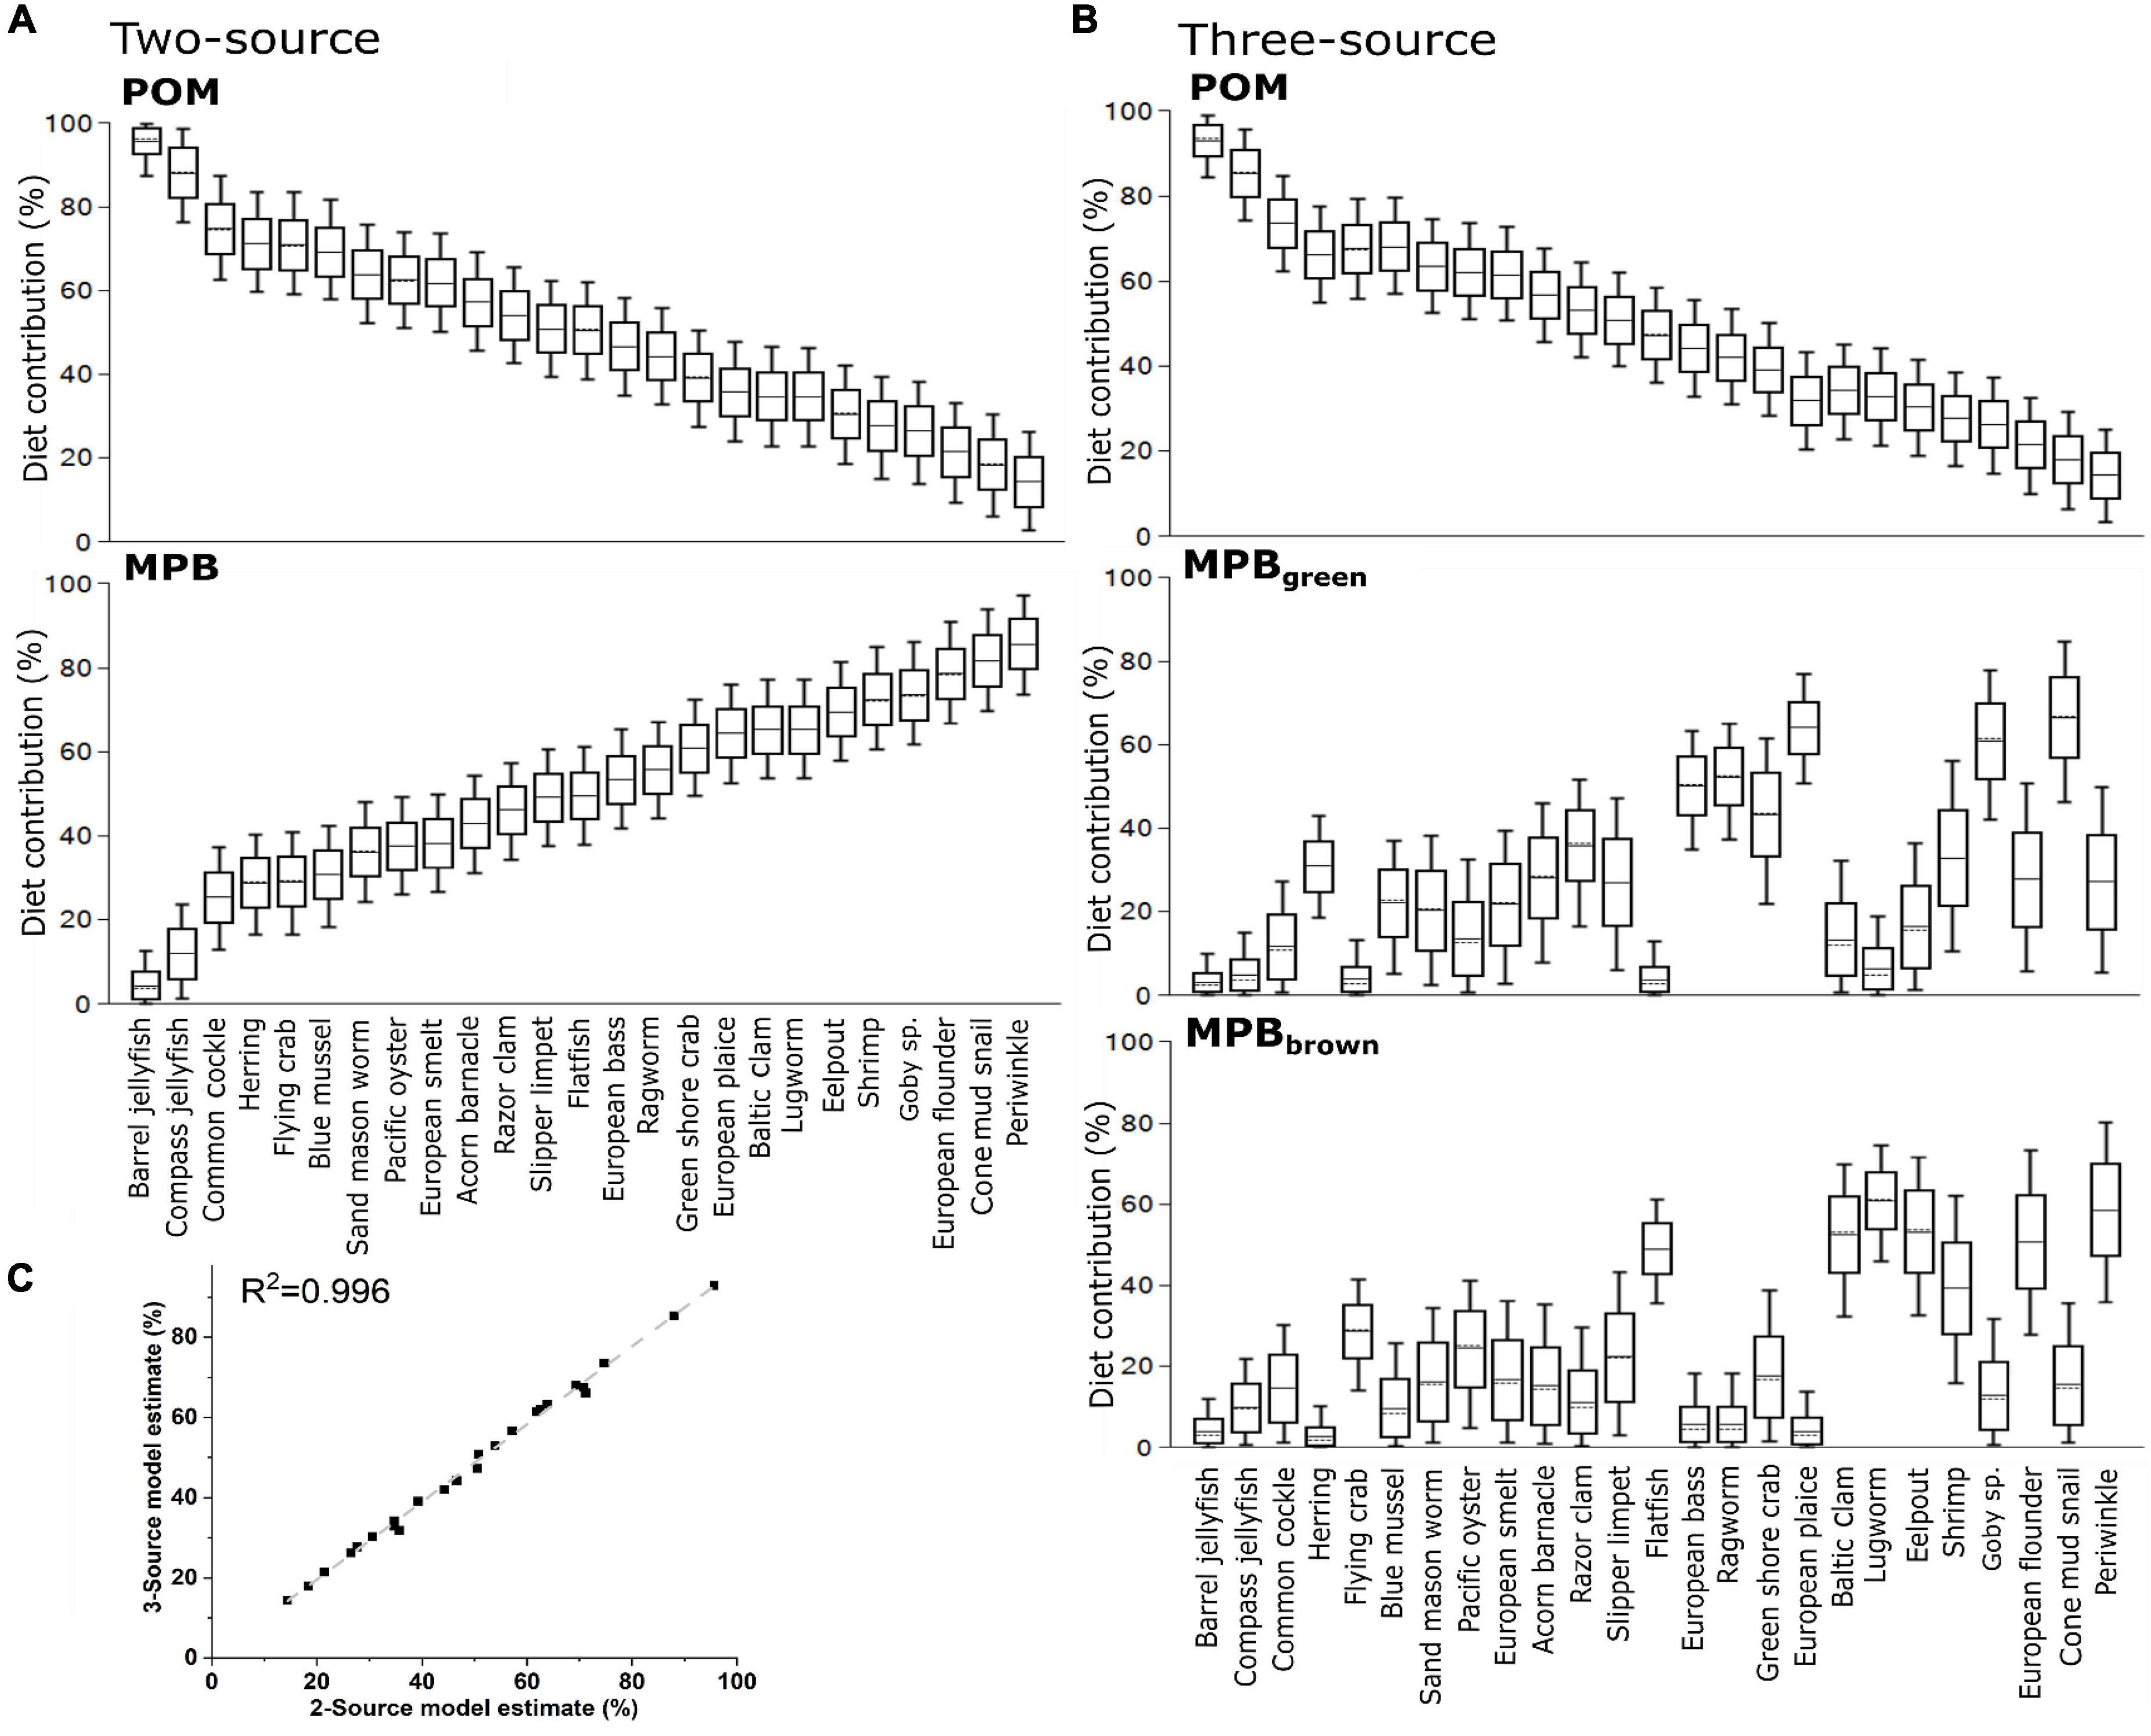
Figure 5. Estimated dietary contributions from primary producers using (A) a two source mixing model using only δ13C and mean values for each species and (B) a three source mixing model using both δ13C and δ15NPhe–Base and mean values for each species and (C) the correlations between two and three source mixing models when applied to means values and individuals for each species. Trophic structure has been accounted for in both models using trophic-level estimates from amino acid analysis of δ15N.
In the Dutch Wadden Sea, we found that using amino acid δ15N values allowed for more detailed and reliable identification of the trophic structure of the benthic food web than possible in previous work using solely bulk isotope methodologies. This improvement allowed for the identification of a subset of species that rely on microbially reworked materials supported through active tidal pumping. Across all four simple and complex SIMMs, mean consumer reliance on MPB was 0.55–0.6, but fell short of the 0.7 previously assessed (Christianen et al., 2017). This smaller contribution from MPB is likely due to the combined use of δ13C and δ15N values to assess resource contributions instead of using consumer integrators as a proxy for MPB resource values (Post, 2002). Additionally, analysis of individual amino acid δ15N values allowed for trophic adjustment of δ13C and δ15N values to account for trophic discrimination for the 25 benthic consumer species prior to analysis with SIMMs. Through the application of source amino acids, we were able to construct a trophic structure within the Dutch Wadden Sea despite the considerable underlying variability present in bulk δ15N values across the area (Figure 1A). This variability was potentially caused by widespread biogeochemical processing in porewaters unique to regions of intense tidal flushing within intertidal sands (e.g., denitrification). Analysis of trophic and source amino acid δ15N values allowed for the development and application of a system-specific TDF and β to determine the trophic structure of the Wadden Sea benthic food web that was previously impossible using solely bulk isotopic techniques.
We confirm that MPB is a major source of productivity that widely supports the food web in the Dutch Wadden Sea (Christianen et al., 2017). The majority of consumers examined here (21 out of 25 consumer species) have δ13C values higher than −18‰, indicating reliance on a resource with a higher value than POM (−21.2 ± 0.2‰; n = 101). MPB (−13.4 ± 0.2‰; n = 95) is a widely available resource across the Dutch Wadden Sea (Figure 1B) with variable δ13C values indicating the use of both dissolved inorganic carbon (DIC) from the overlying water column and remineralized organic matter from porewater DIC. Due to the sandy nature of the sediment and extensive tidal pumping that occurs in the basin, benthic-associated MPB, primarily pennate diatoms (Scholz and Liebezeit, 2012) are widely available to consumers during diel inundation and exposure. Other potential candidate resources available to consumers include sediment organic matter, terrestrial input, macroalgae, or seagrasses, but are unlikely to play a significant role in supporting production. Sediment organic matter (−21.8 ± 0.3‰; n = 117) and terrestrial inputs [−27‰ (Middelburg and Herman, 2007) and −23‰ (Jung et al., 2019)] have lower δ13C values than POM and therefore cannot contribute to explain the higher values widely observed across consumers in the Dutch Wadden Sea. Green macroalgae such as Ulva sp. (Sea lettuce; −13.5 ± 0.6‰, n = 8) have a higher value that could meaningfully contribute but are spatially limited due to their need for hard anchoring points such as exposed rocks within the larger landscape of mud and sand. This limited distribution constrains the amount of contribution from this resource as blooms of Ulva or so-called green tides (Charlier et al., 2008) did not occur in the period between 2011 and 2014 in the Dutch Wadden Sea. This makes Ulva sp. an unlikely resource to support more than half of the food web. Similarly, seagrasses have previously occurred extensively in the Wadden Sea, but due to their current extremely limited spatial ranges in the German and Danish Wadden Sea (Folmer et al., 2016) are unlikely to be a large source of productivity supporting consumers in the Dutch Wadden Sea.
Further examination of MPB as a resource reveals substantial variability in δ15N values ranging from 7.3 to 11.3‰ when grouping the minimum and maximum measurements taken from across the study site (Table 2a; MPBgreen and MPBbrown). This variability could potentially reflect the input from an unaccounted resource or a biogeochemical process that is occurring across the basin. Although freshwater input from terrestrial sources has a δ15N of 10–14‰ (Jung et al., 2019), the limited inputs to the Wadden Sea and δ13C value of −23‰ indicate at best a regionally confined contribution to the ecosystem. Another possible unaccounted source includes submarine groundwater discharge, which due to the relatively porous nature of the sandy sediment in the Wadden Sea basin could contribute reworked N with higher δ15N values to the benthos. Previous work has identified freshwater groundwater discharge as a minor input (Santos et al., 2015) that is unlikely to have a basin wide impact. However, this work did confirm considerable porewater exchange resulting in efflux of waters with higher total dissolved nitrogen and lower dissolved oxygen saturation as tidal exchange flushes previously isolated porewaters that have accumulated products from remineralization. Porewater exchange across the sediment surface during tidal flushing resulted in porewater total dissolved nitrogen that decreased with depth that is expected with efflux into the overlying water column. Tidal pumping through permeable sands (Marchant et al., 2018) is a potentially region-wide process providing nutrients that have undergone considerable denitrification that may provide substrate pools in porewaters with increased δ15N values that then support MPB production within the Wadden Sea. Increased δ15N values are most apparent in the Ems-Dollard region and required adjustment for both bulk δ15N and δ15NPhe–Base values (Supplementary Table 1). Despite this adjustment within the wider data set, there remains considerable variability in δ15N values (Figure 1A) across the basin that has made identifying a trophic structure using bulk δ15N values alone difficult without a method to integrate underlying shifts in baseline δ15N values across the Dutch Wadden Sea.
The TDF value from analysis of the difference between Glu and Phe throughout the food web is lower in this study than the most often applied canonical value (4.9‰ compared to 7.6‰) (Chikaraishi et al., 2009); as has been previously observed in multiple studies (McMahon and McCarthy, 2016; Hebert et al., 2016; Lemons et al., 2020; Nuche-Pascual et al., 2021). The lower TDF value reflects an ecosystem-wide application to species ranging from macroalgae to teleosts, and represents a compromise between the use of a single canonical TDF (Chikaraishi et al., 2009; Kato et al., 2021; Vokhshoori et al., 2021), application of multiple species-specific TDFs as determined by feeding studies (28×, 1 per species) or feeding group-dependent strategies based on the relative diet vs. tissue quality comparisons (McMahon et al., 2015b; McMahon and McCarthy, 2016; Bode et al., 2021; Le-Alvarado et al., 2021). Using wild caught animals across an entire ecosystem to derive a system-wide TDF, we relied on measured variations in the difference between Glu and Phe between individuals in each species sampling to estimate the TDF value that was then applied to estimate the trophic structure within the ecosystem. To this end, we combined trophic position estimates of teleosts from FishBase (Froese and Pauly, 2000), literature values for trophic position of invertebrate species (Christianen et al., 2015) and measured δ15NGlu–Phe values for primary producers to ensure representation across the food web and found a TDF that is broadly comparable to one developed using solely marine teleosts (5.7‰). Application of a system-specific TDF was possible here due to the relatively large number of replicates for each species examined across the food web. Developing the TDF was necessary due to the presence of a large number of species for which no controlled feeding studies have been performed where the stable isotope composition of amino acids have been analyzed (e.g., a wide range of benthic invertebrates).
Application of δ15N values from amino acids allows for the integration of underlying variability in N sources when characterizing the trophic relationships within the benthic community. The large range observed for δ15NPhe-Base (Figure 1C) in consumers further confirms that use of N with a high δ15N value is not regionally confined and occurs across the basin. In contrast, variability in the δ13CBase values is more regionally confined, likely indicating the widespread use of MPB-derived carbon that is more consistently available across the basin and therefore less variable. These contrasting patterns and wide range of δ15N values observed across the MPB sampling support splitting of the MPB end member into two distinct resources: (1) MPBgreen which reflects newly fixed organic matter from MPB supported by dissolved inorganic C (DIC) and N substrates from the overlying water column and (2) MPBbrown which reflects newly fixed organic matter from MPB supported from bacterially reworked C and N substrates provided from porewater associated materials (Table 2a). Furthermore, δ15NPhe–Base values for a subset of the measured individuals of Peringia ulvae (Cone mudsnail; 5.6 ± 0.2‰; n = 3 vs. 8.2 ± 0.7‰; n = 10) indicated the individual specialization on a specific resource in a species previously used as an end member proxy for MPB (Christianen et al., 2017) while Littorina littorea (Periwinkle; 9.8 ± 0.2‰; n = 17; Table 1) had a substantially higher δ15NPhe–Base value despite similar use of MPB between these two species indicated by the two source mixing model (Figure 5A; 71 and 82%, respectively). A 5‰ difference between source amino acid δ15N values between two primary consumers using similar amounts of MPB-derived carbon further confirms the substantial variation in MPB-δ15N values due to availability of porewaters that have been impacted by denitrification. This difference warranted further examination using three-source mixing models with two distinct MPB sources after adjustment for trophic position indicated using the ecosystem-dependent TDF from amino acid δ15N values.
Food webs are often split into herbivory (green) and detrital (brown) pathways depending on whether newly fixed productivity or detrital reworking are the predominate basal resource supporting them (Odum, 1969; Middelburg, 2014). These are often not clear-cut distinctions, but rather a spectrum of resource use split between multiple sources depending on the diet of each individual species. Application of the three source mixing models (Figure 5B) reveals separation between species groups that use the MPBgreen and the MPBbrown resources. Species using MPBgreen include Carcinus maenas (Green crab), Pomatoschistus sp. (Goby sp.), P. platessa (European plaice), and P. ulvae (Cone mudsnail), indicating reliance on newly fixed MPB-derived organic matter supported from the overlying water column (DIC and available N). Species using MPBbrown include M. baltica (Baltic clam), A. marina (Lugworm), L. littorea (Periwinkle), C. crangon (Shrimp), Z. vivparus (Eelpout), Platicthys flesus (European flounder), and Solea solea (Sole) indicating reliance on MPB-derived organic matter supported-off of microbially reworked N substrates that are readily available due to tidal pumping (Figure 6). The separation observed between these two groups of species appears to be along the boundaries of green vs. brown food webs (Evans-White and Halvorson, 2017; Cordone et al., 2020), where green food webs are directly supported by newly fixed OM from primary producers and brown food webs have detrital and microbial support through the breakdown, processing, and reuse of organic matter through an efficient microbial loop (Azam et al., 1983; Fenchel, 2008). The re-entry and reuse of detrital products (MPBbrown) in this system appear to be mediated by MPB and may reflect either (1) support of live MPB using reworked nutrients and porewater DIC or (2) the direct use of reworked dead MPB-derived organic matter by deposit feeders. MPB samples in this study required migration across a permeable filter pressed against the sand so both MPBgreen and MPBbrown end members reflect live-sampled MPB.
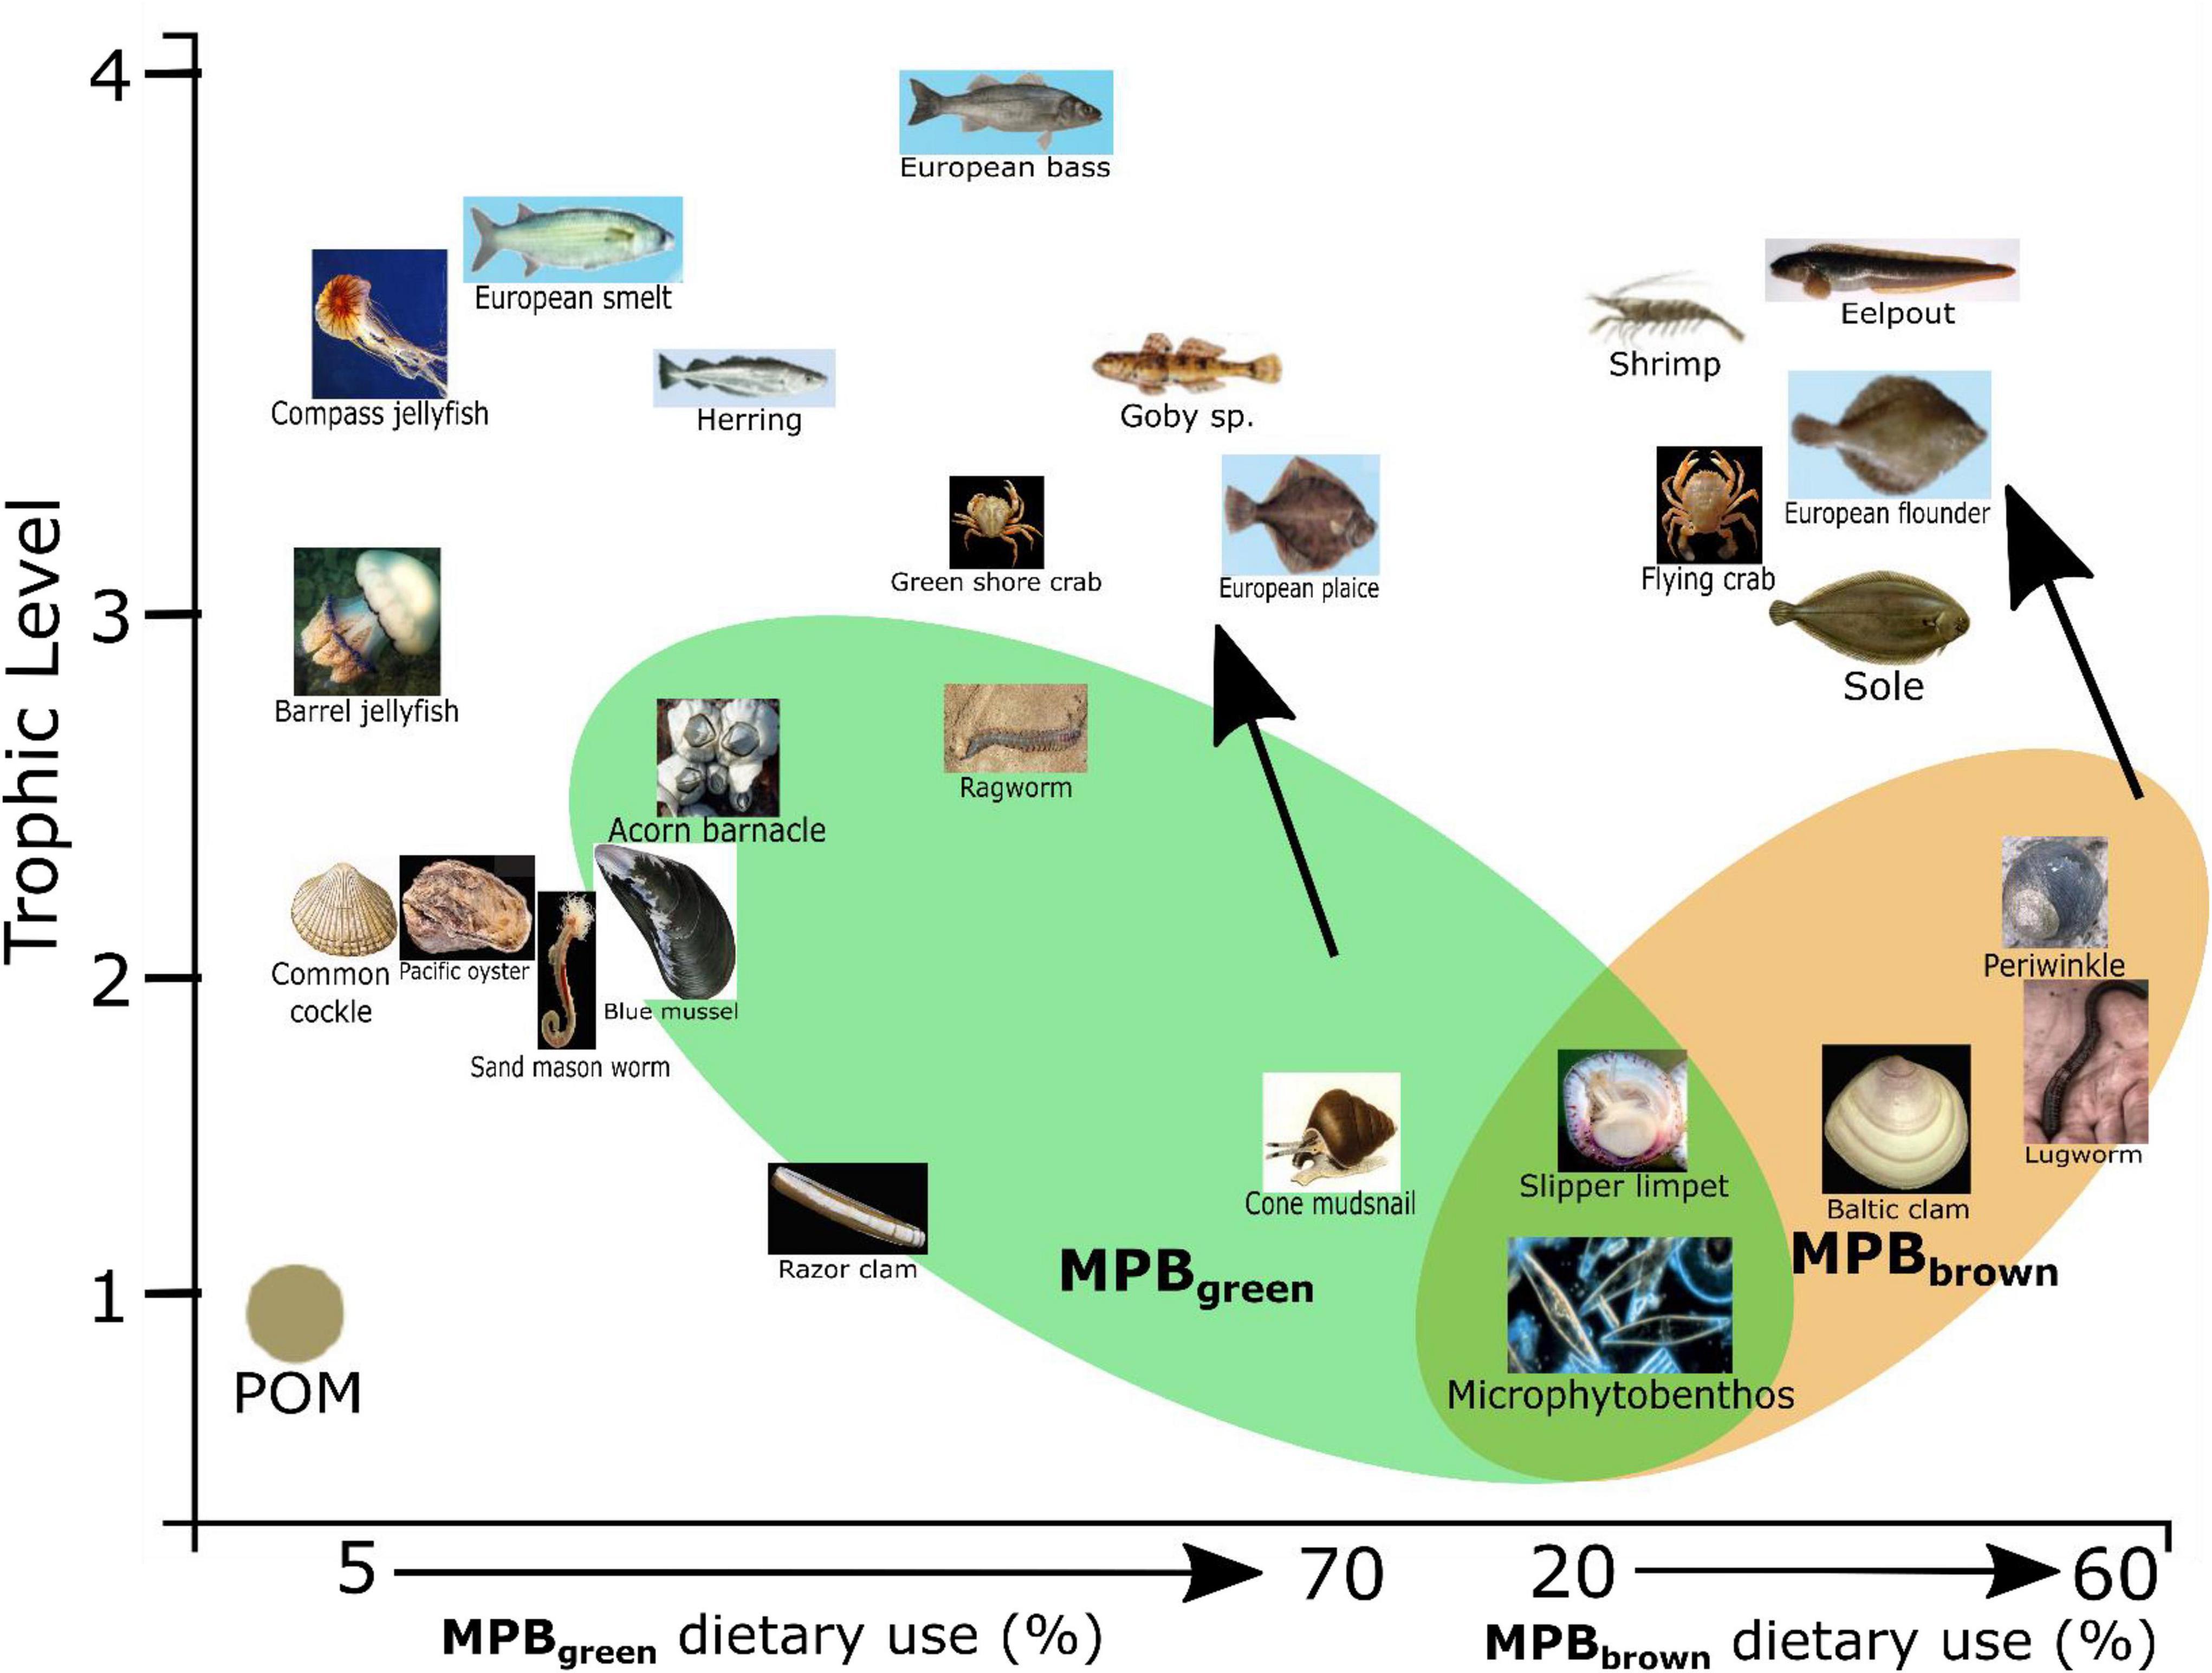
Figure 6. Conceptual diagram indicating increased use of microphytobenthos-derived matter from either reworked material (MPBBrown) or newly produced material (MPBgreen) as use of particulate organic matter (POM) decreases. Photograph credits: Henk Heesen, Ales Kladnik, Francesca Crippa, Hans Hillewaert, Matthisas Buschmann, Sytske Dijksen, and Gordon Taylor.
The large variability for both bulk δ13C and δ15N values found in the MPB end members points to the need for further investigation into how MPB are supported across the tidal cycle as well as better characterization for all primary producers using compound-specific techniques (PLFAs, AA-C, and AA-N) within the Wadden Sea. Partitioning support from MPB throughout the food web into green and brown pathways highlights that each individual resource in this shallow system (POM, MPB) likely has multiple forms due to the shallow nature of the basin as green and brown food webs interact and exchange materials (Krumins et al., 2013). The various forms of organic matter reflect the stages of processing that have occurred: (1) direct initial use of phytoplankton (green POM), (2) deposition and partial reworking of phytoplankton that are resuspended and used (brown POM/SOM), (3) direct uptake of water column N and DIC (MPBgreen), (4) use of reworked nutrients and porewater DIC (MPBbrown), or (5) direct use of detrital MPB biomass (MPBbrown). Environmental bulk isotope samples can often have quite variable values, but this variance likely represents inputs from a variety of resource pools and the combined application of other compound-specific techniques may be able to contribute to teasing apart individual contributions from these pools.
Due to the diversification of MPB resources, there is support of two distinct food web pathways in the Dutch Wadden Sea for MPB-derived resources as indicated by the three source mixing models (Figures 5B, 6): newly fixed production from the overlying water column (MPBgreen) and use of microbially reworked substrates from porewaters (MPBbrown). This resource diversification likely contributes to the outstanding productivity that has been observed within the Wadden Sea. Specialization on the two different MPB types allows for further feeding niche differentiation beyond the classic model of deposit and surface/particulate feeders through identification of MPB specialist consumers that predominantly rely on either newly fixed or reworked MPB-derived organic matter. This specialization likely reduces competition between feeding types in a highly productive ecosystem and reflects efficient use of not only newly fixed organic matter but also efficient use of reworked OM as either direct uptake or through nutrient and DIC support of MPB through tidal pumping.
Compound-specific analysis of amino acid nitrogen allowed for further identification and adjustment for underlying baseline shifts in δ15N values within the Dutch Wadden Sea that were not possible using solely bulk stable isotope methods. The resulting regional adjustments allowed for the development and application of a system-specific TDF that could then successfully be applied to estimate the trophic level of 28 species within the food web. Further application of SIMMs confirmed the dominant support of the food web by MPB (2-source models) and identified biogeochemical pathways supporting MPB along separate green and brown pathways (3-source models). This subsidy of nutrients derived from microbial processing in permeable sands may account for some of the exceptional productivity supporting the Wadden Sea fishery and seabird populations. Separate support of MPB between newly fixed and reworked organic matter showcases that diatom connectivity with underlying porewaters needs to be further considered in food web studies examining the considerable productivity that occurs within intertidal ecosystems.
The original contributions presented in this study are included in the article/Supplementary material, further inquiries can be directed to the corresponding author. The data is available at data.4tu.nl, the amino acid data is available at doi: 10.4121/21207470, and bulk carbon and nitrogen data are available at doi: 10.4121/21213113.
This study used animals previously obtained as part of the SIBES and NIOZ Fyke projects in 2011 to 2014, so no further ethical approval was needed for samples associated with this study.
PR, SH, HV, and MM contributed to conception and design of the study. SH, HV, and TH contributed to sample design and collection of the samples through the SIBES and Waddensleutels projects that support this study. PR and SH organized the databases. PR performed the statistical analysis and wrote the first draft of the manuscript. All authors contributed to manuscript revision and read and approved the submitted version.
This study was carried out as part of the project “Waddensleutels” funded by “Waddenfonds” (WF203930). SIBES-monitoring was financially supported by NAM, NWO-ALW (ZKO program), and Royal NIOZ. This study also had support from the UU-NIOZ project “Using Isotopic Indicators” (NZ4543.13).
For sampling the food web, we thank the crew of RV Navicula and the volunteers, staff, and students in the field. We also thank Kevin Donkers, Ronald van Bommel, Jort Ossebaar, Monique Verweij, Anchelique Mets, Elisabeth Svensson, and Thomas Leerink (NIOZ) for technical assistance in both bulk and compound-specific stable isotope analyses.
The authors declare that the research was conducted in the absence of any commercial or financial relationships that could be construed as a potential conflict of interest.
All claims expressed in this article are solely those of the authors and do not necessarily represent those of their affiliated organizations, or those of the publisher, the editors and the reviewers. Any product that may be evaluated in this article, or claim that may be made by its manufacturer, is not guaranteed or endorsed by the publisher.
The Supplementary Material for this article can be found online at: https://www.frontiersin.org/articles/10.3389/fevo.2022.951047/full#supplementary-material
Androuin, T., Dubois, S. F., Decottignies, P., Pelleter, E., and Carlier, A. (2019). The dark side of soft tissues: Unexpected inorganic carbonate in the invasive slipper limpet Crepidula fornicata and its implications for stable isotope interpretations. Rapid Commun. Mass Spectrom. 33, 107–115.
Azam, F., Fenchel, T., Field, J. G., Gray, J. S., Meyer-Reil, L.-A., and Thingstad, F. (1983). The ecological role of water-column microbes in the sea. Mar. Ecol. Progr. Ser. 10, 257–263. doi: 10.3354/meps010257
Barnett, A., Méléder, V., Dupuy, C., and Lavaud, J. (2020). The vertical migratory rhythm of intertidal microphytobenthos in sediment depends on the light photoperiod, intensity, and spectrum: Evidence for a positive effect of blue wavelengths. Front. Mar. Sci. 7:212. doi: 10.3389/fmars.2020.00212
Bauer, J. E., Cai, W. J., and Raymond, P. A. (2013a). The changing carbon cycle of the coastal ocean. Nature 504, 61–70. doi: 10.1038/nature12857
Bauer, J. E., Cai, W.-J., Raymond, P. A., Bianchi, T. S., Hopkinson, C. S., and Regnier, P. A. G. (2013b). The changing carbon cycle of the coastal ocean. Nature 504, 61–70. doi: 10.1038/nature12857
Beukema, J. J. Cadée, G. C., and Dekker, R. (2002). Zoobenthic biomass limited by phytoplankton abundance: Evidence from parallel changes in two long-term data series in the Wadden Sea. J. Sea Res. 48, 111–125.
Bijleveld, A. I., van Gils, J. A., van der Meer, J., Dekinga, A., Kraan, C., van der Veer, H. W., et al. (2012). Designing a benthic monitoring programme with multiple conflicting objectives. Methods Ecol. Evol. 3, 526–536. doi: 10.1111/j.2041-210X.2012.00192.x
Bode, A., Olivar, M. P., and Hernández-León, S. (2021). Trophic indices for micronektonic fishes reveal their dependence on the microbial system in the north atlantic. Sci. Rep. 11:8488. doi: 10.1038/s41598-021-87767-x
Borst, A. C. W., Verberk, W. C. E. P., Angelini, C., Schotanus, J., Wolters, J.-W., Christianen, M. J. A., et al. (2018). Foundation species enhance food web complexity through non-trophic facilitation. PLoS One 13:e0199152. doi: 10.1371/journal.pone.0199152
Bradley, C. J., Wallsgrove, N. J., Choy, C. A., Drazen, J. C., Hetherington, E. D., Hoen, D. K., et al. (2015). Trophic position estimates of marine teleosts using amino acid compound specific isotopic analysis. Limnol. Oceanogr. Methods 13, 476–493. doi: 10.1002/lom3.10041
Charlier, R. H., Morand, P., and Finkl, C. W. (2008). How Brittany and Florida coasts cope with green tides. Int. J. Environ. Stud. 65, 191–208. doi: 10.1080/00207230701791448
Chi, X., Dierking, J., Hoving, H.-J., Lüskow, F., Denda, A., Christiansen, B., et al. (2021). Tackling the jelly web: Trophic ecology of gelatinous zooplankton in oceanic food webs of the eastern tropical Atlantic assessed by stable isotope analysis. Limnol. Oceanogr. 66, 289–305. doi: 10.1002/lno.11605
Chikaraishi, Y., Kashiyama, Y., Ogawa, N. O., Kitazato, H., and Ohkouchi, N. (2007). Metabolic control of nitrogen isotope composition of amino acids in macroalgae and gastropods: Implications for aquatic food web studies. Mar. Ecol. Progr. Ser. 342, 85–90. doi: 10.3354/meps342085
Chikaraishi, Y., Ogawa, N. O., Kashiyama, Y., Takano, Y., Suga, H., Tomitani, A., et al. (2009). Determination of aquatic food-web structure based on compound-specific nitrogen isotopic composition of amino acids. Limnol. Oceanogr. Methods 7, 740–750. doi: 10.4319/lom.2009.7.740
Christianen, M. J. A., Holthuijsen, S. J., van der Zee, E. M., van der Eijk, A., Govers, L. L., van der Heide, T., et al. (2015). Ecotopen- en Kansrijkdomkaart van de Nederlandse Waddenzee. Rapportnummer 2015.04.01, Waddenfondsproject Waddensleutels.
Christianen, M. J. A., Middelburg, J. J., Holthuijsen, S. J., Jouta, J., Compton, T. J., van der Heide, T., et al. (2017). Benthic primary producers are key to sustain the Wadden Sea food web: Stable carbon isotope analysis at landscape scale. Ecology 98, 1498–1512. doi: 10.1002/ecy.1837
Chua, E. J., Huettel, M., Fennel, K., and Fulweiler, R. W. (2022). A case for addressing the unresolved role of permeable shelf sediments in ocean denitrification. Limnol. Oceanogr. Lett. 7, 11–25. doi: 10.1002/lol2.10218
Compton, T. J., Holthuijsen, S., Koolhaas, A., Dekinga, A., ten Horn, J., Smith, J., et al. (2013). Distinctly variable mudscapes: Distribution gradients of intertidal macrofauna across the dutch wadden sea. J. Sea Res. 82, 103–116. doi: 10.1016/j.seares.2013.02.002
Cook, P. L. M., Veuger, B., Boer, S., and Middelburg, J. J. (2007). Effect of nutrient availability on carbon and nitrogen and flows through benthic algae and bacteria in near-shore sandy sediment. Aquatic Microb. Ecol. 49, 165–180. doi: 10.3354/ame01142
Cordone, G., Salinas, V., Marina, T. I., Doyle, S. R., Pasotti, F., Saravia, L. A., et al. (2020). Green vs brown food web: Effects of habitat type on multidimensional stability proxies for a highly-resolved antarctic food web. Food Webs 25:e00166. doi: 10.1016/j.fooweb.2020.e00166
Cresson, P., Chouvelon, T., Bustamante, P., Bănaru, D., Baudrier, J., Le Loc’h, F., et al. (2020). Primary production and depth drive different trophic structure and functioning of fish assemblages in French marine ecosystems. Progr. Oceanogr. 186:102343. doi: 10.1016/j.pocean.2020.102343
Durante, L., Wing, S., Ingram, T., Sabadel, A., and Shima, J. (2022). Changes in trophic structure of an exploited fish community at the centennial scale are linked to fisheries and climate forces. Sci. Rep. 12, 1–12. doi: 10.1038/s41598-022-08391-x
Eaton, J. W., and Moss, B. (1966). The estimation of numbers and pigment content in epipelic algal populations. Limnol. Oceanogr. 11, 584–595. doi: 10.4319/lo.1966.11.4.0584
Eriksson, B. K., van der Heide, T., van de Koppel, J., Piersma, T., van der Veer, H. W., and Olff, H. (2010). Major changes in the ecology of the wadden sea: Human impacts, ecosystem engineering and sediment dynamics. Ecosystems 13, 752–764. doi: 10.1007/s10021-010-9352-3
Evans-White, M. A., and Halvorson, H. M. (2017). Comparing the ecological stoichiometry in green and brown food webs – a review and meta-analysis of freshwater food webs. Front. Microbiol. 8:1184. doi: 10.3389/fmicb.2017.01184
Evrard, V., Soetaert, K., Heip, C. H., Huettel, M., Xenopoulos, M. A., and Middelburg, J. J. (2010). Carbon and nitrogen flows through the benthic food web of a photic subtidal sandy sediment. Mar. Ecol. Progr. Ser. 416, 1–16. doi: 10.3354/meps08770
Fenchel, T. (2008). The microbial loop–25 years later. J. Exp. Mar. Biol. Ecol. 366, 99–103. doi: 10.1016/j.jembe.2008.07.013
Fernandes, R., Millard, A. R., Brabec, M., Nadeau, M.-J., and Grootes, P. (2014). Food reconstruction using isotopic transferred signals (fruits): A bayesian model for diet reconstruction. PLoS One 9:e87436. doi: 10.1371/journal.pone.0087436
Folmer, E. O., van Beusekom, J. E. E., Dolch, T., Gräwe, U., van Katwijk, M. M., Kolbe, K., et al. (2016). Consensus forecasting of intertidal seagrass habitat in the Wadden Sea. J. Appl. Ecol. 53, 1800–1813. doi: 10.1111/1365-2664.12681
Froese, R., and Pauly, D. (2000). Fishbase 2000: Concepts designs and data sources. Fishbase 2000: Concepts Designs and Data Sources. Penang: WorldFish.
Fry, B. (1984). 13C/12C ratios and the trophic importance of algae in Florida Syringodium filiforme seagrass meadows. Mar. Biol. 79, 11–19. doi: 10.1007/BF00404980
Fry, B. (1988). Food web structure on georges bank from stable C, N, and S isotopic compositions. Limnol. Oceanogr. 33, 1182–1190. doi: 10.4319/lo.1988.33.5.1182
Goto, N., Kawamura, T., Mitamura, O., and Terai, H. (1999). Importance of extracellular organic carbon production in the total primary production by tidal-flat diatoms in comparison to phytoplankton. Mar. Ecol. Progr. Ser. 190, 289–295. doi: 10.3354/meps190289
Hebert, C. E., Popp, B. N., Fernie, K. J., Ka’apu-Lyons, C., Rattner, B. A., and Wallsgrove, N. (2016). Amino acid specific stable nitrogen isotope values in avian tissues: Insights from captive american kestrels and wild herring gulls. Environ. Sci. Technol. 50, 12928–12937. doi: 10.1021/acs.est.6b04407
Jung, A. S., van der Veer, H. W., van der Meer, M. T. J., and Philippart, C. J. M. (2019). Seasonal variation in the diet of estuarine bivalves. PLoS One 14:e0217003. doi: 10.1371/journal.pone.0217003
Kahma, T. I., Karlson, A. M., Sun, X., Mörth, C. M., Humborg, C., Norkko, A., et al. (2020). Macroalgae fuels coastal soft-sediment macrofauna: A triple-isotope approach across spatial scales. Mar. Environ. Res. 162:105163. doi: 10.1016/j.marenvres.2020.105163
Kato, Y., Togashi, H., Kurita, Y., Osada, Y., Amano, Y., Yoshimizu, C., et al. (2021). Segmental isotope analysis of the vertebral centrum reveals the spatiotemporal population structure of adult japanese flounder Paralichthys olivaceus in sendai bay, japan. Mar. Biol. 168:57. doi: 10.1007/s00227-021-03868-1
Krumins, J. A., van Oevelen, D., Bezemer, T. M., De Deyn, G. B., Hol, W. G., Van Donk, E., et al. (2013). Soil and freshwater and marine sediment food webs: Their structure and function. Bioscience 63, 35–42. doi: 10.1525/bio.2013.63.1.8
Le-Alvarado, M., Romo-Curiel, A. E., Sosa-Nishizaki, O., Hernández-Sánchez, O., Barbero, L., and Herzka, S. Z. (2021). Yellowfin tuna (Thunnus albacares) foraging habitat and trophic position in the gulf of mexico based on intrinsic isotope tracers. PLoS One 16:e0246082. doi: 10.1371/journal.pone.0246082
Lemons, G. E., Lewison, R. L., Seminoff, J. A., Coppenrath, C. M., and Popp, B. N. (2020). Nitrogen isotope fractionation of amino acids from a controlled study on the green turtle (Chelonia mydas): Expanding beyond glx/phe for trophic position. Mar. Biol. 167, 1–13. doi: 10.1007/s00227-020-03745-3
Marchant, H. K., Ahmerkamp, S., Lavik, G., Tegetmeyer, H. E., Graf, J., Klatt, J. M., et al. (2017). Denitrifying community in coastal sediments performs aerobic and anaerobic respiration simultaneously. ISME J. 11, 1799–1812. doi: 10.1038/ismej.2017.51
Marchant, H. K., Holtappels, M., Lavik, G., Ahmerkamp, S., Winter, C., and Kuypers, M. M. M. (2016). Coupled nitrification–denitrification leads to extensive N loss in subtidal permeable sediments. Limnol. Oceanogr. 61, 1033–1048. doi: 10.1002/lno.10271
Marchant, H. K., Tegetmeyer, H. E., Ahmerkamp, S., Holtappels, M., Lavik, G., Graf, J., et al. (2018). Metabolic specialization of denitrifiers in permeable sediments controls N2O emissions. Environ. Microbiol. 20, 4486–4502. doi: 10.1111/1462-2920.14385
McCormack, S. A., Trebilco, R., Melbourne-Thomas, J., Blanchard, J., Fulton, E., and Constable, A. (2019). Using stable isotope data to advance marine food web modelling. Rev. Fish Biol. Fish. 29, 277–296. doi: 10.1007/s11160-019-09552-4
McCutchan, J. H., Lewis, W. M. Jr., Kendall, C., and McGrath, C. C. (2003). Variation in trophic shift for stable isotope ratios of carbon, nitrogen, and sulfur. Oikos 102, 378–390. doi: 10.1034/j.1600-0706.2003.12098.x
McMahon, K. W., and McCarthy, M. D. (2016). Embracing variability in amino acid δ15N fractionation: Mechanisms, implications, and applications for trophic ecology. Ecosphere 7:e01511. doi: 10.1002/ecs2.1511
McMahon, K. W., Polito, M. J., Abel, S., McCarthy, M. D., and Thorrold, S. R. (2015a). Carbon and nitrogen isotope fractionation of amino acids in an avian marine predator, the gentoo penguin (pygoscelis papua). Ecol. Evol. 5, 1278–1290. doi: 10.1002/ece3.1437
McMahon, K. W., Thorrold, S. R., Elsdon, T. S., and McCarthy, M. D. (2015b). Trophic discrimination of nitrogen stable isotopes in amino acids varies with diet quality in a marine fish. Limnol. Oceanogr. 60, 1076–1087. doi: 10.1002/lno.10081
Middelburg, J. J. (2014). Stable isotopes dissect aquatic food webs from the top to the bottom. Biogeosciences 11, 2357–2371. doi: 10.5194/bg-11-2357-2014
Middelburg, J. J., and Herman, P. M. J. (2007). Organic matter processing in tidal estuaries. Mar. Chem. 106, 127–147. doi: 10.1016/j.marchem.2006.02.007
Middelburg, J. J., Barranguet, C., Boschker, H. T., Herman, P. M., Moens, T., and Heip, C. H. (2000). The fate of intertidal microphytobenthos carbon: An in situ 13C-labeling study. Limnol. Oceanogr. 45, 1224–1234. doi: 10.4319/lo.2000.45.6.1224
Miller, D. C., Geider, R. J., and MacIntyre, H. L. (1996). Microphytobenthos: The ecological role of the “secret garden” of unvegetated, shallow-water marine habitats. Ii. Role in sediment stability and shallow-water food webs. Estuaries 19, 202–212. doi: 10.2307/1352225
Minagawa, M., and Wada, E. (1984). Stepwise enrichment of 15N along food chains: Further evidence and the relation between δ15N and animal age. Geochim. Cosmochim. Acta 48, 1135–1140. doi: 10.1016/0016-7037(84)90204-7
Nuche-Pascual, M. T., Ruiz-Cooley, R. I., and Herzka, S. Z. (2021). A meta-analysis of amino acid δ15N trophic enrichment factors in fishes relative to nutritional and ecological drivers. Ecosphere 12:e03570. doi: 10.1002/ecs2.3570
O’Connell, T. C. (2017). ‘Trophic’ and ‘source’ amino acids in trophic estimation: A likely metabolic explanation. Oecologia 184, 317–326. doi: 10.1007/s00442-017-3881-9
Oakes, J. M., Eyre, B. D., and Middelburg, J. J. (2012). Transformation and fate of microphytobentos carbon in subtropical shallow subtidal sands: A 13C-labeling study. Limnol. Oceanogr. 57, 1846–1856. doi: 10.4319/lo.2012.57.6.1846
Odum, E. P. (1969). The strategy of ecosystem development: An understanding of ecological succession provides a basis for resolving man’s conflict with nature. Science 164, 262–270. doi: 10.1126/science.164.3877.262
Otto, L., Zimmerman, J., Furnes, G., Mork, M., Saetre, R., and Becker, G. (1990). Review of the physical oceanography of the north sea. Netherlands J. Sea Res. 26, 161–238. doi: 10.1016/0077-7579(90)90091-T
Philippart, C. J., Beukema, J. J., Cadée, G. C., Dekker, R., Goedhart, P. W., van Iperen, J. M., et al. (2007). Impacts of nutrient reduction on coastal communities. Ecosystems 10, 96–119. doi: 10.1007/s10021-006-9006-7
Post, D. M. (2002). Using stable isotopes to estimate trophic position: Models, methods, and assumptions. Ecology 83, 703–718. doi: 10.1890/0012-9658(2002)083[0703:USITET]2.0.CO;2
Postma, H. (1996). “Sea-level rise and the stability of barrier islands, with special reference to the wadden sea,” in Sea-Level Rise and Coastal Subsidence, eds J.D. Milliman and B.U. Haq (Berlin: Springer). doi: 10.1007/978-94-015-8719-8_15
Potapov, A. M., Brose, U., Scheu, S., and Tiunov, A. V. (2019). Trophic position of consumers and size structure of food webs across aquatic and terrestrial ecosystems. Am. Nat. 194, 823–839. doi: 10.1086/705811
Reise, K., Baptist, M., Burbridge, P., Dankers, N., Fischer, L., Flemming, B., et al. (2010). “The wadden sea-a universally outstanding tidal wetland,” in The Wadden Sea 2010 Common Wadden Sea Secretariat (cwss), eds H. Marencic and J. de vlas (Wilhelmshaven: Trilateral Monitoring and Assessment Group).
Riekenberg, P. M., Oakes, J. M., and Eyre, B. D. (2020a). A shift in the pool of retained microphytobenthos nitrogen under enhanced nutrient availability. Water Res. 187:116438. doi: 10.1016/j.watres.2020.116438
Riekenberg, P. M., van der Meer, M., and Schouten, S. (2020b). Practical considerations for improved reliability and precision during determination of δ15N values in amino acids using a single combined oxidation-reduction reactor. Rapid Commun. Mass Spectr. 34:e8797. doi: 10.1002/rcm.8797
Ruiz-Cooley, R. I., Gerrodette, T., Chivers, S. J., and Danil, K. (2021). Cooperative feeding in common dolphins as suggested by ontogenetic patterns in δ15N bulk and amino acids. J. Anim. Ecol. 90, 1583–1595. doi: 10.1111/1365-2656.13478
Saburova, M. A., and Polikarpov, I. G. (2003). Diatom activity within soft sediments: Behavioural and physiological processes. Mar. Ecol. Progr. Ser. 251, 115–126. doi: 10.3354/meps251115
Santos, I. R., Beck, M., Brumsack, H.-J., Maher, D. T., Dittmar, T., Waska, H., et al. (2015). Porewater exchange as a driver of carbon dynamics across a terrestrial-marine transect: Insights from coupled 222Rn and pCO2 observations in the german wadden sea. Mar. Chem. 171, 10–20. doi: 10.1016/j.marchem.2015.02.005
Schlitzer, R. (2022). Ocean Data View. Available online at: https://odv.Awi.De (accessed November 15, 2021).
Scholz, B., and Liebezeit, G. (2012). Microphytobenthic dynamics in a wadden sea intertidal flat – part i: Seasonal and spatial variation of diatom communities in relation to macronutrient supply. Eur. J. Phycol. 47, 105–119. doi: 10.1080/09670262.2012.663793
Stal, L. J. (2010). Microphytobenthos as a biogeomorphological force in intertidal sediment stabilization. Ecol. Eng. 36, 236–245. doi: 10.1016/j.ecoleng.2008.12.032
Stock, B. C., Jackson, A. L., Ward, E. J., Parnell, A. C., Phillips, D. L., and Semmens, B. X. (2018). Analyzing mixing systems using a new generation of bayesian tracer mixing models. PeerJ 6:e5096. doi: 10.7717/peerj.5096
Sturbois, A., Riera, P., Desroy, N. Brébant, T., Carpentier, A., Ponsero, A., et al. (2022). Spatio-temporal patterns in stable isotope composition of a benthic intertidal food web reveal limited influence from salt marsh vegetation and green tide. Mar. Environ. Res. 175:105572.
Svensson, E., Schouten, S., Hopmans, E. C., Middelburg, J. J., and Sinninghe Damsté, J. S. (2016). Factors controlling the stable nitrogen isotopic composition (δ15N) of lipids in marine animals. PLoS One 11:e0146321. doi: 10.1371/journal.pone.0146321
Taylor, J. D., McKew, B. A., Kuhl, A., McGenity, T. J., and Underwood, G. J. C. (2013). Microphytobenthic extracellular polymeric substances (EPS) in intertidal sediments fuel both generalist and specialist EPS-degrading bacteria. Limnol. Oceanogr. 58, 1463–1480. doi: 10.4319/lo.2013.58.4.1463
Then, A. Y., Adame, M. F., Fry, B., Chong, V. C., Riekenberg, P. M. R., Mohammad Zakaria, R., et al. (2021). Stable isotopes clearly track mangrove inputs and food web changes along a reforestation gradient. Ecosystems 24, 939–954. doi: 10.1007/s10021-020-00561-0
Van Roomen, M., Van Turnhout, C., Van Winden, E., Koks, B., Goedhart, P., Leopold, M., et al. (2005). Trends in benthivorous waterbirds in the dutch wadden sea 1975–2002: Large differences between shellfish-eaters and worm-eaters. Limosa 78, 21–38.
Vokhshoori, N. L., and McCarthy, M. D. (2014). Compound-specific δ15N amino acid measurements in littoral mussels in the California upwelling ecosystem: A new approach to generating baseline δ15N Isoscapes for coastal ecosystems. PLoS One 9:e98087. doi: 10.1371/journal.pone.0098087
Vokhshoori, N. L., McCarthy, M. D., Close, H. G., Demopoulos, A. W. J., and Prouty, N. G. (2021). New geochemical tools for investigating resource and energy functions at deep-sea cold seeps using amino acid δ15N in chemosymbiotic mussels (bathymodiolus childressi). Geobiology 19, 601–617. doi: 10.1111/gbi.12458
Vokhshoori, N. L., McCarthy, M. D., Collins, P. W., Etnier, M. A., Rick, T., Eda, M., et al. (2019). Broader foraging range of ancient short-tailed albatross populations into california coastal waters based on bulk tissue and amino acid isotope analysis. Mar. Ecol. Progr. Ser. 610, 1–13. doi: 10.3354/meps12839
Whiteman, J. P., Kim, S. L., McMahon, K. W., Koch, P. L., and Newsome, S. D. (2018). Amino acid isotope discrimination factors for a carnivore: Physiological insights from leopard sharks and their diet. Oecologia 188, 977–989. doi: 10.1007/s00442-018-4276-2
Wolff, W. J. (2013). Ecology of the wadden sea: Research in the past and challenges for the future. J. Sea Res. 82, 3–9. doi: 10.1016/j.seares.2013.03.006
Keywords: trophic discrimination, intertidal, diatoms, microbial loop, permeable sands
Citation: Riekenberg PM, van der Heide T, Holthuijsen SJ, van der Veer HW and van der Meer MTJ (2022) Compound-specific stable isotope analysis of amino acid nitrogen reveals detrital support of microphytobenthos in the Dutch Wadden Sea benthic food web. Front. Ecol. Evol. 10:951047. doi: 10.3389/fevo.2022.951047
Received: 23 May 2022; Accepted: 07 September 2022;
Published: 18 October 2022.
Edited by:
Jason Newton, University of Glasgow, United KingdomReviewed by:
Bobby Nakamoto, University of New Brunswick Fredericton, CanadaCopyright © 2022 Riekenberg, van der Heide, Holthuijsen, van der Veer and van der Meer. This is an open-access article distributed under the terms of the Creative Commons Attribution License (CC BY). The use, distribution or reproduction in other forums is permitted, provided the original author(s) and the copyright owner(s) are credited and that the original publication in this journal is cited, in accordance with accepted academic practice. No use, distribution or reproduction is permitted which does not comply with these terms.
*Correspondence: Philip M. Riekenberg, cGhyaWVrZW5AZ21haWwuY29t
Disclaimer: All claims expressed in this article are solely those of the authors and do not necessarily represent those of their affiliated organizations, or those of the publisher, the editors and the reviewers. Any product that may be evaluated in this article or claim that may be made by its manufacturer is not guaranteed or endorsed by the publisher.
Research integrity at Frontiers
Learn more about the work of our research integrity team to safeguard the quality of each article we publish.