 Ellen E. Brandell
 Daniel J. Storm2
 Timothy R. Van Deelen
 Daniel P. Walsh
- 1Wisconsin Cooperative Wildlife Research Unit, Department of Forest and Wildlife Ecology, University of Wisconsin–Madison, Madison, WI, United States
- 2Wisconsin Department of Natural Resources, Eau Claire, WI, United States
- 3Department of Forest and Wildlife Ecology, University of Wisconsin–Madison, Madison, WI, United States
- 4United States Geological Survey, Montana Cooperative Wildlife Research Unit, University of Montana, Missoula, MT, United States
- 5United States Geological Survey, Wisconsin Cooperative Wildlife Research Unit, Department of Forest and Wildlife Ecology, University of Wisconsin–Madison, Madison, WI, United States
Recreational hunting has been the dominant game management and conservation mechanism in the United States for the past century. However, there are numerous modern-day issues that reduce the viability and efficacy of hunting-based management, such as fewer hunters, overabundant wildlife populations, limited access, and emerging infectious diseases in wildlife. Quantifying the drivers of recreational harvest by hunters could inform potential management actions to address these issues, but this is seldom comprehensively accomplished because data collection practices limit some analytical applications (e.g., differing spatial scales of harvest regulations and harvest data). Additionally, managing large-scale issues, such as infectious diseases, requires collaborations across management agencies, which is challenging or impossible if data are not standardized. Here we discuss modern issues with the prevailing wildlife management framework in the United States from an analytical point of view with a case study of white-tailed deer (Odocoileus virginianus) in the Midwest. We have four aims: (1) describe the interrelated processes that comprise hunting and suggest improvements to current data collections systems, (2) summarize data collection systems employed by state wildlife management agencies in the Midwestern United States and discuss potential for large-scale data standardization, (3) assess how aims 1 and 2 influence managing infectious diseases in hunted wildlife, and (4) suggest actionable steps to help guide data collection standards and management practices. To achieve these goals, Wisconsin Department of Natural Resources disseminated a questionnaire to state wildlife agencies (Illinois, Indiana, Iowa, Kentucky, Michigan, Minnesota, Missouri, Ohio, Wisconsin), and we report and compare their harvest management structures, data collection practices, and responses to chronic wasting disease. We hope our “call to action” encourages re-evaluation, coordination, and improvement of harvest and management data collection practices with the goal of improving the analytical potential of these data. A deeper understanding of the strengths and deficiencies of our current management systems in relation to harvest and management data collection methods could benefit the future development of comprehensive and collaborative management and research initiatives (e.g., adaptive management) for wildlife and their diseases.
Introduction
The primary game management and conservation mechanism in the United States is recreational hunting. Under the North American Model of Wildlife Conservation (NAMWC), hunters drive wildlife conservation, particularly of large game species (Organ et al., 2012; Heffelfinger et al., 2013). Hunters are credited with the conservation and sustainable use of wildlife, yet hunters have fairly inflexible behavior (Brown et al., 2000; Riley et al., 2003; Van Deelen and Etter, 2003; Giles and Findlay, 2004; Holsman and Petchenik, 2006) and hunter numbers continue to decline, which may reduce the efficacy of harvest-based management as emerging issues increase in importance [e.g., infectious diseases, non-native species invasion, overabundance; reviewed in VerCauteren et al. (2011)]. Hunter behaviors and preferences have evolved and may be counter to goals of wildlife management; for example, harvesting primarily large males (“trophies”) is a motivating driver for some portions of the hunting public (Eliason, 2008), which is problematic when this preference results in a reduction of overall harvest and the goal is to reduce overabundant species like some ungulate species. At the same time, there have been local reductions in accessible hunting areas where the target species aggregates [e.g., exurban refugia; Storm et al. (2007)]. Additionally, management practices have not changed substantially since adoption of the NAMWC about a century ago in that they rely on hunter participation, particularly at regular annual intervals (Organ et al., 2012; Heffelfinger et al., 2013).
Under the NAMWC, states and tribes manage wildlife within their borders and use best available science to inform management practices. However, in practice, traditions in hunting seasons and regulations imposed by state agencies are quite inflexible. For example, Wisconsin has begun its major white-tailed deer (Odocoileus virginianus) firearm hunting season on the Saturday before US’s Thanksgiving holiday for at least 65 years (Wis. Admin. Code ch. 29 §29.016). Other traditions arise from habit or history—for instance, a legacy of restrictive female deer harvest regulations designed to increase deer abundance may lead to consistently low female harvests even after regulations are liberalized (Decker and Connelly, 1989; Riley et al., 2003; Holsman and Petchenik, 2006). Predictable or traditional hunting seasons/regulations are beneficial to hunters and management agencies for several reasons, including avoiding the potential for regulation violation if seasons or regulations changing more frequently, and hunters and hunting-related businesses can more easily plan and align activities around consistent seasons. While there are many benefits to predictable hunting seasons/regulations, these cultural and regulatory practices may limit the efficacy of wildlife management. These traditions are especially pronounced for white-tailed deer (henceforth deer), where hunting holds significant cultural and economic value. Broadly, in many regions of the U.S., deer abundance is uncontrolled by hunters (Decker and Connelly, 1989; Brown et al., 2000; Riley et al., 2003; Van Deelen and Etter, 2003; VerCauteren et al., 2011; Williams et al., 2013) and problems of high deer densities are growing (Warren, 2011; McShea, 2012), such as overbrowsing (Augustine and Frelich, 1998; Côté et al., 2004; Shelton et al., 2014), deer-vehicle collisions (Williams and Wells, 2005; DeNicola and Williams, 2008), and the species serving as disease reservoirs [e.g., chronic wasting disease (Escobar et al., 2020); SARS-CoV-2 (Chandler et al., 2021)]. There is an urgency to improve our understanding of the flexibility of wildlife management that primarily relies on hunter participation, and longstanding practices may need to be re-evaluated (McShea, 2012). This first requires identifying the conditions and regulations under which hunter-based management is likely to achieve management agency goals, and quantifying hunter behavior under changing conditions (e.g., disease outbreaks).
There are currently three primary approaches to assessing the drivers of recreational deer harvest by hunters: analyzing tag issuance or harvest trends within spatially defined areas [e.g., number of deer harvested or deer harvest density within deer management units, DMUs, see Box 1, Van Deelen et al. (2010), Karns et al. (2016), and Erickson et al. (2019)], surveying hunters and performing qualitative analyses (e.g., Holsman and Petchenik, 2006), and analyzing deer harvest per unit hunter effort (e.g., Foster et al., 1997; Van Deelen and Etter, 2003). While these approaches can be very useful, they may be limited (especially in interpreting results) due to confounding underlying processes. Additionally, hunter behavior may not correspond with their survey responses, and empirical analyses are useful for examining realized hunter behavior (Haus et al., 2017). More specifically, deer harvest is a function of numerous conditional processes including the number of people who acquire hunting tags, the maximum potential harvest of each hunter (which may be due to personal motivations or a regulatory limit on the number of tags issued per hunter), the proportion of tag holders that attempt to hunt, harvest probability, and the proportion of successful harvests reported. Hunter retention and recruitment has received research attention (e.g., Riley et al., 2003; Winkler and Warnke, 2013; Birdsong et al., 2021), but tag acquisition, hunting, and harvest processes are seldom considered distinct within one analysis, potentially conflating them. For example, a state agency may increase the number of tags available with the goal of locally reducing deer abundance, and then the agency analyzes the number of deer harvested to quantify the efficacy of the new regulations; they find harvest increased. In this case, the increase in the number of deer harvested could result from (1) an increase in the number of hunters with no change in per capita harvest rate, (2) an increase in per capita tags acquired, and consequently, an increase in per capita harvest rate, (3) more favorable weather and environmental conditions during the hunting season (i.e., higher probability of harvest without an increase in per capita tags acquired), or numerous other combinations of causes [e.g., hunter movement and habitat use; Meier (2021)]. Separating these drivers of deer harvest could provide information about the flexibility and importance of each process and guide management initiatives.
| BOX 1 Terminology. |
| Antlered: Broadly represents male deer, “bucks,” but may not include young male deer. Antlered deer are often the demographic class of the high importance to hunters, and have less effect on population control. |
| Antlerless: Broadly represents female deer, “does,” but may also include young male deer. Deer populations are primarily controlled by applying antlerless deer harvests. |
| CWD response: How the agency plans to manage CWD, which has two components: |
| CWD management goal: The state agency goals for CWD management or CWD dynamics, such as “CWD eradication.” |
| CWD management mechanism: The actions implemented to achieve CWD management goals, such as “increase deer removal via agency culls.” |
| CWD responses are further stratified by time: |
| Current response: Present response in an area (i.e., DMU). |
| Historic response: When CWD was newly detected in currently endemic areas (i.e., DMU). |
| Deer management unit: The spatial scale in which deer are managed, often counties (DMU). |
| Endemic CWD: CWD was known to be present for at least 5 years (in an area, i.e., DMU). |
| Invading CWD: CWD was discovered within the past 5 years (in an area, i.e., DMU). |
| Management structure: The prevailing framework in which harvest is regulated at the hunter-level; the structure determines how tags are issued to hunters and is often dependent on spatial scale and deer demography (age/sex). There are two management structures we identified, defined as: |
| Quota structure: Deer harvest is limited by setting a cap on the number of tags that can be issued within a DMU. Under this structure, harvest is limited by the number of tags hunters obtain and fill. |
| Bag structure: Deer harvest is limited by setting a cap on the number of deer each individual hunter can kill [within a DMU]. Under this structure, harvest is limited by the number of hunters through per capita harvest regulations (colloquially: “bag limits”). |
| North American Model of Wildlife Conservation: A list of seven principles used to guide wildlife management and conservation decisions in the United States and Canada for the past century: (1) Wildlife resources are a public trust, (2) No markets for wild game, (3) Wildlife can only be killed for legitimate purposes, (4) Wildlife is an international resource, (5) Science is the proper tool to discharge wildlife policy, (6) Wildlife allocation is by law, and (7) Democracy of hunting is standard. |
| Registration: The reporting of harvests by individual hunters. |
| Tag: The approval for a hunter to harvest a deer or multiple deer (referred to as license or permit by some management agencies). Here, “tag” implies the hunter is approved to harvest one deer and “tags” implies the hunter is approved to harvest multiple deer. Tags can be sex, age, and weapon specific, which we refer to as “tag type.” |
| Tag acquisition: We discuss tags as being “acquired” or “obtained” because tags are not always purchased—some tags come free with the purchase of another type of tag, others may be limited and awarded through a lottery or a “first-come, first-served” convention. |
| Tag filling: When a deer is killed under the approval of a tag. This is generally referred to as “harvest” because it is the act of a hunter harvesting a deer. |
| Wildlife management agency: A government agency (e.g., state, provincial, federal, tribal) in charge of wildlife management; state agencies are commonly named Department of Natural Resources, Game and Fish, Fish and Wildlife, etc. |
| Zone: A conglomerate of multiple deer management units or counties that often share a management approach or habitat affinity. |
There are multiple ways to improve the quantitative applications of hunting and harvest data that we discuss in this article by focusing on data collection practices within and between states. Standardizing data collection is important because wildlife do not follow jurisdictional boundaries and a desire for regional collaborations and management is growing (Mason et al., 2006). Regional wildlife research and management is particularly important for large-scale issues such as migration and disease control. For deer, chronic wasting disease (CWD) is a pressing and widespread issue; CWD is a fatal pathogenic prion disease affecting cervids that was discovered over 50 years ago and currently occurs in at least 28 states (U.S. Geological Survey, and National Wildlife Health Center, 2022). Despite its pervasiveness, papers comparing CWD dynamics across states or regions are limited (Manjerovic et al., 2014; Conner et al., 2021), and authors have pointed out that not all variables describing ecological or management factors of interest could be obtained uniformly across jurisdictions (Conner et al., 2021). Data limitations and gaps in our knowledge can affect development of comprehensive and collaborative plans for managing wildlife and their diseases into the uncertain future.
Here we focus on deer hunting and management in the Midwestern United States. We aim to link data collection practices to quantitative applications, which may be useful for informing and improving management practices. This framework is intended to be generic enough for application across different management jurisdictions and game species, with concrete examples of how to improve data collection. In addition, we aim to offer insight about the shortcomings and barriers to data integration and quantitative analyses across state management agencies with the current data collection systems. In terms of data collection, we discuss agency data collection, data retention systems, and requesting data from hunters (i.e., how to collect data—such as through online registration—as well as what data to collect—such as the number of hours hunted, etc.). While this article does not address all issues we have mentioned, rigorous data collection and analysis is the underpinning of all science-based management programs and is thus fundamental for improving wildlife management (Romesburg, 1981; Organ et al., 2012). We view this article as an essential foundation for subsequent research that identifies solutions to limitations and inefficiencies of current hunter-based management practices, and this foundation can be used to improve management responses to current and future issues.
We begin by describing interrelated processes that comprise hunting from a management perspective and propose an ideal data collection system (I). We then summarize data collection systems employed by state wildlife management agencies in the Midwestern United States and discuss potential for regional data standardization (II). We examine how findings in (I) and (II) are relevant to managing the infectious diseases that wildlife species harbor (III). Finally, we discuss actionable steps to help guide data collection standards and management practices, and limitations to implementing our suggestions (IV). We emphasize that we are not suggesting that all states should manage deer identically, or that data collection practices need to be perfect to manage wildlife; rather, this report is meant to provide a foundation for data collection practices that could expand quantitative applications and thereby improve our collective understanding of hunter behavior, the hunting process, and ultimately management efforts. As a “call to action”, we hope this report catalyzes re-evaluation and strengthening of data collection and analyses with respect to the individual components of hunting, as well as large scale collaborative monitoring and research initiatives, such as regional adaptive management programs.
The hunting process
Deer harvest is the result of multiple processes (Figure 1A), where each process is driven by factors that are unique to that process or shared with others (Figure 1B). Filling tags [e.g., “hunter success”; Figure 1A–(5)] has been the most extensively studied process, yet there are many preceding steps that are rarely examined. For instance, the probability a hunter fills their tag is conditional on the acquisition of at least one tag [Figure 1A–(2)], the number of tags they obtain [Figure 1A–(3)], whether or not they attempt to fill a tag [Figure 1A–(4), binary outcome], and finally, their effort to fill the tag [e.g., number of hours spent hunting; Figure 1A–(5)]. In addition, each of these processes is influenced by certain factors, which may or may not be in the control of the management agency (Figure 1B stars); where in reality, managers have a limited number of tools for manipulating these factors. In this section, we describe a potentially ideal data collection system for harvested species—see Section “Actionable steps” for actionable implementation steps and a discussion of barriers to implementation.
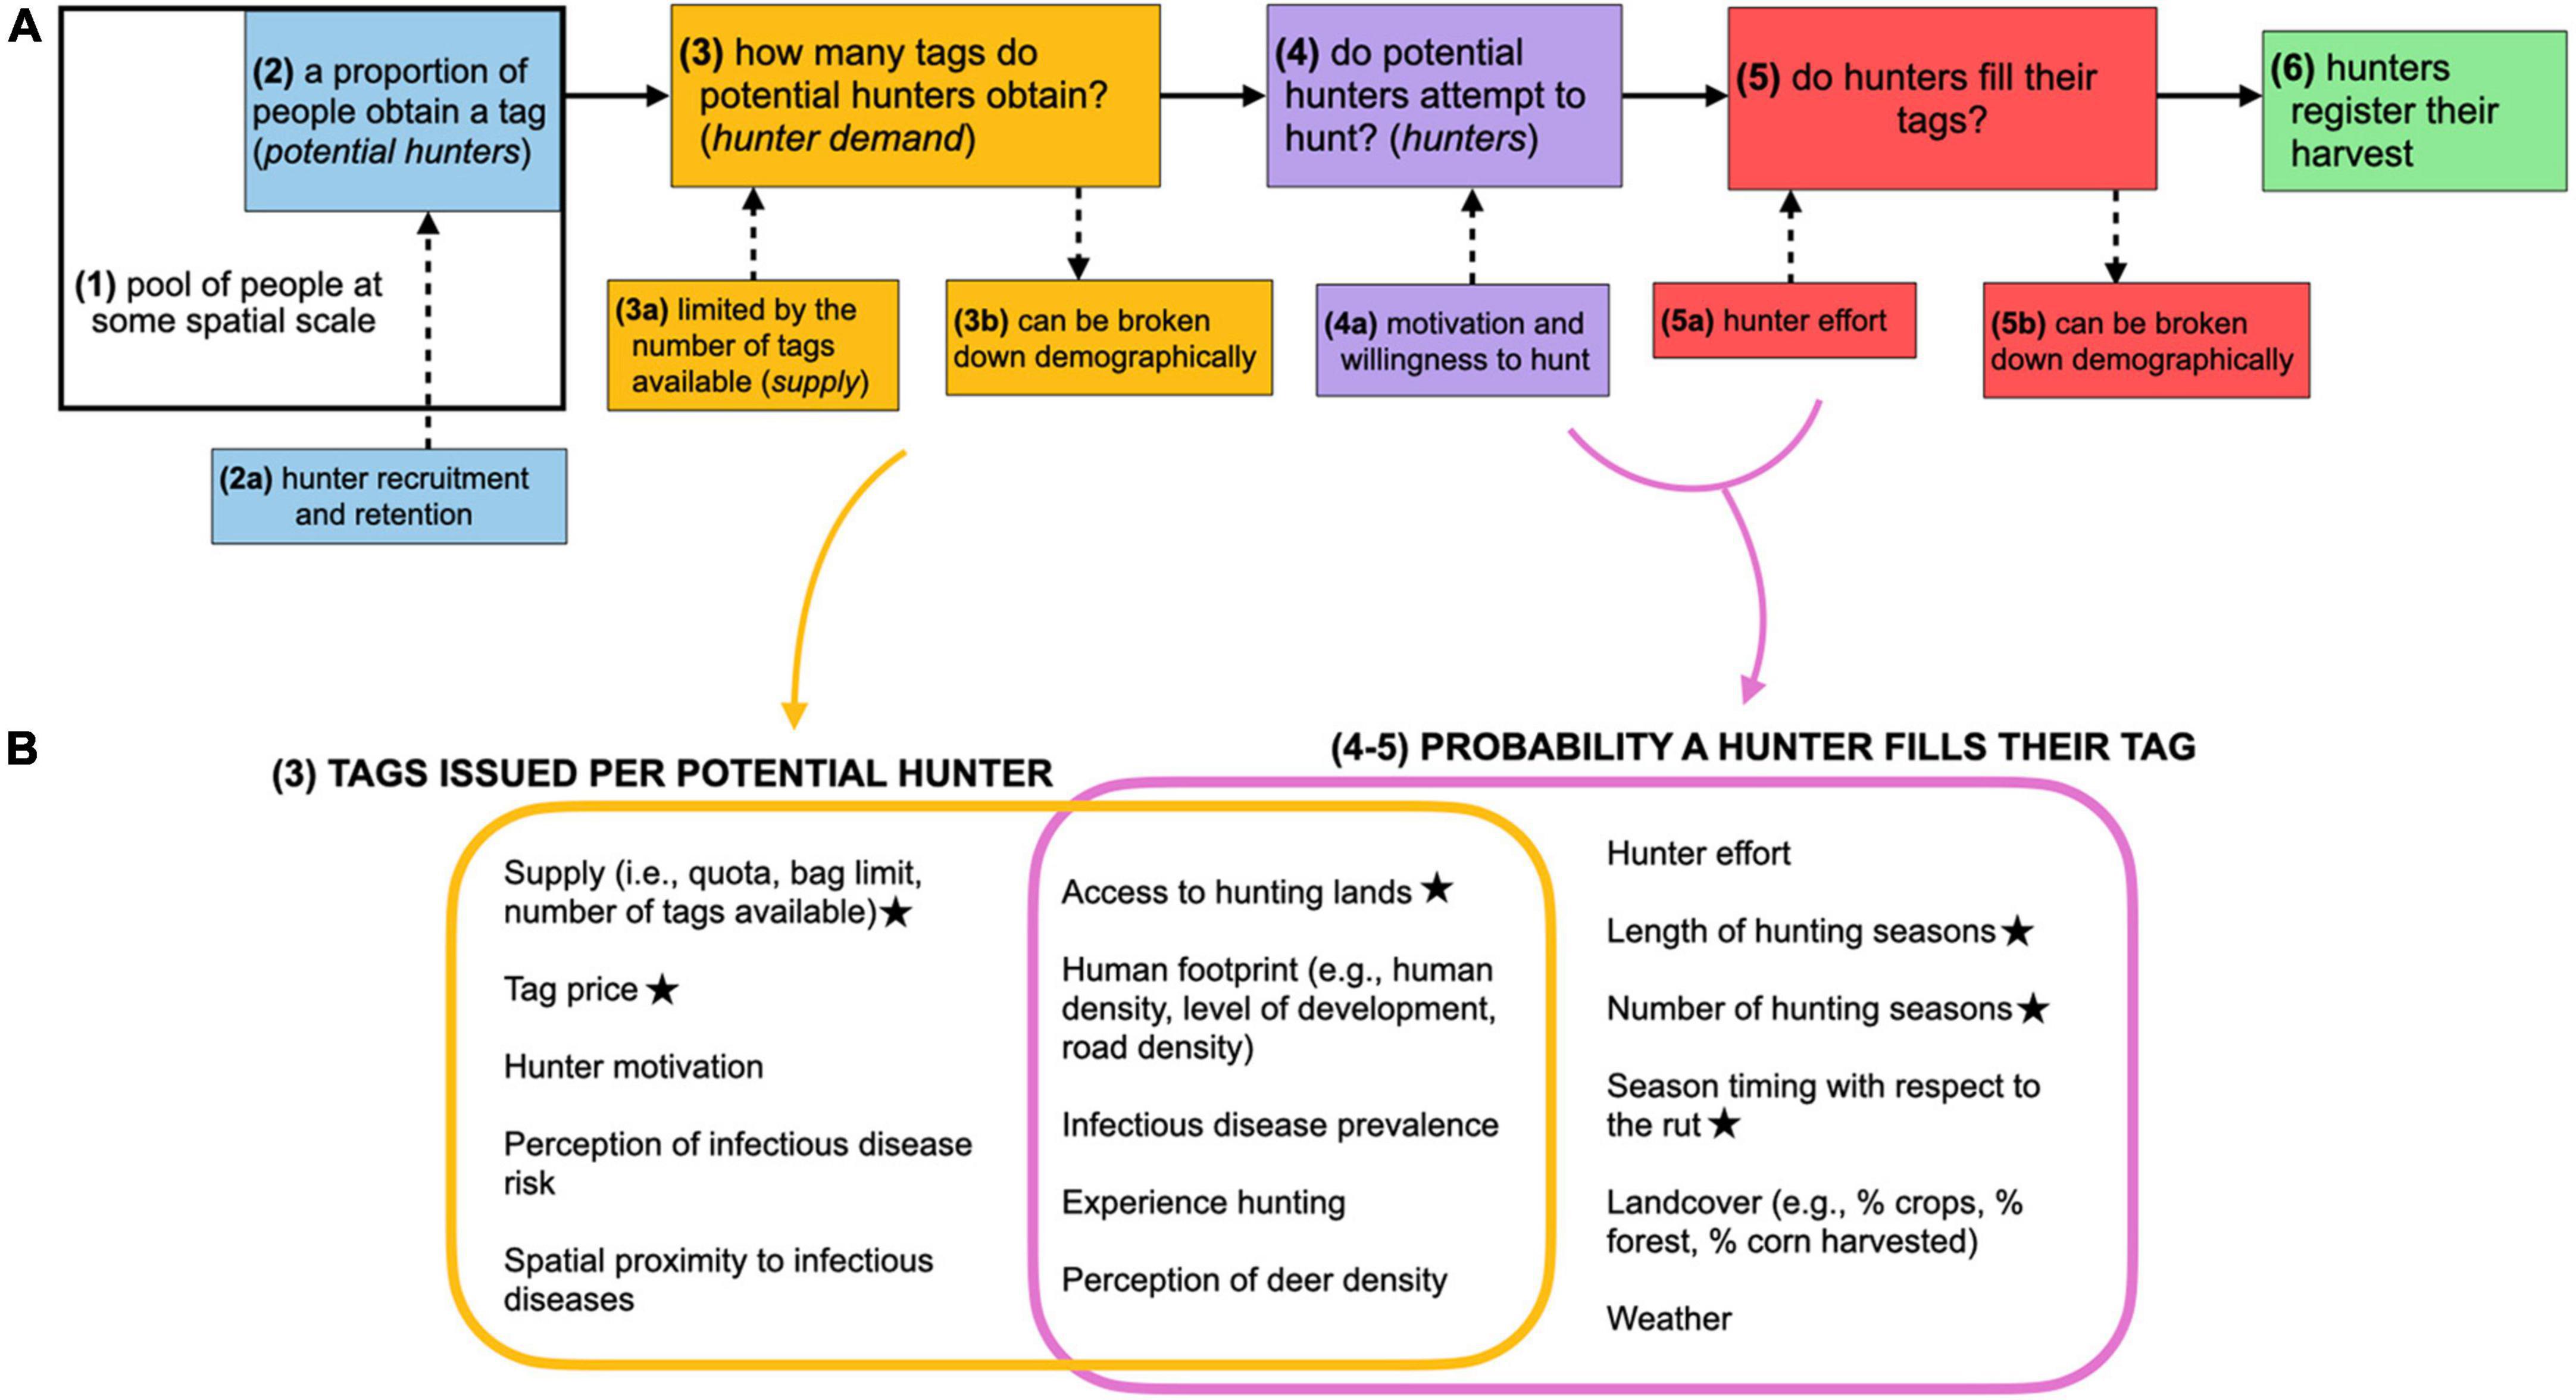
Figure 1. (A) Flowchart depicting the schematic decomposition of the processes affecting hunter harvest. Solid arrows represent conditional, ordered processes; dashed arrows represent influences or components of processes [e.g., (5a) hunter effort, or hours hunted/day, influences (5) the probability a hunter fills their tag]; colored arrows show the hunting processes that are displayed in panel (B). (B) Venn-diagram of potential factors driving the number of tags a hunter obtains [(A): (3)] and the probability that a hunter fills their tag [e.g., kills an animal; (A): (4, 5)]. Stars in panel (B) denote factors that are controlled or influenced by wildlife management agencies.
Management regulations generally focus on the number of deer—of particular demographic classes—that hunters can remove to meet management objectives for a deer population (e.g., Williams et al., 2013). There are multiple pathways that can result in changes in the number of harvested deer such as changes in the number of people that obtain a hunting tag [Figure 1A–(2)]. The number of potential hunters is declining across the United States, including in the Midwest where the number of tag holders declined 8.8% on average per state and declined 9.4% regionally from 2016 to 2021 (Figure 3B; USFWS, 2021); this is alarming due to implications for the efficacy of managing wildlife via hunting. For this reason, we believe it may be critical to understand how management agencies can manipulate the number of deer each hunter kills, which we will focus on in the rest of this section and Section “Midwestern deer harvest and management data collection.” How many deer each hunter kills is a function of numerous factors, including hunting season length, hunting regulations like weapon type allowed, land access, hunting strategies like hunter movement rate, and weather [Figures 1A–(4, 5),B]. Importantly, many aspects of hunter behavior are outside of agency control, but some may be influenced by agency decisions that are yet to be identified. For example, managers may be interested in asking: “Does the timing of the archery hunting season relative to the rut influence hunter success?” Answering these types of questions could help guide informed management decisions and outreach efforts.
A potentially ideal dataset longitudinally links individual hunters to their tag acquisition and harvests. This information would be recorded at the appropriate resolution such that metadata for hunter-level tag acquisition and harvests (e.g., type of tag obtained and filled) match management structures. For instance, if a state allows use of mutually exclusive tag types (e.g., state park tag, antlerless tag, firearm buck tag, archery buck tag), data recorded for each hunter would include the number of each specific tag type obtained and filled, and management unit of harvest. Similarly, if a hunter obtained a tag valid for either sex, the sex of the harvested deer would be reported. Without the collection of tag data at its finest resolution (i.e., hunter-level), it is difficult to know if changes in harvests (at a given spatial scale) are due to a change in number of hunters [Figure 1A–(2)], per capita demand for tags [Figure 1A–(3)], hunter success [Figure 1–(4, 5)], or variable registration [Figure 1A–(6)]. In addition, by longitudinally tracking known hunters, individual variation can be examined and accounted for during analyses. This collection would maximize the quantitative data available to investigate tag acquisition and harvest data, but likely requires mandatory harvest registration (for at least a proportion of hunters) or a statistically rigorous survey of hunters [Figure 1A–(6)].
In addition, in a potentially ideal dataset, metadata about hunter effort could accompany harvest registration, which addresses Figure 1A–(4, 5). For instance, in each hunters’ individual online hunting portal, they could enter information about each tag they obtained: did they attempt to fill it, how many days/hours did they hunt and where, did they fill the tag—and if so, with what deer age/sex class and where (see Section “Actionable steps”). Again, data at this resolution are required to distinguish between the individual hunting processes (Figure 1A) as well as to describe trends, determine influential factors (Figure 1B), and quantify the relative importance of each process through appropriate analytical approaches.
Critically, the spatial scale of recorded data would then match that of the management structure, or be at a finer resolution than the management scale, allowing for customizable data aggregation. One is able to glean the maximum amount of information when the spatial scales of deer management, tag issuance, and recorded harvest match (Figure 2A); for example, we can estimate how management regulations influence hunter demand for tags and hunter success at the highest spatial resolution. However, in practice, the processes underlying hunting may not occur or be recorded at the same spatial scale as management is implemented—for instance, antlered deer tags may be available for use at the state-level, but deer harvest may be recorded at the unit-level (e.g., count of antlered deer harvested per DMU, or “DMU-level”; Figure 2B). From an analytical view, this mismatch can be remedied if states collect data about unsuccessful hunts, which would provide the denominator needed to estimate unit-level success rates. For example, an agency issues tags that are valid across the entire state, hunters register their harvests at the county-level, and hunters provide a list of counties they hunted in but did not harvest an animal; in this example, we can estimate metrics of interest because we are not missing fine-scale hunt information (e.g., units with unsuccessful hunts), even though tags are issued at a larger spatial scale than harvests are recorded (Figure 2B; see Section “Actionable steps”). Unfortunately, spatial mismatch without this data collection is a ubiquitous practice (data provided in Section “Midwestern deer harvest and management data collection”).
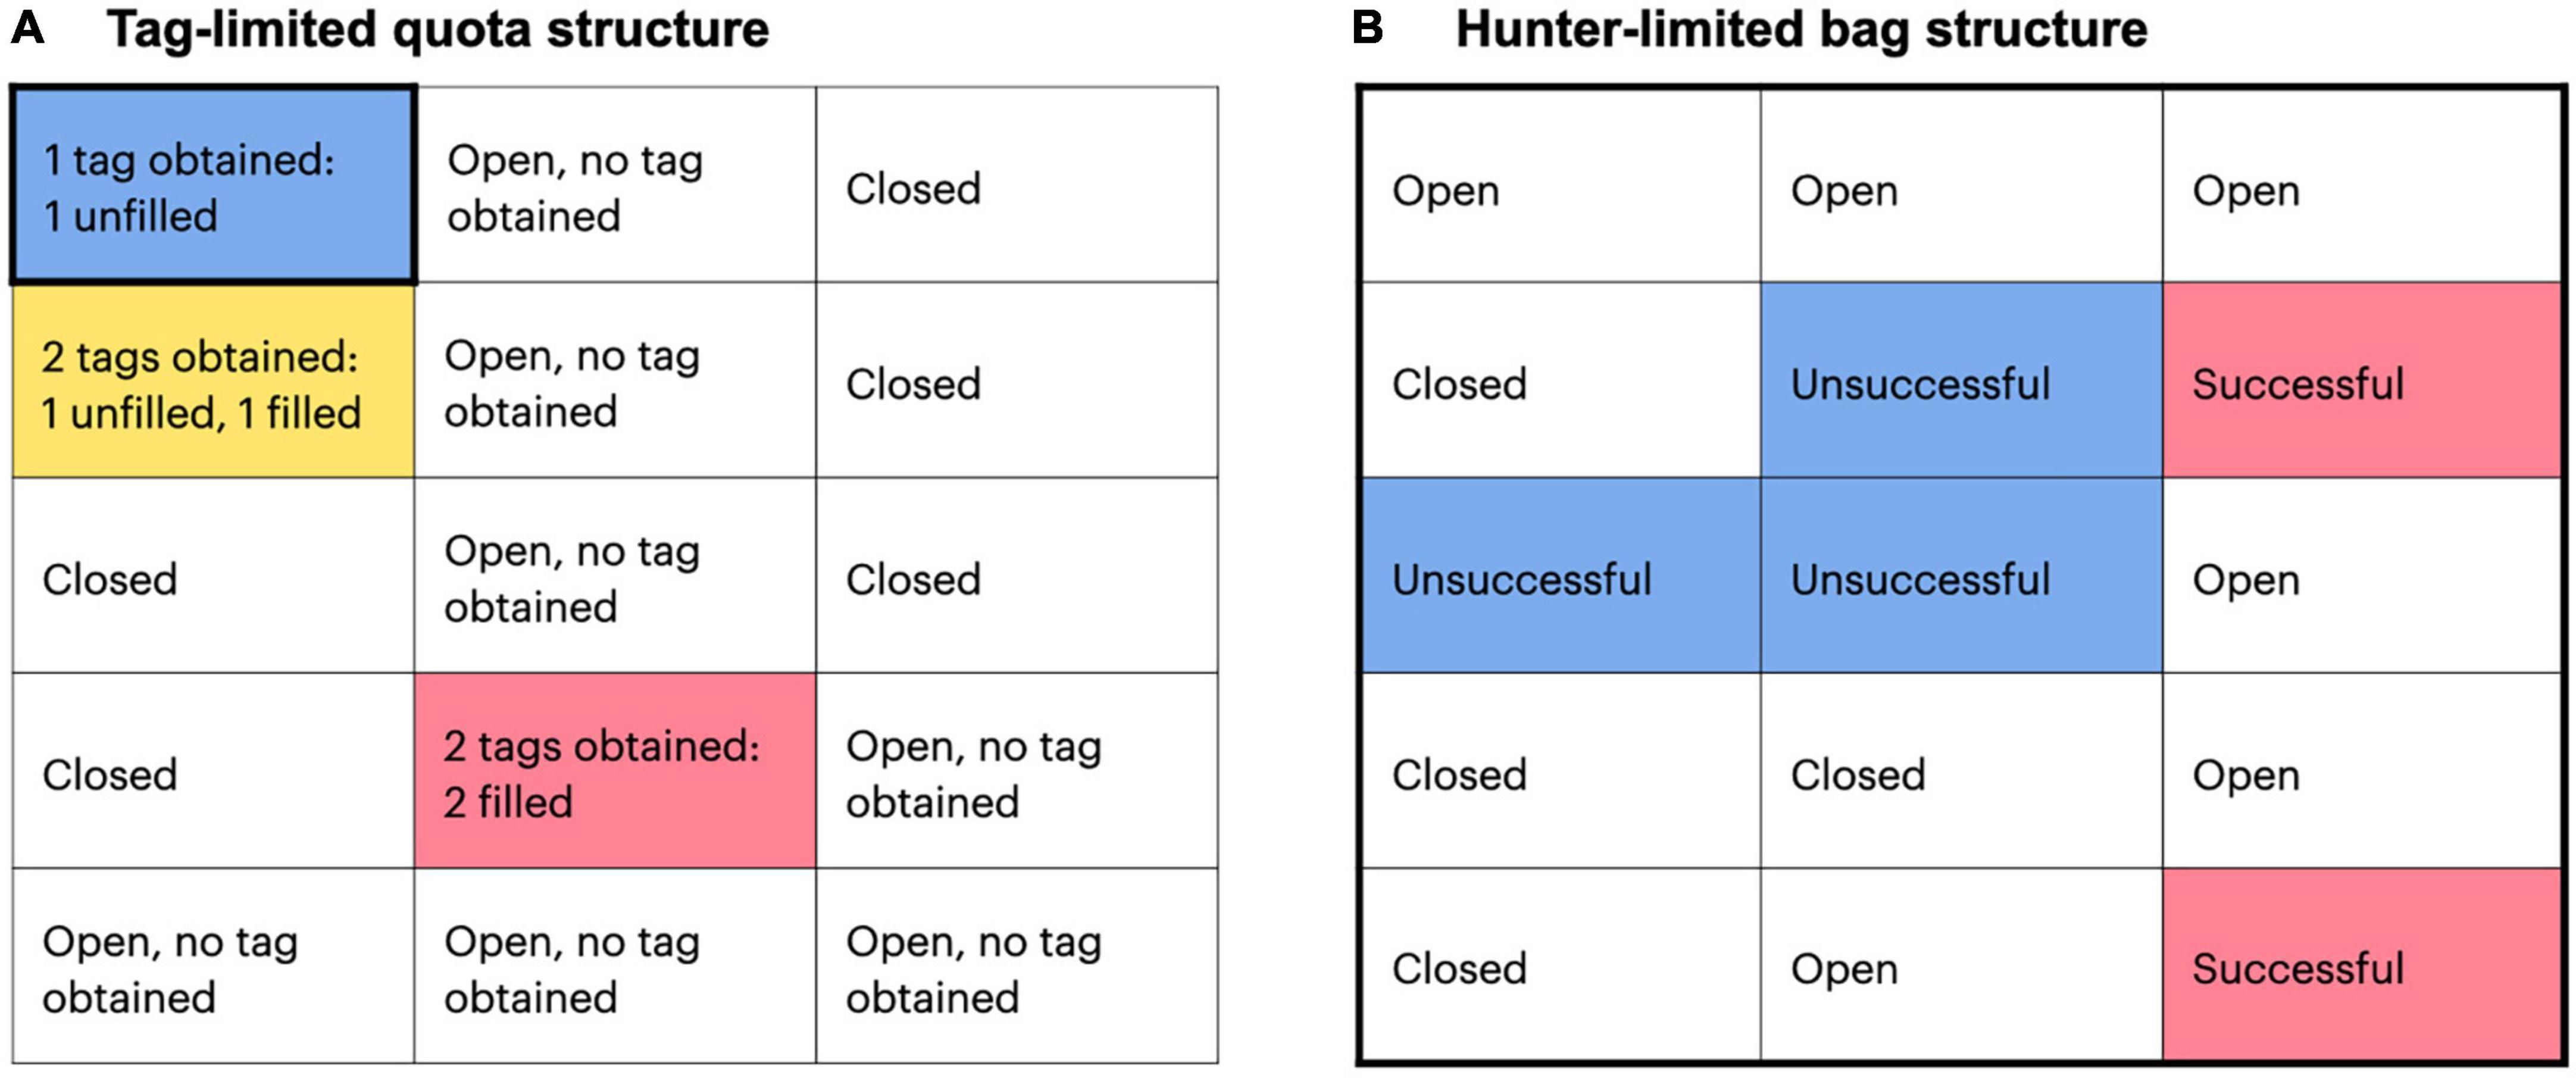
Figure 2. Hypothetical examples of harvest data recording for (A) quota structure and (B) bag structure, where the outer square represents a large spatial scale, such as a state, nested rectangles represent deer management units, and the thicker border represents the spatial scale of tag issuance. Units can be Open or Closed to hunting, and given that hunters attempt to fill their tags, hunters can be (A) unsuccessful (blue), successful (red), or partially successful (yellow), or (B) unsuccessful (blue) or successful (red) within a unit. In panel (A), hunter success can be estimated because the scale of tag issuance is the same as recorded harvest. In panel (B), tags are issued at the large spatial scale, but harvest is recorded within each management unit; hunter success can only be estimated if unsuccessful units are also recorded.
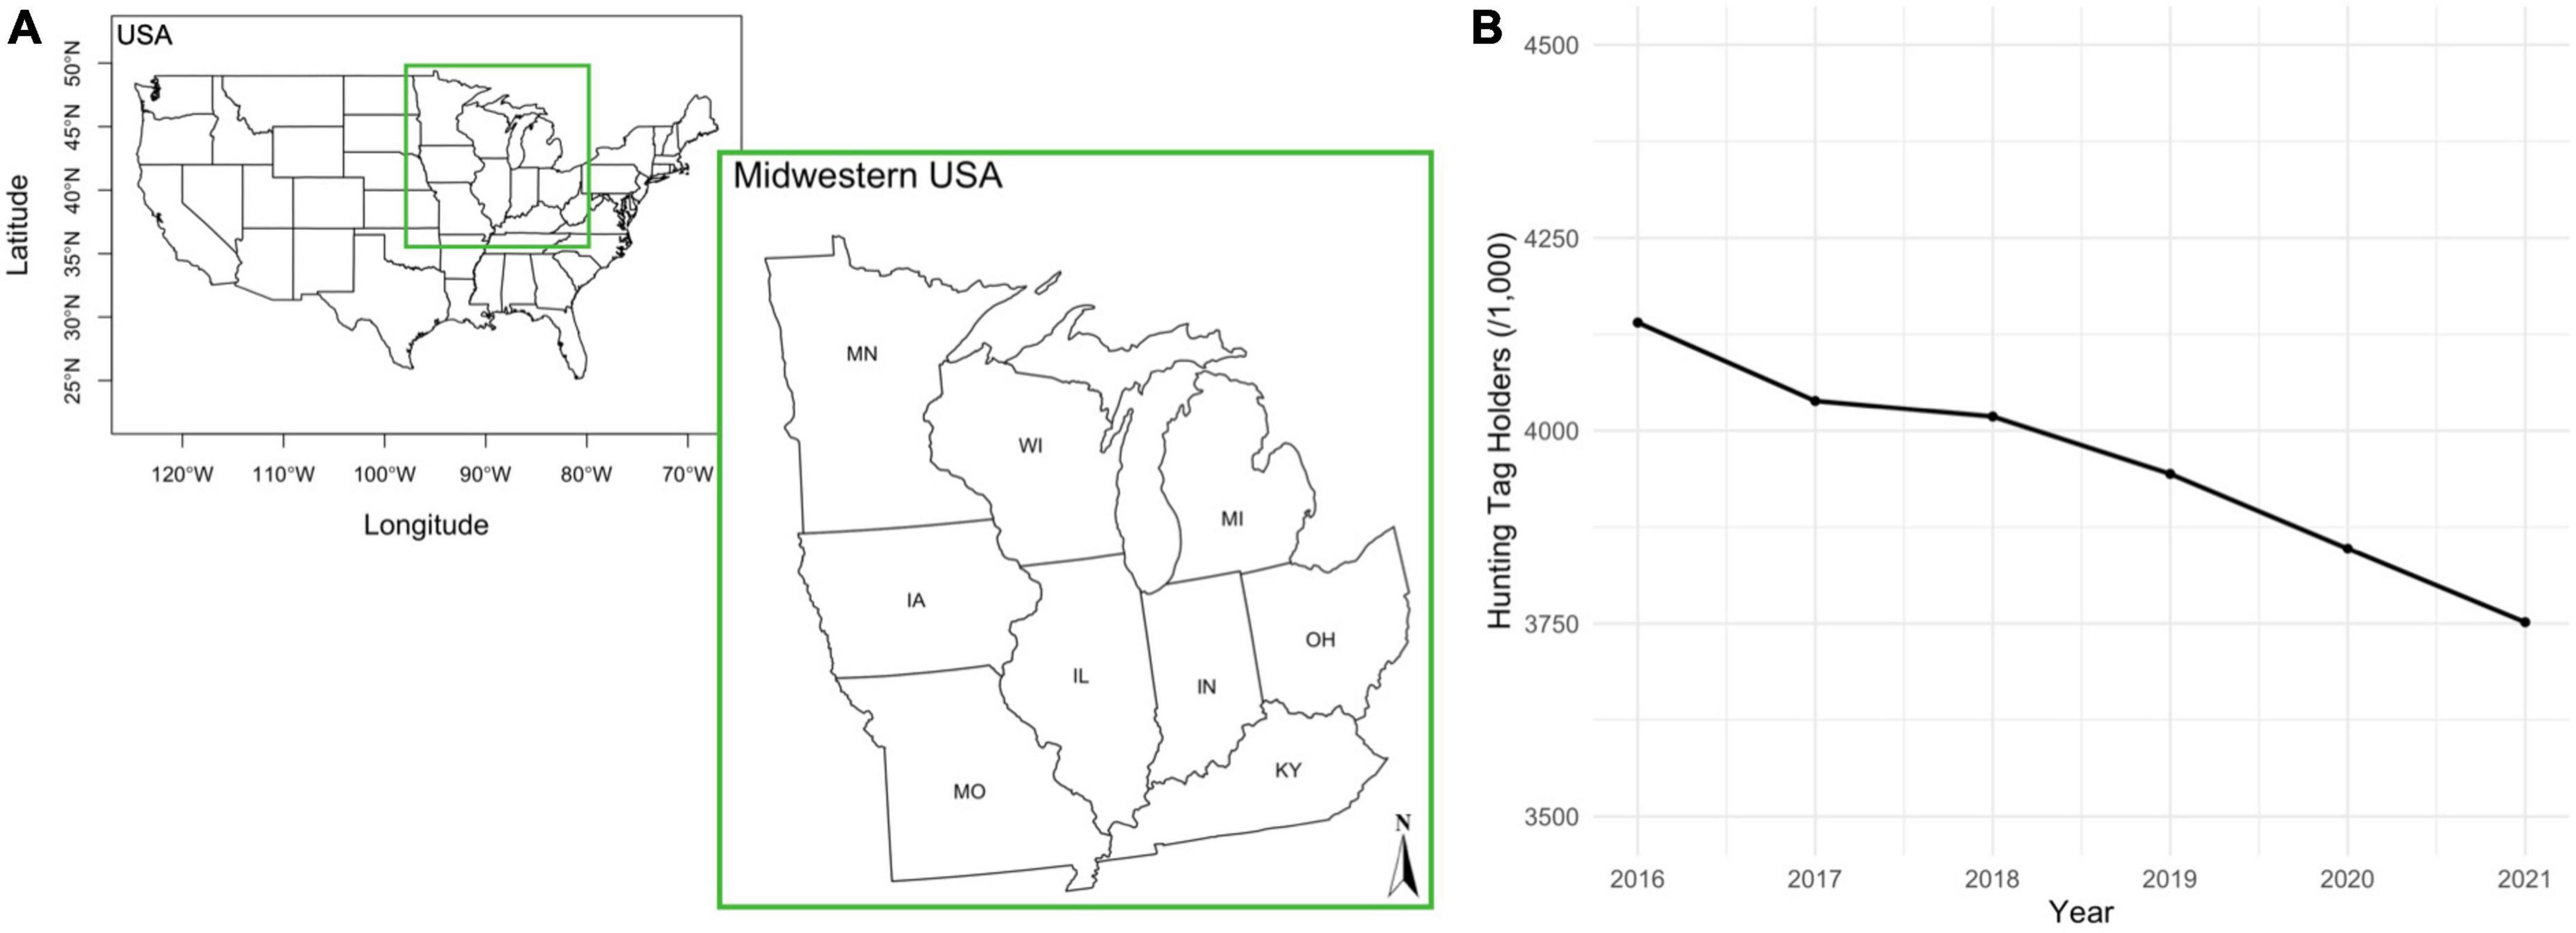
Figure 3. (A) An inset map of nine Midwestern states of interest: Iowa (IA), Illinois (IL), Indiana (IN), Kentucky (KY), Michigan (MI), Minnesota (MN), Missouri (MO), Ohio (OH), and Wisconsin (WI). (B) The number of hunting license holders across the nine states in panel (A) from 2016 to 2021 [y-axis range: 3.5–4.5 million, data from USFWS (2021)].
Further, hunter-level metadata can be very useful to state agencies for examining hunter recruitment and retention. Demographic and behavioral information about hunters can be used to analyze hunter recruitment and retention rates stratified by different groupings of interest (e.g., age, gender identity, residency, years of hunting experience) or management practices (e.g., tag price) (Gude et al., 2012; Hansen et al., 2012; Schorr et al., 2014; Hinrichs et al., 2020). In Montana, for example, there was high recruitment of young hunters, particularly women, from 2002 to 2011; yet retention of this group declined as hunters aged (Schorr et al., 2014). Taken a step further, this information could be used for marketing or communications to specific groups of hunters. In the same Montana example, targeting communications and hunting incentives to young women hunters could have been conducive for maintaining recruitment or improving retention. When paired with social science, this approach can be very powerful for understanding and responding to hunter motivations and behavior (Hansen et al., 2012; Larson et al., 2014).
Importantly, hunter responses to changes in wildlife management can be counterintuitive or unpredictable. For example, Indiana Department of Natural Resources was under a general deer management policy to decrease the deer population from 2012 to 2016 (Caudell and Vaught, 2018). To accomplish this, many counties (23–45 counties, depending on the year) allowed very high antlerless harvest (e.g., eight per hunter per county), yet average per capita harvests remained less than two deer, and harvests did not consistently correlate with increasing or decreasing bag limits. For instance, in Hendricks County, Indiana, there was no apparent relationship between the number of deer harvested per hunter and changes in bag limits, which decreased from eight additional antlerless deer (2007–2017) to three (2018) to two (2019–2020). Harvest number significantly fluctuated (i.e., ±more than two standard deviations) when compared to the preceding 5-year average, during which harvest was mostly stable (i.e., 2007–2017). There was not a significant decrease in harvest when the bag limit was reduced from eight additional antlerless does to three in 2018. Likewise, when the quotas were stable between 2019 and 2020, there was a significant increase in harvest [e.g., 8.7% increase in antlerless deer harvest from 2019 to 2020; Indiana County Deer Statistics (2022)]. These examples of complex or counterintuitive hunter behaviors highlight the importance of collecting high resolution data.
Midwestern deer harvest and management data collection
To learn about current and past harvest management and data collection practices, Wisconsin Department of Natural Resources administered a questionnaire to nine Midwestern state agencies: Illinois, Indiana, Iowa, Kentucky, Michigan, Minnesota, Missouri, Ohio, and Wisconsin (Figure 3A, Table 1, and Supplementary material; Tribes were not included in the questionnaire). The Midwest is located between the Great Plains and the Appalachian Mountains, and can be characterized by its land cover (primarily cultivated and deciduous forest/mixed deciduous and coniferous forest) and geography relative to the Great Lakes. Deer are abundant in this region (at least nine million deer in 2020) and there are approximately four million registered hunters annually (Figure 3B; USFWS, 2021). The overarching goals of the questionnaire were to compare white-tailed deer management practices and data collection practices across Midwestern states, identify the practices that limit our understanding of the harvest process, and find opportunities for data standardizations. The questionnaire included questions relating to management and harvest data resolution and spatial scales with a focus on how antlered and antlerless deer tags are issued and harvests recorded (Table 1). We were also interested in how states responded to CWD in terms of management goals and mechanisms, and if these responses changed throughout the course of an outbreak (Section “Implications for disease management”). We focus on the overarching management systems in place, which are primarily enacted on private property (9/9 states indicated that most deer are hunted on private property). Results from the questionnaire are described in Sections “Midwestern deer harvest and management data collection” and “Implications for disease management.”
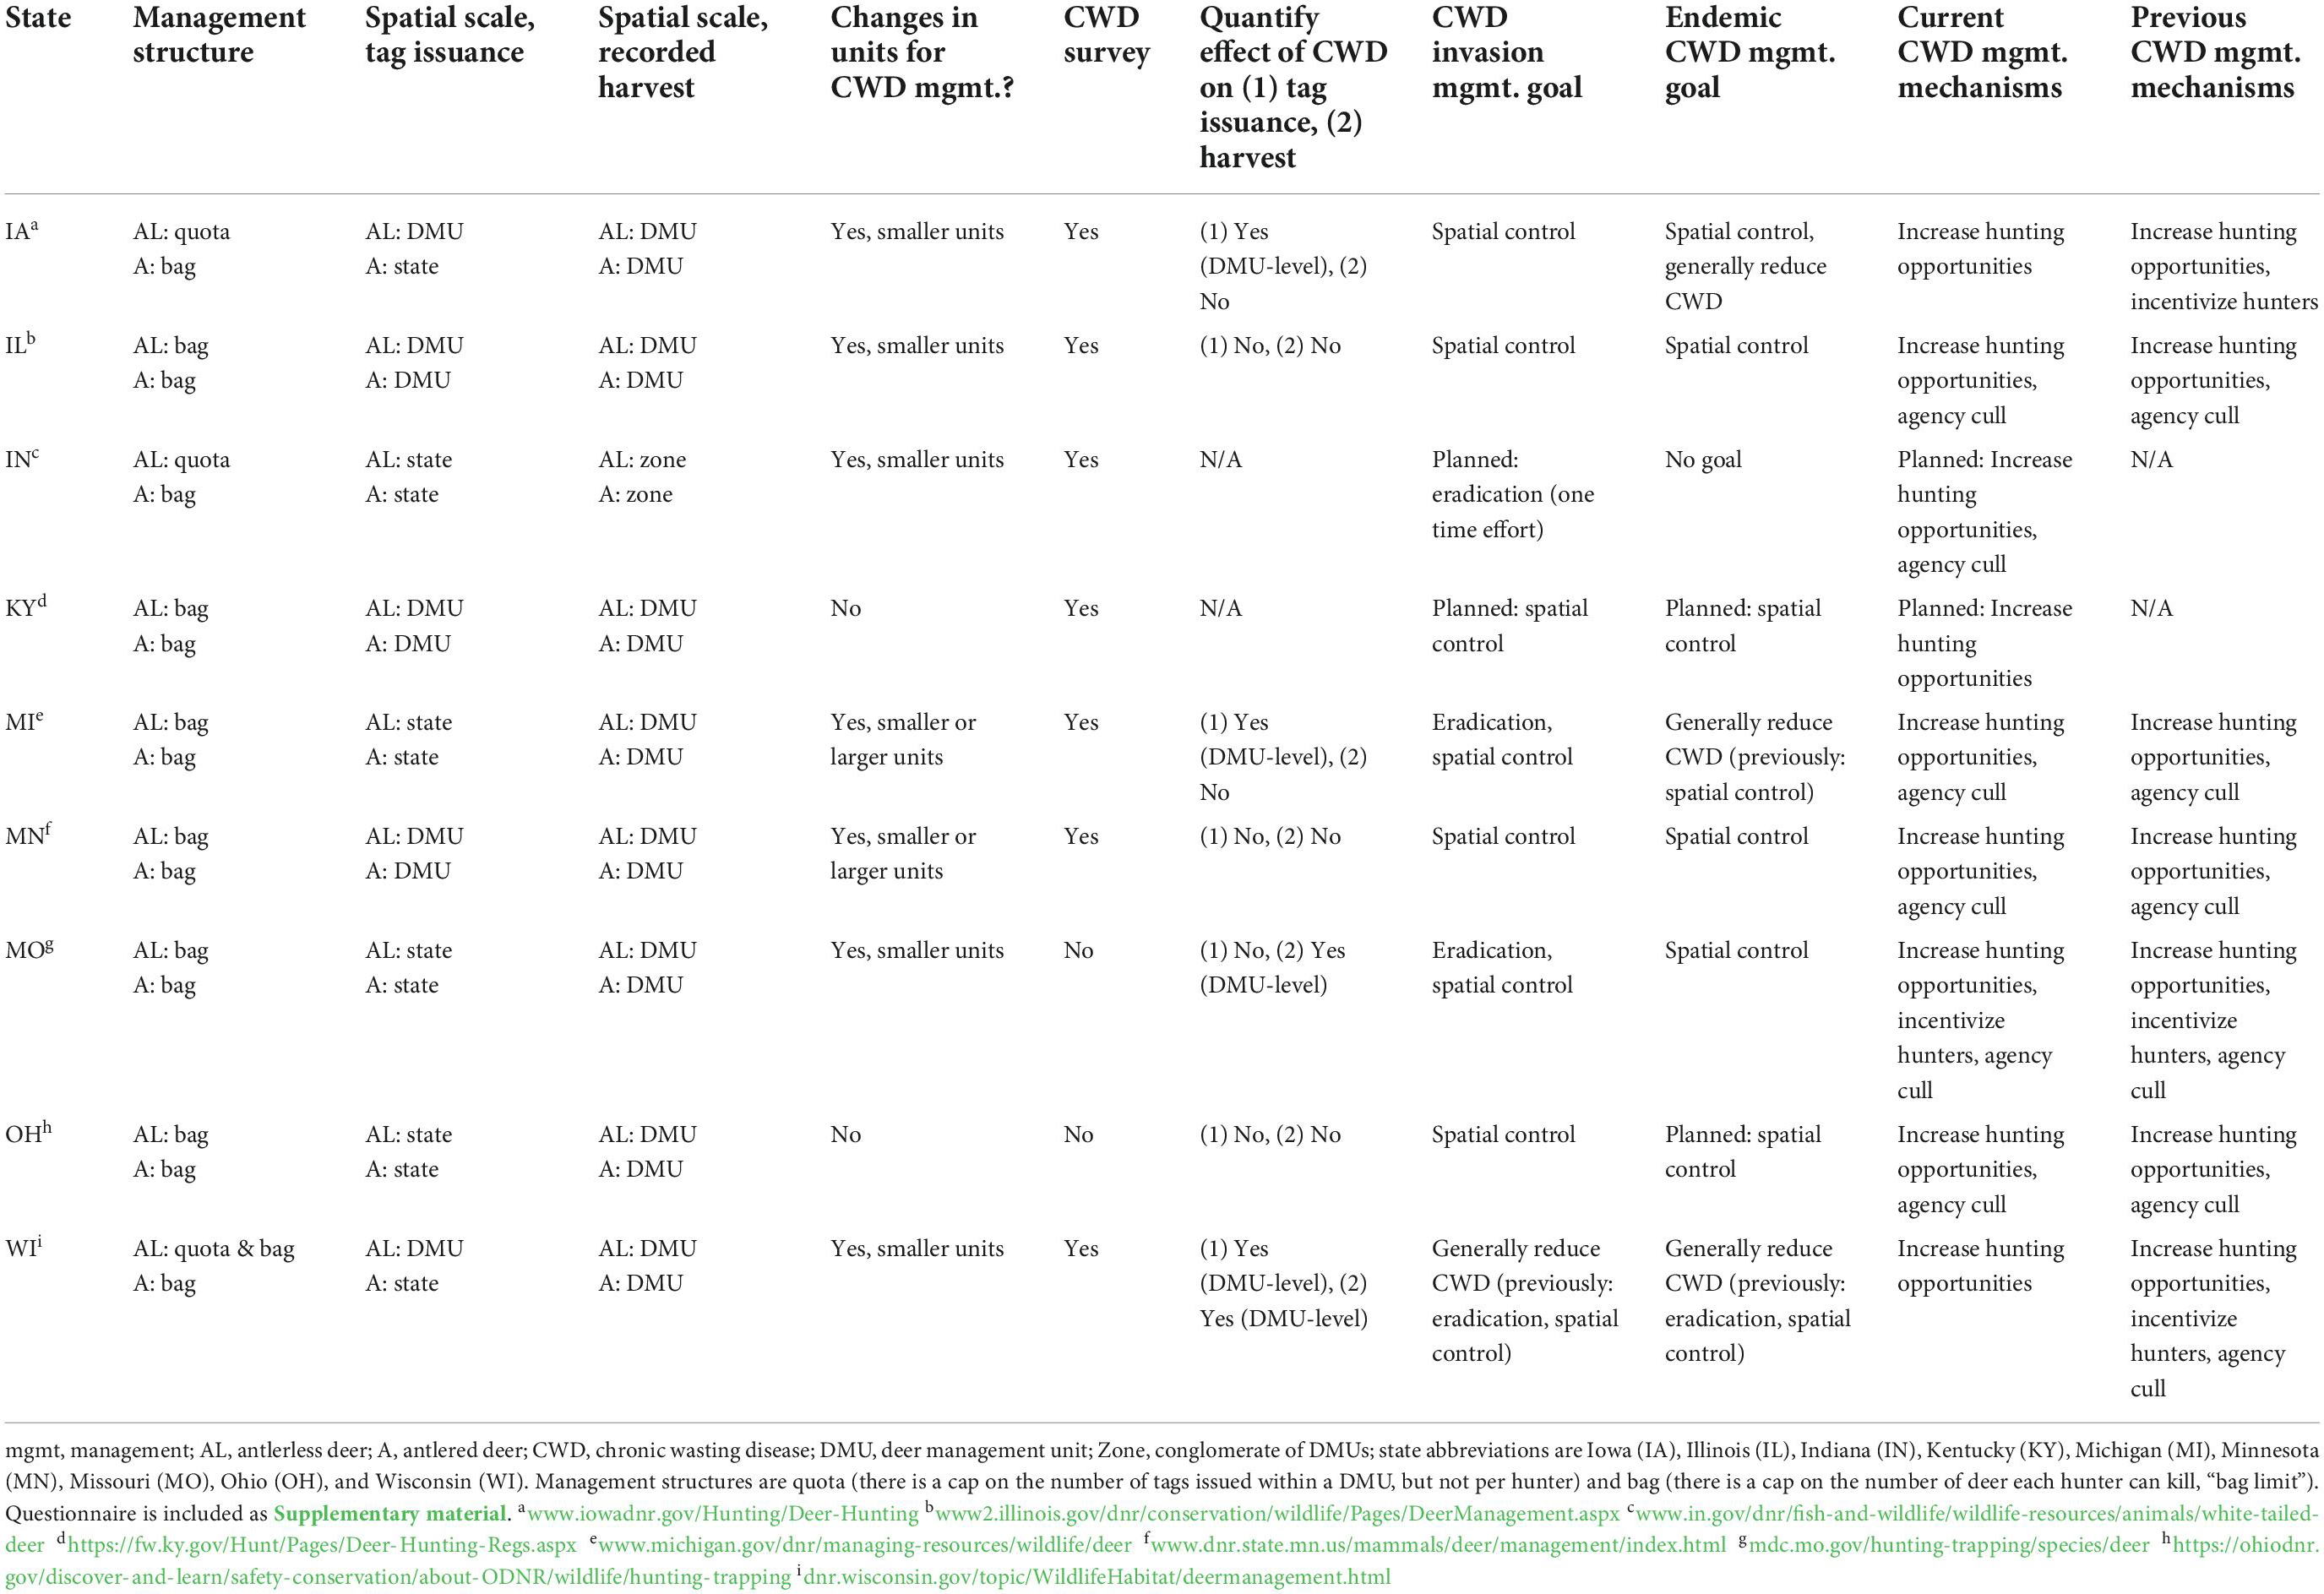
Table 1. Summary of white-tailed deer management and resolution of data collection in Midwestern states.
We identified two major antlerless deer management structures that we define as quota structure and bag structure. Under a quota structure, deer harvest is limited by setting a cap on the number of tags that can be issued within a DMU. A tag quota (maximum number of tags that can be issued) is set at the DMU level; hunters can then purchase tags, without a per hunter limit, until the tag quota is met. This antlerless deer management structure generally describes the structures used in Iowa and Indiana. More commonly, we observed a bag limit (maximum number of deer that can be harvested) per hunter either at the state or DMU level. Under this bag structure, deer harvest is limited by setting a cap on the number of deer each individual hunter can kill within a given DMU. This antlerless deer management structure generally describes the structures used in Ohio, Minnesota, Michigan, Missouri, and Kentucky. There are two primary types of Wisconsin antlerless tags that are issued differently: bonus tags are available for purchase in most DMUs in the state following a quota structure, and a predetermined number of free farmland tags come with the purchase of an antlered tag and can only be filled in specific DMUs in the state. Therefore, Wisconsin antlerless deer tag issuance is best described by a quota structure for bonus tags, and a bag structure for free farmland tags.
Antlered deer management across the nine Midwestern states is a bag structure, with typically a 1–2 buck harvest limit per hunter (by the same or different weapon types, valid statewide). Some of these states also apply lottery systems where hunters purchase entries and a predetermined number of individuals can receive tags per DMU. Illinois uses either sex and antlerless tags; this agency applies a bag limit to antlered bucks and most antlerless deer harvest is regulated by unit-level quotas, but without a statewide cap. Therefore, management in Illinois is closest to a quota structure for antlerless deer and a bag limit for antlered deer.
Distinguishing between these two management structures is important because the maximum potential deer harvest is limited by different components of the hunting process. Under a quota structure, hunter demand for tags often determines the maximum potential deer harvest [Figure 1A–(3)]—in other words, when quotas are set at or above hunter demand, the maximum potential harvest is limited by hunter demand. Under a bag structure, the maximum potential deer harvest per hunter is predetermined, therefore the number of hunters that are recruited and retained will determine the maximum potential harvest [Figure 1A–(2)]. Both structures are influenced by hunter willingness and ability to fill their tags [Figure 1A–(4–6)], but identifying the source of their major limitations can focus management responses to changing harvest trends. Future research about the relationship and potentially compensatory effects between the number of potential hunters and per capita demand for tags may clarify how these structures differ in practice. For example, these two structures may operate similarly if hunter demand for deer decreases as the number of hunters on the landscape increases, and therefore managers under a bag structure may want to increase bag limits as hunter populations decline and managers under a quota structure may want to set per capita limits on tag purchases. Alternatively, hunter demand may not be precisely estimable under a bag structure when demand is lower than the bag limit, but hunter demand is estimable under a quota structure when the quota has not been reached.
We conceive that the quota structure can be more useful in terms of quantifying hunter behavior and potential harvest because it provides more data about hunter demand for tags, or the maximum number of deer a hunter is willing to kill. As a simplified quota structure example, the quota in a DMU exceeds demand, and thus a hunter can purchase as many tags as they desire until tags are sold out—this system provides specific information about how many tags, and tag types, each hunter desires. However, if quotas are set lower than hunter demand and tags sell out within a DMU, hunter demand may be censored and relatively more challenging to estimate (although possible using censored distributions in mixed statistical models). Under a bag structure, a hunter is given a predetermined number of tags that may be more or fewer than the number of tags they actually desire, and hunter demand is unknown without follow-up surveys. Because tags are issued individually under a quota structure, we can study hunter desires and behavior at a finer resolution than bag structures. This data resolution is essential for separating the hunting process into the distinct processes of tag acquisition and harvest.
Linking individual hunters to their tags and harvests, at the appropriate spatial scales, is critical for science-informed management. Tracking individual hunter data is a more recent development likely due to technological improvements such as database-user interfaces, constituent accessibility to computers, and even smartphone applications (used in Missouri). Most Midwestern state agencies have transitioned to collecting hunter-level data within the past 15 years, suggesting these finer-resolution data have high utility to agency biologists (Illinois has collected these data for several decades; Michigan is currently in the process of implementing this data collection). For example, 8/9 states can track numbers of tags by type (e.g., weapon-specific) each hunter obtained annually. In the Midwest, 9/9 states record harvested deer age and sex linked to each hunter, and 8/9 states additionally track deer harvested by specific tag type and hunting season. Mandatory harvest registration aids in hunter-level data collection (8/9 states), yet only 4/9 states conduct post-hunt surveys to estimate error in registered harvest.
From our questionnaire, we found that mismatch between the spatial scale of tag issuance and recorded harvest was common, especially for antlered deer. For antlered deer: 6/9 states issued tags that were valid statewide, but harvest was recorded at smaller scale: DMU (5/6) or Zone (1/6; conglomerate of DMUs); only 3/9 states issued tags and recorded harvests at the unit-level. For antlerless deer, 4/9 states issued tags that were valid statewide, but harvest was recorded at smaller scale: DMU (3/4) or Zone (1/4); only 5/9 states issued tags and recorded harvests at the unit-level. Interestingly, one state (Michigan) recently transitioned from a system where antlerless tag issuance and recorded harvests were at the same spatial scale (DMU), to a mismatched system where tags are issued at the state-level and harvests are recorded at the unit-level. Importantly, at least three states have significantly changed their DMU boundaries within the past two decades, such as switching from DMU boundaries based on roadways and ecological features to counties (Missouri, Wisconsin), which disrupts time series data and can decouple deer population trends from ecological context.
As described more comprehensively in Section “The hunting process,” spatial mismatch between tag issuance and harvest data limits the questions that researchers and managers can ask and answer. For example, to answer the question “What factors influence deer harvest success?”, data must be collected about where each hunter hunted and if they were successful or not. When data are collected in the same way for both sexes, the question above could be rephrased as “Are there different factors influencing deer harvest success for antlerless versus antlered deer?” These types of questions may be of interest to state wildlife agencies because antlerless deer harvests are the primary control mechanism for deer populations, while antlered deer harvests are of high importance to many hunters.
Implications for disease management
The importance of hunter participation for research and management of infectious diseases in hunted wildlife cannot be overstated (Blanchong et al., 2006). In hunted species, disease control in the U.S. is primarily implemented through increasing harvest opportunities for hunters by increasing the numbers of deer that hunters are allowed to kill in specific areas (Figure 4B). Similarly, most surveillance systems are designed from the foundation of the NAMWC such that recreational hunters are expected to actively and voluntarily participate in monitoring and research processes [i.e., provide tissues for testing and diagnosis; e.g., Walsh (2012)]. Because of this system, hunter-killed deer typically comprise nearly all samples for disease surveillance—a sampling scale (both in geographic extent and number of samples) that may be impossible to reach without hunter participation. However, due to differences in state-level management structures, disease-related regulations, and short-lived disease response initiatives, efficacy of harvest-based management during epidemics and its influences on harvest-based disease surveillance systems are poorly understood.
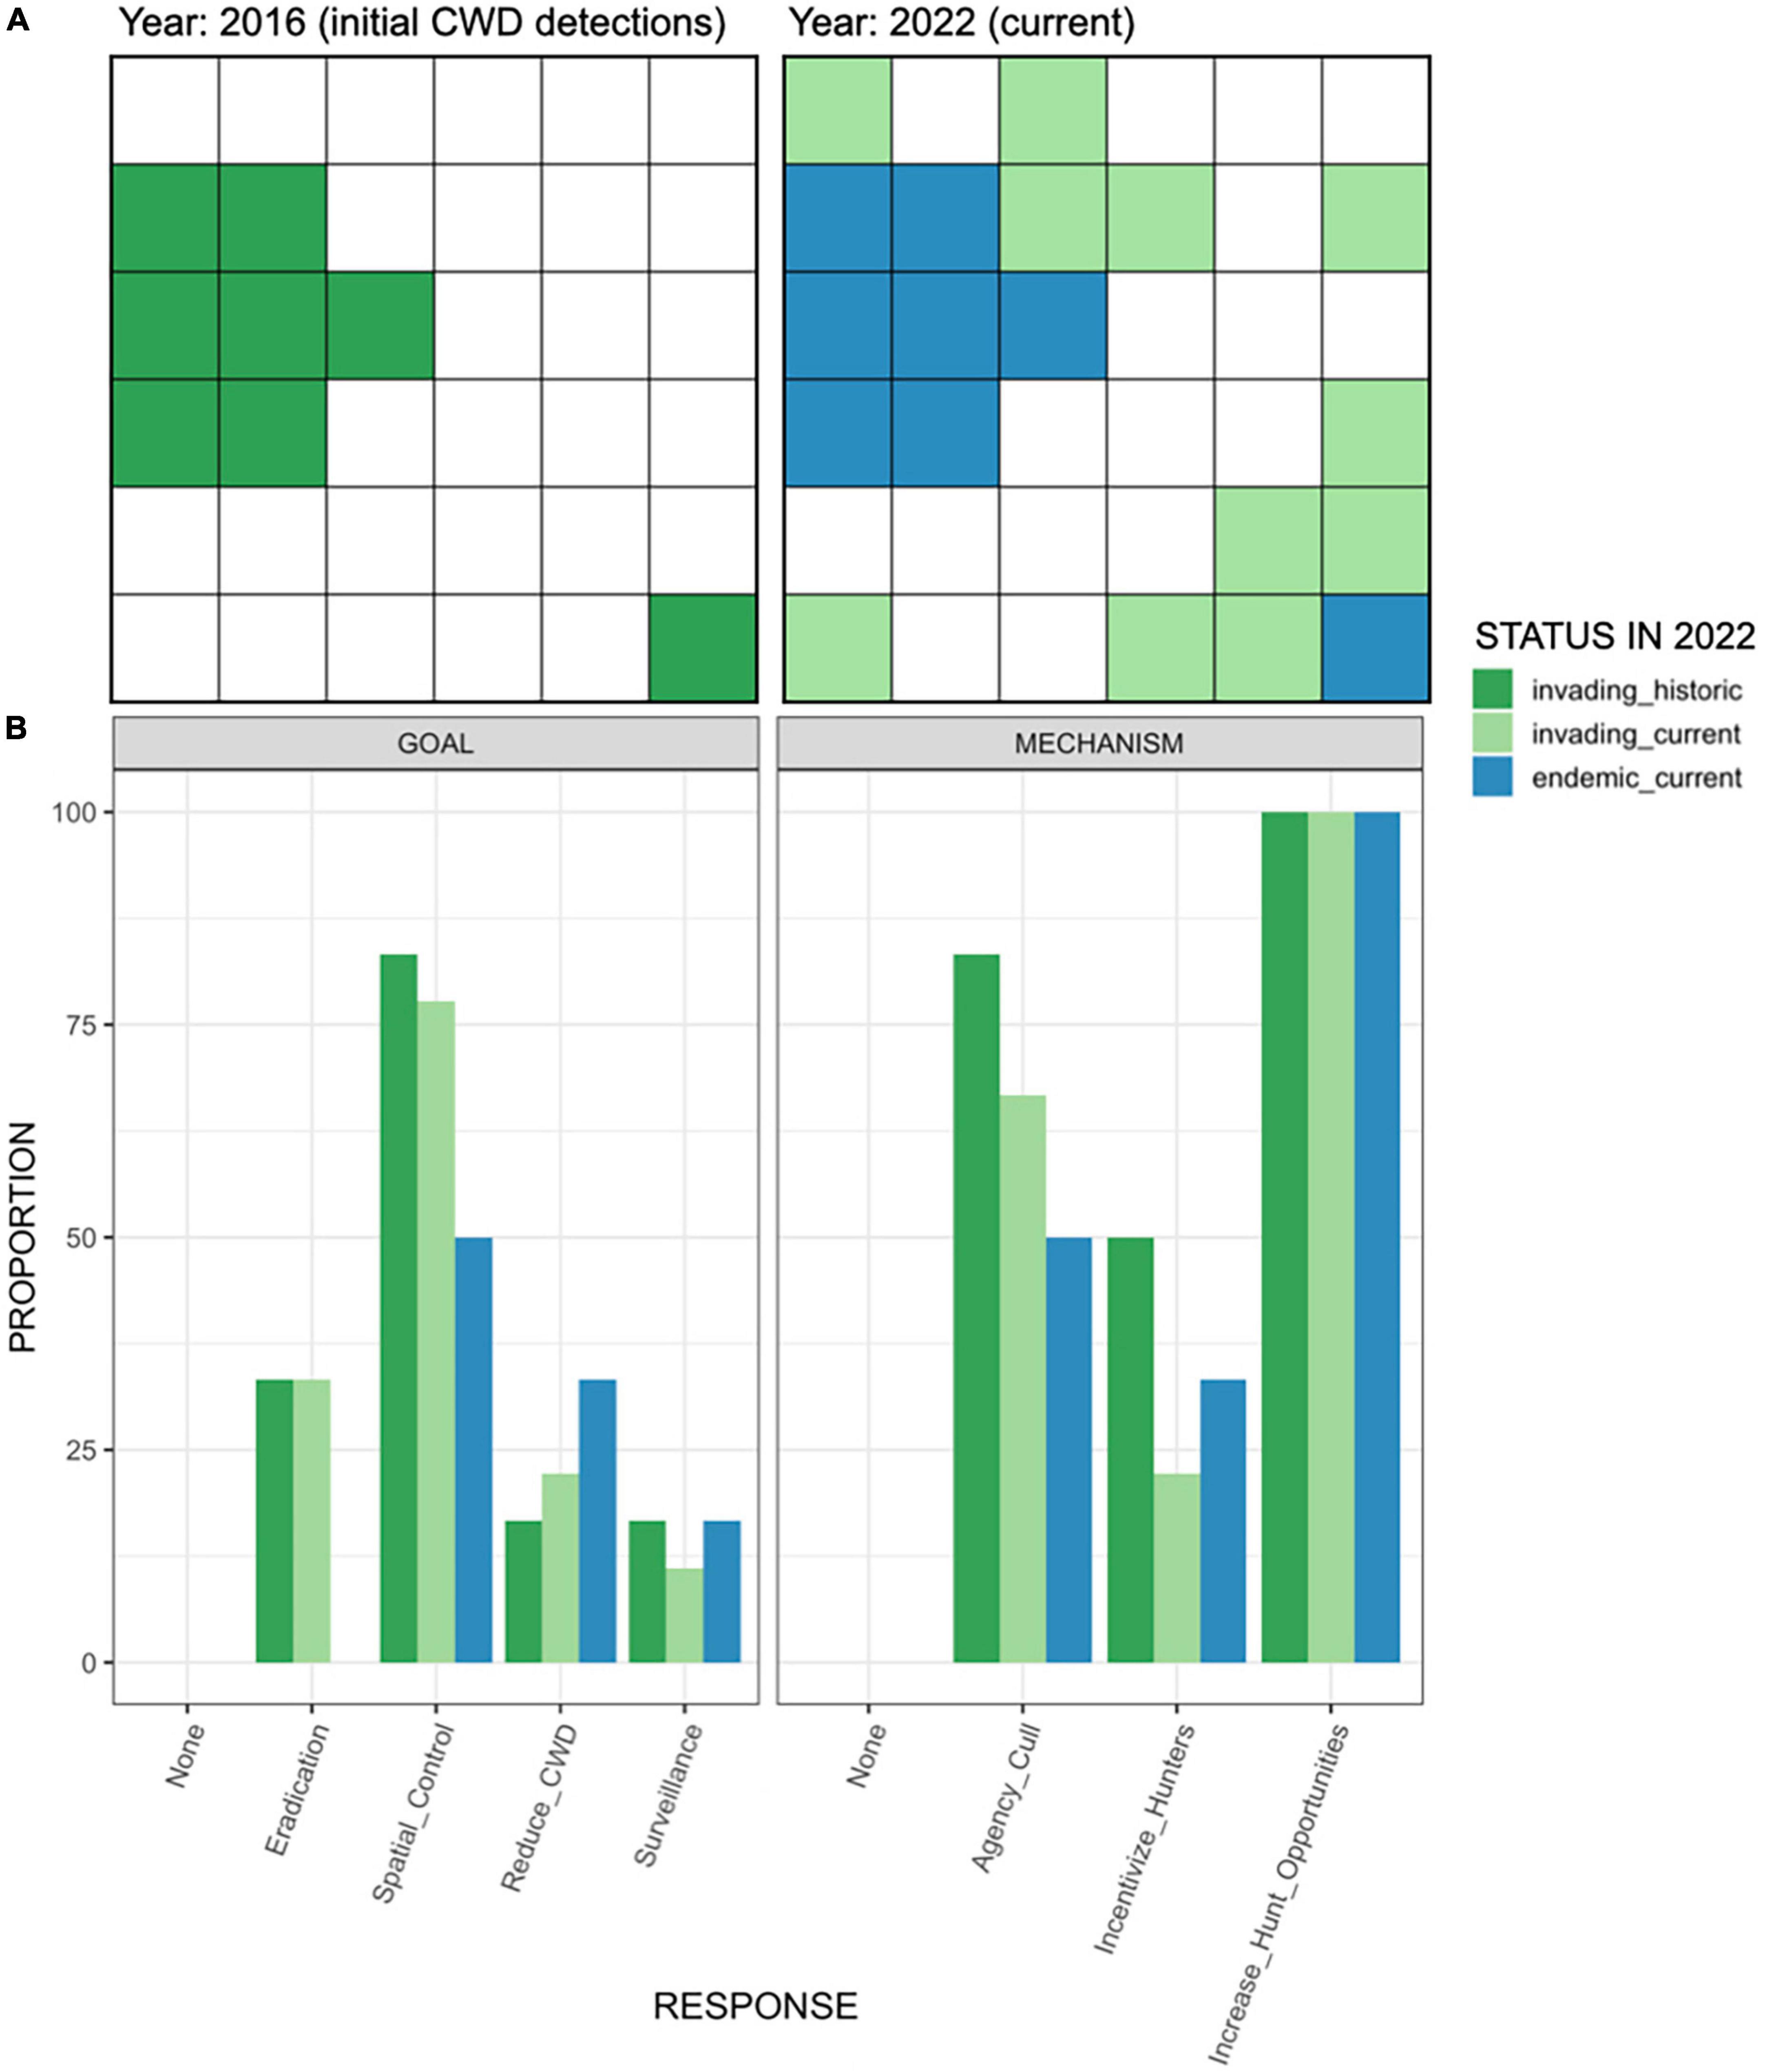
Figure 4. (A) Hypothetical example of chronic wasting disease (CWD) status classifications of deer management units (grid squares) in a state (larger 6 × 6 square) from 2016 when CWD was first detected in the state to the current year 2022. CWD status across the state is partitioned by CWD presence: invading (CWD present for <5 years, green shades), endemic (CWD present for ≥5 years, dark blue), and undetected (white). CWD status is also partitioned by time: current (light green, dark blue) and historic (dark green). (B) The proportion of state agency responses to CWD in terms of management goals (left panel) and management mechanisms (right panel) based on current CWD status (endemic, currently invading, historically invading). To compare CWD responses through time in the same area, compare the dark green to dark blue responses [shown in panel (A)]; to compare how responses to CWD invasion have changed, compare the dark green to light green responses [shown in panel (A)]. Management goals include: none, eradication, spatial control, generally reduce CWD prevalence, and implementation of/increased surveillance. Management mechanisms include: none, agency-regulated/sponsored culls/removals, incentivizing or requiring hunters to kill more deer, and increasing hunting opportunities.
We collected information about state agency responses to CWD in the questionnaire we disseminated to nine states across the Midwest. We stratified CWD responses by the stage of the CWD outbreak: endemic, invading, or not detected (Figure 4A); states could have areas defined by any of the three stages. Endemic meant that CWD was known to be present for at least 5 years, invading meant CWD was detected less than 5 years ago, and CWD may be not detected opportunistically or via a surveillance program. Finally, we stratified CWD responses by time in terms of current response (relative to each state; see Box 1) to CWD and historic response to CWD (when CWD was newly detected in now-endemic areas, relative to each state; see Box 1). We separated two aspects of responses, management goals (agency goals for CWD management or dynamics; see Box 1) and management mechanisms (actions implemented to achieve management goals; see Box 1; Figure 4B), and states were able to select any option that applied (i.e., non-mutually exclusive).
Chronic wasting disease outbreak dynamics are heterogeneous across the Midwest: 6/9 states had areas that could be classified as endemic, invading, and not detected, 1/9 states had areas of invading or not detected CWD (i.e., no endemic CWD, Ohio), and CWD had not been detected in 2/9 states (Indiana, Kentucky). State agencies in Indiana and Kentucky had a CWD response plan in place at the time of the questionnaire, despite CWD not detected in these states; therefore the denominator from questionnaire results varies between seven (seven states where CWD had been detected) or nine (all states including planned responses).
The most common CWD management goal was spatial control, meaning slowing or stopping the geographic spread of CWD from invading areas or identified hot spots, and this goal persisted through time (Figure 4B). The goals of CWD management shifted with time due to negative stakeholder responses, cost and logistical challenges of management mechanisms required to achieve goals, and general ineffectiveness of CWD management. For instance, none of the three states with eradication goals maintained (or planned to maintain) this goal if CWD persisted for five or more years, but it was still fairly common upon CWD invasion. Depending on the outbreak stage, one or two states had a non-specific goal to generally reduce CWD prevalence, and one or two states aimed to improve CWD surveillance but not manage the disease specifically. All states had at least one management goal.
All nine states included here implemented at least one CWD management mechanism, and all mechanisms focused on increasing deer removal rates. The most common CWD management mechanism was increasing hunting opportunities within designated areas (Figure 4B). Most state agencies also applied culls when CWD invaded (6/7) but only Illinois maintained a long-term culling program. Depending on the CWD stage, two to three states incentivized hunters to harvest more deer, but this was not always maintained through time. State agencies cited the cost, effort, and public dissatisfaction with culls and incentive programs as the main reasons they ended these practices (e.g., Van Deelen et al., 2010). Areas designated for CWD management differed from the typical spatial resolution for managing deer in 7/7 states where CWD had been detected. Agencies in all six states with endemic CWD created new management units for disease control purposes, 4/6 states indicated CWD management units were smaller and 2/6 states indicated they could be smaller or larger than existing DMUs. This creation of new management units could be problematic from an analytical standpoint—especially when tag acquisition or harvest data are aggregated to the unit-level—because it prohibits analysis of hunting trends with respect to disease through time at a consistent resolution. An alternative could be to make smaller units within the current, larger DMU boundaries, and (at least for a portion of hunters) require geospatial coordinates of deer harvested. However, this alternative may be unrealistic in practice based on the spatial extent of the disease and planned control measures, as well as the potential reluctance of hunters to providing such detailed data.
Midwestern state agency responses to CWD, as recorded from our questionnaire, were similar to, or more extreme than, responses in other states. For instance, in 22 surveyed states with CWD present across the U.S. (including some Midwestern states we also surveyed), 27–54% of states increased hunting opportunities depending on the management practice (Miller and Vaske, 2022), compared to 100% of nine Midwestern states we report on here. Similarly, agency culling was less common at a national scale where CWD was present [32% of 22 states; Miller and Vaske (2022)], compared to the Midwest (50–83%). However, some of these differences may be due to differential management of white-tailed deer compared to mule deer (Odocoileus hemionus).
Many state agencies and researchers have studied hunter responses to CWD resulting in dozens of surveys focused on how hunters perceive CWD risk to human and cervid health and their opinions of CWD management (e.g., Needham et al., 2004, 2006; Vaske, 2010; Haus et al., 2017; Vaske et al., 2021). Most Midwestern states (7/9) indicated they have surveyed hunters about CWD, largely reflecting national trends in CWD survey dissemination by state agencies (Miller and Vaske, 2022). However, hunter perceptions of CWD risk and responses to CWD (e.g., hunter participation) are highly inconsistent across states, as well as inconsistent across years within the same state (Haus et al., 2017; Holland et al., 2020). Only 3/7 and 2/7 states indicated they complemented surveys with empirical quantification of changes in the number of tags that hunters obtain and fill, respectively, as CWD prevalence changes, and these analyses were conducted at the unit-level. Thus, we currently lack a strong empirical understanding of if and to what magnitude individual hunters actually change their behavior with respect to infectious diseases in white-tailed deer, and how responses change through the course of an epidemic. We believe this is an important gap in the literature.
One of the few examples linking surveys and empirical harvest data is Holland et al. (2020), built on Haus et al. (2017)—they surveyed Maryland hunters about if and how they planned to change their hunting behavior due to CWD proximity. The authors retrieved and analyzed hunting records for hunters that claimed they would alter their behavior by reducing hunting participation, to compare their claims and behaviors. The proportion of hunters who changed their behavior due to CWD was not affected by proximity to CWD detection. Still, people who hunted in CWD-affected counties with negative perceptions of CWD decreased their per capita harvest rates temporarily following CWD detection, but harvest rates rebounded after 4 years. This type of analysis may not be possible without hunter-level data collection, including longitudinal tracking of individual hunters and annual per capita harvests at the same spatial resolution as CWD surveillance.
Many biologists and hunters speculate that CWD management via white-tailed deer hunting is inadequate (Needham et al., 2004; Holsman and Petchenik, 2006; Potapov et al., 2016; Mysterud et al., 2019). In other words, it might not be plausible to implement a voluntary hunting-based management system for disease control purposes because hunters may not adequately harvest deer (of a certain demographic class) to reduce transmission rates and control disease spread. One of the few comparisons of CWD management response efficacy is between Wisconsin and Illinois following initial CWD detections (“historic invasions”). Wisconsin Department of Natural Resources aimed to eradicate CWD primarily through recreational hunter participation—for example, the agency provided unlimited, free hunting tags in a designated area hoping that hunters would harvest deer at high rates (Heberlein, 2004). Illinois Department of Natural Resources biologists did not believe the hunter harvest rates would be high enough to control the disease, so they introduced a culling program in addition to increasing the number of buck tags hunters could obtain in a designated area (Manjerovic et al., 2014). At least in the short term (10 years), CWD prevalence in the Wisconsin CWD epicenter continued to rise (from ∼1 to 5%) but was controlled in the Illinois CWD epicenter (∼1%) (Manjerovic et al., 2014). This comparison highlights the limitations of management under the NAMWC, and how understanding these limitations can improve the efficacy of management protocols. Government imposed management programs, such as culls, are typically highly unpopular (Needham et al., 2004; Durocher et al., 2022), but a diverse set of management options could be considered in situations where harvest-based management fails.
Actionable steps
The importance of standardizing ungulate data collection across multiple states, especially for implementing an adaptive management framework, is not a new concept (Walters and Holling, 1990; Mason et al., 2006). In fact, 9/9 Midwestern states responded “Yes” to the following question: “Do you believe your agency would be willing to participate in a regional (Midwest/Great Plains) adaptive white-tailed deer management effort, such as a workshop?”, and regional organizations and workshops are common in the fields of wildlife management and ecology, such as regional (e.g., Western, Midwest) Association of Fish and Wildlife Agencies (e.g., WAFWA, MAFWA). However, specific and comprehensive sampling and management protocols may not be fully developed (Williams et al., 2009). While adaptive management may be an ultimate goal of many organizations or researchers (Wasserberg et al., 2009; Miller and Fischer, 2016), in reality, may be rarely employed for managing wildlife populations or diseases, and it may require balanced and replicated factorial experiments with controls and data collected in a standardized and statistically sound manner (Serrouya et al., 2019). As demonstrated here, Midwestern deer harvest data are collected in multiple ways—thus, it may be challenging to implement adaptive management in this region, and likely most other cross-jurisdictional regions, without first standardizing data collection practices. Here we list our suggestions for white-tailed deer management and data collection for Midwestern states, with the aim of linking these practices to comprehensive quantitative analyses. We then present a post-hunt data collection user interface to help implement these suggestions in a standardized fashion. Throughout, we discuss important barriers to implementation. Importantly, our suggestions are broadly applicable to other species, regions, and more specific data that wildlife management agencies may be interested in collecting.
We identified four important attributes that could be included in white-tailed deer harvest management and data collection; these are listed below with brief descriptions or rationales:
(1) The hunter is the main unit for data collection: individual hunters are tracked through time and linked to the number and types of tags they obtain and fill (Sections “The hunting process” and “Implications for disease management”).
(2) Per capita demand for tags and realized harvests are estimable: hunter demand for tags represents maximum potential harvest and is a distinct process from harvesting an animal (filling a tag); a quota structure provides better empirical data for these estimations, but this could also be achieved with a bag structure and follow-up surveys (Sections “The hunting process” and “Midwestern deer harvest and management data collection”).
(3) Spatial resolution of hunter harvest and disease surveillance data collection match management structures, or finer: quantitative data applications are optimized when the spatial resolution of deer management (e.g., tag issuance, quotas), hunter harvest, and disease surveillance match (Sections “The hunting process,” “Midwestern deer harvest and management data collection,” and “Implications for disease management”).
(4) Relevant hunter metadata are collected and registration is mandatory (at a large scale): data collection about unsuccessful hunts is necessary if the spatial scale of tag issuance is larger than recorded harvest, and hunter metadata can be used to integrate social science with management decisions and outcomes (Sections “The hunting process” and “Actionable steps”). These data could be collected for all potential hunters, or more realistically, a statistically valid sample.
Collecting data associated with these attributes can be executed efficiently and relatively simply during the registration/post-hunt survey process through online user interfaces. We designed potential user interfaces that could be used to survey all tag holders (“potential hunters”; Figures 5, 6), as opposed to only collecting data from hunters that harvested a deer, which is standard practice. Figures 5, 6 demonstrate the utility and relative simplicity of post-hunt user interfaces, but require internet or smartphone access for potential hunters to complete; alternatively, a similar mail-based survey could be designed, but may be more cumbersome. We hope these user interface examples are a useful foundation for wildlife management agencies, and metadata collected by the series of questions and prompts can be used to improve our understanding of the effects of management and disease on hunter behavior and harvests, which is a critical gap in our current knowledge.
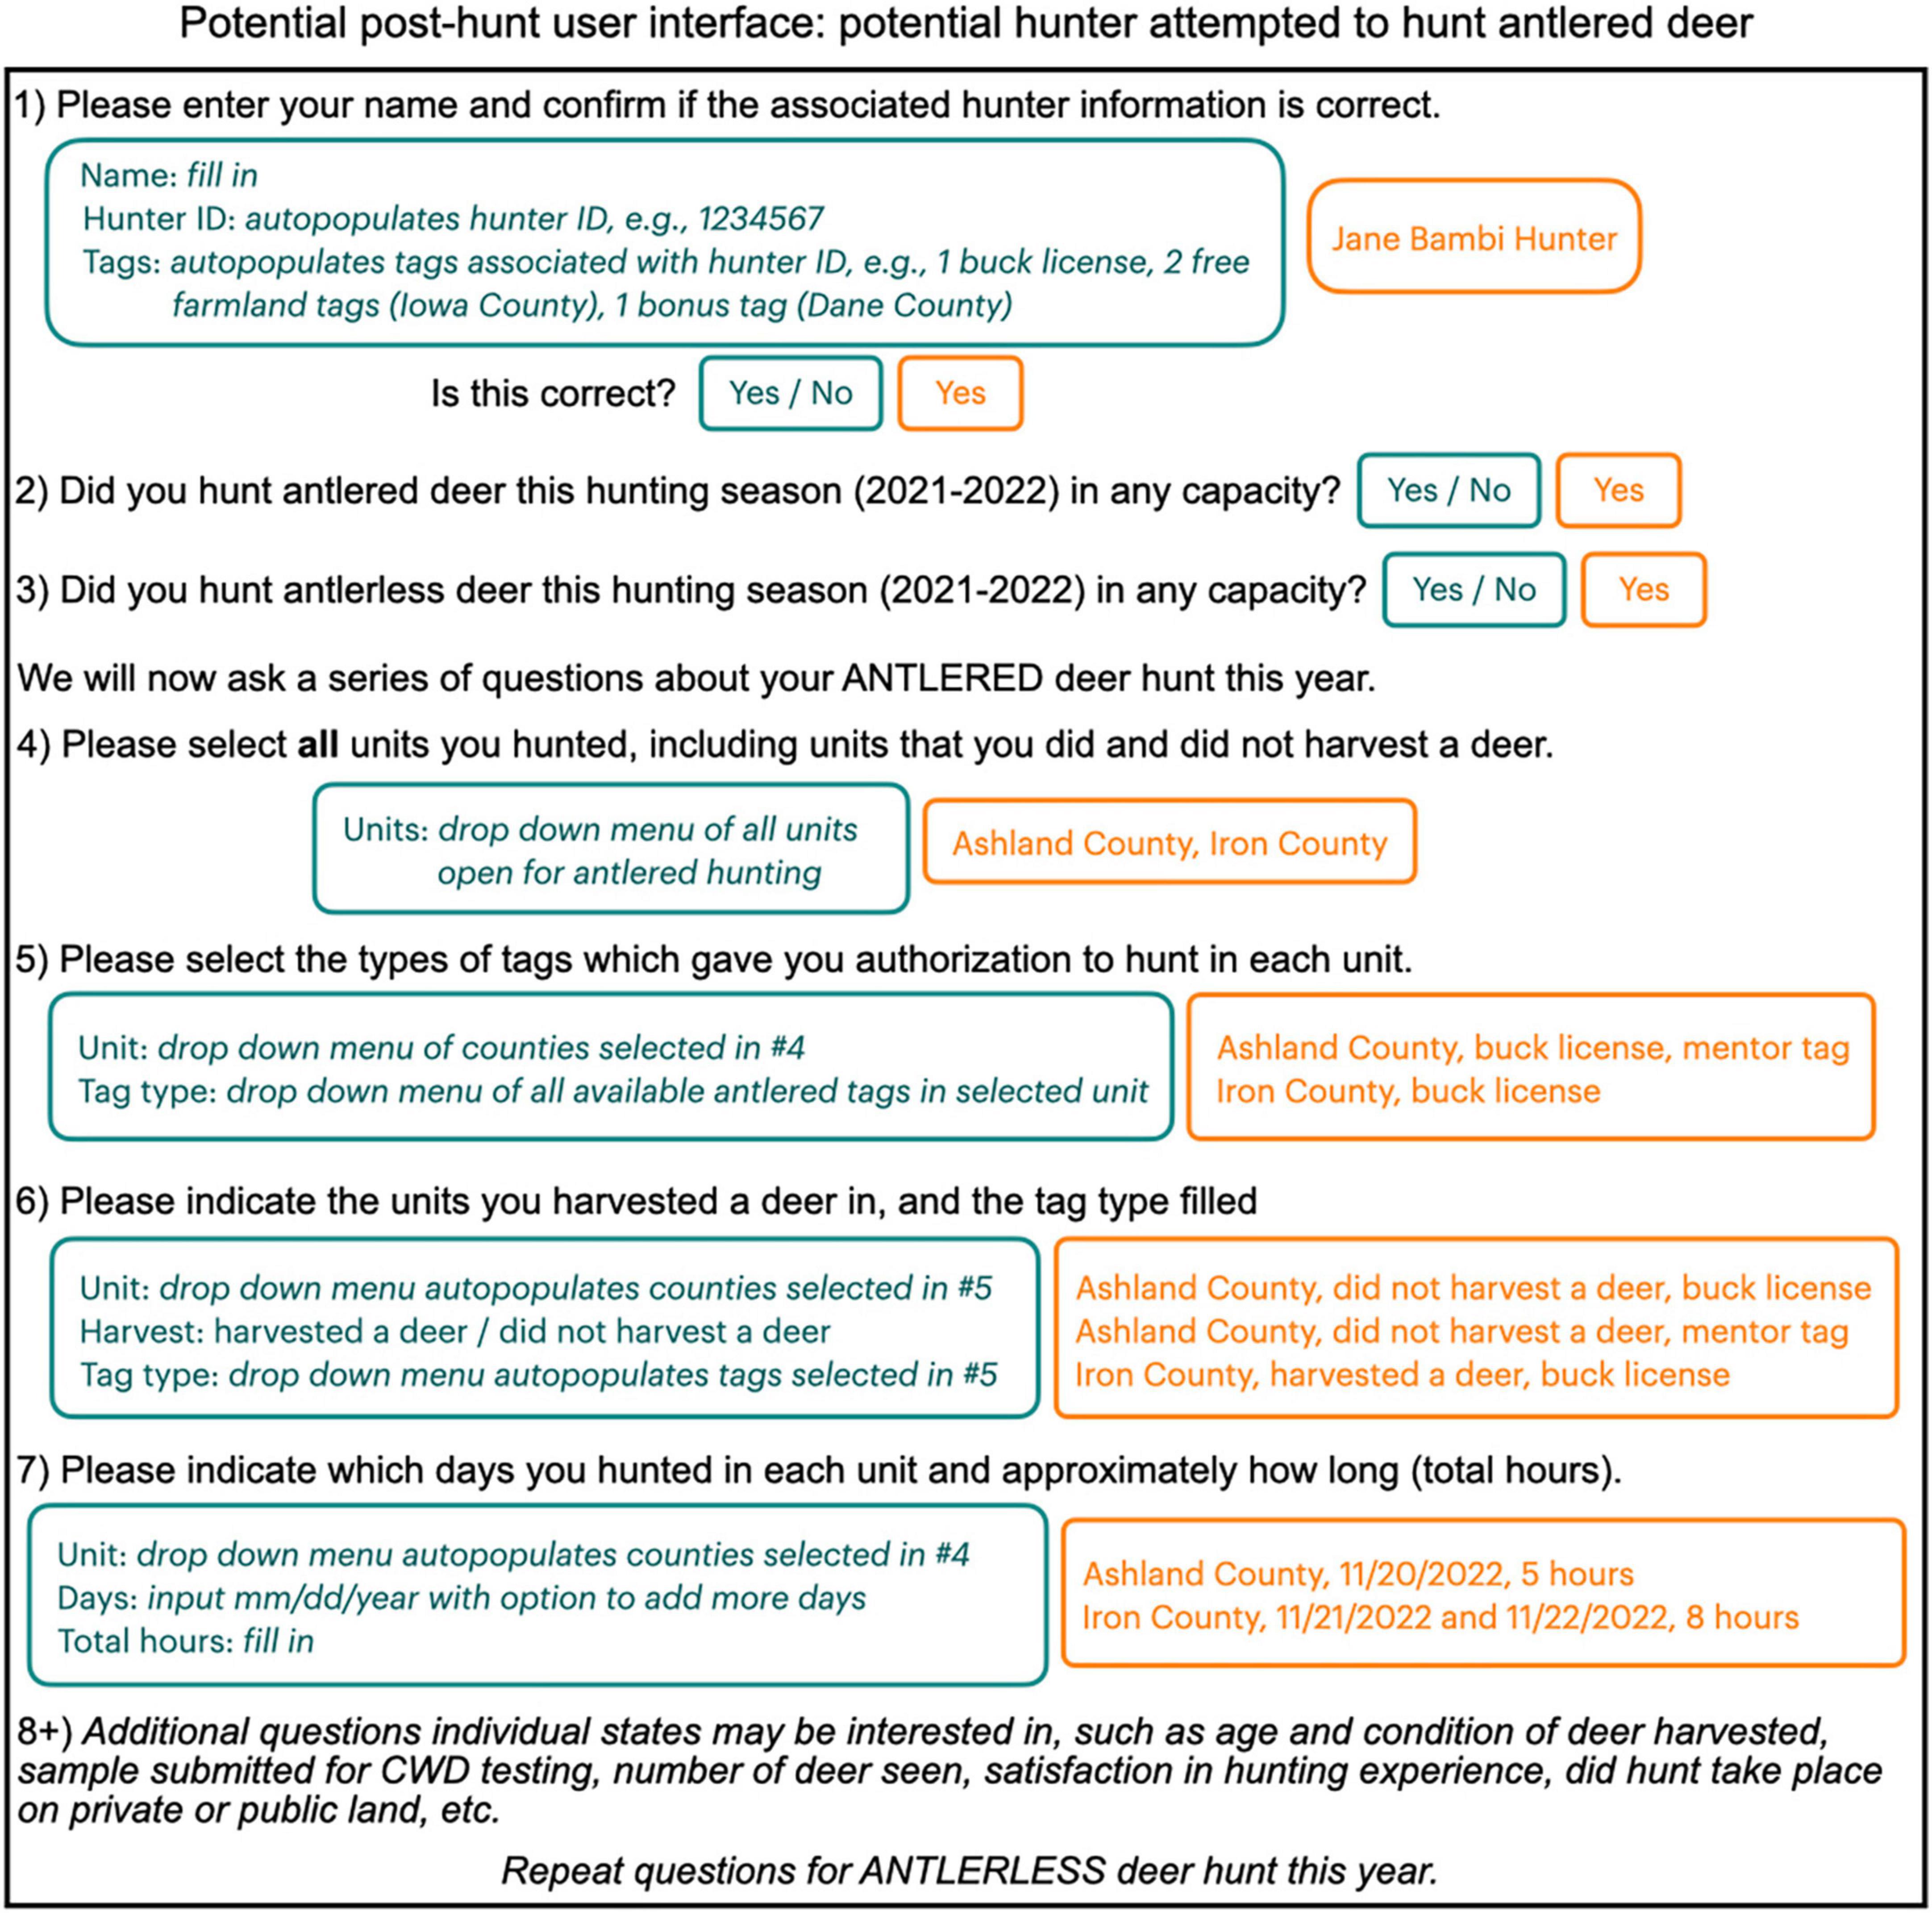
Figure 5. Example post-hunt user interface, such as a website or smartphone application, that collects metadata necessary to link individual hunters to their successful and unsuccessful harvests, and links harvests to the appropriate spatial scales of deer tag issuance and filling. This is an example of a hypothetical Wisconsin hunter—i.e., for a state where antlered deer are managed under a bag structure and antlerless deer are managed under either a bag structure (free farmland tags) or a quota structure (bonus tags). Black text shows agency designed prompts; teal text shows user interface options where plain text denotes options or titles and italics denotes design choices; orange text shows hypothetical hunter selections or responses. The appearance and order of questions can be dependent on the previous responses such that questions that are not relevant to the hunter or situation do not appear.
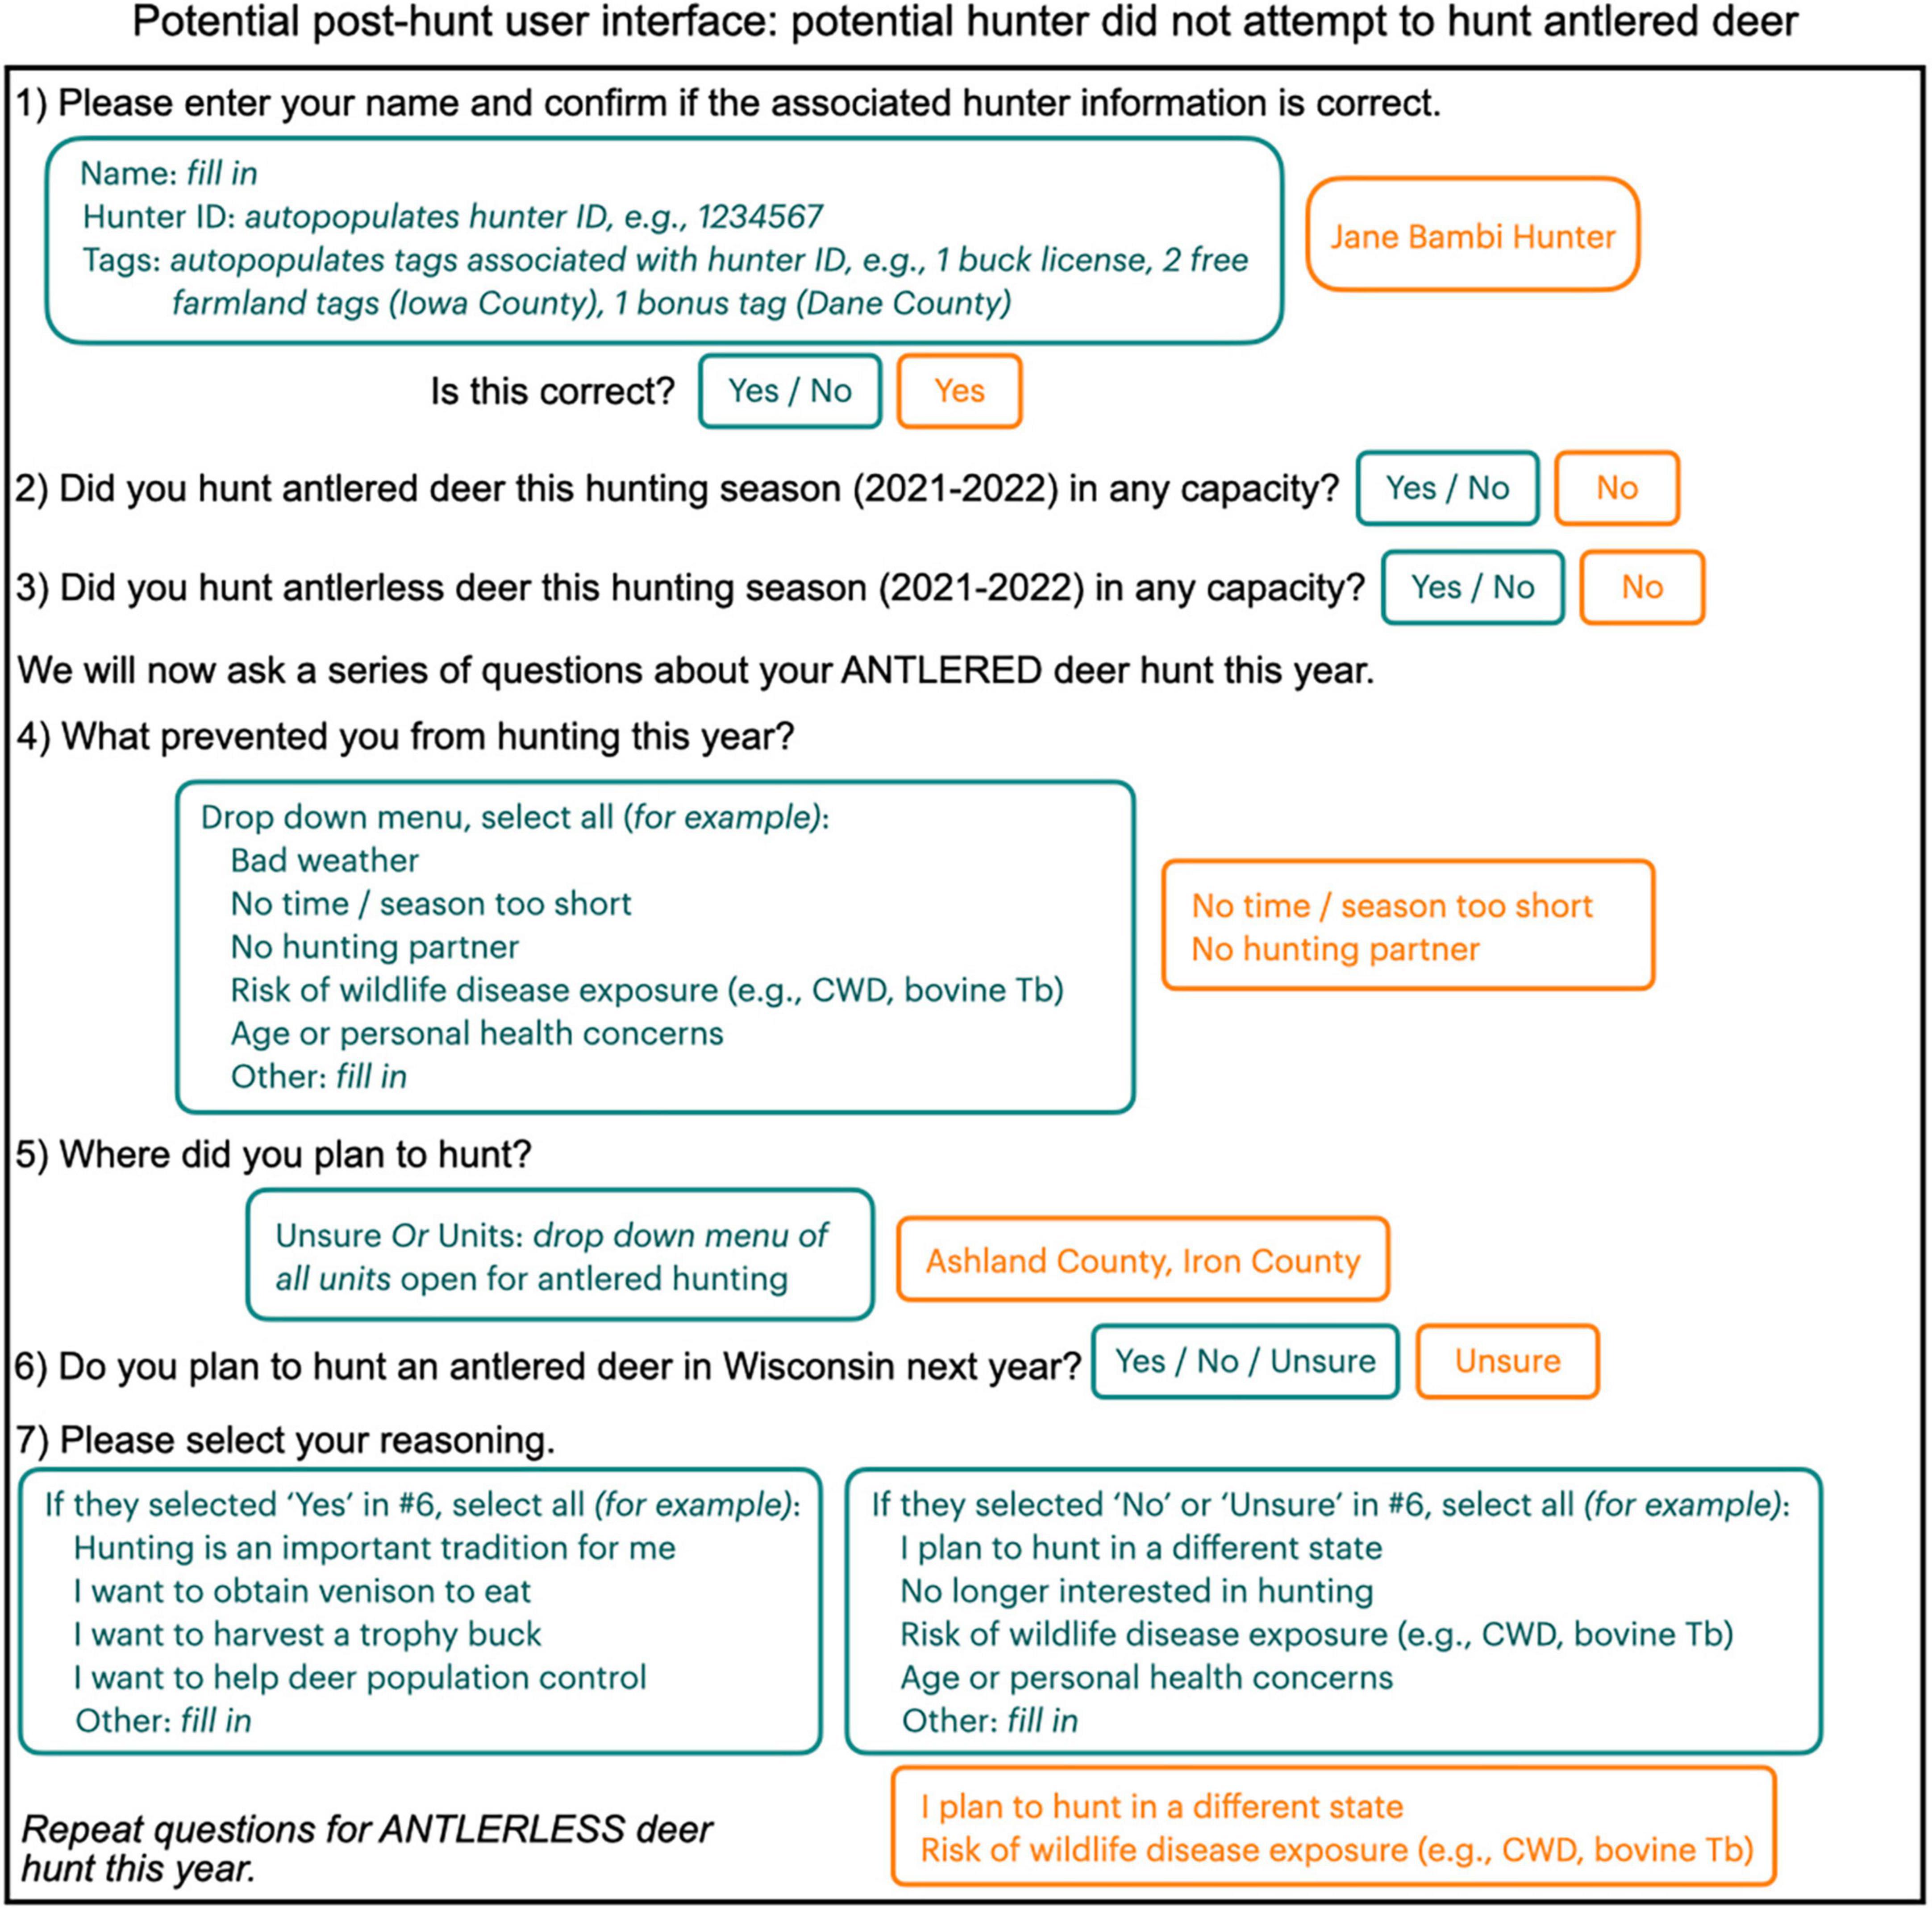
Figure 6. Example post-hunt user interface, such as a website or smartphone application, that collects metadata necessary to link individual tag holders to their unattempted harvests, and links the reasoning for the unattempted harvests to the appropriate spatial scales of deer tag issuance and filling. This is an example of a hypothetical Wisconsin tag holder (“potential hunter”)—i.e., a state where antlered deer are managed under a bag structure and antlerless deer are managed under either a bag structure (free farmland tags) or a quota structure (bonus tags). Black text shows agency designed prompts; teal text shows user interface options where plain text denotes options or titles and italics denotes design choices; orange text shows hypothetical hunter selections or responses. The appearance and order of questions can be dependent on the previous responses such that questions that are not relevant to the hunter or situation do not appear.
We conceptualize that hunter-level data are retained by the state agency, and a link or reminder to take the post-hunt survey (Figures 5, 6) is sent out automatically via email or text to all potential hunters when they obtain their tags; for those that haven’t taken the survey by a certain date, reminders can be sent out at regular intervals, including a follow up via mail if necessary. One obvious risk to this method is potential lack of hunter participation which can cause a non-response bias. Many states (8/9 Midwestern states) indicated that they survey hunters about their hunting experiences, such as hours spent hunting, days spent hunting, number of deer seen, or quality of their hunting experience, but this post-hunt survey was not mandatory in any state. We suggest the survey be disseminated to a relatively high proportion or statistically valid sample of potential hunters, and to improve compliance, agencies could offer incentives such as a tag discount the following year. One potential risk of this approach is that hunters may feel burdened by additional detailed data collection, yet we expect potential hunters can fill out this type of survey in a short amount of time. If data collection occurs through a smartphone application, hunters can enter data closer to the timing of hunting and harvests, which may increase accuracy.
In addition, in this system of data collection, hunters may be uncomfortable with state governments tracking their behavioral data. To ameliorate this, we suggest showing hunters how important these data are through examples, and providing easily accessible reports and results online. It could be beneficial to emphasize that analyzing survey responses allows the agency to better serve the constituents (them). For instance, at the start of the post-hunt survey or in the reminder prompt, agencies could express thanks for their participation, and provide links to sites with information about how the agency uses the data, current projects, etc. Involving and educating hunters can be beneficial because people may be more likely to participate when they feel they are contributing in a meaningful way toward effective management (Cooney and Holsman, 2010; Meeks et al., 2021).
The utility of the user interface present here may be especially powerful for standardizing regional data collection, and synthesizing management, harvest, and human dimensions data across spatial scales. With large sample sizes across different deer management practices, landscape characteristics, and local cultures, standardized post-hunt data collection regarding harvested deer, hunt metadata, and hunter behavior through this convenient interface (Figures 5, 6) could revolutionize the quantitative and qualitative applications of these data. Yet deploying such a survey may require a shift in methods of harvest registration and post-hunt surveys to websites or smartphone applications. All states included in our questionnaire that disseminate a post-hunt survey do so via mail, and harvest registration methods vary across the states: 9/9 states allow online registration but only 1/9 states have online registration exclusively (Michigan); 3/9 states also allow registration over the phone and 5/9 states allow in person or mail registration (in addition to online and over the phone). It may be challenging for hunters to transition to websites and smartphone applications, but it has been done successfully and states that have been through this process could provide helpful information or approaches. Yet from a state agency perspective, collecting registration data may not be worth the logistical or financial costs because registration rates and therefore harvests by demographic classes can be estimated statistically (Rosenberry et al., 2004). A transition to registration via websites and smartphone applications may require multiple years, and this time may need to be considered when developing regional adaptive management plans.
There could also be a challenging period of transition within state agencies. This might require new software, hiring of temporary staff to implement new data collection programs, new staff training programs, and more. These changes may come with short-term costs in terms of funding and employee time. In the long term, however, because of the efficiency of data gathering via self-reporting, collecting these additional data may cost very little in terms of funding—perhaps only additional costs associated with increased data storage. Individual agencies can determine if the challenges and financial burden of changing data collection practices are worth the benefits.
Finally, we want to emphasize that the actions proposed do not suggest that data collection should be perfect to properly manage deer. Rather this section is meant to provide a starting point for possible improvements to data collection practices where wildlife managers are interested in expanding the quantitative applications of their harvest data to better understand hunter behavior or the hunting process, or where managers are interested in investigating cross-jurisdictional administrative and wildlife processes that could address wildlife management challenges. While this may seem daunting, we posit that most state agencies already adhere to some of the listed attributes, and therefore have a foundation to build upon. For instance, 9/9 Midwestern states are already implementing at least two of the four attributes on the list above. Additionally, depending on the circumstances, implementing just one change (e.g., the hunter as the main unit of data collection) may lead to improvements from an analytical point of view (e.g., estimation of per capita tag acquisition and per capita harvests), and therefore be worth the costs to the state wildlife agency given the value of information to managers.
Discussion
Current recreational white-tailed deer harvest data collection systems may limit quantitative analysis when spatial scales differ between management and data collection, distinct hunting processes are conflated, and data are not standardized across jurisdictions. Many management and data collection systems have operated in largely the same way for decades, yet issues such as overabundance and control of emerging infectious diseases are increasingly important to managers, hunters, and constituents. Tackling these modern-day issues may require re-evaluation of management decisions, and could hinge on the quality of our understanding of hunting processes. To improve this understanding, quantitative data collected in a standardized fashion and analyzed rigorously could be beneficial; in this article, we aim to link data collection practices to quantitative applications, which may be useful for informing and improving management practices within and across jurisdictions. Here we identify shortcomings of data collection practices from a quantitative point of view, and suggest attributes of white-tailed deer harvest management and data collection while determining the data collection systems and management structures that can be more informative than others (e.g., a quota structure can provide more information about the maximum number of deer hunters are willing to harvest than a bag structure).
It was not our goal to summarize the mechanisms by which hunters change their behavior (e.g., what motivates hunters to increase their harvests), but understanding what influences hunters is also critical for management decision-making. Embracing social science might provide insights to elucidate why hunters behave in complex and sometimes counterintuitive ways, which has important implications for host and disease management (Stinchcomb et al., 2022). In practice, statistical analyses using empirical data could be paired with social science. For instance, Meeks et al. (2021) found that deer hunters in Tennessee who believe their participation helps effectively control deer abundance and CWD are significantly more likely to hunt in CWD-affected counties than hunters who do not believe their participation improves deer and disease control—this behavior creates a positive feedback loop. However, whether or not these beliefs significantly impact deer harvests can only be determined by analyzing harvest data at the appropriate resolution and spatial scale. Following, this type of research could lead to actionable changes (e.g., structured decision making, implementation science).
There are also cultural factors that may dampen hunter motivation to harvest specific deer demographic classes. Specifically, the emphasis on harvesting primarily large males (“trophies”) and the aversion to hunting females and young males can impede deer population management. There are also limitations in access that may prevent hunters from increasing their harvest rates even when motivation is high, like deer refugia in exurban landscapes where hunters cannot or will not kill deer near human residences and structures (Harden et al., 2005; Storm et al., 2007). These issues and more have been addressed in many other publications (e.g., Brown et al., 2000; Nugent and Choquenot, 2004; VerCauteren et al., 2011; Simard et al., 2013; Feldpausch-Parker et al., 2017), and only bolster support for re-examining our current wildlife management schema.
Some components of harvest management can be incredibly complicated and are difficult to record in a systematic fashion. Through our survey of state systems, we found that all states surveyed have multiple hunting seasons per year with different weapon, tag, or hunting area regulations. In addition, while most hunting tags are regulated by weapon type or season, some tags are unlimited, apply to a subset of constituents, or have different associated regulations. For example, most states have youth or mentor tags that are more liberal in terms of quota and allowable harvest by deer age or sex. In all seven states surveyed with detected CWD, CWD management boundaries have changed over time, creating difficulties in analyzing time series data. These complications make regional data standardization daunting, and we acknowledge that there are likely some instances where state-specific regulations are necessary to achieve management goals.
Disparate management of an infectious disease in a relatively mobile host can cause inequalities in management burdens. Deer may move from high-density (i.e., potentially high prevalence) areas to low-density areas, which may be across state lines, for several reasons: deer dispersal rate may be positively related to population density (Lutz et al., 2015), males are capable of long-distance dispersals (Moll et al., 2021), and deer density may influence CWD transmission and therefore prevalence (Storm et al., 2013). Even substantial landscape features like the Mississippi River do not cause deer subpopulation structuring in this region (Lang and Blanchong, 2012), highlighting the extent of cross-state movement and supporting the notion that diseases cannot be effectively managed by an individual state. In addition, decreasing deer density was the primary CWD management mechanism in 9/9 Midwestern states, yet little is known about the efficacy of density-based host management. Further, hosts can contract CWD from the environment, which could partially decouple host density from transmission rate (Almberg et al., 2011; Jennelle et al., 2014). Therefore, other approaches to CWD management could benefit from experimental testing, yet this is likely very challenging in practice because it may require treatments that allow CWD to spatially spread or increase in prevalence.
Finally, state sovereignty underlies the regulation of wildlife and natural resources in the United States. State-level wildlife and natural resource management is a pillar of the NAMWC [i.e., Public Trust Doctrine; Batcheller et al. (2010)], and state sovereignty is guaranteed by the Constitution of the United States. Every state has a unique identity and traditions, and state constituents may feel a sense of connection and pride for their state. There may be social, political, and legal barriers to implementing regional management programs (e.g., state wildlife commissions). Importantly, indigenous tribes may have treaty rights granting access to, and harvest of, natural resources, and these rights can differ from the dominant management structure. Tribal harvests could be included in standardized regional management and data collection. It may be helpful if education about wildlife management, disease management, and data collection were some of the first steps in developing a regional management program, along with transparency with the public during restructuring.
In summary, there can be significant barriers to adaptive and collaborative wildlife management within states and at regional scales. We show differences in data collection across neighboring state agencies for a primary game species: white-tailed deer. In particular, within many states, hunting tag issuance data and harvest data are collected at different spatial resolutions, and lack of information about unsuccessful hunting may inhibit analysis at the smallest spatial scale. Additionally, given the heterogeneous distribution of CWD, collecting data at the smallest spatial scales may be critical because aggregating data to the broader common scale could fail to describe processes occurring at the scales of interest or occurrence. Among states, deer management can vary by hunting processes and state-specific traditions and cultures. These variations may hinder the ability of state agencies to measure, monitor, and manage overabundant deer populations because the factors affecting specific hunting processes cannot be identified using robust statistics. Additional consequences of variable measures across states include limitations in the monitoring of disease transmission and management. To streamline and standardize hunter and harvest data collection, we suggest four data attributes that could benefit quantitative applications for state wildlife agencies: (1) the hunter is the main unit for data collection, (2) per capita demand for tags and realized harvests are estimable, (3) spatial resolution of hunter harvest and disease surveillance data collection match management structures, or finer, and (4) relevant hunter metadata are collected and registration is mandatory (at a large scale). We hope this work spurs collaborative research initiatives.
Author contributions
EB conceptualized and drafted the manuscript. DS and EB designed the questionnaire. DS disseminated the questionnaire and collected the results. All authors were involved in idea development, contributed substantially to manuscript revisions, and approved the submitted version.
Funding
The data analysis and manuscript preparation were funded by the United States Geological Survey, Biological Threats program (grant G20AC00353).
Acknowledgments
We sincerely thank Nicholas Cole for reviewing a prior version of the state agency questionnaire and providing excellent feedback. We also thank the participating state wildlife management agencies for taking the time to complete the questionnaire, especially Joe Caudell for additional follow-up. The survey described in this report was organized and implemented by Wisconsin DNR and was not conducted on behalf of the United States Geological Survey. Any use of trade, firm, or product names is for descriptive purposes only and does not imply endorsement by the U.S. Government.
Conflict of interest
The authors declare that the research was conducted in the absence of any commercial or financial relationships that could be construed as a potential conflict of interest.
Publisher’s note
All claims expressed in this article are solely those of the authors and do not necessarily represent those of their affiliated organizations, or those of the publisher, the editors and the reviewers. Any product that may be evaluated in this article, or claim that may be made by its manufacturer, is not guaranteed or endorsed by the publisher.
Supplementary material
The Supplementary Material for this article can be found online at: https://www.frontiersin.org/articles/10.3389/fevo.2022.943411/full#supplementary-material
References
Almberg, E. S., Cross, P. C., Johnson, C. J., Heisey, D. M., and Richards, B. J. (2011). Modeling routes of chronic wasting disease transmission: environmental prion persistence promotes deer population decline and extinction. PLoS One 6:e19896. doi: 10.1371/journal.pone.0019896
Augustine, D. J., and Frelich, L. E. (1998). Effects of white-tailed deer on populations of an understory forb in fragmented deciduous forests. Conserv. Biol. 12, 995–1004. doi: 10.1046/j.1523-1739.1998.97248.x
Batcheller, G. R., Bambery, M. C., Bies, L., Decker, T., Dyke, S., Guynn, D., et al. (2010). The Public Trust Doctrine: Implications for Wildlife Management and Conservation in the United States and Canada. Bethesda, MD: The Wildlife Society.
Birdsong, M., Morse, W., Steury, T., and Smith, M. (2021). Socialization and motivational pathways among different groups of non-traditional hunters in Alabama reveal unique recruitment and retention opportunities. Hum. Dimensions Wildl. 27, 1–15. doi: 10.1080/10871209.2021.1954266
Blanchong, J. A., Joly, D. O., Samuel, M. D., Langenberg, J. A., Rolley, R. E., and Sausen, J. F. (2006). White-tailed deer harvest from the chronic wasting disease eradication zone in south-central Wisconsin. Wildl. Soc. Bull. 34, 725–731. doi: 10.2193/0091-7648(2006)34[725:WDHFTC]2.0.CO;2
Brown, T. L., Decker, D. J., Riley, S. J., Enck, J. W., Lauber, T. B., Curtis, P. D., et al. (2000). The future of hunting as a mechanism to control white-tailed deer populations. Wildl. Soc. Bull. 28, 797–807.
Caudell, J. N., and Vaught, O. D. L. (2018). 2017 Indiana White-tailed Deer Report. Bloomington: Indiana Department of Natural Resources.
Chandler, J. C., Bevins, S. N., Ellis, J. W., Linder, T. J., Tell, R. M., Jenkins-Moore, M., et al. (2021). SARS-CoV-2 exposure in wild white-tailed deer (Odocoileus virginianus). Proc. Natl. Acad. Sci. U S A. 118:e2114828118. doi: 10.1073/pnas.2114828118
Conner, M. M., Wood, M. E., Hubbs, A., Binfet, J., Holland, A. A., Meduna, L. R., et al. (2021). The relationship between harvest management and chronic wasting disease prevalence trends in wester mule deer (Odocoileus hemionus) herds. J. Wildl. Dis. 57, 831–843. doi: 10.7589/JWD-D-20-00226
Cooney, E. E., and Holsman, R. H. (2010). Influences on hunter support for deer herd reduction as a chronic wasting disease (CWD) management strategy. Hum. Dimensions Wildl. 15, 194–207. doi: 10.1080/10871201003598785
Côté, S. D., Rooney, T. P., Tremblay, J.-P., Dussault, C., and Waller, D. M. (2004). Ecological impacts of deer overabundance. Annu. Rev. Ecol. Evol. Syst. 35, 113–147. doi: 10.1146/annurev.ecolsys.35.021103.105725
Decker, D. J., and Connelly, N. A. (1989). Motivations for deer hunting: implications for antlerless deer harvest as a management tool. Wildl. Soc. Bull. 17, 455–463.
DeNicola, A. J., and Williams, S. C. (2008). Sharpshooting suburban white-tailed deer reduces deer–vehicle collisions. Human-Wildl. Confl. 2, 28–33.
Durocher, G., Luckert, M. K., Goddard, E. W., and Adamowicz, W. L. (2022). Public preferences for options to manage chronic wasting disease in Canada: a paired comparisons study. Environ. Sci. Policy 132, 206–213. doi: 10.1016/j.envsci.2022.02.014
Eliason, S. (2008). A statewide examination of hunting and trophy nonhuman animals: perspectives of Montana hunters. Soc. Animals 16, 256–278. doi: 10.1163/156853008X323402
Erickson, D., Reeling, C., and Lee, J. G. (2019). The effect of chronic wasting disease on resident deer hunting permit demand in wisconsin. Animals (Basel) 9:1096. doi: 10.3390/ani9121096
Escobar, L. E., Pritzkow, S., Winter, S. N., Grear, D. A., Kirchgessner, M. S., Dominguez-Villegas, E., et al. (2020). The ecology of chronic wasting disease in wildlife. Biol. Rev. Camb. Philos. Soc. 95, 393–408. doi: 10.1111/brv.12568
Feldpausch-Parker, A. M., Parker, I. D., and Vidon, E. S. (2017). Privileging consumptive use: a critique of ideology, power, and discourse in the North American model of wildlife conservation. Conservation Soc. 15, 33–40. doi: 10.4103/0972-4923.201395
Foster, J. R., Roseberry, J. L., and Woolf, A. (1997). Factors influencing efficiency of white-tailed deer harvest in Illinois. J. Wildl. Manage. 61, 1091–1097. doi: 10.2307/3802106
Giles, B. G., and Findlay, C. S. (2004). Effectiveness of a selective harvest system in regulating deer populations in Ontario. J. Wildl. Manage. 68, 266–277. doi: 10.2193/0022-541X(2004)068[0266:EOASHS]2.0.CO;2
Gude, J. A., Cunningham, J. A., Herbert, J. T., and Baumeister, T. (2012). Deer and elk hunter recruitment, retention, and participation trends in Montana. J. Wildl. Manage. 76, 471–479. doi: 10.1002/jwmg.272
Hansen, H. P., Nils Peterson, M., and Jensen, C. (2012). Demographic transition among hunters: a temporal analysis of hunter recruitment dedication and motives in Denmark. Wildl. Res. 39, 446–451. doi: 10.1071/WR12028
Harden, C. D., Woolf, A., and Roseberry, J. (2005). Influence of exurban development on hunting opportunity, hunter distribution, and harvest efficiency of white-tailed deer. Wildl. Soc. Bull. 33, 233–242. doi: 10.2193/0091-7648(2005)33[233:IOEDOH]2.0.CO;2
Haus, J. M., Eyler, T. B., Duda, M. D., and Bowman, J. L. (2017). Hunter perceptions toward chronic wasting disease: implications for harvest and management. Wildl. Soc. Bull. 41, 294–300. doi: 10.1002/wsb.761
Heberlein, T. A. (2004). “Fire in the Sistine Chapel”: how wisconsin responded to chronic wasting disease. Hum. Dimensions Wildl. 9, 165–179. doi: 10.1080/10871200490479954
Heffelfinger, J. R., Geist, V., and Wishart, W. (2013). The role of hunting in North American wildlife conservation. Int. J. Environ. Stud. 70, 399–413. doi: 10.1080/00207233.2013.800383
Hinrichs, M. P., Price, N. B., Gruntorad, M. P., Pope, K. L., Fontaine, J. J., and Chizinski, C. J. (2020). Understanding sportsperson retention and reactivation through license purchasing behavior. Wildl. Soc. Bull. 44, 383–390. doi: 10.1002/wsb.1088
Holland, A. M., Haus, J. M., Eyler, T. B., Duda, M. D., and Bowman, J. L. (2020). Revisiting hunter perceptions toward chronic wasting disease: changes in behavior over time. Animals (Basel) 10:187. doi: 10.3390/ani10020187
Holsman, R. H., and Petchenik, J. (2006). Predicting deer hunter harvest behavior in wisconsin’s chronic wasting disease eradication zone. Hum. Dimensions Wildl. 11, 177–189. doi: 10.1080/10871200600669916
Indiana County Deer Statistics (2022). Indiana Department of Natural Resources. Available online at: https://www.in.gov/dnr/fish-and-wildlife/wildlife-resources/animals/white-tailed-deer/county-data/ (accessed March 18, 2022).
Jennelle, C. S., Henaux, V., Wasserberg, G., Thiagarajan, B., Rolley, R. E., and Samuel, M. D. (2014). Transmission of chronic wasting disease in Wisconsin white-tailed deer: implications for disease spread and management. PLoS One 9:e91043. doi: 10.1371/journal.pone.0091043
Karns, G. R., Gates, R. J., Matthews, S. N., Bruskotter, J. T., McCoy, J. C., and Tonkovich, M. J. (2016). Factors influencing spatial heterogeneity of female white-tailed deer harvest dynamics. Wildl. Soc. Bull. 40, 758–763. doi: 10.1002/wsb.702
Lang, K. R., and Blanchong, J. A. (2012). Population genetic structure of white-tailed deer: understanding risk of chronic wasting disease spread. J. Wildl. Manage. 76, 832–840. doi: 10.1002/jwmg.292
Larson, L. R., Stedman, R. C., Decker, D. J., Siemer, W. F., and Baumer, M. S. (2014). Exploring the social habitat for hunting: toward a comprehensive framework for understanding hunter recruitment and retention. Hum. Dimensions Wildl. 19, 105–122. doi: 10.1080/10871209.2014.850126
Lutz, C. L., Diefenbach, D. R., and Rosenberry, C. S. (2015). Population density influences dispersal in female white-tailed deer. J. Mammal. 96, 494–501. doi: 10.1093/jmammal/gyv054
Manjerovic, M. B., Green, M. L., Mateus-Pinilla, N., and Novakofski, J. (2014). The importance of localized culling in stabilizing chronic wasting disease prevalence in white-tailed deer populations. Prev. Vet. Med. 113, 139–145. doi: 10.1016/j.prevetmed.2013.09.011
Mason, R., Carpenter, L. H., Cox, M., Devos, J. C. Jr., Fairchild, J., Freddy, D. J., et al. (2006). A case for standardized ungulate surveys and data management in the Western United States. Wildl. Soc. Bull. 34, 1238–1242. doi: 10.2193/0091-7648(2006)34[1238:ACFSUS]2.0.CO;2
McShea, W. J. (2012). Ecology and management of white-tailed deer in a changing world. Ann. N. Y. Acad. Sci. 1249, 45–56. doi: 10.1111/j.1749-6632.2011.06376.x
Meeks, A., Poudyal, N. C., Muller, L. I., and Yoest, C. (2021). Hunter acceptability of chronic wasting disease (CWD) management actions in Western Tennessee. Hum. Dimensions Wildl. 27, 457–471. doi: 10.1080/10871209.2021.1959962
Meier, A. N. (2021). Effects of Hunter Movement and Habitat use on Observation Rate of White-tailed Deer (Odocoileus virginianus). Master of Science thesis, Chicago, IL: University of Nebraska Kearney.
Miller, M. W., and Fischer, J. R. (2016). “The first five (or more) decades of chronic wasting disease: lessons for the five decades to come,” in Transactions of the North American Wildlife and Natural Resources Conference (cwd-info.org), (Pittsburg, PA).
Miller, C. A., and Vaske, J. J. (2022). How state agencies are managing chronic wasting disease. Hum. Dimensions Wildl. 1–10. doi: 10.1080/10871209.2021.2023712
Moll, R. J., McRoberts, J. T., Millspaugh, J. J., Wiskirchen, K. H., Sumners, J. A., Isabelle, J. L., et al. (2021). A rare 300 kilometer dispersal by an adult male white-tailed deer. Ecol. Evol. 11, 3685–3695.
Mysterud, A., Strand, O., and Rolandsen, C. M. (2019). Efficacy of recreational hunters and marksmen for host culling to combat chronic wasting disease in reindeer. Wildl. Soc. Bull. 43, 683–692. doi: 10.1002/wsb.1024
Needham, M. D., Vaske, J. J., and Manfredo, M. J. (2004). Hunters’ behavior and acceptance of management actions related to chronic wasting disease in eight states. Hum. Dimensions Wildl. 9, 211–231. doi: 10.1080/10871200490479990
Needham, M. D., Vaske, J. J., and Manfredo, M. J. (2006). State and residency differences in hunters’ responses to chronic wasting disease. Hum. Dimensions Wildl. 11, 159–176. doi: 10.1080/10871200600669973
Nugent, G., and Choquenot, D. (2004). Comparing cost-effectiveness of commercial harvesting, state-funded culling, and recreational deer hunting in New Zealand. Wildl. Soc. Bull. 32, 481–492. doi: 10.2193/0091-7648(2004)32[481:CCOCHS]2.0.CO;2
Organ, J. F., Geist, V., Mahoney, S. P., Williams, S., Krausman, P. R., Batcheller, G. R., et al. (2012). The North American Model of Wildlife Conservation. The Wildlife Society Technical Review 12-04. Bethesda, MD: The Wildlife Society.
Potapov, A., Merrill, E., Pybus, M., and Lewis, M. A. (2016). Chronic wasting disease: transmission mechanisms and the possibility of harvest management. PLoS One 11:e0151039. doi: 10.1371/journal.pone.0151039
Riley, S. J., Decker, D. J., Enck, J. W., Curtis, P. D., Lauber, T. B., and Brown, T. L. (2003). Deer populations up, hunter populations down: implications of interdependence of deer and hunter population dynamics on management. Ecoscience 10, 455–461. doi: 10.1080/11956860.2003.11682793
Romesburg, H. C. (1981). Wildlife science: gaining reliable knowledge. J. Wildl. Manage 45, 293–313. doi: 10.2307/3807913
Rosenberry, C. S., Diefenbach, D. R., and Wallingford, B. D. (2004). Reporting-rate variability and precision of white-tailed deer harvest estimates in Pennsylvania. J. Wildl. Manage 68, 860–869. doi: 10.2193/0022-541X(2004)068[0860:RVAPOW]2.0.CO;2
Schorr, R. A., Lukacs, P. M., and Gude, J. A. (2014). The Montana deer and Elk hunting population: the importance of cohort group, license price, and population demographics on hunter retention, recruitment, and population change. J. Wildl. Manage. 78, 944–952. doi: 10.1002/jwmg.732
Serrouya, R., Seip, D. R., Hervieux, D., McLellan, B. N., McNay, R. S., Steenweg, R., et al. (2019). Saving endangered species using adaptive management. Proc. Natl. Acad. Sci. U S A. 116, 6181–6186. doi: 10.1073/pnas.1816923116
Shelton, A. L., Henning, J. A., Schultz, P., and Clay, K. (2014). Effects of abundant white-tailed deer on vegetation, animals, mycorrhizal fungi, and soils. For. Ecol. Manage. 320, 39–49. doi: 10.1016/j.foreco.2014.02.026
Simard, M. A., Dussault, C., Huot, J., and Côté, S. D. (2013). Is hunting an effective tool to control overabundant deer? a test using an experimental approach. J. Wildl. Manage. 77, 254–269. doi: 10.1002/jwmg.477
Stinchcomb, T., Ma, Z., and Nyssa, Z. (2022). Complex human-deer interactions challenge conventional management approaches: the need to consider power, trust, and emotion. Ecol. Soc. 27:13. doi: 10.5751/ES-12899-270113
Storm, D. J., Nielsen, C. K., Schauber, E. M., and Woolf, A. (2007). Space use and survival of white-tailed deer in an exurban landscape. J. Wildl. Manage. 71, 1170–1176. doi: 10.2193/2006-388
Storm, D. J., Samuel, M. D., Rolley, R. E., Shelton, P., Keuler, N. S., Richards, B. J., et al. (2013). Deer density and disease prevalence influence transmission of chronic wasting disease in white-tailed deer. Ecosphere 4, 1–14. doi: 10.1890/ES12-00141.1
U.S. Geological Survey, and National Wildlife Health Center (2022). Expanding Distribution of Chronic Wasting Disease. Available online at: https://www.usgs.gov/centers/nwhc/science/expanding-distribution-chronic-wasting-disease (accessed March 15, 2022).
Van Deelen, T., and Etter, D. (2003). Effort and the functional response of deer hunters. Hum. Dimensions Wildl. 8, 097–108. doi: 10.1080/10871200304306
Van Deelen, T. R., Dhuey, B. J., Jacques, C. N., McCaffery, K. R., Rolley, R. E., and Warnke, K. (2010). Effects of earn-a-buck and special antlerless-only seasons on Wisconsin’s deer harvests. J. Wildl. Manage. 74, 1693–1700. doi: 10.2193/2009-551
Vaske, J. J. (2010). Lessons learned from human dimensions of chronic wasting disease research. Hum. Dimensions Wildl. 15, 165–179. doi: 10.1080/10871201003775052
Vaske, J. J., Needham, M. D., and Miller, C. A. (2021). Wildlife agency trust and perceived risks from chronic wasting disease. Wildl. Soc. Bull. 4, 597–607. doi: 10.1002/wsb.1224
VerCauteren, K. C., Anderson, C. W., van Deelen, T. R., Drake, D., Walter, W. D., Vantassel, S. M., et al. (2011). Regulated commercial harvest to manage overabundant white-tailed deer: an idea to consider? Wildl. Soc. Bull. 35, 185–194. doi: 10.1002/wsb.36
Walsh, D. P. (2012). Enhanced Surveillance Strategies for Detecting and Monitoring Chronic Wasting Disease in Free-ranging Cervids. Washington, DC: U.S. Department of the Interior, U.S. Geological Survey. doi: 10.3133/ofr20121036
Walters, C. J., and Holling, C. S. (1990). Large-scale management experiments and learning by doing. Ecology 71, 2060–2068. doi: 10.2307/1938620
Warren, R. J. (2011). Deer overabundance in the USA: recent advances in population control. Anim. Produc. Sci. 51, 259–266. doi: 10.1071/AN10214
Wasserberg, G., Osnas, E. E., Rolley, R. E., and Samuel, M. D. (2009). Host culling as an adaptive management tool for chronic wasting disease in white-tailed deer: a modelling study. J. Appl. Ecol. 46, 457–466. doi: 10.1111/j.1365-2664.2008.01576.x
Williams, A. F., and Wells, J. K. (2005). Characteristics of vehicle-animal crashes in which vehicle occupants are killed. Traffic Inj. Prev. 6, 56–59.
Williams, B. K., Szaro, R. C., and Shapiro, C. D. (2009). Adaptive Management: The U.S. Department of the Interior Technical Guide. Washington, DC: Adaptive Management Working Group, U.S. Department of the Interior.
Williams, S. C., Denicola, A. J., Almendinger, T., and Maddock, J. (2013). Evaluation of organized hunting as a management technique for overabundant white-tailed deer in suburban landscapes. Wildl. Soc. Bull. 37, 137–145. doi: 10.1002/wsb.236
Keywords: adaptive management, analysis, chronic wasting disease (CWD), conservation, human dimensions, harvest, hunting, North American Model of Wildlife Conservation
Citation: Brandell EE, Storm DJ, Van Deelen TR, Walsh DP and Turner WC (2022) A call to action: Standardizing white-tailed deer harvest data in the Midwestern United States and implications for quantitative analysis and disease management. Front. Ecol. Evol. 10:943411. doi: 10.3389/fevo.2022.943411
Received: 13 May 2022; Accepted: 27 September 2022;
Published: 20 October 2022.
Edited by:
Andrew Gregory, University of North Texas, United StatesReviewed by:
Stephen L. Webb, Texas A&M Natural Resources Institute, United StatesLisa Muller, The University of Tennessee, Knoxville, United States
Copyright © 2022 Brandell, Storm, Van Deelen, Walsh and Turner. This is an open-access article distributed under the terms of the Creative Commons Attribution License (CC BY). The use, distribution or reproduction in other forums is permitted, provided the original author(s) and the copyright owner(s) are credited and that the original publication in this journal is cited, in accordance with accepted academic practice. No use, distribution or reproduction is permitted which does not comply with these terms.
*Correspondence: Ellen E. Brandell, ZWxsZW4uYnJhbmRlbGxAc3RhdGUuY28udXM=
†Present address: Ellen E. Brandell, Colorado Parks and Wildlife, Fort Collins, CO, United States