 Junjie Wang
 Kui-Ching Hsu
 Yue-Hua Chen3
 Jun Zhao
 Wen-Qiao Tang
 Dong Liu
 Jin-Quan Yang
 Hung-Du Lin
- 1Guangdong Provincial Key Laboratory for Healthy and Safe Aquaculture, Guangdong Provincial Engineering Technology Research Center for Environmentally-friendly Aquaculture, Guangzhou Key Laboratory of Subtropical Biodiversity and Biomonitoring, School of Life Science, South China Normal University, Guangzhou, China
- 2College of Fisheries, Guangdong Ocean University, Zhanjiang, China
- 3Shanghai Universities Key Laboratory of Marine Animal Taxonomy and Evolution, Shanghai Ocean University, Shanghai, China
- 4The Affiliated School of National Tainan First Senior High School, Tainan, Taiwan
The shimofuri goby (Tridentiger bifasciatus) is native to marine, brackish, and fresh waters along the coasts of the northwest Pacific. Our study examined the population genetic structure, diversity, and demography of T. bifasciatus in the China Seas, including the Yellow Sea, East China Sea, and South China Sea, using the sequences of mitochondrial DNA [mtDNA cytochrome b (cyt b) gene and d-loop region] and nuclear DNA [nuDNA ryanodine receptor 3 (Ryr3) gene]. The mtDNA dataset revealed a significant population differentiation, but the nuDNA dataset displayed the absence of genetic differentiation. The discordance between these two datasets was accounted for by population admixture, selection, and incomplete lineage sorting. Although the mtDNA and nuDNA displayed a discordant population structure, these genetic markers revealed the same population history: (1) the populations retreated into two refugia during glaciations and (2) the populations declined recently. Our study revealed that after glaciations, the re-flooding in Taiwan Strait did not shape the migrations of the southern lineage from the South China Sea to the East China Sea, and displayed that two mtDNA lineages have diverged before they migrated southward during glaciations. These results offer important resources for the further study of conservation genetics.
Introduction
The shimofuri goby, Tridentiger bifasciatus, is a species of goby native to marine, brackish, and fresh waters along the coasts of East Asia. This species can tolerate a wide range of temperature and salinity values (Matern, 2001). Moreover, T. bifasciatus is oviparous, and the males build and guard nests inside cavities with hard interior surfaces (Matern, 1999). Reproduction in this species generally occurs during spring and summer in oligohaline to fresh waters. Its natural dispersal is likely to occur during the planktonic larval stage, and adults are benthic (Matern, 1999). The maximum length of T. bifasciatus is 12 cm (Froese and Pauly, 2021). Our study considered that this species could be used as an ecological indicator species to monitor environmental deterioration because this fish is not consumed by humans, and its habitat is close to the range of humans’ activities. Although this species is listed as “least concern,” these results will help in the construction of a conservation strategy in the marginal seas of China. Thus, our study examined the genetic variations in T. bifasciatus along the coastline of mainland China to understand its current genetic structure and demography, and to infer the phylogeographic and historic changes.
The coastline of mainland China stretches from the mouth of the Yalu River on the China–Korea border in the north to the mouth of the Beilun River on the China–Vietnam border in the south. The marginal seas of China include the Yellow Sea (YS, including Bohai Gulf), East China Sea (ECS), and South China Sea (SCS, including Beibu Gulf). Many phylogeographic studies conducted along the coastline of China have proposed that (1) the sea-level fluctuations of marginal seas were greatly impacted by Pliocene and Pleistocene glacial cycles (Kizaki and Oshiro, 1980; Ota, 1994; Voris, 2000), (2) during glaciations, the exposure of the Taiwan Strait introduced a barrier to gene flows between ECS and SCS (Liu et al., 2007; Qiu et al., 2016), (3) the oceanographic current systems shape the migrations of marine species mainly (Shen et al., 2011; Ni et al., 2012, 2014; He et al., 2015), and (4) the Yangtze River outflows shape coastal species differentiation by creating a phylogeographic break (Dong et al., 2012; Ni et al., 2012, 2017).
Moreover, Liu (2013) proposes that the biodiversity of the China Seas, particularly in the brackish waters of estuarine environments, is threatened by overexploitation and environmental deterioration greatly. He et al. (2014) also proposed that rapid urban expansion has resulted in natural habitat loss in some areas in China, particularly in Pearl River Delta in South China. Thus, our study attempted to understand if the humans’ activities are significant threats to the intraspecific diversity and structure in brackish waters of estuarine environments along the China coastline.
Two major aims of our study are as follows: (1) Does differentiation exist within T. bifasciatus? If present, what is the diversification mechanism? Did it shape by exposure to the Taiwan Strait and Yangtze River outflows? Did the differentiation contribute to speciation? Did the oceanographic current systems shape its migrations? and (2) Did the population size of T. bifasciatus decline? If present, which of climate changes or human activities causes the populations to decline? To investigate the above-mentioned questions, our study used the genetic markers from mitochondrial DNA (mtDNA) and nuclear DNA (nuDNA). It is acknowledged that the genetic markers from mtDNA and nuDNA react differently to current demography and past history (Habib and Sulaiman, 2016; Yang et al., 2016; Tan et al., 2019; Yusoff et al., 2021). Thus, our study attempts to obtain different historical signals from these two markers to identify the population history of T. bifasciatus. These two markers are used to identify the population history of T. bifasciatus and identify whether any cryptic species are present. The sequences of the mtDNA cytochrome b (cyt b) gene and d-loop region and nuDNA Ryr3 (ryanodine receptor type 3) were used to establish the phylogeographic pattern and infer the demographic history of T. bifasciatus. Sequences of mtDNA are usually analyzed in the studies of animal phylogeography (Yang et al., 2016; Zhao et al., 2017; Han et al., 2019). More recently, Ryr3 has become widely used as a marker for determining molecular phylogeny and phylogeography of fishes (Hollingsworth and Darrin Hulsey, 2011; Qu et al., 2018; Bernt et al., 2019).
Materials and Methods
Population Sampling and Molecular Methods
We collected a total of 204 individuals from 15 localities across the coast of China from September 2015 until November 2015. All specimens were collected from the field sites with seines and euthanized with MS-222 (Sigma1). The range of the total body length is 6–8 cm. All specimens were housed in the laboratory of Jin-Quan Yang, Shanghai Universities Key Laboratory of Marine Animal Taxonomy and Evolution. Five sampling localities were established in the Yellow Sea (YS): (1) Dandong, DD; (2) Qinhuangdao, QH; (3) Tianjin, TJ; (4) Yantai, YT; and (5) Qingdao, QD (Figure 1A and Table 1). Six sampling localities were established in the East China Sea (ECS): (6) Shanghai, SH; (7) Ningbo, NB; (8) Taizhou, TZ; (9) Dongtou, DT; (10) Fuding, FD; and (11) Zhangzhou, ZZ. Four localities were established in the South China Sea (SCS): (12) Raoping, RP; (13) Shanwei, SW; (14) Shenzhen, SZ; and (15) Zhanjiang, ZJ. The samples were fixed and stored in 95% ethanol. Genomic DNA was extracted from muscle tissue using a DNeasy Blood & Tissue Kit (QIAGEN, Valencia, CA, United States).
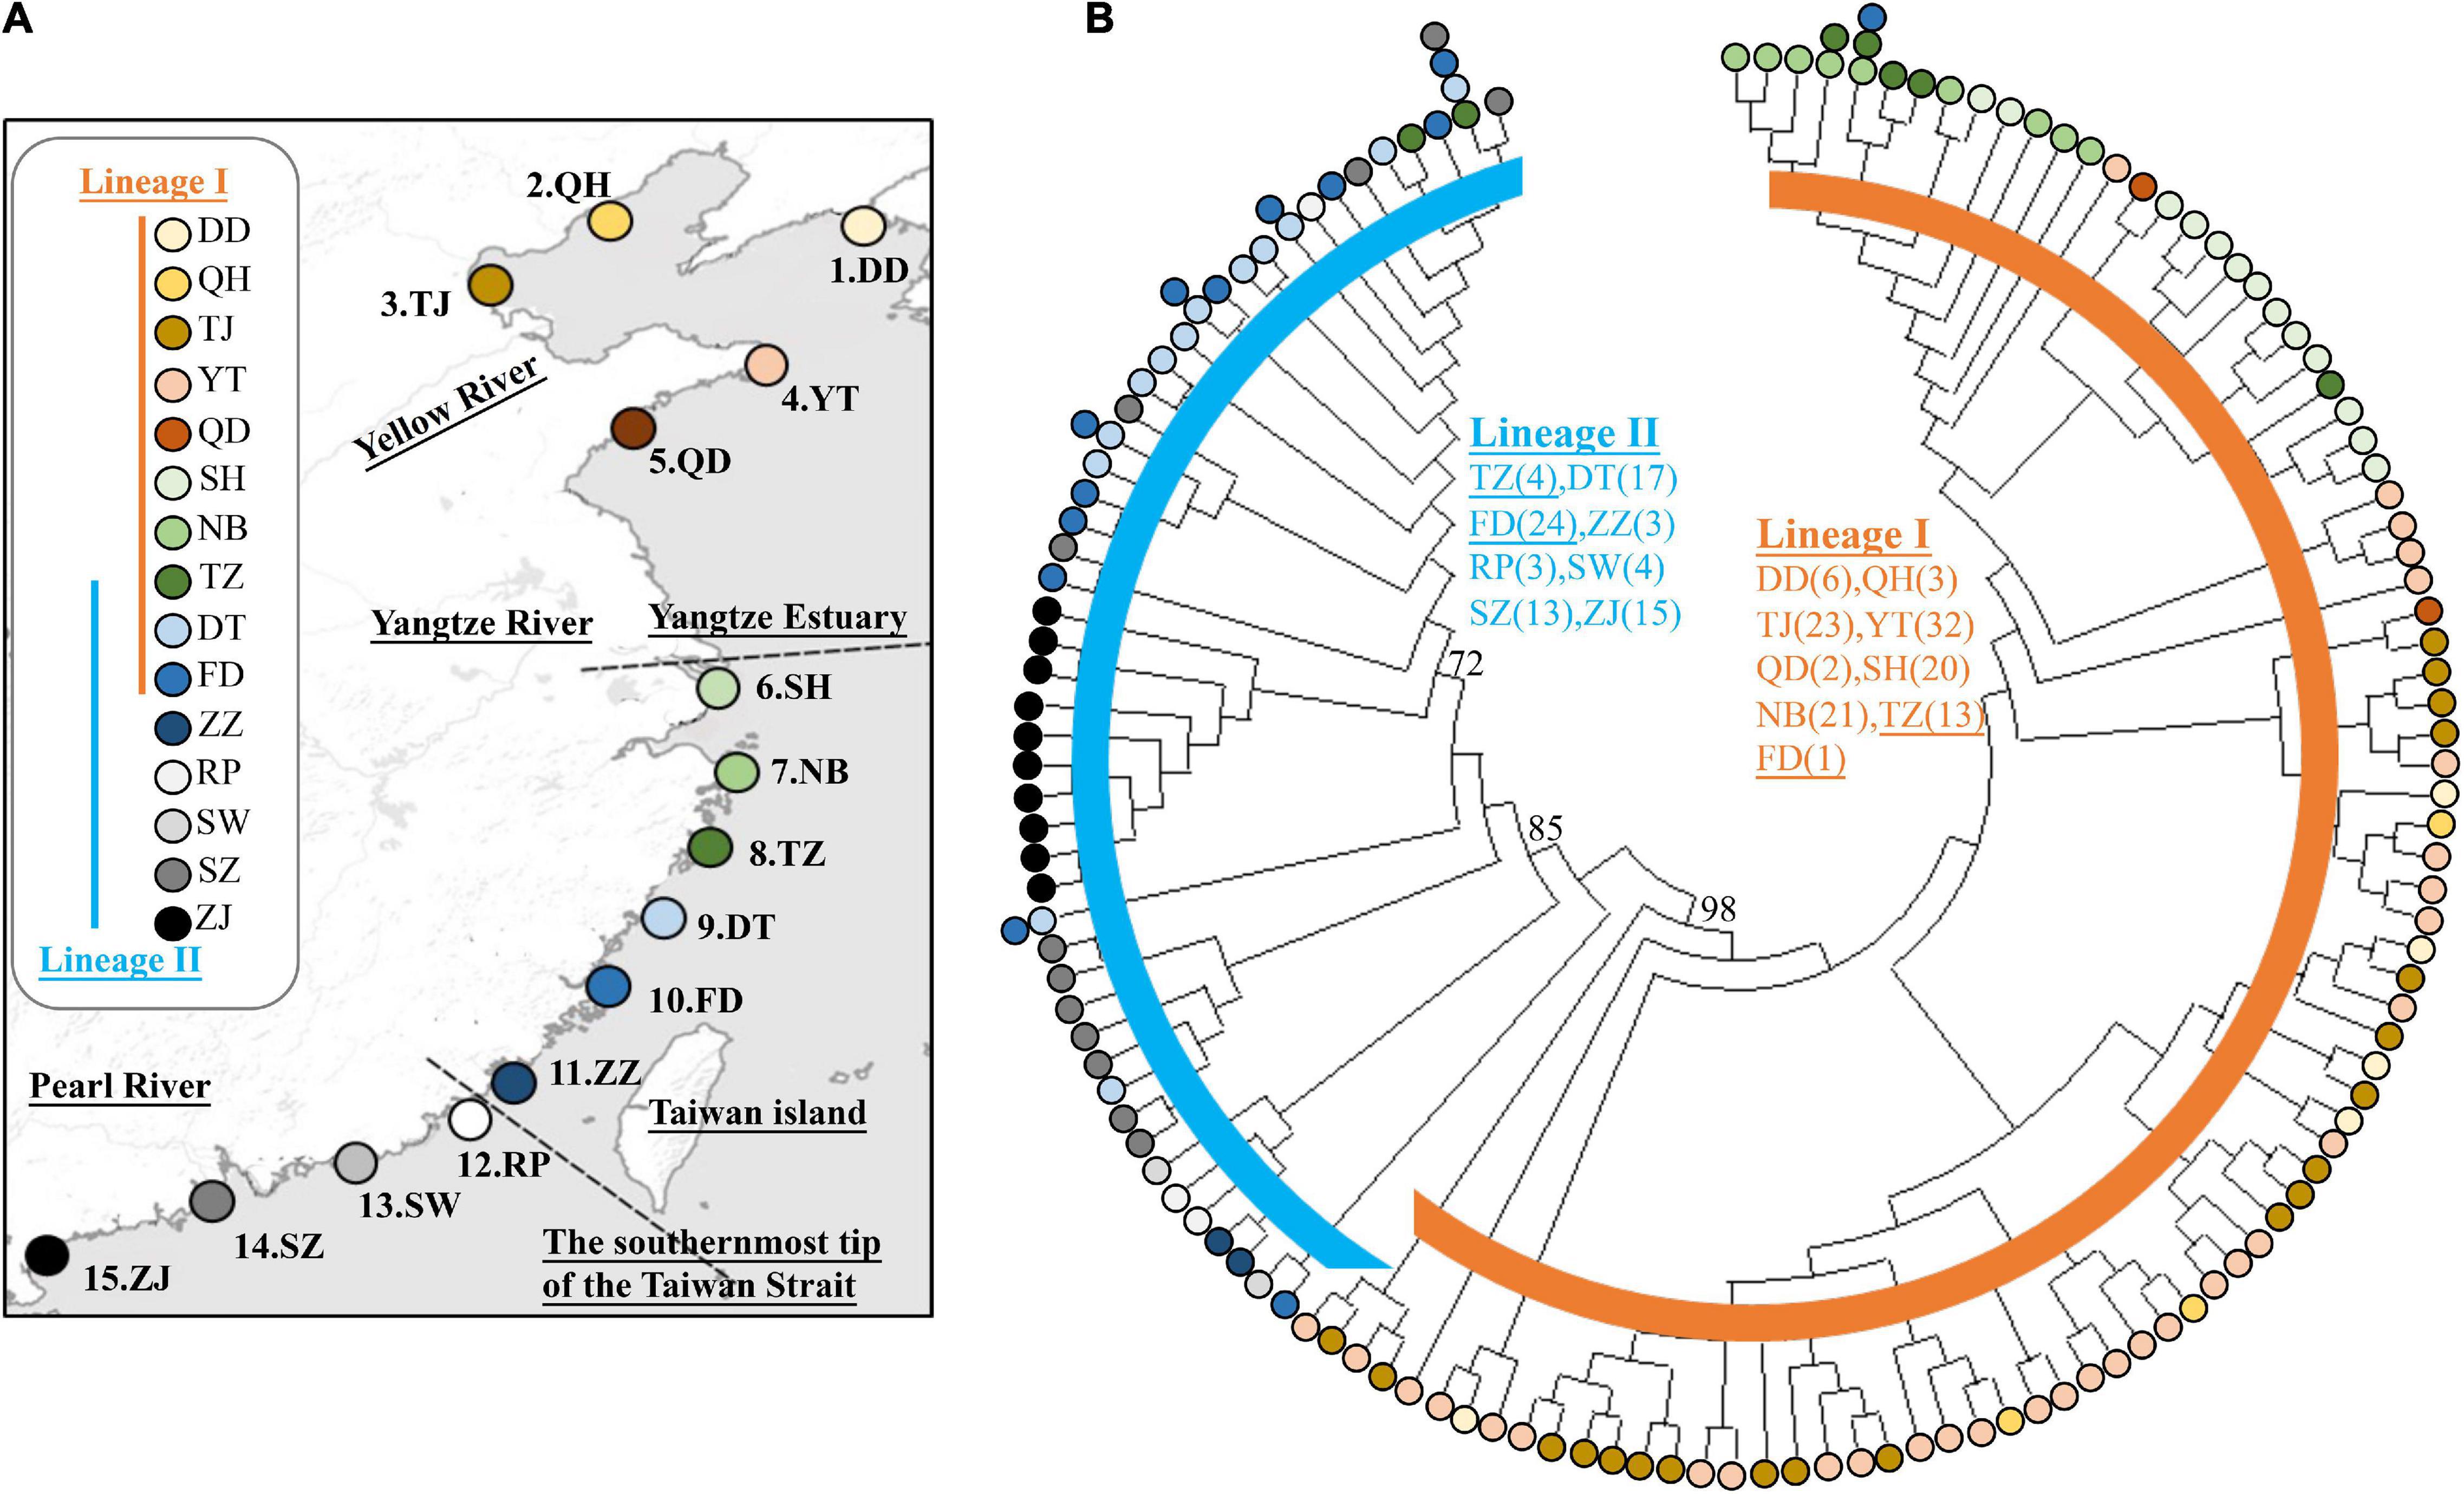
Figure 1. (A) The sampling localities of Tridentiger bifasciatus along the coast of the China Seas are indicated by∙. Refer to Table 1 for the abbreviations of the localities. (B) The maximum likelihood tree and the distribution of the lineages based on mitochondrial DNA cytochrome b and d-loop sequences. The numbers at the nodes are the bootstrap values. Bootstrap values less than 70% are not shown.
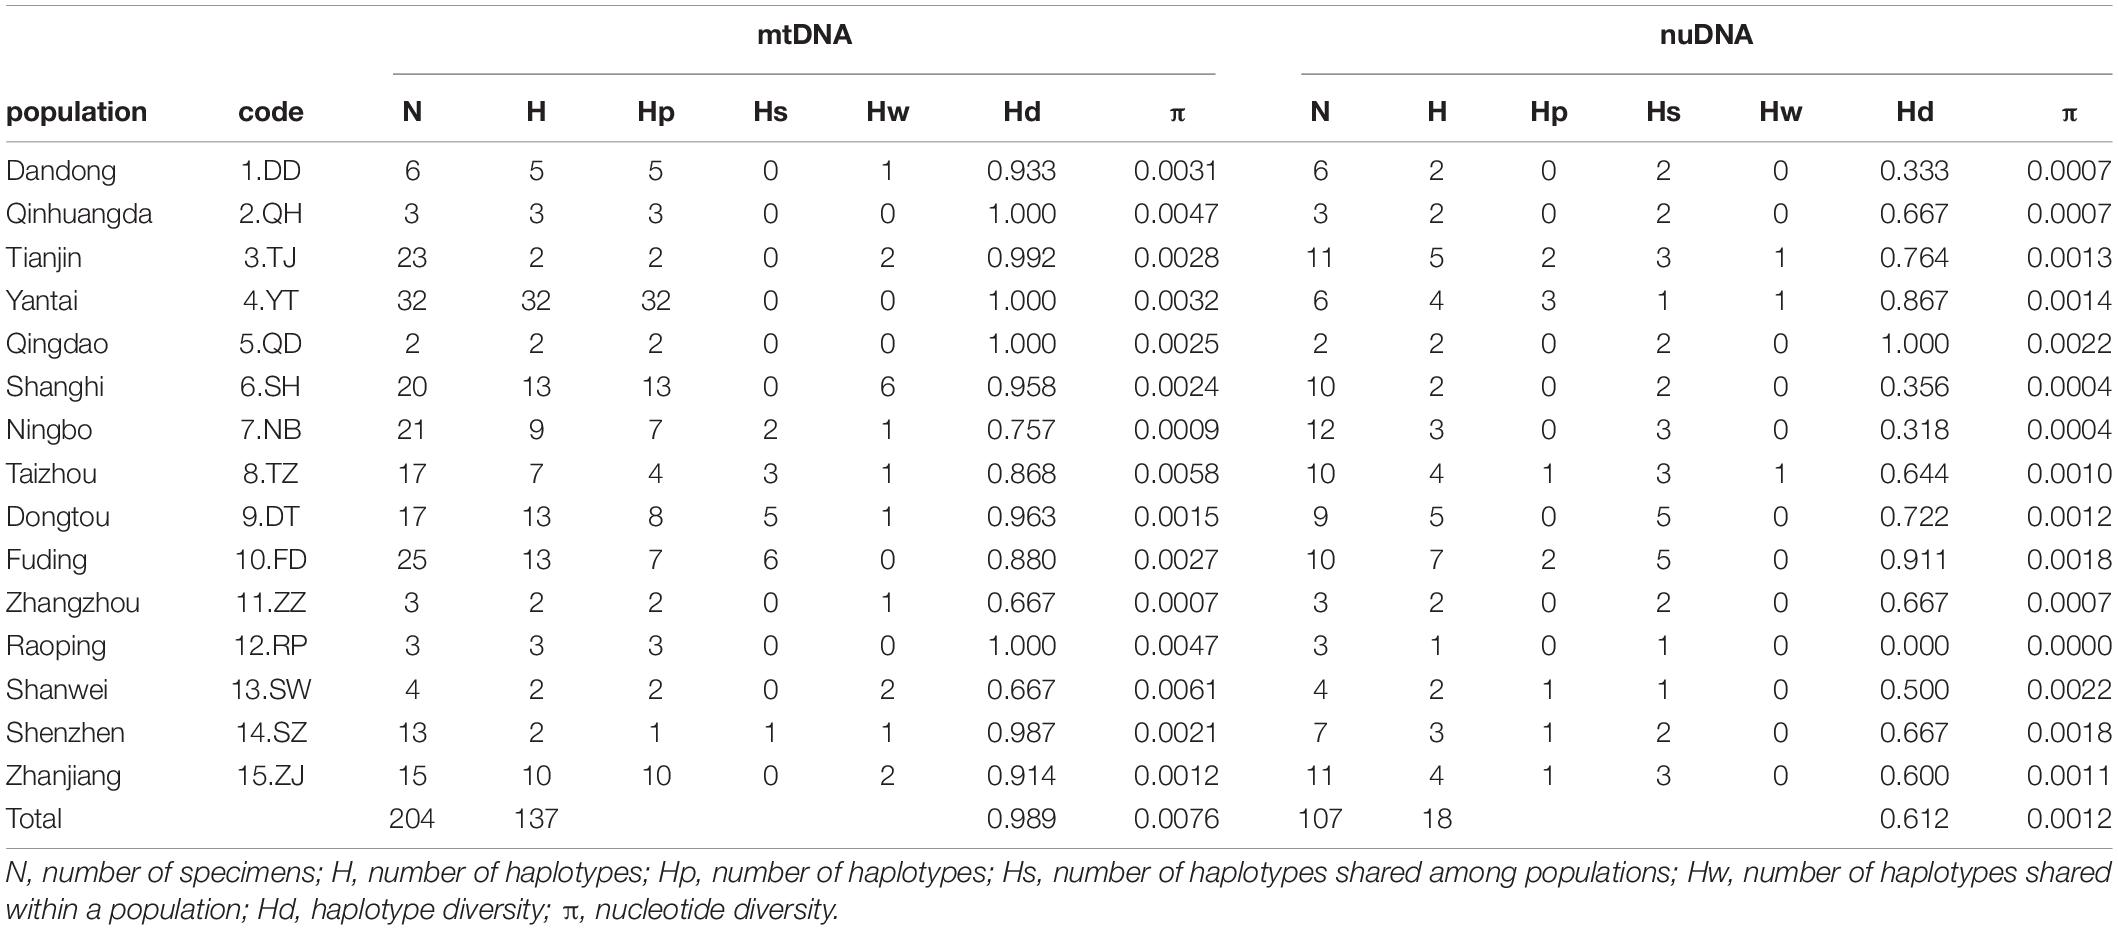
Table 1. Genetic diversity of Tridentiger bifasciatus in the China Seas.
The mtDNA cyt b gene and d-loop region and nuDNA Ryr3 gene were amplified using polymerase chain reaction (PCR). The primers for the two mtDNA fragments were developed in our study according to the mitogenomes of T. bifasciatus in NCBI (GenBank access numbers JN244650, MW376913, and JX5366942), and the primers of nuDNA were adapted from Li et al. (2007). Cytochrome b was amplified with the primers B-F (5′-TGAAGCAACAACCACTACAC-3′) and B-R (5′-TCTGACACTGAGCTACCACT-3′), the d-loop was amplified with the primers D-F (5′-GCTGTCGGGGCTAAAATCCTC-3′) and D-R (5′-CGGGGTGTTCGTGTTTCCAAAT-3′), and Ryr3 was amplified with the primers R-F (5′-GGAACTA TYGGTAAGCARATGG-3′) and R-R (5′-TGGAAGAAKC CAAAKATGATGC-3′). Each 50 μl of PCR mixture included 5 ng of template DNA, 5 μl of 10× reaction buffer, 4 μl of dNTP mix (10 mM), 5 pmol of each primer, and 2 U of Taq polymerase (TaKaRa). The PCR amplifications were performed using an MJ Thermal Cycler, with one cycle of denaturation at 94°C for 4 min, 40 cycles of denaturation at 94°C for 30 s, annealing at 49–55°C for 50 s to 1 min, and extension at 72°C for 90 s, followed by a 72°C extension for 10 min and 4°C for storage. Amplification products were separated by a 2% agarose gel and purified by a QIAquick Gel Extraction kit (QIAGEN, Valencia, CA, United States). Unlike mtDNA genes, nuDNA genes may be heterozygous. Thus, the purified PCR products were cloned in the pGEM-T Easy vector (Promega) and transformed into E. coli DH5α cells before sequencing (Gurushidze et al., 2008). Each individual chose one clone, and the plasmid DNA was extracted using a QIAwave Plasmid Miniprep Kit (QIAGEN, Valencia, CA, United States). The PCR products and plasmid DNA were sequenced on an ABI 377 automated sequencer (Applied Biosystems, Foster City, CA, United States.). The chromatograms were assessed using CHROMAS software (Technelysium), and the sequences were manually edited using BIOEDIT 6.07 (Hall, 1999).
Species Identification
The taxonomic identification within the genus Tridentiger has long been confusing. Thus, our study identified species by BLAST analysis in National Center for Biotechnology Information (NCBI) to make sure that all of our specimens were T. bifasciatus. Our study also downloaded 169 Tridentiger cyt b sequences (GenBank access numbers MK257014–MK257076, MN413603–MN413604, MT210674–MT210693. MT215243–MT215324, and MT524720–MT524721). In total, all sequences were assorted into seven species: T. bifasciatus, Tridentiger trigonocephalus, Tridentiger obscurus, Tridentiger brevispinis, Tridentiger kuroiwae, Tridentiger microsquamis, and Tridentiger barbatus. In this process, our study found some misidentifications in GenBank; however, all the specimens of our study were identified as T. bifasciatus (data not shown).
Sequence Alignment and Genetic Analyses
The nucleotide sequences were aligned with Clustal X 1.81 (Thompson et al., 1997). The most appropriate nucleotide substitution models were TN93 (Tamura-Nei) and K2P (Kimura’s two-parameter) using the Bayesian information criterion (BIC) for mtDNA and nuDNA datasets in jModelTest 2.0 (Darriba et al., 2012). The levels of intrapopulation genetic diversity were estimated based on the indices of haplotype diversity (h) and nucleotide diversity (π) (Nei, 1987) in DnaSP 4.10.8 (Rozas et al., 2003). Two genetic differentiation indices, GST and NST, were estimated in DnaSP 4.10.8. The GST value makes use of only the allelic frequencies and the NST value for which similarities between the haplotypes are taken into account. The difference between these two indices can be used to examine the existence of a phylogeographic structure (Pons and Petit, 1996). Pairwise FST values were used to examine the spatial partitioning of genetic variation among the populations by using Arlequin v3.5 (Excoffier and Lischer, 2010). The population clusters were estimated based on FCT values using SAMOVA 1.0 (Dupanloup et al., 2002). Because there were 14 sampling localities, the tests were performed with K-values of 2–14. The value for which FCT was the highest was chosen as the best grouping. The analyses of molecular variance (AMOVA) were performed with Arlequin. AMOVA partitioning was used to observe the within-population (FST), within-group (FSC), and among-group (FCT) components of the variation among the samples based on the groups defined in SAMOVA. The phylogenetic analysis was also performed using maximum likelihood (ML) estimation with MEGA-X (Kumar et al., 2018). The genetic distances (p-distances and K2P) were estimated in MEGA-X. The haplotype list was detected by DnaSP 4.10.8. The median-joining algorithm (Bandelt et al., 1999) from Network 5.0 was used to reconstruct the haplotype networks. In addition, the number of the non-synonymous substitution sites (NSS) and the number of the synonymous substitution sites (SS) of the cyt b from each sequence, and the non-synonymous/synonymous substitution rate ratio (Ka/Ks) were estimated by DnaSP 4.10.8.
Population Demography, Migration, and History
The demographic histories were reconstructed using three different approaches. First, we performed Tajima’s D and Fu’s FS neutrality tests in DnaSP 4.10.8 (Tajima, 1989; Fu and Li, 1993; Fu, 1997; Ramos-Onsins and Rozas, 2002). Under a population expansion model, significant values of negative Tajima’s D and Fu’s FS are expected. The statistical significance was tested using 10,000 permutations. Second, the mismatch distribution was estimated under the assumption of a sudden expansion model as implemented in Arlequin (Rogers and Harpending, 1992) and DnaSP 4.10.8. Third, we reconstructed the historical demography using the coalescent-based Bayesian Skyline Plot (BSP) implemented in BEAST 1.10 (Suchard et al., 2018). The strict clock model, which assumes that every branch in a phylogenetic tree evolves according to the same evolutionary rate, with a Bayesian skyline tree was used to construct Bayesian skyline plots and estimate the time of the most recent common ancestor (TMRCA) by running 106 generations in the program BEAST 1.0, with 107 MCMC steps and the first 10% as burn-in. The molecular clock was calibrated using an average divergence rate of 1.50% and 1.00% per million years for mtDNA and nuDNA, respectively (Burridge et al., 2008). The prior was fixed to a long-normal distribution with a mean of 0.01 and a standard deviation of 0.5. The output was visualized in Tracer v1.7.1 (Rambaut et al., 2018) to determine whether convergence and suitable effective sample sizes were achieved for all parameters. The burn-in plots for each analysis were visualized in Tracer v1.7.1.
In addition, our study tested three different scenarios about the population history of T. bifasciatus using the ABC framework implemented in DIYABC 2.0 (Cornuet et al., 2014). Our study used two datasets, mtDNA and nuDNA, to simulate history during the Pleistocene glaciation. Our study compared three scenarios by the existence of two glacial refugia with post-glacial admixture and dispersal events. In scenario A, mtDNA phylogenetic analyses identified two lineages, suggesting therefore two glacial refugia, and then mixed in populations FD and TZ (see “Results” section). In scenario B, all populations diverged simultaneously based on the results of nuDNA phylogenetic analyses (see “Results” section). In scenario C, all populations withdrew into two glacial refugia, and then all populations mixed based on the results of the combinations of the mtDNA and nuDNA phylogenetic analyses. All analyses ran one million simulations for each scenario using the following summary statistics: one-sample statistics for the number of haplotypes, Tajima’s D, the mean number of pairwise differences, the variance in the pairwise differences, and the number of segregating sites; and two-sample statistics for the mean of the within-sample pairwise differences, the mean of the between-sample pairwise differences, the number of segregating sites, and FST between samples. The intervals of the prior distribution of applied parameters were all 10–100,000, and those of mean mutation were 10–9 to 10–7. We used uniform priors for all scenarios and gave no constraints to population sizes and coalescent times. The posterior probabilities were compared by logistic regression.
Besides, genetic connectivity among the populations was assessed using the Bayesian MCMC method implemented in MIGRATE-N 4.4.3 (Beerli, 2016). MIGRATE-N estimates the mutation- scaled population size (θ = 2Neμ for haploid mtDNA; θ = 4Neμ for diploid for nuDNA) for each locality and the mutation-scaled immigration rate (M = m/μ), where Ne is the effective population size, μ is the mutation rate of loci per generation, and m is the immigration rate per generation. The effective number of immigrants per generation was calculated for haploid data with female transmission following the equation Nm = θ x M. The runs consisted of two replicates of 10 short chains and three long chains, with the first 10,000 genealogies discarded.
Results
Genetic Diversity and Structure
A total of 1,985 bp of the mtDNA sequences (1,141 bp cytb and 844 bp d-loop) from 204 specimens in 15 sampling populations were analyzed (Table 1 and Figure 1A). The sequences were aligned unambiguously with no indels. A total of 137 haplotypes (161 variable sites and 92 phylogenetic informative sites) were obtained. The range of the haplotype diversity was from 0.667 (populations ZZ and SW) to 1.000 (populations QH, YT, QD, and RP), and the range of nucleotide diversity was from 0.0007 (population ZZ) to 0.0061 (population SW) (Table 1). Among 137 haplotypes, only seven haplotypes were shared with populations (Supplementary Table 1). Most populations (populations DD, QH, TJ, YT, QD, SH, ZZ, RP, SW, SA, and SJ) did not have shared haplotypes, and the population FD had the most shared haplotypes (six haplotypes).
In the phylogenetic analyses, the haplotype trees reconstructed with different methods (ML and BI, rooted and unrooted) were identical, with only small differences in bootstrap values. In the ML tree (Figure 1B), 137 haplotypes fell into two almost allopatric lineages (I and II). These two lineages were only sympatric in the populations TZ and FD (Figure 1 and Supplementary Table 1). The K2P distance between these two lineages was 0.0117 (p-distance = 0.0116). The overall FST was 0.651. A comparison of the fixation indices NST and GST revealed that NST (0.652) was larger than GST (0.074). These results show that the population differentiation was significant and suggests a significant relationship between phylogeny and geography. The pairwise FST values ranged from 0.000 (between populations YT and QH, QD and QH, and YT and QD) to 0.940 (between populations NB and ZZ) (Figure 2). Because high divergence existed between two lineages, our study examined the differentiation indexes in each lineage. Within lineage I, the overall FST, NST, and GST were 0.398, 0.398, and 0.072, respectively, and the pairwise FST values ranged from 0.000 to 0.768 (Supplementary Table 2). Within lineage II, the overall FST, NST, and GST were 0.522, 0.522, and 0.088, respectively, and the pairwise FST values ranged from 0.000 to 0.924 (Supplementary Table 3). In the SAMOVA analysis, the highest FCT value (FCT = 0.675) occurred at K = 11 and 14 (Supplementary Table 4). In AMOVA, 67.54% of variations existed among these 14 groups (Table 2).
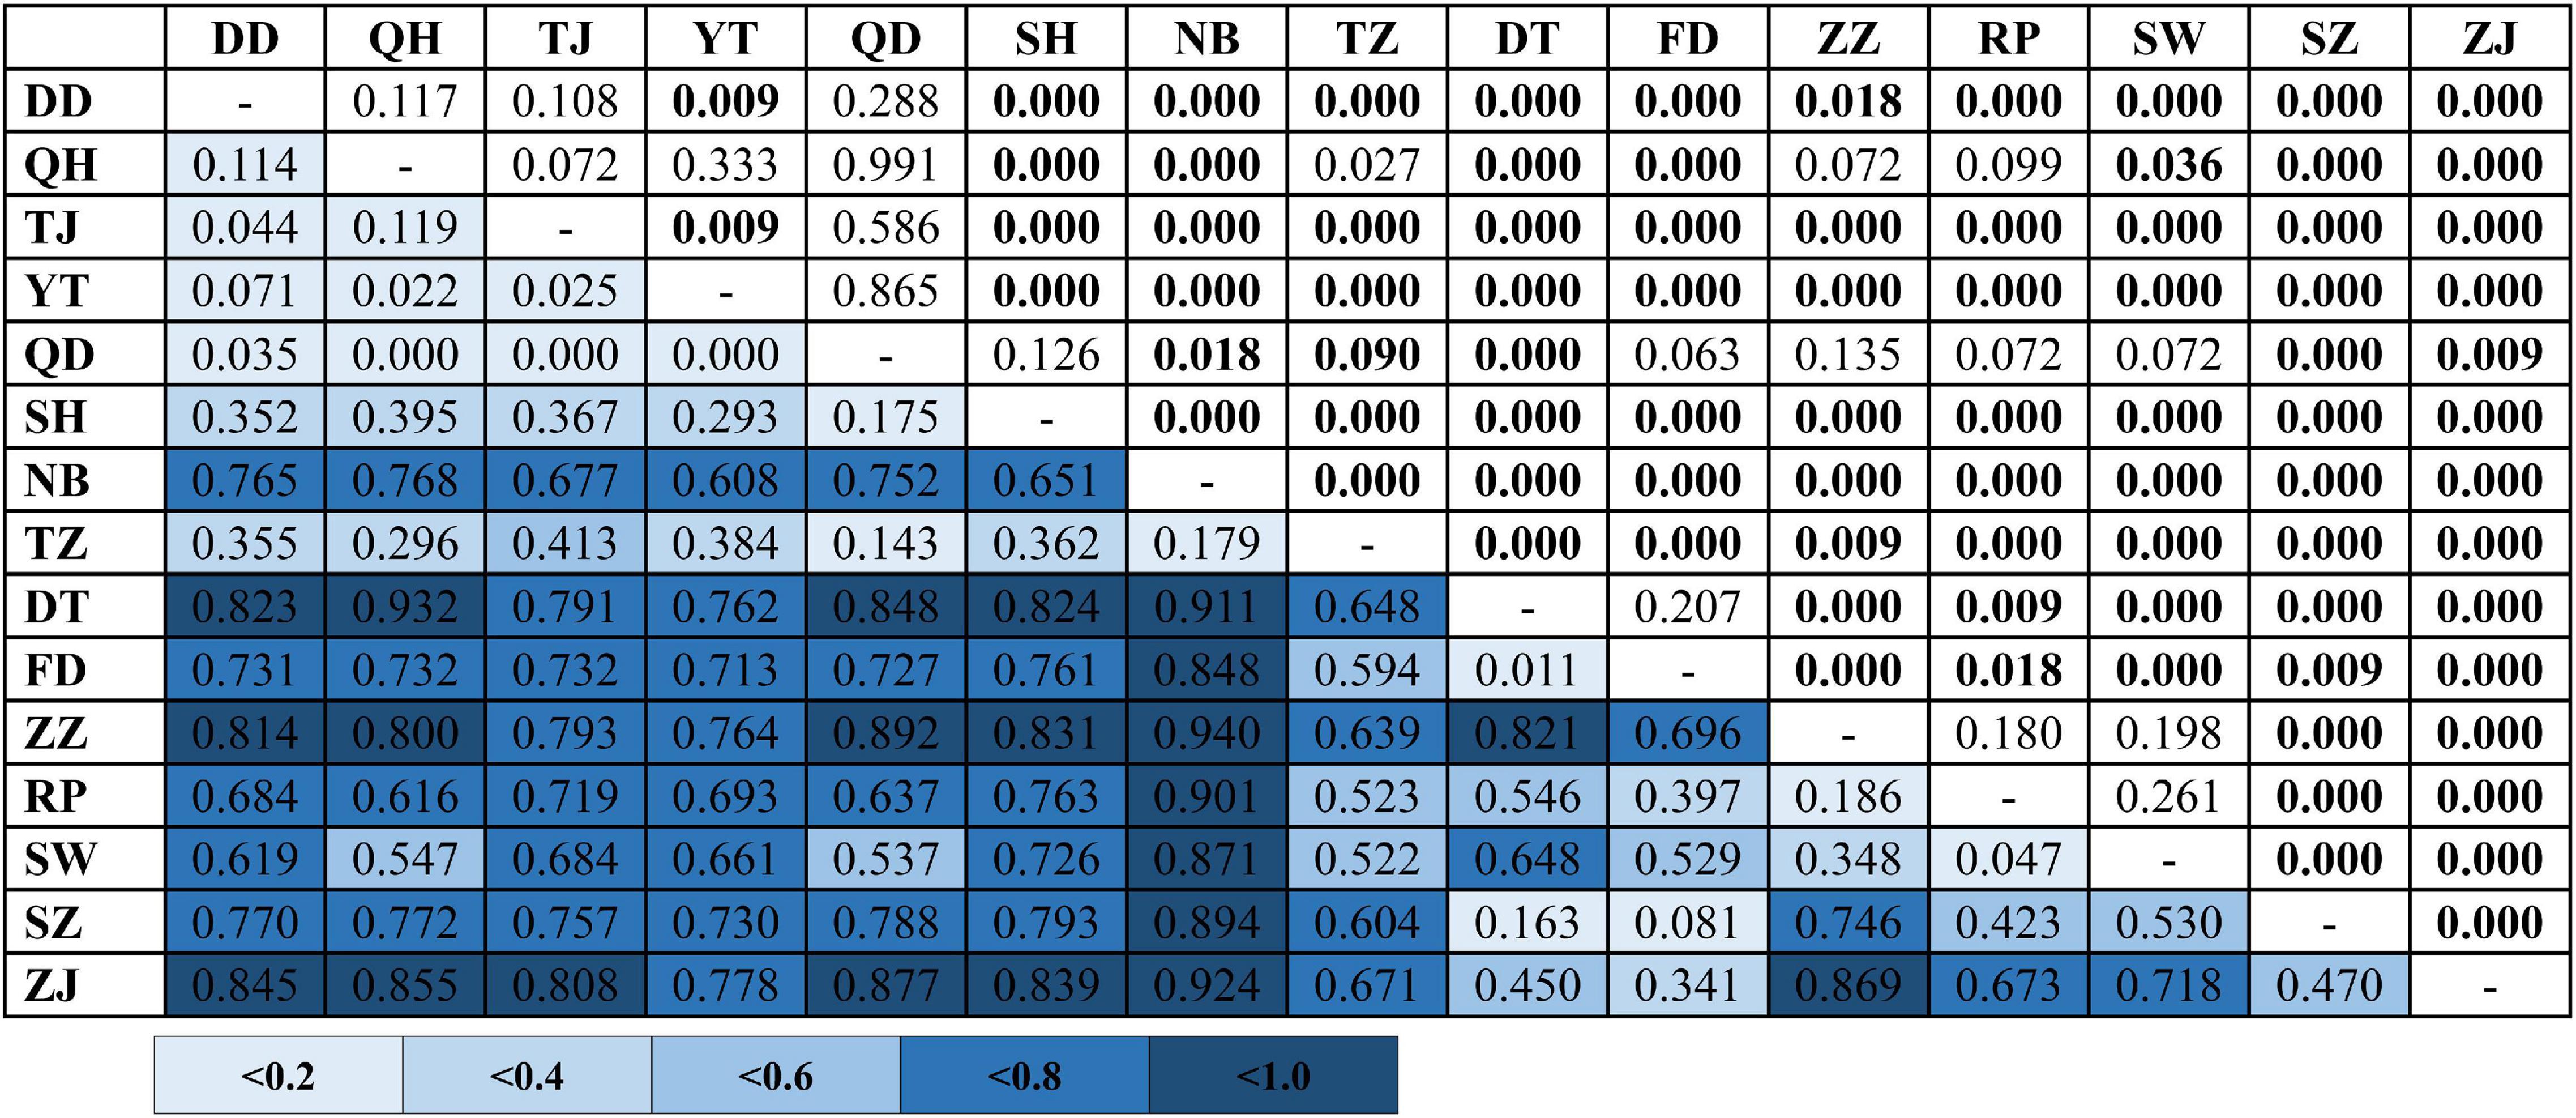
Figure 2. Pairwise genetic differentiation (FST; below diagonal) between populations of Tridentiger bifasciatus in the China Seas based on mtDNA dataset. Significant pairwise p-values (above diagonal) are shown in bold (p < 0.05) after the Bonferroni correction. See Table 1 for the locality codes.
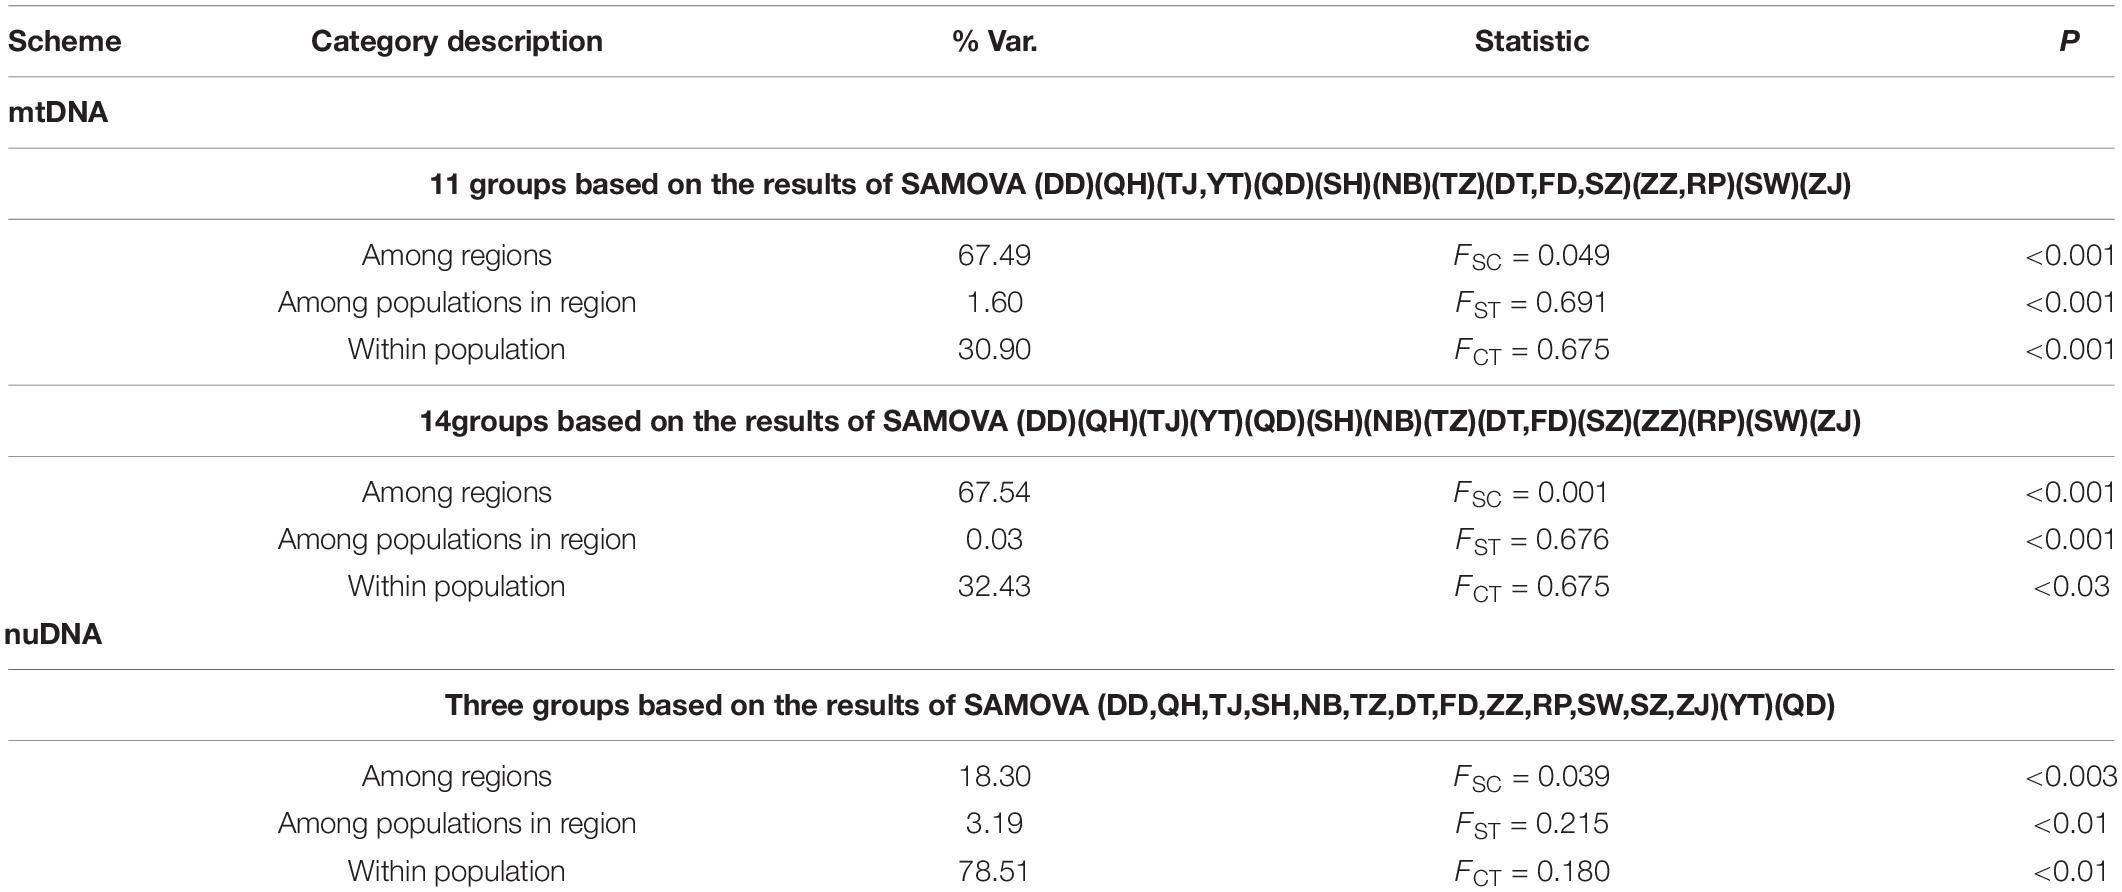
Table 2. Analysis of molecular variance (AMOVA) of Tridentiger bifasciatus. See Table 1 for the locality codes.
In addition, our study found that the Ka/Ks values of T. bifasciatus cyt b gene were smaller than 1 (Ka/Ks < 1). To identify if there were differences between two mtDNA lineages (Figure 1B), the NSS and SS in 204 sequences of cyt b gene were estimated. The values of NSS/SS were calculated. In total, 204 values fell into eight groups, ranging from 2.927 to 2.947 (Figure 3A). The most frequency value of NSS/SS was 2.938. Besides, our results also revealed that the sequences in lineage I had a higher value of NSS/SS than those in lineage II, excluding only one sequence in population YT (NSS/SS = 2.933). Moreover, our study found the values of the Ka and Ks within lineages I and II were smaller than those between lineages I and II (Figures 3B,C). The average Ks values between sequences within lineages I and II were 0.015 and 0.014, respectively, and the average Ka values between sequences within lineages I and II were 0.0010 and 0.0011, respectively. The average Ks and Ka values between sequences from different lineages were 0.045 and 0.0043, respectively (Figures 3B,C).
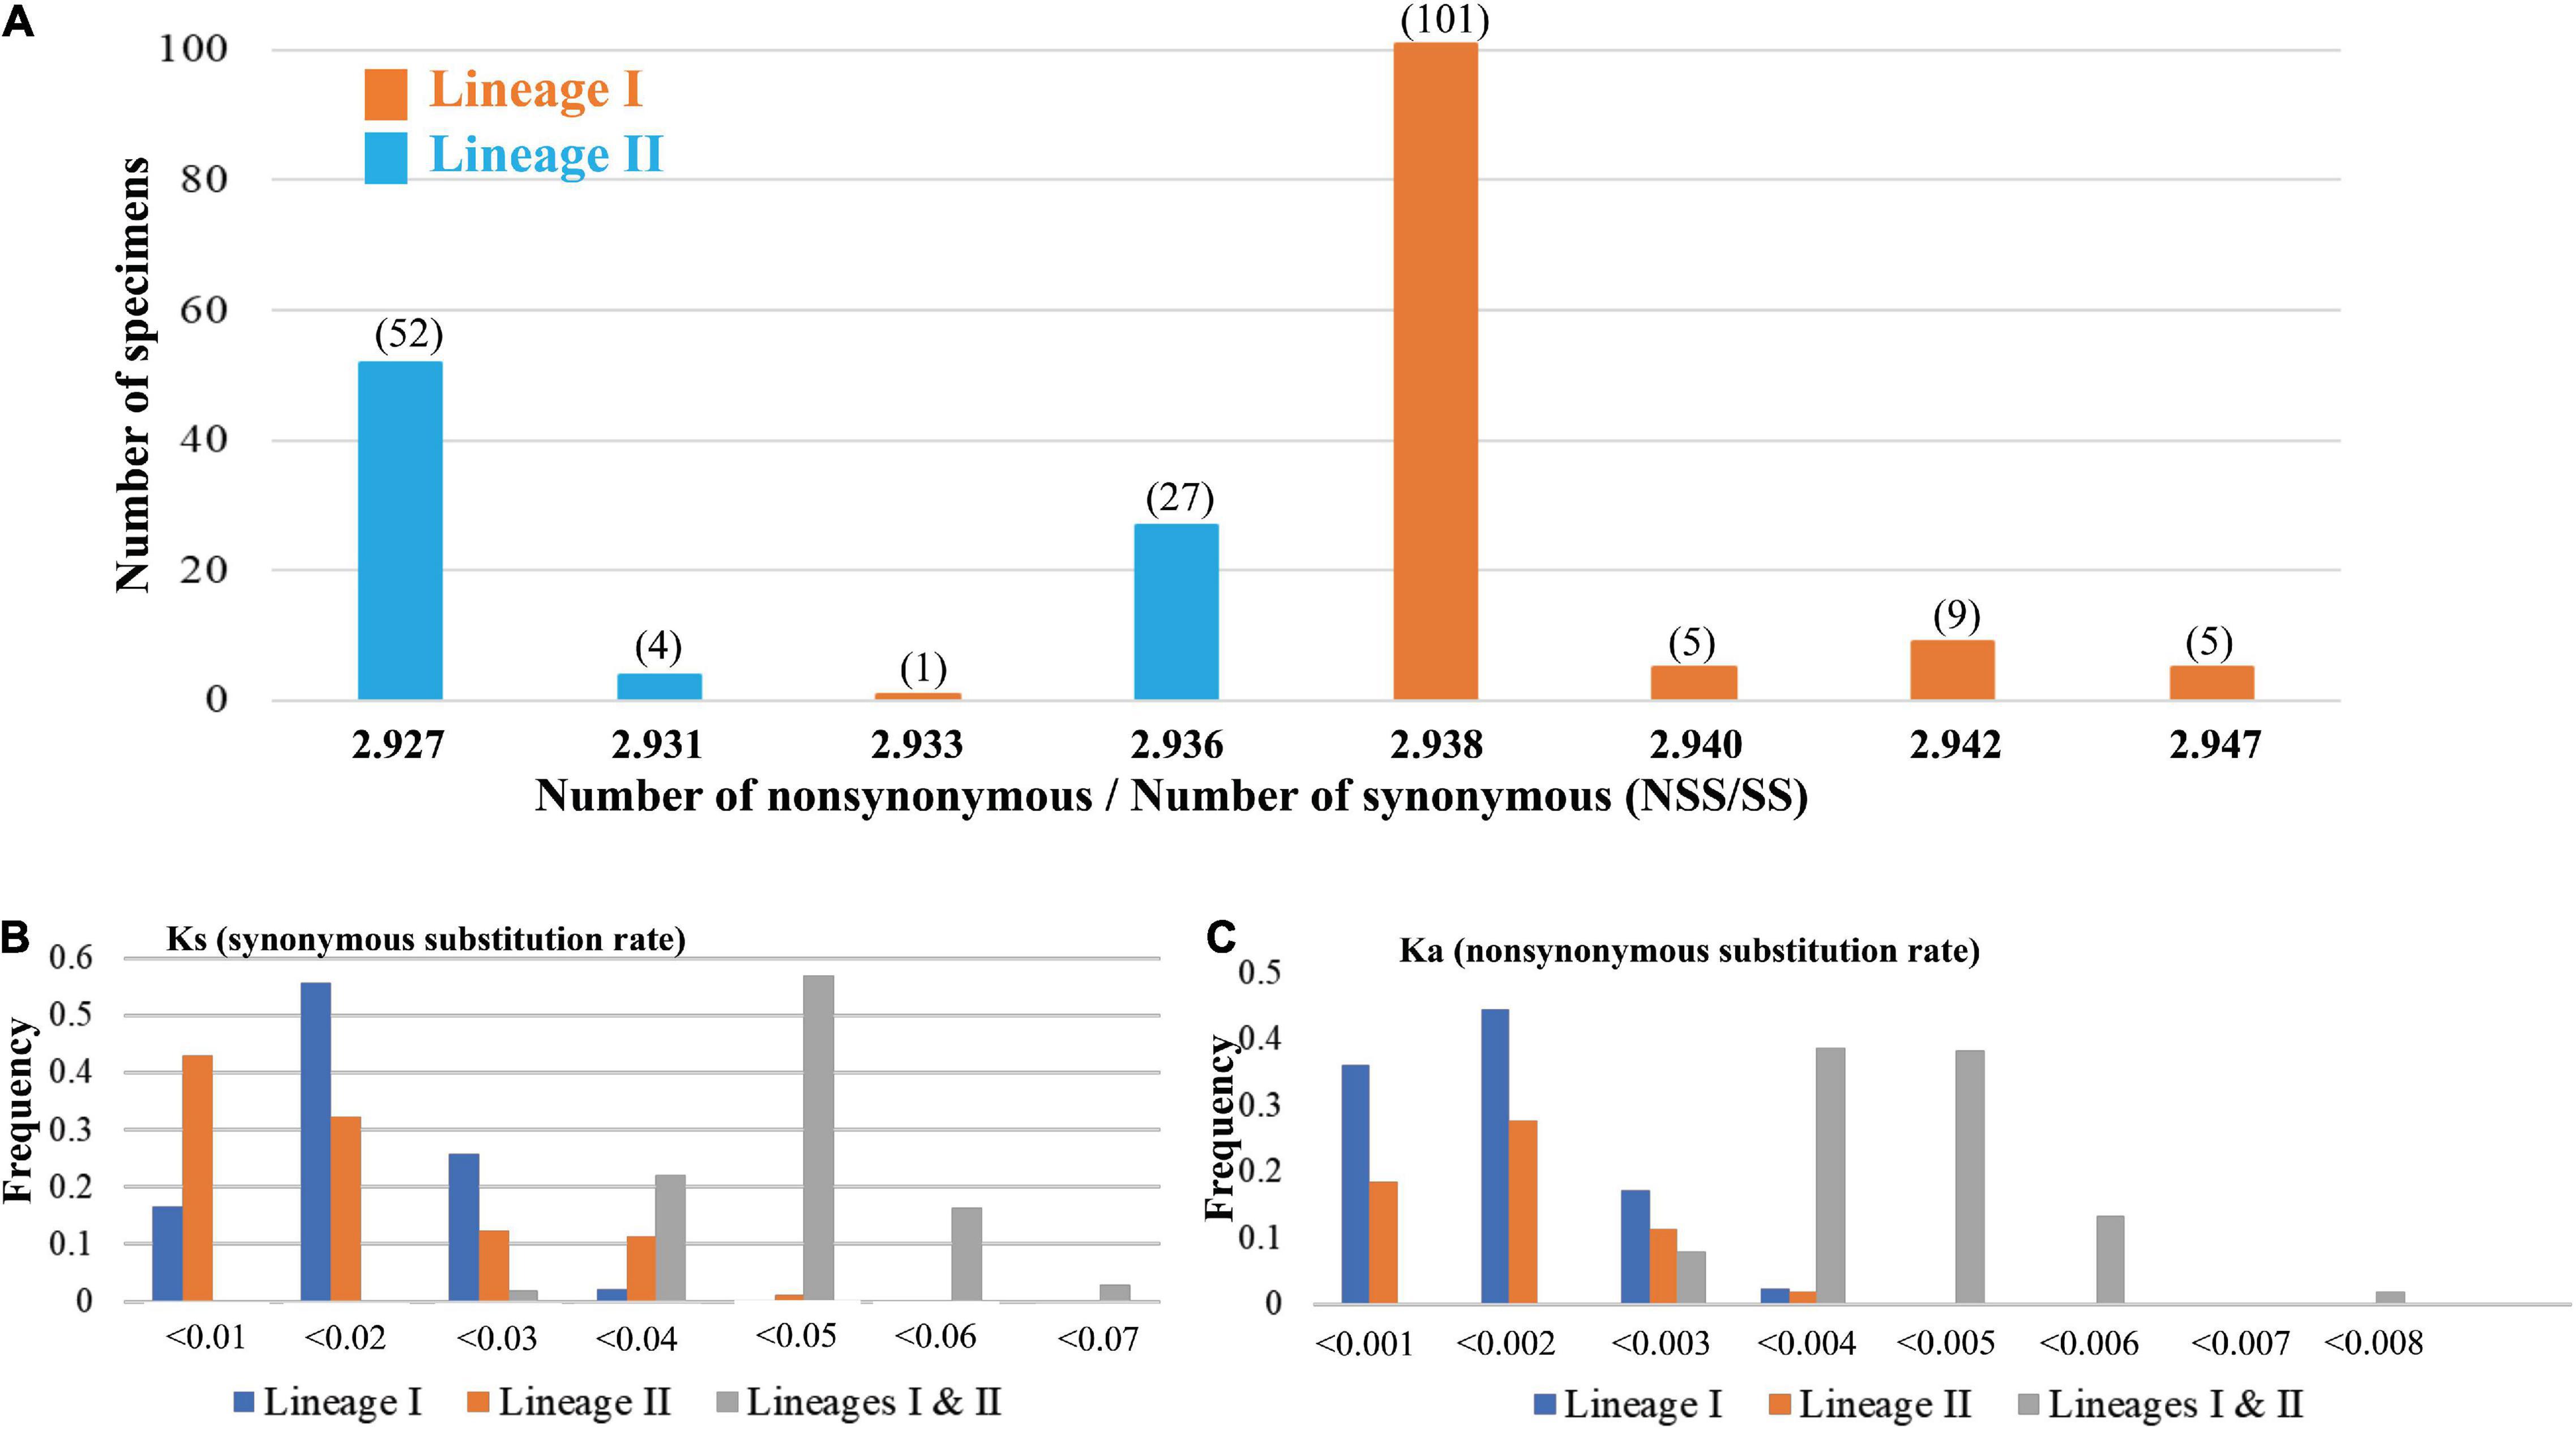
Figure 3. (A) The distribution of the values of the Number of non-synonymous/Number of synonymous (NSS/SS) substitution sites based on the cytochrome b gene. All values of NSS/SS are assorted as eight numerical values. Five values are calculated from the sequences from mt DNA lineage I (orange, Figure 1), and three values are calculated from the sequences from mt DNA lineage II (blue, Figure 1). The numbers in the parentheses are the numbers of the sequence. The distribution of the values of (B) Ks (synonymous substitution rate) and (C) Ka (non-synonymous substitution rate) based on the cytochrome b gene within lineage I, lineage II, and between lineages are presented.
A total of 896 bp of the nuDNA sequences from 107 specimens were analyzed (Table 1 and Figure 1A). The sequences were aligned unambiguously with no indels. A total of 18 haplotypes (16 variable sites and 13 phylogenetic informative sites) were obtained (Supplementary Table 1). The range of the haplotype diversity was from 0.000 (population RP) to 1.000 (population QD), and the range of nucleotide diversity was from 0.0000 (population RP) to 0.0022 (populations QD and SW) (Table 1). Among 18 nuDNA haplotypes, eight haplotypes were shared with two and more than two populations (Supplementary Table 1). The haplotype 1 was distributed in all populations, and most specimens displayed the haplotype 1. The populations DT and FD had the most shared haplotypes (five shared haplotypes), while the populations YT, RP, and SW had only one shared haplotype. The haplotype network showed a lack of population structure (Figure 4). The overall FST was 0.053. A comparison of the fixation indices NST and GST revealed that NST (0.053) was slightly larger than GST (0.032). These results show non-population differentiation. The pairwise FST values ranged from 0.000 to 0.443, but most of the values were non-significant (Figure 5). In the SAMOVA analysis, the highest FCT value (FCT = 0.183) occurred at K = 3 (Supplementary Table 4). In AMOVA, only 18.30% of variations existed among these three groups, and 78.51% of variations existed within the population (Table 2).
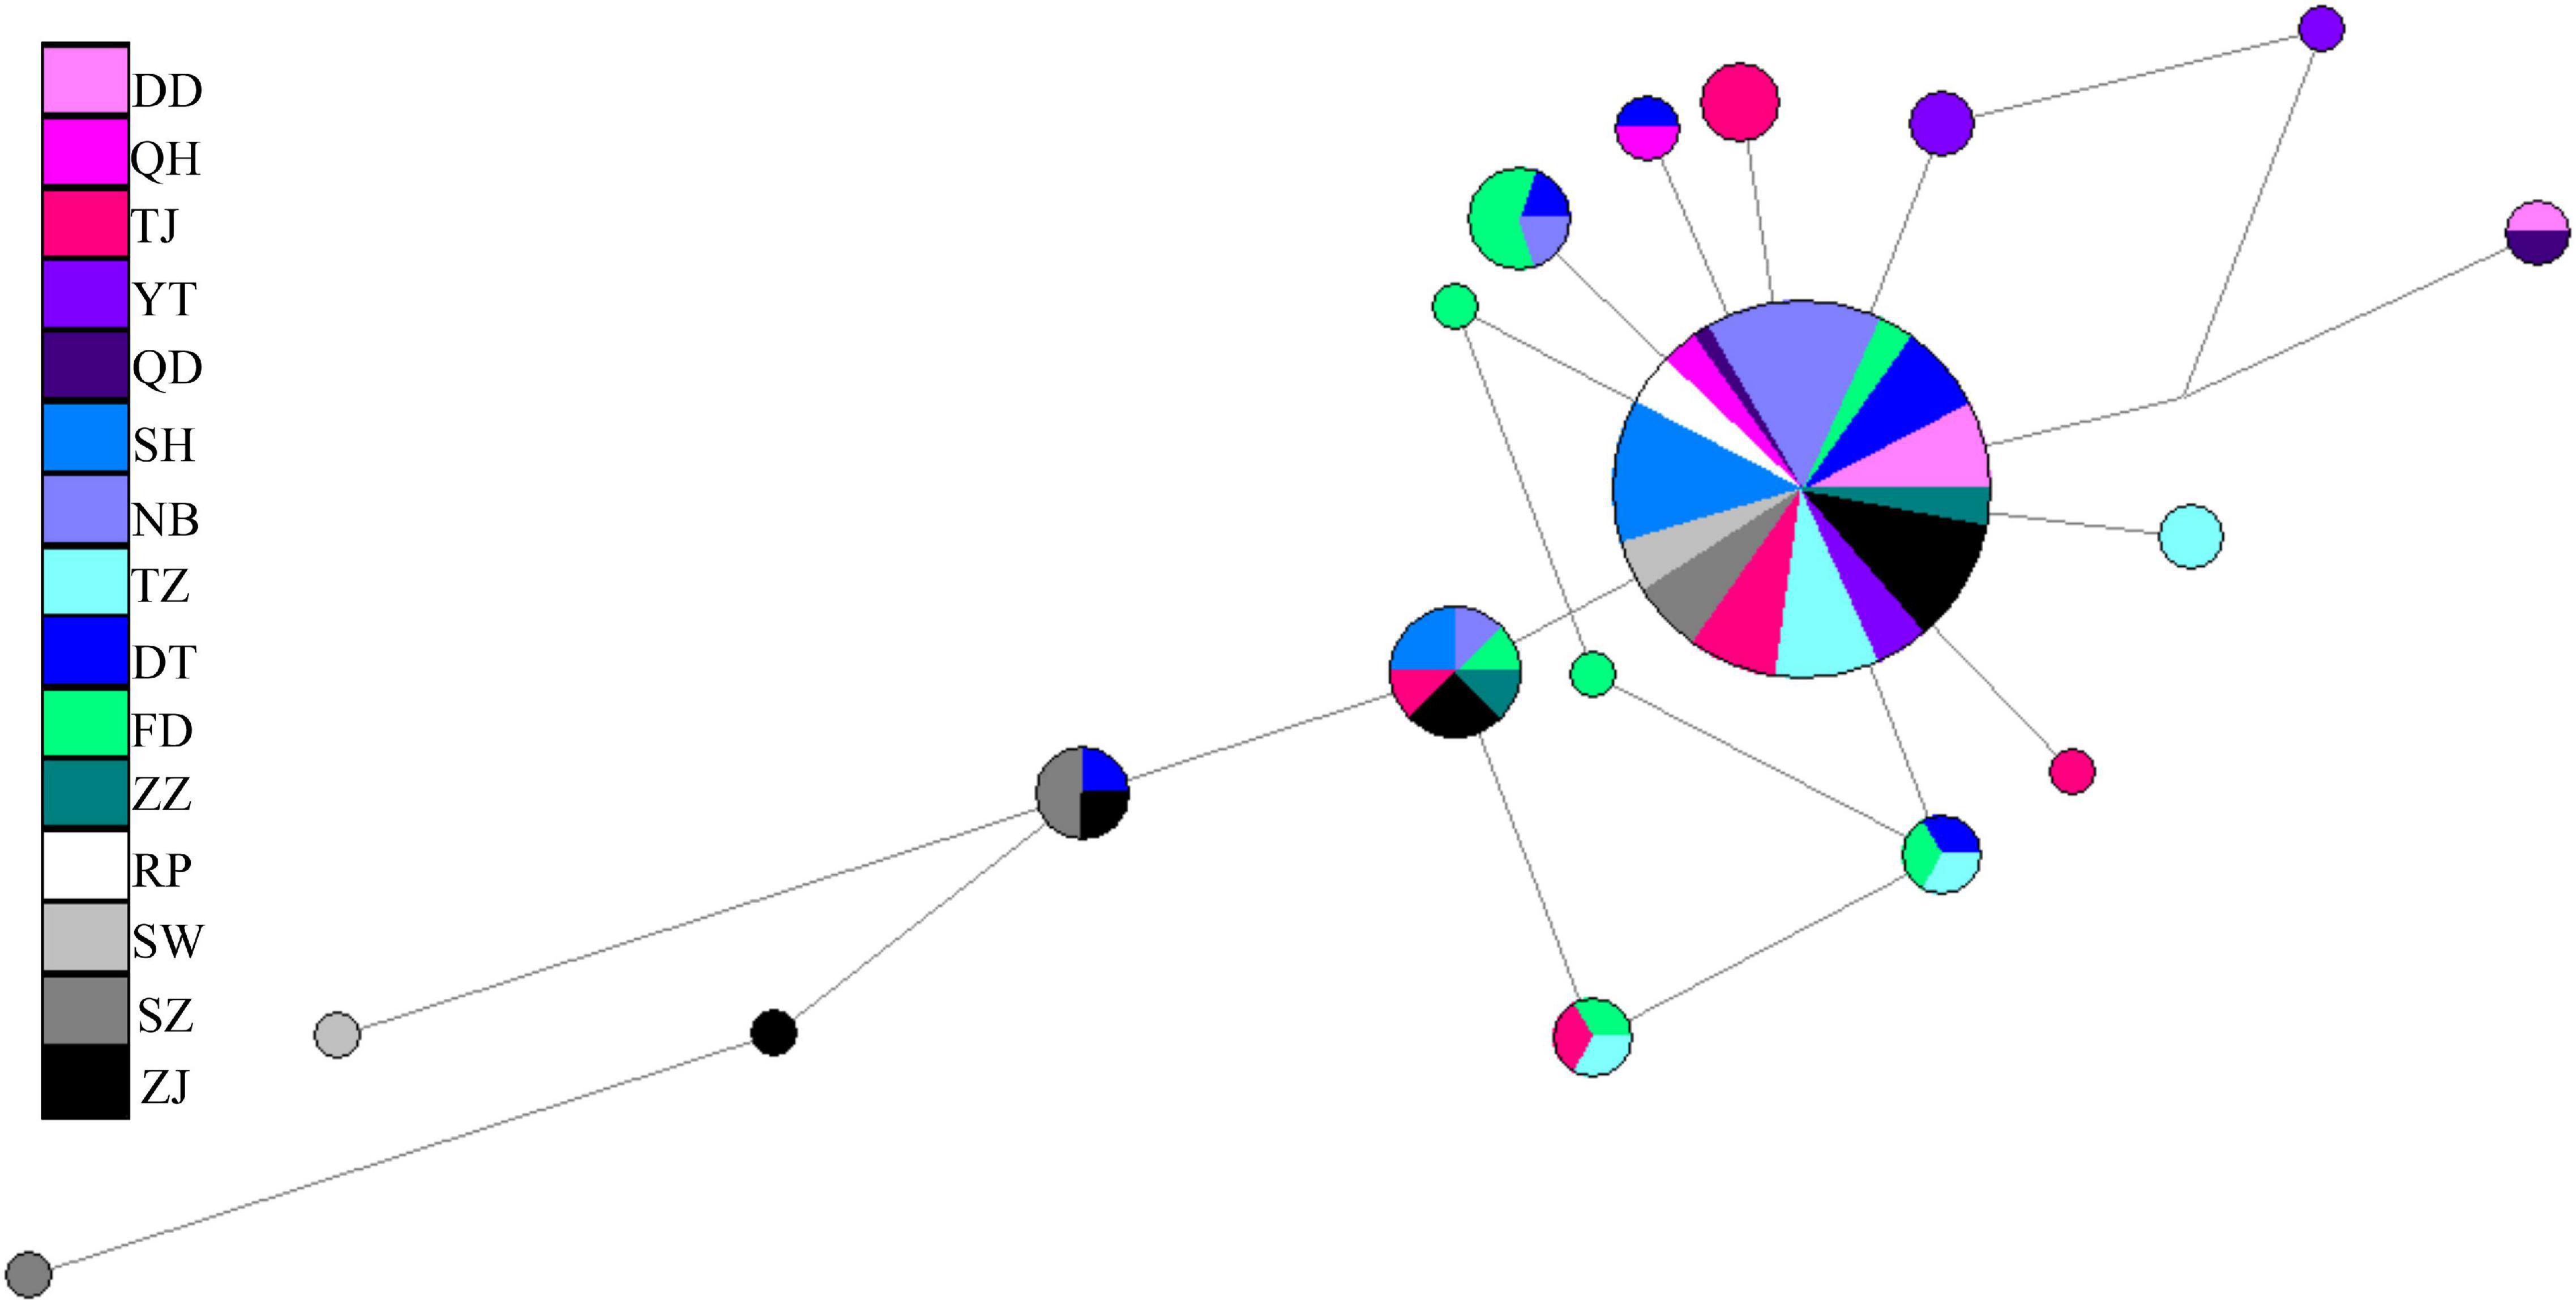
Figure 4. Median-joining network of Tridentiger bifasciatus along the coast of the China Seas based on the nuDNA haplotypes.
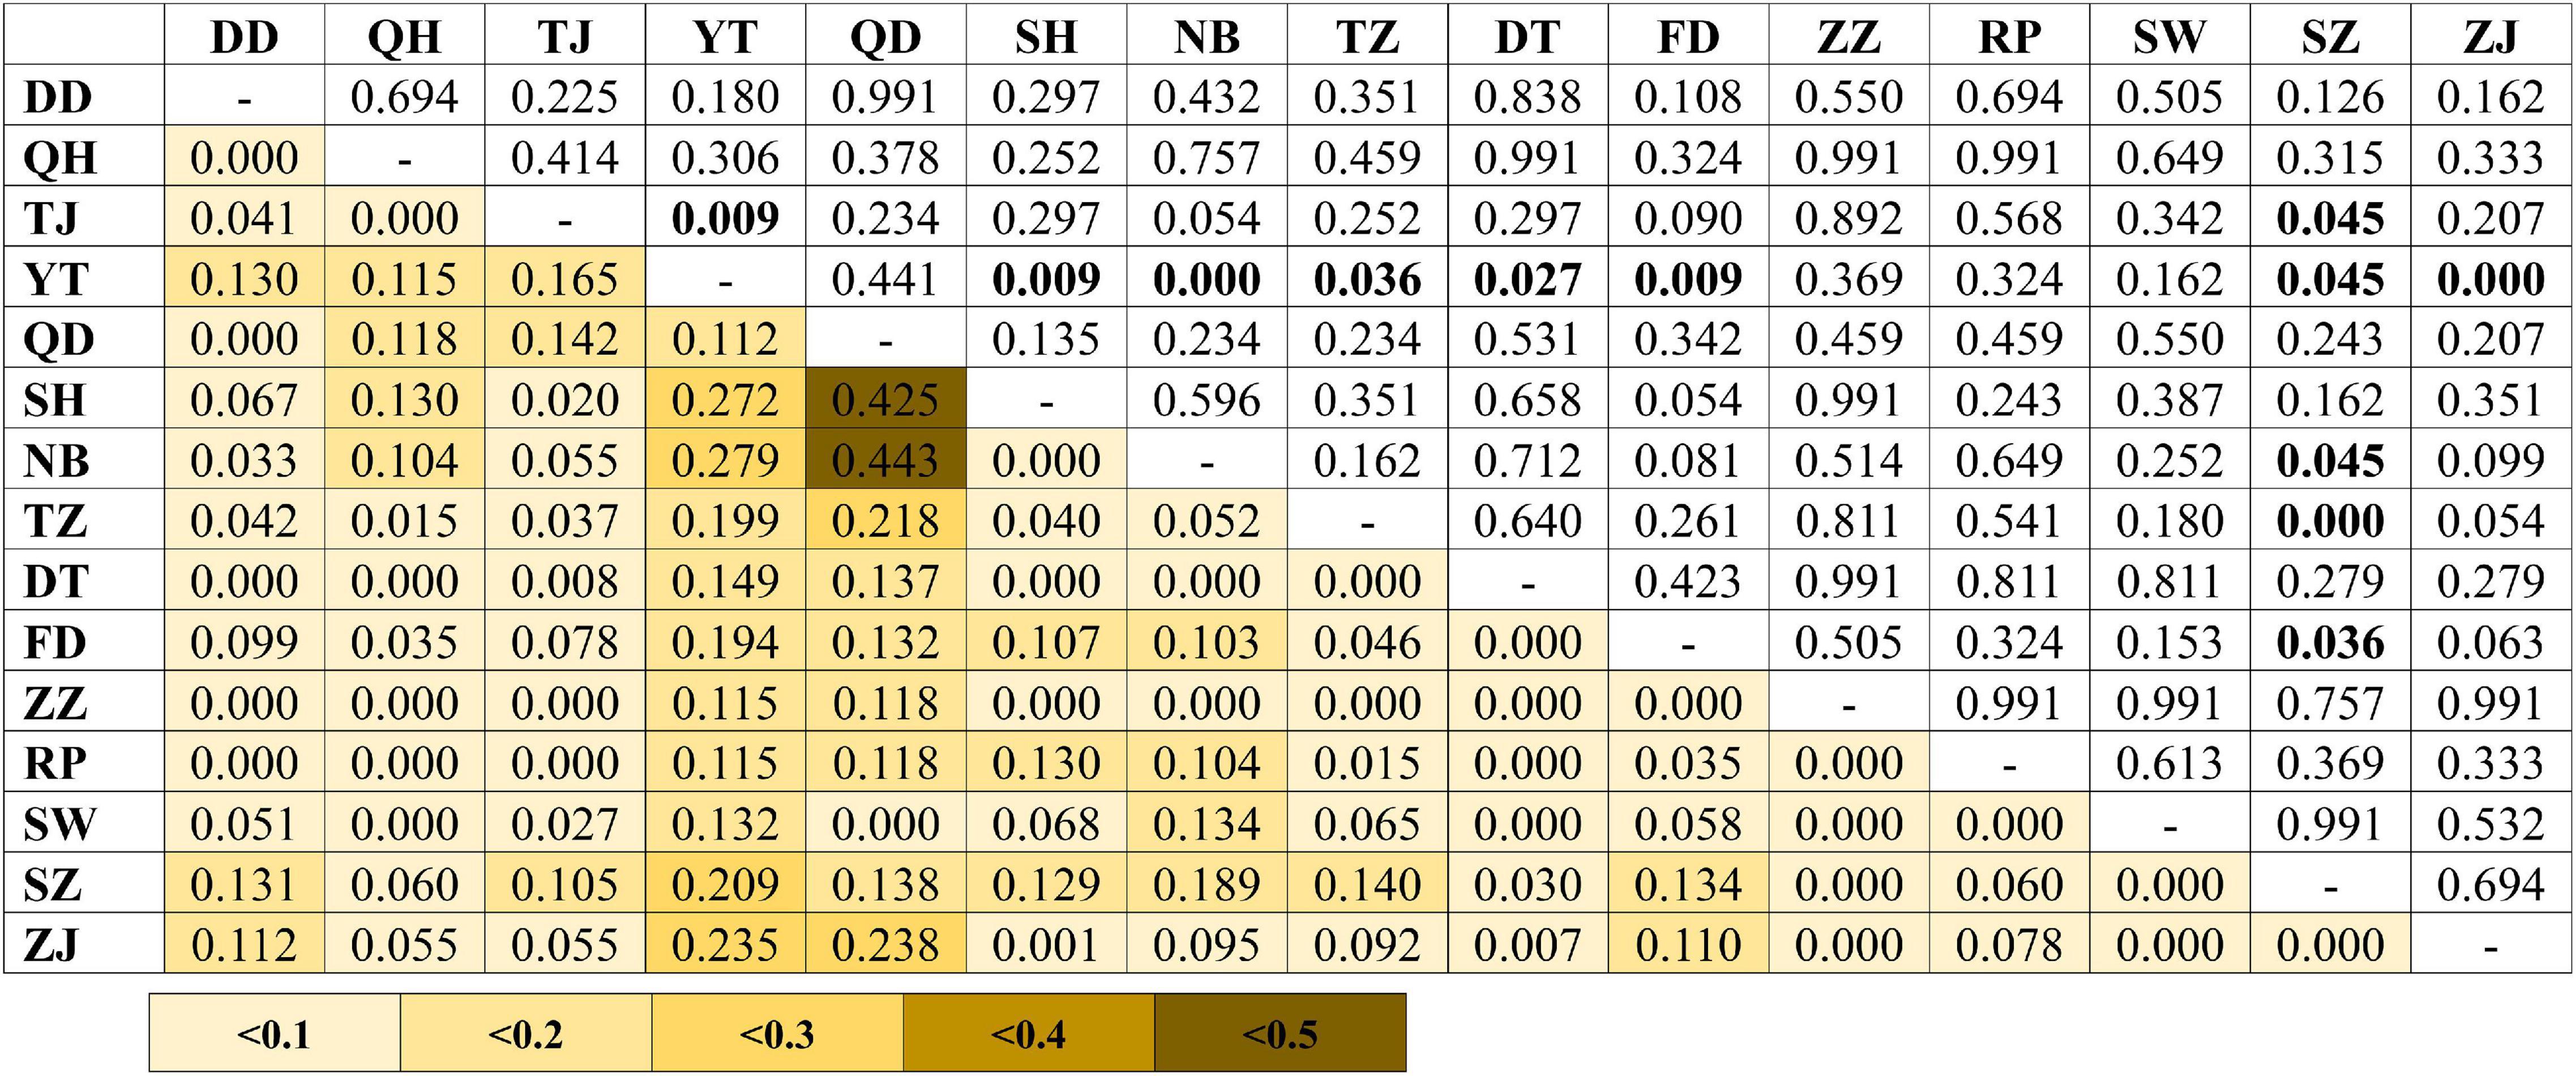
Figure 5. Pairwise genetic differentiation (FST; below diagonal) between the populations of Tridentiger bifasciatus in the China Seas based on the nuDNA dataset. Significant pairwise p-values (above diagonal) are shown in bold (p < 0.05) after the Bonferroni correction. See Table 1 for the locality codes.
Demography and Migrations
In the demographic analyses, the significant negative values of Fu’s FS in all datasets were significant (Table 3). The values of Tajima’s D based on both the mtDNA and nuDNA datasets showed no significant difference, but the dataset that only included the mtDNA lineage I showed a significant difference (Table 3). The mismatch distribution based on all mtDNA and two mtDNA lineages were bimodal and that based on nuDNA lineage seemed to reveal a unimodal distribution (Figure 6A). The BSPs displayed that the population expanded 0.07 million years ago and that the population declined recently (Figure 6B).
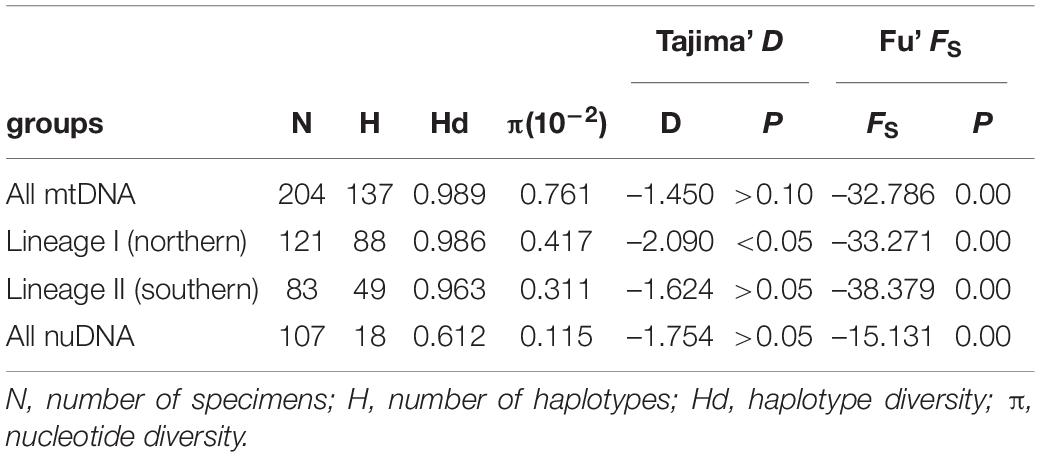
Table 3. Neutrality test statistics (Tajima’ D and Fu’ FS) for the all mitochondrial samples, two mitochondrial lineages, and all nuclear samples of Tridentiger bifasciatus populations.
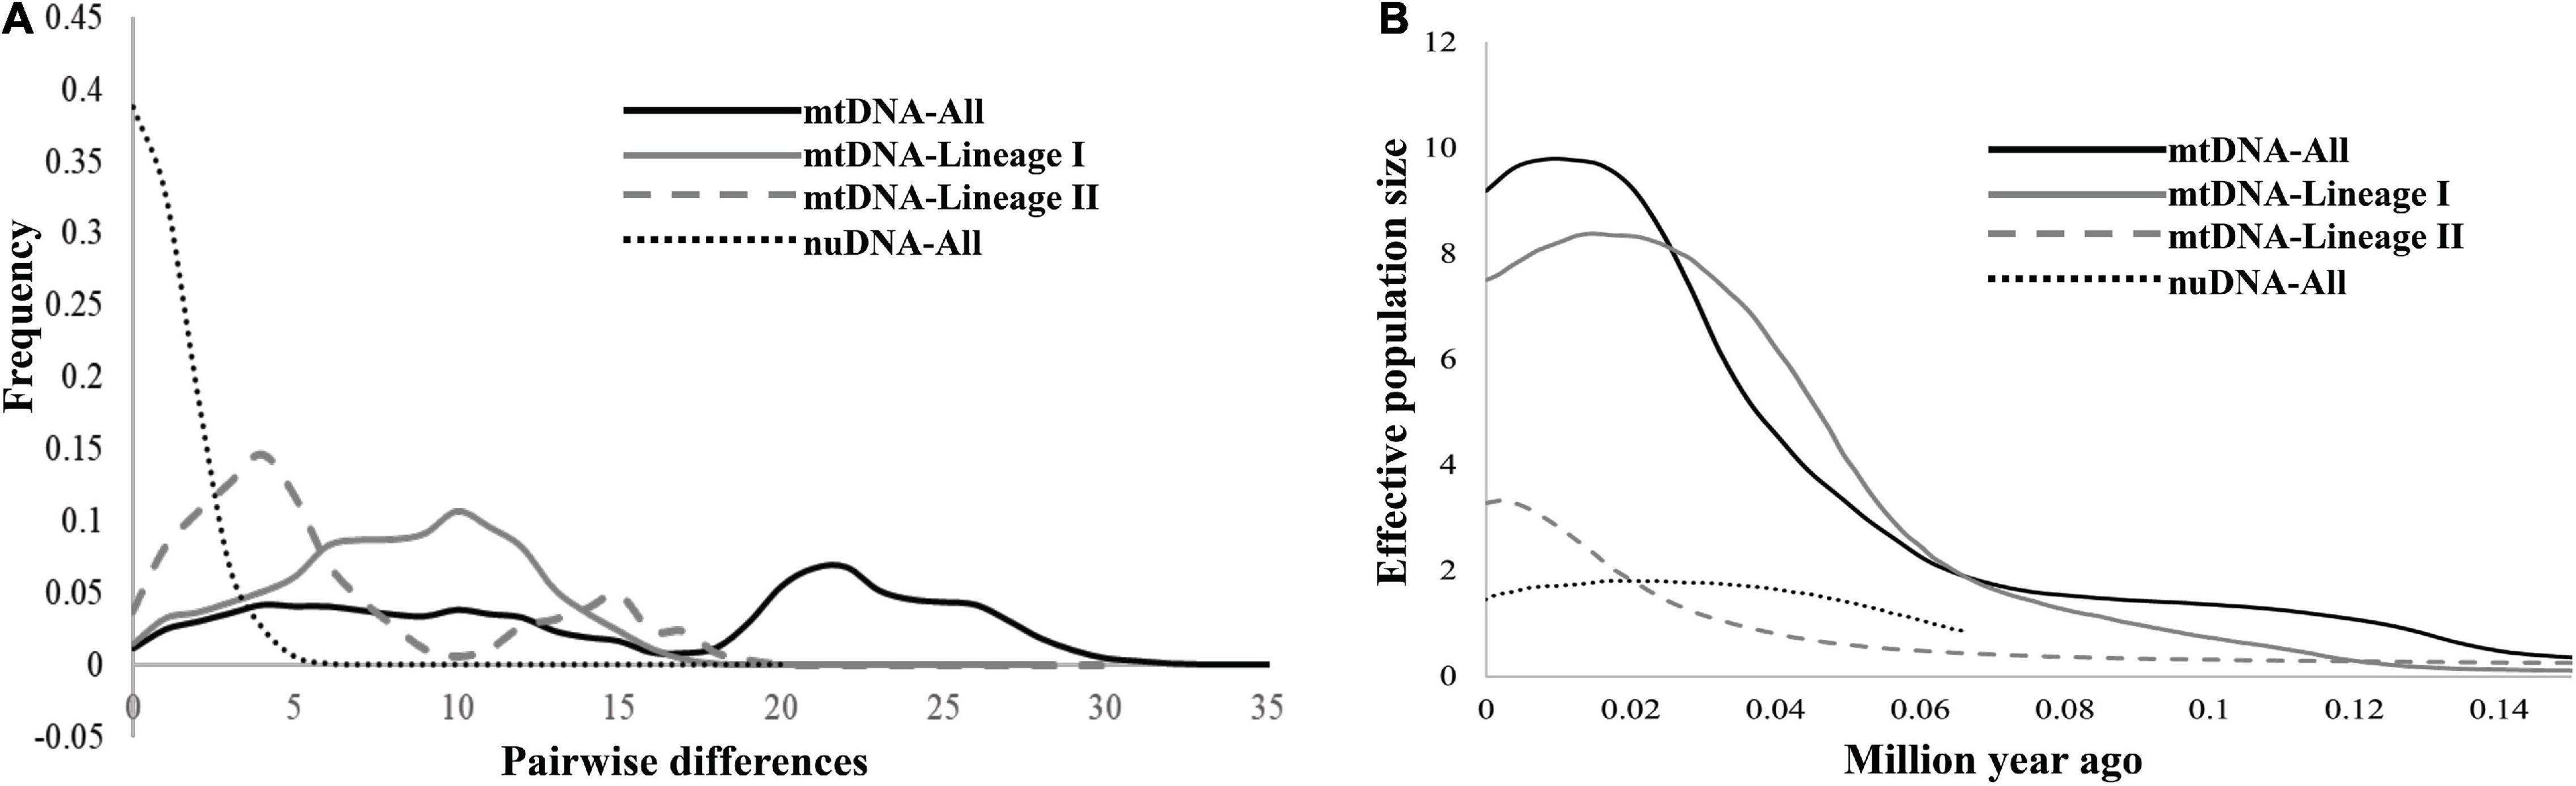
Figure 6. (A) The mismatch distributions for all samples based on mtDNA and nuDNA, and for mtDNA lineages I and II, respectively. (B) Bayesian skyline plots of all samples based on mtDNA and nuDNA, and for mtDNA lineages I and II, respectively. The y-axis is the product of the effective population size (Ne) and the generation length on a log scale, while the x-axis is the time scale before the present in units of a million years ago.
In addition, we tested three population scenarios using mtDNA and nuDNA datasets (Figure 7). Based on the phylogenetic analysis of mtDNA, scenario A assumed two glacial refugia followed by post-glacial admixture (Figure 7A). Based on the haplotype network analysis of nuDNA, scenario B assumed that all populations diverged simultaneously from a single recent common ancestor (Figure 7B). Scenario C was a combination model, which combined the results of the mtDNA and nuDNA, where all the populations withdrew into two glacial refugia followed by post-glacial admixture simultaneously from the admixed population (Figure 7C). For the mtDNA dataset, the highest posterior probability was found for scenario A. Its posterior probability [1.0000, 95% HPDI (highest posterior density interval): 1.0000–1.0000] was much higher than that observed for other scenarios (Figure 7D). The 95% HPDI of scenario A did not overlap with those of other scenarios. For the nuDNA dataset, the highest posterior probability was found for scenario C (Figure 7D). Its posterior probability (0.8507, 95% HPDI: 0.8408–0.8605) was much higher than observed for other scenarios, and the 95% HPDI of scenario A did not overlap with those of other scenarios.
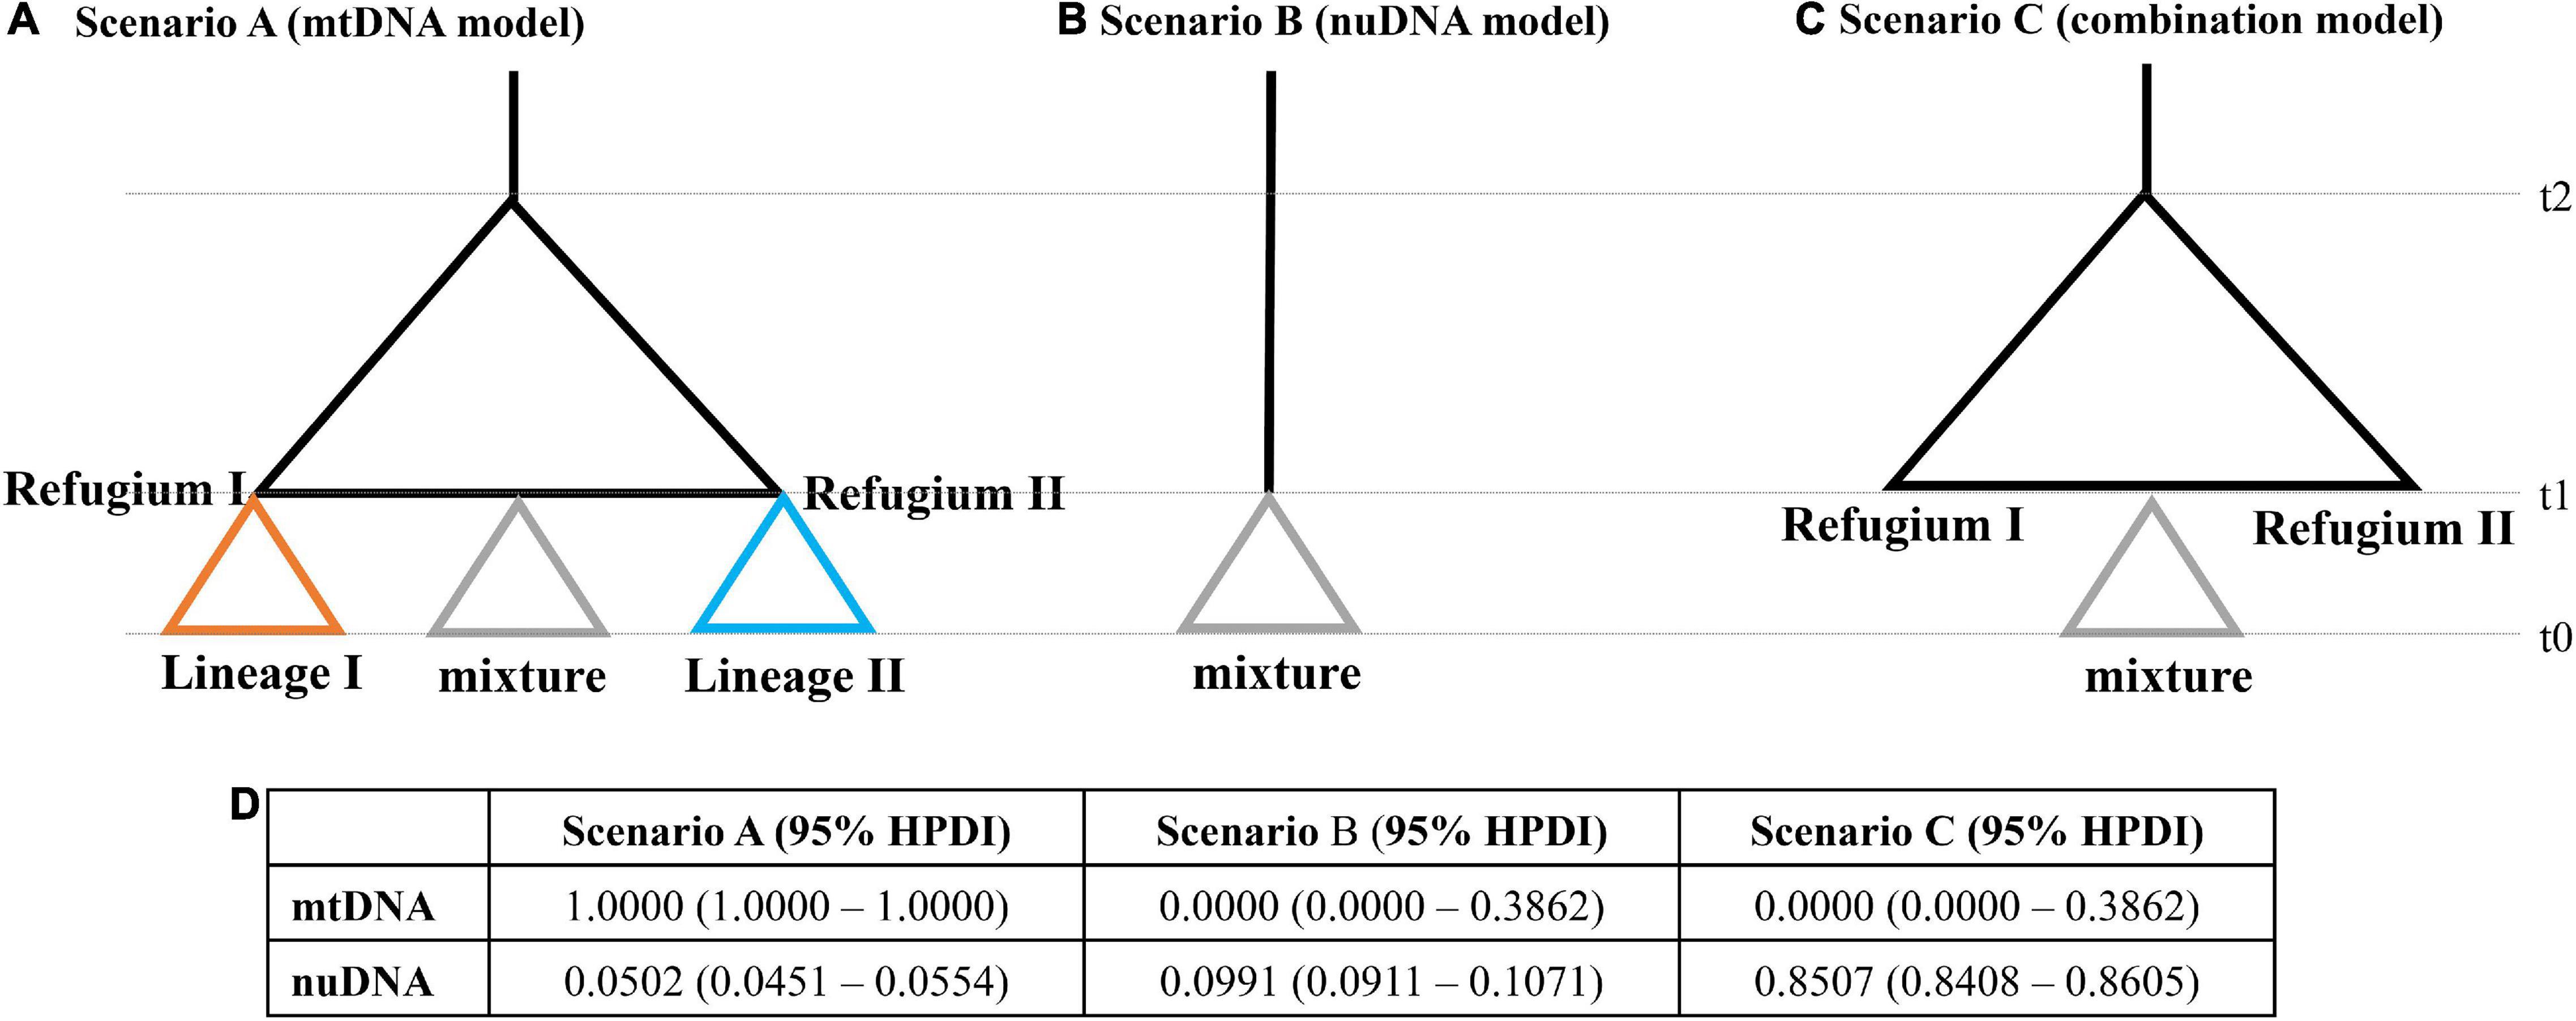
Figure 7. Graphic representation of the three scenarios, (A) mtDNA phylogenetic model, (B) nuDNA phylogenetic model, and (C) combination model, used in the ABC analyses. The t-values correspond to the timing of past divergence events or past admixture between populations. Note that time is not to scale. (D) Relative posterior probabilities for each scenario and their 95% highest posterior density interval (HPDI) based on the logistic estimate by DIYABC.
Finally, our study re-assorted all sampling populations into three metapopulations, YS, ECS, and SCS, to examine the migrations between these three regions. The effective population size in each metapopulation and the migration number (per generation) were analyzed using MIGRATE-N based on the mtDNA and nuDNA datasets. In mtDNA dataset, YS had the larger effective population size (θ = 0.034). Migration was most frequent from ECS to SCS (m = 11.76) (Figure 8A). These suggested that the migrations were southward (Figure 8A). In nuDNA dataset, ECS had the larger effective population size (θ = 0.097). Migration was most frequent from ECS to YS (m = 1.92) (Figure 8B). These findings suggested that the migrations were northward (Figure 8B).
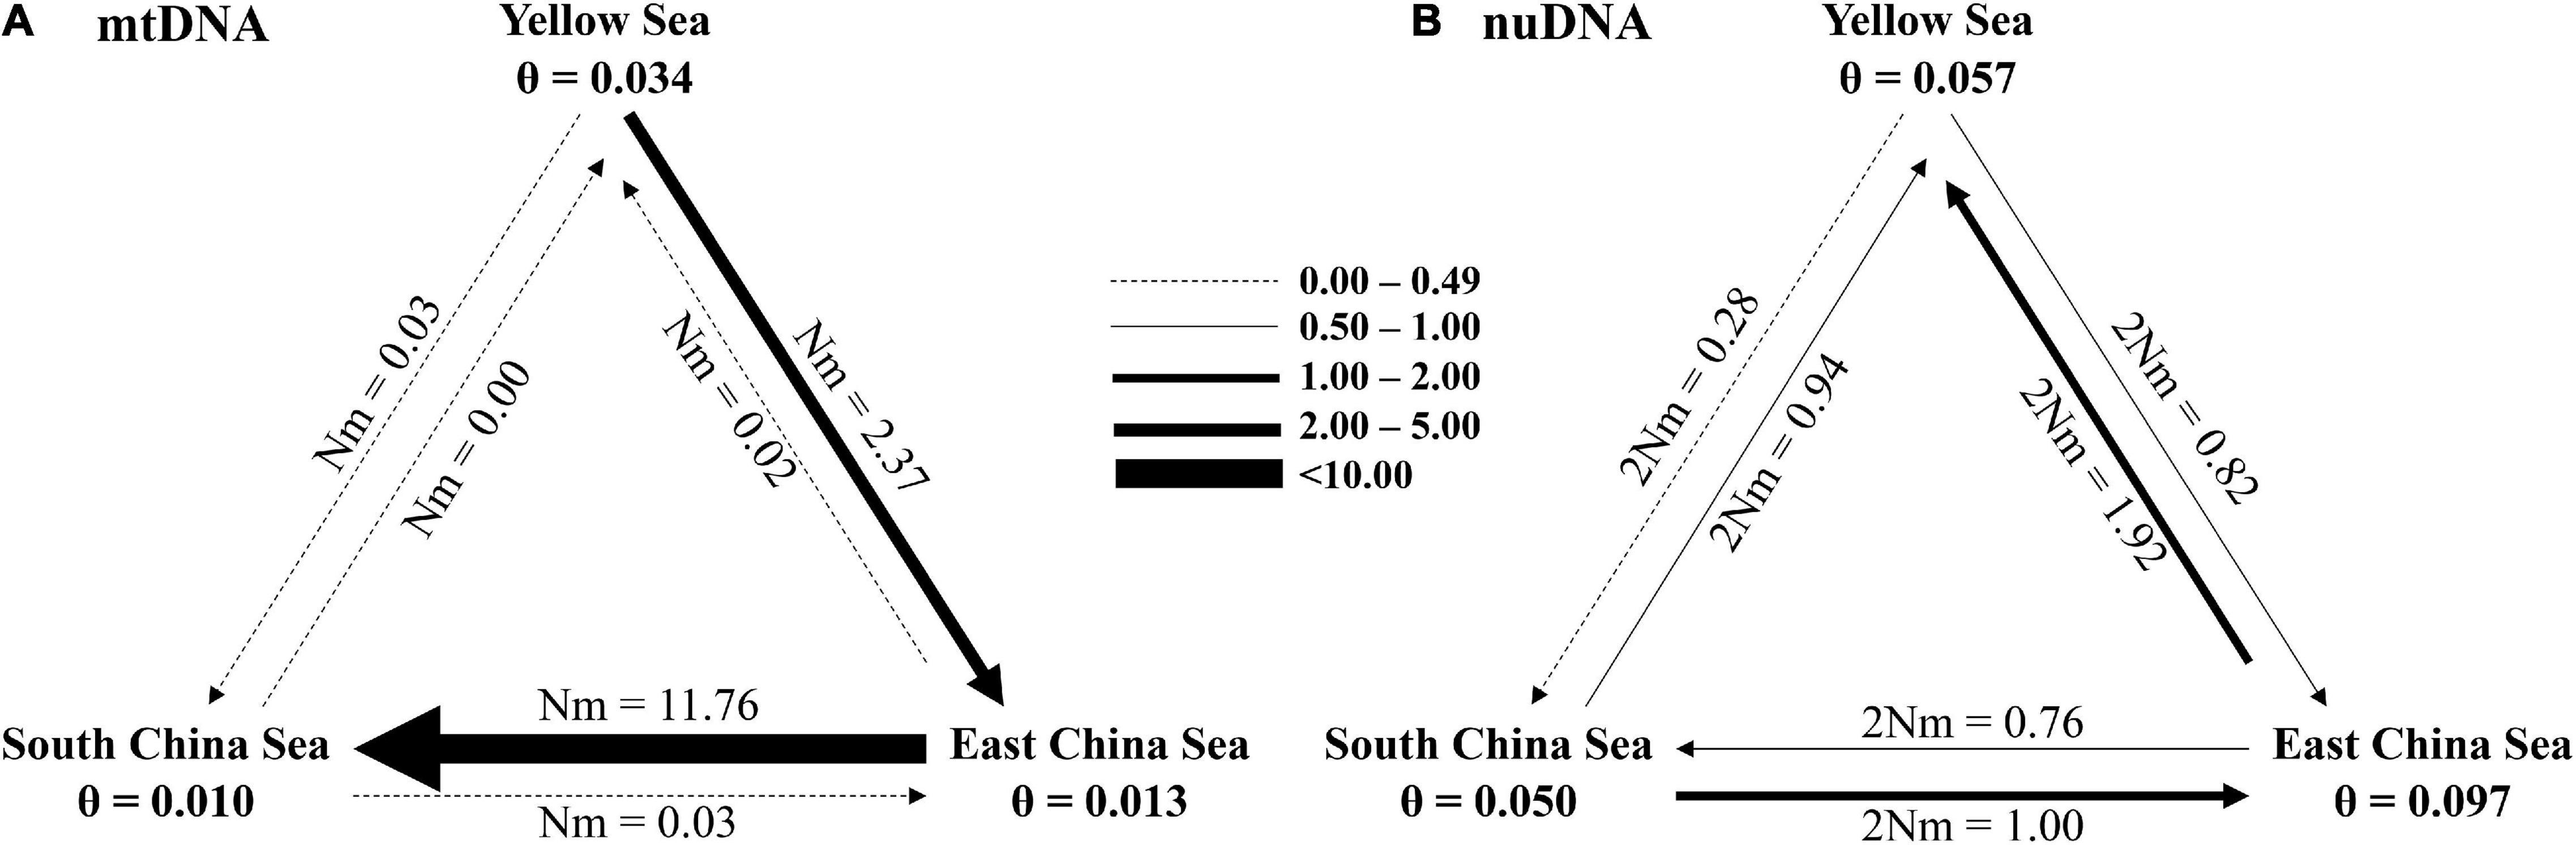
Figure 8. Number of migrants (per generation, Nm) among Tridentiger bifasciatus metapopulations from the Yellow Sea, East China Sea, and the South China Sea, and their effective population sizes (θ) based on (A) mtDNA and (B) nuDNA.
Discussion
Selection Driven Mitochondrial Lineages Splitting
Previous phylogeographic studies in the northwest Pacific have revealed that the marine species often displayed high genetically divergent lineages of mtDNA (e.g., Mytilisepta virgata, see Lee et al., 2021; Cyclina sinensis, see Ni et al., 2012; Bostrychus sinensis, see Qiu et al., 2016; Mugil cephalus, see Shen et al., 2011; Meretix petechialis, see Wang et al., 2017; and Scatophagus argus, see Yan et al., 2020). Although some species revealed the absence of significant genetic differentiation, they displayed the diversification of multiple stocks based on the mtDNA dataset (e.g., Trichiurus japonicus, see Hsu et al., 2022 and Nemipterus bathybius, see Yi et al., 2021). Here, T. bifasciatus also displayed high genetically divergent lineages of mtDNA (Figure 1B).
Most studies supported that the isolations were shaped by the landform changes during ice ages (e.g., Liu et al., 2007; Shen et al., 2011; Qiu et al., 2016). However, Lee et al. (2021) suggested that the two divergent mtDNA cox1 (cytochrome c oxidase subunit I) lineages of M. virgata were a proxy for two mtDNA genotypes adapted to different surface water temperature regions, due to divergence in the energy metabolic functions. Although they could not provide supporting evidence about selection, they suggested that the balancing selection can occur under spatial heterogeneity. Here, our study found that the values of Ka/Ks in T. bifasciatus cyt b gene were smaller than 1, and the two divergent mtDNA lineages of T. bifasciatus displayed different values of NSS/SS based on the cyt b gene (Figure 3A). The values of NSS/SS in lineage II were lower than that in lineage I, excluding one specimen in population YT. Thus, our study suggests that the two mtDNA divergent lineages might be maintained due to purifying selection (Ka/Ks < 1; Amparo et al., 2021) and different strengths of selection in the two geographic regions.
Discordance Between Mitochondrial and Nuclear Markers
All results displayed that the mtDNA and nuDNA datasets revealed discordant patterns (Tables 1–3 and Figures 1–7). The discordance between the mtDNA and nuDNA structures could simply be due to incomplete lineage sorting of the ancestral polymorphisms, admixture, and selection (Yang et al., 2016, 2018; Zhao et al., 2018; Lee et al., 2021). Due to differences in effective population size, mtDNA lineage sorting should be completed before sorting nuDNA (Zink and Barrowclough, 2008). Crochet (2000) suggested that similar values between the corrected mtDNA genetic differentiation [FST(mt)] and their analog for nuclear genes, FST(nu), are expected if the discordance results from incomplete lineage sorting of ancestral polymorphisms. Brito (2007) proposed an equation, FST(nu) = FST(mt)/[4-3xFST(mt)], to correct FST differentiation between mtDNA and nuDNA. An FST(nu) value of 0.053 was obtained in this study. Based on the equation proposed by Brito (2007), the calculated FST(mt) was 0.318. This corrected FST(nu) was still two times smaller than the FST(mt). Accordingly, incomplete lineage sorting might not result in the discordance between two markers.
The previous studies suggested that the mtDNA lineage sorting should be completed before sorting nuDNA because mtDNA included lower variations, which are transferred by single sex and have a lower effective population size (Zink and Barrowclough, 2008; Zhao et al., 2018; Lee et al., 2021). However, our study found that the genetic variations of nuDNA were lower than that of mtDNA in T. bifasciatus (Table 1 and Figures 1B, 4). Moreover, our study found that the four-eyed sleeper, Bostrychus sinensis, on the Pacific coastline of China (Qiu et al., 2016), two marine gobies, Gobius geniporus and Gobius cruentatus, from the north-eastern Atlantic and the Mediterranean Sea (Cekovská et al., 2020), and bifurcate mussel, Mytilisepta virgata, in northwestern Pacific coastline (Lee et al., 2021) all displayed the same pattern. The genetic variations of nuDNA, Ryr3, the first intron of ribosomal protein gene S7, and ITS1, were lower than those of mtDNA. These results all displayed that unlike the higher divergence in mtDNA sequences, the polymorphisms in nuDNA sequences were lower. Thus, our study suggested that the discordance between mitochondrial and nuclear markers might have resulted in incomplete lineage sorting, which might result in constraints on nuDNA genes.
The previous studies documented that balancing selection can occur under spatial heterogeneity and produce balanced mtDNA polymorphism due to mito-nuclear discordance (Hedrick, 2006; Scott et al., 2011; Lee et al., 2021). Our study found that the different selection stresses drove the mitochondrial lineages splitting (see above: Selection Driven Mitochondrial Lineages Splitting; Figure 3). Besides, our study suggested that the populations of T. bifasciatus first diverged and then mixed (see the section “Phylogeography of T. bifasciatus along the Pacific Coastline of China”). It could be that the nuDNA marker is more admixed, as it is transferred by both sexes and has a higher effective population size because the nuDNA dataset displayed the absence of genetic differentiation. Thus, in our study, the discordance between these two datasets of T. bifasciatus was accounted for by incomplete lineage sorting, selection, and population admixture.
Phylogeography of T. bifasciatus Along the Pacific Coastline of China
Previous studies suggest that sea level and temperature fluctuations promote migrations, differentiation, and speciation in the northwestern Pacific Ocean during glaciations (Liu et al., 2006; Shen et al., 2011; Qu et al., 2018). During glaciations, in the YS, partial ECS (including Taiwan Strait) was exposed. Many studies suggested that the exposed Taiwan Strait acted as a phylogeographic break during glaciations (e.g., Shen et al., 2011; Muto et al., 2016; Zhao et al., 2017). During glaciations, the populations on two sides of the Taiwan Strait were isolated in ECS (north lineage) and SCS (south lineage), and then the populations migrated during interglacial periods (e.g., Liu et al., 2007; Xu et al., 2009; Ni et al., 2012; Qiu et al., 2016). According to the results in the previous studies, our study found that there were two distribution patterns of these two lineages (north and south). First, the south lineage was only distributed in the south of Taiwan Strait, and the north lineage migrated southward (Figure 9A). For example, the north lineages of Chelon haematocheilus (Liu et al., 2007) and Cyclina sinensis (Ni et al., 2012) were distributed in ECS, including Taiwan Strait and northern SCS, and the south lineage was only distributed at SCS and the Taiwan Strait is the northern boundary. Second, the south lineage migrated northward and was also distributed in the north of Taiwan Strait (Figure 9B), but the north lineage did not migrate to SCS. For example, the south lineages of Eriocheir sensu stricto (Xu et al., 2009) and B. sinensis (Qiu et al., 2016) were also distributed at ECS. Here, the pattern of T. bifasciatus is the same as the pattern of B. sinensis and E. sensu stricto (Xu et al., 2009; Qiu et al., 2016; Figure 9B).
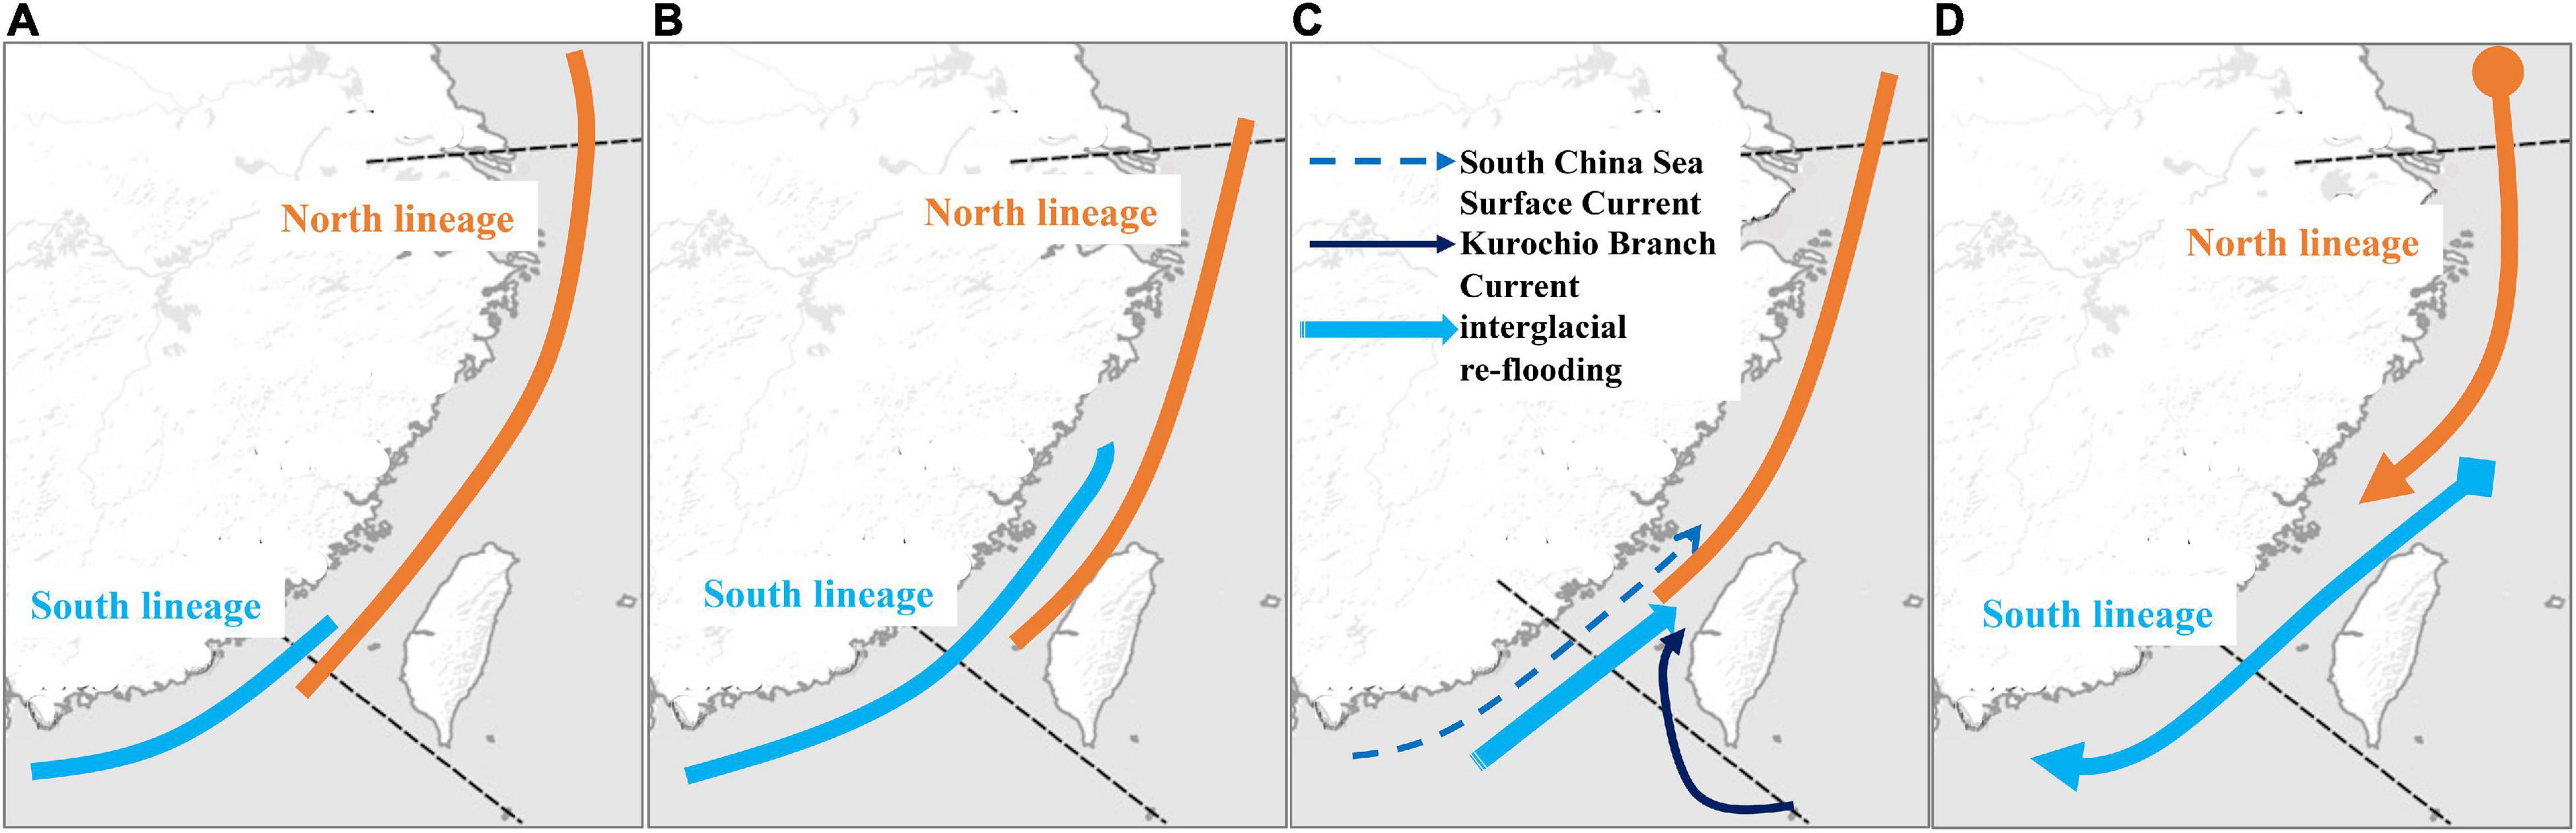
Figure 9. Two scenarios of the mtDNA phylogeographic patterns, (A) southward scenario and (B) northward scenario. (C) The colonization history of the northward scenario proposed by Qiu et al. (2016). (D) The colonization history of Tridentiger bifasciatus inferred in this study.
Qiu et al. (2016) proposed that two phylogeographic lineages of B. sinensis along China Seas were attributed to the Pleistocene glaciation exposure of the Taiwan Strait, and then the distributions of the two lineages overlapped in the ECS by northward ocean currents. Qiu et al. (2016) also suggested that besides the main northward currents, Kuroshio Branch Current and South China Sea Surface Current, the interglacial re-flooding can be attributed to the biased northward migration of south lineage (Figure 9C). However, the results of the pairwise FST, AMOVA, and SAMOVA based on the mtDNA datasets revealed high population differentiations in T. bifasciatus (Figure 2, Table 2, Supplementary Table 4). The numbers of the private mtDNA haplotypes in each population were higher (Table 1). Compared with the results of B. sinensis (Qiu et al., 2016), the distribution of shared haplotypes of T. bifasciatus was more restricted, and the estimates of migrations of T. bifasciatus were lower than those of B. sinensis. Moreover, T. bifasciatus is unable to tolerate marine salinities above 17 practical salinity units (Matern, 2001). Thus, our study considered that the migrations of female T. bifasciatus are rare, and the ocean current did not shape their migrations as B. sinensis. Furthermore, the main migrations of T. bifasciatus were southward (Figure 8), and the migration of B. sinensis was predominately northward (Qiu et al., 2016). Therefore, the phylogeographical history of T. bifasciatus was not the same as that of B. sinensis (Qiu et al., 2016; Figure 9C).
According to all the results based on the mtDNA dataset, our study suggests that T. bifasciatus diverged into two lineages in the north of the SCS (YS and ECS) because of the force of the selection. The Yangtze River outflows might be manifested as a phylogeographic break and shaped the differentiation of T. bifasciatus as other species (Dong et al., 2012; Ni et al., 2012, 2017). During the ice age, these two lineages migrated southward, and then sympatric in ECS (Figure 9D). Because of the environmental factors, temperature, and salinity, the north lineage was restricted to the north of the SCS, and the south lineage was restricted to the south of the northern ECS (Figure 9D).
Our study also detected some northward migrations based on the nuDNA dataset. Matern (1999) proposed that reproduction in this species generally occurs during spring and summer in oligohaline to fresh waters, and its natural dispersal is likely to occur during the planktonic larval stage, and adults are benthic. During spring and summer, the major ocean current along the China coastline is South China Sea Surface Current, and this current is northward. Thus, very few northward migrations were detected.
Demographic History
The neutrality tests and the mismatch distributions almost did not support population expansion (Table 3 and Figure 6A). The mismatch distributions and the results of the DIYABC analyses supported that the populations of T. bifasciatus met differentiations (Figures 6A, 7). Heller et al. (2013) proposed that the results of BSP analyses show false signals of population decline under biologically plausible combinations of population structure. However, our results displayed that the coalescent BSPs supported population decline based on all datasets (Figure 6B). Thus, our study might overestimate the diversity of T. bifasciatus. Our study inferred that during glaciations, the populations in YS and ECS migrated southward, and the north lineage was restricted to the north of the SCS because of the environmental factors (Figure 9D). However, the geological history revealed that during glaciations, YS and partial ECS became exposed. Accordingly, the distribution range of T. bifasciatus did not expand southward, and it shifted and contracted southward during glaciations. Compared with the sympatric distribution species, the genetic diversity of cyt b gene in T. bifasciatus was relatively low (π = 0.0007–0.0061; π = 0.0020–0.0220 in B. sinensis, see Qiu et al., 2016; π = 0.0008–0.0063 in S. argus, see Yan et al., 2020; and π = 0.0044–0.0080 in N. bathybius, see Yi et al., 2021). Arenas et al. (2012) proposed that range contractions and shifts tend to decrease genetic diversity, and the levels of diversity preserved depend on the dispersal abilities after climate changes. Our study suggested that the populations of T. bifasciatus met contractions and shifts and their dispersal ability was low, and therefore, the real genetic diversity of T. bifasciatus was very much lower than that estimated in this study.
Previous studies proposed that rapid urban expansion resulted in the loss of natural habitat and biodiversity in some areas in China (Liu, 2013; He et al., 2014). Thus, our study considered that the sampling sites with high variations of genetic diversity and sampling size is possibly related to the variations among sites with variations in human impact (Table 1). However, our study found that the populations in YS (populations DD, QH, TJ, YT, and QD) did not reveal significant differentiation (Figure 2), but the populations in ECS (populations SH, NB, TZ, DT, and FD) revealed a high significant differentiation (Figure 2). Our study found the Yellow Sea Warm Current assisted the gene flows among the populations in YS and the rapid urban expansion raised in the coastal cities along the ECS. Mona et al. (2014) proposed that long-distance dispersal can counteract the effects of fragmentation. These factors lead to different differentiation patterns in YS and ECS.
In summary, the lower diversity and high population differentiation of T. bifasciatus might have resulted from habitat fragmentation, which is caused by human activities. Thus, a conservation strategy for T. bifasciatus in coastal China is needed. Regarding the resource management of T. bifasciatus in China, two management units, north of population TZ and south of population DT, may be considered. For in situ conservation, the work may focus on ECS because only the populations in this sea, populations TZ and FD, included the specimens from two management units (lineages I and II). Moreover, Han et al. (2013) also found that the nutrient transport from the ECS is a major source supporting winter primary production in the north-eastern SCS shelf through the Taiwan Strait. This region has been recognized as the wintering ground of T. japonicus and Engraulis japonicus (e.g., Liu et al., 2020; Hsu et al., 2022).
Data Availability Statement
The datasets presented in this study can be found in online repositories. All nucleotide sequences were deposited in GenBank under accessions MT027615 – MT027814(Cyt b), MN610586 – MN610664 (control region), and MT002146–MT002265 (RyR3).
Ethics Statement
All animal experiments were carried out in accordance with the guidelines and approval of the Animal Research and Ethics Committee of School of Life Science, South China Normal University (permissions, CAMC-2018F).
Author Contributions
Y-HC, W-QT, DL, and J-QY participated in data collection and DNA sequencing. JZ, K-CH, and H-DL contributed to the conception and design the study. JW, K-CH, J-QY, and H-DL performed the statistical analysis and drafting of the manuscript. All authors read and approved the final manuscript.
Funding
The research was supported by the National Natural Science Foundation of China (No. 31872207), Shanghai Universities First-class Disciplines Project of Fisheries, and China-ASEAN Maritime Cooperation Fund (CAMC-2018F).
Conflict of Interest
The authors declare that the research was conducted in the absence of any commercial or financial relationships that could be construed as a potential conflict of interest.
Publisher’s Note
All claims expressed in this article are solely those of the authors and do not necessarily represent those of their affiliated organizations, or those of the publisher, the editors and the reviewers. Any product that may be evaluated in this article, or claim that may be made by its manufacturer, is not guaranteed or endorsed by the publisher.
Acknowledgments
We would like to thank Po-Hsun Kuo, Department of Industrial Management, National Taiwan University of Science and Technology, for helping with the data analysis.
Supplementary Material
The Supplementary Material for this article can be found online at: https://www.frontiersin.org/articles/10.3389/fevo.2022.935251/full#supplementary-material
Footnotes
References
Amparo, R. D., Branco, C., Areans, J., Vicens, A., and Arenas, M. (2021). Analysis of selection in protein-coding sequences accounting for common biases. Brief. Bioinform. 22:bbaa431. doi: 10.1093/bib/bbaa431
Arenas, M., Ray, N., Currat, M., and Excoffier, L. (2012). Consequences of range contractions and range shifts on molecular diversity. Mol. Biol. Evol. 29, 207–218. doi: 10.1093/molbev/msr187
Bandelt, H. J., Forster, P., and Rohl, A. (1999). Median-joining networks for inferring intraspecific phylogenies. Mol. Biol. Evol. 16, 37–48. doi: 10.1093/oxfordjournals.molbev.a026036
Beerli, P. (2016). MIGRATE-N 4.4.3. Available Online at: https://peterbeerli.com/migrate/tutorials.html (accessed April 9, 2016).
Bernt, M. J., Tagliacollo, V. A., and Albert, J. S. (2019). Molecular phylogeny of the ghost knifefishes (Gymnotiformes: Apteronotidae). Mol. Phylogenet. Evol. 135, 297–307. doi: 10.1016/j.ympev.2019.02.019
Brito, P. H. (2007). Contrasting patterns of mitochondrial and microsatellite genetic structure among Western European populations of tawny owls (Strix aluco). Mol. Ecol. 16, 3423–3437. doi: 10.1111/j.1365-294X.2007.03401.x
Burridge, C. P., Craw, D., Fletcher, D., and Waters, J. M. (2008). Geological dates and molecular rates: fish DNA sheds light on time dependency. Mol. Biol. Evol. 25, 624–633. doi: 10.1093/molbev/msm271
Cekovská, K., Sanda, R., Eliásová, K., Kovacic, M., Zogaris, S., Pappalardo, A. M., et al. (2020). Population genetic diversity of two marine gobies (Gobiiformes: Gobiidae) from the north-eastern Atlantic and the Mediterranean Sea. J. Mar. Sci. Eng. 8:792. doi: 10.3390/jmse8100792
Cornuet, J. M., Pudlo, P., Veyssier, J., Dehne-Garcia, A., Gautier, M., Leblois, R., et al. (2014). DIYABC v2.0: a software to make approximate Bayesian computation inferences about population history using single nucleotide polymorphism, DNA sequence and microsatellite data. Bioinformatics 30, 1187–1189. doi: 10.1093/bioinformatics/btt763
Crochet, P. A. (2000). Genetic structure of avian populations — allozymes revisited. Mol. Ecol. 9, 1463–1469. doi: 10.1046/j.1365-294x.2000.01026.x
Darriba, D., Taboada, G. L., Doallo, R., and Posada, D. (2012). jModelTest 2: more models, new heuristics and parallel computing. Nat. Methods 9:772. doi: 10.1038/nmeth.2109
Dong, Y. W., Wang, H. S., Han, G. D., Ke, C. H., Zhan, X., Nakano, T., et al. (2012). The impact of Yangtze River discharge, ocean currents and historical events on the biogeographic pattern of Cellana toreuma along the China Coast. PLoS One 7:e36178. doi: 10.1371/journal.pone.0036178
Dupanloup, I., Schneider, S., and Excoffier, L. (2002). A simulated annealing approach to define the genetic structure of populations. Mol. Ecol. 11, 2571–2581. doi: 10.1046/j.1365-294X.2002.01650.x
Excoffier, L., and Lischer, H. E. (2010). Arlequin suite ver 3.5: a new series of programs to perform population genetics analyses under Linux and Windows. Mol. Ecol. Resour. 10, 564–567. doi: 10.1111/j.1755-0998.2010.02847.x
Froese, R., and Pauly, D. (2021). FishBase. World Wide Web Electronic Publication. Available Online at: http://www.fishbase.org (accessed December 2021).
Fu, Y. X. (1997). Statistical tests of neutrality of mutations against population growth, hitchhiking and background selection. Genetics 147, 915–925. doi: 10.1093/genetics/147.2.915
Fu, Y. X., and Li, W. H. (1993). Statistical tests of neutrality of mutations. Genetics 133, 693–709.
Gurushidze, M., Fritsch, R. M., and Blattner, F. R. (2008). Phylogenetic analysis of Allium subg. Melanocrommyum infers cryptic species and demands a new sectional classification. Mol. Phylogenet. Evol. 49, 997–1007. doi: 10.1016/j.ympev.2008.09.003
Habib, A., and Sulaiman, Z. (2016). High genetic connectivity of narrow-barred Spanish mackerel (Scomberomorus commerson) from the South China, Bali and Java Seas. Zool. Ecol. 26, 93–99. doi: 10.1080/21658005.2016.1161121
Hall, T. A. (1999). BioEdit: a user-friendly biological sequence alignment editor and analysis program for Windows 95/98/NT. Nucleic Acids Symp. Ser. 41, 95–98.
Han, A. Q., Dai, M. H., Gan, J. P., Kao, S. J., Zhao, X. Z., Jan, S., et al. (2013). Inter-shelf nutrient transport from the East China Sea as a major nutrient source supporting winter primary production on the northeast South China Sea shelf. Biogeosciences 10, 8159–8170. 159–2013 doi: 10.5194/bg-10-8
Han, C. C., Hsu, K. C., Fang, L. S., Chang, I. M., and Lin, H. D. (2019). Geographical and temporal origins of Neocaridina species (Decapoda: Caridea: Atyidae) in Taiwan. BMC Genet. 20:86. doi: 10.1186/s12863-019-0788-y
He, C., Liu, Z., Tian, J., and Ma, Q. (2014). Urban expansion dynamics and natural habitat loss in China: a multiscale landscape perspective. Glob. Change Biol. 20, 2886–2902. doi: 10.1111/gcb.12553
He, L., Mukai, T., Chu, K. H., Ma, Q., and Zhang, J. (2015). Biogeographical role of the Kuroshio current in the amphibious mudskipper Periophthalmus modestus indicated by mitochondrial DNA data. Sci. Rep. 5:15645. doi: 10.1038/srep15645
Hedrick, P. W. (2006). Genetic polymorphism in heterogeneous environments: the age of genomics. Annu. Rev. Ecol. Evol. Syst. 37, 67–93. doi: 10.1146/annurev.ecolsys.37.091305.110132
Heller, R., Chikhi, L., and Siegismund, H. R. (2013). The confounding effect of population structure on Bayesian skyline plot inferences of demographic history. PLoS One 8:e62992. doi: 10.1371/journal.pone.0062992
Hollingsworth, P. R., and Darrin Hulsey, C. (2011). Reconciling gene trees of eastern North American minnows. Mol. Phylogenet. Evol. 61, 149–156. doi: 10.1016/j.ympev.2011.05.020
Hsu, K. C., Yi, M. R., Gu, S., He, X. B., Luo, Z. S., Kang, B., et al. (2022). Composition, demographic history, and population structures of Trichiurus. Front. Mar. Sci. 9:875042. doi: 10.3389/fmars.2022.875042
Kizaki, K., and Oshiro, I. (1980). “The origin of the Ryukyu Islands,” in Natural History of the Ryukyus, ed. K. Kizaki (Tokyo: Tsukiji-shokan), 8–37.
Kumar, S., Stecher, G., Li, M., Knyaz, C., and Tamura, K. (2018). MEGA X: molecular evolutionary genetics analysis across computing platforms. Mol. Biol. Evol. 35, 1547–1549. doi: 10.1093/molbev/msy096
Lee, Y., Ni, G., Shin, J., Kim, T., Kern, E. M. A., Kim, Y., et al. (2021). Phylogeography of Mytilisepta virgata (Mytilidae: Bivalvia) in the northwestern Pacific: cryptic mitochondrial lineages and mito-nuclear discordance. Mol. Phylogenet. Evol. 157:107037. doi: 10.1016/j.ympev.2020.107037
Li, C., Orti, G., Zhang, G., and Lu, G. (2007). A practical approach to phylogenomics: the phylogeny of ray-finned fish (Actinopterygii) as a case study. BMC Evol. Biol. 7:44. doi: 10.1186/1471-2148-7-44
Liu, J., Gao, T., Yokogawa, K., and Zhang, Y. (2006). Differential population structuring and demographic history of two closely related fish species, Japanese sea bass (Lateolabrax japonicus) and spotted sea bass (Lateolabrax maculatus) in Northwestern Pacific. Mol. Phylogenet. Evol. 39, 799–811. doi: 10.1016/j.ympev.2006.01.009
Liu, J. X., Gao, T. X., Wu, S. F., and Zhang, Y. P. (2007). Pleistocene isolation in the Northwestern Pacific marginal seas and limited dispersal in a marine fish, Chelon haematocheilus (Temminck & Schlegel, 1845). Mol. Ecol. 16, 275–288. doi: 10.1111/j.1365-294X.2006.03140.x
Liu, J. Y. (2013). Status of marine biodiversity of the China seas. PLoS One 8:e50719. doi: 10.1371/journal.pone.0050719
Liu, S., Liu, Y., Alabia, I. D., Tian, Y., Ye, Z., Yu, H., et al. (2020). Impact of climate Change on wintering ground of Japanese Anchovy (Engraulis japonicus) using marine geospatial statistics. Front. Mar. Sci. 7:604. doi: 10.3389/fmars.2020.00604
Matern, S. A. (1999). The Invasion of the Shimofuri Goby (Tridentiger bifasciatus) into California: Establishment, Potential for Spread, and Likely Effects. Ph.D thesis. Davis, CA: University of California.
Matern, S. A. (2001). Using temperature and salinity tolerances to predict the success of the Shimofuri goby, a recent invader into California. Trans. Am. Fish. Soc. 130, 592–599.
Mona, S., Ray, N., Arenas, M., and Excoffier, L. (2014). Genetic consequences of habitat fragmentation during a range expansion. Heredity 112, 291–299. doi: 10.1038/hdy.2013.105
Muto, N., Alama, U. B., Hata, H., Guzman, A. M. T., Cruz, R. G. A., Traifalgar, R. F. M., et al. (2016). Genetic and morphological differences among the three species of the genus Rastrelliger (Perciformes: Scombridae). Ichthyol. Res. 63, 275–287. doi: 10.1007/s10228-015-0498-z
Ni, G., Kern, E., Dong, Y., Li, Q., and Park, J. K. (2017). More than meets the eye: the barrier effect of the Yangtze River outflow. Mol. Ecol. 26, 4591–4602.
Ni, G., Li, Q., Kong, L., and Yu, H. (2014). Comparative phylogeography in marginal seas of the northwestern Pacific. Mol. Ecol. 23, 534–548. doi: 10.1111/mec.12620
Ni, G., Li, Q., Kong, L., and Zheng, X. (2012). Phylogeography of bivalve Cyclina sinensis: testing the historical glaciations and Changjiang River outflow hypotheses in northwestern Pacific. PLoS One 7:e49487.
Ota, H. (1994). Biogeographical Characteristics of Terrestrial Vertebrates of the Ryukyu Archioelago. In Search of Origins of Okinawan Culture. Naha: Bunshinlnsatsu, 460–464.
Pons, O., and Petit, R. J. (1996). Measuring and testing genetic differentiation with ordered versus unordered alleles. Genetics 144, 1237–1245. doi: 10.1093/genetics/144.3.1237
Qiu, F., Li, H., Lin, H., Ding, S., and Miyamoto, M. M. (2016). Phylogeography of the inshore fish, Bostrychus sinensis, along the Pacific coastline of China. Mol. Phylogenet. Evol. 96, 112–117. doi: 10.1016/j.ympev.2015.11.020
Qu, M., Tang, W., Liu, Q., Wang, D., and Ding, S. (2018). Genetic diversity within grouper species and a method for interspecific hybrid identification using DNA barcoding and RYR3 marker. Mol. Phylogenet. Evol. 121, 46–51. doi: 10.1016/j.ympev.2017.12.031
Rambaut, A., Drummond, A. J., Xie, D., Baele, G., and Suchard, M. A. (2018). Posterior summarization in Bayesian phylogenetics using Tracer 1.7. Syst. Biol. 67, 901–904. doi: 10.1093/sysbio/syy032
Ramos-Onsins, S. E., and Rozas, J. (2002). Statistical properties of new neutrality tests against population growth. Mol. Biol. Evol. 19, 2092–2100.
Rogers, A. R., and Harpending, H. (1992). Population growth makes waves in the distribution of pairwise genetic differences. Mol. Biol. Evol. 9, 552–569. doi: 10.1093/oxfordjournals.molbev.a040727
Rozas, J., Sanchez-DelBarrio, J. C., Messeguer, X., and Rozas, R. (2003). DnaSP, DNA polymorphism analyses by the coalescent and other methods. Bioinformatics 19, 2496–2497. doi: 10.1093/bioinformatics/btg359
Scott, G. R., Schulte, P. M., Egginton, S., Scott, A. L. M., Richards, J. G., and Milsom, W. K. (2011). Molecular evolution of cytochrome c oxidase underlies high-altitude adaptation in the bar-headed goose. Mol. Biol. Evol. 28, 351–363. doi: 10.1093/molbev/msq205
Shen, K. N., Jamandre, B. W., Hsu, C. C., Tzeng, W. N., and Durand, J. D. (2011). Plio-Pleistocene sea level and temperature fluctuations in the northwestern Pacific promoted speciation in the globally-distributed flathead mullet Mugil cephalus. BMC Evol. Biol. 11:83. doi: 10.1186/1471-2148-11-83
Suchard, M. A., Lemey, P., Baele, G., Ayres, D. L., Drummond, A. J., and Rambaut, A. (2018). Bayesian phylogenetic and phylodynamic data integration using BEAST 1.10. Virus Evol. 4:vey016. doi: 10.1093/ve/vey016
Tajima, F. (1989). Statistical method for testing the neutral mutation hypothesis by DNA polymorphism. Genetics 123, 585–595. doi: 10.1093/genetics/123.3.585
Tan, M. P., Amornsakun, T., Azizah, M. N. S., Habib, A., Sung, Y. Y., and Danish-Daniel, M. (2019). Hidden genetic diversity in snakeskin gourami, Trichopodus pectoralis (Perciformes, Osphronemidae), inferred from the mitochondrial DNA COI gene. Mitochondrial DNA B Resour. 4, 2966–2969. doi: 10.1080/23802359.2019.1662741
Thompson, J. D., Gibson, T. J., Plewniak, F., Jeanmougin, F., and Higgins, D. G. (1997). The CLUSTAL_X windows interface: flexible strategies for multiple sequence alignment aided by quality analysis tools. Nucleic Acids Res. 25, 4876–4882. doi: 10.1093/nar/25.24.4876
Voris, H. K. (2000). Maps of Pleistocene sea levels in Southeast Asia: shorelines, river systems and time durations. J. Biogeogr. 27, 1153–1167. doi: 10.1046/j.1365-2699.2000.00489.x
Wang, X., Kong, L., Chen, J., Matsukuma, A., and Li, Q. (2017). Phylogeography of bivalve Meretrix petechialis in the Northwestern Pacific indicated by mitochondrial and nuclear DNA data. PLoS One 12:e0183221. doi: 10.1371/journal.pone.0183221
Xu, J., Chan, T. Y., Tsang, L. M., and Chu, K. H. (2009). Phylogeography of the mitten crab Eriocheir sensu stricto in East Asia: pleistocene isolation, population expansion and secondary contact. Mol. Phylogenet. Evol. 52, 45–56. doi: 10.1016/j.ympev.2009.02.007
Yan, Y. R., Hsu, K. C., Yi, M. R., Li, B., Wang, W. K., Kang, B., et al. (2020). Cryptic diversity of the spotted scat Scatophagus argus (Perciformes: Scatophagidae) in the South China Sea: pre- or post-production isolation. Mar. Freshw. Res. 71, 1640–1650. doi: 10.1071/MF19337
Yang, J. Q., Hsu, K. C., Kuo, P. H., Li, L. L., Tang, W. Q., Liu, D., et al. (2018). Mitochondrial and nuclear genetic structure in Rhodeus ocellatus (Teleostei: Cyprinidae) with approximate Bayesian computation. Environ. Biol. Fishes 101, 829–841. doi: 10.1007/s10641-018-0741-3
Yang, J. Q., Hsu, K. C., Liu, Z. Z., Su, L. W., Kuo, P. H., Tang, W. Q., et al. (2016). The population history of Garra orientalis (Teleostei: Cyprinidae) using mitochondrial DNA and microsatellite data with approximate Bayesian computation. BMC Evol. Biol. 16:73. doi: 10.1186/s12862-016-0645-9
Yi, M. R., Hsu, K. C., Wang, J. X., Feng, B., Lin, H. D., and Yan, Y. R. (2021). Genetic structure and diversity of the Yellowbelly threadfin bream Nemipterus bathybius in the Northern South China Sea. Diversity 13:324. doi: 10.3390/d13070324
Yusoff, N. I. S. M., Jaafer, T. N. A. M., Vilasri, V., Nor, S. A. M., Seah, Y. G., Habib, A., et al. (2021). Genetic diversity, population structure and historical demography of the two-spined yellowtail stargazer (Uranoscopus cognatus). Sci. Rep. 11:13357. doi: 10.1038/s41598-021-92905-6
Zhao, D., Li, Q., Kong, L., and Yu, H. (2017). Cryptic diversity of marine gastropod Monodonta labio (Trochidae): did the early Pleistocene glacial isolation and sea surface temperature gradient jointly drive diversification of sister species and/or subspecies in the Northwestern Pacific? Mar. Ecol. 38:e12443. doi: 10.1111/maec.12443
Zhao, J., Hsu, K. C., Luo, J. Z., Wang, C. H., Chan, B. P., Li, J., et al. (2018). Genetic diversity and population history of Tanichthys albonubes (Teleostei: Cyprinidae): implications for conservation. Aquat. Conserv. Mar. Freshw. Ecosyst. 28, 422–434. doi: 10.1002/aqc.2840
Keywords: Tridentiger bifasciatus, euryhaline species, phylogeography, taiwan strait, selection
Citation: Wang J, Hsu K-C, Chen Y-H, Zhao J, Tang W-Q, Liu D, Yang J-Q and Lin H-D (2022) Phylogeography of Tridentiger bifasciatus (Gobiidae) in the Northwestern Pacific. Front. Ecol. Evol. 10:935251. doi: 10.3389/fevo.2022.935251
Received: 03 May 2022; Accepted: 31 May 2022;
Published: 30 June 2022.
Edited by:
Miguel Arenas, University of Vigo, SpainReviewed by:
Snaebjörn Pálsson, University of Iceland, IcelandCatarina Branco, University of Vigo, Spain
Ahasan Habib, University of Malaysia Terengganu, Malaysia
Takashi Yanagimoto, National Research Institute of Fisheries Science, Japan Fisheries Research and Education Agency, Japan
Copyright © 2022 Wang, Hsu, Chen, Zhao, Tang, Liu, Yang and Lin. This is an open-access article distributed under the terms of the Creative Commons Attribution License (CC BY). The use, distribution or reproduction in other forums is permitted, provided the original author(s) and the copyright owner(s) are credited and that the original publication in this journal is cited, in accordance with accepted academic practice. No use, distribution or reproduction is permitted which does not comply with these terms.
*Correspondence: Jin-Quan Yang, anF5YW5nQHNob3UuZWR1LmNu; Hung-Du Lin, dmFyaWNvcmhpbnVzQGhvdG1haWwuY29t