 Yuxin An
 Yuyu Wang
94% of researchers rate our articles as excellent or good
Learn more about the work of our research integrity team to safeguard the quality of each article we publish.
Find out more
ORIGINAL RESEARCH article
Front. Ecol. Evol. , 08 August 2022
Sec. Phylogenetics, Phylogenomics, and Systematics
Volume 10 - 2022 | https://doi.org/10.3389/fevo.2022.932601
This article is part of the Research Topic Biology, Systematics, Taxonomy and Evolution of Insect Vectors - Volume II View all 8 articles
The family Simuliidae belongs to Diptera whose systematic position is still strongly debated. A few mitochondrial genomes (mitogenomes) of Simuliidae and none of the subgenus Montisimulium in the genus Simulium have previously been available. Therefore, the mitogenome of Simulium jisigouense Chen, Zhang and Liu, 2008 was sequenced to better understand the diversity of mitogenomes within this family. The complete mitogenome of S. jisigouense was 16,384 bp long. It contained 37 genes including 22 tRNAs, 13 protein-coding genes (PCGs), and 2 rRNAs, and an A + T-rich region, which was the same as the arrangement of mitogenomes of ancestral insects. Almost all PCGs used the typical ATN as start codons, except COI used TTG. Almost all tRNAs could be folded into cloverleaf structures except the dihydrouridine (DHU) arm of tRNASer (AGN), which formed a loop. The phylogenetic analysis revealed that Simuliidae was monophyletic and was the sister group to Thaumaleidae. Subgenus Simulium was recovered as paraphyletic and needs more comprehensive sampling in future studies. Divergence time estimation showed that Simuliidae diverged from Thaumaleidae at 239.24 Ma and the subgenera of Simulium diverged from each other from 162.46 to 75.08 Ma.
Simuliids (Diptera), also called black flies, are blood-sucking insects distributed throughout the world that can transmit the agents of many diseases (Chen and An, 2003). The female adults of Simuliidae are vectors of blood-borne diseases of humans and livestock, such as river blindness and bovine onchocerciasis (Cai, 2005; Huang et al., 2009). In addition, larvae of Simuliidae inhabit flowing water and play an important role in material metabolism and energy transformation as one of the most important families in river ecosystems (Garms and Walsh, 1987; Hall et al., 2001; Yan and Li, 2006). They are also important indicator organisms that can be used for water quality and environmental monitoring (Garms and Walsh, 1987; Hall et al., 2001; Yan and Li, 2006).
Miller et al. (1997) recovered Simuliidae as the sister group to Dixidae based on the 18S rDNA and 5.8S rDNA genes. Beckenbach and Borkent (2003) demonstrated that Simuliidae is the sister group to the branch including Ceratopogonidae and Chironomidae based on the COII gene. Pawlowski et al. (1996) based on 28S rRNA and Bertone et al. (2008) based on 28S rDNA, CAD, TPI, and PGD concluded that Simuliidae is the sister group to Thaumaleidae. Day et al. (2016) reconstructed the phylogeny of “Nematocera” using mitochondrial genomes (mitogenomes) and demonstrated that Simuliidae is the sister group to Dixidae. However, Kang (2017) showed that Simuliidae is the sister group to Thaumaleidae, and together they are the sister group to the rest of the Culicomorpha based on the mitogenomes. Wang and Huang (2019) analyzed the complete mitogenomes of Simulium maculatum and showed that Simuliidae is the sister group to Dixidae + Culicidae. Phayuhasena et al. (2010) demonstrated that subgenus Simulium is monophyletic, whereas subgenus Nevermannia is paraphyletic and together with subgenus Montisimulium being the sister group to subgenus Simulium based on COI, ND4, 16S rRNA, and 18S rRNA. The phylogenetic position of Simuliidae in Diptera and the internal phylogenetic relationships of Simuliidae are not fully resolved and further research is needed.
Mitogenomes have been extensively used in taxonomy, evolution, phylogeny, population genetics, and comparative genomics (Cameron, 2014). Research on the mitogenomes of Simuliidae, however, is relatively scarce. There are 2,401 species of Simuliidae known in the world and 347 species in China (Adler, 2021). However, 10 mitogenomes of Simuliidae are available in GenBank, 3 of which are complete. No mitogenome of the subgenus Montisimulium is available up to now. Therefore, we sequenced and annotated the complete mitogenome of S. jisigouense Chen, Zhang and Liu, 2008 as the first representative of Montisimulium (GenBank accession number: OM898924). The phylogenetic position of Simuliidae in Culicoidea and the internal phylogenetic relationships of Simuliidae were reconstructed and the divergence time within Culicoidea was estimated.
The specimen used for DNA extraction was collected on 2016-VII-14 by Liang Wang in Lushui City, Yunnan Province, China (99°34′E, 25°33′N). The voucher specimen was preserved for storage in absolute ethanol at −20°C at Hebei Agricultural University (HEBAU), Baoding, China, with the identification number Sim06-001. Genomic DNA was extracted using the DNeasy Blood and Tissue kit from the thoracic muscle (QIAGEN, Germany). Electrophoresis was used to assess the quality of PCR products in a 1% agarose gel and Gold View was used as the dye.
The Illumina HiSeq 2500 Platform was used for whole-genome sequencing. Raw reads (about 4 Gb) were checked by FastQC 0.11.9 (Andrews, 2020). Trimmomatic 0.32 was used to filter the low-quality reads (Bolger et al., 2014). The COI gene was amplified by PCR, using universal primers, and detected by the blast with relevant species in the National Center for Biotechnology Information (NCBI) to exclude the amplification of any pseudogene (nuclear copy). The PCR cycling conditions included a pre-denaturation at 94°C for 30 s and 40 cycles of denaturation at 95°C for 10 s, annealing at 55°C for 50 s, and elongation at 65°C for 10 min at the end of all cycles. The IDBA-UD 1.1.3 was used to assemble the mitogenome (Peng et al., 2012). Secondary structures of tRNAs were predicted by the MITOS Web Server and then checked by manual proofreading (Bernt et al., 2013). MEGA 7.0 was used to analyze the base composition and codon usages (Kumar et al., 2016). The calculation formulas of composition skew values were AT-skew = (A − T) / (A + T) and GC-skew = (G − C) / (G + C) (Perna and Kocher, 1995).
Clustal_X was used to conduct the amino acid alignment of protein-coding genes (PCGs) (Thompson et al., 1997). All sequences were aligned by MEGA 7.0, excluding the stop codons (Kumar et al., 2016). Four datasets of PCGs were used in the heterogeneous sequence divergence test, each representing different types of data, which included or excluded specific sites. The PCG12 matrix includes 13 PCGs with only the first and second codon positions. The PCG12r matrix includes 13 PCGs with only the first and second codon positions plus two rRNAs. The PCG123 matrix includes 13 PCGs with three codon positions. The PCG123r matrix includes 13 PCGs with three codon positions plus two rRNAs. AliGROOVE was used to analyze the heterogeneity of sequence divergence within the datasets under the default parameters (Kück et al., 2014).
In total, twenty-two mitogenomes of Diptera, including that of the newly sequenced species, were used for phylogenetic analyses (Table 1). Limonia phragmitidis (Tipuloidea) and Paracladura trichoptera (Tipuloidea) were used as outgroups. The ingroups included eight families of Culicoidea (Ceratopogonidae, Chaoboridae, Chironomidae, Corethrellidae, Culicidae, Dixidae, Simuliidae, and Thaumaleidae) (Table 1).
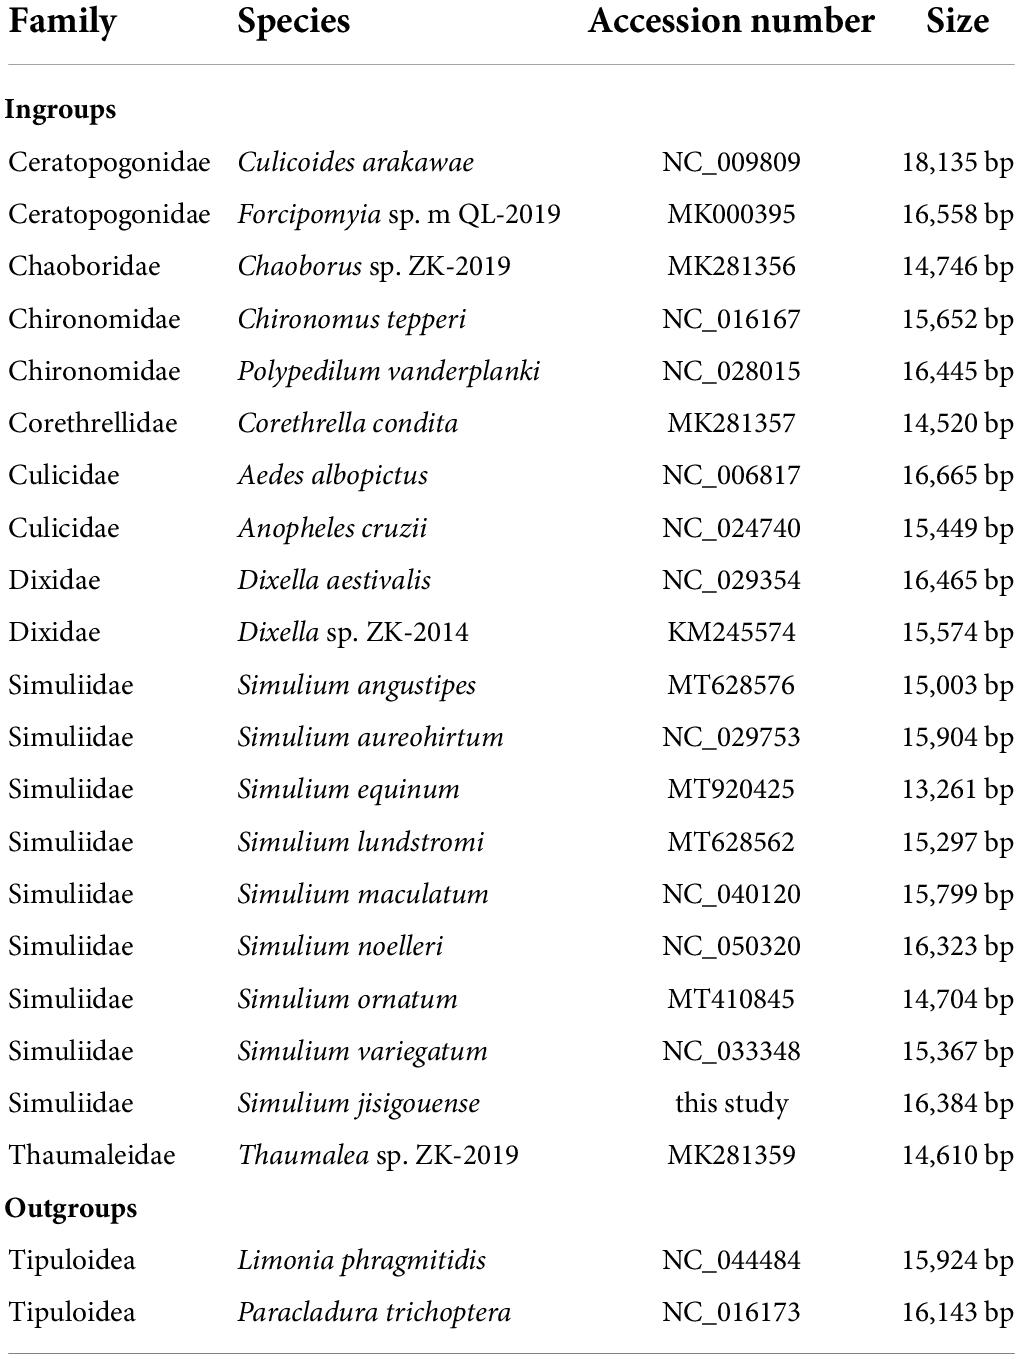
Table 1. Taxonomic groups are used for the phylogenetic analyses of Simuliidae.
PCG12, PCG12r, PCG123, and PCG123r were used in phylogenetic analyses. The phylogenetic trees were reconstructed using different datasets under homogeneous as well as heterogeneous models. The homogeneous trees were reconstructed with Bayesian Inference (BI) using MrBayes (Ronquist and Huelsenbeck, 2003) as well as Maximum Likelihood (ML) using Randomized Axelerated Maximum Likelihood (RAxML) (Liu et al., 2011; Alexandros, 2014) on CIPRES.1 In BI analysis, 2 runs of 2,000,000 generations were conducted until the average standard deviation (SD) of split frequencies was below 0.01. The analysis was sampled every 200 generations with a burn-in of 25%. An ML analysis was calculated with branch support, which estimated 500 bootstrap replicates. A heterogeneous tree was reconstructed using PhyloBayes (Lartillot et al., 2009) based on PCG123r. Four chains were run at the same time, and analyses were terminated when the maxdiff was smaller than 0.1. Finally, the phylogenetic tree was visualized by FigTree (2021).
The divergence time was estimated using MCMCtree in BEAST v.2.5.0 (Drummond et al., 2012). In this study, the heterogeneous tree based on PCG123r was used to estimate divergence time. Two calibration points based on Chironomidae (Aenne triassica) at 210.00–267.00 Ma (Krzeminski and Jarzembowski, 1999) and Culicidae (Anopheles genus) at 83.23–210.00 Ma (Martinez-Villegas et al., 2019) were used. Under the uncorrelated lognormal relaxed clock, 200,000 generations were generated. The analysis was terminated when the ESS value exceeded 200. The first 25% was removed as burn-in. Finally, FigTree was used to visualize the tree.2
The complete mitogenome of S. jisigouense was 16,384 bp long and contained 37 genes (22 tRNAs, 13 PCGs, and 2 rRNA genes) and an A + T-rich region, which is typical in metazoan mitogenomes (Wolstenholme, 1992; Figure 1). There were 23 genes on the main stand (J stand) and 14 genes on the minority stand (N stand). In addition to the A + T-rich region, there were 4 overlapping regions ranging from 1 to 8 bp and 24 intergenic regions ranging from 1 to 44 bp (Supplementary Table 1). Among them, three overlapping regions (AAGCCTTA in tRNATrp and tRNACys, ATGATAA in ATP8 and ATP6, and TTAACAT in ND4 and ND4L) of the S. jisigouense mitogenome were conserved, which was consistent with other Diptera (Li et al., 2015b; Zhang et al., 2016).
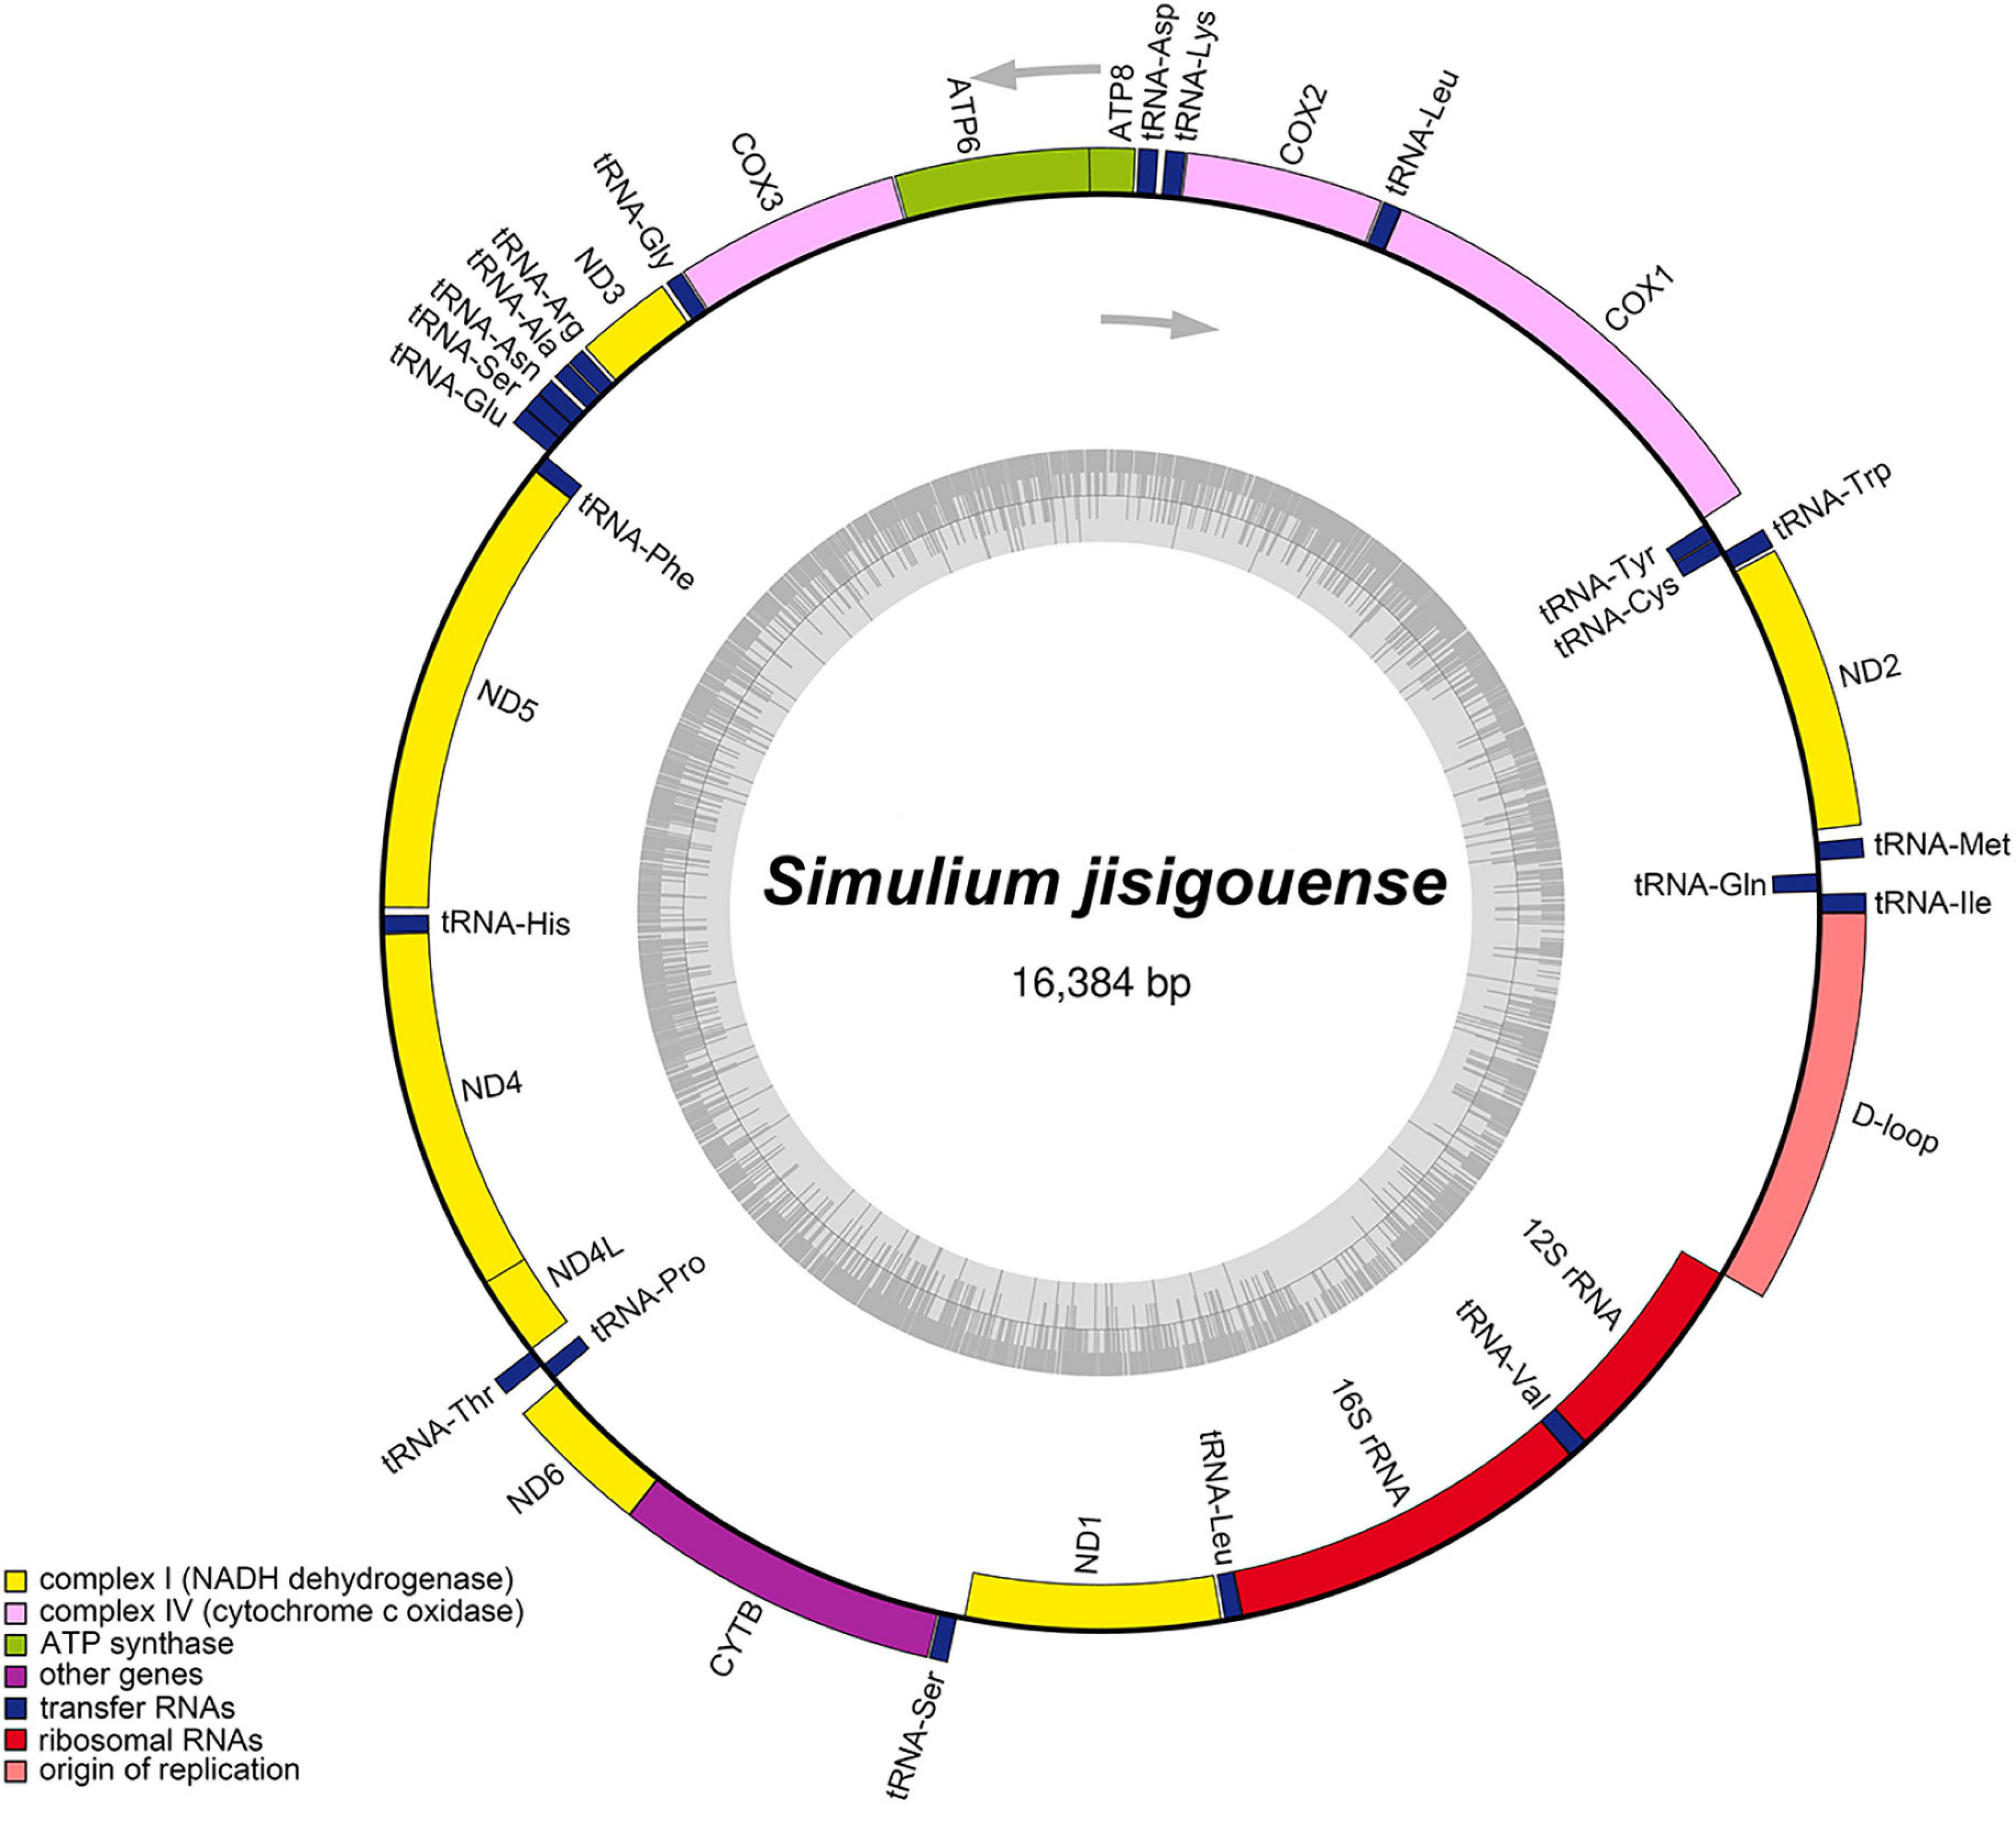
Figure 1. Mitochondrial maps of Simulium jisigouense. The tRNAs, rRNAs, and protein-coding genes (PCGs) are denoted by the color blocks. Genes outside the map are transcribed clockwise, whereas those inside are transcribed counter-clockwise.
The base composition of the mitogenome of S. jisigouense was 38.01% of A, 35.14% of T, 15.84% of C, and 11.01% of G, with a significant bias toward A and T (Supplementary Table 2). The AT-skew of the tRNAs, PCGs, rRNAs, and the A + T-rich region were 0.00, −0.18, 0.09, and 0.09, respectively, whereas the GC-skews were −0.09, 0.00, −0.27, and −0.29, respectively (Supplementary Table 2).
The base composition of the mitogenomes of Simuliidae was analyzed using PCGs since most of the published mitogenomes of Simuliidae are incomplete. In Simuliidae, the nucleotide composition of S. ornatum of subgenus Odagmia was different from the others, with T more than A and G more than C (Supplementary Table 3). A comparative analysis of A + T% vs. AT-skew and G + C% vs. GC-skew of PCGs across Simuliidae was constructed (Figure 2). The results indicated that subgenus Montisimulium exhibited the weakest AT-skew, subgenus Wilhelmia exhibited the weakest GC-skew, and subgenus Nevermannia exhibited the strongest GC-skew.
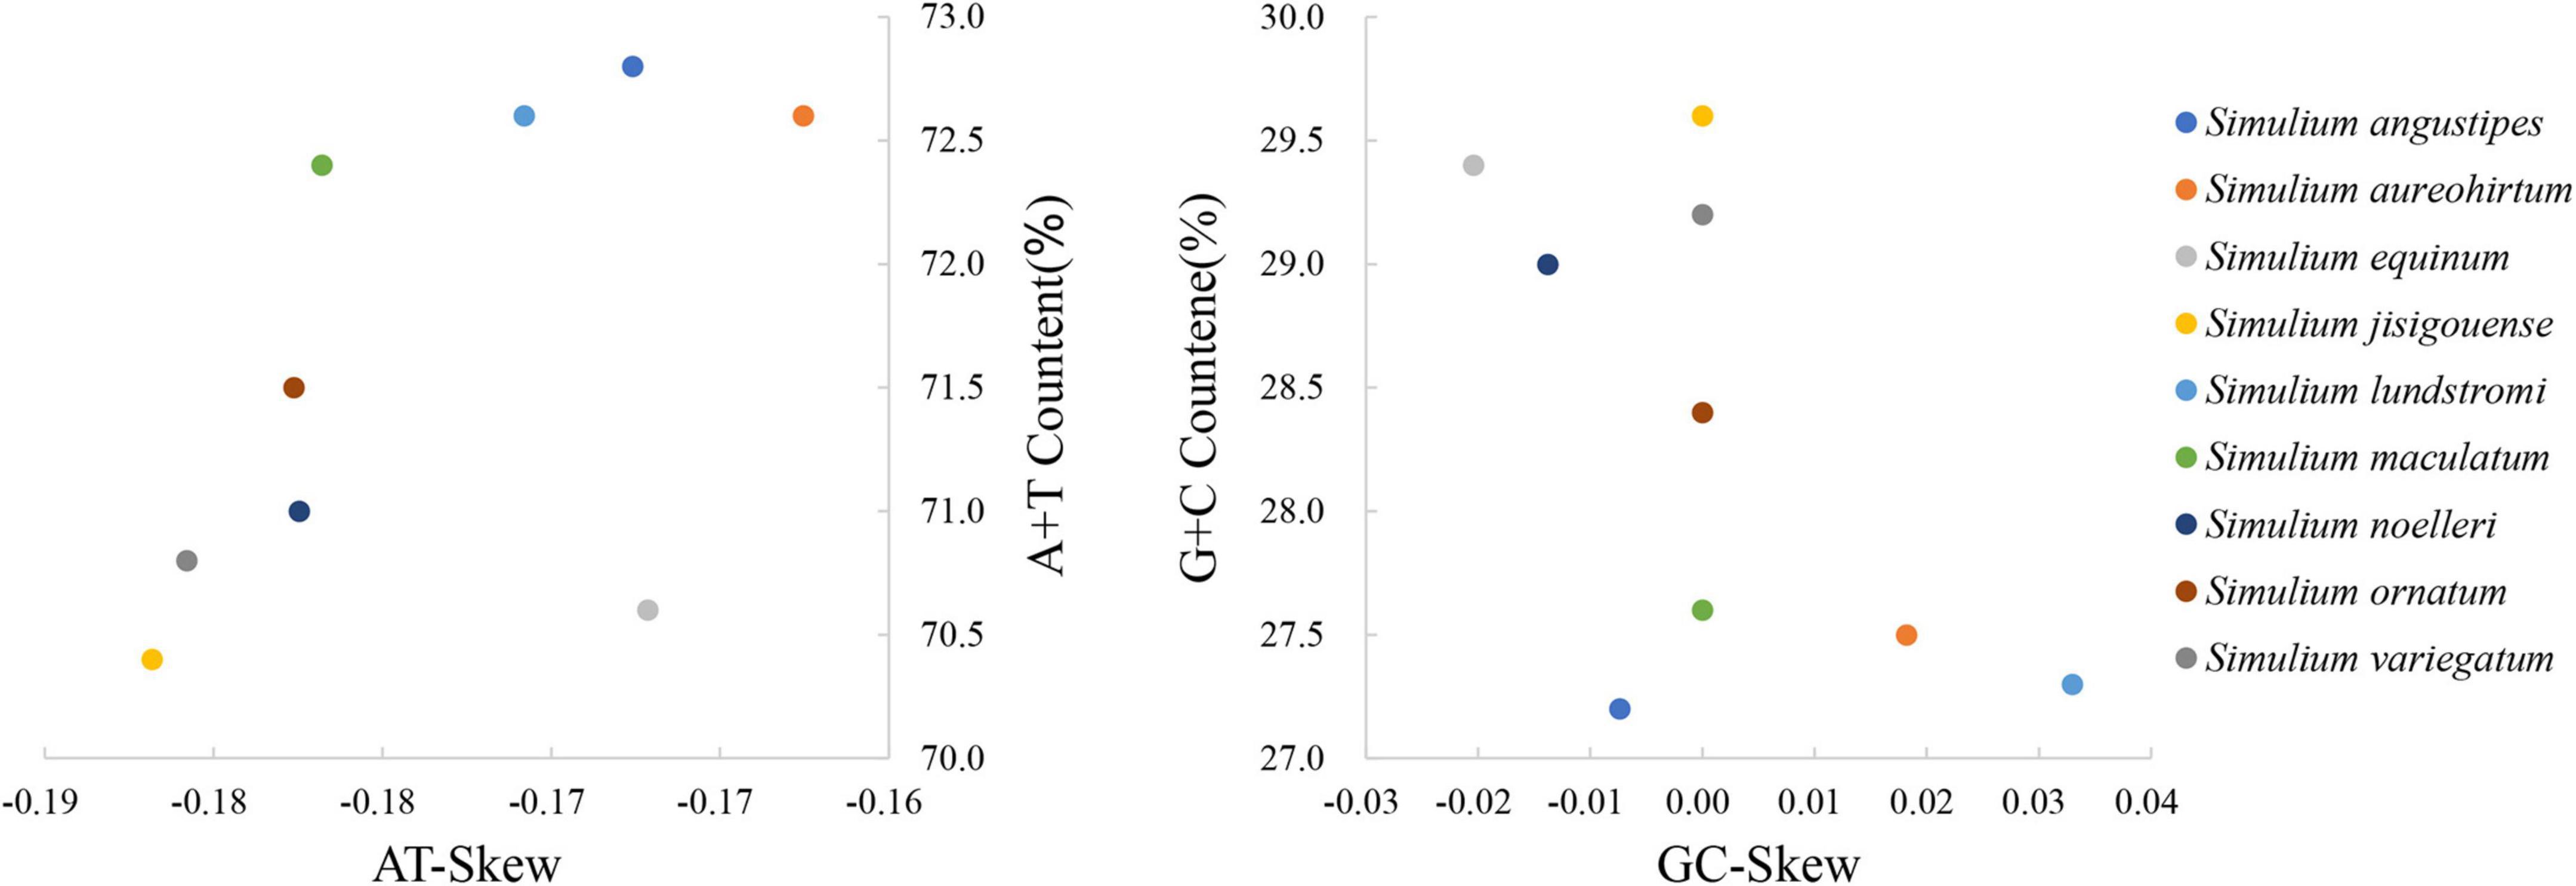
Figure 2. AT% vs. AT-Skew and GC% vs. GC-Skew in Simuliidae mitogenomes of PCGs.
The base composition of PCGs of S. jisigouense was 28.76% for A, 41.65% for T, 14.84% for C, and 14.75% for G (Supplementary Table 2). Almost all PCGs used the typical ATN as start codons except COI used TTG. In total, 11 PCGs used TAA as the termination codon, whereas ND1 used TAG and COI used T-tRNA (Supplementary Table 3). In Simuliidae, almost all species used ATN as the start codon for all PCGs, except COI of all species used TTG and ND2 of S. ornatum (subgenus Odagmia) used TAT. Almost all species used TAA/TAG for the stop codon, except ND1 of S. noelleri (subgenus Simulium) used T-tRNA, and COI of most species used T-tRNA except S. angustipes (subgenus Eusimulium), S. equinum (subgenus Wilhelmia), and S. lundstromi (subgenus Nevermannia) used TAA (Supplementary Table 4).
The relative synonymous codon usage (RSCU) of PCGs, PCGs on the J-strand, and PCGs on the N-strand of S. jisigouense was calculated (Figure 3). A total of 3,705 codons, 2,274 codons, and 1,431 codons of PCGs, PCGs on the J-strand, and PCGs on the N-strand, respectively, excluding stop codons, were used. The most frequently used codon of PCGs was UUA, which showed a bias in the nucleotide composition for A/T. The least frequently used codon in PCGs was AGG (Supplementary Tables 5–7).
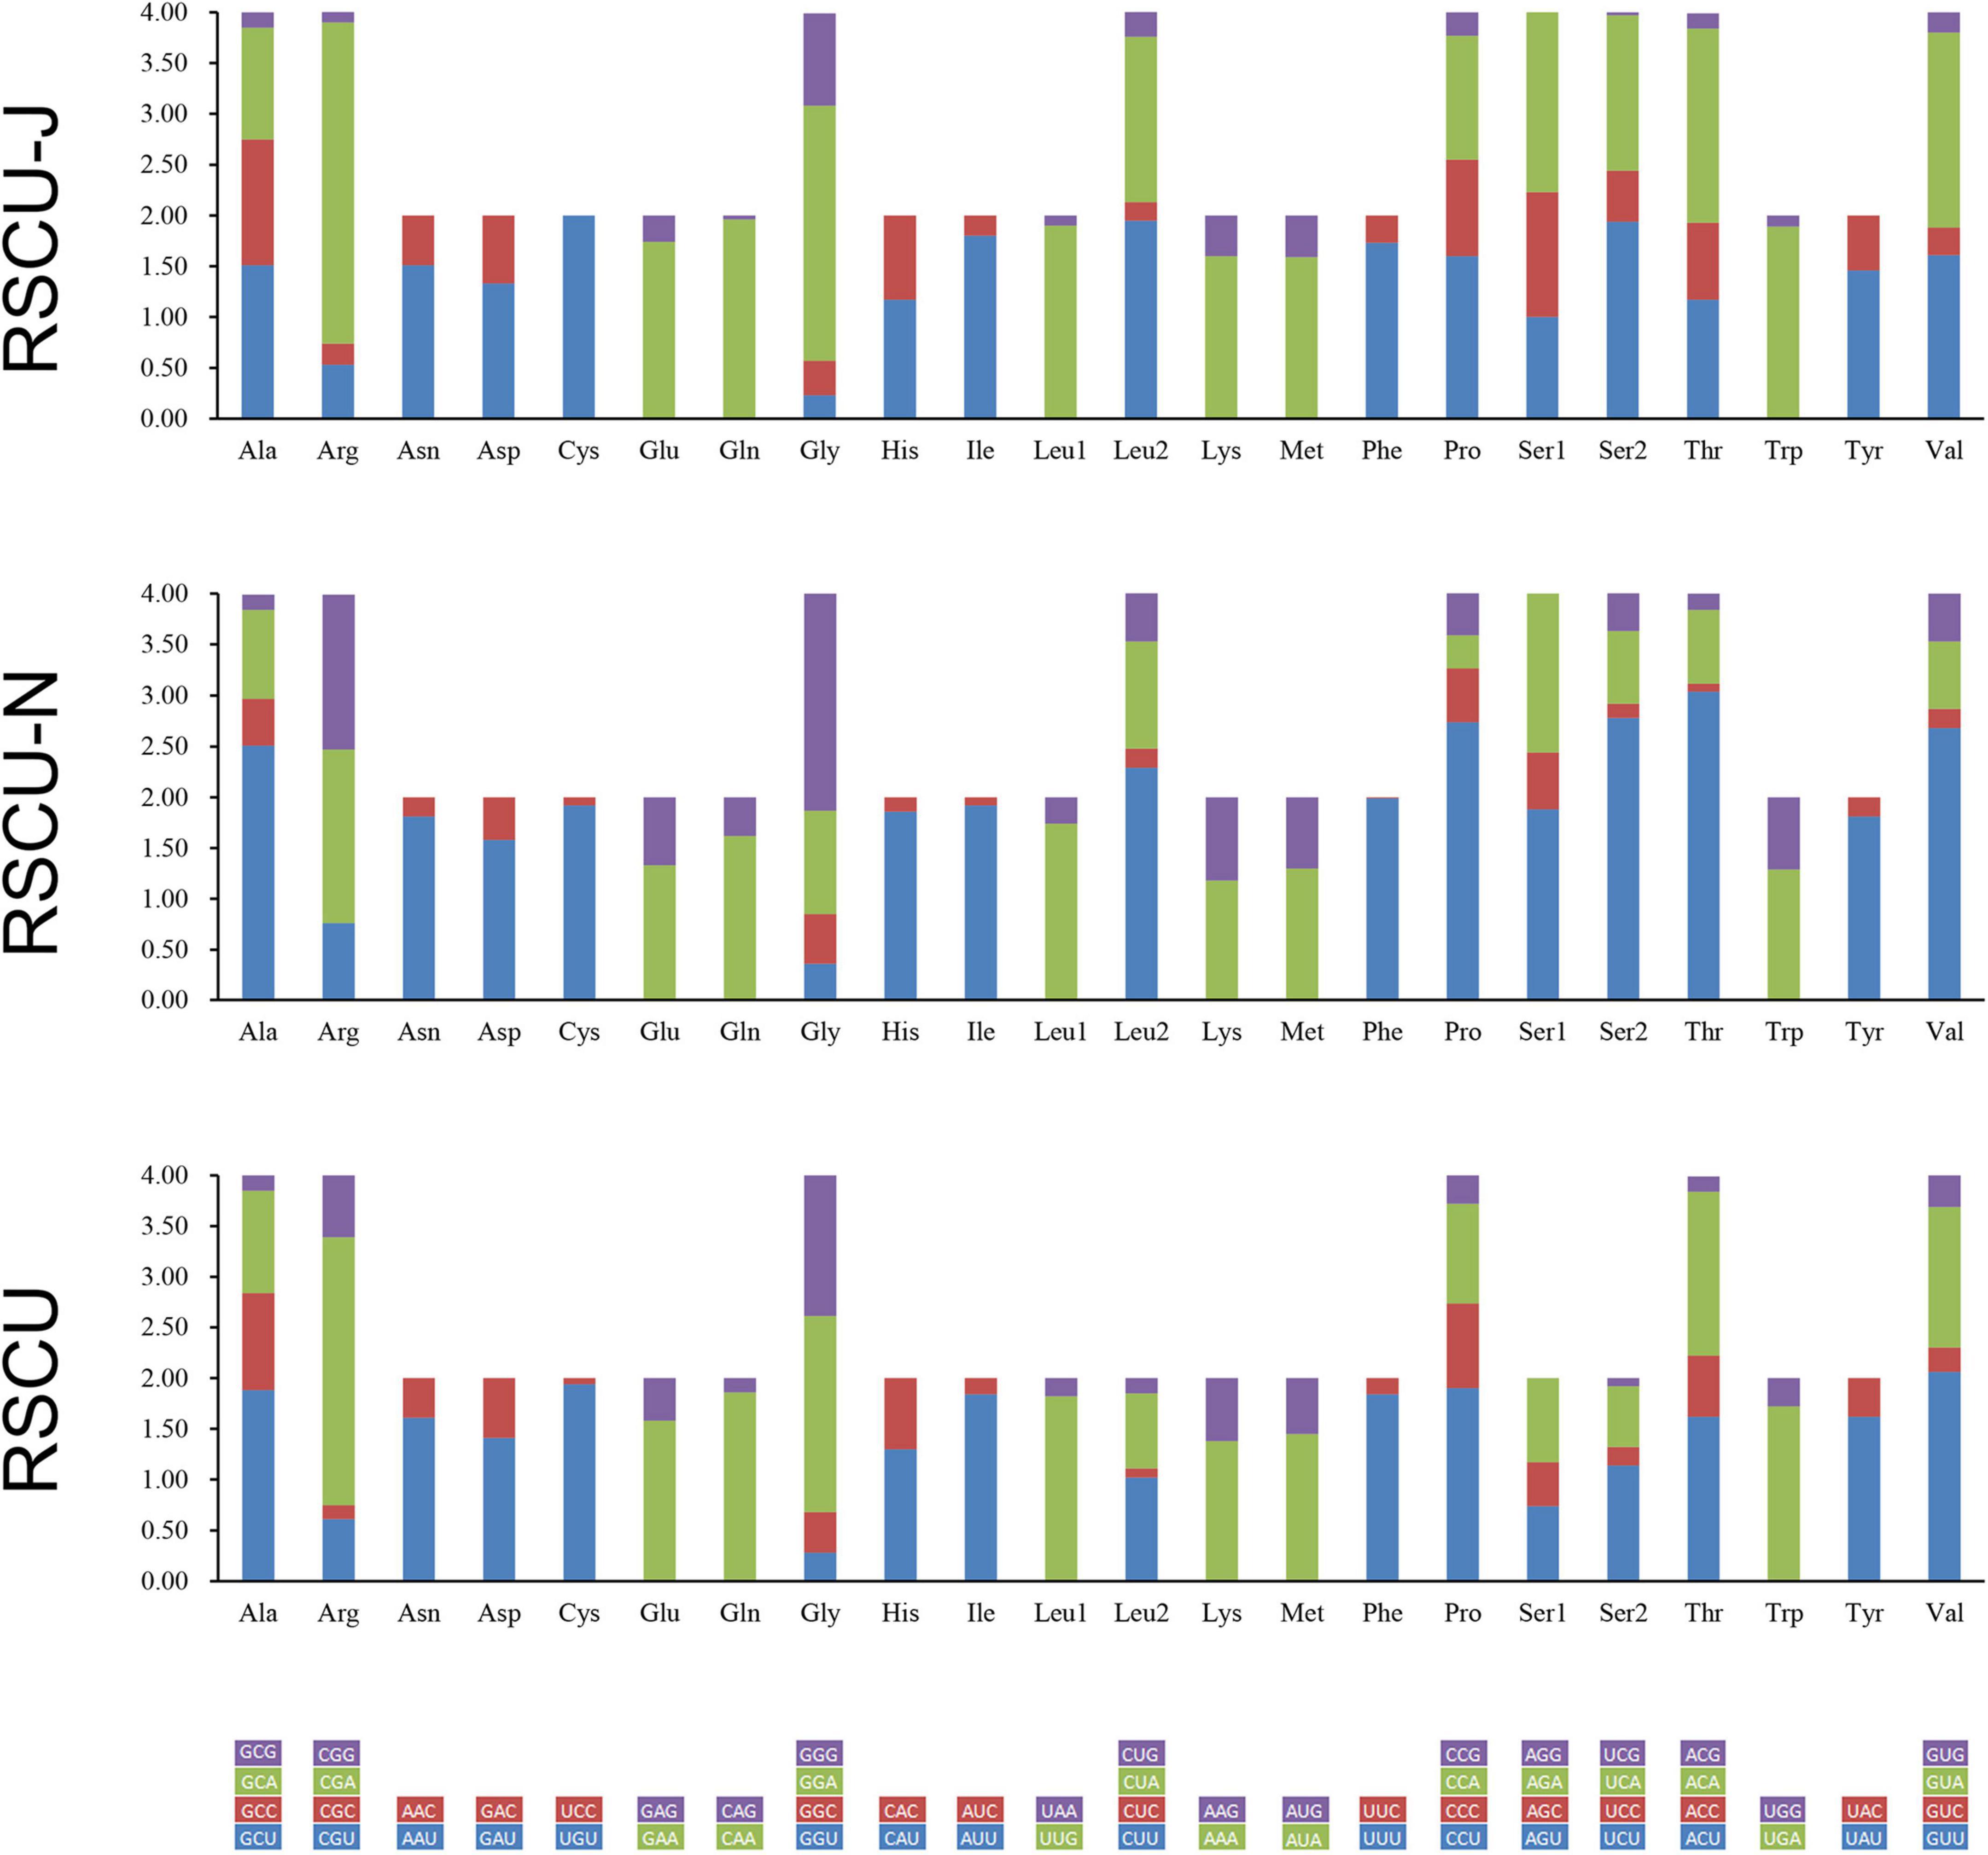
Figure 3. Relative synonymous codon usage (RSCU) of S. jisigouense.
The length of 22 tRNAs ranged from 64 to 72 bp and the secondary structures were predicted (Figure 4). There were 14 tRNAs located on the J-strand and the remaining tRNAs were located on the N-strand. Almost all tRNAs could be folded into cloverleaf structures, except the dihydrouridine (DHU) arm of tRNASer (AGN), which formed a loop. The amino acid acceptor (AA) arms of all tRNAs were 7 bp. The size of the TΨC (T) arms ranged from 3 to 5 bp. The length of DHU arms ranged from 3 to 4 bp except for tRNASer (AGN). The AC arms ranged from 4 to 5 bp. There were 28 pairs of G-U located on 4 arms, 4 pairs of U-U located on the AA arm and T arm, and 1 pair of A-C located on the AC arm.
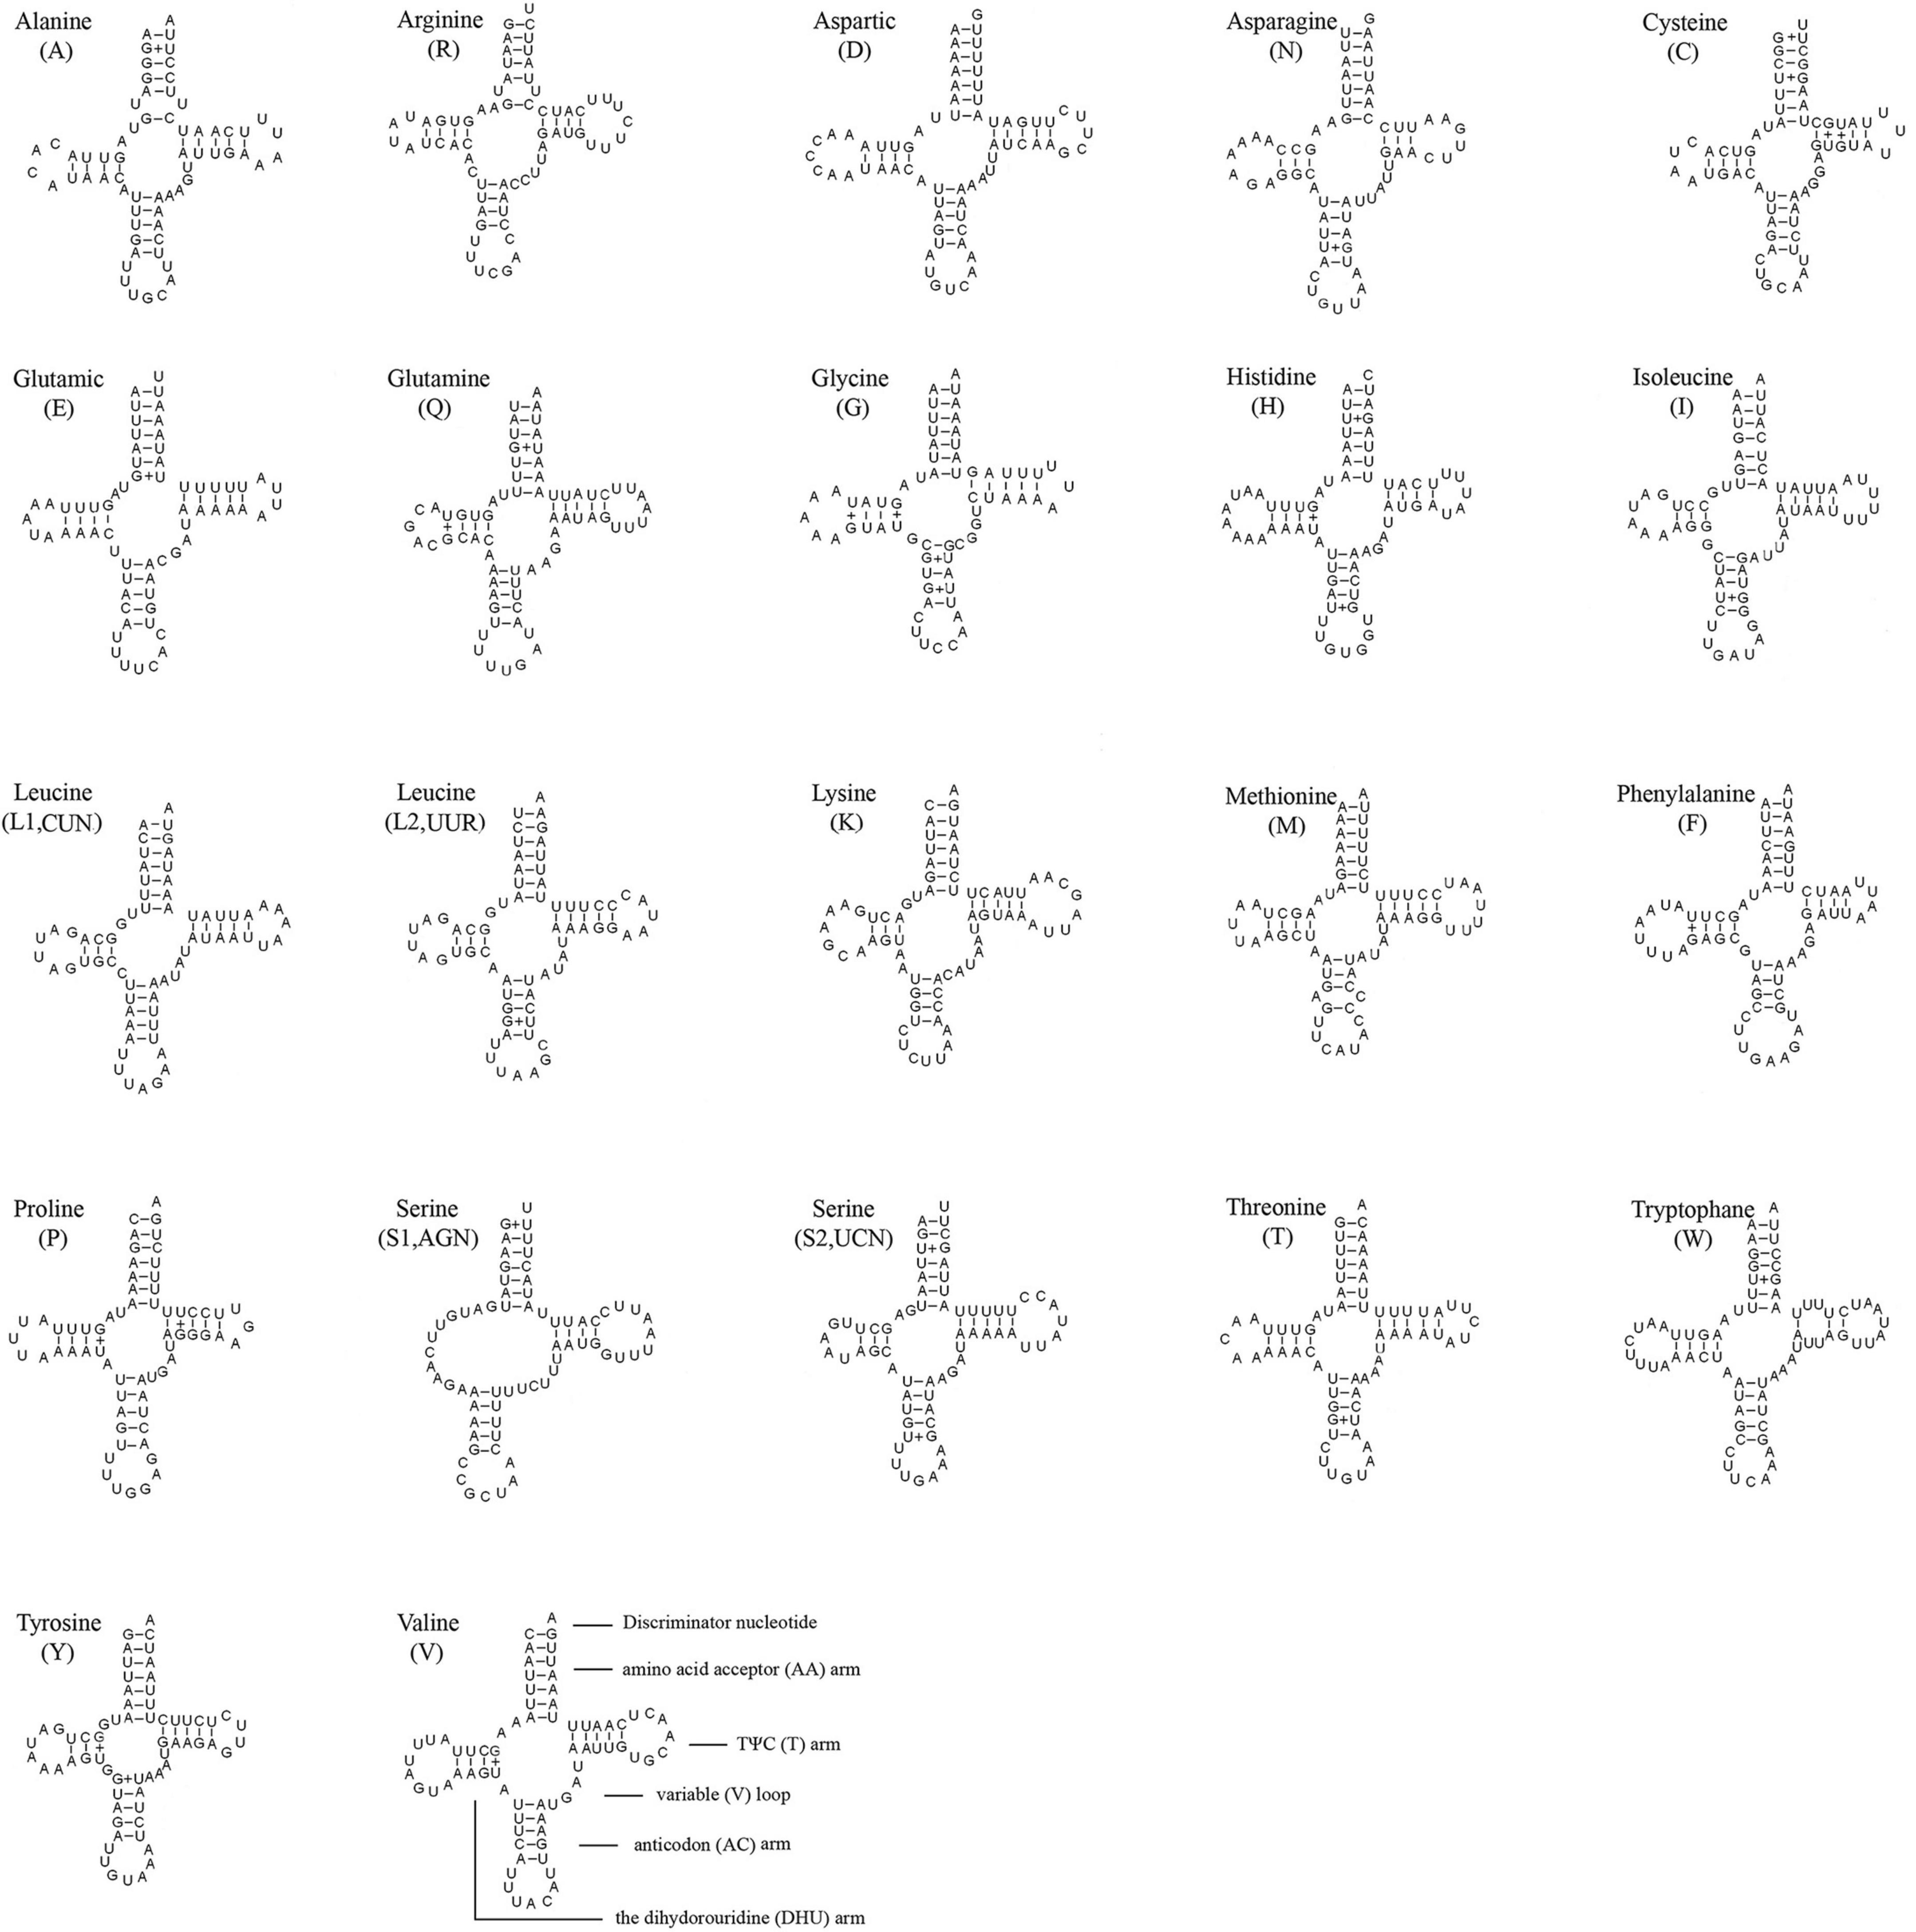
Figure 4. Inferred secondary structure of 22 tRNAs of S. jisigouense. The tRNAs are labeled with the abbreviations of their corresponding amino acids. Inferred Watson-Crick bonds are illustrated by “–,” whereas GU bonds are illustrated by “+.”
The lrRNA was located between tRNALeu (CUN) and tRNAVal with a length of 1,343 bp. The base composition of lrRNA was 44.23% for A, 36.26% for T, 12.58% for C, and 6.92% for G. The srRNA was located between tRNAVal and the A + T-rich region with a length of 789 bp. The base composition of srRNA was 41.06% for A, 35.74% for T, 14.32% for C, and 8.87% for G. The AT-skew and GC-skew of rRNAs were 0.09 and −0.27, respectively (Supplementary Table 2).
The A + T-rich region was 1,375 bp long and located between srRNA and tRNAIle. The AT-skew and GC-skew were 0.09 and −0.29, respectively (Supplementary Table 2). The secondary structure was predicted with 231 bp repeated sequences and some microsatellite-like “(TA)s” sequences (Figure 5).
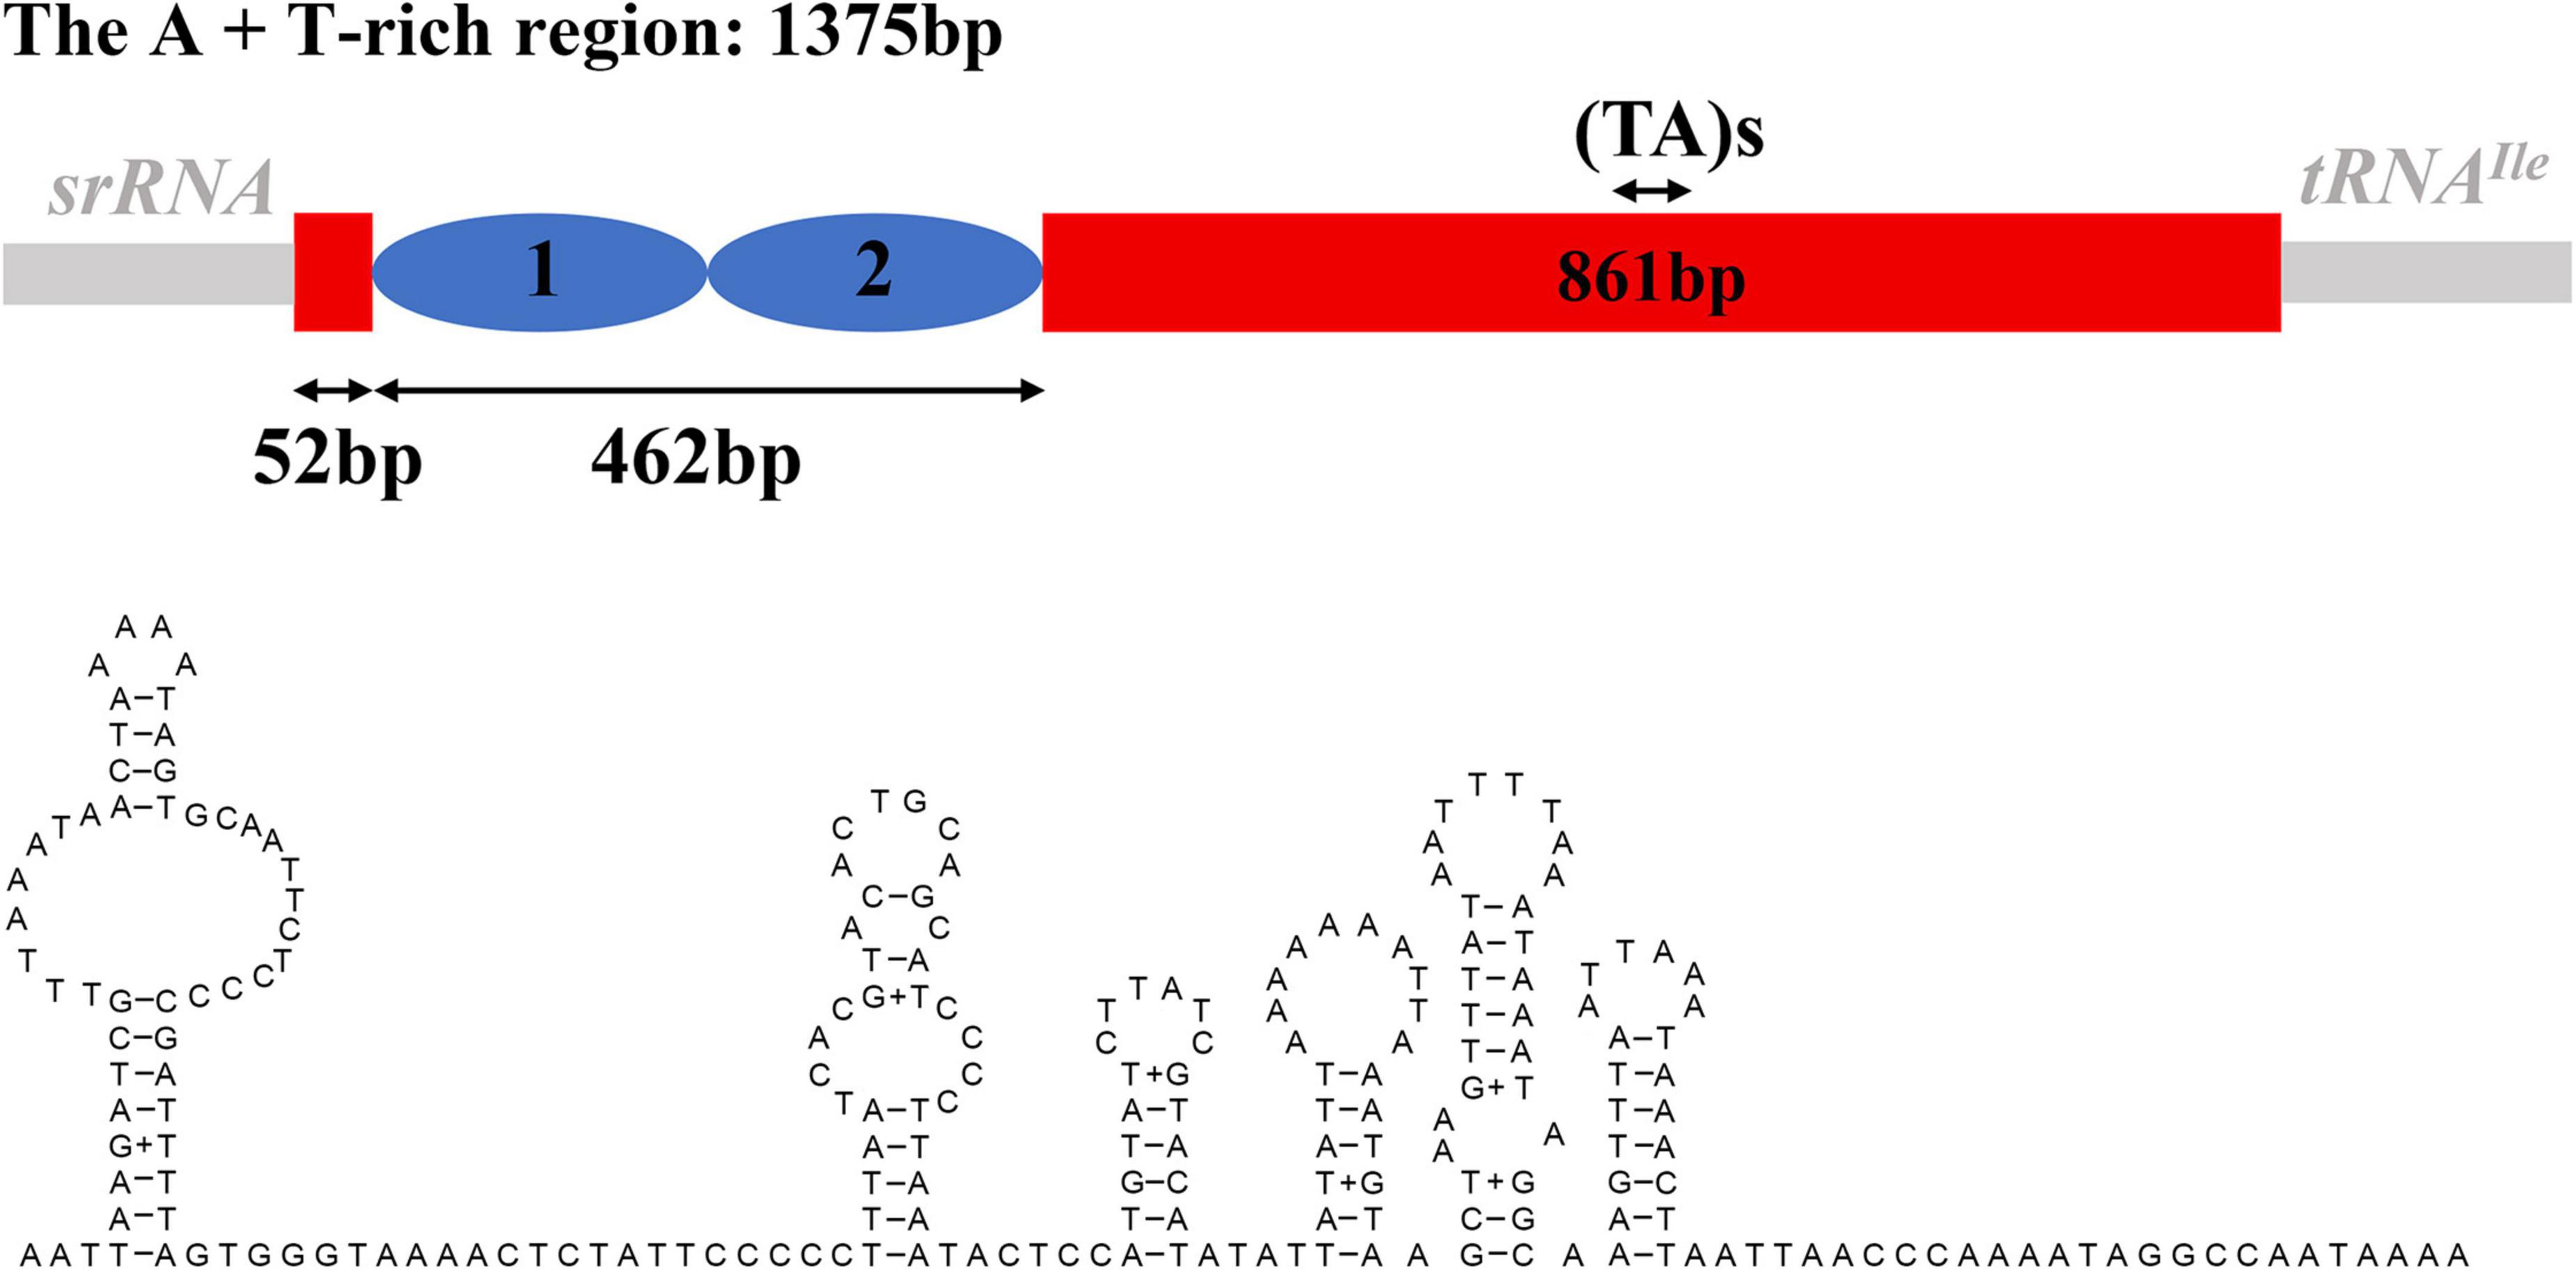
Figure 5. The structure of the A + T-rich region and possible secondary structures within the specific position of S. jisigouense.
The AliGROOVE analyses showed strong heterogeneity in pair-wise sequence comparisons of most species, especially within Simuliidae (Figure 6). The pairwise sequence comparison scores of all four datasets of Simuliidae were higher, except S. equinum (subgenus Wilhelmia) and S. ornatum (subgenus Odagmia) vs. Culicoides arakawae (Ceratopogonidae) as well as the former two vs. Polypedilum vanderplanki (Chironomidae).
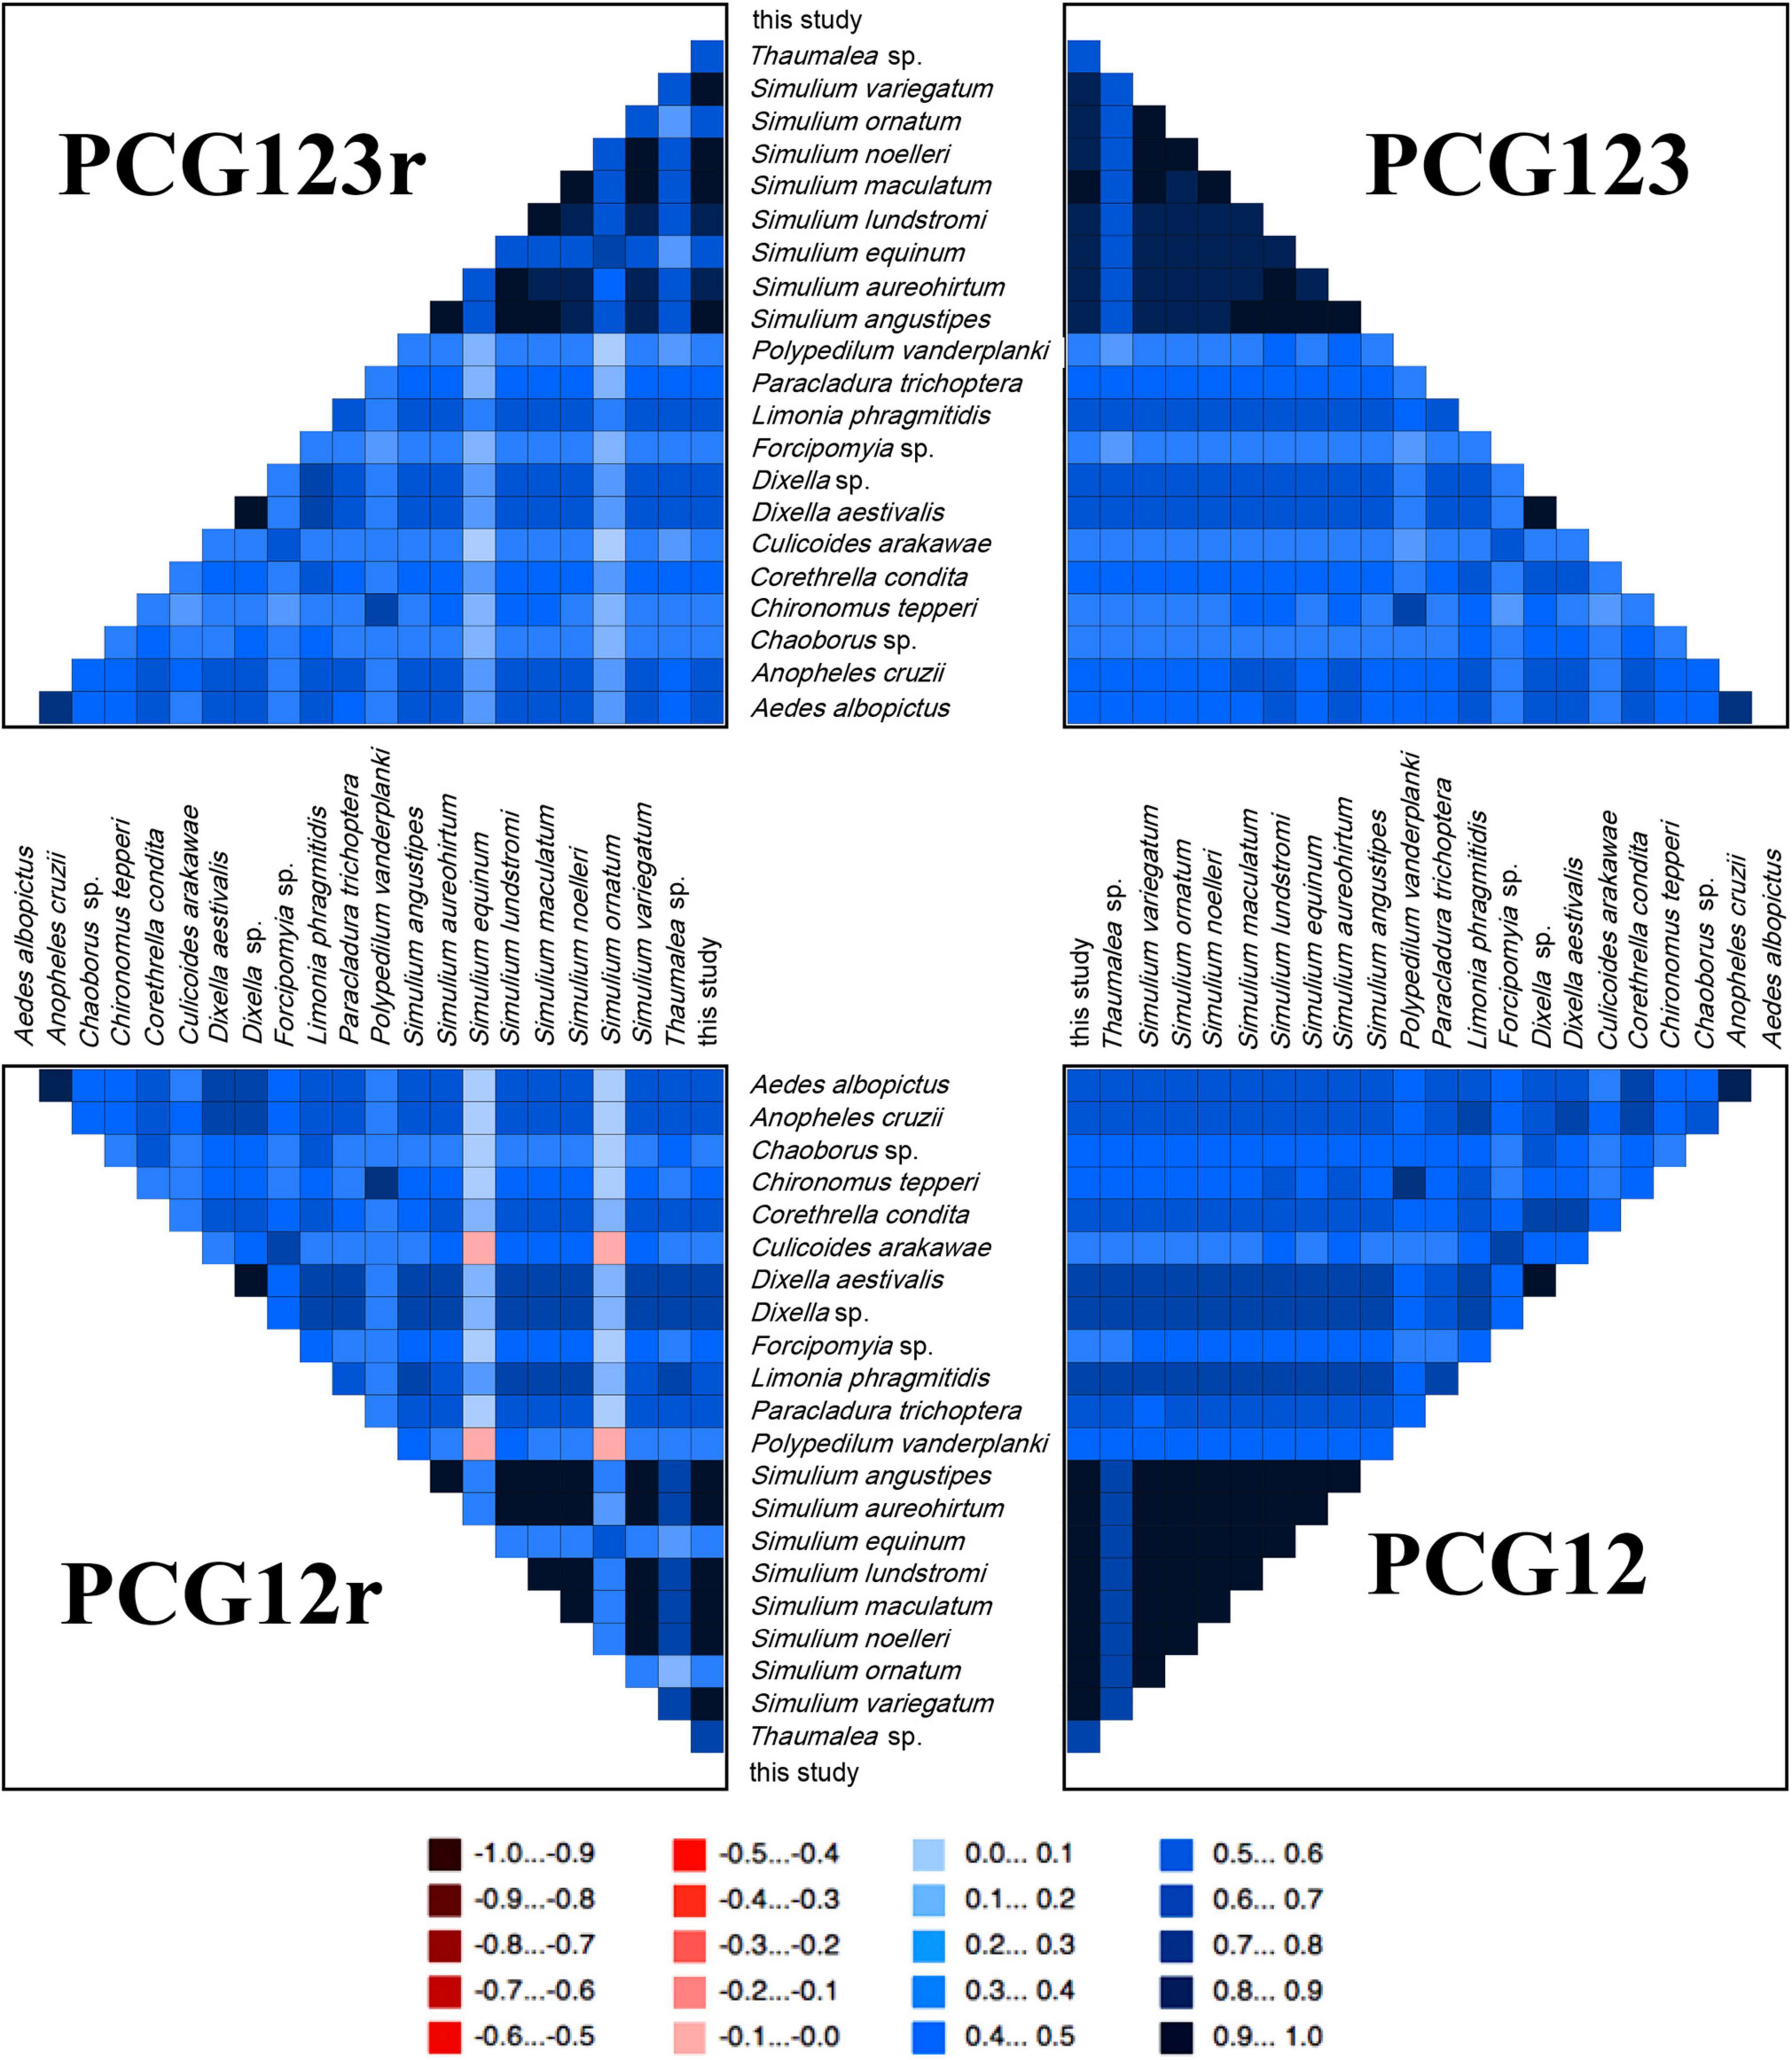
Figure 6. AliGROOVE analysis for four datasets. The mean similarity score between sequences is represented by a colored square, based on the AliGROOVE scores from –1, indicating great differences in rates from the remainder of the datasets, i.e., heterogeneity (red), to +1, indicating rates match all other comparisons (blue).
The phylogenetic analyses were conducted based on 21 mitogenomes downloaded from GenBank and one newly sequenced mitogenome of subgenus Montisimulium in this study, including 20 species of Culicoidea and two species of Tipuloidea (Table 1).
In total, nine phylogenetic trees were obtained in our analyses, of which eight were under homogeneous models with MrBayes and RaxML based on PCG12, PCG12r, PCG123, and PCG123r, as well as one under a heterogeneous model (CAT-GTR) with PhyloBayes based on PCG123r. All phylogenetic trees had similar topologies. Many phylogenetic studies of arthropods have shown that heterogeneous models perform better than homogeneous ones to resolve ancient relationships (Lartillot et al., 2007; Li et al., 2015a; Song et al., 2016). Strong heterogeneity in pair-wise sequence comparisons was shown in AliGROOVE analyses. Therefore, the phylogenetic trees under the heterogeneous model are shown because the phylogenetic relationships were considered more compelling (Figure 7). The Simuliidae was recovered as monophyletic and the sister group to Thaumaleidae. Dixidae was the sister group to Ceratopogonidae. Chironomidae was the sister group to [(Corethrellidae, Chaoboridae) and Culicidae]. In Simuliidae, subgenus Nevermannia was recovered as monophyletic and subgenus Simulium was recovered as paraphyletic. In total, nine species of Simuliidae formed two well-supported clades. The first branch was the subgenera Eusimulium + Nevermannia. In the second branch, subgenus Simulium + Odagmia was the sister group to subgenus Byssodon, and together they were the sister group to subgenus Montisimulium. In addition, the whole branch [Montisimulium, (Byssodon and Simulium + Odagmia)] was the sister group to subgenus Wilhelmia (Figure 7).
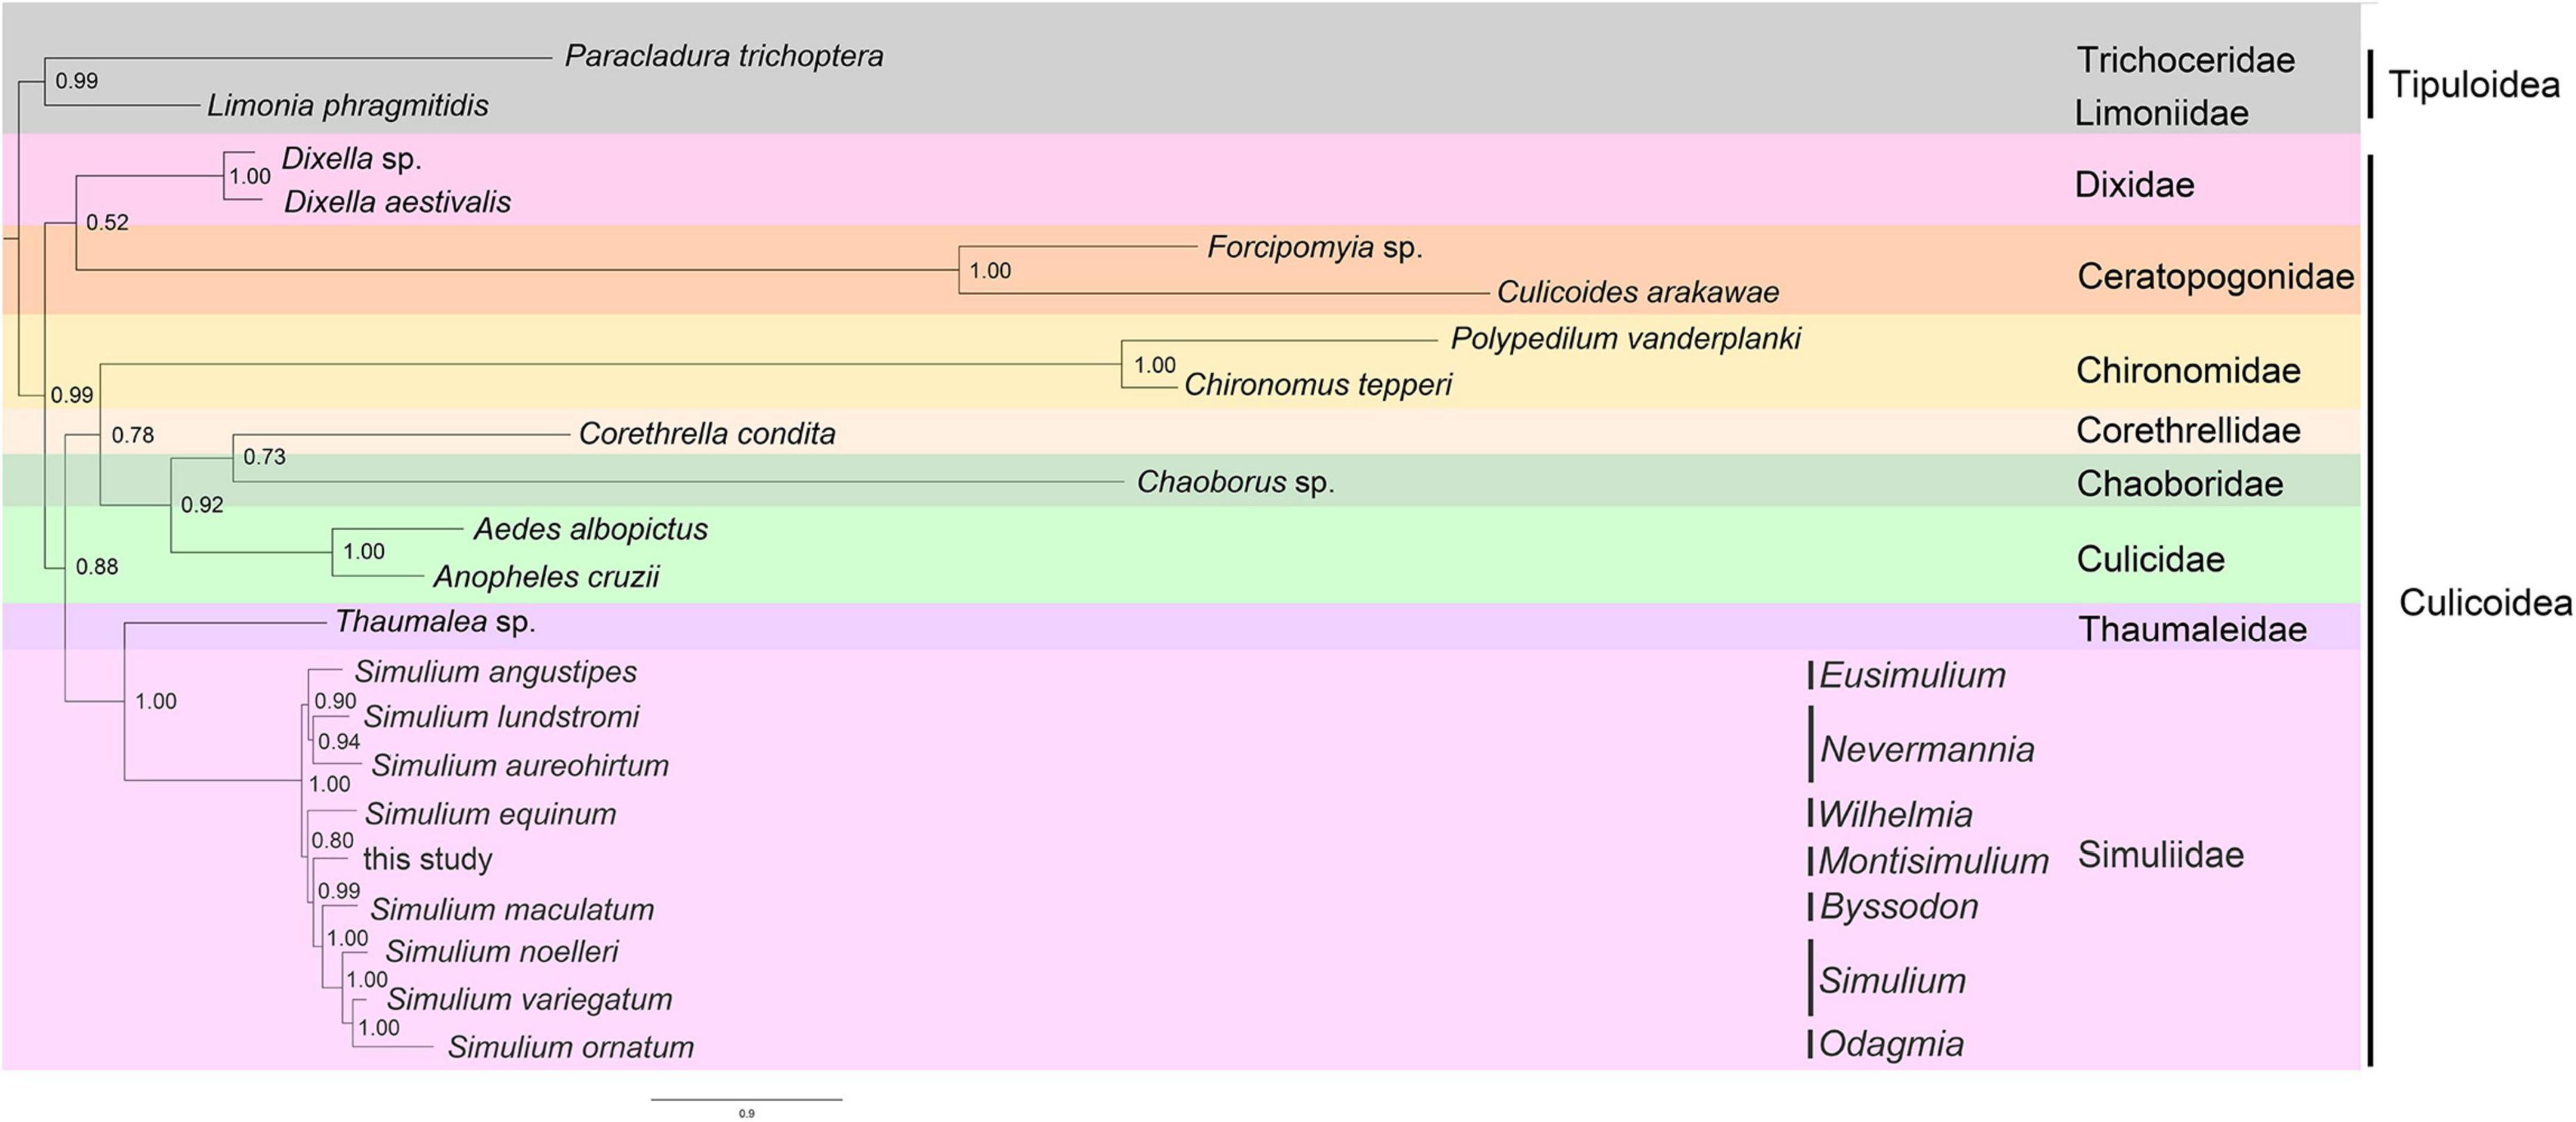
Figure 7. Phylogenetic trees inferred from PhyloBayes analysis based on the concatenation data of PCG123r.
The ML and BI analyses had similar topologies with some incongruences (Supplementary Figures 1–8). In Culicoidea, most analyses gave the same conclusion, with Chironomidae being the sister group to the branch (Chaoboridae and Ceratopogonidae). However, Chironomidae was recovered as the sister group to the outgroup, with very low support in the ML analysis of PCG12. In BI analyses of PCG12 and PCG12r, Ceratopogonidae was the sister group to (Chironomidae and Chaoboridae). Dixidae was recovered as the sister group to other species of Culicoidea based on PCG12r and PCG123r, whereas it was recovered as the sister group to the Thaumaleidae + Simuliidae based on PCG12 and PCG123 in BI analyses. In the ML analysis of PCG123, Dixidae was recovered as the sister group to {(Corethrellidae and Culicidae) and [Chironomidae, (Chaoboridae and Ceratopogonidae)]}. In the ML analysis of PCG12, Dixidae was recovered as the sister group to the outgroup, with very low support. Corethrellidae was recovered as the sister group to Culicidae except in the ML analysis of PCG12. Simuliidae was recovered as the sister group to Thaumaleidae in all analyses.
In Simuliidae, there were two types of phylogenetic trees. Based on PCG12 and PCG12r, subgenus Simulium and Nevermannia were paraphyletic, whereas others were basically the same as with the heterogeneous tree. The phylogenetic trees based on PCG123 and PCG123r supported subgenus Eusimulium as the sister group to subgenus Nevermannia except that subgenus Nevermannia was paraphyletic in BI analysis based on PCG123r, whereas the branch of Wilhelmia + Montisimulium was recovered as the sister group to (Byssodon and Simulium + Odagmia) (Supplementary Figures 1–8).
Divergence time estimation of Culicoidea, including the median node height for the main clade and the 95% highest posterior density (HPD) interval for each clade, is shown in Figure 8. Culicoidea originated in the Carboniferous (296.14 Ma, 95% HPD = 262.07–333.99 Ma), and the (Dixidae, Ceratopogonidae) diverged from Culicoidea in the Permian (292.17 Ma, 95% HPD = 259.30–330.68 Ma). The divergence between Culicidae and Corethrellidae and Chaoboridae was estimated to be in the Triassic (227.91 Ma, 95% HPD = 189.49–266.77 Ma), whereas the divergence between this branch and Chironomidae was estimated to be in the Permian (259.06 Ma, 95% HPD = 232.49–289.71 Ma). The divergence between the Thaumaleidae and Simuliidae was estimated to be in the Triassic (239.24 Ma, 95% HPD = 203.54–279.26 Ma).
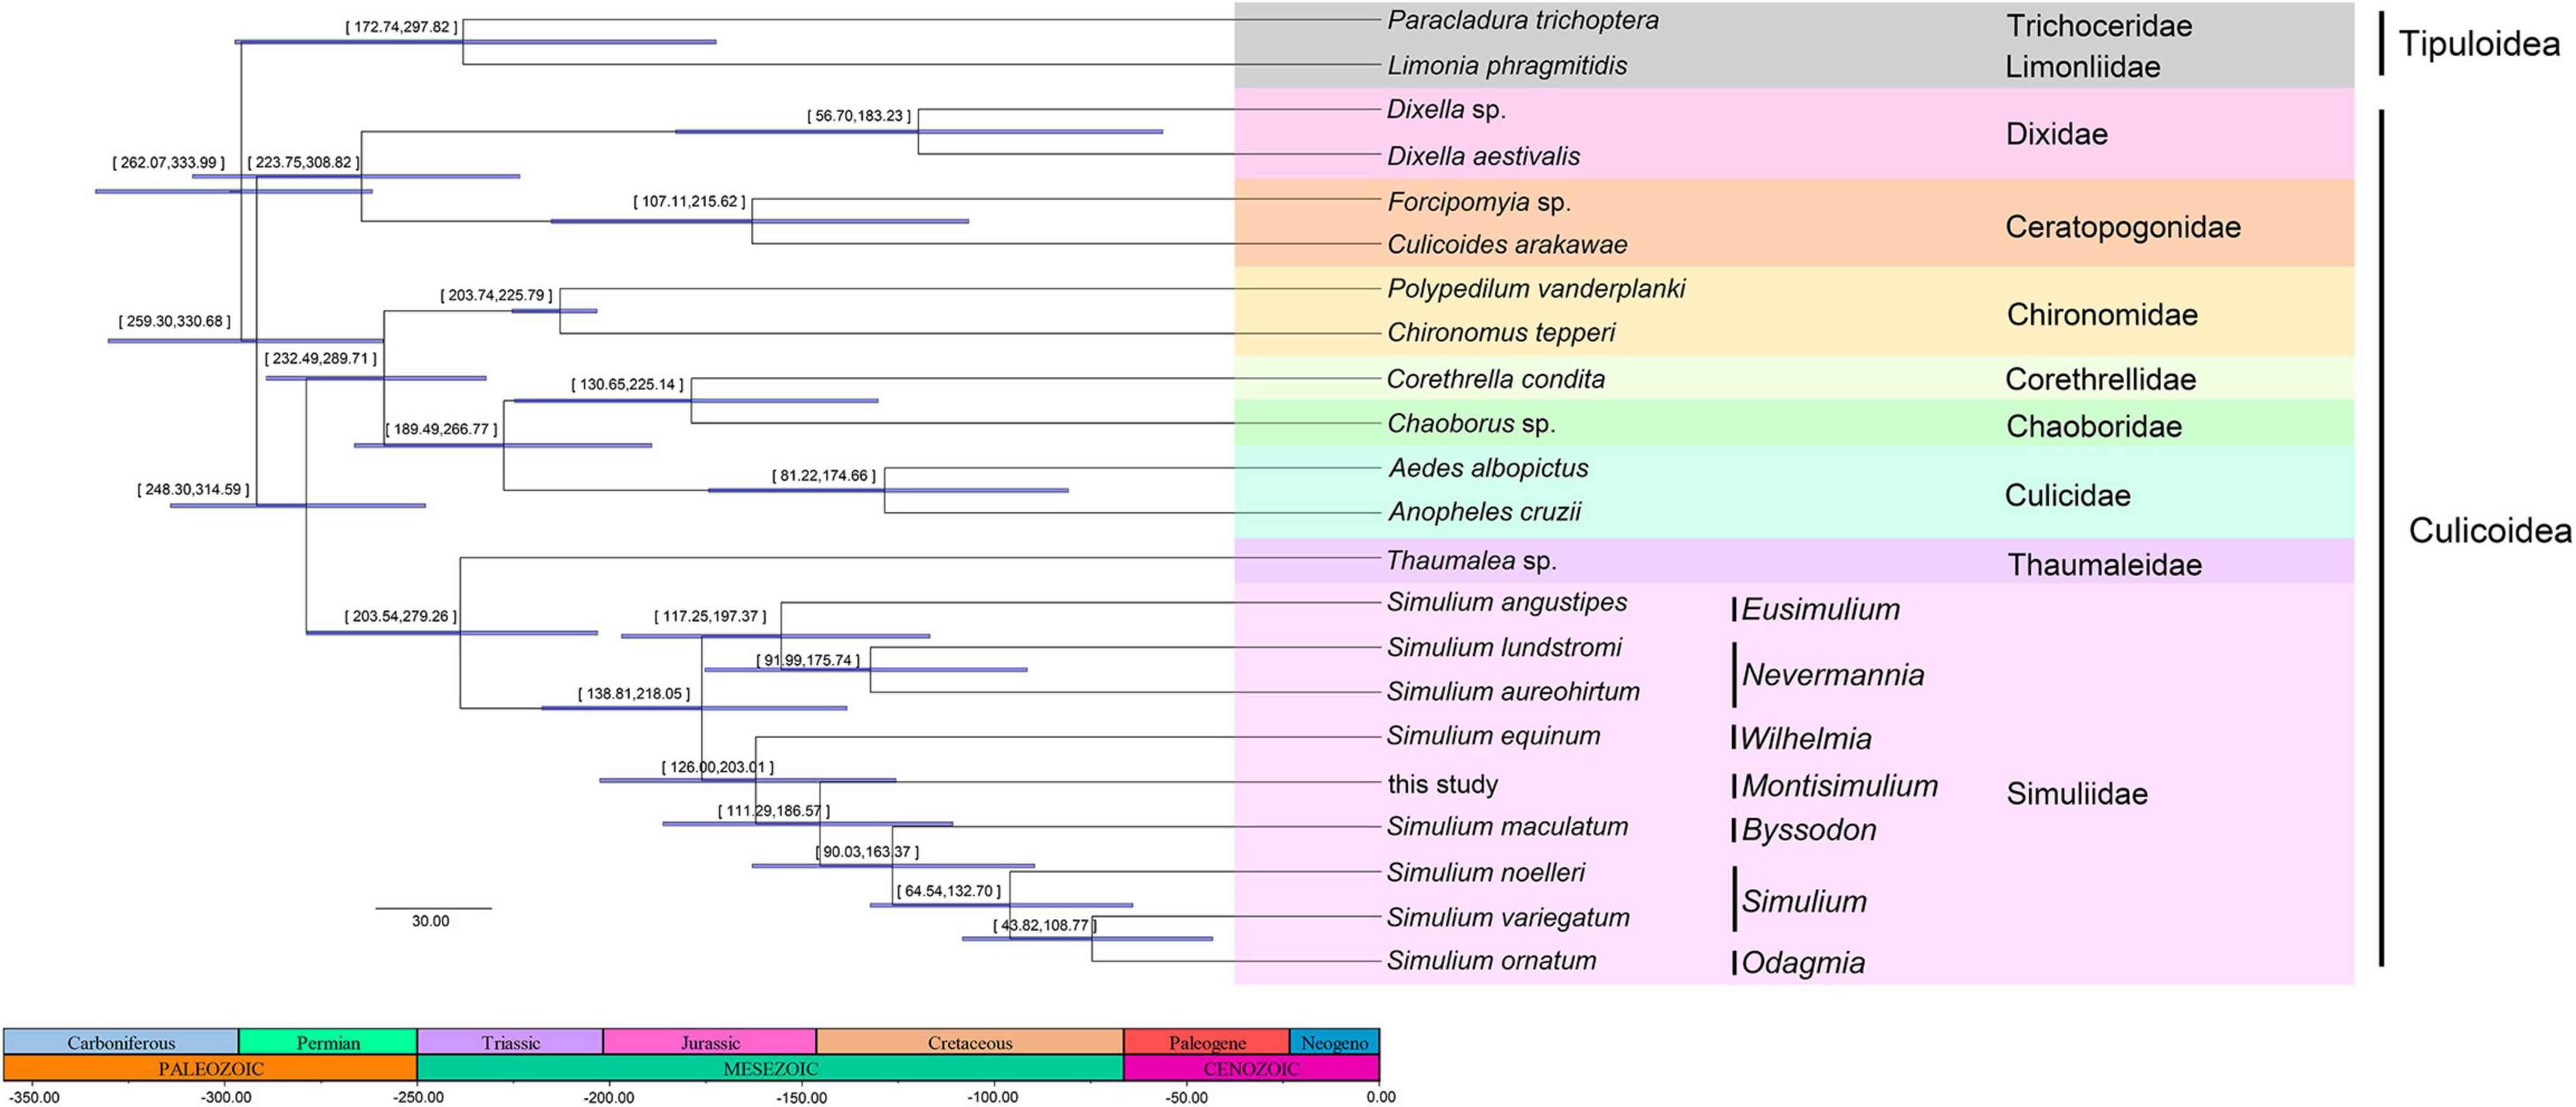
Figure 8. Estimated divergence times among all families based on PhyloBayes analysis.
The Simuliidae split into two branches at 176.50 Ma (95% HPD = 138.81–218.05 Ma). The divergence time estimation among subgenera of Simuliidae ranged from 162.46 Ma (95% HPD = 126.00–203.01 Ma) to 75.08 Ma (95% HPD = 43.82–108.77 Ma).
In a few species of Aedes, Anopheles, and Cecidomyiidae, individual gene deletions, transpositions between adjacent genes, or coding direction changes have been observed (Beckenbach and Joy, 2009; Zhang et al., 2013; Atray et al., 2015; Miao et al., 2020). Otherwise, the structures of most Diptera mitogenomes are conservative, similar to the insect ancestral arrangement (Zhang et al., 2013). The genome organization of S. jisigouense was the same as most Diptera.
The phylogenetic reconstruction with all methods based on all datasets supported Simuliidae as monophyletic, being the sister group to Thaumaleidae, which is consistent with previous research (Pawlowski et al., 1996; Bertone et al., 2008; Kang, 2017). Our results show that the family Chironomidae is closely related to the big branch, such as Chaoboridae, Corethrellidae, and Culicidae, which is consistent with the findings by Zhang et al. (2019). However, Zhang et al. (2019) recovered Chaoboridae as the sister group to Corethrellidae + Culicidae, whereas our results recovered Culicidae as the sister group to Corethrellidae + Chaoboridae. Wang and Huang (2019) recovered Dixidae as the sister group to Culicidae, whereas our results recovered Dixidae as the sister group to Ceratopogonidae. Our results show that subgenus Nevermannia is monophyletic, whereas Phayuhasena et al. (2010) demonstrated that Nevermannia is paraphyletic. Further, we found that subgenus Simulium is paraphyletic, whereas Phayuhasena et al. (2010) demonstrated that subgenus Simulium is monophyletic. Phayuhasena et al. (2010) showed that subgenus Simulium is the sister group to subgenus Nevermannia + Montisimulium. However, our results show that subgenus Nevermannia is the sister group to subgenus Montisimulium + Simulium. These incongruences will need to be addressed with more comprehensive sampling and more accurate models in future studies.
We estimated that the divergence between Culicidae and Corethrellidae and Chaoboridae was in the Triassic (227.01 Ma, 95% HPD = 189.49–266.77 Ma). Thus, the divergence time of Culicidae may be earlier than that found by Cheng et al. (2021). We reported divergence time estimation among subgenera of Simuliidae for the first time, which ranged from the Jurassic to the Cretaceous.
We recognize that only one specimen of subgenus Montisimulium was sequenced in our study. More mitogenomes will be needed in the future to better understand the phylogenetic position of Montisimulium, as well as the phylogenetic relationships within Simuliidae. Additional sampling of all other subgenera will be required to clarify the phylogenetic relationships within Simuliidae.
The datasets presented in this study can be found in online repositories. The names of the repository/repositories and accession number(s) can be found in the article/Supplementary material.
YA and YW: conceptualization. YA and CL: methodology and formal analysis. YA: software and writing—review and editing. JL and YW: validation, supervision, project administration, and funding acquisition. CL: investigation and resources. YA, JL, and YW: data curation and writing—original draft preparation. YW: visualization. All authors have read and agreed to the published version of the manuscript.
This research was funded by the National Natural Science Foundation of China (31900341 and 32170451), the Hebei Natural Science Foundation for Excellent Young Scholars (C2019204149), the Hebei Youth Talent Support Program (BJ2019039), the Hebei Importing Overseas Students Support Program (C20190341), and the Starting Scientific Research Foundation for the Introduced Talents of Hebei Agricultural University (YJ201817).
We thank Prof. Peter H. Adler from Clemson University for comments on this manuscript and Liang Wang from China Agricultural University for collecting and providing the specimen.
The authors declare that the research was conducted in the absence of any commercial or financial relationships that could be construed as a potential conflict of interest.
All claims expressed in this article are solely those of the authors and do not necessarily represent those of their affiliated organizations, or those of the publisher, the editors and the reviewers. Any product that may be evaluated in this article, or claim that may be made by its manufacturer, is not guaranteed or endorsed by the publisher.
The Supplementary Material for this article can be found online at: https://www.frontiersin.org/articles/10.3389/fevo.2022.932601/full#supplementary-material
Supplementary Figure 1. Phylogenetic trees inferred from Randomized Axelerated Maximum Likelihood (RAxML) analysis based on the concatenation data of PCG12.
Supplementary Figure 2. Phylogenetic trees inferred from MrBayes analysis based on the concatenation data of PCG12.
Supplementary Figure 3. Phylogenetic trees inferred from RAxML analysis based on the concatenation data of PCG12r.
Supplementary Figure 4. Phylogenetic trees inferred from MrBayes analysis based on the concatenation data of PCG12r.
Supplementary Figure 5. Phylogenetic trees inferred from RAxML analysis based on the concatenation data of PCG123.
Supplementary Figure 6. Phylogenetic trees inferred from MrBayes analysis based on the concatenation data of PCG123.
Supplementary Figure 7. Phylogenetic trees inferred from RAxML analysis based on the concatenation data of PCG123r.
Supplementary Figure 8. Phylogenetic trees inferred from MrBayes analysis based on the concatenation data of PCG123r.
Adler, P. H. (2021). World blackflies (Diptera: Simuliidae): A Comprehensive Revision of the Taxonomic, and Geographical Inventory. Clemson: Clemson University.
Alexandros, S. (2014). RAxML version 8: a tool for phylogenetic analysis and post-analysis of large phylogenies. Bioinformatics 30, 1312–1313. doi: 10.1093/bioinformatics/btu033
Andrews, S. (2020). FastQC: A Quality Control Tool for High Throughput Sequence Data. 2020. Available online at: https://www.bioinformatics.babraham.ac.uk/ (accessed April 12, 2021).
Atray, I., Bentur, J. S., and Nair, S. (2015). The Asian rice gall midge (Orseolia oryzae) mitogenome has evolved novel gene boundaries and tandem repeats that distinguish its biotypes. PLoS One 10:14. doi: 10.1371/journal.pone.0134625
Beckenbach, A. T., and Borkent, A. (2003). Molecular analysis of the biting midges (Diptera Ceratopogonidae), based on mitochondrial cytochrome oxidase subunit 2. Mol. Phylogenet. Evol. 27, 21–35. doi: 10.1016/s1055-7903(02)00395-0
Beckenbach, A. T., and Joy, J. B. (2009). Evolution of the mitochondrial genomes of gall midges (Diptera Cecidomyiidae): rearrangement and severe truncation of tRNA genes. Genom. Biol. Evol. 1, 278–287. doi: 10.1093/gbe/evp027
Bernt, M., Donath, A., Jühling, F., Externbrink, F., Florentz, C., Fritzsch, G., et al. (2013). MITOS: improved de novo metazoan mitochondrial genome annotation. Mol. Phylogenet. Evol. 69, 313–319.
Bertone, M. A., Courtney, G., and Wiegmann, B. M. (2008). Phylogenetics and temporal diversification of the earliest true flies (Diptera) based on multiple nuclear genes. Syst. Entomol. 33, 668–687.
Bolger, A. M., Lohse, M., and Usadel, B. (2014). Trimmomatic: a flexible trimmer for Illumina sequence data. Bioinformatics 30, 2114–2120.
Cai, R. (2005). Study of classification on blackflies in some areas in China. Anhui Univers. Sci. Technol. 54, 80–86.
Cameron, S. L. (2014). Insect mitochondrial genomics: implications for evolution and phylogeny. Ann. Rev. Entomol. 59, 95–117.
Cheng, P., Zhang, Q., Zhang, X., Le, Q., Gong, M., Zhang, Z., et al. (2021). A draft genome assembly of Culex pipiens pallens (Diptera Culicidae) using Pacbio sequencing. Genom. Biol. Evol. 13:evab005. doi: 10.1093/gbe/evab005
Day, J. C., Gweon, H. S., and Post, R. J. (2016). Sequence and organization of the complete mitochondrial genome of the blackfly Simulium variegatum (Diptera Simuliidae). Mitochondrial DNA B 1, 799–801. doi: 10.1080/23802359.2016.1209091
Drummond, A. J., Suchard, M. A., Xie, D., and Rambaut, A. (2012). Bayesian Phylogenetics with BEAUti and the BEAST 1.7. Mol. Biol. Evol. 29, 1969–1973. doi: 10.1093/molbev/mss075
FigTree (2021). FigTree Evolution Phylogenetics and Epidemilogy. Available online: http://tree.bio.ed.ac.uk/software/figtree/ (accessed on Apr 12 2021)
Garms, R., and Walsh, J. F. (1987). “The migration and dispersal of blackflies: Simulium damnosum s.l., the main vector of human onchocerciasis,” in Blackflies. Ecology, population management, and annotated world list, eds K. C. Kim and R. W. Merritt (Pennysylvania: The Pennsylvania State University Press), 201–214.
Hall, R. O. Jr., Likens, G. E., and Malcom, H. M. (2001). Trophic basis of invertebrate production in 2 streams at the Hubbard Brook Experimental Forest. J. North Am. Benthol. Soc. 20, 432–447.
Huang, L., Zhang, C., and Chen, H. (2009). Improvement for the preparation of the polytene chromosomes of blackflies. Chin. J. Vector Biol. Control 20, 281–283.
Kang, Z. (2017). A Study on Molecular Phylogeny of the Nematocera (Insecta: Diptera). Beijing: China agricultural university.
Krzeminski, W., and Jarzembowski, E. (1999). Anne triassica, n.sp., the oldest representative of Chironomidae. Polskie Pismo Entomologiczne 68, 445–449.
Kück, P., Meid, S. A., Groß, C., Wägele, J. W., and Misof, B. (2014). AliGROOVE – visualization of heterogeneous sequence divergence within multiple sequence alignments and detection of inflated branch support. BMC Bioinform. 15:294. doi: 10.1186/1471-2105-15-294
Kumar, S., Stecher, G., and Tamura, K. (2016). MEGA7: molecular evolutionary genetics analysis version 7.0 for bigger datasets. Mol. Biol. Evol. 33, 1870–1874. doi: 10.1093/molbev/msw054
Lartillot, N., Brinkmann, H., and Philippe, H. (2007). Suppression of long-branch attraction artefacts in the animal phylogeny using a site-heterogeneous mode. BMC Evol. Biol. 7:S4. doi: 10.1186/1471-2148-7-S1-S4
Lartillot, N., Lepage, T., and Blanquart, S. (2009). PhyloBayes 3: A Bayesian software package for phylogenetic reconstruction and molecular dating. Bioinformatics 25, 2286–2288. doi: 10.1093/bioinformatics/btp368
Li, H., Shao, R., Song, N., Song, F., Jiang, P., Li, Z., et al. (2015a). Higher-level phylogeny of paraneopteran insects inferred from mitochondrial genome sequences. Sci. Rep. 5:8527. doi: 10.1038/srep08527
Li, X., Ding, S., Cameron, S., Kang, Z., Wang, Y., and Yang, D. (2015b). The first mitochondrial genome of the Sepsid Fly Nemopoda mamaevi Ozerov, 1997 (Diptera Sciomyzoidea Sepsidae), with mitochondrial genome phylogeny of Cyclorrhapha. PLoS One 10:e0123594. doi: 10.1371/journal.pone.0123594
Liu, K., Linder, C. R., and Warnow, T. (2011). RAxML and FastTree: comparing two methods for large-scale maximum likelihood phylogeny estimation. PLoS One 6:e27731. doi: 10.1371/journal.pone.0027731
Martinez-Villegas, L., Assis-Geraldo, J., Koerich, L. B., Id, T., and Bahia, A. C. (2019). Characterization of the complete mitogenome of Anopheles aquasalis, and phylogenetic divergences among Anopheles from diverse geographic zones. PLoS One 14:e0219523. doi: 10.1371/journal.pone.0219523
Miao, X. Q., Huang, J. H., Menzel, F., Wang, Q. Y., Wei, Q. Y., Lin, X. L., et al. (2020). Five mitochondrial genomes of black fungus gnats (Sciaridae) and their phylogenetic implications. Int. J. Biol. Macromol. 150, 200–205. doi: 10.1016/j.ijbiomac.2020.01.271
Miller, B. R., Crabtree, M. B., and Savage, H. M. (1997). Phylogenetic relationships of the Culicomorpha inferred from 18S and 5.8S ribosomal DNA sequences (Diptera Nematocera). Insect Mol. Biol. 6, 105–114. doi: 10.1111/j.1365-2583.1997.tb00078.x
Pawlowski, J., Szadziewski, R., Kmieciak, D., Fahrni, J., and Bittar, G. (1996). Phylogeny of the infraorder Culicomorpha (Diptera Nematocera) based on 28S RNA gene sequences. Syst. Entomol. 21, 167–178.
Peng, Y., Leung, H., Yiu, S. M., and Chin, F. I. D. B. A.-U. D. (2012). a de novo assembler for single-cell and metagenomic sequencing data with highly uneven depth. Bioinformatics 28, 1420–1428. doi: 10.1093/bioinformatics/bts174
Perna, N. T., and Kocher, T. D. (1995). Patterns of nucleotide composition at fourfold degenerate sites of animal mitochondrial genomes. J. Mol. Evol. 41, 353–358.
Phayuhasena, S., Colgan, D. J., Kuvangkadilok, C., Pramual, P., and Baimai, V. (2010). Phylogenetic relationships among the black fly species (Diptera Simuliidae) of Thailand based on multiple gene sequences. Genetica 138, 633–648. doi: 10.1007/s10709-010-9437-0
Ronquist, F., and Huelsenbeck, J. P. (2003). MrBayes 3: Bayesian phylogenetic inference under mixed models. Bioinformatics 19, 1572–1574.
Song, F., Li, H., Jiang, P., Zhou, X., Liu, J., Sun, C., et al. (2016). Capturing the phylogeny of Holometabola with mitochondrial genome data and Bayesian site-heterogeneous mixture models. Genom. Biol. Evol. 8, 1441–1426. doi: 10.1093/gbe/evw086
Thompson, J. D., Gibson, T. J., Plewniak, F., Jeanmougin, F., and Higgins, D. G. (1997). The Clustal_X Windows interface: flexible strategies for multiple sequence alignment aided by quality analysis tool. Nucleic Acids Res. 25, 4876–4882. doi: 10.1093/nar/25.24.4876
Wang, G., and Huang, M. (2019). Characterization of the complete mitochondrial genome of Simulium (Byssodon) maculatum (Diptera Simuliidae) and its phylogenetic implications. Int. J. Biol. Macromol. 121, 152–160. doi: 10.1016/j.ijbiomac.2018.09.205
Wolstenholme, D. R. (1992). Animal mitochondrial DNA: structure and evolution. Int. Rev. Cytol. 141, 173–216.
Yan, Y., and Li, X. (2006). Secondary production and its trophic basis of Simulium Spin Heizhuchong Stream. Ecol. Sci. 25, 308–311.
Zhang, N., Zhang, Y., Yu, G., and Chen, B. (2013). Structure characteristics of the mitochondrial genomes of Diptera and design and application of universal primers for their sequencing. Acta Entomol. Sin. 56, 398–407.
Zhang, X., Kang, Z., Ding, S., Wang, Y., Borkent, C., Saigusa, T., et al. (2019). Mitochondrial genomes provide insights into the phylogeny of Culicomorpha (Diptera). Int. J. Mol. Sci. 20:747. doi: 10.3390/ijms20030747
Keywords: Simuliidae, Simulium jisigouense, mitochondrial genome, phylogenetic relationships, divergence time
Citation: An Y, Li C, Li J and Wang Y (2022) The complete mitochondrial genome of Simulium jisigouense (Diptera: Simuliidae) and phylogenetic analysis of Simuliidae. Front. Ecol. Evol. 10:932601. doi: 10.3389/fevo.2022.932601
Received: 30 April 2022; Accepted: 11 July 2022;
Published: 08 August 2022.
Edited by:
Xiaofan Zhou, South China Agricultural University, ChinaReviewed by:
Qingyun Guo, Gannan Normal University, ChinaCopyright © 2022 An, Li, Li and Wang. This is an open-access article distributed under the terms of the Creative Commons Attribution License (CC BY). The use, distribution or reproduction in other forums is permitted, provided the original author(s) and the copyright owner(s) are credited and that the original publication in this journal is cited, in accordance with accepted academic practice. No use, distribution or reproduction is permitted which does not comply with these terms.
*Correspondence: Jing Li, bGlqaW5nMTk3NjQxNjUxNEAxNjMuY29t; Yuyu Wang, d2FuZ3l5X2FteUAxMjYuY29t
Disclaimer: All claims expressed in this article are solely those of the authors and do not necessarily represent those of their affiliated organizations, or those of the publisher, the editors and the reviewers. Any product that may be evaluated in this article or claim that may be made by its manufacturer is not guaranteed or endorsed by the publisher.
Research integrity at Frontiers
Learn more about the work of our research integrity team to safeguard the quality of each article we publish.