 Xianyu Yang1
 Tong Yang1Yaqiong Lu2*Mengjiao Jiang1
 Shaobo Zhang1Ping Shao1
 Liang Yuan1Chao Wang1Lei Wang1
- 1Plateau Atmosphere and Environment Key Laboratory of Sichuan Province, School of Atmospheric Sciences, Chengdu University of Information Technology, Chengdu, China
- 2Institute of Mountain Hazards and Environment, Chinese Academy of Sciences, Chengdu, China
The alarming increase of ambient ozone (O3) levels across China raises an urgent need in understanding underlying mechanisms of regional O3 events for highly urbanized city clusters. Sichuan Basin (SCB) situated in southwestern China has experienced severe O3 pollution at times in summer from 2013 to 2020. Here, we use the WRF-CMAQ model with the Integrated Source Apportionment Method (ISAM) to investigate the evolution mechanism and conduct source attribution of an extreme O3 episode in the SCB from June 1 to 8, 2019. This typical summer O3 episode is associated with the synoptic-driven meteorological phenomenon and transboundary flow of O3 and precursors across the SCB. Weak ventilation in combination with stagnant conditions triggered the basin-wide high O3 concentrations and enhanced BVOC emissions substantially contribute up to 57.9 μg/m3 MDA8 O3. CMAQ-ISAM indicates that precursor emissions from industrial and transportation have the largest impacts on elevating ambient O3 concentrations, while power plant emissions exhibit insignificant contributions to basin-wide O3 episodes. These results improve the understanding of the summertime O3 episode in the SCB and contribute insights into designing O3 mitigation policy.
Introduction
As a crucial oxidant in the atmosphere, ozone (O3) is a secondary pollutant formed through photochemical reactions of biogenic and anthropogenic precursors in the atmosphere (Atkinson, 2000; Seinfeld and Pandis, 2016). The increase of ground-level O3 adversely impacts human health, damages plant physiological functions, and reduces crop productivity (Anenberg et al., 2010). The Global Burden of Diseases Study 2015 reported that exposure to O3 contributed to 254 000 deaths globally from chronic obstructive pulmonary disease (COPD) in 2015 (Cohen et al., 2017). Due to the nonlinear relationship between O3 and its precursors (NOx and VOCs), decreases in precursor concentrations may not necessarily result in a corresponding decrease in O3. Conversely, disproportionate reductions in NOx and VOCs emissions may worsen O3 pollution (Wu et al., 2022). Therefore, a comprehensive understanding of O3 formation in response to the reduction in precursor emissions is urgently needed for the effective design of control measures.
With the rapid industrialization and urbanization since the 2000s, air pollution in China has become increasingly severe featured by frequent high PM2.5 and O3 episodes (Richter et al., 2005; Apte et al., 2015). Although NOx and SO2 emissions have been effectively controlled through stringent pollution control measures, elevated O3 levels in urban areas remain as an important environmental issue (Liu and Wang, 2020). Previous studies have shown that the Beijing–Tianjin–Hebei (BTH) area, Pearl River Delta (PRD), Yangtze River Delta (YRD) and Sichuan Basin are the four major urban clusters in China that suffer severe O3 pollution (Wu et al., 2020; Wang et al., 2021). The Sichuan Basin is the most developed economic zone in western China which is home to approximately 116 million residents within an area of 260,000 km2. The basin is nestled between the Daba Mountains to the north, the Yunnan-Guizhou Plateau to the south, the Tibetan Plateau to the west and the Wushan Mountains to the east. Given the deep basin topography, unique climate dynamics, in conjunction with intense anthropogenic emissions, considerable attention has been devoted to urban O3 pollution across the Sichuan Basin (Song et al., 2018; Simayi et al., 2020; Wang H. et al., 2022). Based on long-term ambient measurements of trace gasses, Wu et al. (2022) reported that O3 exceedance events and regional O3 episodes continuously increased over the Sichuan Basin during warm season from 2014 to 2019. Using the comprehensive air quality model with extensions (CAMx), Du et al. (2022) found that a reduction ratio of 1:3 for NOx/VOCs is the most beneficial pathway for O3 mitigation in metropolitan Chengdu. While prior studies have focused on identifying the spatial and temporal patterns and conducting source apportionment of O3 in the Sichuan Basin, the formation mechanism of O3 pollution in the Sichuan Basin remains unclear. In addition, the meteorological and chemical impacts on O3 episodes need to be further investigated.
In this study, we investigated the formation of a high O3 episode in that occurred in the summer of 2019 for revealing the governing processes of O3 formation by using the Weather Research and Forecasting-Community Multiscale Air Quality (WRF-CMAQ) modeling system. Further, CMAQ-ISAM is applied for conducting source apportionment of ambient O3 across the SCB. The paper is organized as follows. In Sect. 2, the model configuration is described. The model performance results as indicated by comparisons with observations – including meteorological and ground-level air pollutant observations – and the results of sensitivity experiments are presented in Sect. 3. The conclusions are given in Sect. 4.
Methodology
WRF-CMAQ model
The WRF-CMAQ modeling system is adopted to simulate a high O3 episode in the Sichuan Basin from 1 June to 8 June, 2019. WRF v4.1.1 is used to simulate meteorological fields using the National Centers for Environmental Prediction (NCEP) Final (FNL) 1.0° × 1.0° reanalysis data1 as initial and boundary conditions. The physical parameterizations for the WRF model are same as our previous work (Yang et al., 2020). There are 30 vertical layers from the ground to 100 hPa.
CMAQ v5.3.2 is employed to simulate O3 and its precursors with carbon-bond chemical mechanism (CB06) and the AERO6 aerosol module (Pye et al., 2017; Luecken et al., 2019; Appel et al., 2021). The grid resolution for the three-nested model domains is 27 km, 9 km and 3 km, respectively. Here, we analyzed only the innermost domain, which covers most cities within the Sichuan Basin. Boundary inflow to inner domains is extracted from outer domain CMAQ simulations. Anthropogenic emissions of air pollutants are based on Multiresolution Emission Inventory for China (MEIC) in 2017 with five emission sectors included (transportation, agricultural, power plant, industrial, and residential; Zheng et al., 2018). The Model of Emissions of Gasses and Aerosols from Nature (MEGAN, version 2.1) was used to calculate the biogenic emissions (Guenther et al., 2012; Wu et al., 2020). All model simulations are conducted from 20 May to 8 June and model outputs prior to 1 June are discarded as spin-up (Figure 1).
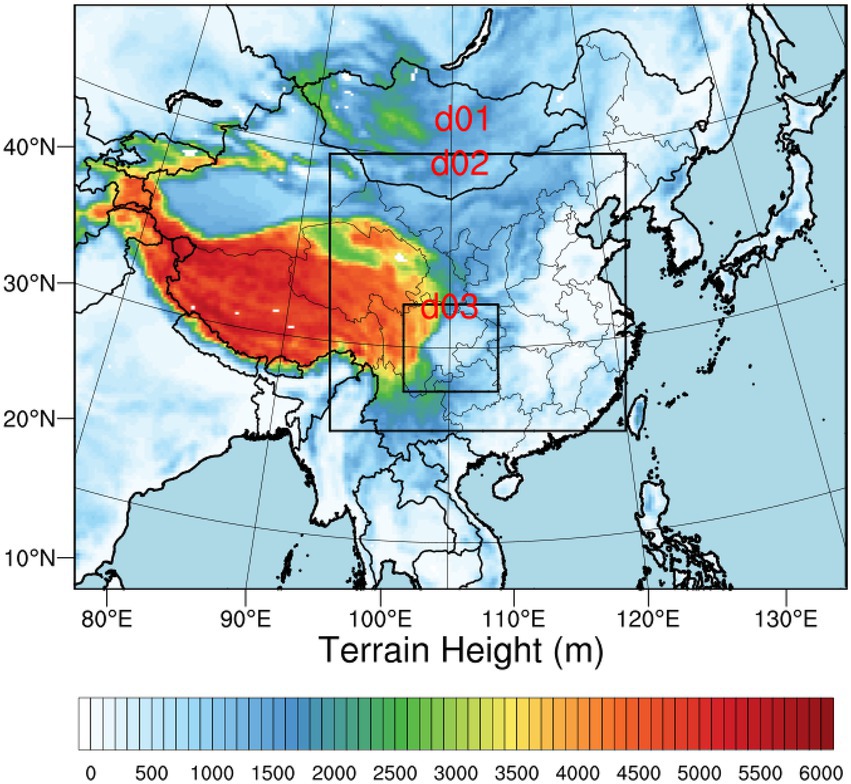
Figure 1. Three-nested domains of WRF-CMAQ modeling system.
Ambient measurements
Ground-level meteorological observations were collected from the monitoring stations were obtained from the China Meteorological Data Service Centre.2 Hourly air pollutants concentrations (O3 and NO2) were acquired from Sichuan environmental monitoring center and rigorously checked following data accuracy guides (Wang H. et al., 2022).
Integrated source apportionment method
The Integrated Source Apportionment Method (ISAM) in CMAQ has been widely used in prior studies for investigating the response of air pollutants to changes in specific emission sources and quantifying the contributions of source regions to pollutants levels in receptor areas (Valverde et al., 2016; Kitagawa et al., 2021; Yang et al., 2021). Unlike OSAT/PSAT in the CAMx model, ISAM explicitly characterizes reactions of individual species rather than lumped species, thus enabling detailed source apporitionment along simulations. For each tagged source sector or region, ISAM uses a two-dimensional Jacobian matrix to diagnose changes of each species between model integration timesteps. For source apportionment of O3, ISAM uses the ratio between production rate of hydrogen peroxide to nitric acid (PH2O2/PHNO3) to identify O3-VOCs-NOx sensitivity regimes (Kwok et al., 2015). The ratio of PH2O2/PHNO3 <0.35 is distinguished as VOCs-limited regime while NOx-limited regime is for PH2O2/PHNO3 higher than 0.35.
Statistical metrics for model evaluation
The mean bias (MB), normalized mean bias (NMB), root mean square error (RMSE), and index of agreement (IOA) are used to evaluate the WRF-CMAQ model simulations of meteorological parameters and gas-phase species. The calculations of the MB, NMB, RMSE, and IOA are defined by equations (1)–(4), respectively, where Pi denotes values derived from model simulation and Oi represents observed values.
Results and discussion
Evaluation of WRF and CMAQ model performance
Four national meteorological stations are selected to validate the simulated meteorological fields (Chengdu, Meishan, Ziyang, Neijiang). Table 1 presents the statistical metrics for the hourly 2-m temperature (T2), 2-m relative humidity (RH2), and 10-m wind speed (WS10) at Chengdu, Meishan, Ziyang, and Neijiang meteorological stations. As shown in Table 1, IOA values for T2 for all sites are higher than 0.90 and MB values are lower than 1.5°C, indicating that the model can adequately reproduce the variations of T2 across the SCB. For RH2, it can be clearly seen that WRF well captures temporal variations of RH2, while WRF tends to underestimate the RH2 for all cities with the most significant underestimation in Chengdu (MB higher than 15%). In addition, despite the slight overestimation of WS10, the WRF model adequately simulated the transition of wind fields over the study period, with correlation coefficients of the simulated and observed 10-m u- and v-components reaching 0.64 and 0.71, respectively.
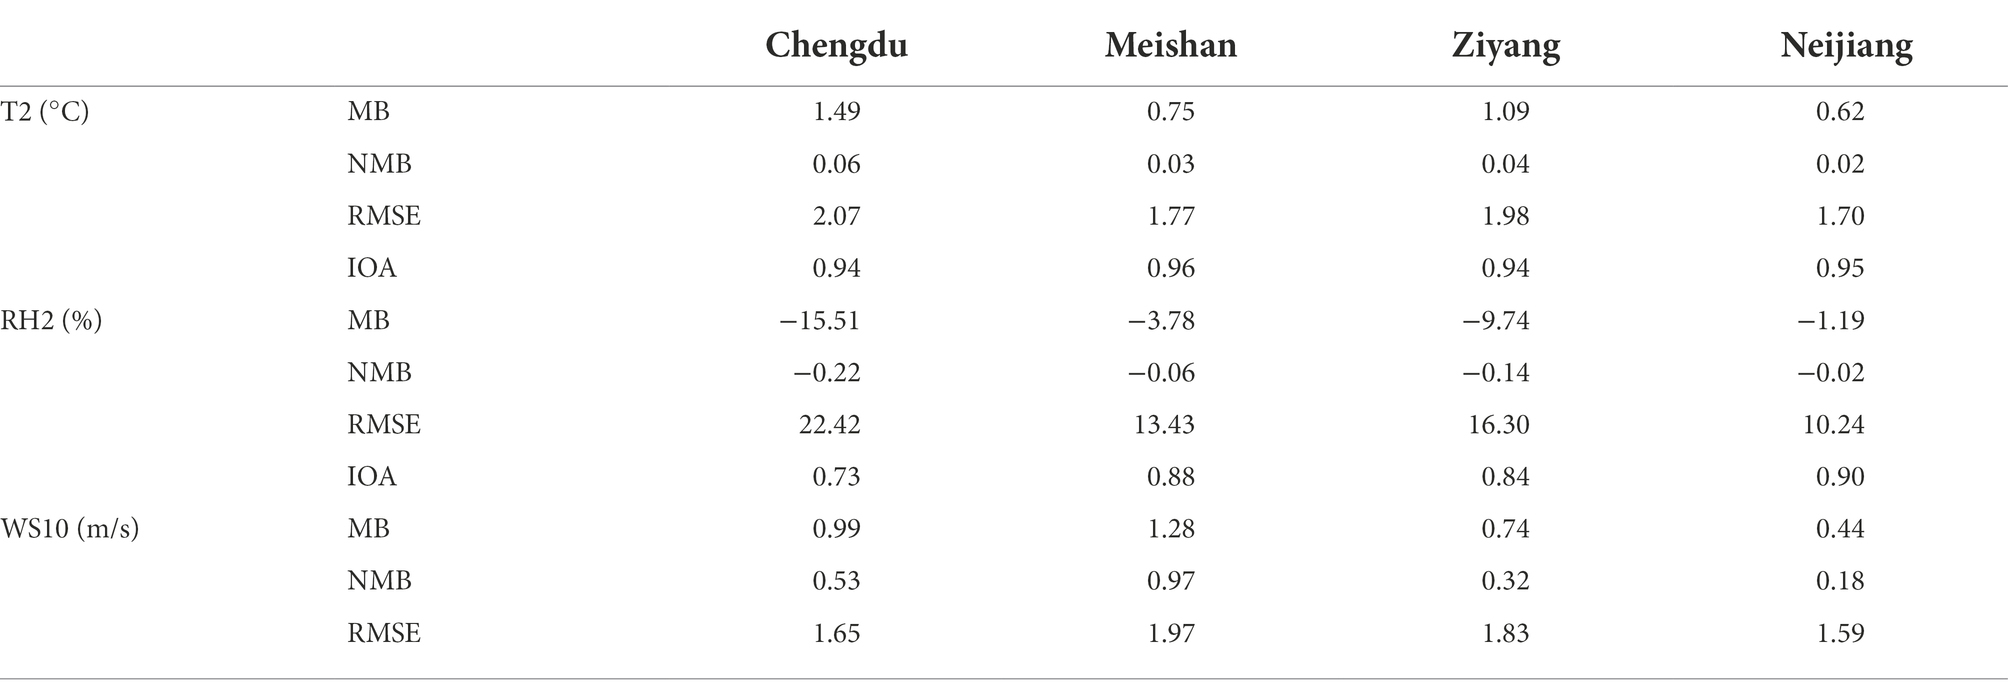
Table 1. Statistical metrics of WRF model performance compared with the observed meteorological parameters at Chengdu, Meishan, Ziyang and Neijiang stations from June 1 to 8, 2019.
Figure 2 displays the time series of simulated and observed O3 for Chengdu, Deyang, Mianyang, Nanchong, Neijiang, and Zigong cities over the study period. It can be clearly seen that the diurnal variations and temporal pattern of O3 were well captured by the CMAQ model simulation. O3 concentration peaked in the afternoon while it decreased at night due to NOx titration, which is coincident with periods of photochemical activity (Deng et al., 2019). Compared with the observations, the R values among cities are higher than 0.75 and all NMBs are <0.20, indicating that modeled O3 levels are in good agreement with the observations (Emery et al., 2017). However, it is worth noting that peak O3 levels were underestimated by CMAQ for Chengdu, Deyang, and Mianyang cities, resulting in relatively high MB values. This phenomenon could be attributed to overestimated daytime NO2 concentrations in urban areas (Zheng et al., 2021). Despite the moderate bias in the WRF-CMAQ modeling system, the model performance in this study is comparable to prior work, and the IOA values are even higher than in published literature (Yang et al., 2020; Wang Y. et al., 2022).
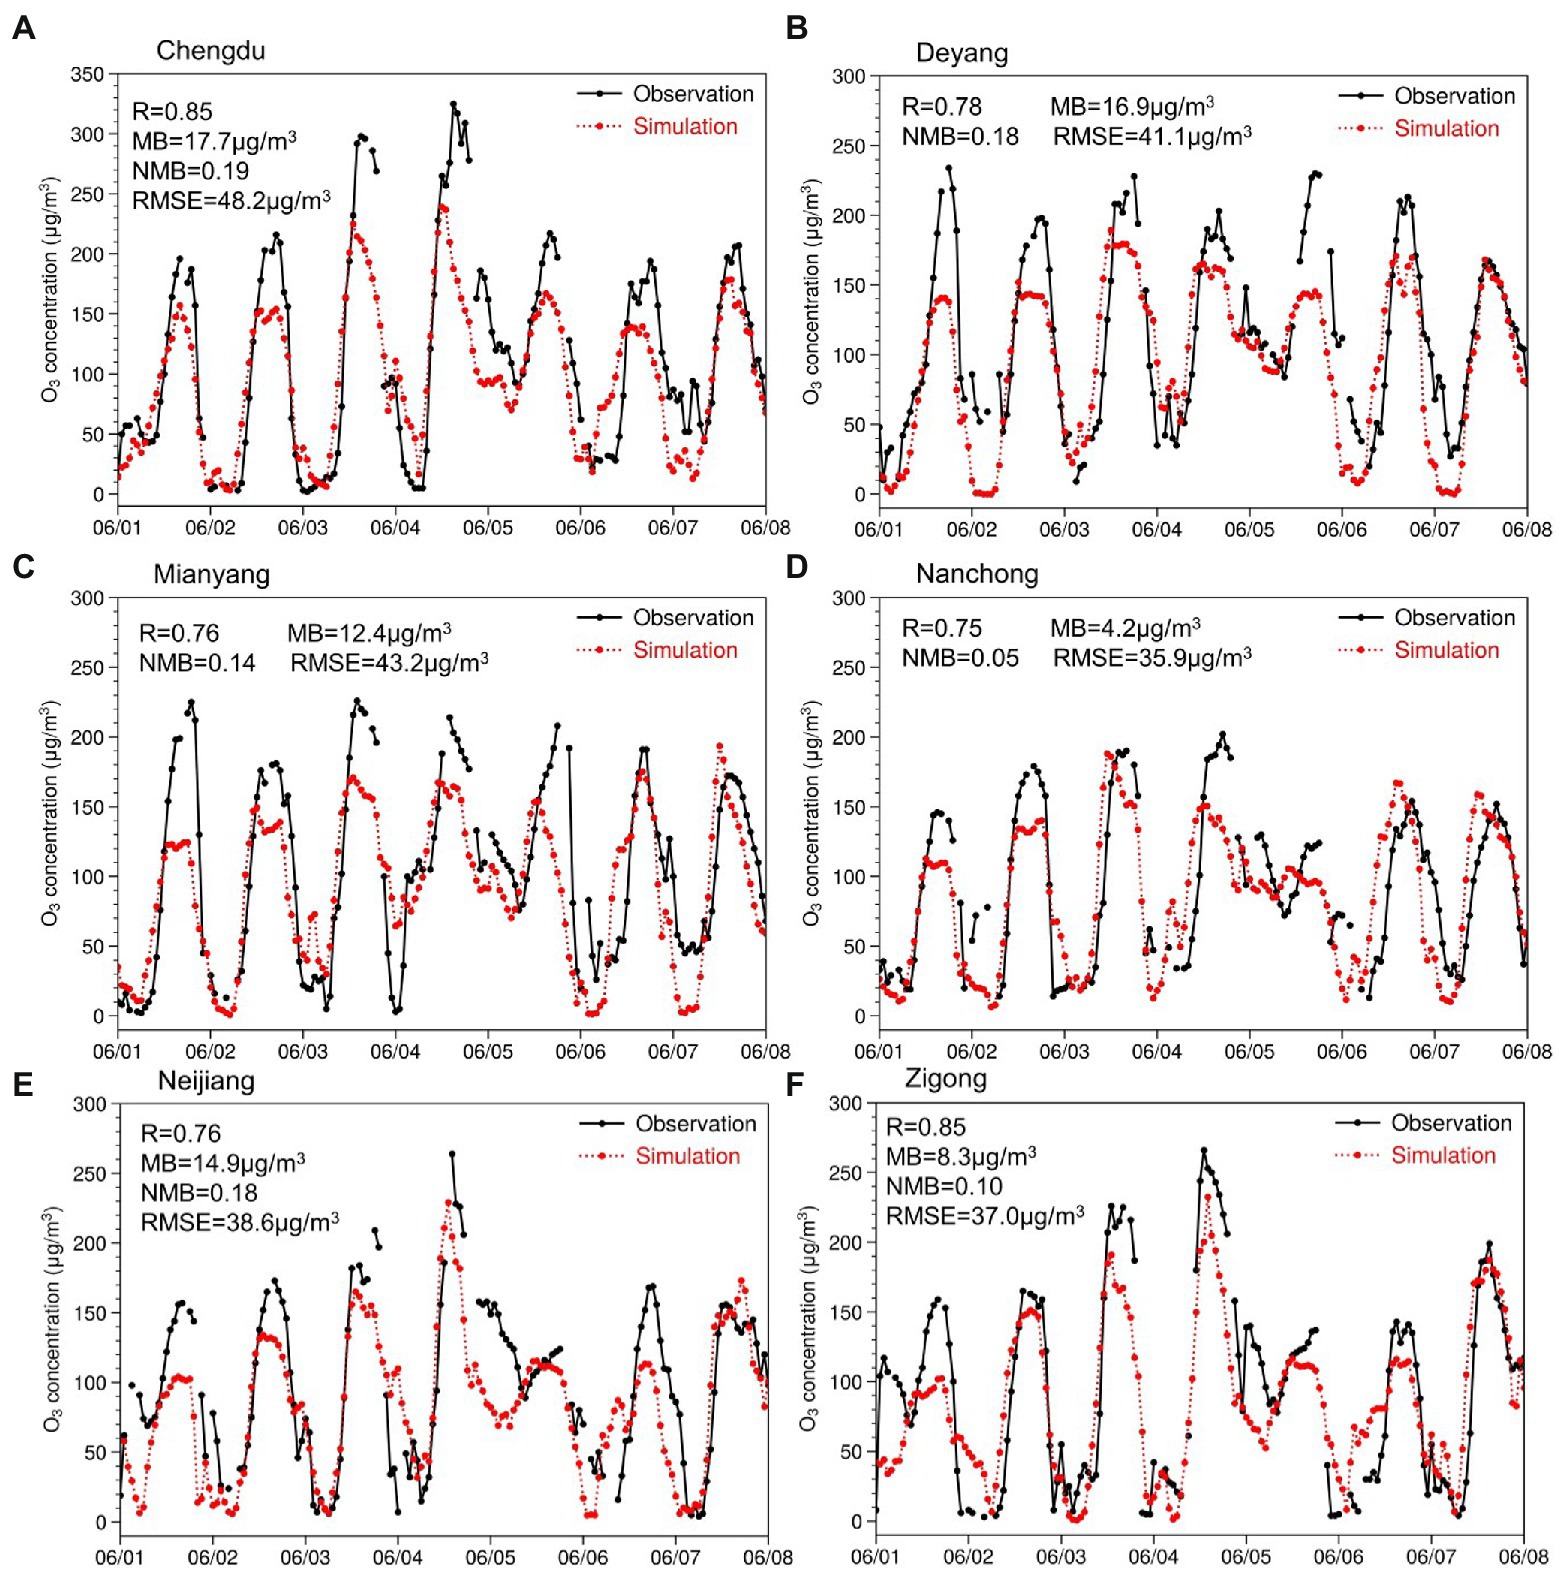
Figure 2. Time series of observed and simulated surface O3 concentrations at (a) Chengdu,
In general, the variations of meteorological parameters and gaseous pollutants simulated by the WRF-CMAQ modeling system agree well with ground-level observations across the SCB, indicating the robustness of the simulated meteorological fields and air pollutants levels.
Characterization of summertime O3 episode
Figure 3 presents the spatial pattern of the simulated ground-level MDA8 O3 concentrations from 1 June to 8 June 2019. Further, daily synoptic patterns at 500 hPa over China are shown in Figure 4. At the beginning of this episode (1 June), there were few polluted air masses advected across the SCB due to the stable synoptic background field. As a result, ambient O3 was mainly formed from local sources and peak O3 levels were mainly found in urban areas. Notably, the urban center of Chongqing exhibited MDA8 O3 in excess of National Ambient Air Quality Standards (NAAQS; MDA8 O3 higher than 160 μg/m3), suggesting the governing role of local meteorological conditions and anthropogenic emissions in O3 formation. With the development of the synoptic pattern, anthropogenic precursors emitted from southern and southeastern SCB were streaming northward and gradually accumulated in downwind regions on 2nd June. At the same time, high levels of MDA8 O3 concentrations were clearly observed across the Chengdu Plain and southern SCB due to unfavorable meteorological conditions. On 3rd June, synoptic wind fields in combination with stagnant conditions considerably exacerbated the regional O3 episode, which lead to basin-wide exposure to high levels of O3 (peak MDA8 O3 reaching 256.3 μg/m3). It is worth noting that elevated O3 levels can also be observed over northeastern SCB where anthropogenic emissions of NOx and VOCs are comparatively lower than in other areas within the SCB, indicating the remarkable O3 enhancement attributed to meteorological-driven mesoscale processes. On the basis of substantial accumulated precursors, synoptic-driven wind fields continued to fuel regional O3 formation, and O3 hotspots were mainly found in the Chengdu Plain and southern SCB., With the eastward of southwest vortex on 5th June, moderate basin-wide precipitation led to dramatic reductions in O3 concentrations. Over this period, spatial patterns of O3 pollution were mainly influenced by local meteorological phenomena and anthropogenic emissions. On 7th June, high levels of ambient O3 were depicted throughout the SCB, which arise from the effects of a slow-moving high-pressure system. This episode ended on 8th June as the thermally driven circulation forced clean air masses through the SCB, subsequently reducing basin-wide O3 concentrations.
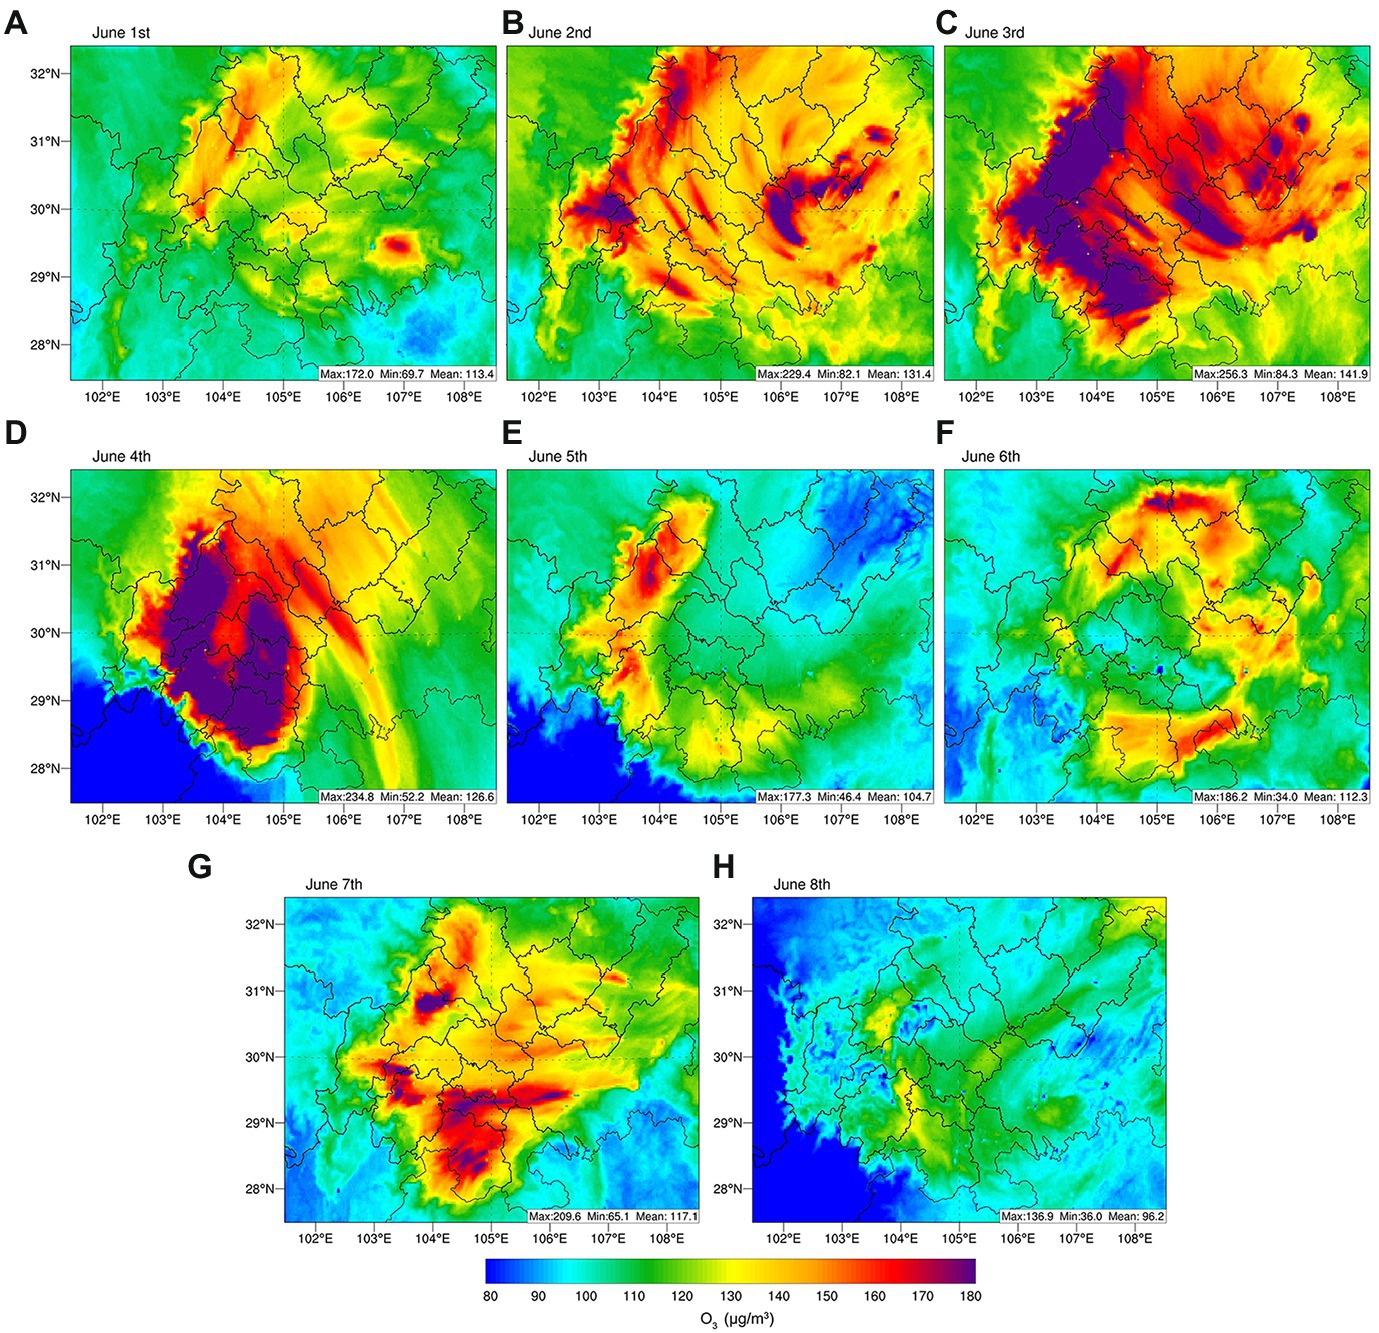
Figure 3. (A-H) Spatial map of ground-level MDA8 O3 concentrations over the SCB from 1 June to 8 June, 2019.
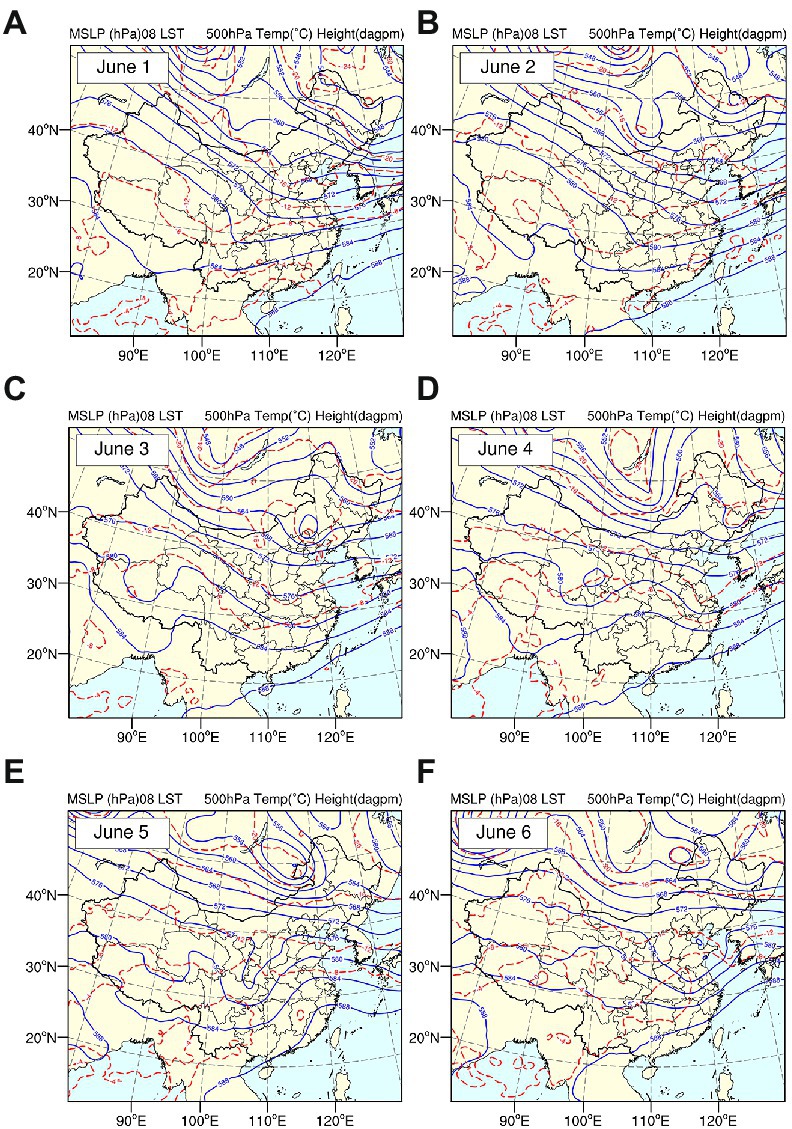
Figure 4. (A-F) Map of synoptic pattern at 500 hPa over China from 1 June to 6 June, 2019.
Source attribution of ambient O3
Previous studies have suggested that both biogenic and anthropogenic emissions significantly contribute to O3 formation (Yang et al., 2020; Wang Y. et al., 2022). However, to effectively reduce ambient O3 levels, it is of vital importance to assess the relative contributions of different source sectors to surface O3 formation. In this section, we evaluated the contributions of biogenic, industrial, power plant, residential, and transport emissions to O3 in the Sichuan Basin, using CMAQ-ISAM to quantify the effect of each source on O3 concentrations.
The contribution of biogenic sources to MDA8 O3 during the summer O3 episode identified by CMAQ-ISAM is presented in Figure 5. It can be clearly seen that the effects of BVOCs became increasingly prominent with the evolution of this episode. When the period turns to the most polluted conditions, BVOCs contributed upwards of 57.9 μg/m3 to MDA8 O3 across the Chengdu Plain and southern SCB, which substantially elevates peak O3 concentrations and affect the build-up of basin-wide episode.
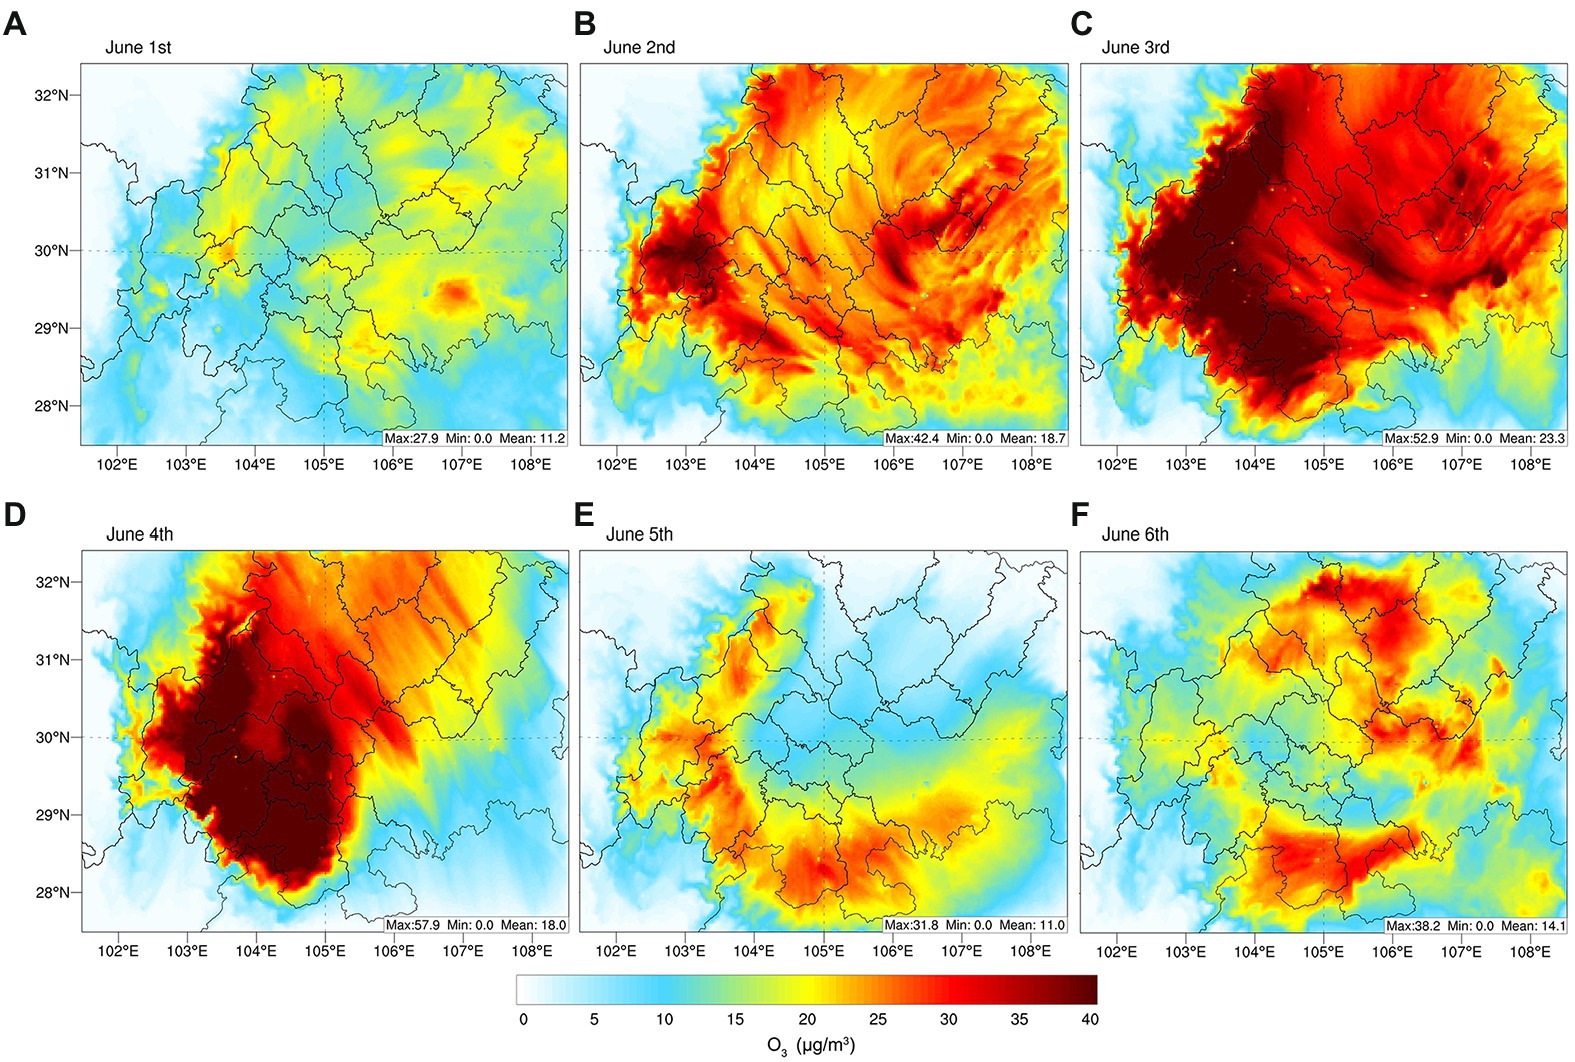
Figure 5. (A-F) BVOC contributions to ground-level MDA8 O3 over the SCB from 1 June to 6 June, 2019.
Figure 6 shows the relative contributions of power, industrial, residential, and transportation sources to MDA8 O3 concentration. For anthropogenic sectors, industrial and transportation sectors exhibit comparable contributions to O3 formation (approximately 30 μg/m3) in the SCB, compared with other sectors. This phenomenon is because industrial emissions account for more than 60% of anthropogenic VOCs compared to residential and transportation emissions. Thus, industrial emissions explained the majority of basin-wide O3 enhancements in affected regions including urban and suburban areas. Unlike industrial emissions, the role of precursors emitted from transportation was much more prominent in urban areas, with peak levels found in metropolitan Chengdu and urban Chongqing (Wang Y. et al., 2022). The contribution of the residential source showed a distinct spatial pattern that exhibited the largest values over southern SCB. By contrast, emissions of power plants made insignificant contributions to MDA8 O3 (<15 μg/m3), which is primarily attributed to substantial reductions in NOx emissions from power plants. Therefore, reducing industrial and transportation emissions is crucial for reducing O3 pollution in the SCB.
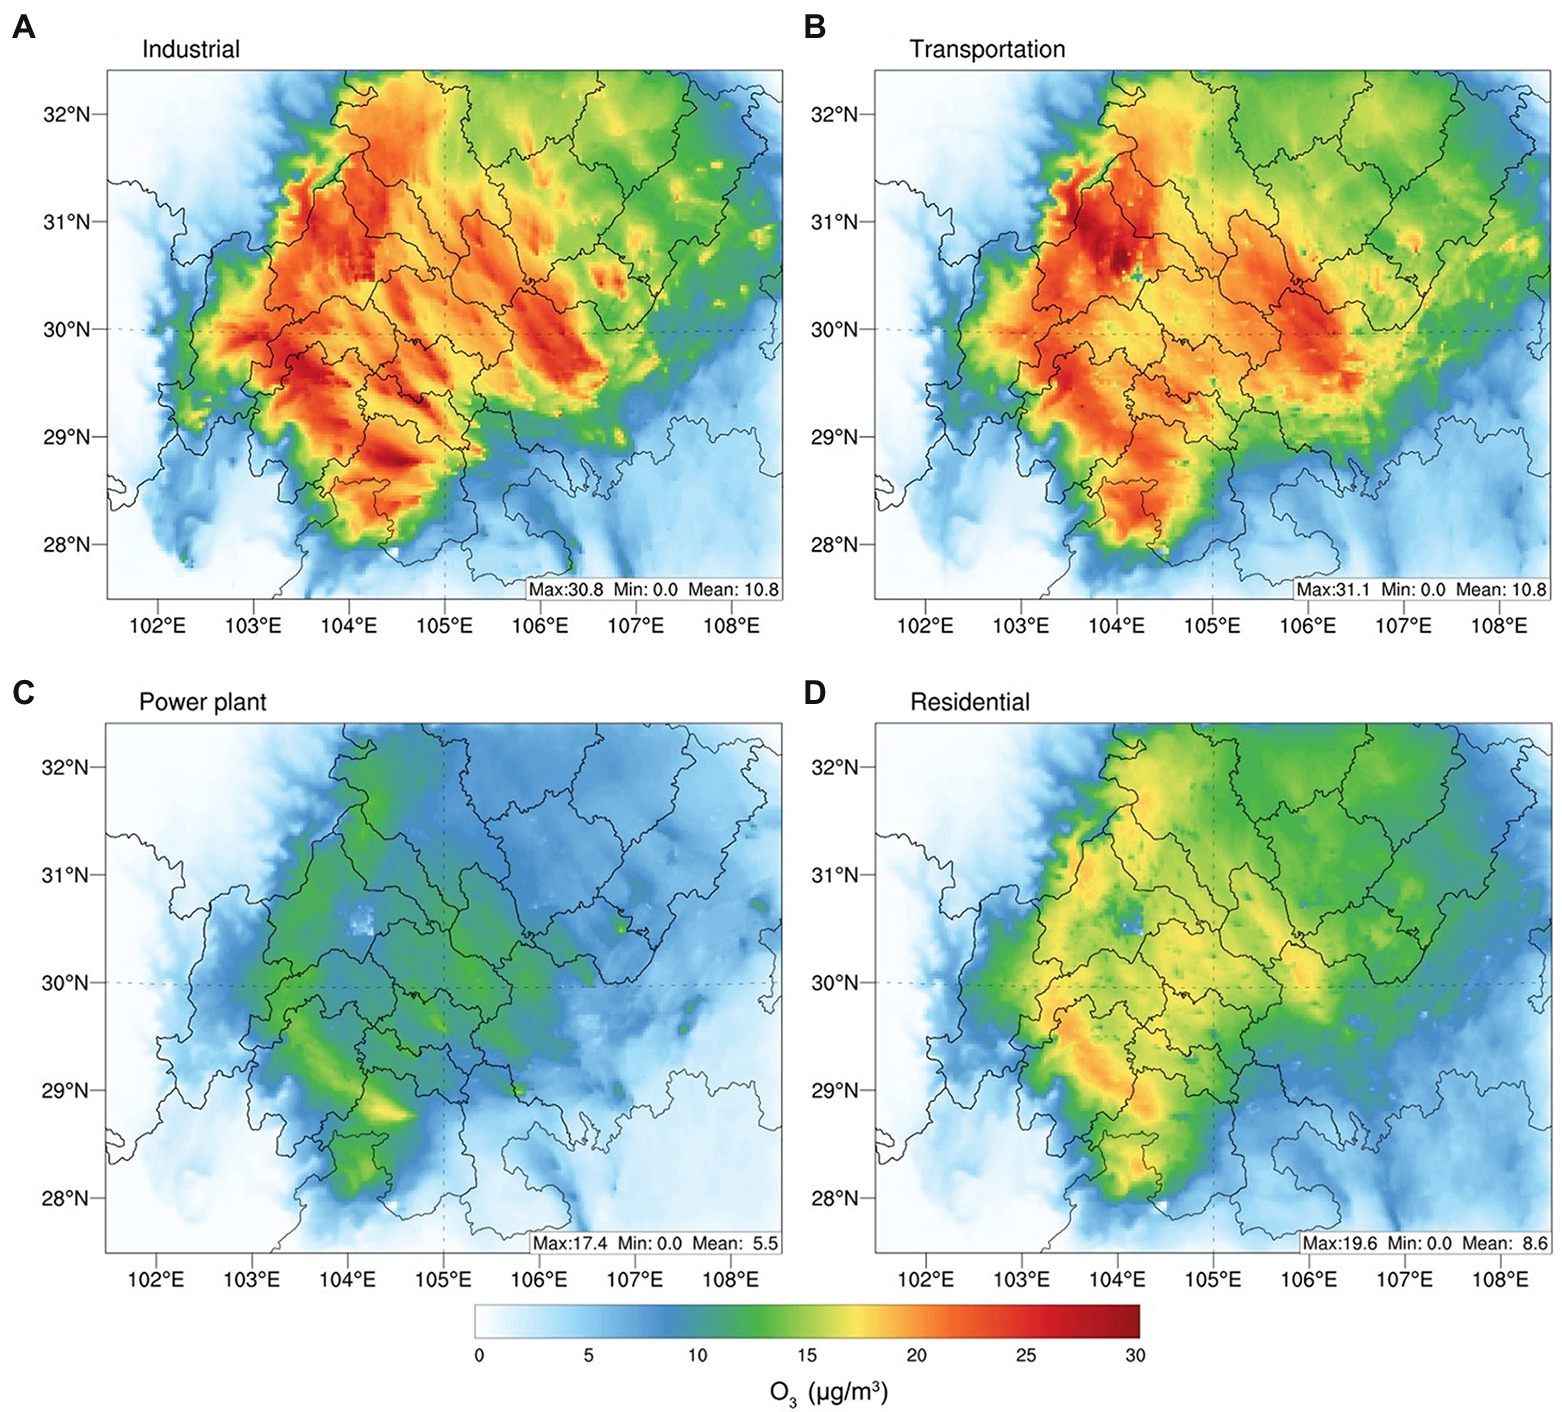
Figure 6. Sector-based anthropogenic contributions to MDA8 O3 concentrations across the SCB from 1 June to 6 June, 2019. (a) Industrial, (b) transportation, (c) power plant, (d) residential.
Conclusion
The interplay of sources, advection, and chemical reactions has limited the full characterization of extreme air pollution events. In this study, we leverage the WRF-CMAQ modeling system to reproduce a summer O3 episode over the SCB in June 2019. This episode was strongly influenced by meteorology-driven processes and elevated anthropogenic emissions, representing a typical basin-wide summer O3 exceedance event. Model evaluation showed that both spatial and temporal changes of meteorological parameters and air pollutants concentrations across the SCB were well captured by the model. We depict that O3 rapidly spiked to peak levels under the synoptic-driven wind fields. In particular, when the southeasterlies prevail in the basin, O3 and precursors streaming westward significantly contribute to the downwind MDA8 O3 levels.
Based on the CMAQ-ISAM model, we find comparable contributions from the transportation and industrial sectors, which both elevate MDA8 O3 by about 30 μg/m3. Emissions of power plants showed moderate effects on O3 formation, with the most significant impacts over southern SCB. Limited impacts of power plant emissions are simulated by CMAQ due to relatively low emission amount. Consistent with prior studies, enhanced BVOC emissions during the episode not only play crucial roles in local O3 formation but can also exert a profound influence on the whole basin due to regional transport, which could even contribute 57.9 μg/m3 to MDA8 O3. Therefore, regulatory measures should keep the focus on cutting precursor emissions of industrial and transportation sectors, aiming for achieving compliance with O3 air quality standards.
Concerning the severe summertime O3 pollution in the SCB, this work provides a comprehensive assessment on O3 formation and identifies the importance of anthropogenic and biogenic sources in this typical exceedance event through high-resolution air quality modeling. However, we note that the CMAQ model tends to underpredict peak O3 levels in urban areas, which potentially underestimates the contribution of anthropogenic sectors. Future studies aid in improving model performance through data assimilation and building emission inventory through a top-down approach is warranted for further understanding of O3 formation in the SCB.
Data availability statement
The raw data supporting the conclusions of this article will be made available by the authors, without undue reservation.
Author contributions
XY, TY, and YL: designed this project and wrote the original draft. MJ, SZ, PS, and LW: conducted formal analysis and edited the manuscript. LY and CW: contributed to the data collection and analysis. YL and LW: supervision and project administration. All authors contributed to the article and approved the submitted version.
Funding
This work was funded by the National Natural Science Foundation of China (nos. 42175174, 41905025, and 42005072), Science and Technology Project of Sichuan Province (no. 2022NSFSC1050), Open Research Fund Program of Plateau Atmosphere and Environment Key Laboratory of Sichuan Province (no. PAEKL-2020-C6), and the Scientific Research Foundation of the Chengdu University of Information Technology (no. KYTZ201823).
Acknowledgments
The authors thank the MEIC team from Tsinghua University for providing the Multi-resolution Emission Inventory for China (MEIC) and Chengdu Plain Urban Meteorology and Environment Observation and Research Station of Sichuan Province for providing ambient monitoring data.
Conflict of interest
The authors declare that the research was conducted in the absence of any commercial or financial relationships that could be construed as a potential conflict of interest.
Publisher’s note
All claims expressed in this article are solely those of the authors and do not necessarily represent those of their affiliated organizations, or those of the publisher, the editors and the reviewers. Any product that may be evaluated in this article, or claim that may be made by its manufacturer, is not guaranteed or endorsed by the publisher.
Footnotes
References
Anenberg, S. C., Horowitz, L. W., Tong, D. Q., and West, J. J. (2010). An estimate of the global burden of anthropogenic ozone and fine particulate matter on premature human mortality using atmospheric modeling. Environ. Health Perspect. 118, 1189–1195. doi: 10.1289/ehp.0901220
Appel, K. W., Bash, J. O., Fahey, K. M., Foley, K. M., Gilliam, R. C., Hogrefe, C., et al. (2021). The community multiscale air quality (CMAQ) model versions 5.3 and 5.3.1: system updates and evaluation. Geosci. Model Dev. 14, 2867–2897. doi: 10.5194/gmd-14-2867-2021
Apte, J. S., Marshall, J. D., Cohen, A. J., and Brauer, M. (2015). Addressing global mortality from ambient PM2.5. Environ. Sci. Technol. 49, 8057–8066. doi: 10.1021/acs.est.5b01236
Atkinson, R. (2000). Atmospheric chemistry of VOCs and NOx. Atmos. Environ. 34, 2063–2101. doi: 10.1016/S1352-2310(99)00460-4
Cohen, A. J., Brauer, M., Burnett, R., Anderson, H. R., Frostad, J., Estep, K., et al. (2017). Estimates and 25-year trends of the global burden of disease attributable to ambient air pollution: an analysis of data from the global burden of diseases study 2015. Lancet 389, 1907–1918. doi: 10.1016/S0140-6736(17)30505-6
Deng, Y., Li, J., Li, Y., Wu, R., and Xie, S. (2019). Characteristics of volatile organic compounds, NO2, and effects on ozone formation at a site with high ozone level in Chengdu. J. Environ. Sci. 75, 334–345. doi: 10.1016/j.jes.2018.05.004
Du, X., Tang, W., Zhang, Z., Li, Y., Yu, Y., Xiao, Z., et al. (2022). Sensitivity modeling of ozone and its precursors over the Chengdu metropolitan area. Atmos. Environ. 277:119071. doi: 10.1016/j.atmosenv.2022.119071
Emery, C., Liu, Z., Russell, A. G., Odman, M. T., Yarwood, G., and Kumar, N. (2017). Recommendations on statistics and benchmarks to assess photochemical model performance. J. Air Waste Manage. Assoc. 67, 582–598. doi: 10.1080/10962247.2016.1265027
Guenther, A. B., Jiang, X., Heald, C. L., Sakulyanontvittaya, T., Duhl, T., Emmons, L. K., et al. (2012). The model of emissions of gases and aerosols from nature version 2.1 (MEGAN2.1): an extended and updated framework for modeling biogenic emissions. Geosci. Model Dev. 5, 1471–1492. doi: 10.5194/gmd-5-1471-2012
Kitagawa, Y. K. L., Pedruzzi, R., Galvão, E. S., de Araújo, I. B., Alburquerque, T. T. D. A., Kumar, P., et al. (2021). Source apportionment modelling of PM2.5 using CMAQ-ISAM over a tropical coastal-urban area. Atmospheric. Pollut. Res. 12:101250. doi: 10.1016/j.apr.2021.101250
Kwok, R. H. F., Baker, K. R., Napelenok, S. L., and Tonnesen, G. S. (2015). Photochemical grid model implementation and application of VOC, NOx and O3 source apportionment. Geosci. Model Dev. 8, 99–114. doi: 10.5194/gmd-8-99-2015
Liu, Y., and Wang, T. (2020). Worsening urban ozone pollution in China from 2013 to 2017 – part 1: the complex and varying roles of meteorology. Atmos. Chem. Phys. 20, 6305–6321. doi: 10.5194/acp-20-6305-2020
Luecken, D. J., Yarwood, G., and Hutzell, W. T. (2019). Multipollutant modeling of ozone, reactive nitrogen and HAPs across the continental US with CMAQ-CB6. Atmos. Environ. 201, 62–72. doi: 10.1016/j.atmosenv.2018.11.060
Pye, H. O. T., Murphy, B. N., Xu, L., Ng, N. L., Carlton, A. G., Guo, H., et al. (2017). On the implications of aerosol liquid water and phase separation for organic aerosol mass. Atmos. Chem. Phys. 17, 343–369. doi: 10.5194/acp-17-343-2017
Richter, A., Burrows, J. P., Nüß, H., Granier, C., and Niemeier, U. (2005). Increase in tropospheric nitrogen dioxide over China observed from space. Nature 437, 129–132. doi: 10.1038/nature04092
Seinfeld, J. H., and Pandis, S. N. (2016). Atmospheric Chemistry and Physics: From Air Pollution to Climate Change. Hoboken, New Jersey: John Wiley & Sons.
Simayi, M., Shi, Y., Xi, Z., Li, J., Yu, X., Liu, H., et al. (2020). Understanding the sources and spatiotemporal characteristics of VOCs in the Chengdu plain, China, through measurement and emission inventory. Sci. Total Environ. 714:136692. doi: 10.1016/j.scitotenv.2020.136692
Song, M., Tan, Q., Feng, M., Qu, Y., Liu, X., An, J., et al. (2018). Source apportionment and secondary transformation of atmospheric nonmethane hydrocarbons in Chengdu, Southwest China. J. Geophys. Res. Atmos. 123, 9741–9763. doi: 10.1029/2018JD028479
Valverde, V., Pay, M. T., and Baldasano, J. M. (2016). Ozone attributed to Madrid and Barcelona on-road transport emissions: characterization of plume dynamics over the Iberian Peninsula. Sci. Total Environ. 543, 670–682. doi: 10.1016/j.scitotenv.2015.11.070
Wang, H., Liu, Z., Wu, K., Qiu, J., Zhang, Y., Ye, B., et al. (2022). Impact of urbanization on meteorology and air quality in Chengdu, a Basin City of southwestern China. Front. Ecol. Evol. 10:845801. doi: 10.3389/fevo.2022.845801
Wang, H., Wu, K., Liu, Y., Sheng, B., Lu, X., He, Y., et al. (2021). Role of heat wave-induced biogenic VOC enhancements in persistent ozone episodes formation in Pearl River Delta. J. Geophys. Res. Atmos. 126. doi: 10.1029/2020JD034317
Wang, Y., Yang, X., Wu, K., Mei, H., De Smedt, I., Wang, S., et al. (2022). Long-term trends of ozone and precursors from 2013 to 2020 in a megacity (Chengdu), China: evidence of changing emissions and chemistry. Atmos. Res. 278:106309. doi: 10.1016/j.atmosres.2022.106309
Wu, K., Wang, Y., Qiao, Y., Liu, Y., Wang, S., Yang, X., et al. (2022). Drivers of 2013–2020 ozone trends in the Sichuan Basin, China: impacts of meteorology and precursor emission changes. Environ. Pollut. 300:118914. doi: 10.1016/j.envpol.2022.118914
Wu, K., Yang, X., Chen, D., Gu, S., Lu, Y., Jiang, Q., et al. (2020). Estimation of biogenic VOC emissions and their corresponding impact on ozone and secondary organic aerosol formation in China. Atmos. Res. 231:104656. doi: 10.1016/j.atmosres.2019.104656
Yang, X., Wu, K., Lu, Y., Wang, S., Qiao, Y., Zhang, X., et al. (2021). Origin of regional springtime ozone episodes in the Sichuan Basin, China: role of synoptic forcing and regional transport. Environ. Pollut. 278:116845. doi: 10.1016/j.envpol.2021.116845
Yang, X., Wu, K., Wang, H., Liu, Y., Gu, S., Lu, Y., et al. (2020). Summertime ozone pollution in Sichuan Basin, China: meteorological conditions, sources and process analysis. Atmos. Environ. 226:117392. doi: 10.1016/j.atmosenv.2020.117392
Zheng, B., Cheng, J., Geng, G., Wang, X., Li, M., Shi, Q., et al. (2021). Mapping anthropogenic emissions in China at 1 km spatial resolution and its application in air quality modeling. Sci. Bull. 66, 612–620. doi: 10.1016/j.scib.2020.12.008
Keywords: ozone, Sichuan Basin, CMAQ, emission regulation, air quality
Citation: Yang X, Yang T, Lu Y, Jiang M, Zhang S, Shao P, Yuan L, Wang C and Wang L (2022) Assessment of summertime ozone formation in the Sichuan Basin, southwestern China. Front. Ecol. Evol. 10:931662. doi: 10.3389/fevo.2022.931662
Edited by:
Michael MacKinnon, University of California, United StatesReviewed by:
Bosi Sheng, Sun Yat-sen University, ChinaYing Wang, Nanjing University of Information Science and Technology, China
Copyright © 2022 Yang, Yang, Lu, Jiang, Zhang, Shao, Yuan, Wang and Wang. This is an open-access article distributed under the terms of the Creative Commons Attribution License (CC BY). The use, distribution or reproduction in other forums is permitted, provided the original author(s) and the copyright owner(s) are credited and that the original publication in this journal is cited, in accordance with accepted academic practice. No use, distribution or reproduction is permitted which does not comply with these terms.
*Correspondence: Yaqiong Lu, eWFxaW9uZ0BpbWRlLmFjLmNu