
94% of researchers rate our articles as excellent or good
Learn more about the work of our research integrity team to safeguard the quality of each article we publish.
Find out more
ORIGINAL RESEARCH article
Front. Ecol. Evol., 04 August 2022
Sec. Population, Community, and Ecosystem Dynamics
Volume 10 - 2022 | https://doi.org/10.3389/fevo.2022.930888
This article is part of the Research TopicEVOLMAR 2020 - The First Italian Congress on Marine EvolutionView all 7 articles
 Alessio Iannucci1†
 Anik Saha1†
 Stefano Cannicci1,2*
 Arianna Bellucci1
 Christine L. Y. Cheng2
 Ka Hei Ng2
 Sara Fratini1
Crustaceans are characterized by some of the most variable genome sizes among animals. Significant relationships between genome size and specific eco-physiological and morphological features have been described in many crustacean taxa, such as Amphipoda, Ostracoda, Cladocera, and Copepoda. A consistent pattern of genome size variation is yet to be found, however, in one of the most specious order of crustaceans, the Decapoda. We investigated how genome size is related to selected eco-physiological and life-history traits in species belonging to this order. We analyzed the respiratory, excretory, and developmental adaptations of 179 decapod species inhabiting shallow marine, deep marine, freshwater, intertidal, and terrestrial habitats. Our results show that the genome size is significantly larger in decapods that have a direct development. Moreover, in Anomura, Astacidea, and Brachyura we found larger genome sizes in species (i) living in freshwater habitats, (ii) using gills as a strictly water-breathing organs, and (iii) presenting a direct development. While species that (i) live in shallow waters, and intertidal and terrestrial habitats, (ii) have some degrees of air-breathing adaptations, namely gills that can exchange oxygen with air if wet or branchiostegal lungs, and (iii) possess an indirect or extended development are characterized by significantly smaller genomes. Our analyses show that developmental complexity affects genome size in decapods, and that multiple eco-physiological and life-history traits correlate with genome size in Anomura, Astacidea, and Brachyura.
Genome size, the bulk amount of DNA in the genome, displays an extremely high variability across the Tree of Life (Gregory, 2021). Comparative studies of genome size variation revealed universal patterns of correlations between genome size and cytological traits across a variety of taxa, spanning from plants to animals. A positive correlation between genome size and nucleus/cell size has been reported, as well as a negative relationship between genome size and cellular division rate (Cavalier-Smith, 1985; Lynch, 2007; Gregory, 2021). When life-history and eco-physiological traits are considered, however, their correlation patterns with genome size variation often become unpredictable and universal trends are elusive. These loose correlations suggest that genome size is affected by multiple synergistic factors that do not act likewise across taxa (Grime and Mowforth, 1982; Smith and Gregory, 2009; Herben et al., 2012; Suda et al., 2015; Alfsnes et al., 2017; Lertzman-Lepofsky et al., 2019; Glazier, 2021). For this reason, comparative studies among low taxonomic levels (e.g., among families) can help to disentangle the factors guiding genome size evolution and adaptation.
Crustaceans are characterized by some of the most variable genome sizes among animals (Jeffery and Gregory, 2014), with values ranging from 0.14 picograms (pg) for the copepod Cyclops kolensis to 64.62 pg for the amphipod Ampelisca macrocephala (Gregory, 2021). Some studies focused on specific crustacean orders demonstrated a relationship between genome size and their ecological, physiological and morphological features. For example, genome size is related to body size, latitude, temperature, and water depth for the Amphipoda (Hessen and Persson, 2009; Jeffery et al., 2017b; Ritchie et al., 2017; Hultgren et al., 2018; Hancock et al., 2021) and to body size in the Ostracoda and Cladocera (Hessen and Persson, 2009; Jeffery et al., 2017a), while it relates to metabolic and developmental rates, body size and latitude in the Copepoda (Gregory et al., 2000; White and McLaren, 2000; Wyngaard et al., 2005; Hultgren et al., 2018). A consistent correlation pattern is yet to be found in one of the most specious order of crustaceans, the Decapoda.
The order Decapoda includes more than 14,750 extant species, most of which belong to the suborders Caridea (true shrimps), Anomura (hermit crabs), and Brachyura (true crabs) (De Grave et al., 2009). Decapods inhabit a broad variety of habitats, including oceanic waters, seafloors, coral reefs, mangroves and estuaries, intertidal muddy and sandy areas, freshwater streams and lakes, and even terrestrial ecosystems (Martin and Davis, 2001; De Grave et al., 2009). Their ecological plasticity is reflected in a wide range of morphological, physiological, reproductive, and behavioral traits. Indeed, the importance of decapods is unquestionable also from an economic point of view, with many species being extensively fished and commercialized worldwide (Bondad-Reantaso et al., 2012) or marketed as ornamental animals (Calado et al., 2003). These characteristics make the Decapoda an interesting model group in the study of crustacean evolution, including the evolution of genome size and complexity.
In Decapoda, genome size did not show a clear correlation with any of the life-history and eco-physiological traits investigated so far. In this group, genome size does not correlate with body size (Hessen and Persson, 2009; Hultgren et al., 2018), latitude (with the exception of caridean shrimps, Hultgren et al., 2018), or habitat (Hessen and Persson, 2009; Hultgren et al., 2018), although the categories of habitat considered thus far were limited to marine/freshwater or artic/temperate. Recent studies found that life-history traits, such as direct/indirect development and the number of larval stages, do correlate with variation in genome size (Hultgren et al., 2018, 2021). This correlation, however, was not present when the influence of phylogeny was accounted for and excluded from the analyses. An absence of correlation between genome size and life-history traits was also reported by Hessen and Persson (2009).
The high diversity in morphology, physiology, and ecology of Decapoda calls for a broad analysis to clarify the role of genome size in the diversification of this taxon. We hypothesize that multiple comparisons among species with different life-style characteristics and belonging to different families should lead to resolutive outcomes, as underlined by Rees et al. (2007). Here we tested possible relationships between the genome size and the ecological adaptations related to respiration, excretion, and reproduction of 179 species of Decapoda inhabiting marine, freshwater, intertidal and terrestrial habitats. The physiological traits and habitat categories were chosen ad hoc to represent the huge range of Decapoda environmental plasticity and were never tested before. Developmental mode and number of planktonic larvae, already tested in Hessen and Persson (2009) and Hultgren et al. (2018), were also considered to test whether a broader sample set would show any hitherto hidden pattern of correlation between these traits and genome size. We also provided new genome size data for three species of decapods using flow cytometry. To our knowledge, our dataset comprises all the species of Decapoda for which the genome size is currently available.
Data on genome size were collected for 176 decapods from the Animal Genome Size Database (Gregory, 2021) and from literature search (Supplementary Table 1). To our knowledge, this dataset includes all the decapod species for which C-values are currently available. The species recorded belong to the suborders Dendrobranchiata (superfamily Penaeoidea) and Pleocyemata (infraorders Achelata, Anomura, Astacidea, Brachyura, and Caridea) for a total of 44 families (∼20% of all families of decapods). Genome size was expressed as haploid DNA contents (C-values, in picograms). For the few species we found multiple different genome size values, we calculated an average C-value when the difference among values was less than 2 pg. Otherwise, we selected the measures obtained most recently, through flow cytometry (FCM) or Feulgen densitometry (FIAD).
We also added new data on three brachyuran crab species, the sesarmid Chiromantes haematocheir and the ocypodids Gelasimus borealis and Paraleptuca splendida, by measuring genome size using flow cytometry. Hemolymph was collected from four individuals of C. haematocheir and three individuals of G. borealis and P. splendida in tubes containing anticoagulant buffer (0.1 M glucose, 30 mM trisodium citrate, 26 mM citric acid, 10 mM EDTA and 0.1M NaCl) in a 1:1 ratio. Erythrocyte nuclei from Gallus gallus were added to cell suspensions as an internal size standard and stained using propidium iodide at a final concentration of 50 ppm before incubation in the dark for 20 min at 4°C. The suspensions were run on a BD FACSMelody Cell Sorter (BD Biosciences, NJ, United States) and the relative fluorescence of nuclei peaks of interest were isolated using the software BD FACSDIVA v 6.1.3. C-values of the samples were estimated by comparing the fluorescence intensity of the target sample with the fluorescence intensity of the internal size standard.
Taxonomy of all the species was checked on the World Register of Marine Species database (WoRMS Editorial Board, 2022)1, and no more valid species names or incorrect taxonomic classification were updated. For each species we collected data on habitat, respiratory, and excretory adaptations, developmental mode and, when available, number of larval stages. This information was retrieved from online databases (Legall and Poupin, 2002; WoRMS Editorial Board, 2022), both scientific and gray literature (see Supplementary Table 1) and knowledge by the authors.
We classified the habitats into five categories: freshwater, terrestrial, intertidal (i.e., the area comprises between high and low tide marks), shallow-mid marine waters (0–200 m), and deep sea waters (more than 200 m). The distinction between shallow-mid and deep waters was fixed at 200 m, i.e., the maximum depth of the photic zone (Thomas, 2019). The few species of the dataset living in brackish water were classified as shallow-mid marine water species.
In terms of respiration, species were divided into three categories based on their respiratory organs and on how they function: (a) gills only capable to breathe underwater (henceforth termed “gills”); (b) gills capable to extract oxygen also from air, for a limited amount of time, if kept wet and gills kept oxygenated through branchial chamber water recirculation (henceforth termed “wet gills”); (c) and branchiostegal lung (Supplementary Table 1). Gills are the most common respiratory organ in aquatic crustaceans and are found in representatives from all the superfamilies included in our dataset. Here haemolymph flows inside thin lamellae, located inside the branchial chamber, and exchange oxygen with the water constantly recirculated in the chamber by the movement of the scaphognathite, the leaflike exopodite of the second maxilla. “Wet gills” are typical of some brachyuran crabs that can stand out of water for relatively long periods of time provided that the gills and branchial chamber are wet. In these species, gills are smaller than the ones of marine species, with bulges on the surface of the lamellae, to prevent their collapse out of the water (Hsia et al., 2013). Among species possessing “wet gills”, some sesarmid crabs also show a reticulate pattern of setae on their branchiostegites. This pattern is used to recirculate water contained in their branchial chambers to maintain a high oxygen level of this water when the animal is emersed (Hawkins et al., 1982; Hawkins and Jones, 1982). Branchiostegal lungs are typical of terrestrial hermit crabs and brachyuran crabs: these species, in addition to the gills, developed a thick and well-vascularized epithelium, located inside an enlarged branchial chamber, through which air-breathing is possible (Farrelly and Greenaway, 1994; Paoli et al., 2015). Most of this linings tissue consists of large haemolymph-filled sinuses, bound by connective tissue. The outer cuticle and the epithelium lining this cuticle are both very thin and the blood-air diffusion distance results very short (Farrelly and Greenaway, 1994).
Regarding the excretory mode, we classified species as obligate ammonotelic or not strictly ammonotelic (Supplementary Table 1). Species belonging to the first category excrete nitrogen through ammonia while species falling in the second category are able to shift from ammonia to urea production for nitrogen excretion, depending on water availability and salinity (Weihrauch et al., 2004). Only one species included in our dataset (the coconut crab Birgus latro) is uricotelic (i.e., it excretes nitrogen mostly in the form of uric acid). In our statistical analyses this species was also classified as not strictly ammonotelic.
Finally, the developmental mode was categorized as direct (no larval stages) and indirect (presence of larval stages). For the totality of the species belonging to the three decapod infraorders of Anomura, Brachyura, and Astacidae, which develop through a series of zoea stages into the megalopa, we also retrieved the effective number of larval stages (Supplementary Table 1). This allowed us to categorize the developmental mode of these infraorders into direct (no larval stages), abbreviated (number of zoeae between 1 and 4), and extended (more than 4 zoeae).
Firstly, we reconstructed the phylogenetic relationships among species included in our dataset retrieving taxonomic information from the Open Tree of Life2 using the package rotl v3.0.12 (Michonneau et al., 2016). The length of the branches of the tree were calculated according to Grafen’s method (Grafen, 1989), i.e., the height of each node is calculated as the number of leaves of the subtree minus one, with the package ape v5.6-1 (Paradis et al., 2004). Then we checked possible phylogenetic correlations of our dependent and independent variables (C-value, habitat, respiration, excretion, developmental mode, number of larval stages) using Pagel’s λ (Pagel, 1994). Pagel’s λ is a scaling parameter of phylogenetic dependence that varies continuously from 0 (the null expectation) to 1. λ = 0 means that the trait varies independently of phylogeny, while λ = 1 indicates that there is a strong phylogenetic signal. λ values slightly greater than one are also possible because λ is not a correlation but a scaling factor for a correlation and the value is subject to constraints determined by characteristics of the tree. The index was estimated using the phylosig function under the phytools package v1.0-1 and the fitDiscrete function under the geiger package v2.0.7 (Pennell et al., 2014) for the continuous and discrete variables, respectively.
We examined the association between the response variable (genome size, log-transformed) and the predictor categorical variables (habitat, respiratory adaptations, excretion mode, and developmental mode) running the phylogenetic generalized least squares (PGLS) model. To minimize the effects of wrong model selection, for each model, we explored the contribution of phylogeny by fitting λ simultaneously with the PGLS test (Revell, 2010). We fitted models with λ = 0 (phylogenetic independence) and λ = 1 (trait evolution according to Brownian motion). Models were fitted using the gls function of the nlme package v3.1-158 (Pinheiro et al., 2022) using corPagel as a correlation structure. Considering that the PGLS algorithm does not allow for unresolved branching, prior to run each model we removed polytomies within the dendrogram using the multi2di function under the phytools package v1.0-1. We selected the most informative models using a multimodel inference approach by means of the lowest Akaike’s Information Criterion (AIC) (Burnham and Anderson, 2004). We assessed the overall significance of each PGLS model by conducting a full vs. null model comparison. The overall P-value was obtained by comparing the full model–which is simply the model fitted–and the null model–which is a model comprising only the intercept. A significant P-value indicates that at least a predictor variable has a significant effect on the response variable (Mundry, 2014). We then ran ANOVA tests, using the anova function of the nlme package v3.1-153, to identify the effect of each specific predictor variable within the model. Post hoc pairwise comparisons were applied to uncover differences among each pair of means using estimated marginal means applying Bonferroni correction using the function emmeans in the package emmeans v1.7.4-1. PGLS models were run both using the complete Decapoda dataset and on a subset including species belonging to the infraorder Anomura, Brachyura, and Astacidea (∼57% of the complete dataset). We additionally focused our analyses on these three infraorders as they display the widest range of physiological and ecological traits within Decapoda. As specified above, for this subset we also collected the effective number of larval stages. To assess the relationship between genome size (log-transformed) and number of larval stages, transformed into log10(X + 1), we ran the phylogenetically independent contrasts (PICs) (Felsenstein, 1985). The analysis was implemented in the ape package v5.6-1. Summary statistics of the two datasets are reported in Supplementary Table 2. Dendrograms and boxplots were built using the packages ggtree v3.3.1, ggnewscale v0.4.6, and ggplot2 v3.3.5 in R v4.1.2.
The haploid genome sizes of the three brachyuran crabs, C. haematocheir, G. borealis, and P. splendida, newly obtained by flow cytometry were 4.60 ± 0.12 pg, 1.16 ± 0.06 pg, and 2.02 ± 0.07 pg, respectively. These results are coherent with Iannucci et al. (2020) that recorded a higher number of chromosomes for the sesarmid C. hematocheir in comparison to G. borealis.
A taxonomy-based dendrogram including all the species analyzed in this study was built (Figure 1). Considering the complete dataset (N = 179), we recorded a 41-fold variation in genome size (1.16–40.89 pg). Largest genome sizes (C-value > 10 pg) were found for the family Astacidae; the anomuran family Munidopsidae; the brachyuran families Aethridae and Polybiidae; and the caridean families Alvinocarididae, Bythocarididae, Crangonidae, Lysmatidae, Pandalidae, and Thoridae. Conversely, smallest genome sizes (C-value < 2 pg) were recorded for the brachyuran families Cancridae, Gecarcinidae, Leucosiidae, Menippidae, and Plagusiidae (Figure 2). The largest genome sizes were recorded for the carideans Sclerocrangon ferox and Bythocaris irene (40.89 and 38.47 pg, respectively), with the brachyuran crabs Carcinus aestuarii and G. borealis displaying the smallest genomes (1.16 pg).
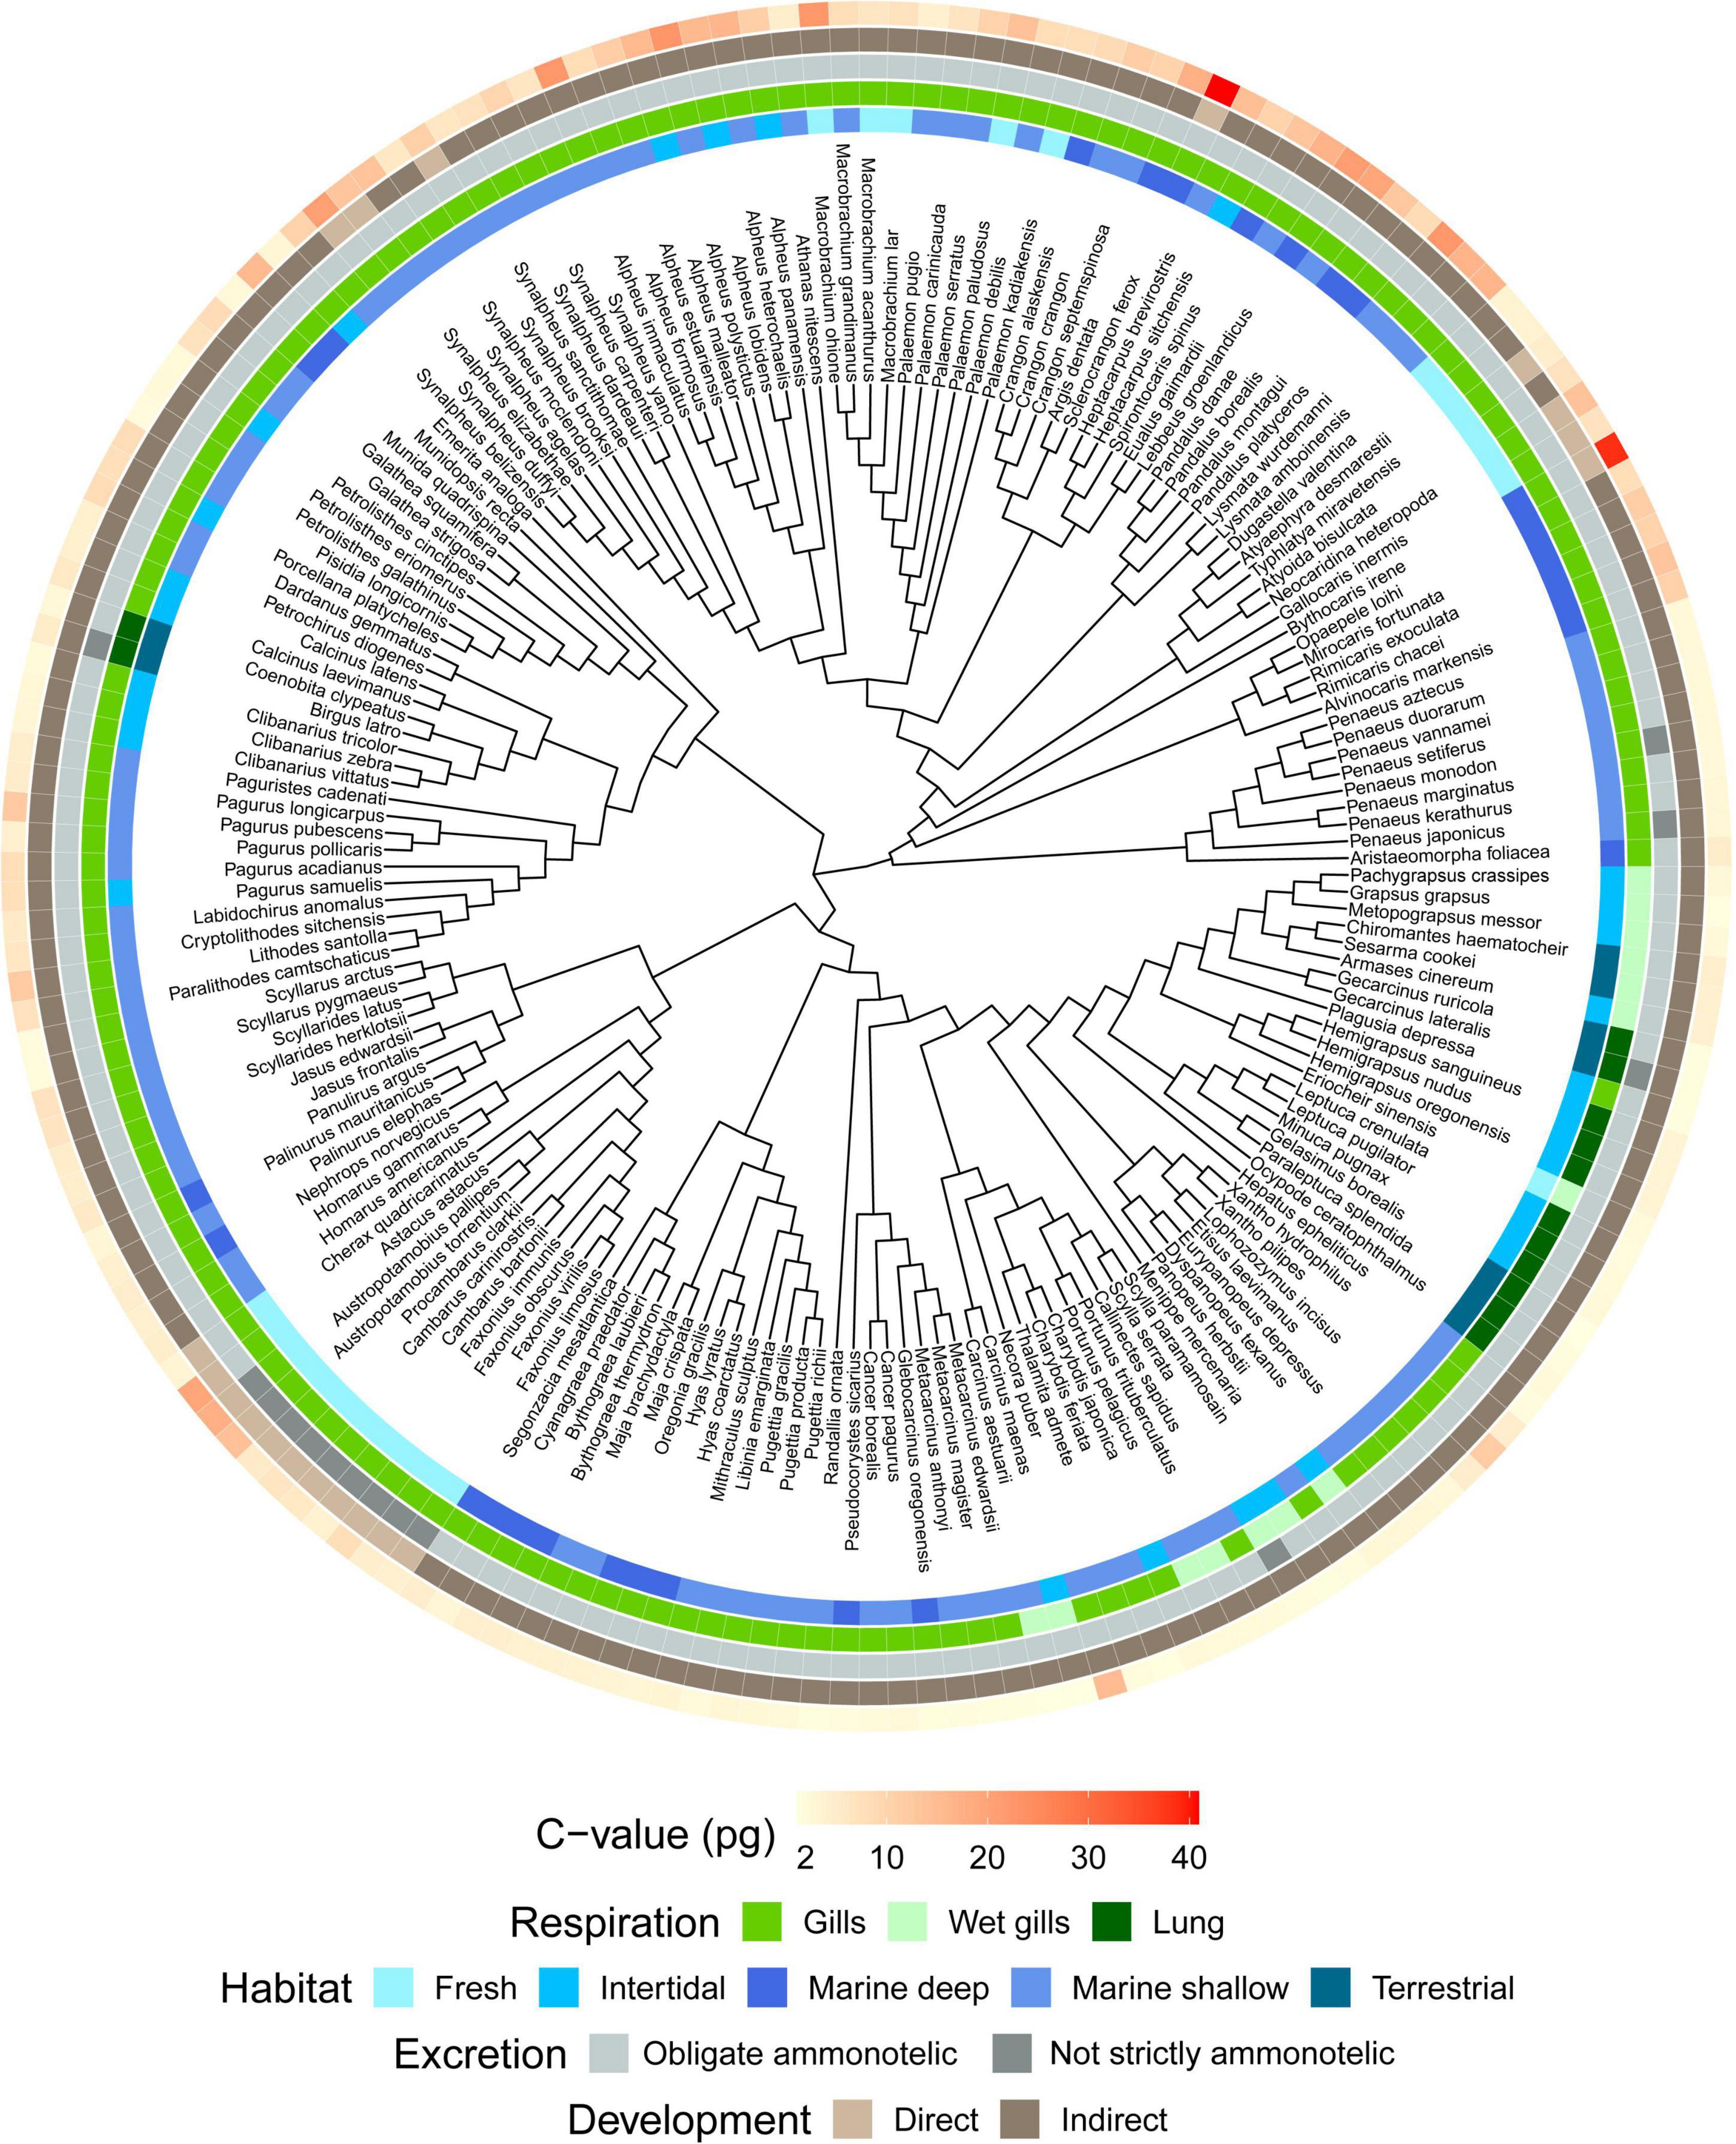
Figure 1. Taxonomy-based dendrogram of decapods with known genome size (n = 179). C-values are shown in red gradient (minimum/light red = 1.16 pg, maximum/dark red = 40 pg). Specific C-values are reported in Supplementary Table 1. Differences in habitat, respiration and developmental mode are also plotted on the dendrogram using different colors.
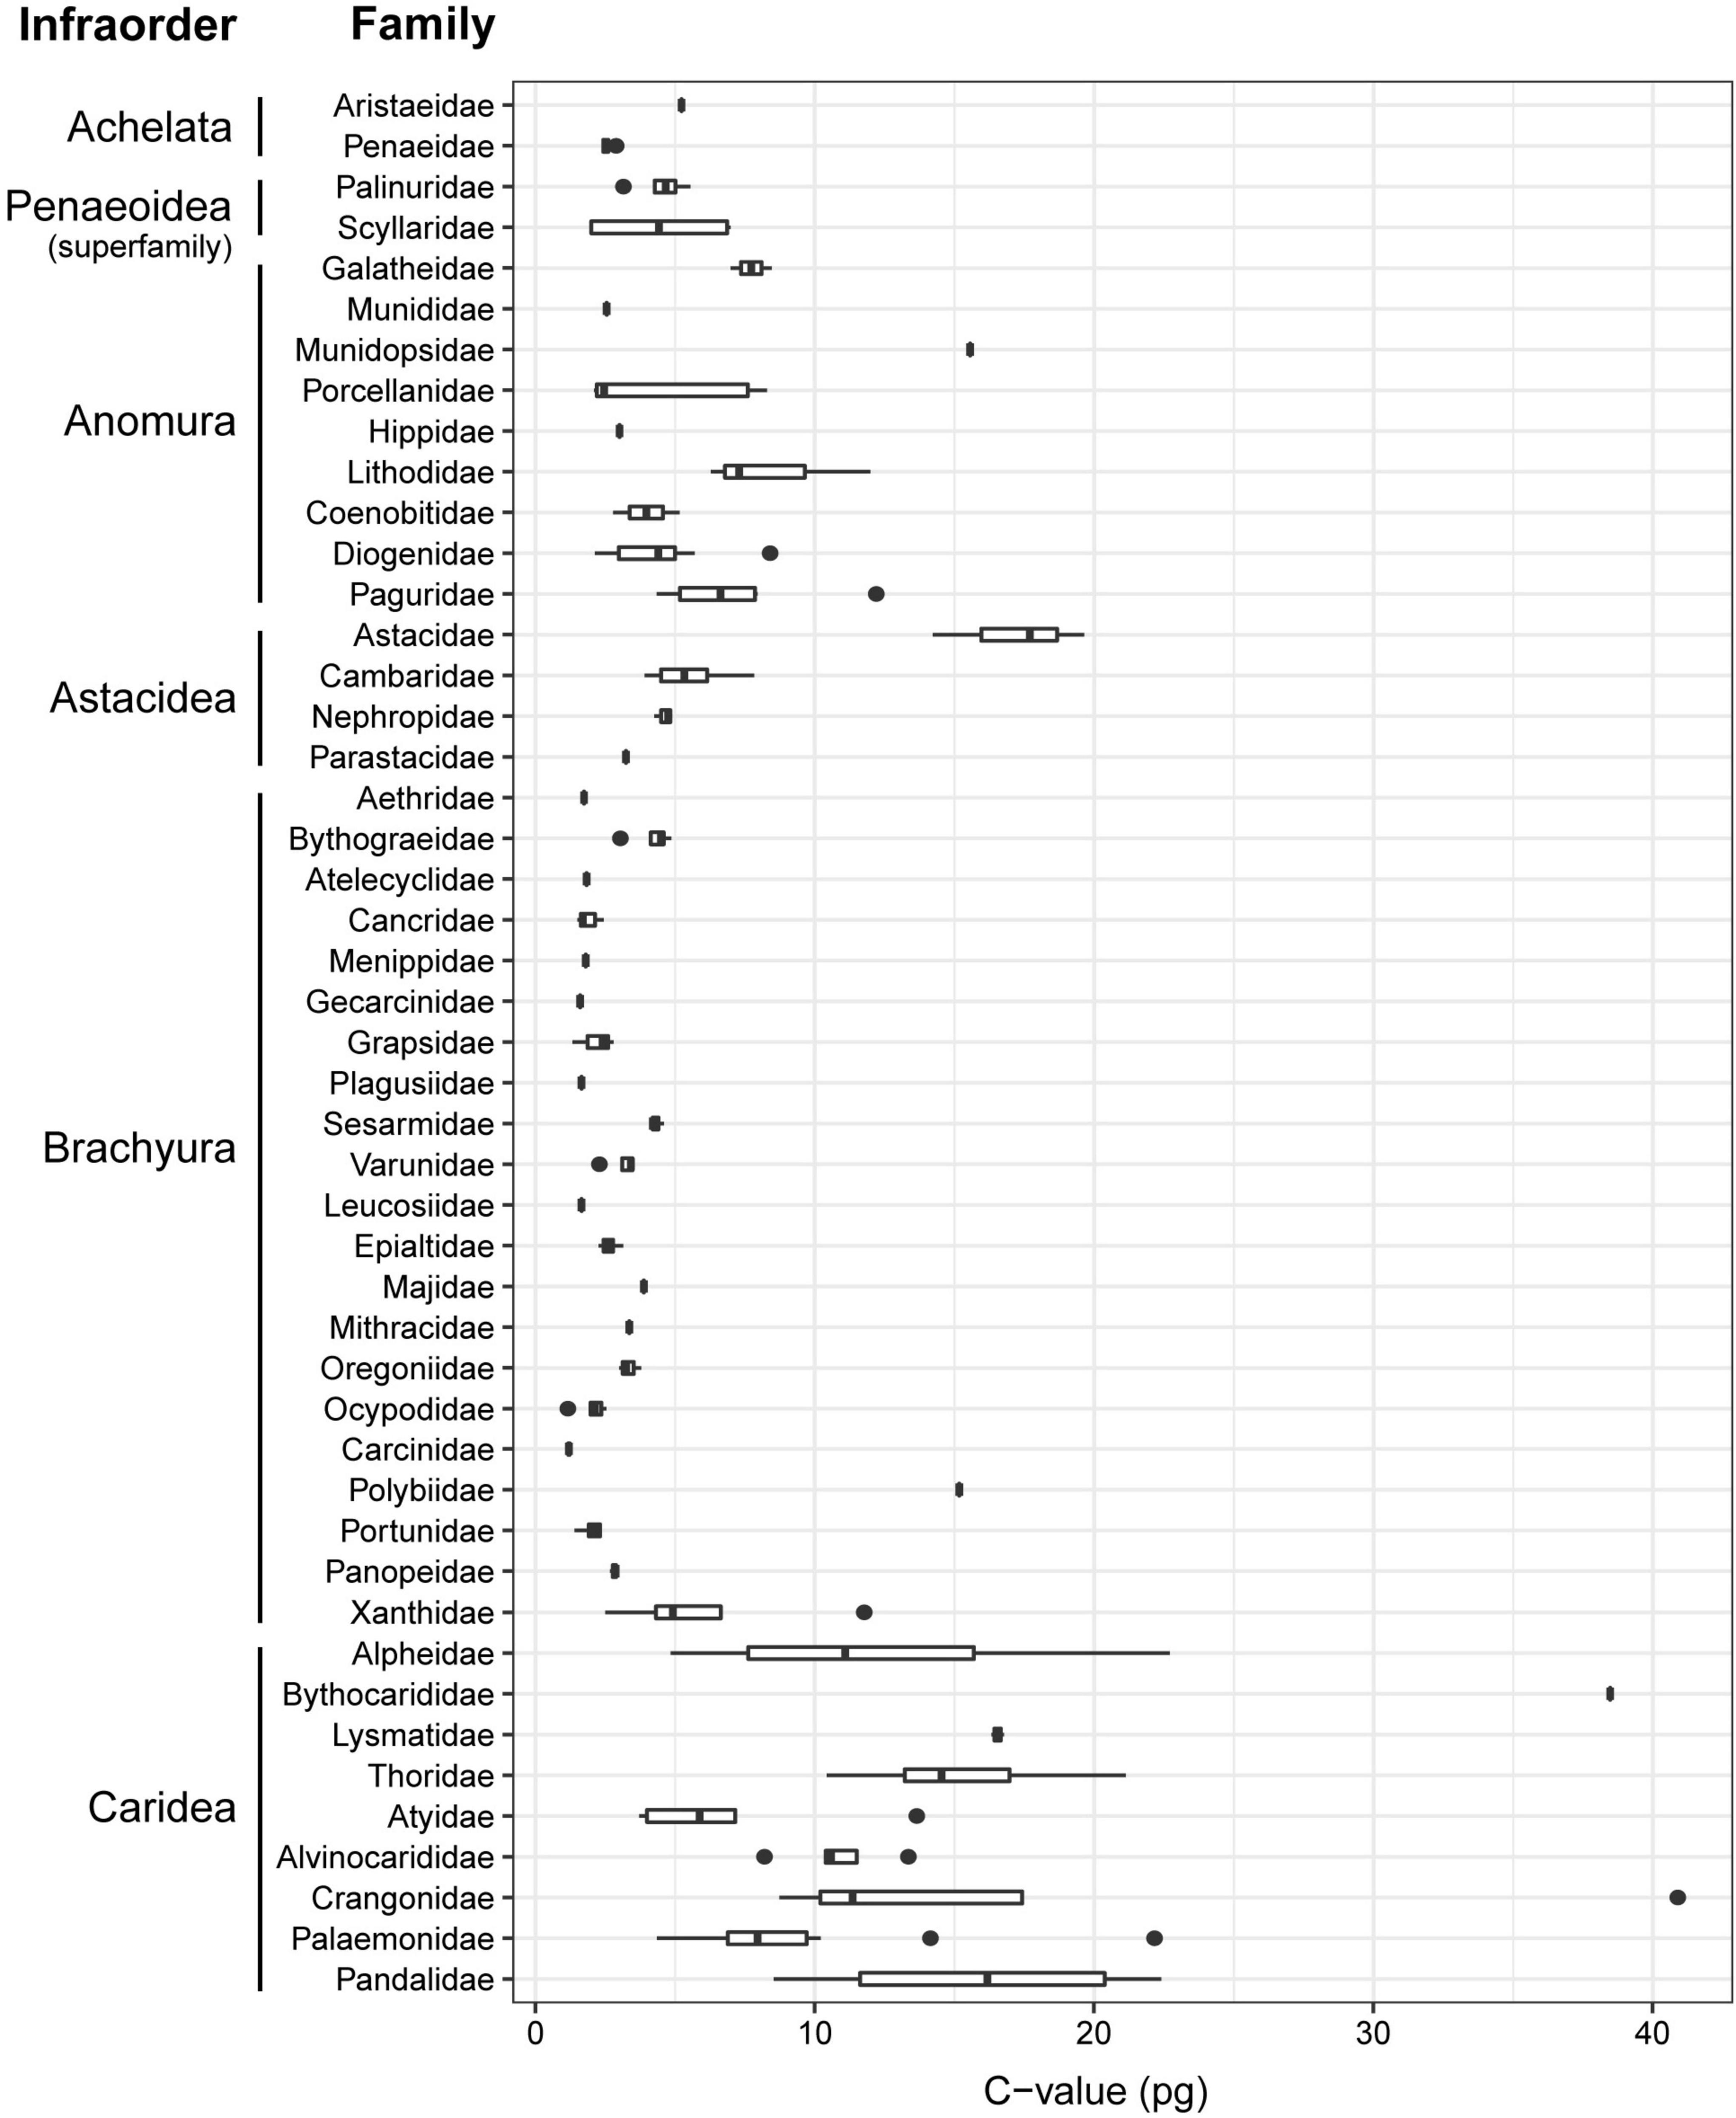
Figure 2. Range of genome size (pg, uncorrected values) for the decapod families included in this study. Where present, the vertical line within the box indicates the median and the horizontal whiskers the 95% confidence intervals.
For the complete Decapoda dataset, Pagel’s λ indicated a strong phylogenetic correlation for all the variables (Table 1). Based on the lowest AIC, the best-fitted models (ΔAICc < 4) included phylogeny as covariate (λ = 1, Table 2). The best-fitted PGLS model included only development as a predictor variables, while the other models with a ΔAICc < 4 were multivariate models always including the variable development. The results of the ANOVA tests for the best-fitted models are reported in Table 3. For all the models, the tests showed that only the developmental mode accounted for genome size variation, with species with direct development possessing significantly larger genome sizes than species with an indirect development (Contrast: direct-indirect; Estimate: 0.27 ± 0.06; df: 176; t-ratio: 4.39; P < 0.001) (Figure 3).
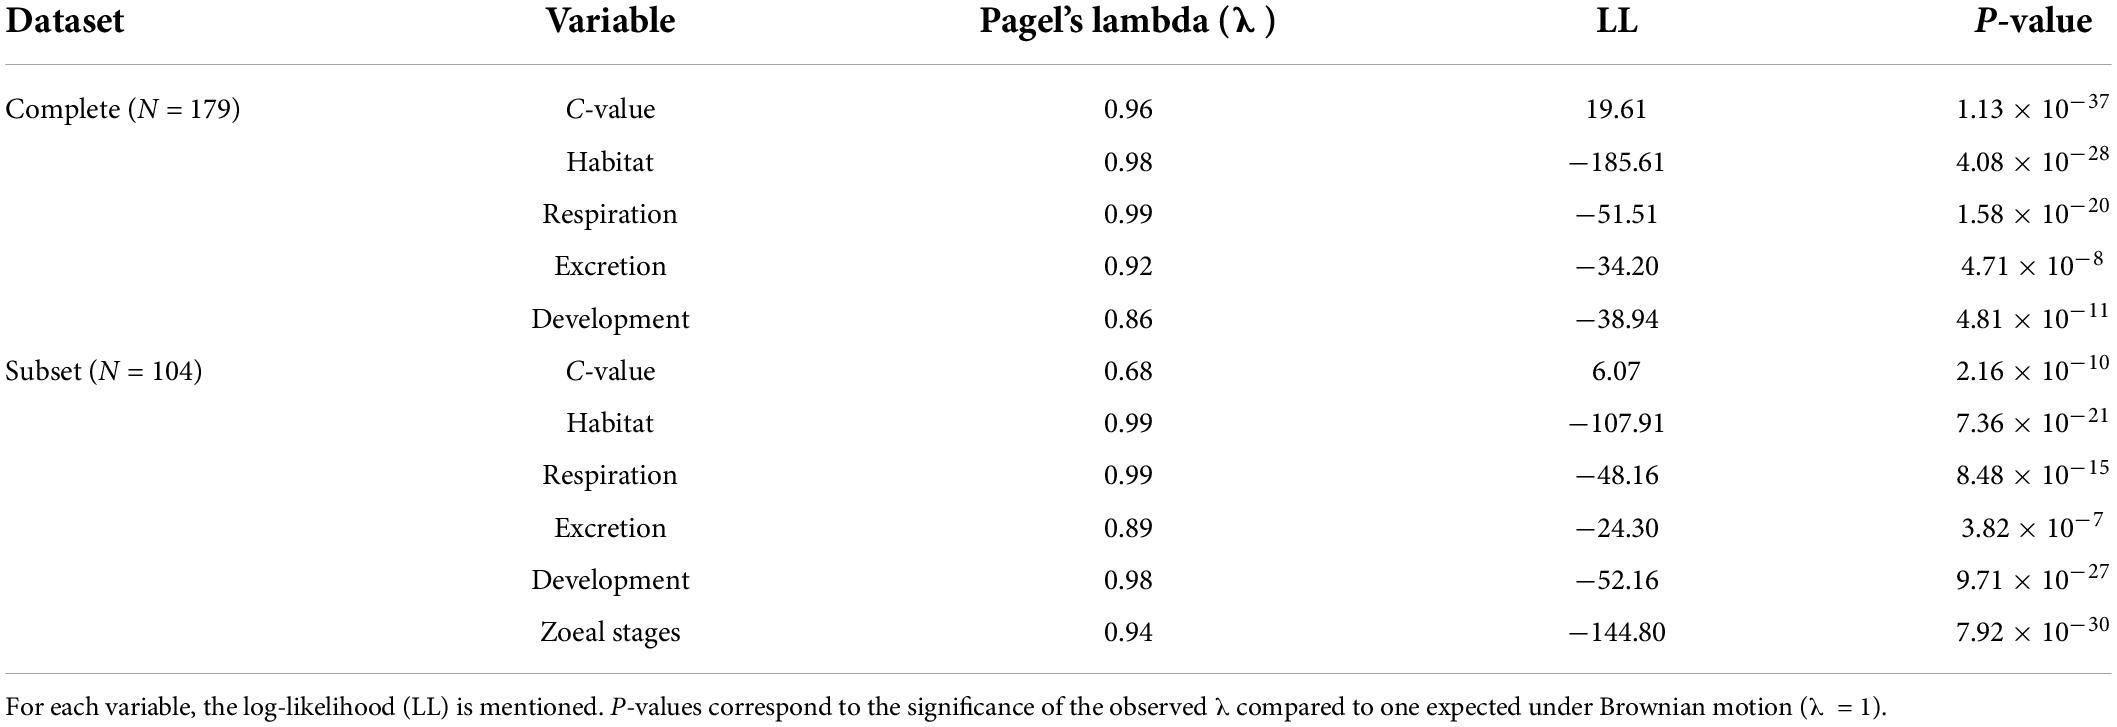
Table 1. Values of phylogenetic signal, estimated as Pagel’s lambda (λ), for the response and the predictor variables used in the models’ correlation structure both in the complete dataset and in the subset.
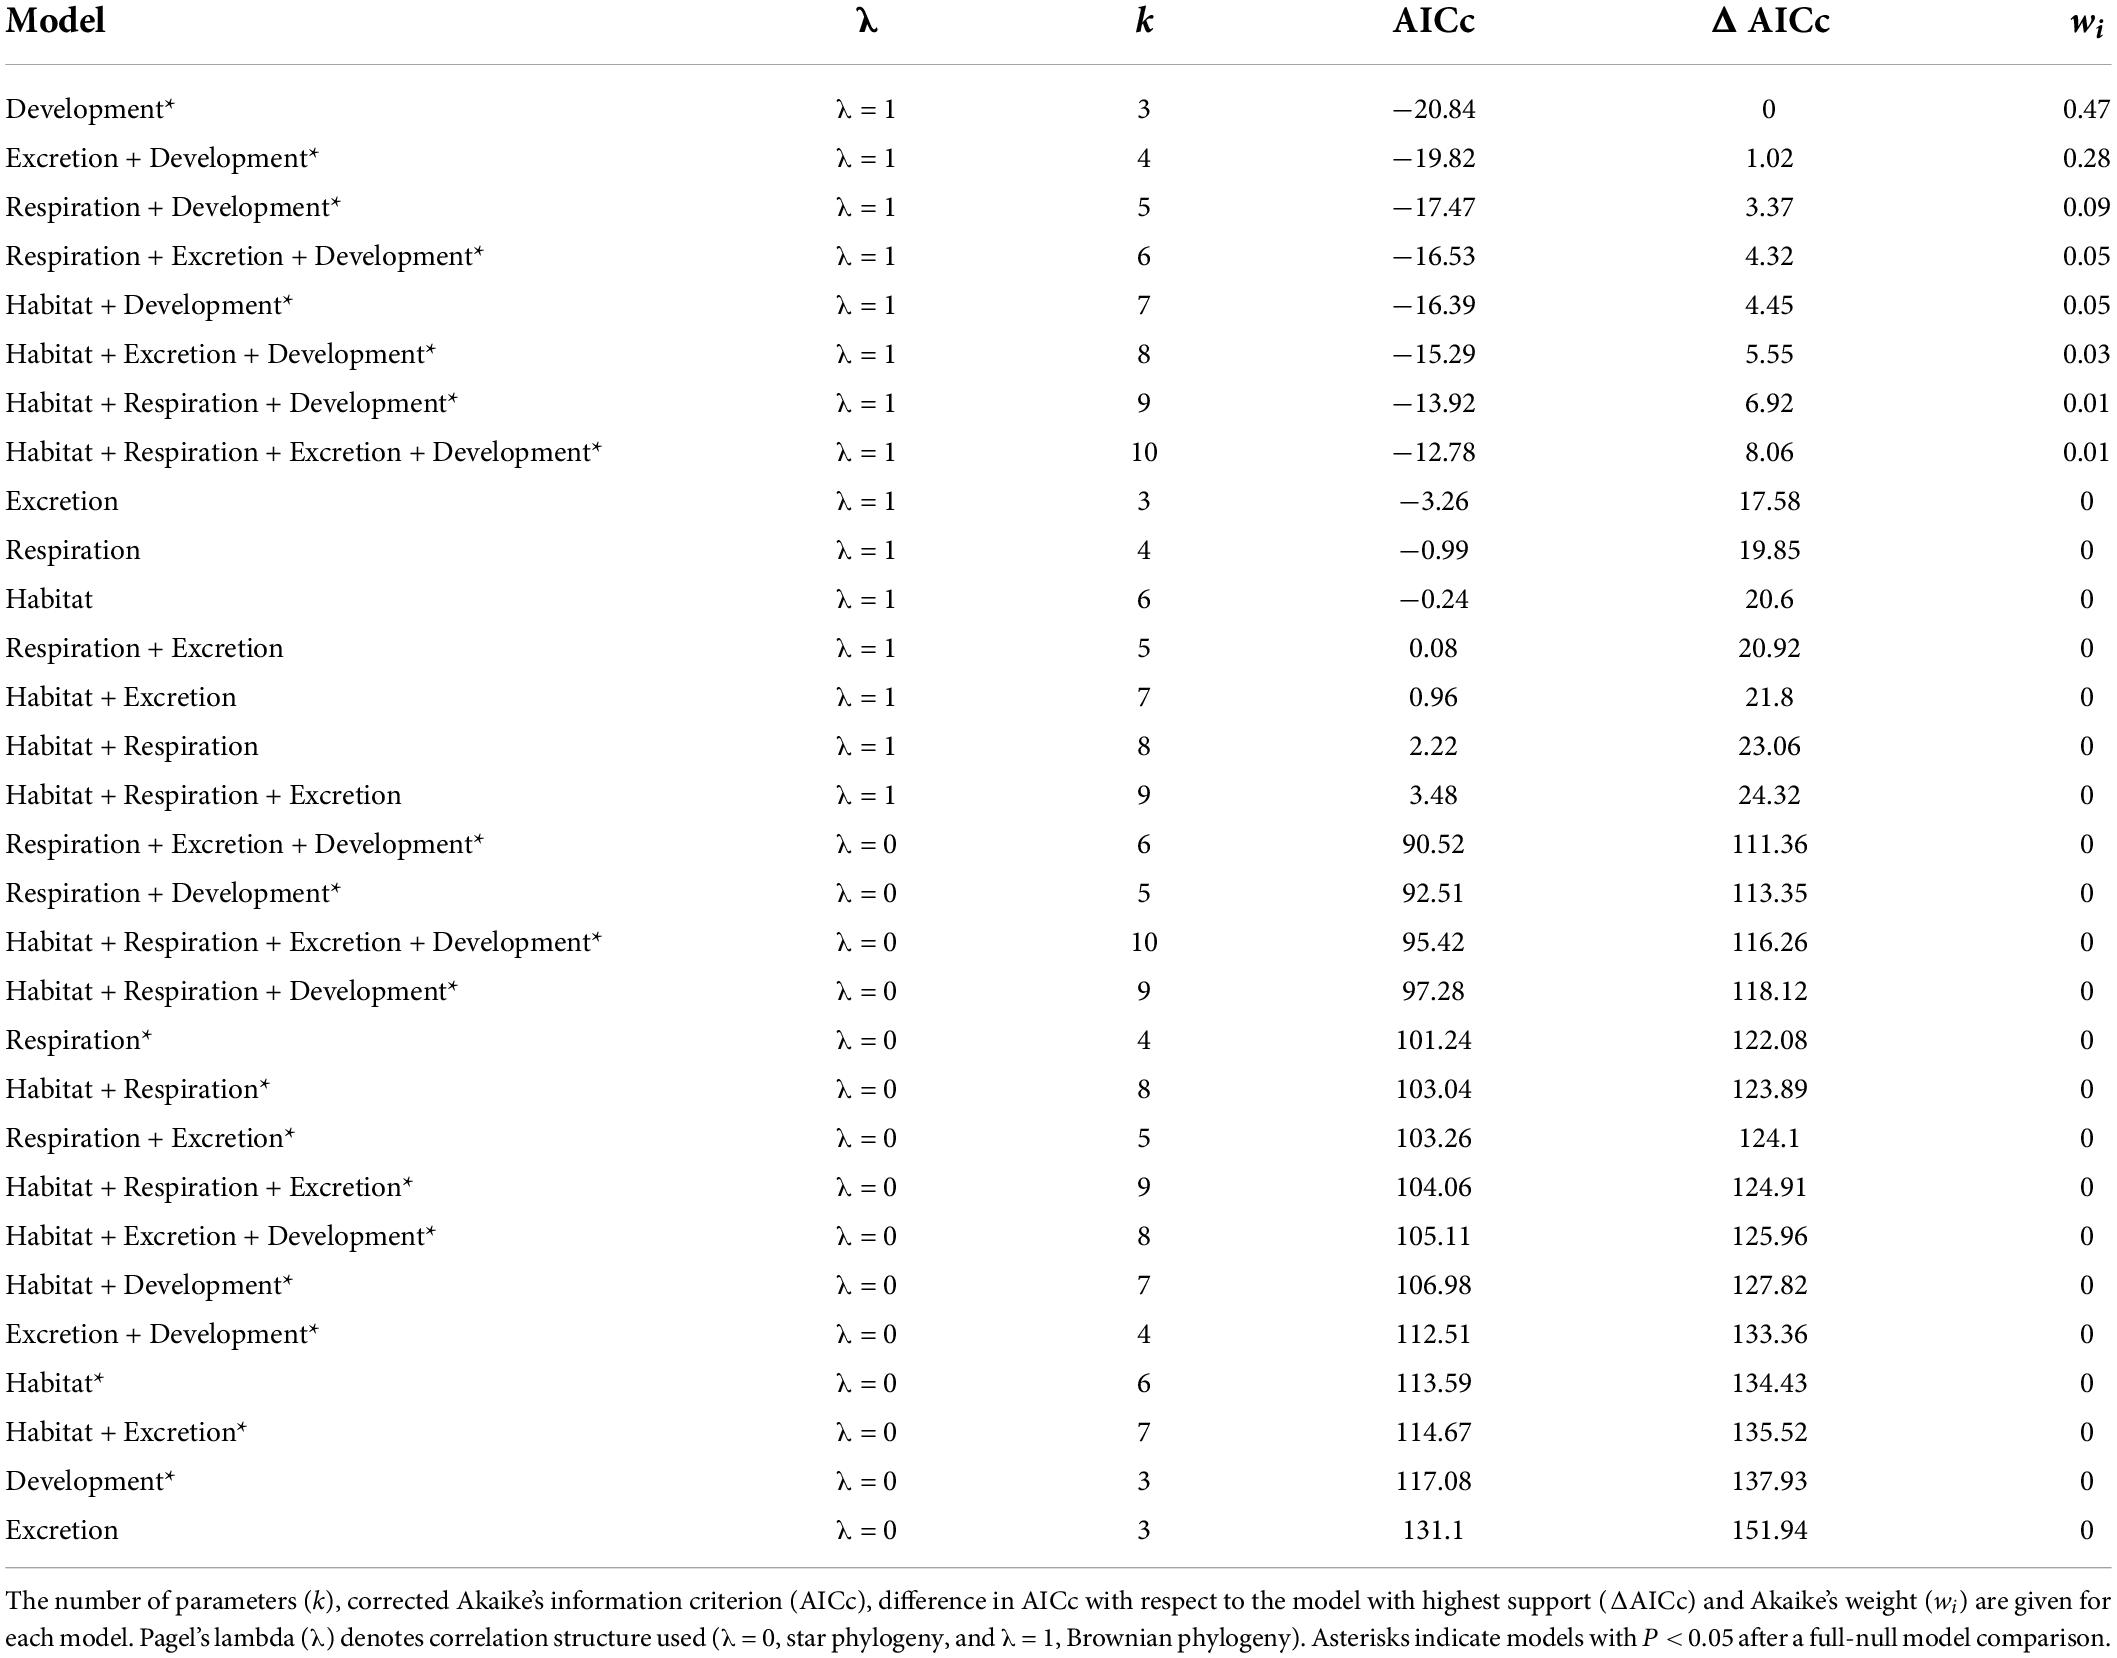
Table 2. Results for the complete Decapoda dataset for phylogenetic generalized least-squares (PGLSs) models to explain variation in genome size as a function of habitat, respiration, excretion, developmental mode and their combinations.
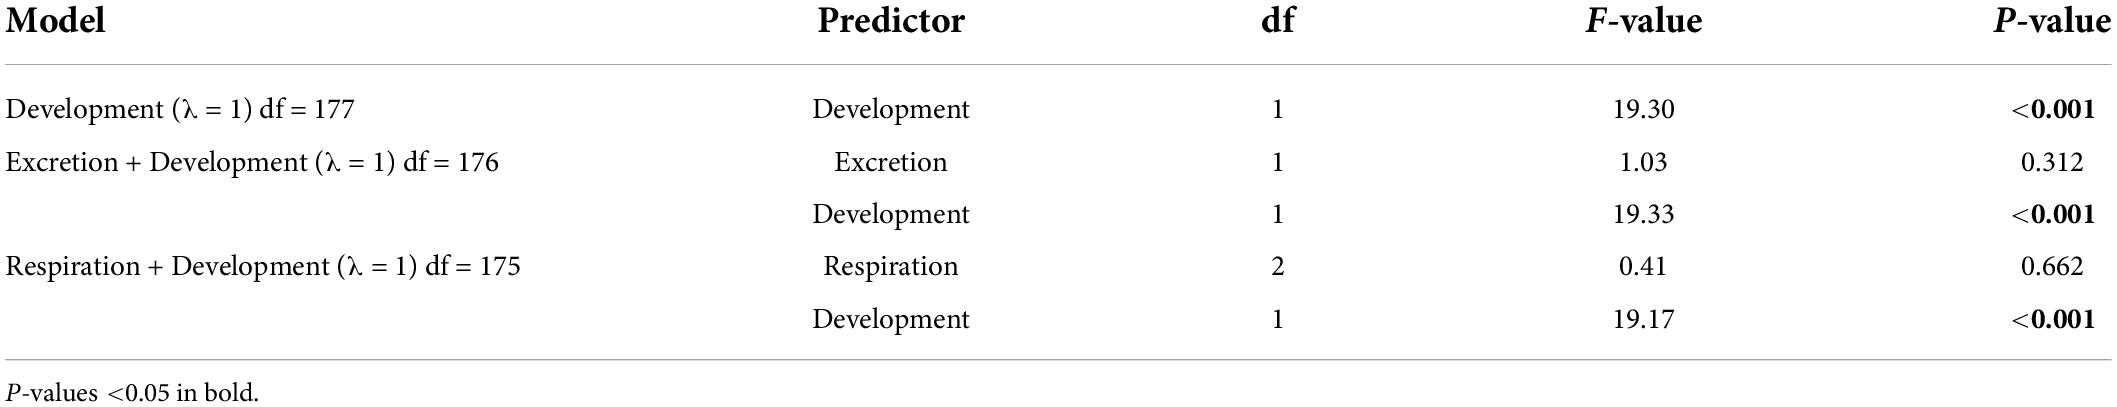
Table 3. ANOVA results for the phylogenetic generalized least-square (PGLS) models with ΔAICc < 4 obtained for the complete Decapoda dataset.
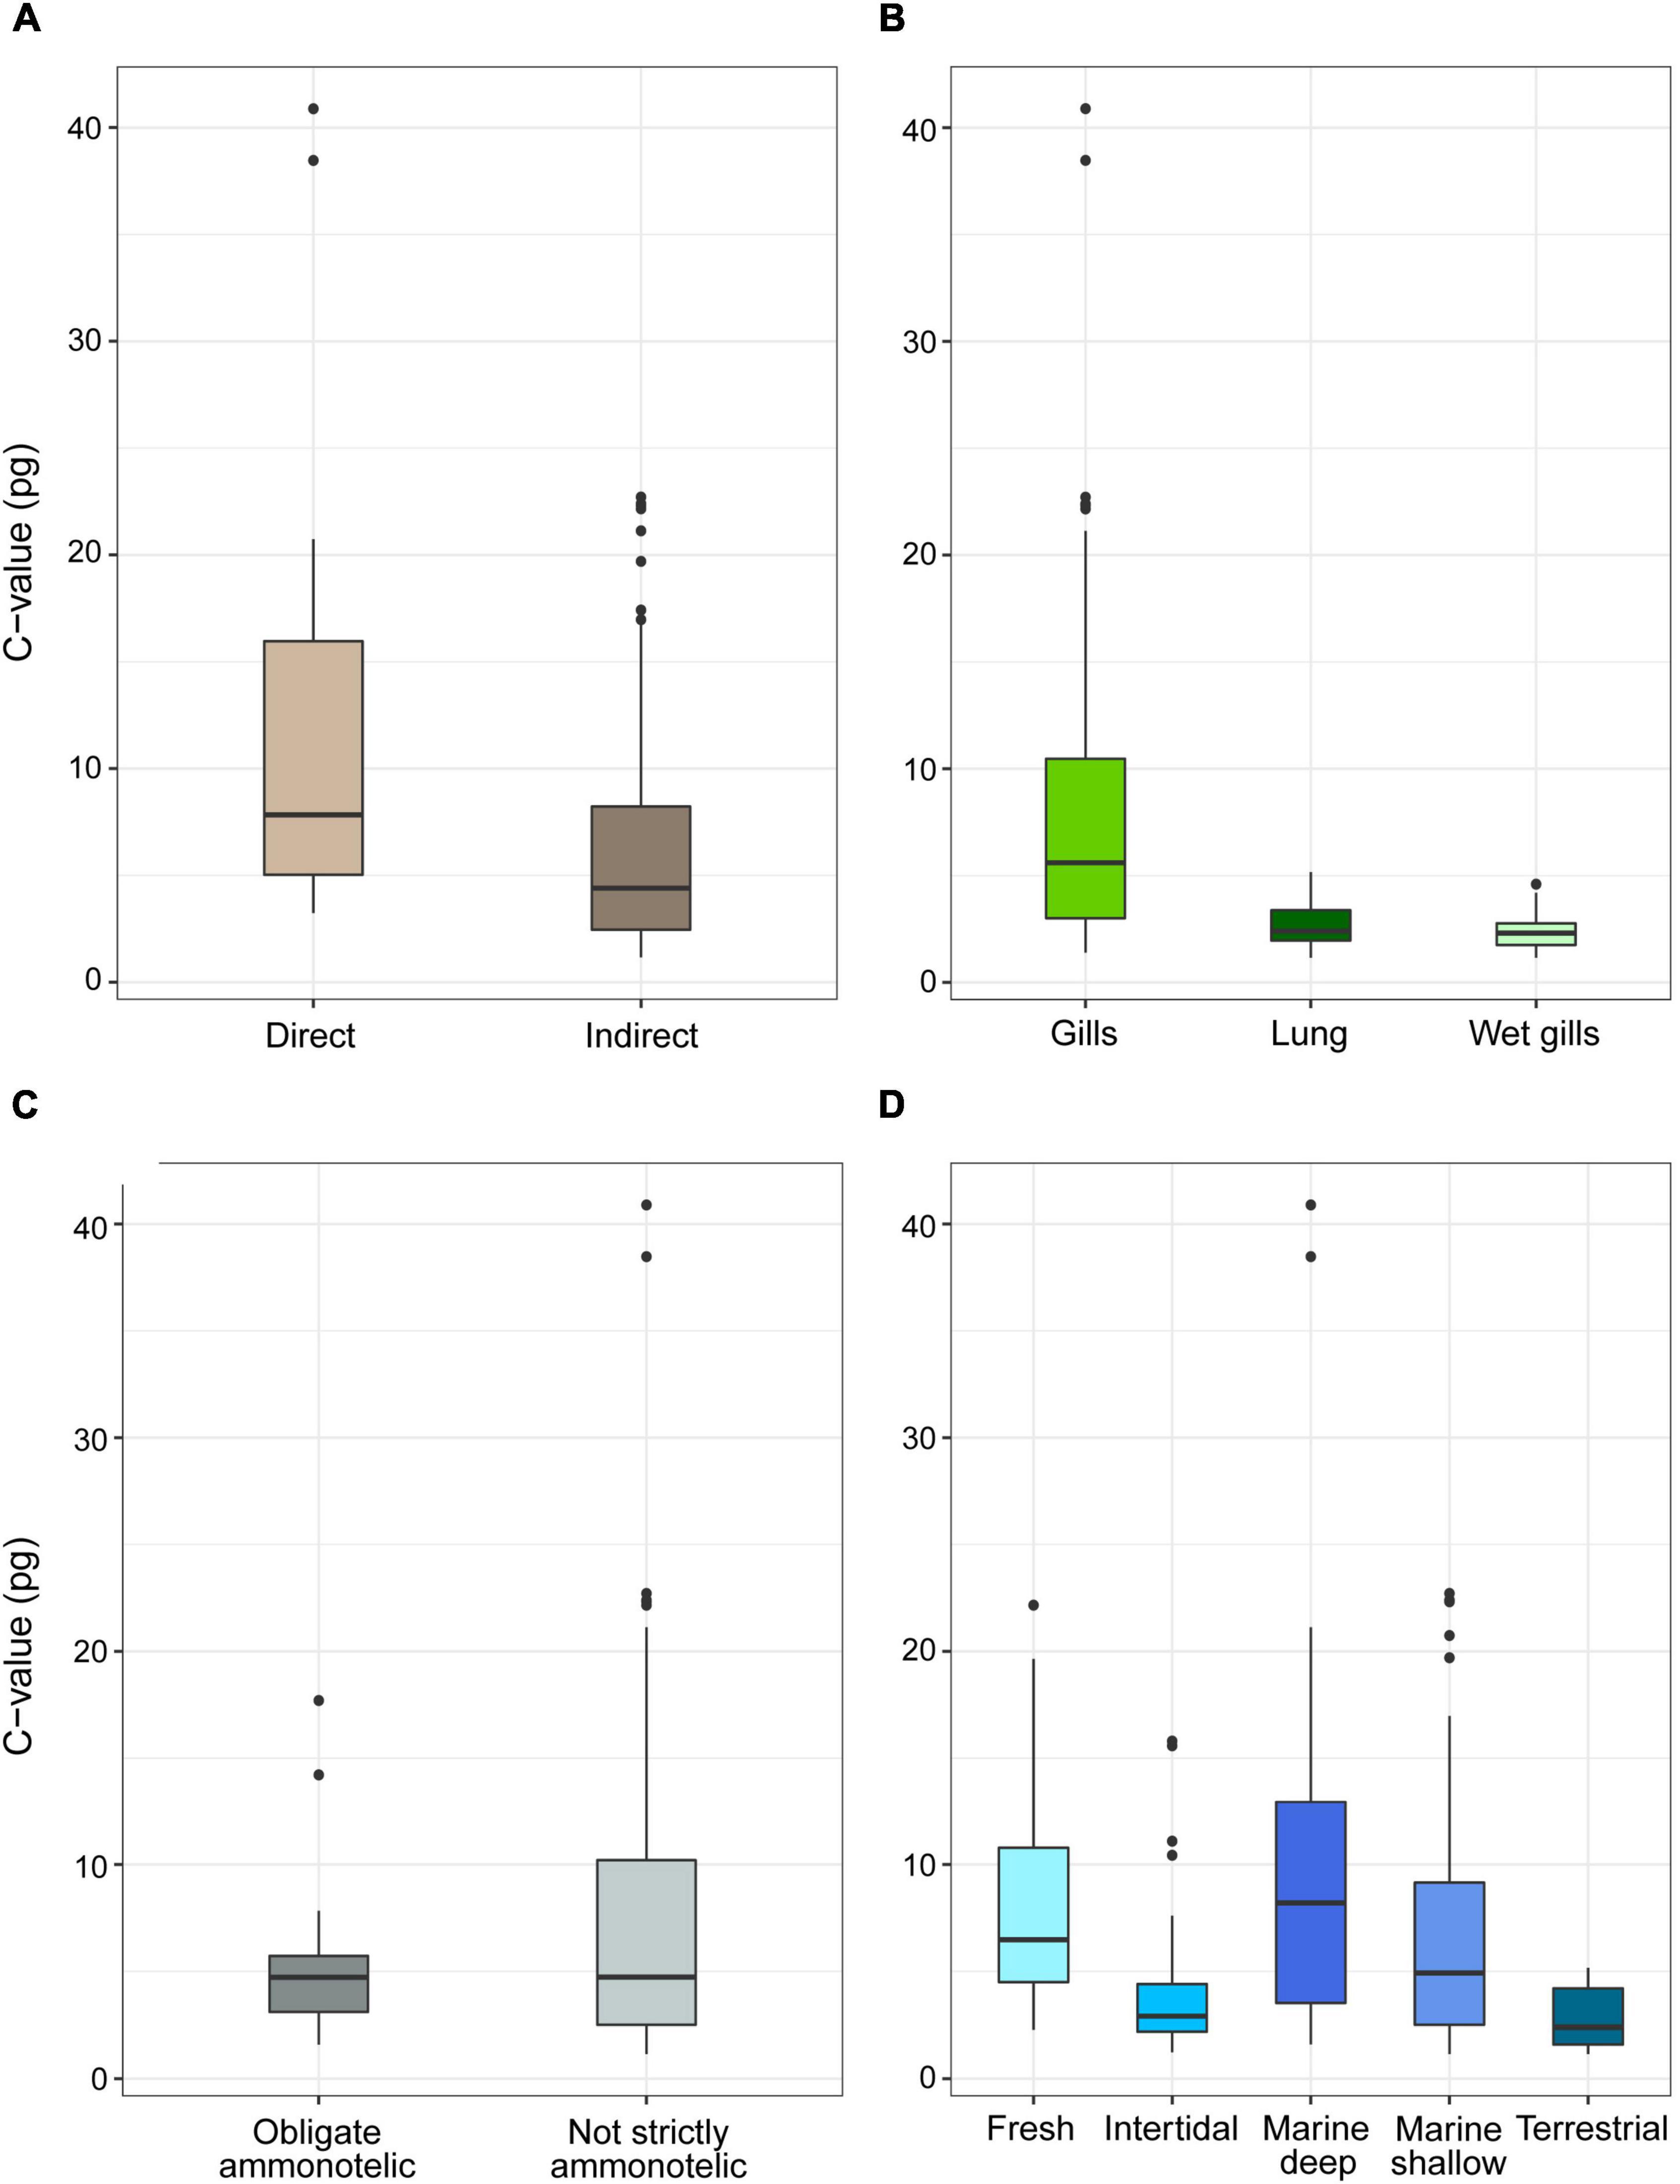
Figure 3. Genome size (pg, uncorrected values) in species of decapods grouped according to developmental (A), respiration (B), excretion (C) mode, and habitat (D). The boxplots whiskers indicate the 95% confidence intervals and the dots indicate the outliers.
For the subset of data including only the species belonging to the infraorders Anomura, Astacidea, and Brachyura, Pagel’s λ indicated a strong phylogenetic correlation for all the predictor variables. For the dependent variable (genome size) we found a reduction of phylogenetic signal in comparison to the complete dataset (the Pagel’s λ decreased from 0.96 to 0.68: Table 1). The best-fitted models based on the lowest Akaike’s Information Criterion (ΔAICc < 4) did not include phylogeny as a covariate (λ = 0, Table 4). The ANOVA tests (Table 5, data showed for models with ΔAICc < 4) indicated that all the predictors accounted for genome size variation in the models. Both respiration and developmental mode were included in the best-fitted model, indicating these two as the main predictors for genome size variation in this sub-dataset. Post hoc tests confirmed that species with direct development possess significantly larger genome sizes than species with an abbreviated and extended development (Table 6 and Figure 4A). For what concerns respiration, the species that breathe underwater using gills were found to have significantly larger genome sizes than those who developed “wet gills” and lungs as breathing organs (Table 6 and Figure 4B). In addition, not strictly ammonotelic species have significantly larger genome sizes than obligate ammonotelic species (Table 6 and Figure 4C). Finally, the category “habitat” was included in the fifth best-fitted model (Habitat + Respiration + Development, λ = 0). Despite this model has a ΔAICc of 8.92, it was found to be significant, and the ANOVA test indicated that all the predictors accounted for genome size variation. The post hoc tests showed that freshwater species have significantly larger genomes than species living in terrestrial and intertidal habitat and in shallow-mid waters (Table 6 and Figure 4D); while all the other pairwise comparisons across habitats were not significant (Table 6). The PIC analysis did not show any significant correlation between the genome size and the number of larval stages (Figure 5).
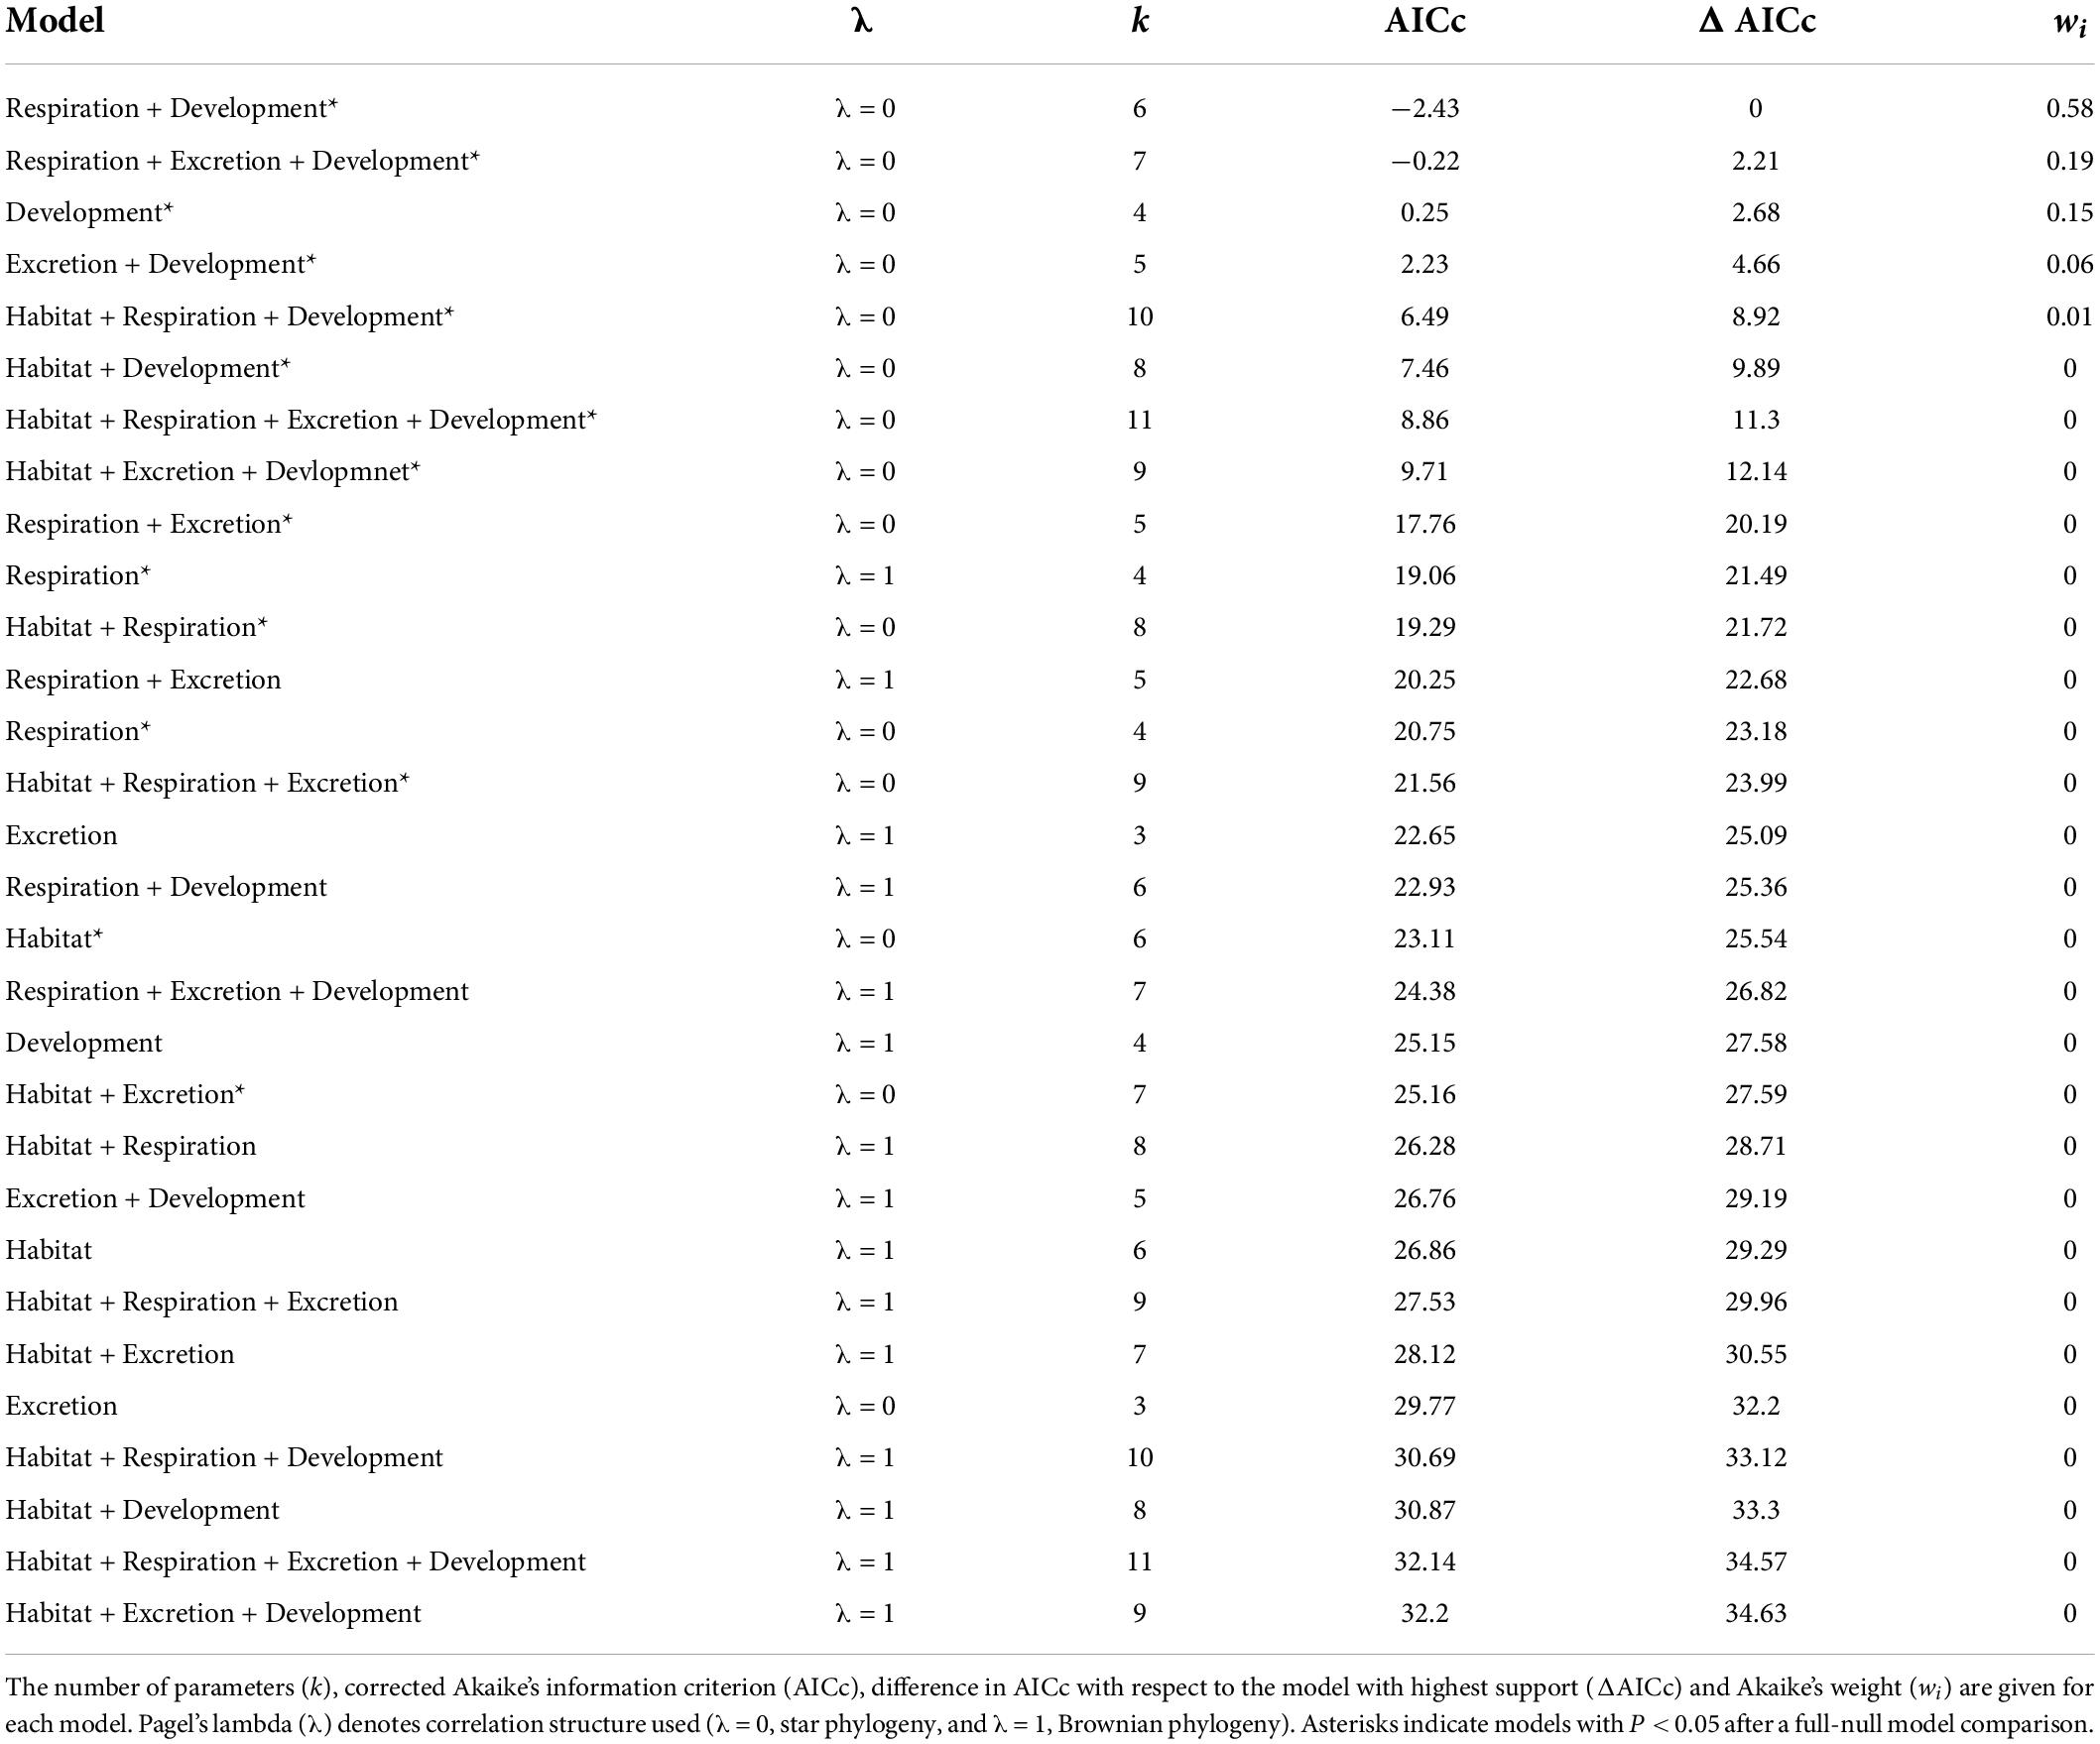
Table 4. Results for the subset (species belonging to the infraorders Anomura, Astacidea, and Brachyura) for phylogenetic generalized least-squares (PGLSs) models to explain variation in genome size as a function of habitat, respiration, excretion, developmental mode and their combinations.
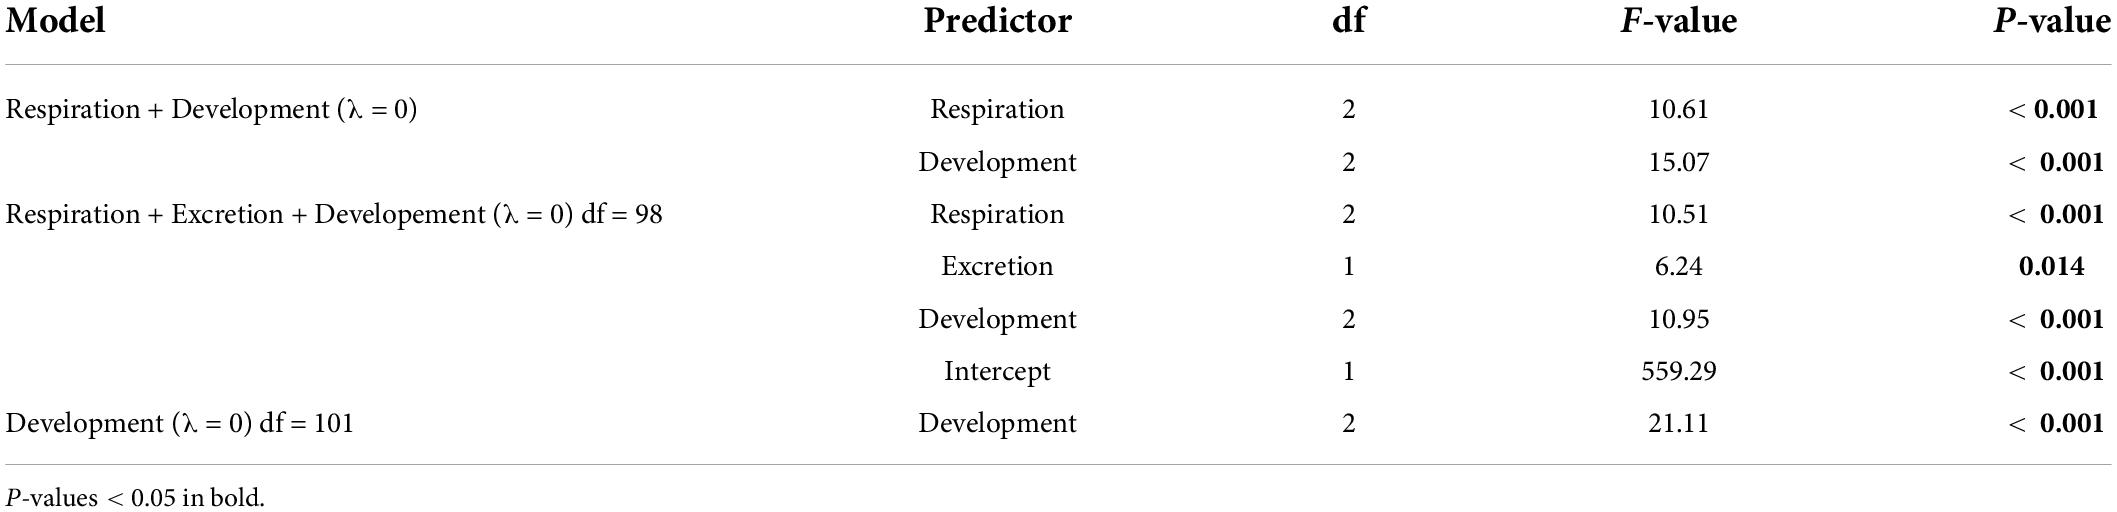
Table 5. ANOVA results for the phylogenetic generalized least-square (PGLS) models with ΔAICc < 4 obtained for the subset comprising the species belonging to the infraorders Anomura, Astacidea, and Brachyura.
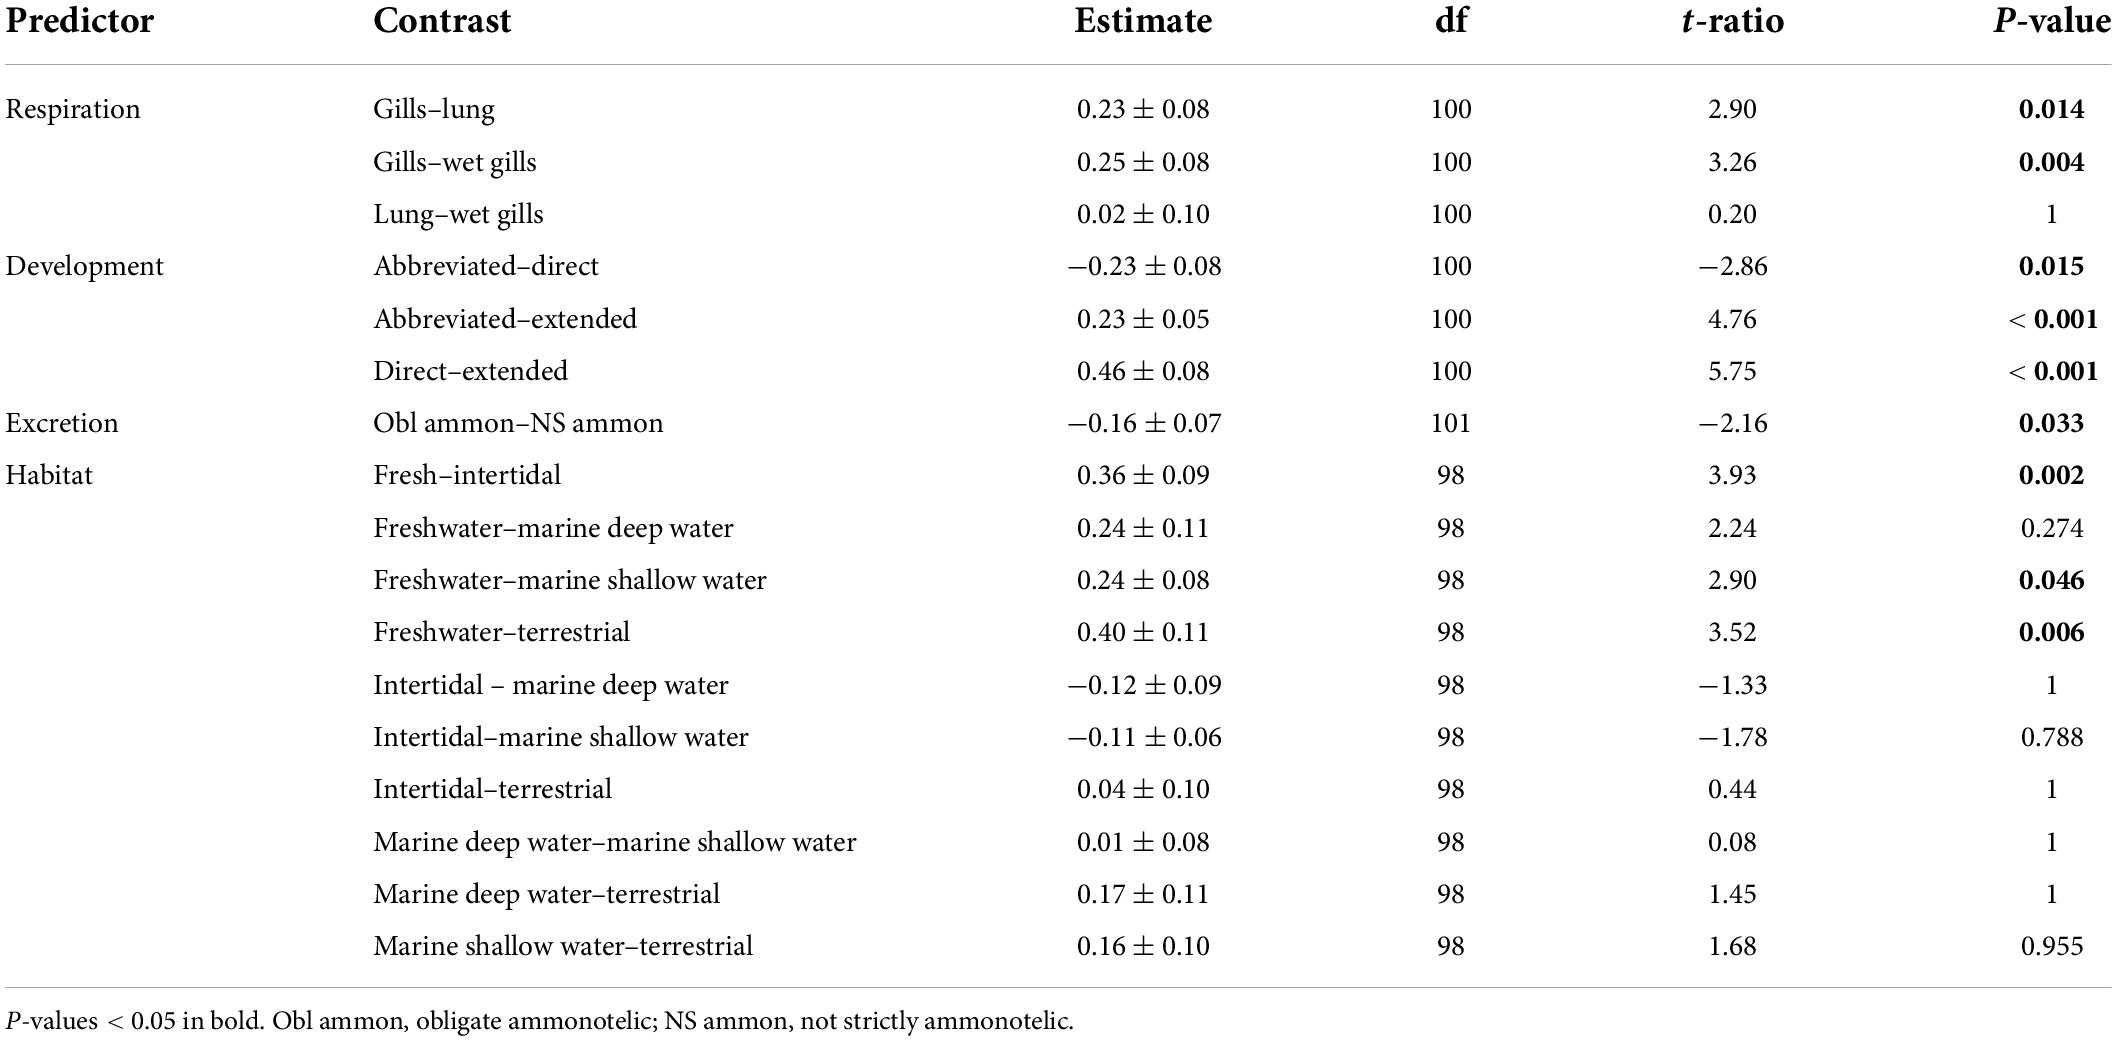
Table 6. Post hoc tests for the significant predictors included in the phylogenetic generalized least-squares (PGLS) models with the lowest ΔAICc obtained for the subset comprising the species belonging to the infraorders Anomura, Astacidea, and Brachyura.
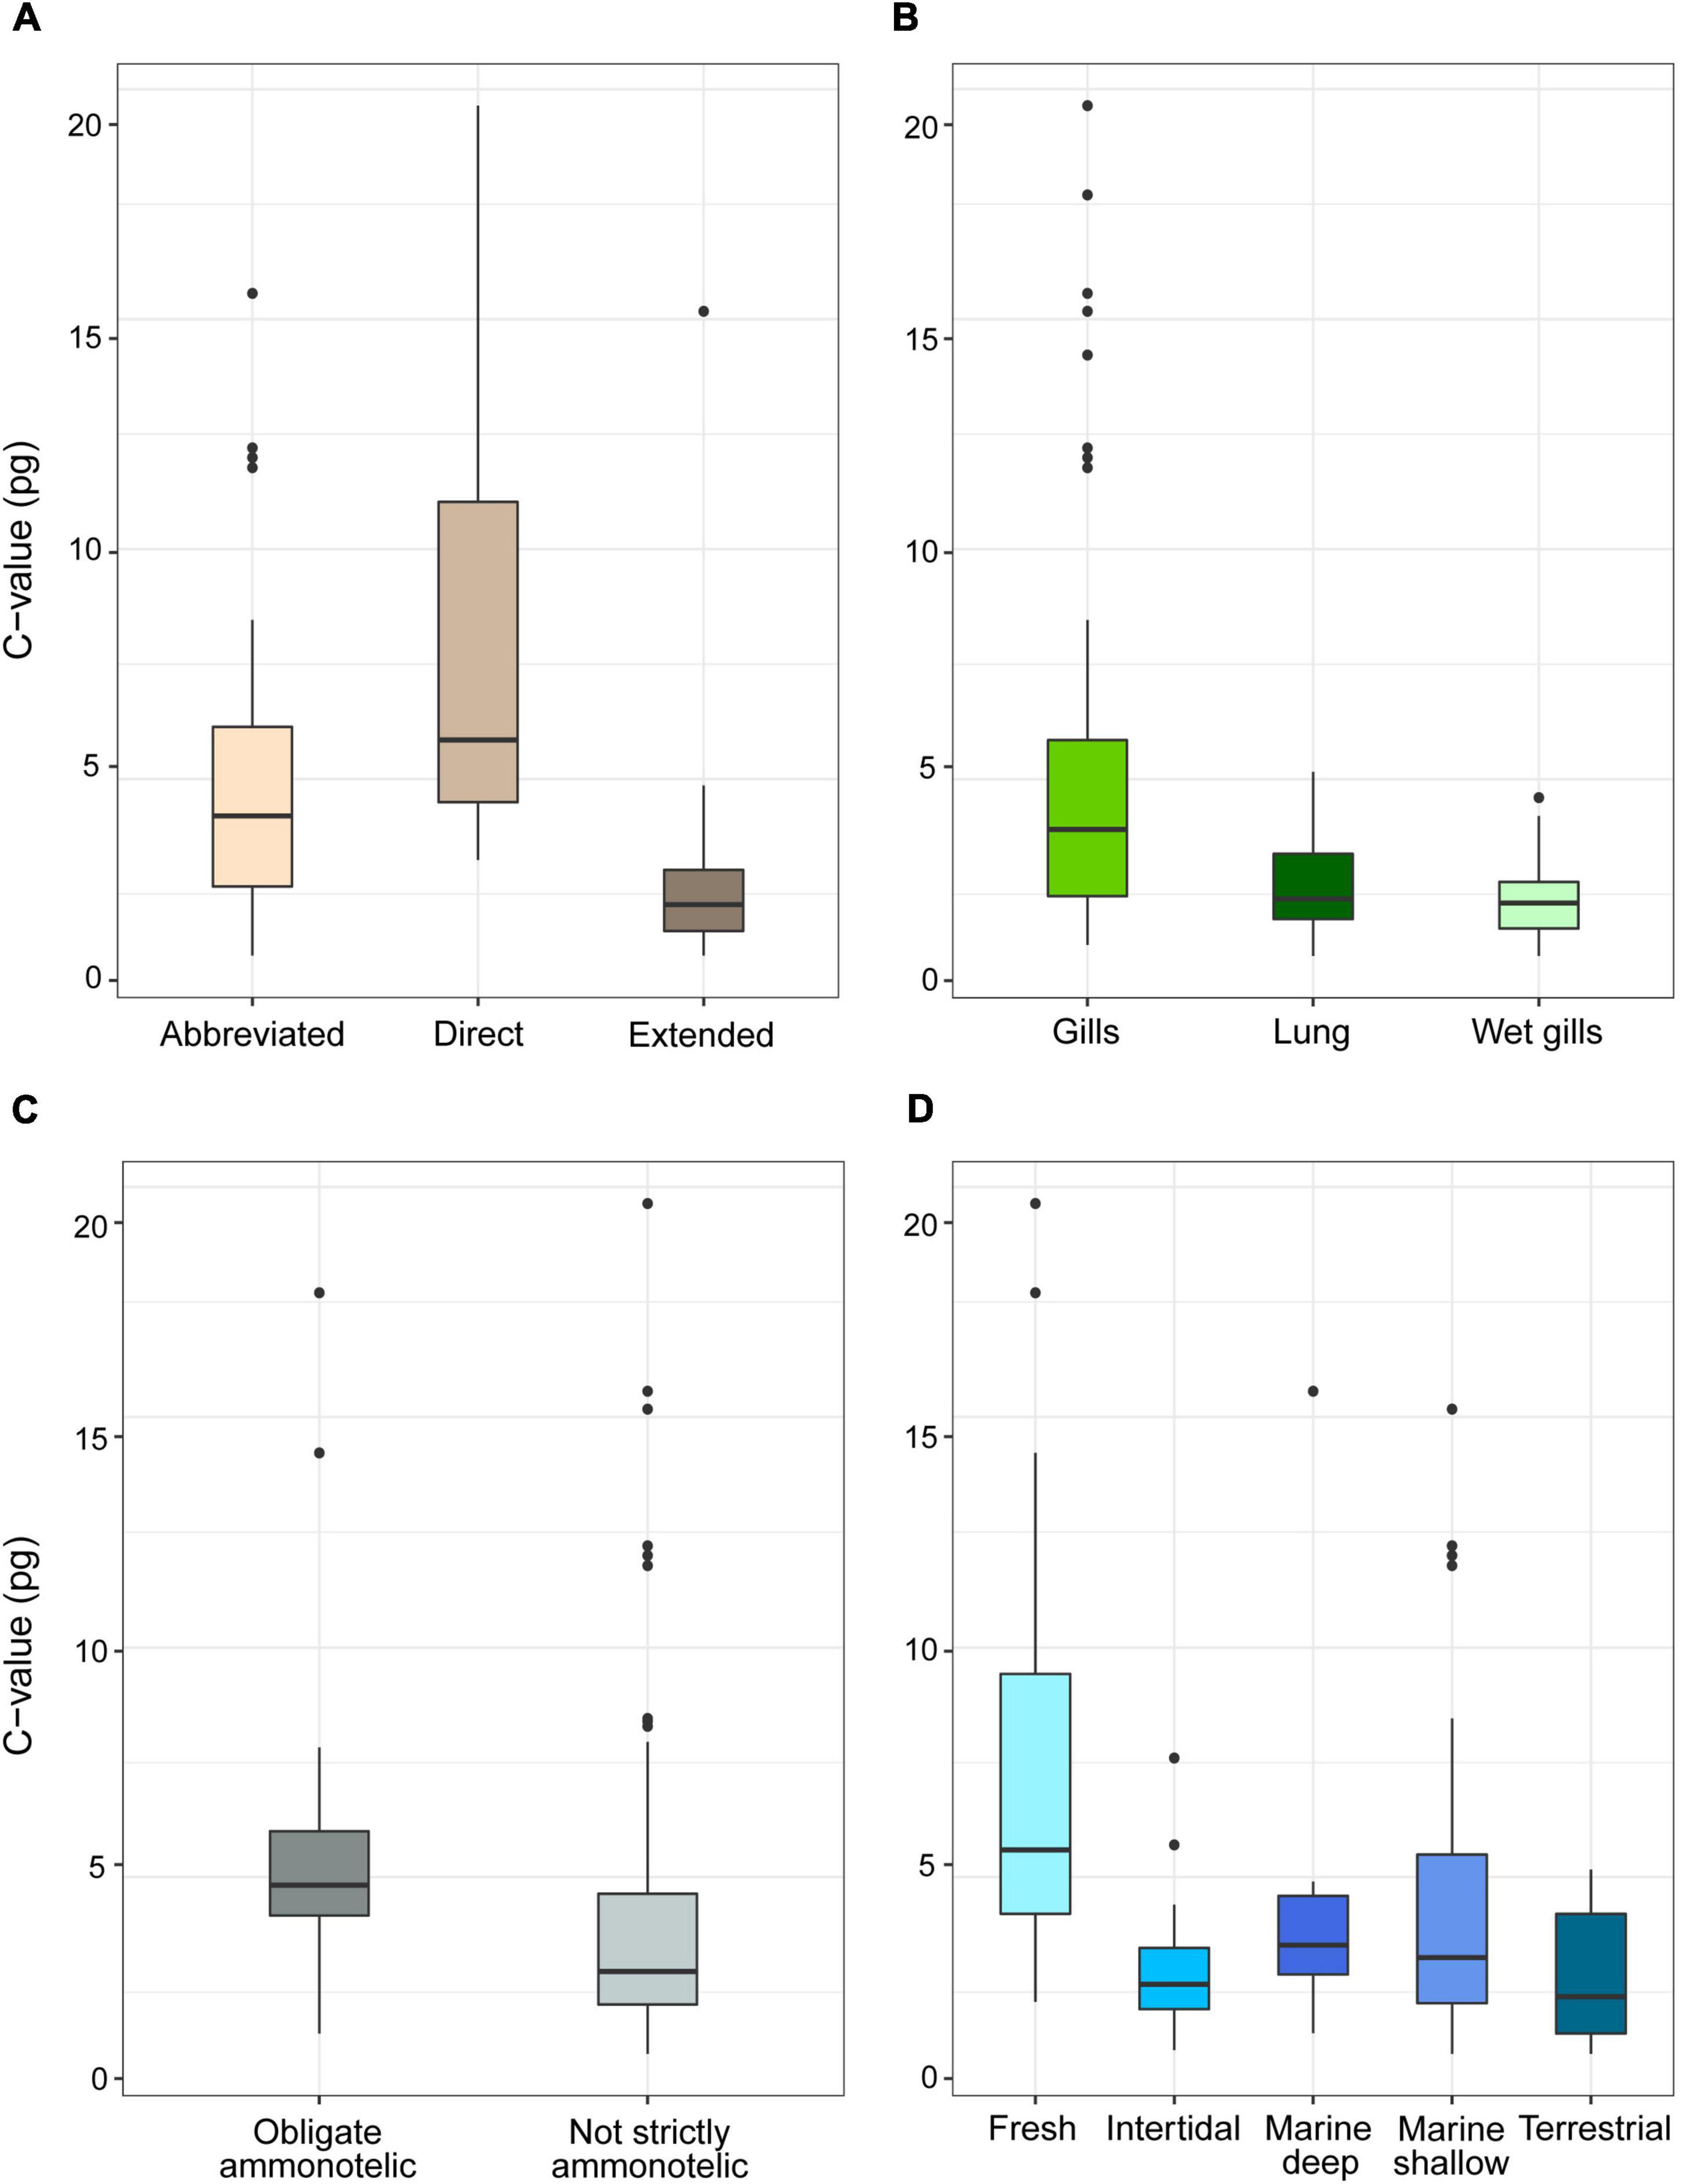
Figure 4. Genome size (pg, uncorrected values) in species of decapods belonging to the infraorders Anomura, Astacidea and Brachyura grouped according to developmental (A), respiration (B), excretion (C) mode, and habitat (D). The boxplots whiskers indicate the 95% confidence intervals and the dots indicate the outliers.
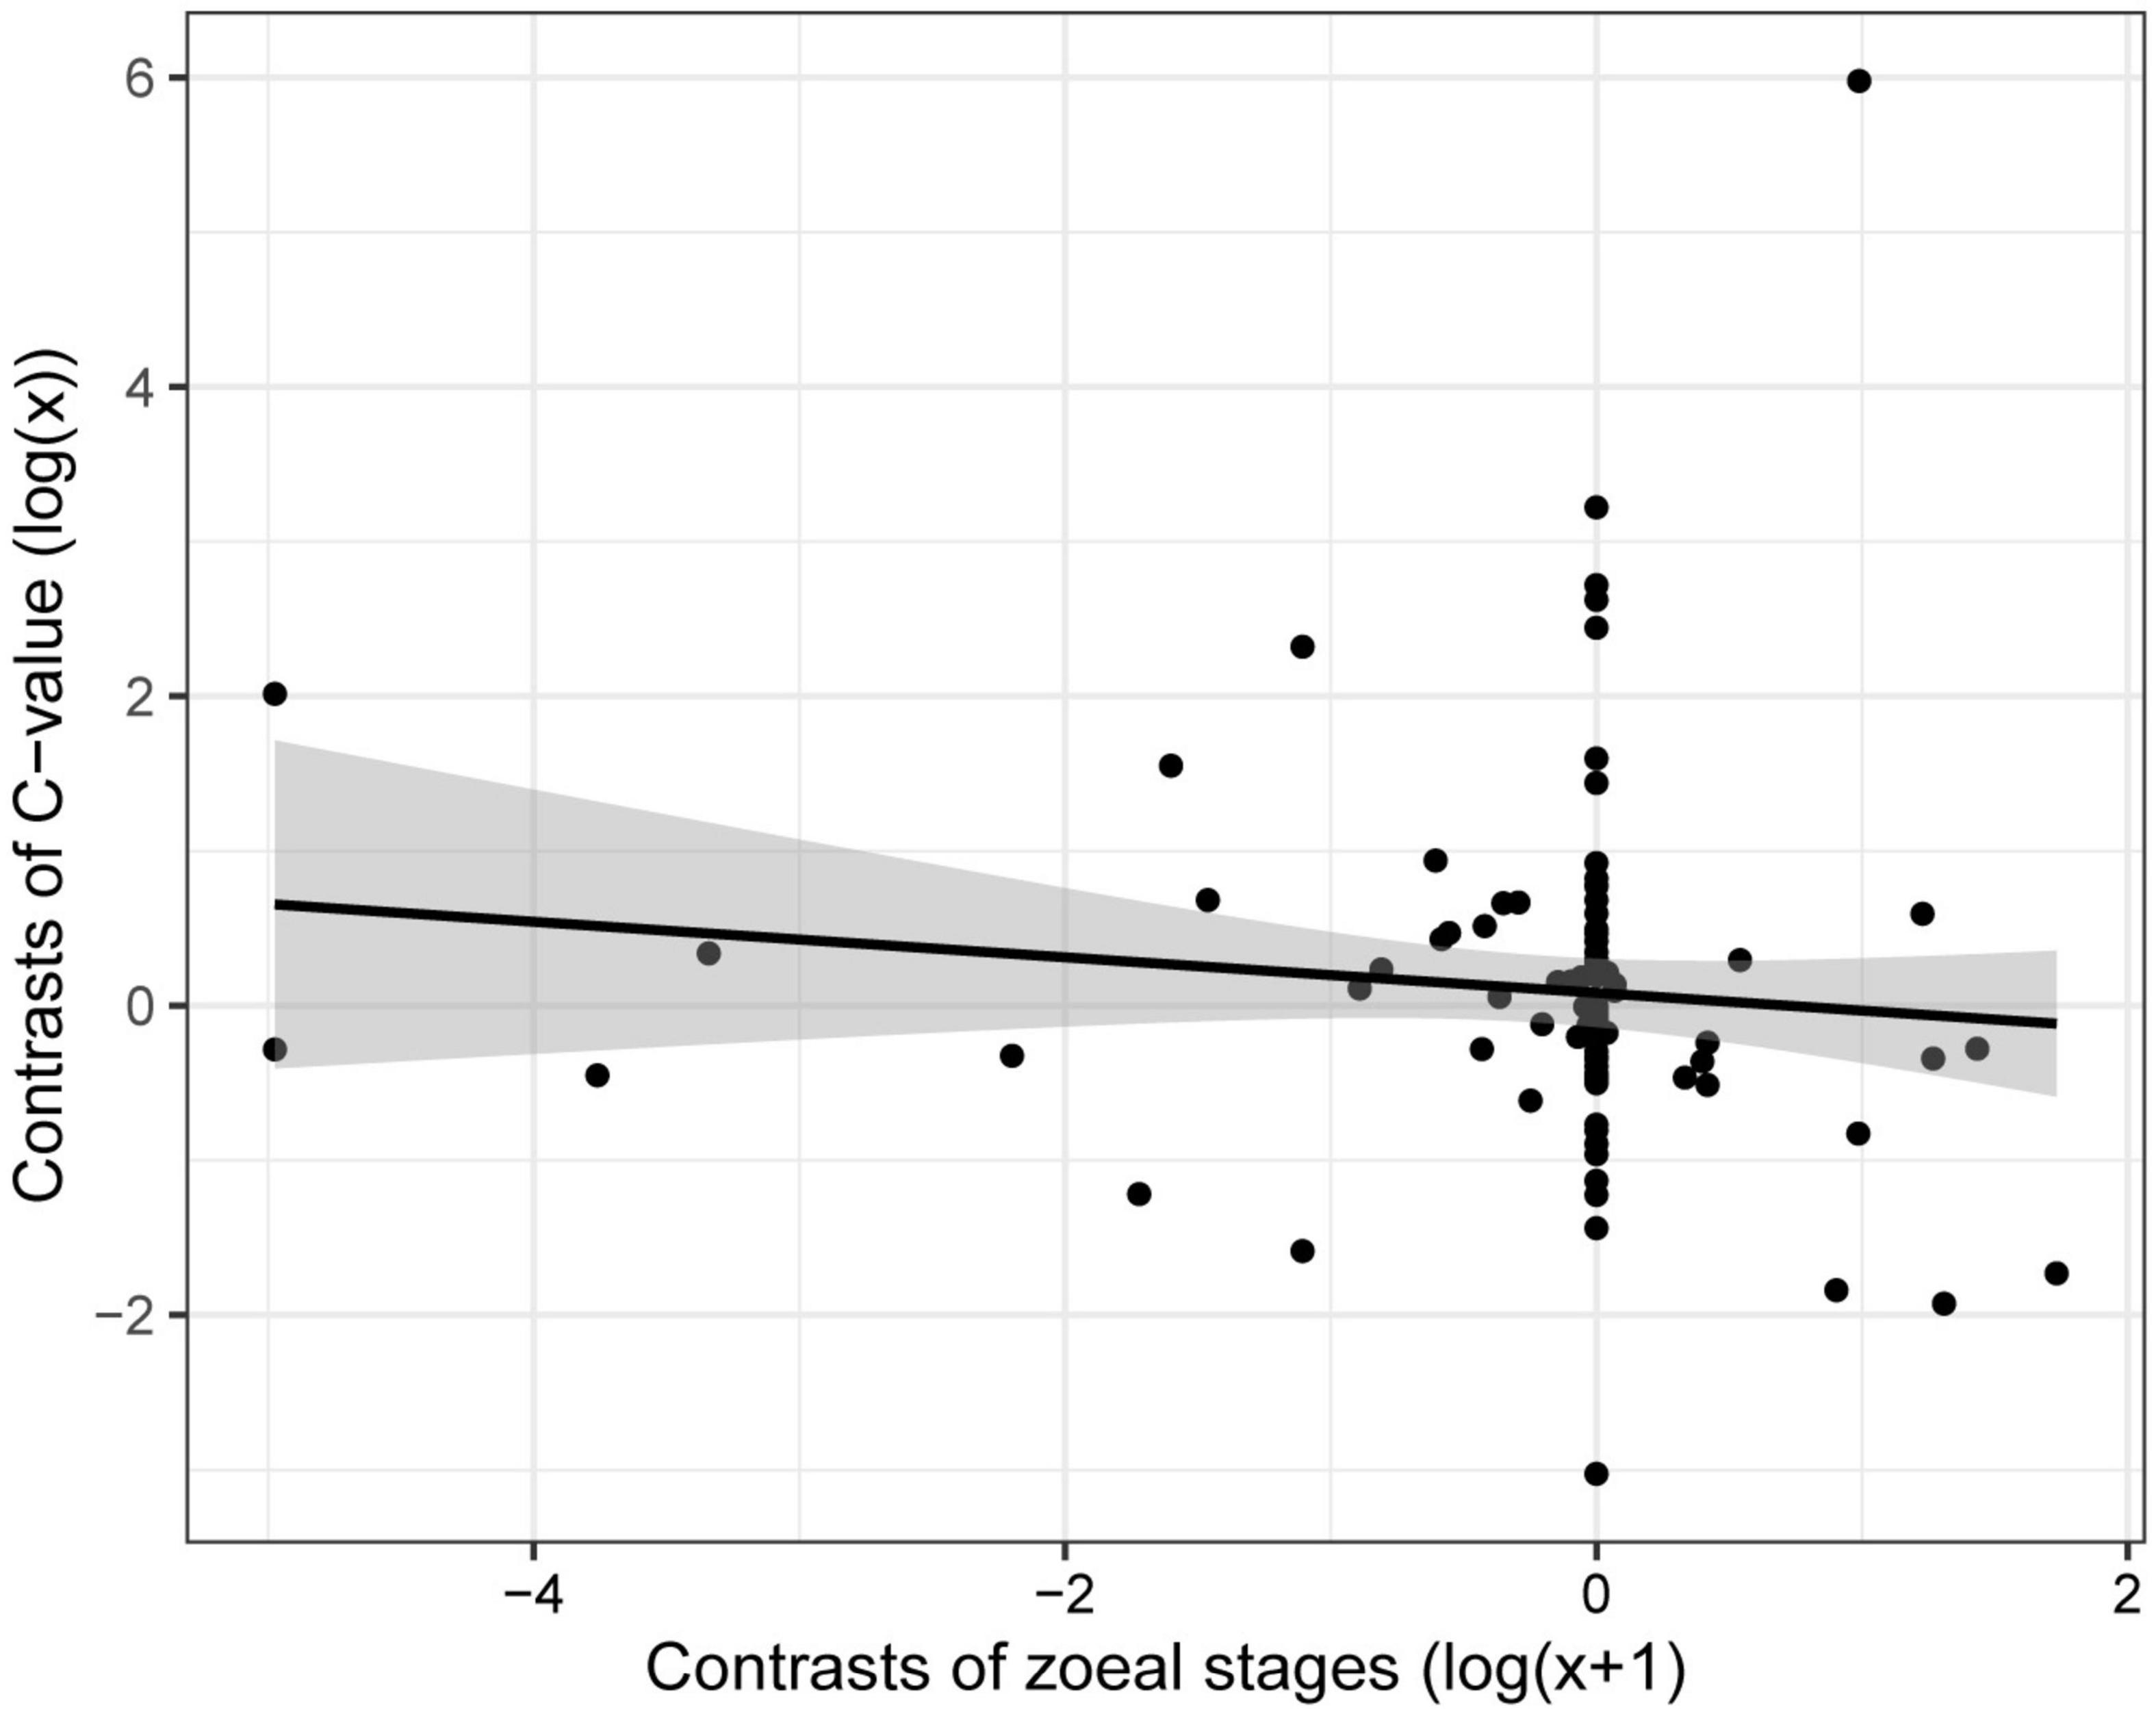
Figure 5. Correlation between genome size and number of zoeal stages in species of decapods belonging to the infraorders Anomura, Astacidea, and Brachyura, using phylogenetic independent contrasts.
The major finding of this study is that genome size variation in decapods is mainly explained by their developmental mode. We found that genome size is significantly larger in decapods that have a direct development than in species with an indirect development. This result was confirmed both when the analyses were run on the complete dataset and on the subset including only the infraorders Anomura, Astacidea, and Brachyura. Our analyses also proved that in the latter subset genome size variation is also explained by the habitat, the respiration and excretion mode of the analyzed species.
The link between developmental modes and genome sizes shows a rather homogeneous trend across all metazoans. A significant association between large genomes and developmental complexity has been described for several species (Gregory, 2002). Organisms with complex developments, such as the ones for instance characterized by many larval stages or going through metamorphosis, have time-limited developmental windows to rapidly complete single or successive metamorphoses. This process requires rapid cellular division and differentiation, with direct implications on the amount of DNA that can be maintained (Gregory, 2002). On the other hand, developmental windows are less stringent for those species showing an abbreviated or direct development, allowing for genome expansion (Gregory, 2002). In crustaceans, this hypothesis was confirmed for copepods, where species with narrow temporal windows between successive larval stages present small genomes (Wyngaard et al., 2005). Even in insects, holometabolous species (i.e., the species with the most complex developmental mode) present smaller genomes than hemimetabolous ones (Gregory, 2002; Alfsnes et al., 2017). Similar patterns have been also shown within the Agnatha, with hagfish, which show direct development, presenting larger genome sizes than lampreys, characterized by extended development with metamorphosis (Hardie and Hebert, 2004). In amphibians, smaller genomes are found in frogs, characterized by a more complex development in comparison to salamanders, which are obligate pedomorphs (i.e., they do not undergo metamorphosis) and possess larger genomes (Bonett et al., 2020).
Interestingly, as far as the phylogenetic signal is concerned, when the dataset was reduced to just three infraorders (subset), we recorded a significant reduction in the lambda value of the dependent variable (genome size). In this case, the phylogenetic signal was mainly associated with the independent variables. With such results, ordinary least-squares (OLS) models are found to perform better than PGLS models (Revell, 2010). Our results are coherent with this evidence, since, for the subset, the best-fitted models did not include phylogeny as a covariate.
Overall, the results of our analyses on the subset show that multiple eco-physiological and life-history traits correlate with genome size in Anomura, Astacidea, and Brachyura. The best-fitted model showed that respiration mode, together with developmental mode, principally explains genome size variation in these three decapod infraorders. Specifically, respiratory adaptations typical of terrestrial and intertidal species, such as branchiostegal lungs or gills capable to extract oxygen from air, explain for a reduction of genome size.
Also the excretion mode contributes to explain the genome size variation in this subset of species. Species that are not strictly ammonotelic possess larger genomes than strictly ammonotelic species, in accordance with evidence that organisms with a broad ecological tolerance have large genomes (Bennett, 1987; Beaton and Hebert, 1989). This finding is in line with studies on genome size evolution in fish, which showed that freshwater and other eurybiotic species have larger genomes than marine and stenobiotic species (Ebeling et al., 1971; Hardie and Hebert, 2004).
Habitat has been pointed out as one of the main factors driving the evolution of genome size in many species (Grime and Mowforth, 1982; Dufresne and Jeffery, 2011; Herben et al., 2012). We found that this predictor significantly affected the genome size of Anomura, Astacidea, and Brachyura, even if less predominantly than the other variables considered. The Post hoc tests indicated that freshwater species have significantly larger genomes than species living in terrestrial and intertidal habitat and in shallow-mid waters. Previous studies aimed to compare freshwater and marine crustaceans found a weak association between genome size and these habitats, with slightly larger genomes found in marine species (Hessen and Persson, 2009; Alfsnes et al., 2017). Our results are yet in line with data on genome size evolution in fish, which indicate a clear correlation between the colonization of freshwater habitat and the possession of larger genomes (Hardie and Hebert, 2004; Smith and Gregory, 2009). The developmental mode of many crustacean species is related to habitat occupation and, for instance, the strong variations of hydrodynamic and physico-chemical parameters in freshwater habitats have led to an evolutionary trend toward direct development. On the contrary, direct and abbreviated development is very rare in marine species (Vogt, 2013).
All the chosen predictors, including habitat, showed a significant effect on the genome size of Brachyura, Astacidea, and Anomura, while the only variable accounting for genome size variation of all considered crustaceans was the developmental mode. In our opinion, this is due to the wider variation in habitat occupation and physiological adaptations occurring in these three infraorders. All these taxa include freshwater species, with Brachyura and Anomura being the only decapod infraorders able to colonize the terrestrial habitats, and they often show specific adaptations to cope with these challenging ecological transitions. Moreover, the reduction of the phylogenetic signal in the dependent variable, when only Anomura, Astacidea, and Brachyura are considered, suggests that accurate phylogenetic information (i.e., not only the one inferred from taxonomy as in this study) might lead to more solid results. This evidences point out areas for further research. We hypothesize that a more detailed study on a particular group with a well-resolved phylogeny and multiple transitions between habitats and/or developmental modes could shed further light on the evolution of genome size in decapods.
One of our expectations was that terrestrial and intertidal species could have a smaller genome size than marine species, in line with the large genomes constrained hypothesis (Knight et al., 2005). This hypothesis postulates that species with large genomes are under-represented in less-stable environments due to the cost of maintaining large amounts of DNA. Terrestrial and intertidal habitats represent de facto more variable environments to cope with than the marine realm, in terms of temperature and salinity unpredictability, weather extremes and water availability, for instance. This hypothesis has been confirmed for the most successful land dwellers among Crustacea, the Isopoda (Jeffery, 2015), whose terrestrial species have smaller genomes respect to the marine ones. In our subset, terrestrial and intertidal species display the smallest genomes. Post hoc tests, however, reveal a significant differentiation in their genome sizes with respect to freshwater species only, but not with marine ones. The lack of significance in our test can be attributed to our unbalanced dataset, as for the terrestrial and intertidal categories the number of entries was very small. This might have reduced the power of our statistical analysis. We registered, however, a significant reduction in genome size in species that possess branchiostegal lungs or gills capable to extract oxygen from air, which are both adaptations typical of terrestrial and intertidal species. The colonization of terrestrial and intertidal habitats led various taxa to evolve physiological adaptations to cope with challenging new environmental conditions (Little, 2009). Land invasion in decapods mainly concerned brachyuran and anomuran species, which evolved remarkable adaptations that involved locomotion, respiration, excretion, reproduction and, eventually, their microbiome composition (Burggren and McMahon, 1988; Greenaway, 2003; Cannicci et al., 2011, 2020; Watson-Zink, 2021). The observed trend in genome sizes could be the result of the genome restructuring that led to these adaptations and the selective pressures that was exerted by the water-to-land transition on the amount of DNA. Further studies, including more species living in intertidal and terrestrial habitats, may confirm our working hypothesis.
In conclusion, our study shows that multiple eco-physiological and life-history traits correlate with genome size in Anomura, Astacidea, and Brachyura. As suggested by Gregory (2002), a strong relationship—with causation proceeding in both directions—occurs between the genome size and the phenotype of an organism, with several ecological and physiological factors exerting synergistic effects on this interaction. Whether genome restructuring involved the acquisition or loss of functional genes, spliceosomal introns, mobile elements or other genomic regions is yet to be investigated in decapods. Future research should couple genome size data with genome sequencing ones for target species, to underpinning the role of differential genome content in this interaction and shed further light on this evolutionary process.
The original contributions presented in this study are included in the article/Supplementary material, further inquiries can be directed to the corresponding author.
AI, SF and SC: conceptualization. AI, AS, AB, SF, and SC: data collection. CC, KN, and SF: experimental procedures. AS: data analysis. AI, AS, SF, and SC: writing. SC: funding. All authors contributed to the article and approved the submitted version.
SC was supported by TUYF Charitable Trust funds, Hong Kong, and by the HKU Faculty of Science RAE improvement funds. AS was supported by an EC-funded Erasmus Mundus grants through the Erasmus Mundus Joint Master Degree in Tropical Biodiversity and Ecosystems (TROPIMUNDO) recognized by the Université libre de Bruxelles, Belgium.
The authors declare that the research was conducted in the absence of any commercial or financial relationships that could be construed as a potential conflict of interest.
All claims expressed in this article are solely those of the authors and do not necessarily represent those of their affiliated organizations, or those of the publisher, the editors and the reviewers. Any product that may be evaluated in this article, or claim that may be made by its manufacturer, is not guaranteed or endorsed by the publisher.
The Supplementary Material for this article can be found online at: https://www.frontiersin.org/articles/10.3389/fevo.2022.930888/full#supplementary-material
Alfsnes, K., Leinaas, H. P., and Hessen, D. O. (2017). Genome size in arthropods; different roles of phylogeny, habitat and life history in insects and crustaceans. Ecol. Evol. 7, 5939–5947. doi: 10.1002/ece3.3163
Beaton, M. J., and Hebert, P. D. N. (1989). Miniature genomes and endopolyploidy in cladoceran crustaceans. Genome 32, 1048–1053. doi: 10.1139/g89-552
Bennett, M. D. (1987). Variation in genomic form in plants and its ecological implications. New Phytol. 106, 177–200. doi: 10.1111/j.1469-8137.1987.tb04689.x
Bondad-Reantaso, M. G., Subasinghe, R. P., Josupeit, H., Cai, J., and Zhou, X. (2012). The role of crustacean fisheries and aquaculture in global food security: Past, present and future. J. Invertebr. Pathol. 110, 158–165. doi: 10.1016/j.jip.2012.03.010
Bonett, R. M., Hess, A. J., and Ledbetter, N. M. (2020). Facultative transitions have trouble committing, but stable life cycles predict salamander genome size evolution. Evol. Biol. 47, 111–122. doi: 10.1007/s11692-020-09497-8
Burggren, W. W., and McMahon, B. R. (1988). Biology of the land crabs. Cambridge: Cambridge University Press.
Burnham, K. P., and Anderson, D. R. (eds) (2004). Model selection and multimodel inference. New York, NY: Springer. doi: 10.1007/b97636
Calado, R., Lin, J., Rhyne, A. L., Araújo, R., and Narciso, L. (2003). Marine ornamental decapods: Popular, pricey, and poorly studied. J. Crustac. Biol. 23, 963–973.
Cannicci, S., Fratini, S., Meriggi, N., Bacci, G., Iannucci, A., Mengoni, A., et al. (2020). To the land and beyond: Crab microbiomes as a paradigm for the evolution of terrestrialization. Front. Microbiol. 11:575372. doi: 10.3389/fmicb.2020.575372
Cannicci, S., Simoni, R., and Giomi, F. (2011). Role of the embryo in crab terrestrialisation: An ontogenetic approach. Mar. Ecol. Prog. Ser. 430, 121–131. doi: 10.3354/meps08954
De Grave, S., Pentcheff, N. D., Ahyong, S. T., Chan, T., Crandall, K. A., Dworschak, P. C., et al. (2009). A classification of living and fossil genera of decapod Crustacea. Raffles Bull. Zool. Suppl. Ser. 21, 1–109.
Dufresne, F., and Jeffery, N. W. (2011). A guided tour of large genome size in animals: What we know and where we are heading. Chromosome Res. 19, 925–938. doi: 10.1007/s10577-011-9248-x
Ebeling, A. W., Atkin, N. B., and Setzer, P. Y. (1971). Genome sizes of teleostean fishes: Increases in some deep-sea species. Am. Nat. 105, 549–561.
Farrelly, C. A., and Greenaway, P. (1994). Gas exchange through the lungs and gills in air-breathing crabs. J. Exp. Biol. 187, 113–130.
Glazier, D. S. (2021). Genome size covaries more positively with propagule size than adult size: New insights into an old problem. Biology 10:270. doi: 10.3390/biology10040270
Grafen, A. (1989). The phylogenetic regression. Philos. Trans. R. Soc. Lond. B Biol. Sci. 326, 119–157. doi: 10.1098/rstb.1989.0106
Greenaway, P. (2003). Terrestrial adaptations in the Anomura (Crustacea: Decapoda). Mem. Mus. Vic. 60, 13–26. doi: 10.24199/j.mmv.2003.60.3
Gregory, T. R. (2002). Genome size and developmental complexity. Genetica 115, 131–146. doi: 10.1023/A:1016032400147
Gregory, T. R. (2021). Animal genome size database. Available online at: http://www.genomesize.com (accessed december 14, 2021).
Gregory, T. R., Hebert, P. D. N., and Kolasa, J. (2000). Evolutionary implications of the relationship between genome size and body size in flatworms and copepods. Heredity 84, 201–208. doi: 10.1046/j.1365-2540.2000.00661.x
Grime, J. P., and Mowforth, M. A. (1982). Variation in genome size—an ecological interpretation. Nature 299, 151–153. doi: 10.1038/299151a0
Hancock, Z. B., Hardin, F. O., Murthy, A., Hillhouse, A., and Johnston, J. S. (2021). Rapid genomic expansion and purging associated with habitat transitions in a clade of beach crustaceans (Amphipoda: Haustoriidae). J. Crustac. Biol. 41:ruab042. doi: 10.1093/jcbiol/ruab042
Hardie, D. C., and Hebert, P. D. N. (2004). Genome-size evolution in fishes. Can. J. Fish. Aquat. Sci. 61, 1636–1646. doi: 10.1139/f04-106
Hawkins, A. J., Jones, M., and Marsden, I. (1982). Aerial and aquatic respiration in two mud crabs, Helice crassa Dana (grapsidae) and Macrophthalmus hirtipes (Jacquinot) (Ocypodidae), in relation to habitat. Comp. Biochem. Physiol. A Physiol. 73, 341–347. doi: 10.1016/0300-9629(82)90165-7
Hawkins, A. J. S., and Jones, M. B. (1982). Gill area and ventilation in two mud crabs, Helice crassa Dana (Grapsidae) and Macrophthalmus hirtipes (Jacquinot) (Ocypodidae), in relation to habitat. J. Exp. Mar. Biol. Ecol. 60, 103–118. doi: 10.1016/0022-0981(82)90153-8
Herben, T., Suda, J., Klimešová, J., Mihulka, S., Øíha, P., and Šímová, I. (2012). Ecological effects of cell-level processes: Genome size, functional traits and regional abundance of herbaceous plant species. Ann. Bot. 110, 1357–1367. doi: 10.1093/aob/mcs099
Hessen, D. O., and Persson, J. (2009). Genome size as a determinant of growth and life-history traits in crustaceans. Biol. J. Linn. Soc. 98, 393–399. doi: 10.1111/j.1095-8312.2009.01285.x
Hsia, C. C. W., Schmitz, A., Lambertz, M., Perry, S. F., and Maina, J. N. (2013). Evolution of air breathing: Oxygen homeostasis and the transitions from water to land and sky. Compr. Physiol. 3, 849–915. doi: 10.1016/j.biotechadv.2011.08.021
Hultgren, K. M., Chak, S. T. C., Bjelajac, J., and Macdonald, K. S. (2021). Correlated evolution of larval development, egg size and genome size across two genera of snapping shrimp. J. Evol. Biol. 34, 1827–1839. doi: 10.1111/jeb.13945
Hultgren, K. M., Jeffery, N. W., Moran, A., and Gregory, T. R. (2018). Latitudinal variation in genome size in crustaceans. Biol. J. Linn. Soc. 123, 348–359. doi: 10.1093/biolinnean/blx153
Iannucci, A., Cannicci, S., Lin, Z., Yuen, K. W., Ciofi, C., Stanyon, R., et al. (2020). Cytogenetic of Brachyura (Decapoda): Testing technical aspects for obtaining metaphase chromosomes in six mangrove crab species. Caryologia 73, 39–49.
Jeffery, N. W. (2015). Genome size diversity and evolution in the Crustacea. Ph.D. thesis. Guelph, ON: University of Guelph.
Jeffery, N. W., Ellis, E. A., Oakley, T. H., and Gregory, T. R. (2017a). The genome sizes of ostracod crustaceans correlate with body size and evolutionary history, but not environment. J. Hered. 108, 701–706. doi: 10.1093/jhered/esx055
Jeffery, N. W., and Gregory, T. R. (2014). Genome size estimates for crustaceans using Feulgen image analysis densitometry of ethanol-preserved tissues. Cytom. A 85, 862–868. doi: 10.1002/cyto.a.22516
Jeffery, N. W., Yampolsky, L., and Gregory, T. R. (2017b). Nuclear DNA content correlates with depth, body size, and diversification rate in amphipod crustaceans from ancient Lake Baikal, Russia. Genome 60, 303–309. doi: 10.1139/gen-2016-0128
Knight, C. A., Molinari, N. A., and Petrov, D. A. (2005). The large genome constraint hypothesis: Evolution, ecology and phenotype. Ann. Bot. 95, 177–190. doi: 10.1093/aob/mci011
Legall, N., and Poupin, J. (2002). CRUSTA: Database of Crustacea (Decapoda and Stomatopoda), with special interest for those collected in French overseas territories. Available online at: http://crustiesfroverseas.free.fr/ (accessed July 26, 2020).
Lertzman-Lepofsky, G., Mooers, A. Ø., and Greenberg, D. A. (2019). Ecological constraints associated with genome size across salamander lineages. Proc. R. Soc. B Biol. Sci. 286:20191780. doi: 10.1098/rspb.2019.1780
Little, C. (2009). The colonisation of land. origins and adaptations of terrestrial animals. Cambridge: Cambridge University Press.
Martin, J. W., and Davis, G. E. (2001). An updated classification of the recent Crustacea. Los Angeles, CA: Natural history museum of Los Angeles county.
Michonneau, F., Brown, J. W., and Winter, D. J. (2016). rotl: An R package to interact with the Open Tree of Life data. Methods Ecol. Evol. 7, 1476–1481. doi: 10.1111/2041-210X.12593
Mundry, R. (2014). “Statistical issues and assumptions of phylogenetic generalized least squares,” in Modern Phylogenetic Comparative Methods and Their Application in Evolutionary Biology, ed. L. Garamszegi (Berlin: Springer), 131–153. doi: 10.1007/978-3-662-43550-2_6
Pagel, M. (1994). Detecting correlated evolution on phylogenies: A general method for the comparative analysis of discrete characters. Proc. R. Soc. Lond. Ser. B Biol. Sci. 255, 37–45. doi: 10.1098/rspb.1994.0006
Paoli, F., Wirkner, C. S., and Cannicci, S. (2015). The branchiostegal lung of Uca vocans (Decapoda: Ocypodidae): Unreported complexity revealed by corrosion casting and MicroCT techniques. Arthropod Struct. Dev. 44, 622–629. doi: 10.1016/j.asd.2015.09.006
Paradis, E., Claude, J., and Strimmer, K. (2004). APE: Analyses of phylogenetics and evolution in R language. Bioinformatics 20, 289–290. doi: 10.1093/bioinformatics/btg412
Pennell, M. W., Eastman, J. M., Slater, G. J., Brown, J. W., Uyeda, J. C., FitzJohn, R. G., et al. (2014). geiger v2.0: An expanded suite of methods for fitting macroevolutionary models to phylogenetic trees. Bioinformatics 30, 2216–2218. doi: 10.1093/bioinformatics/btu181
Pinheiro, J., and Bates, D. R Core Team (2022). nlme: Linear and nonlinear mixed effects models. R package version 3.1-158. Available online at: https://CRAN.R-project.org/package=nlme
Rees, D. J., Dufresne, F., Glémet, H., and Belzile, C. (2007). Amphipod genome sizes: First estimates for Arctic species reveal genomic giants. Genome 50, 151–158. doi: 10.1139/G06-155
Revell, L. J. (2010). Phylogenetic signal and linear regression on species data. Methods Ecol. Evol. 1, 319–329. doi: 10.1111/j.2041-210X.2010.00044.x
Ritchie, H., Jamieson, A. J., and Piertney, S. B. (2017). Genome size variation in deep-sea amphipods. R. Soc. Open Sci. 4:170862. doi: 10.1098/rsos.170862
Smith, E. M., and Gregory, T. R. (2009). Patterns of genome size diversity in the ray-finned fishes. Hydrobiologia 625, 1–25. doi: 10.1007/s10750-009-9724-x
Suda, J., Meyerson, L. A., Leitch, I. J., and Pyšek, P. (2015). The hidden side of plant invasions: The role of genome size. New Phytol. 205, 994–1007. doi: 10.1111/nph.13107
Vogt, G. (2013). Abbreviation of larval development and extension of brood care as key features of the evolution of freshwater Decapoda. Biol. Rev. 88, 81–116. doi: 10.1111/j.1469-185X.2012.00241.x
Watson-Zink, V. M. (2021). Making the grade: Physiological adaptations to terrestrial environments in decapod crabs. Arthropod Struct. Dev. 64:101089. doi: 10.1016/j.asd.2021.101089
Weihrauch, D., Morris, S., and Towle, D. W. (2004). Ammonia excretion in aquatic and terrestrial crabs. J. Exp. Biol. 207, 4491–4504. doi: 10.1242/jeb.01308
White, M. M., and McLaren, I. A. (2000). Copepod development rates in relation to genome size and 18S rDNA copy number. Genome 43, 750–755. doi: 10.1139/gen-43-5-750
WoRMS Editorial Board (2022). World register of marine species. Available from https://www.marinespecies.org at VLIZ (accessed July 25, 2022).
Keywords: C-value, flow cytometry, development, Anomura, Astacidea, Brachyura, terrestrialization
Citation: Iannucci A, Saha A, Cannicci S, Bellucci A, Cheng CLY, Ng KH and Fratini S (2022) Ecological, physiological and life-history traits correlate with genome sizes in decapod crustaceans. Front. Ecol. Evol. 10:930888. doi: 10.3389/fevo.2022.930888
Received: 28 April 2022; Accepted: 18 July 2022;
Published: 04 August 2022.
Edited by:
Lisa Locatello, Zoological Station Anton Dohrn, ItalyReviewed by:
Kristin Hultgren, Seattle University, United StatesCopyright © 2022 Iannucci, Saha, Cannicci, Bellucci, Cheng, Ng and Fratini. This is an open-access article distributed under the terms of the Creative Commons Attribution License (CC BY). The use, distribution or reproduction in other forums is permitted, provided the original author(s) and the copyright owner(s) are credited and that the original publication in this journal is cited, in accordance with accepted academic practice. No use, distribution or reproduction is permitted which does not comply with these terms.
*Correspondence: Stefano Cannicci, Y2FubmljY2lAaGt1Lmhr
†These authors have contributed equally to this work
Disclaimer: All claims expressed in this article are solely those of the authors and do not necessarily represent those of their affiliated organizations, or those of the publisher, the editors and the reviewers. Any product that may be evaluated in this article or claim that may be made by its manufacturer is not guaranteed or endorsed by the publisher.
Research integrity at Frontiers
Learn more about the work of our research integrity team to safeguard the quality of each article we publish.