 Qimeng Ning1
 Xiao Ouyang
95% of researchers rate our articles as excellent or good
Learn more about the work of our research integrity team to safeguard the quality of each article we publish.
Find out more
ORIGINAL RESEARCH article
Front. Ecol. Evol. , 17 June 2022
Sec. Environmental Informatics and Remote Sensing
Volume 10 - 2022 | https://doi.org/10.3389/fevo.2022.912127
This article is part of the Research Topic Meta-Scenario Computation for Social-Geographical Sustainability View all 60 articles
Understanding the pattern and quality of construction land expansion in urban agglomerations is important for new urbanization and high-quality development of land spaces. Taking urban agglomeration in the middle reaches of the Yangtze River as the research object, this study analyzes the spatio-temporal pattern and quality level of construction land expansion at various scales using remote sensing images, the expansion intensity index, the coordination degree model, and the Tapio elastic decoupling model. The results show that from 2000 to 2020, (1) the construction land scale of urban agglomeration in the study area had expanded, with significant stage characteristics and spatial differentiation patterns. (2) The overall relationship between the construction land and the population in urban agglomerations was found to be uncoordinated, but the coordination degree had been improved. The optimization of human–land coordination was faster at the metropolitan scale than at the overall level and the sub-urban agglomerations. (3) The decoupling relationship between the overall construction land and the economy in urban agglomerations was weak and had improved. The coupling/decoupling relationship was found to be better at the metropolitan scale than at the overall level and sub-urban agglomerations.
Mainly due to urbanization and industrialization, the expansion of construction lands is a significant change in the earth’s surface and is reflected in the transformation of natural and agricultural lands into non-agricultural lands (Lv and Huang, 2013). China has been experiencing rapid urbanization and construction land expansion since 1978, and the area of construction land in 2018 was 8.34 times the level in 1981 (Ministry of Housing and Urban-Rural Development, 2018). But the neglect of the quality of construction land expansion for a long time leads to a series of problems such as wild growth, environmental pollution, and low efficiency (Wang et al., 2018b). The quality of construction land expansion describes the comprehensive utilization and level of newly added construction land, and high-quality development is achieved by the resonance and coordination of people, land, and industry (Liu et al., 2021). In 2017, the Chinese government put forward the concept of high-quality development and emphasized the coordination between regional people, land, and industry. In this context, seeking the path to improve the quality of construction land expansion has become an important issue of academic concern.
Urban agglomeration is the main form of urbanization and industrialization and is more crucial to China’s participation in global competition and cooperation (Yao et al., 2016). In recent decades, China’s urban agglomerations have developed rapidly. The spatial scope of some urban agglomerations has been greatly expanded and is characterized by rapid population agglomeration and economic growth (Fang, 2014), which contend with increasingly tense contradictions between people, land, and industry (Fang, 2018; Liu et al., 2019). How to promote the high-quality expansion of construction land in urban agglomerations and address the conflicts and contradicting demands of people, land, and industry has become an important research topic in China’s urbanization development and territorial space development. The expansion of construction land has always been a key issue in academic circles, and previous research has mainly focused on space–time patterns (Li et al., 2020b), driving mechanisms (Wu et al., 2021), simulation prediction (Li et al., 2021), and expansion effect (Yang et al., 2020). As ecological, social, urban heat, and other problems become more serious during the expansion process (Zhao et al., 2018, 2021; Wei et al., 2021; He et al., 2022), and China’s transition to high-quality development is accelerating, the quality of construction land expansion has become a prominent research topic in geographical science, land science, ecological science, and other disciplines. One of the primary research focuses has been on understanding the relationships between construction land expansion and economic development or the ecological environment (Li et al., 2020c; Chen et al., 2022; Yi et al., 2022). For example, Li et al. (2020c) used Liaoning Province to explore the relationship between construction land expansion and the population and the economy. But in general, most of the existing research studies still discuss the expansion of construction land, while the research on the expansion quality of construction land is still insufficient.
As the role of urban agglomeration in the new urbanization and regional spatial organization is growing increasingly, land expansion and quality research on urban agglomeration have gained the attention of scholars, and the related research results are mainly distributed in the efficiency of urban construction land expansion (Yu et al., 2019; Li et al., 2021), the relationship between population growth and economic growth (Li et al., 2018; Xiao et al., 2021), and the ecological function value changes (Ouyang et al., 2021a). Ouyang (Ouyang et al., 2021b) studied the relationship between the urban agglomeration construction space and the ecological function value in China. However, most of the current research studies are just based on a single aspect, and there is a lack of multi-scale comparative analysis on urban agglomerations.
Urban agglomeration in the middle reaches of the Yangtze River is an important part of the Yangtze River Economic Belt and an important growth pole of the central region in China. In the long process of urbanization and industrialization, it faces numerous problems, such as population imbalance and land pollution caused primarily by urban expansion, and its land ecology is fragile (Shen et al., 2019). Moreover, the development level of each sub-urban agglomeration varies significantly, with each having its unique characteristics in terms of construction land expansion and its connection with the economy and society. On March 30, 2021, the Political Bureau of the CPC Central Committee held a meeting to review “the Guideline on Promoting the High-Quality Development of the Country’s Central Region in the New Era.” The Bureau pointed out that it is crucial to promote the development of urban agglomeration in the middle reaches of the Yangtze River and the Central Plain urban agglomeration. Understanding the spatio-temporal changes and expansion quality levels of its construction land is crucial to help promote high-quality of urbanization and territorial space optimization.
Therefore, this study takes urban agglomeration in the middle reaches of the Yangtze River as an example, uses Landsat TM/ETM remote sensing data, and combines the expansion intensity index, coordination degree model, and Tapio elastic decoupling model to study the spatio-temporal process and quality level of urban agglomeration construction land expansion, to supplement and expand the existing literature. This study mainly aims to (1) explore the spatio-temporal pattern and characteristics of construction land expansion based on multi-scale comparative analyses and (2) evaluate the quality of construction land expansion in urban agglomerations from a human–land–industry coordination perspective and then provide a better understanding and support to the department about land planning and urban planning.
Urban agglomeration in the middle reaches of the Yangtze River includes three regional urban agglomerations, Wuhan (WH), Poyang Lake (PY), and Changsha–Zhuzhou–Xiangtan (CZT), encompassing 13 cities in Hubei, eight cities in Hunan, and 10 cities in Jiangxi and covering a total area of 317,000 square kilometers (Figure 1). Setting the research scope to the metropolitan scale, we used documents from the “Wuhan Comprehensive Planning (2017–2035),” the “Changsha Comprehensive Planning (2017–2035),” and the “Greater Nanchang Metropolitan Area Development Planning (2019–2025)” for this study. The Wuhan metropolitan area is composed of 17 research units, including the Wuhan municipal area; the Changsha metropolitan area comprising 15 research units, including the Changsha municipal area; and the Nanchang metropolitan area, including the Nanchang municipal area. In total, there are 17 research units in 49 counties, cities, and urban areas.
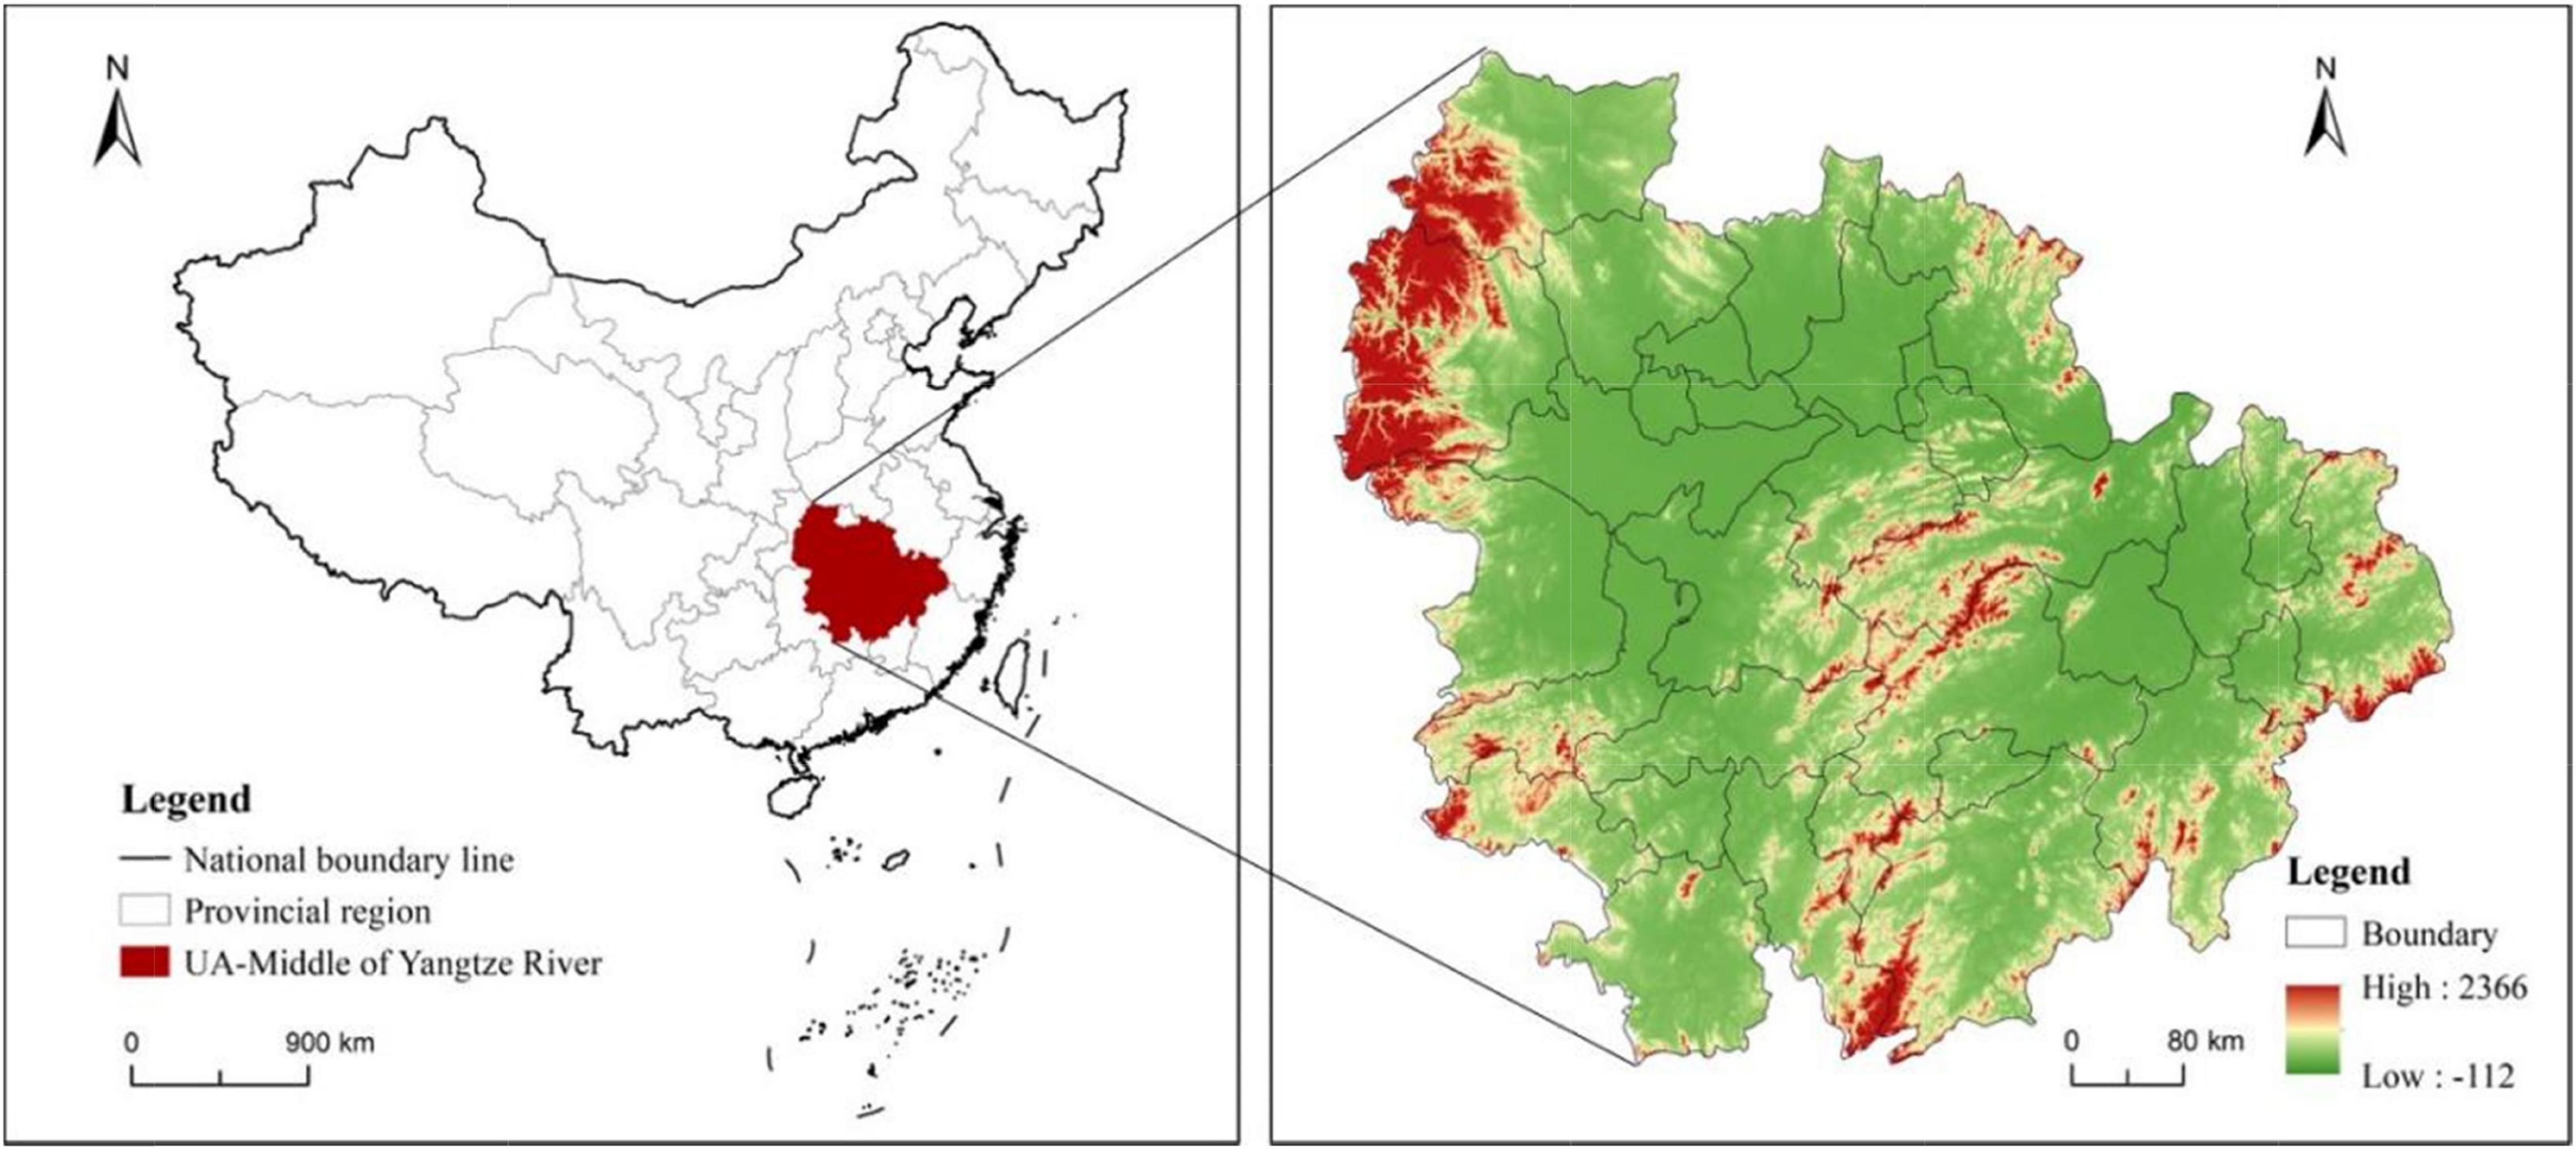
Figure 1. Location of the study area and its basic geomorphology.
We collected Landsat TM/ETM remote sensing images during the summer months for the years 2000, 2005, 2010, 2015, and 2020. We then adjusted and corrected the images, including band composition, geodetic datum correction, and ground control point calibration. The construction land included the urban land, rural residential land, and other construction lands. The population and GDP data were obtained from the “Hubei Statistical Yearbook,” “Hunan Provincial Statistical Yearbook,” “Jiangxi Provincial Statistical Yearbook,” and the statistical bulletins of some prefectures and cities. Since some data from 2000 had been missing, we used relevant data from 2001 or 2002 and calculated the values using the change rate.
The expansion intensity index refers to the product of the newly added construction land, which can directly reflect the change rate of the construction land in a certain regional unit (Wang et al., 2018a). The expansion intensity index was used in this study to represent the time sequence state of urban agglomeration construction land expansion, given by the formula:
where UEIn is the urban land expansion intensity index of the Nth urban agglomeration, is the urban land area of the Nth urban agglomeration in the t1 time period, is the urban land area of the Nth urban agglomeration in the t2 time period, and Δt is the interval year from t1 to t2.
The urban land expansion intensity differentiation index is the ratio of the intensity of land use expansion for a particular urban agglomeration to the urban expansion intensity of all urban agglomerations, reflecting the heterogeneity in the expansion intensity among different urban areas agglomerations (Wang et al., 2018a). The index can be used in the horizontal comparative study of urban land expansion in urban agglomerations and to compare the variations in urban land expansion intensity of different urban agglomerations in the same period. In this study, we used the expansion intensity differentiation index to characterize the spatial patterns of construction land expansion in urban agglomeration. The formula used is as follows:
where UEDIn is the urban land expansion intensity differentiation index of the Nth urban agglomeration.
After the reform and its opening up, China has experienced rapid urbanization and industrialization. The rapid growth and the agglomeration of the population and economy have accelerated the outward expansion of construction lands. Due to the influence of the urban–rural dual structure system and the concept of extensive development, numerous problems have emerged, such as the indiscriminate proliferation of construction lands, increased environmental pollution, and inefficient and wasteful land use. These challenges are directly related to the incongruity of construction land expansion with population, economic, and ecological development. Therefore, quantifying the coordination between land, economy, and society is an important foundation for scientifically understanding the quality of construction land expansion and optimizing and coordinating the man–land relationship.
The coordination degree model is a quantitative method to measure the degree of coordination between systems or elements, which can be used to evaluate the consistency and coordination among various elements (Li et al., 2020a). In this study, the coordination degree model was used to explore the relationship between construction land expansion and population development, given by the following equations:
where X and Y are the population growth rate and construction land growth rate, respectively; Pt and Pt1 are the resident population at time t and time t1, respectively; Lt and Lt1 are the construction land area at time t and time t1, respectively; and C is to the coordination degree (−1.414≤C≤1.414). The coordination types were divided into coordinated (C) (1.40≤C), relatively coordinated (RC) (1.35≤C≤1.40), relatively uncoordinated (RUC) (1.30≤C≤1.35), and uncoordinated (UC) (C≤1.30).
The Tapio elastic decoupling model was developed to study the relationship between European economic growth, traffic conditions, and carbon emissions (Tapio, 2005). This approach has been shown to effectively analyze the relationship between different systems or elements. This study used the Tapio model to explore the relationship between construction land expansion and economic growth. The calculation formula is as follows:
where T is the decoupling index, Lt and Lt1 are the total construction land area of the geographical unit in years t, and GDPt and GDPt1 are the gross domestic production (GDP) of the geographical unit in years t and t1, respectively. From 2000 to 2020, the construction land and the GDP of all cities in the study area had increased. Both ΔL and ΔG were greater than 0, the Tapio index values ranged between 0.1 and 0.8, and the regional “construction land–economy” exhibited weak decoupling.
To further investigate the changes at different years and different internal units and also to consider the actual conditions in the study area, we subdivided the weak decoupling (WD) into three types according to the natural fracture point classification method: high WD (HWD, ΔL > 0,ΔG > 0,0≤T < 0.1), moderate WD (MWD, ΔL > 0,ΔG > 0,0.1≤T < 0.5), and low WD (LWD, ΔL > 0,ΔG > 0,0.5≤T < 0.8).
Based on the expansion intensity values computed at different scales and perspectives (see Table 1), the expansion intensity of the construction land in the study area exhibited distinct stage characteristics and pronounced differences. The expansion intensity indices for 2000–2005, 2005–2010, 2010–2015, and 2015–2020 were 2.32%, 1.26%, 5.29%, and 3.81%, respectively. Based on these values, the expansion can be divided into three stages. From 2000 to 2010, the first stage exhibited low-speed expansion, with an expansion intensity index lower than 2.5%. At this stage, the urban agglomeration was in the primary cultivation stage, presenting a relatively low regional development level and relatively weak expansion intensity. In the second stage, from 2010 to 2015, the expansion intensity index accelerated and reached its peak. Here, the urban agglomeration was in the stage of rapid development, with the regional economy and society quickly developing. Demands for industrial and residential lands had also increased significantly, causing the accelerated expansion of the construction land. The third stage covered the period 2015–2020, where the urban agglomeration was in a stable development stage, and the expansion rate had decreased. During this period, the focus was on the quality of construction land expansion, resulting in a decrease in expansion intensity.
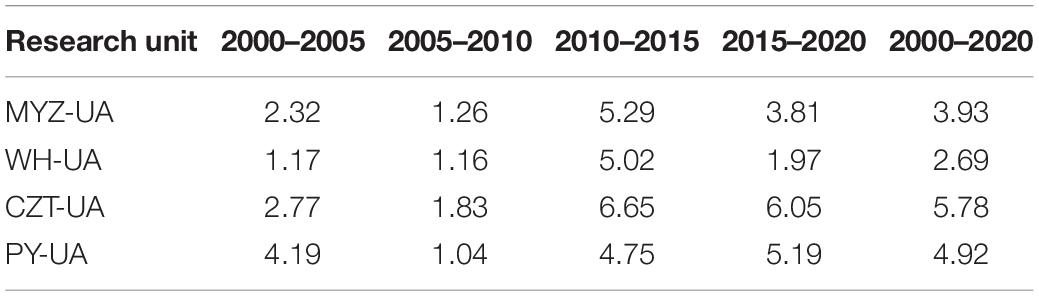
Table 1. Intensity index of construction land expansion from 2000 to 2020 (%).
At the sub-urban agglomeration scale, the temporal characteristics of construction land expansion were comparable to those of the entire research area. The first and third stages of the WH-UA had a low expansion intensity, with urban expansion intensity index (UEI) below 1.50%, while the second stage expanded rapidly, with a 5.02% UEI. The first stage of the CZT-UA had a comparatively low expansion intensity, with a UEI lower than 3.00%, whereas the second and third stages both exceeded 6.00%, with the second stage at 6.65%. The temporal change in the construction land expansion in the PY-UA was slightly different from the overall pattern. In the second half of the first stage, the expansion intensity dropped significantly, with the UEI decreasing from 4.19% to 1.04%. The third stage was slightly stronger than the second stage, with the UEI increasing from 4.75% to 5.19%.
The temporal characteristics of construction land expansion at the metropolitan scale were similar to those of the other two scales. The expansion intensity index showed a rising–falling–rising trend, while the growth in the different metropolitan areas exhibited significant differences. As shown in Table 2, the Wuhan metropolitan area had the lowest overall expansion intensity, decreasing slightly during the study period. Compared to 2000–2005, the UEI for 2015–2020 declined by 0.19%. In comparison, the overall expansion intensity was the highest in the Changsha metropolitan area. During this period, the overall expansion intensity increased, with the UEI rising by 1.04%. The overall expansion intensity of the Nanchang metropolitan area was weaker than that of Changsha, with its overall expansion intensity increasing only slightly and the UEI rising by 0.16% for 2000–2020.
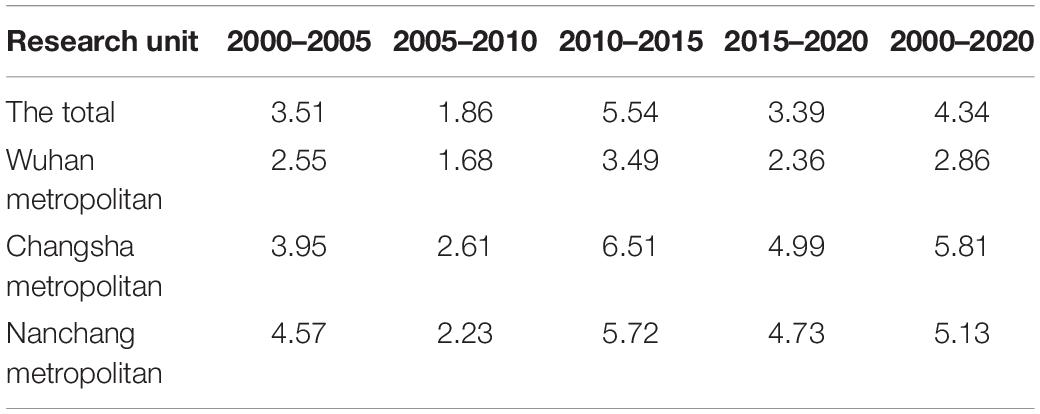
Table 2. Intensity index of construction land expansion in three metropolitan regions from 2000 to 2020 (%).
There were distinct spatial differences in the construction land expansion in the study area (Figure 2). For the given study period, the high-value areas in expansion intensity were concentrated in the CZT-UA, mid-value regions were mainly in the PY-UA, and the low-value areas were situated primarily in the WH-UA. The results suggest that the CZT-UA had expanded most rapidly, followed by the PY-UA, and the WH-UA’s expansion had been the slowest. The relatively low expansion rate was due to the large expanse of the construction land in the WH-UA. This is consistent with the analysis results of the expansion intensity index mentioned before. In comparison, the expansion in the CZT-UA had significantly accelerated due to the construction of numerous high-tech, economic development, and new national-level zones.
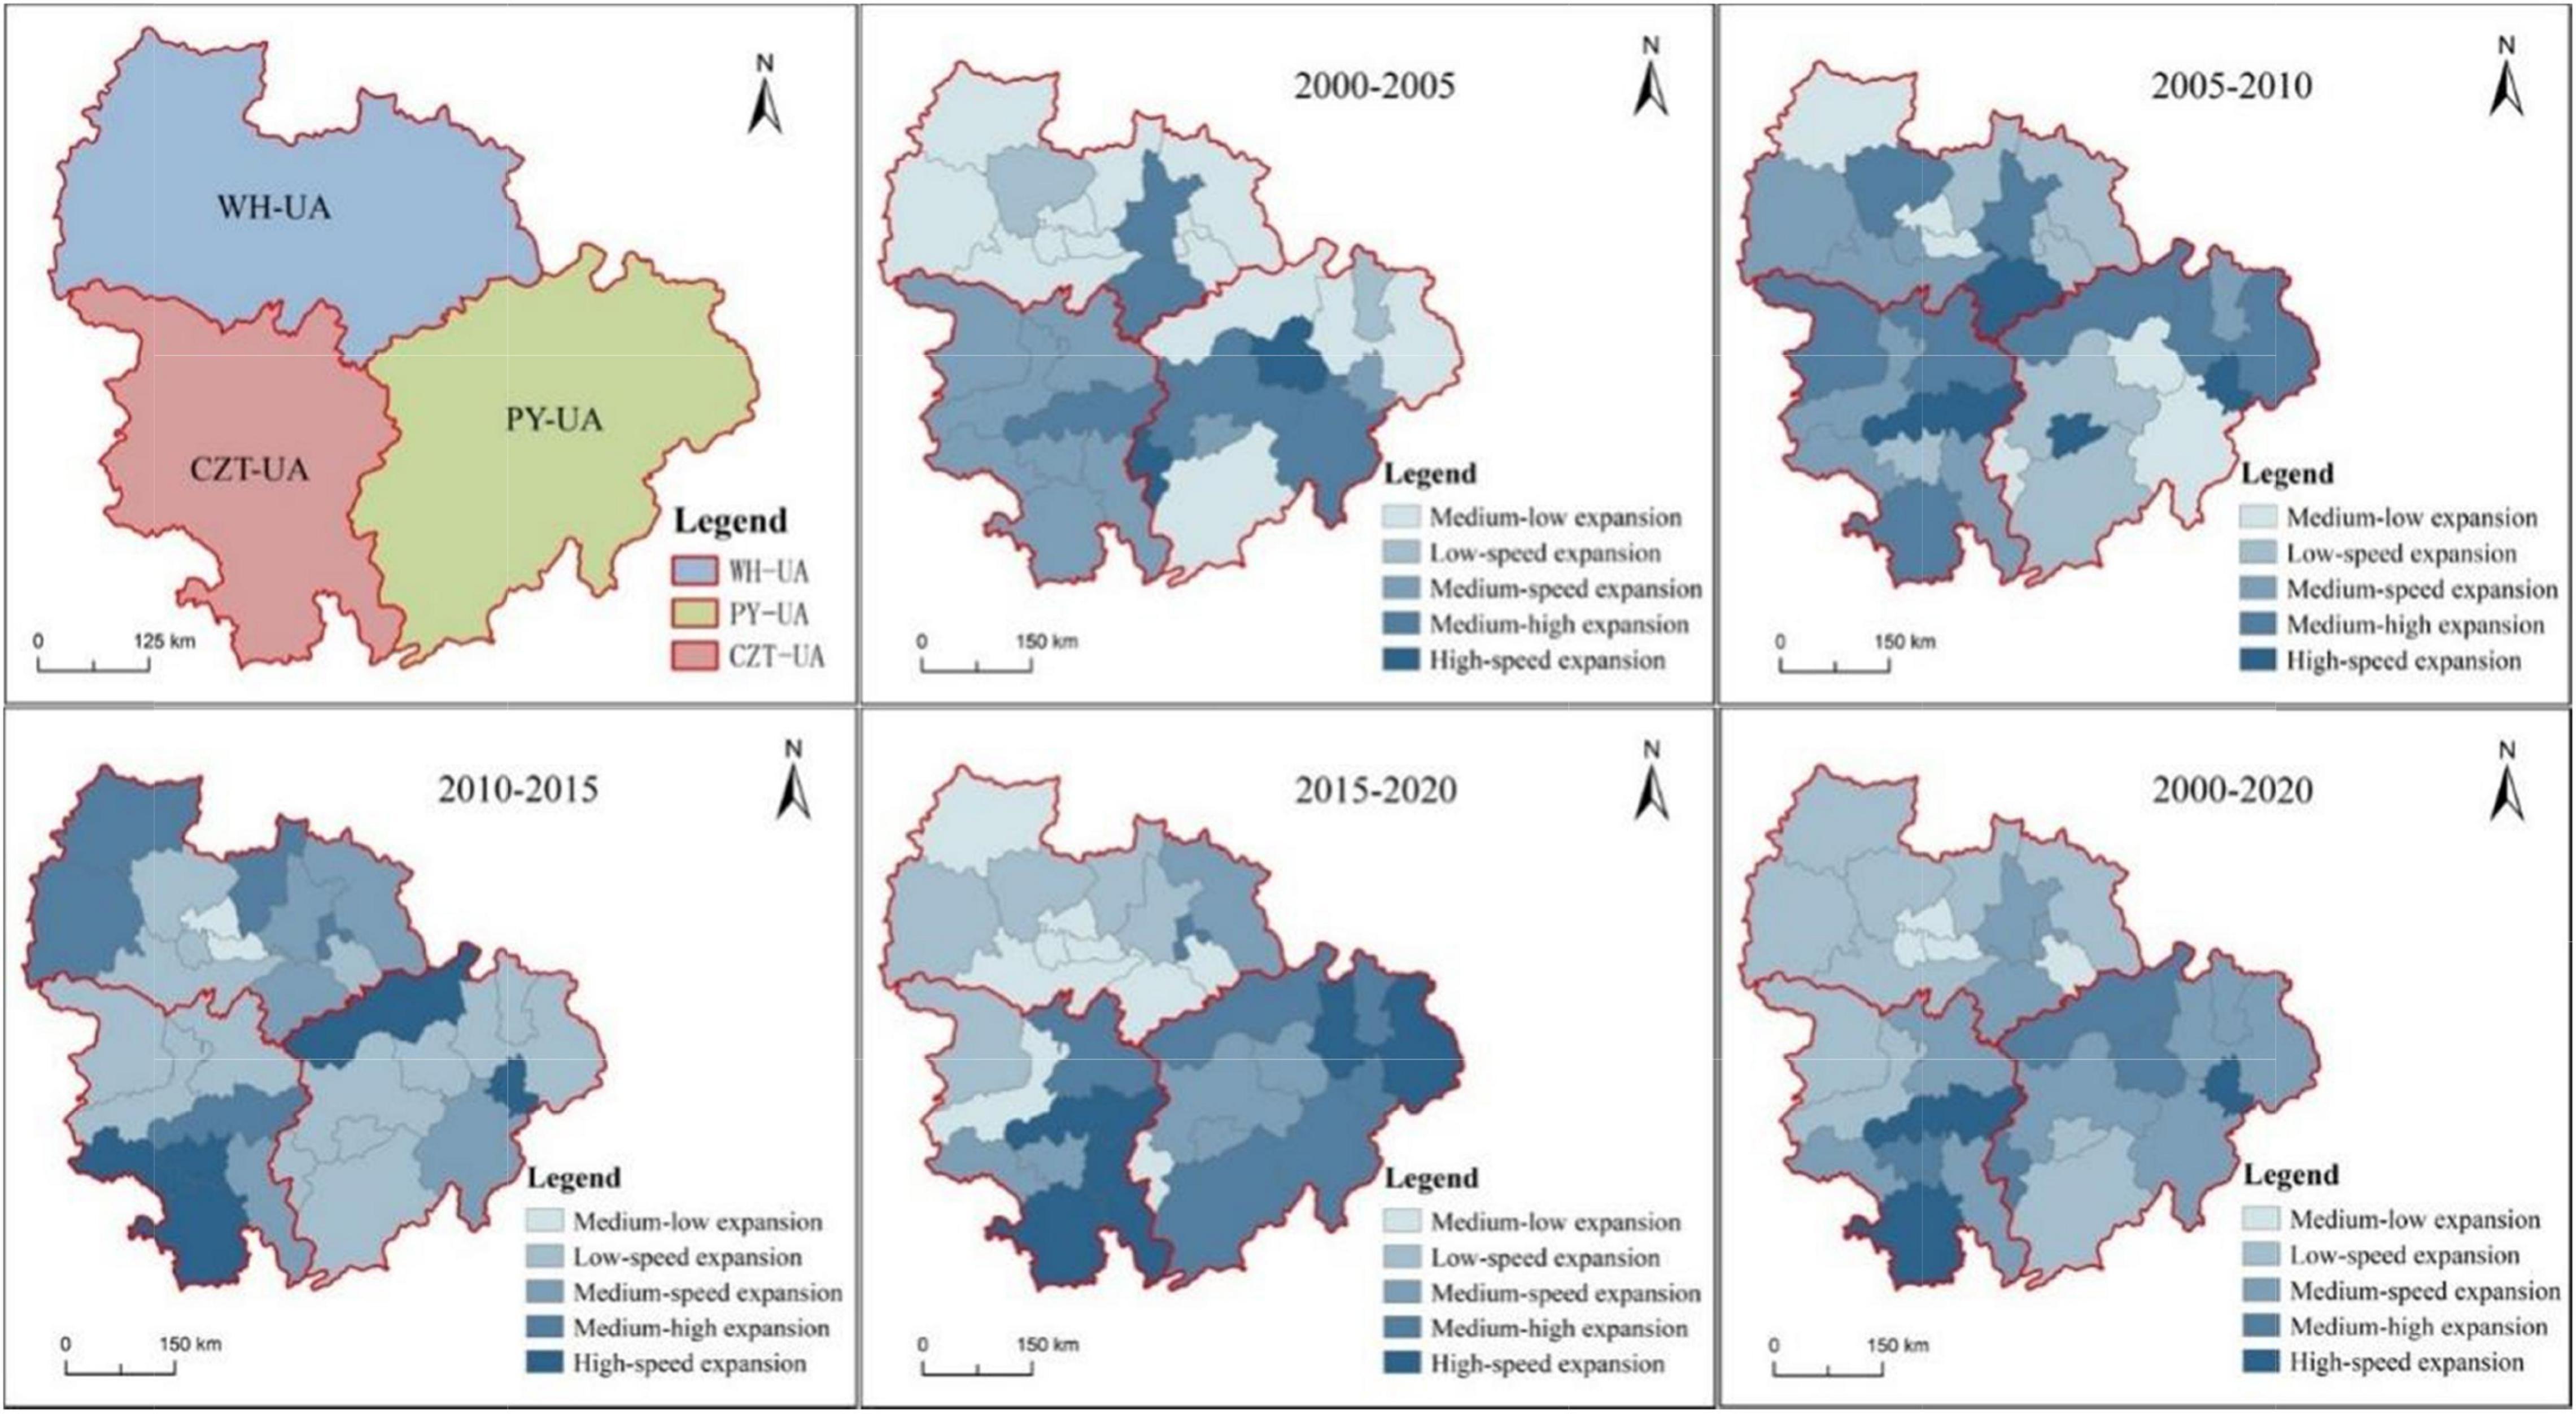
Figure 2. Spatial pattern of difference of construction land expansion intensity from 2000 to 2020.
For the PY-UA, the development of the high-speed expansion areas and the area’s rapid growth mainly occurred from 2000 to 2005. In particular, Nanchang and Pingxiang cities expanded the fastest, with urban expansion intensity differentiation index (UEDI) indexes reaching 6.37 and 8.14, respectively. Many medium- and low-speed expansion areas were found in the CZT-UA, while the WH-UA mainly had low-speed expansion areas. From 2005 to 2010, high-speed expansion areas were distributed throughout the three sub-urban agglomerations, but the number was small; only Changsha, Xianning, and Xinyu cities had high-speed expansion. Medium- and low-speed expansion areas were mostly found in WH-UA and CZT-UA, while slower expansion areas were mainly in the PY-UA.
From 2010 to 2015, Xiangtan, Loudi, Hengyang, Jiujiang, and Yingtan cities from the CZT-UA and the PY-UA experienced high-speed expansion. The medium-high expansion areas were found mainly in the WH-UA, while the medium-speed expansion area was distributed in many cities in all three urban agglomerations. The medium- to low-speed expansion areas were located primarily in the PY-UA, and the low-speed expansion areas were only found in the WH-UA. For 2015–2020, the high- and medium-speed expansion areas were concentrated in the PY-UA and the CZT-UA, while the medium- and low-speed expansion areas were mainly in the WH-UA.
There were also pronounced spatial differences in construction land expansion in the three major metropolitan regions (Figure 3). From 2000 to 2020, the UEDI for the Wuhan metropolitan area was generally low, and the expansion intensity was relatively weak. The UEDI for the Changsha and Nanchang metropolitan areas was not significantly different, but the expansion intensity of Changsha was slightly greater than that of Nanchang. From 2000 to 2005, the construction land in the Nanchang metropolitan area expanded rapidly, with a UEDI of 1.70, and the high-speed expansion areas were concentrated in the Nanchang municipal area, Xinjian district, Jing’an county, and Fengxin county. The expansion of the Wuhan metropolitan area was relatively slow, with low-speed expansion areas found mainly in Macheng, Tuanfeng, Ezhou, Xiantao, Hanchuan, and areas around the municipal area. From 2005 to 2010, the construction lands in the Changsha and Nanchang metropolitan areas expanded rapidly, with similar UEDI; the high-speed expansion areas were concentrated in Changsha county, Ningxiang city, Jing’an county, and Fengxin county.
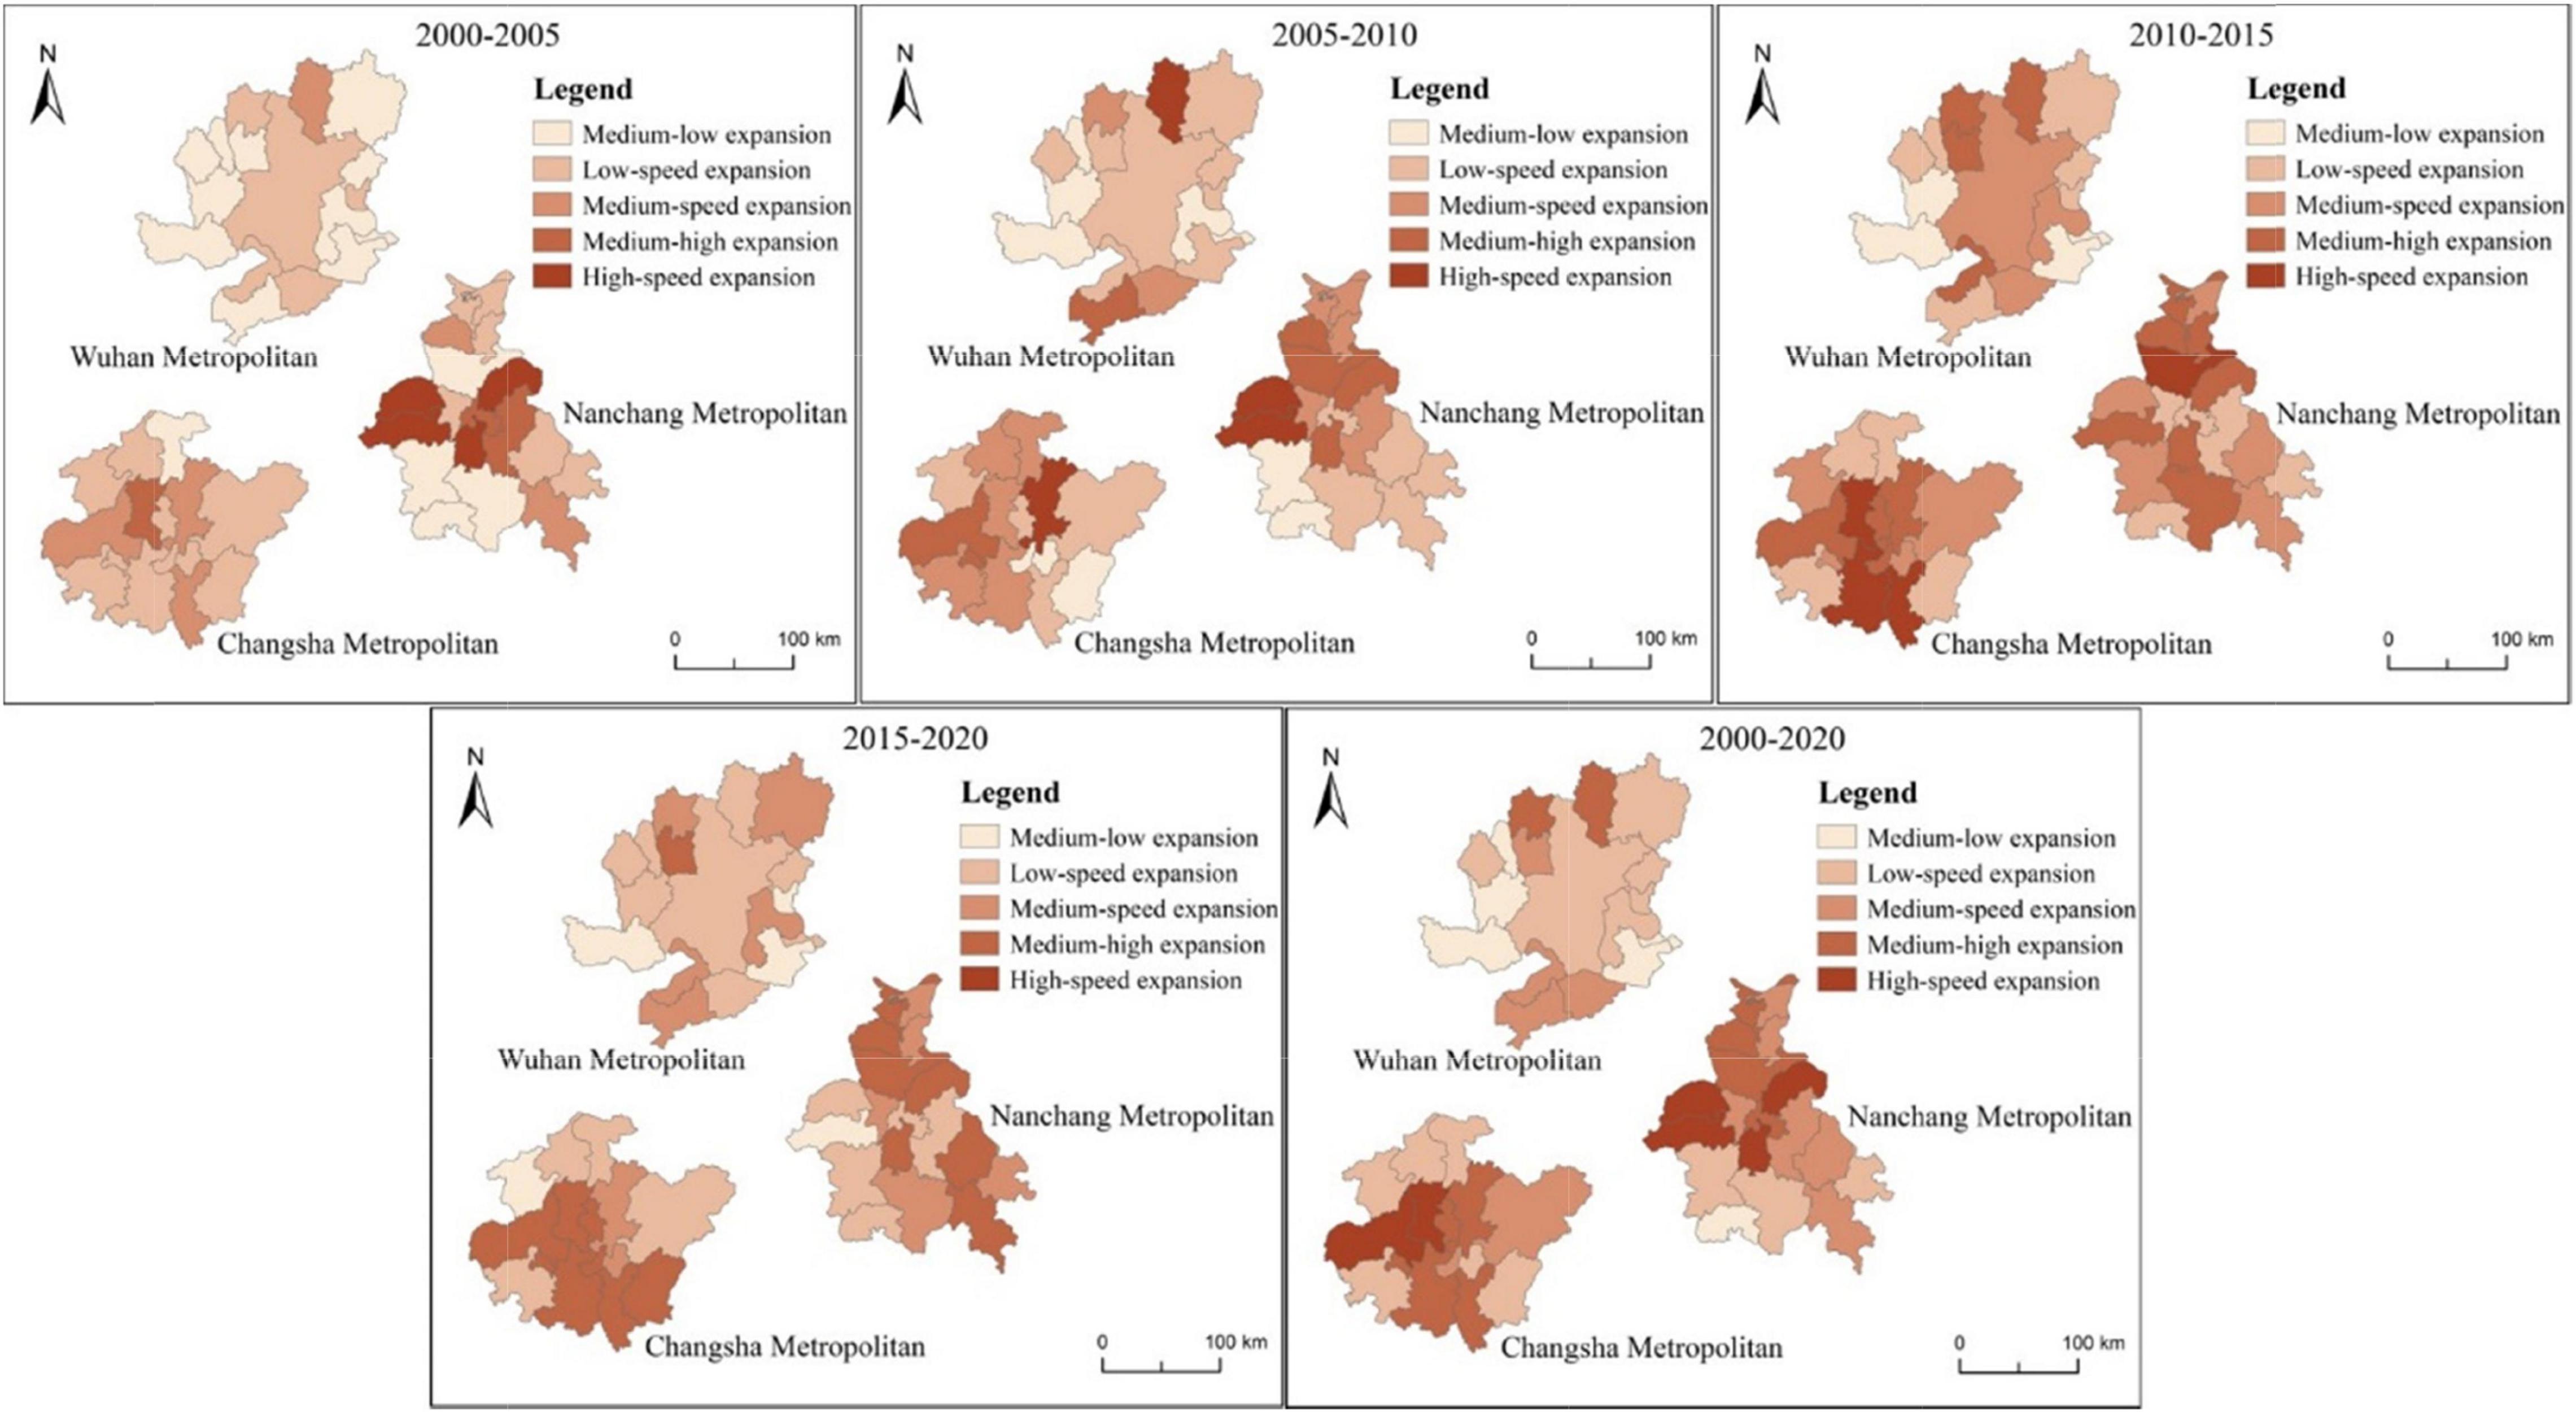
Figure 3. Spatial pattern of difference of construction land expansion intensity in three metropolitan regions from 2000 to 2020.
From 2010 to 2015, the construction lands in the Changsha metropolitan area continued to expand, with a UEDI of 1.41; the high-speed expansion areas were mainly in Wangcheng district, Xiangtan county, and Zhuzhou county. From 2015 to 2020, the expansion intensities of the three metropolitan areas decreased, and there were no high-speed expansion areas. During this period, the expansion rate of the Changsha metropolitan area was relatively fast, with a UEDI of 1.36. Medium-high expansion areas were located in Changsha municipal district, Wangcheng district, Ningxiang city, Xiangtan city, Xiangtan county, Zhuzhou county, and Liling city and were distributed contiguously.
High-quality development is largely characterized by sustainable growth, which can address people’s growing needs and tackle unbalanced and insufficient development. It encompasses various aspects of development, such as efficiency improvements, structural optimization, and coordination and order. High-quality development of construction lands is crucial to meet the spatial needs for production, living, and ecological activities; support the optimal allocation of resources; improve land-use efficiency; and help create a harmonious relationship between people and land.
While population and economy are important driving factors in construction land expansion, they are also major carriers of challenges and contradictions. The coupling and coordination of construction land, population, and economy can reflect the quality of urban expansion. In this study, we characterized the quality of construction land expansion by measuring the coordination degree of “construction land–population” and the coupling/decoupling degree of “construction land–economy.”
The “construction land–population” coordination degree was generally uncoordinated, varying at different periods but exhibiting a generally fluctuating upward trend (Figure 4). In 2000–2005, the coordination index between construction land and population was 1.212, and the coordination type was UC. For 2005–2010 and 2010–2015, the coordination type developed into RUC. In 2015–2020, the coordination index was 1.343, and the coordination type transitioned from RUC to RC.
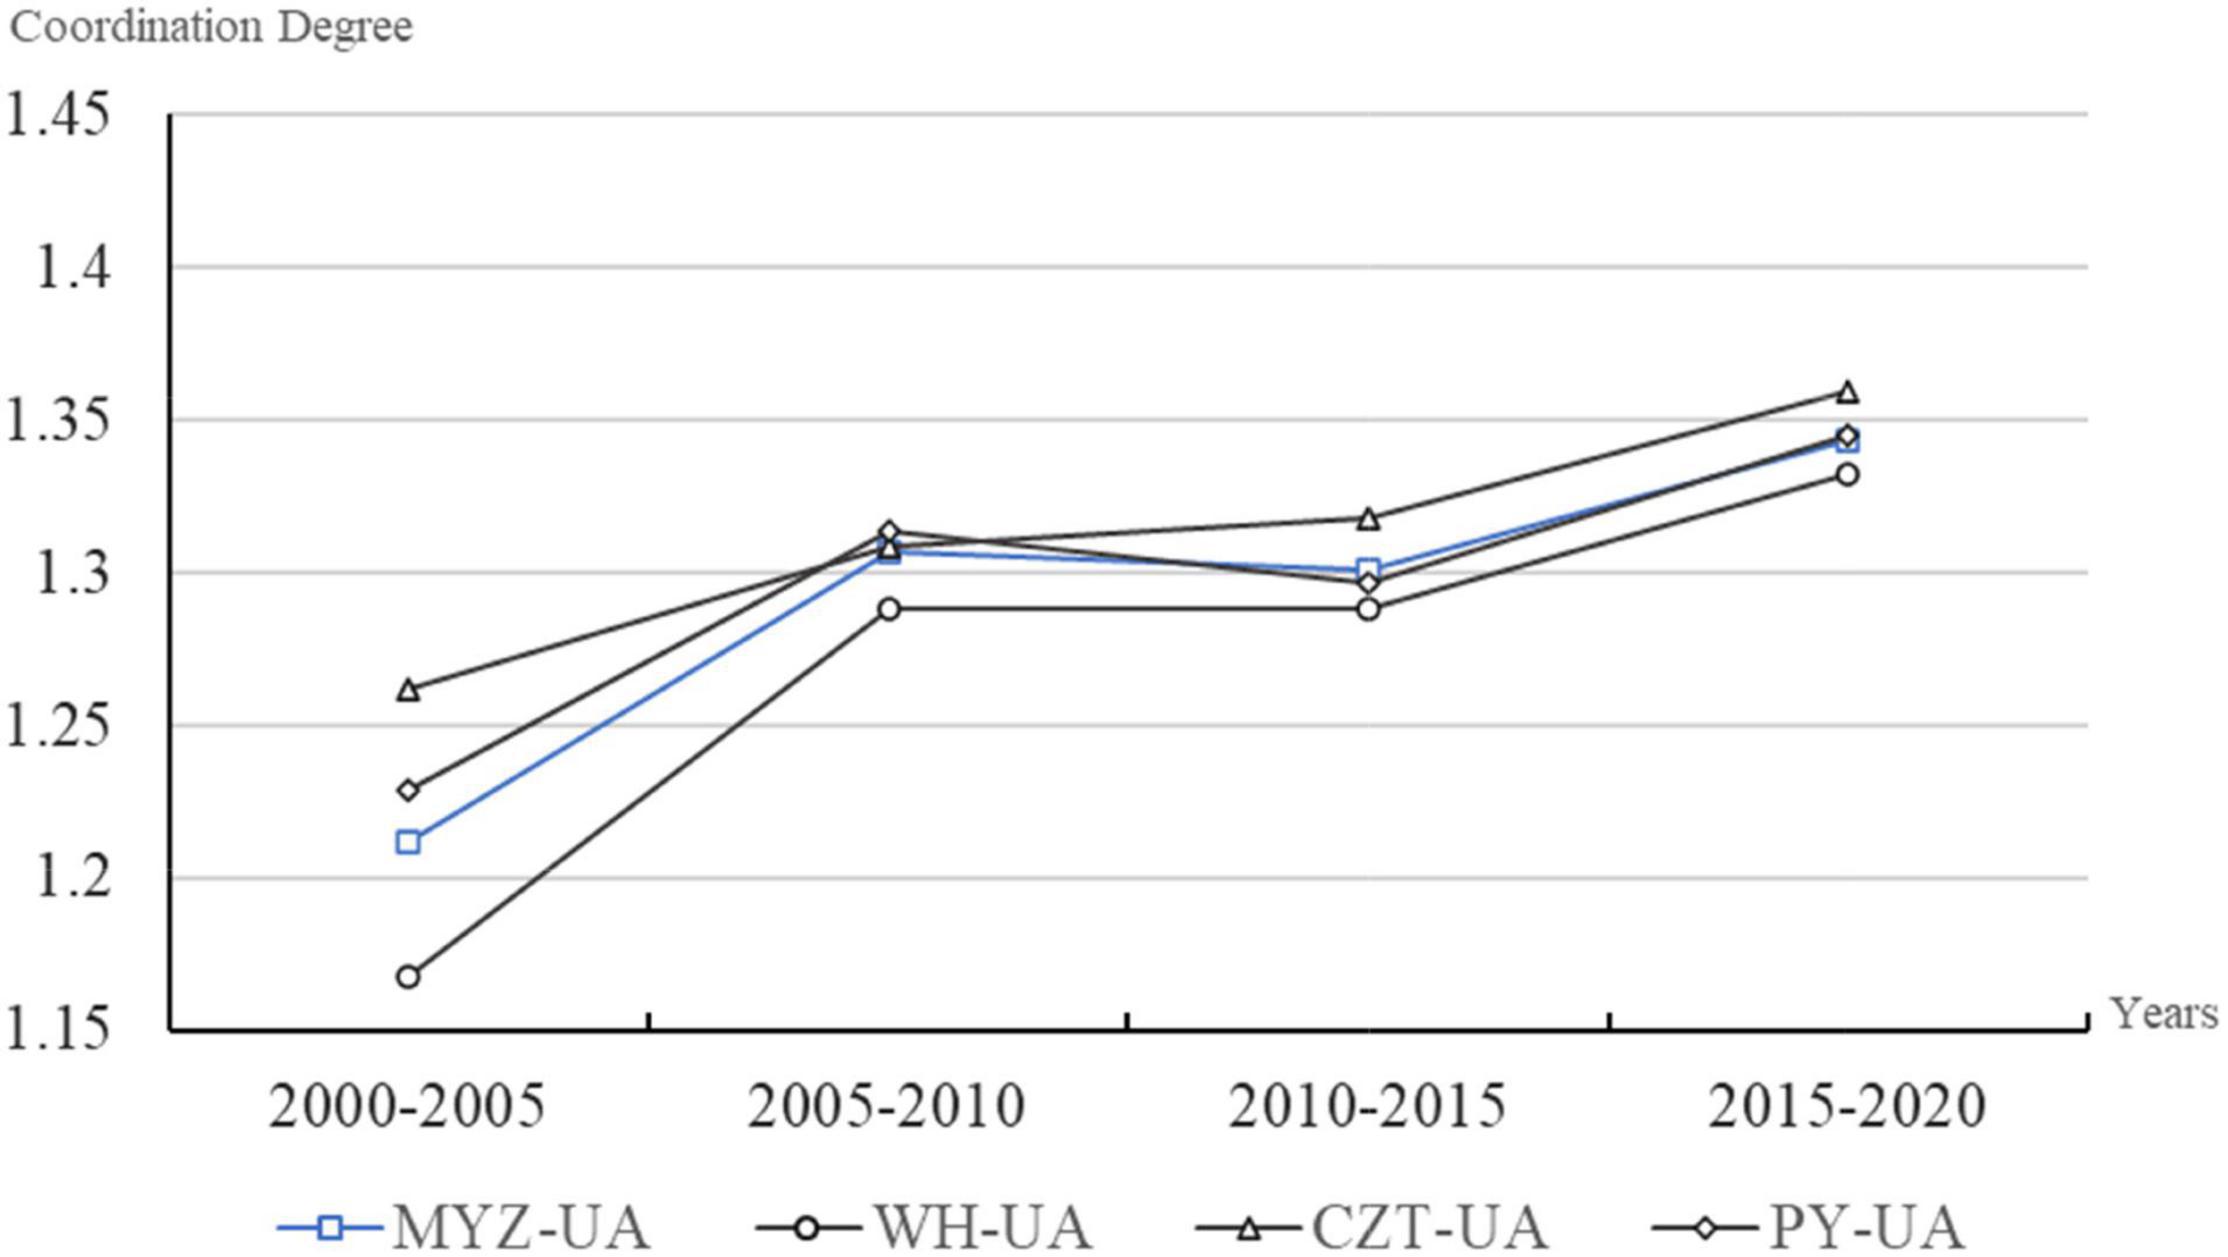
Figure 4. Change of coordination degree of “construction land–population” from 2000 to 2020.
Overall, the coordination state for “construction land–population” can be divided into three stages. The period 2000–2010 exhibited an uncoordinated stage dominated by growth, 2010–2015 presented a relatively uncoordinated stage dominated by imbalance, and 2015–2020 displayed a more coordinated stage focusing on quality improvements. Since the start of the 21st century, China’s regional development strategy has promoted the development of the central and western regions. Policies and measures focused on western development and major improvements in the central region have been proposed. However, due to the long-term lag in economic development and constraints in the industrial structure, the labor force in the central and western regions has been moving into the coastal areas. At the same time, the local government’s fiscal and tax revenues have been overly dependent on land finance, causing land urbanization to significantly outpace population urbanization. This has resulted in a mismatch between population and construction land development in the central and western regions.
With the strengthening of the regional coordinated development strategy, the socio-economic progress in the urban agglomerations in the middle reaches of the Yangtze River has accelerated considerably. Construction lands have expanded rapidly, investments and industries have emerged in some large cities in the central region, and the population outflow has decelerated. The “construction land–population” coordination has improved, but the regional growth differences remain considerably large, leading to uneven development. After implementing new urbanization and encouraging high-quality development, the urbanization levels of many small and medium-sized cities in the study area have significantly improved. The influence of large cities has been further enhanced, the expansion of construction land has intensified, and the labor force has started to return. The “construction land–population” coordination has evolved toward a more coordinated state.
The “construction land–population” coordination in each of the sub-urban agglomerations was largely comparable to the overall urban agglomeration. While the coordination state generally exhibited an upward trend, there were slight variations at different time periods. The “construction land–population” coordination degree for the WH-UA was the lowest among the three urban agglomerations. The coordination relationship has improved significantly, from being in the UC state in 2000–2015 to the RUC state in 2015–2020. The coordination degree for the CZT-UA was in the UC state from 2000 to 2005, RUC from 2005 to 2015, and RC from 2015 to 2020. This means that its general coordination relationship has improved continuously. The PY-UA was in the UC state for 2000–2005, the RUC state for 2005–2010, slightly decreased in 2010–2015, and returned to the RUC for 2015–2020.
The overall “construction land–population” coordination degree in the three major metropolitan areas has been rising (Figure 5), developing from uncoordinated to relatively coordinated. However, the coordination degree and evolution process among the different metropolitan areas varied considerably. The Wuhan metropolitan area had UC, RUC, and RC phases, with a 1.385 coordination degree in 2015–2020, the highest among the three metropolitan areas. The Changsha metropolitan area had similar coordination types as Wuhan, but the coordination was slightly lower at a 1.360 coordination degree for 2015–2020. The Nanchang metropolitan area had the lowest coordination degree and experienced three stages of coordination types: UC, UC, and RUC. Its coordination generally improved to relatively coordinated, with a coordination index of 1.347 in 2015–2020. The results suggest that the degree of “construction land–population” coordination in the three major metropolitan areas is better than the overall urban agglomeration and the different sub-urban agglomerations.
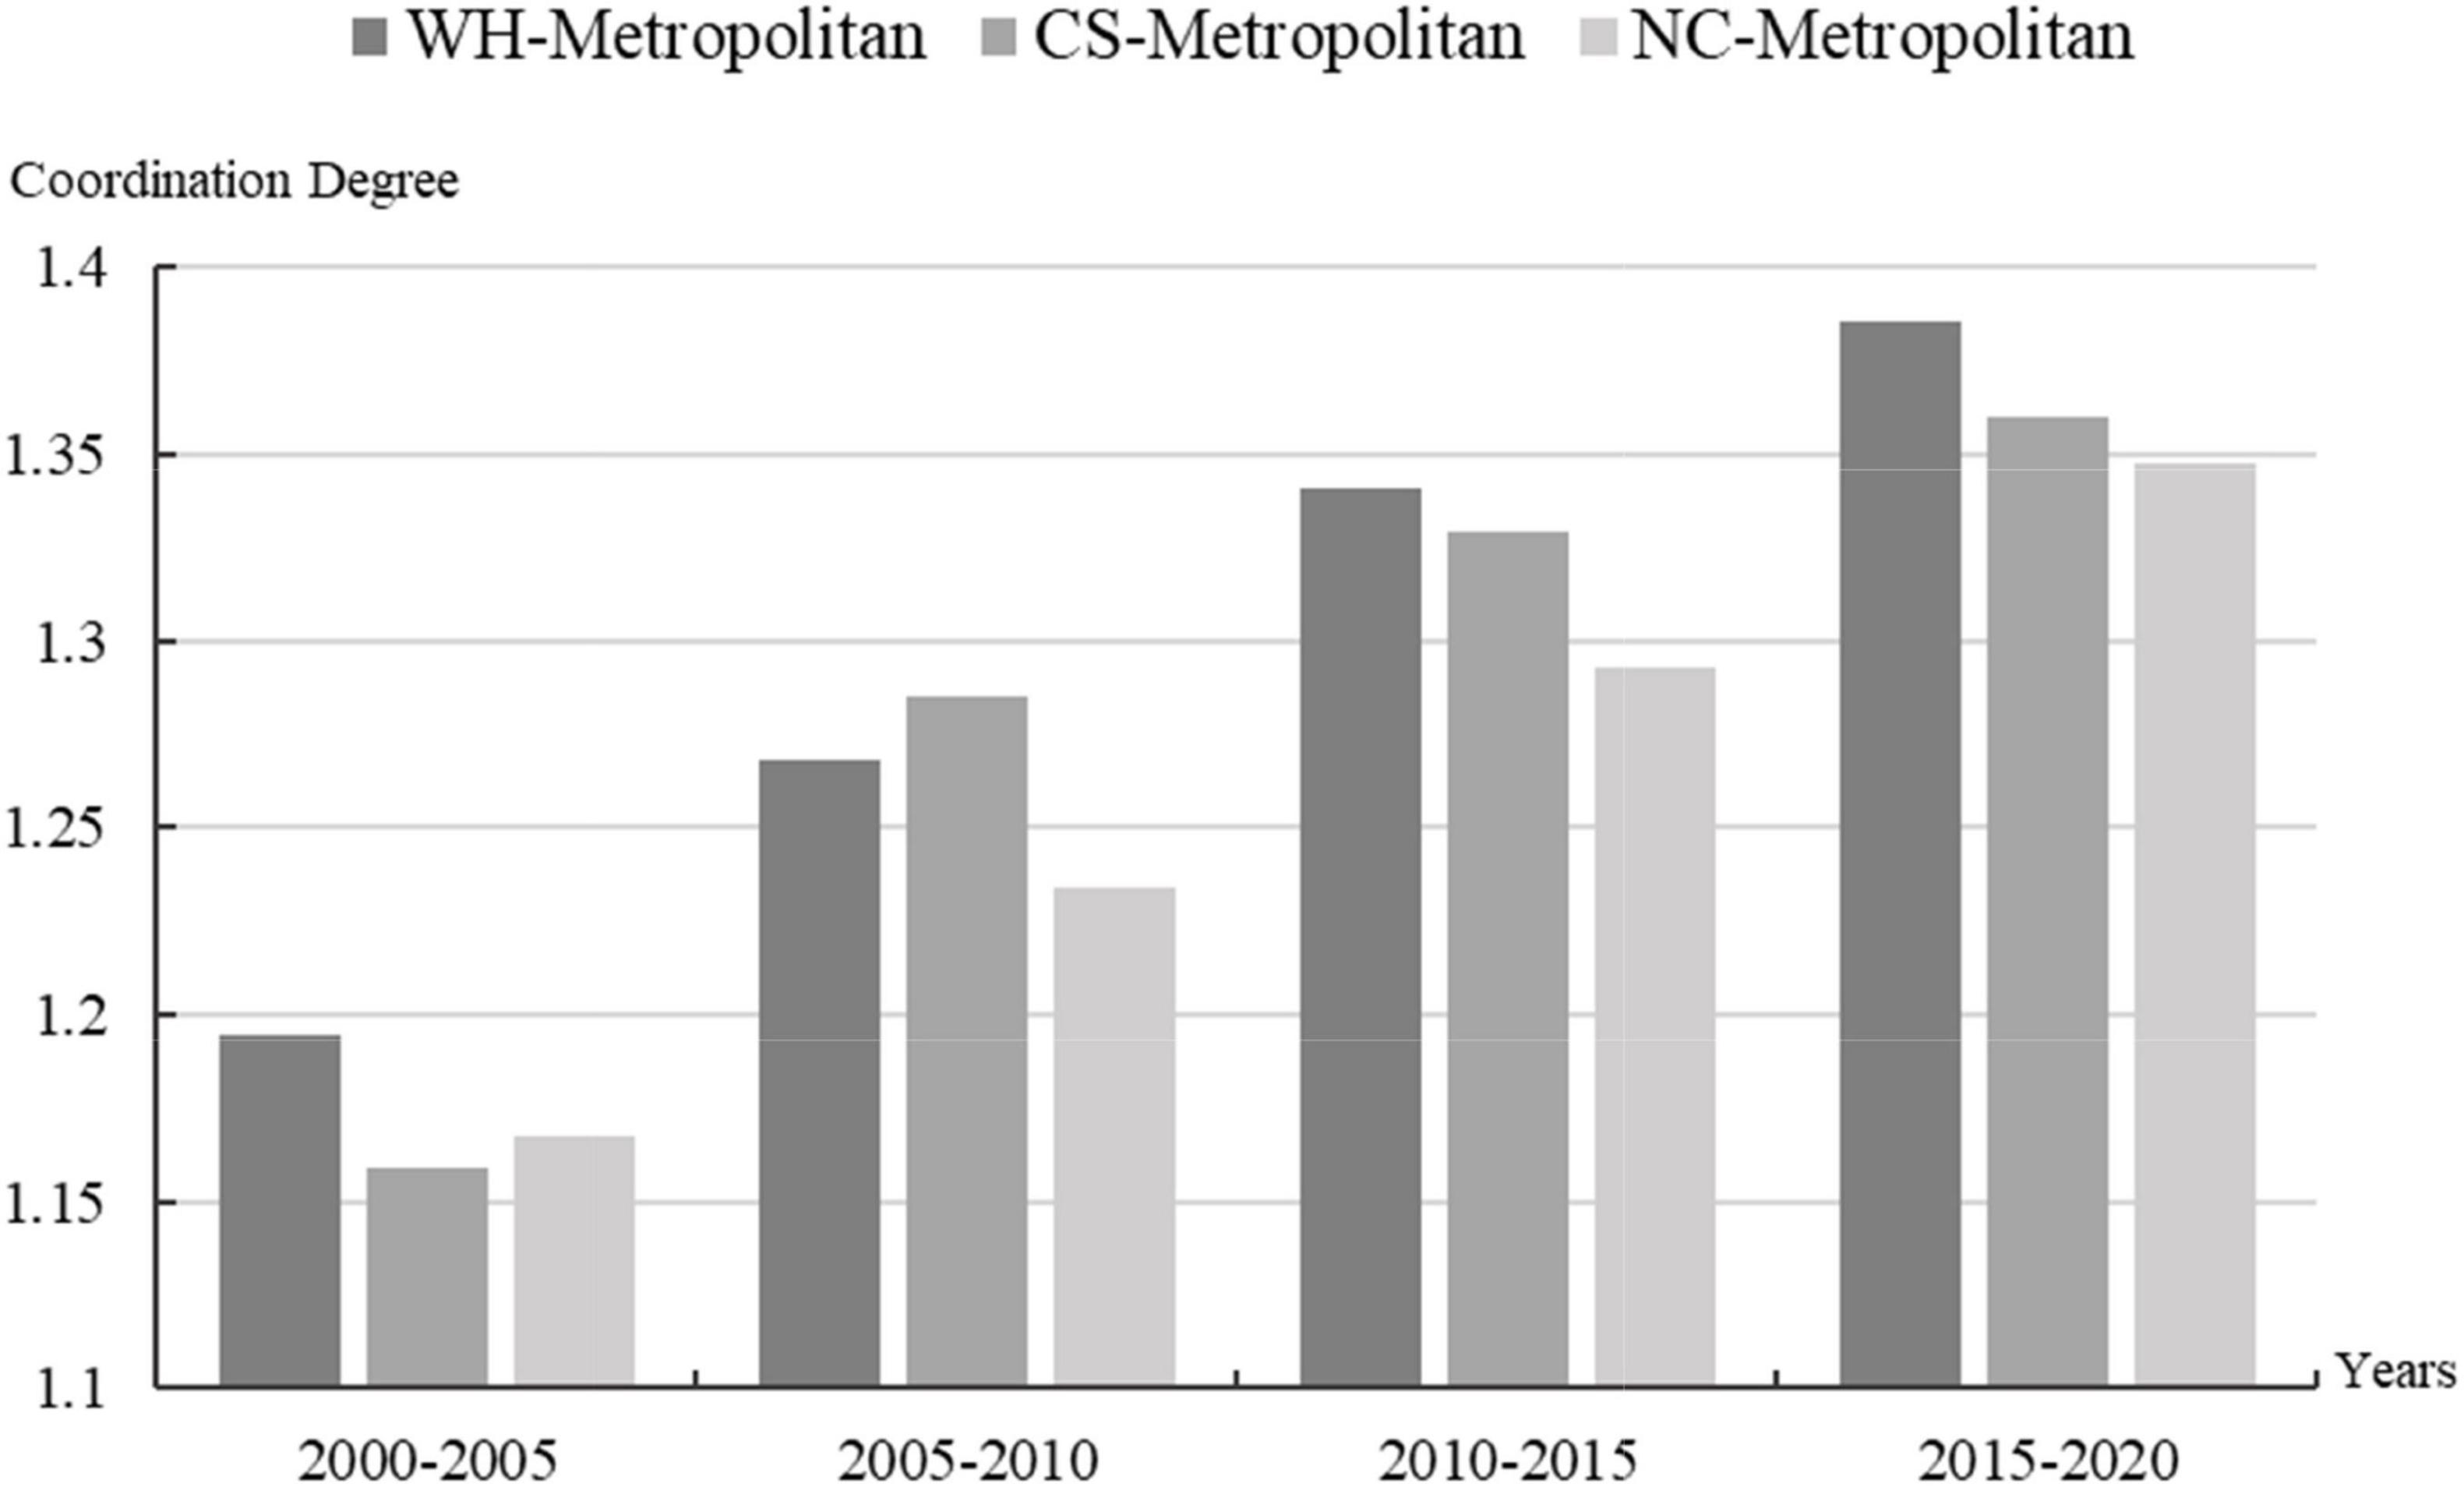
Figure 5. Change in the coordination degree of “construction land–population” in the three metropolitan regions from 2000 to 2020.
There are underlying reasons for the spatial differences between agglomerations in sub-urban and metropolitan areas. Due to its strategic location and policy advantages as a national central city, in one of the core nodes of the Yangtze River Economic Belt, many resources aggregate in Wuhan and the Wuhan metropolitan region. By contrast, other cities in the city group experience resource shortages and significant limitations. As a result, while the overall coordination degree for WH-UA is not high, the Wuhan metropolitan area exhibits a high degree of coordination. The CZT-UA has a comprehensive urban system with higher mobility and better linkages, so the overall level of man–land coordination tends to be higher than that in the other regions. For the PY-UA, however, because of its low development level, weak leadership, ineffective self-organization, and limited interactions with other cities, the overall coordination degree and the metropolitan’s degree of coordination are generally low.
The “construction land–economy” decoupling index of urban agglomerations in the middle reaches of the Yangtze River was calculated to be between 0 and 0.8, presenting a fluctuating downward trend from 0.409 in 2000–2005 to 0.335 in 2015–2020. The “construction land–economy” decoupling relationship is generally characterized as weak decoupling. Economic growth is notably faster than construction land expansion. The coupling/decoupling state is good, and the overall situation indicates further optimization (Figure 6). From 2000 to 2010, the regional expansion for construction lands did not exhibit a strong momentum, and the economic growth rate was much faster than construction land expansion. The results indicate that the decoupling index is relatively low and that the construction land expansion and economic development of urban agglomerations, as a whole, have low coordination levels.
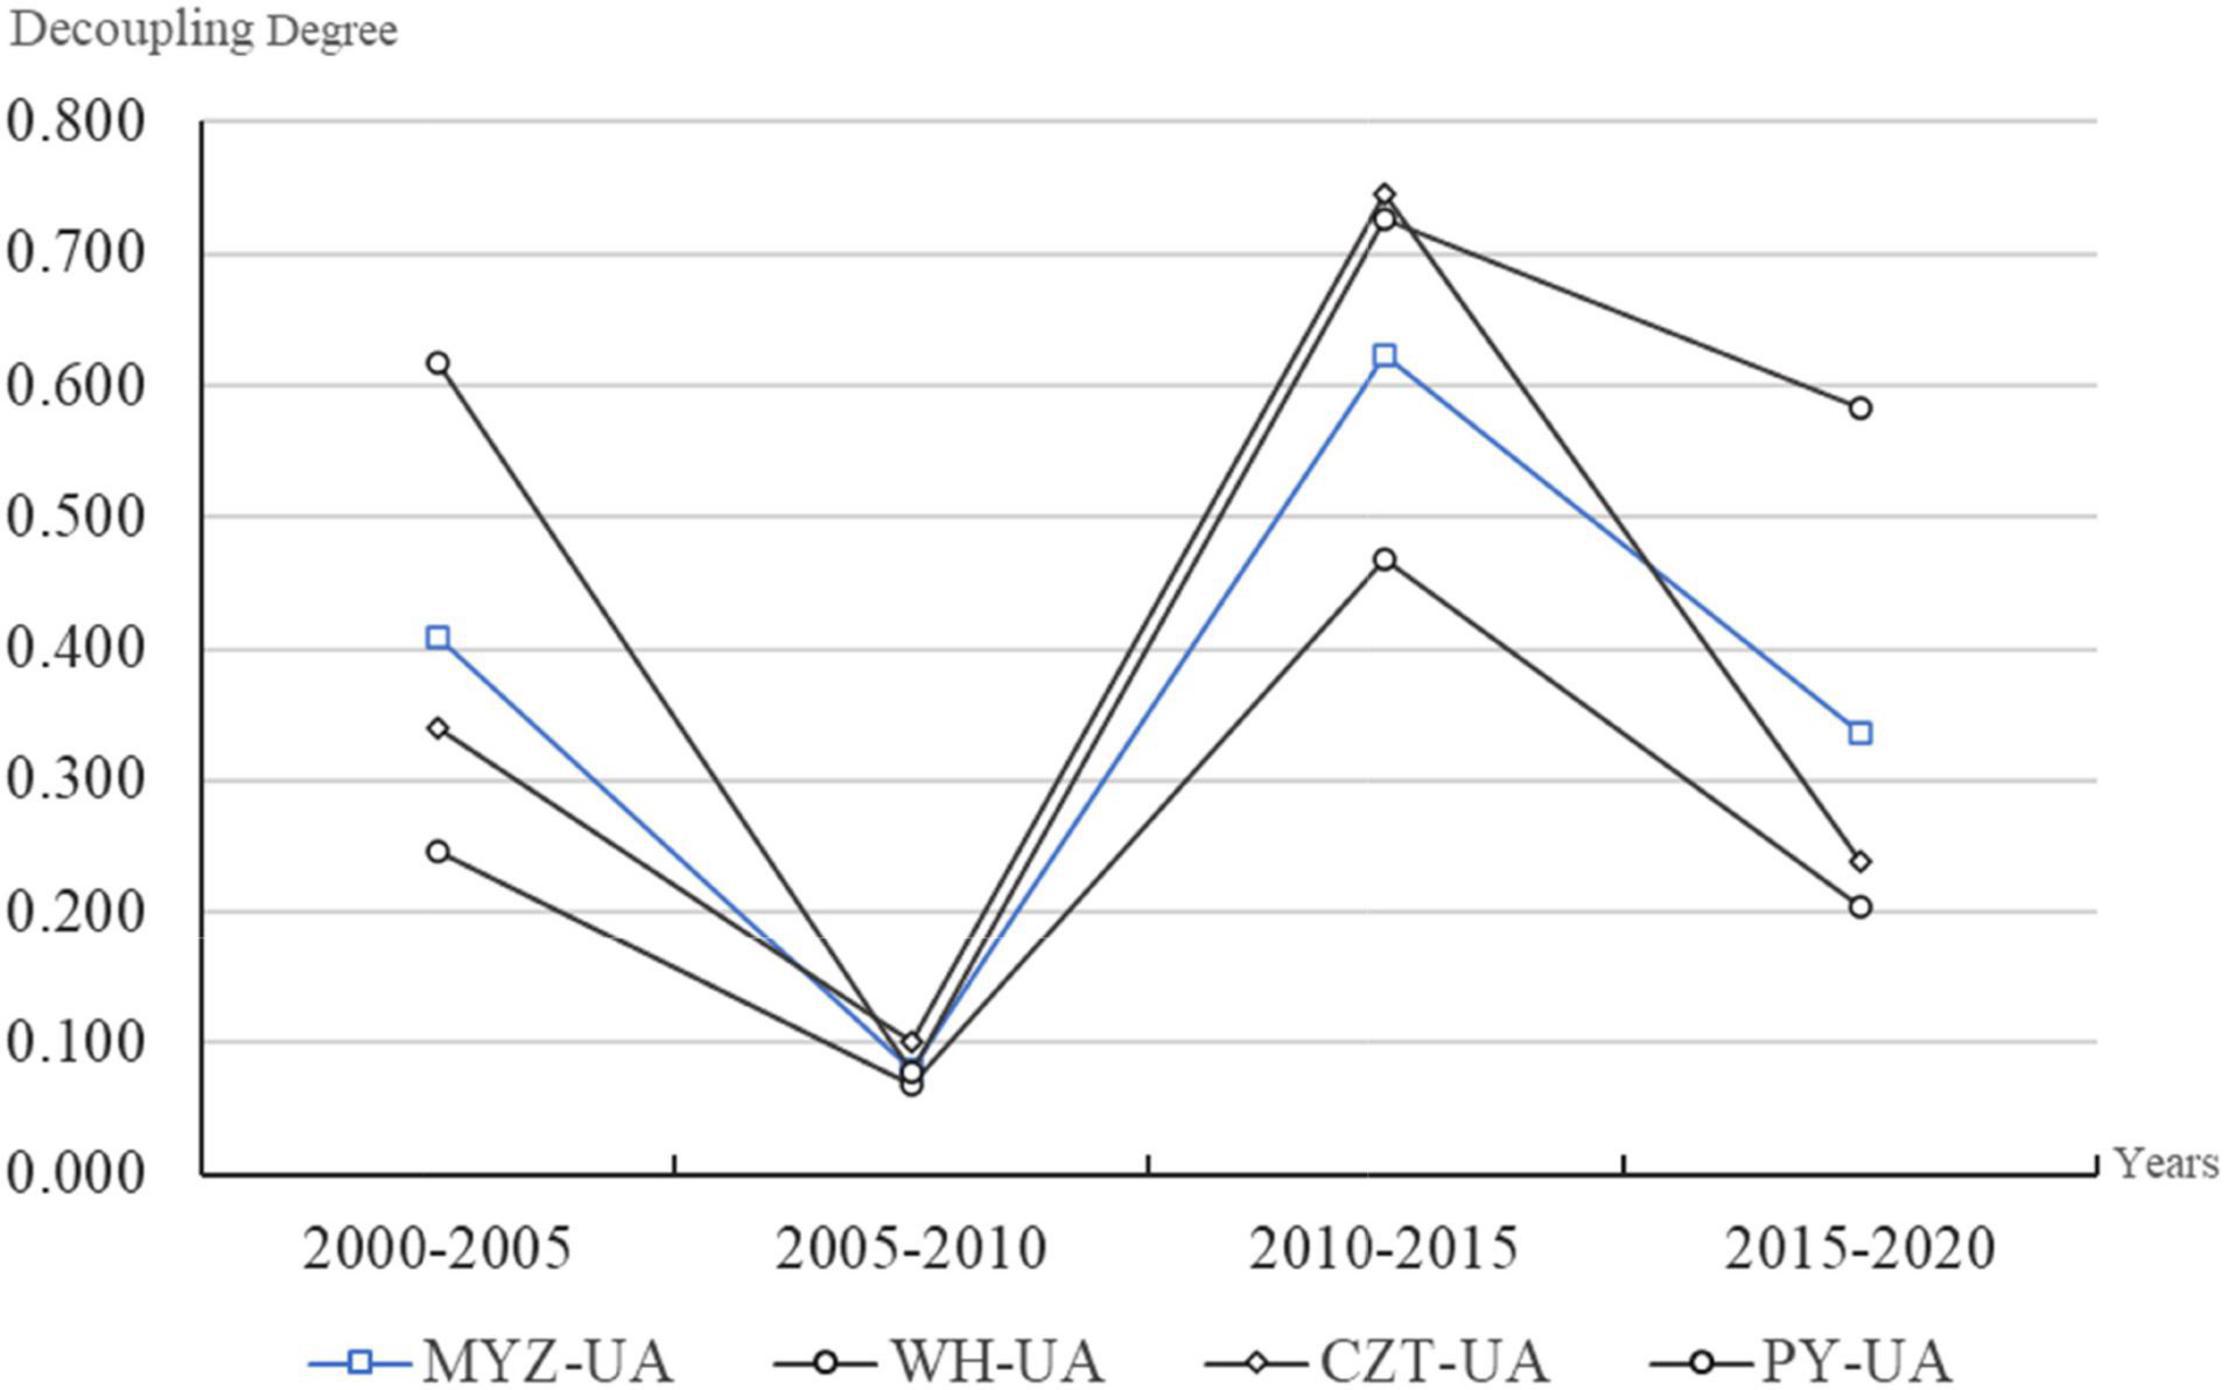
Figure 6. Change in the decoupling degree of “construction land–economy” from 2000 to 2020.
In 2010–2015, delayed effects from economic growth began to appear, further accelerating urbanization. Numerous development policies and strategies for urban agglomerations in the middle reaches of the Yangtze River were also implemented to promote socio-economic growth. The construction land expanded more rapidly and grew slightly faster than economic growth. From 2015 to 2020, a national strategy and guiding principles were adopted to focus on high-quality development. The expansion of regional construction land was controlled and managed, causing the coupling/decoupling relationship between “construction land and economy” to gradually enter a stage of quality-oriented optimization.
Among the sub-urban agglomerations, the WH-UA was mostly of the MWD type during the study period, except for 2005–2010, when it was of the HWD type. Its decoupling index at each time period was the lowest (all below 0.5) and slightly declined over time, indicating that it had the best coupling/decoupling relationship among the three and that the construction land expansion had entered the stage of quality growth (Figure 6). The CZT-UA was of the MWD type from 2000 to 2010, the LMD type from 2010 to 2015, and again of the MWD type from 2015 to 2020. The decoupling index value initially decreased, then increased, and then decreased again. Its overall value decreased, although its coupling/decoupling relationship was worse than that of the WH-UA. The PY-UA was of the HWD type from 2005 to 2010 and the LWD type in other periods. The construction land expansion and economic growth were generally coupled, although its decoupling index was the highest. There was a slight increase in decoupling over the research period, indicating that both economic growth and construction land expansion were in a rapid rising period and that the acceleration of construction land expansion was greater than economic growth.
The decoupling indices for the construction land and economy in the three major metropolitan areas were below 0.4 during the study period and exhibited a downward trend. The decoupling type was mostly MWD, with no LWD type. The coupling/decoupling relationship was generally better, indicating that the “construction land–economy” coupling at the metropolitan scale was significantly better than the overall urban agglomeration and the sub-urban scale (Figure 7). The “construction land–economy” coupling/decoupling relationship was best in the Wuhan metropolitan area. The overall decoupling index slightly decreased, indicating that the coupling/decoupling relationship was optimized. For the Changsha metropolitan area, the decoupling index dropped significantly. While the coupling/decoupling state was also optimized considerably, the overall coupling/decoupling degree differed slightly from that of Wuhan. The decoupling index of the Nanchang metropolitan area, the highest among the three regions, increased slightly, and its coupling/decoupling relationship was slightly worse than the other two regions.
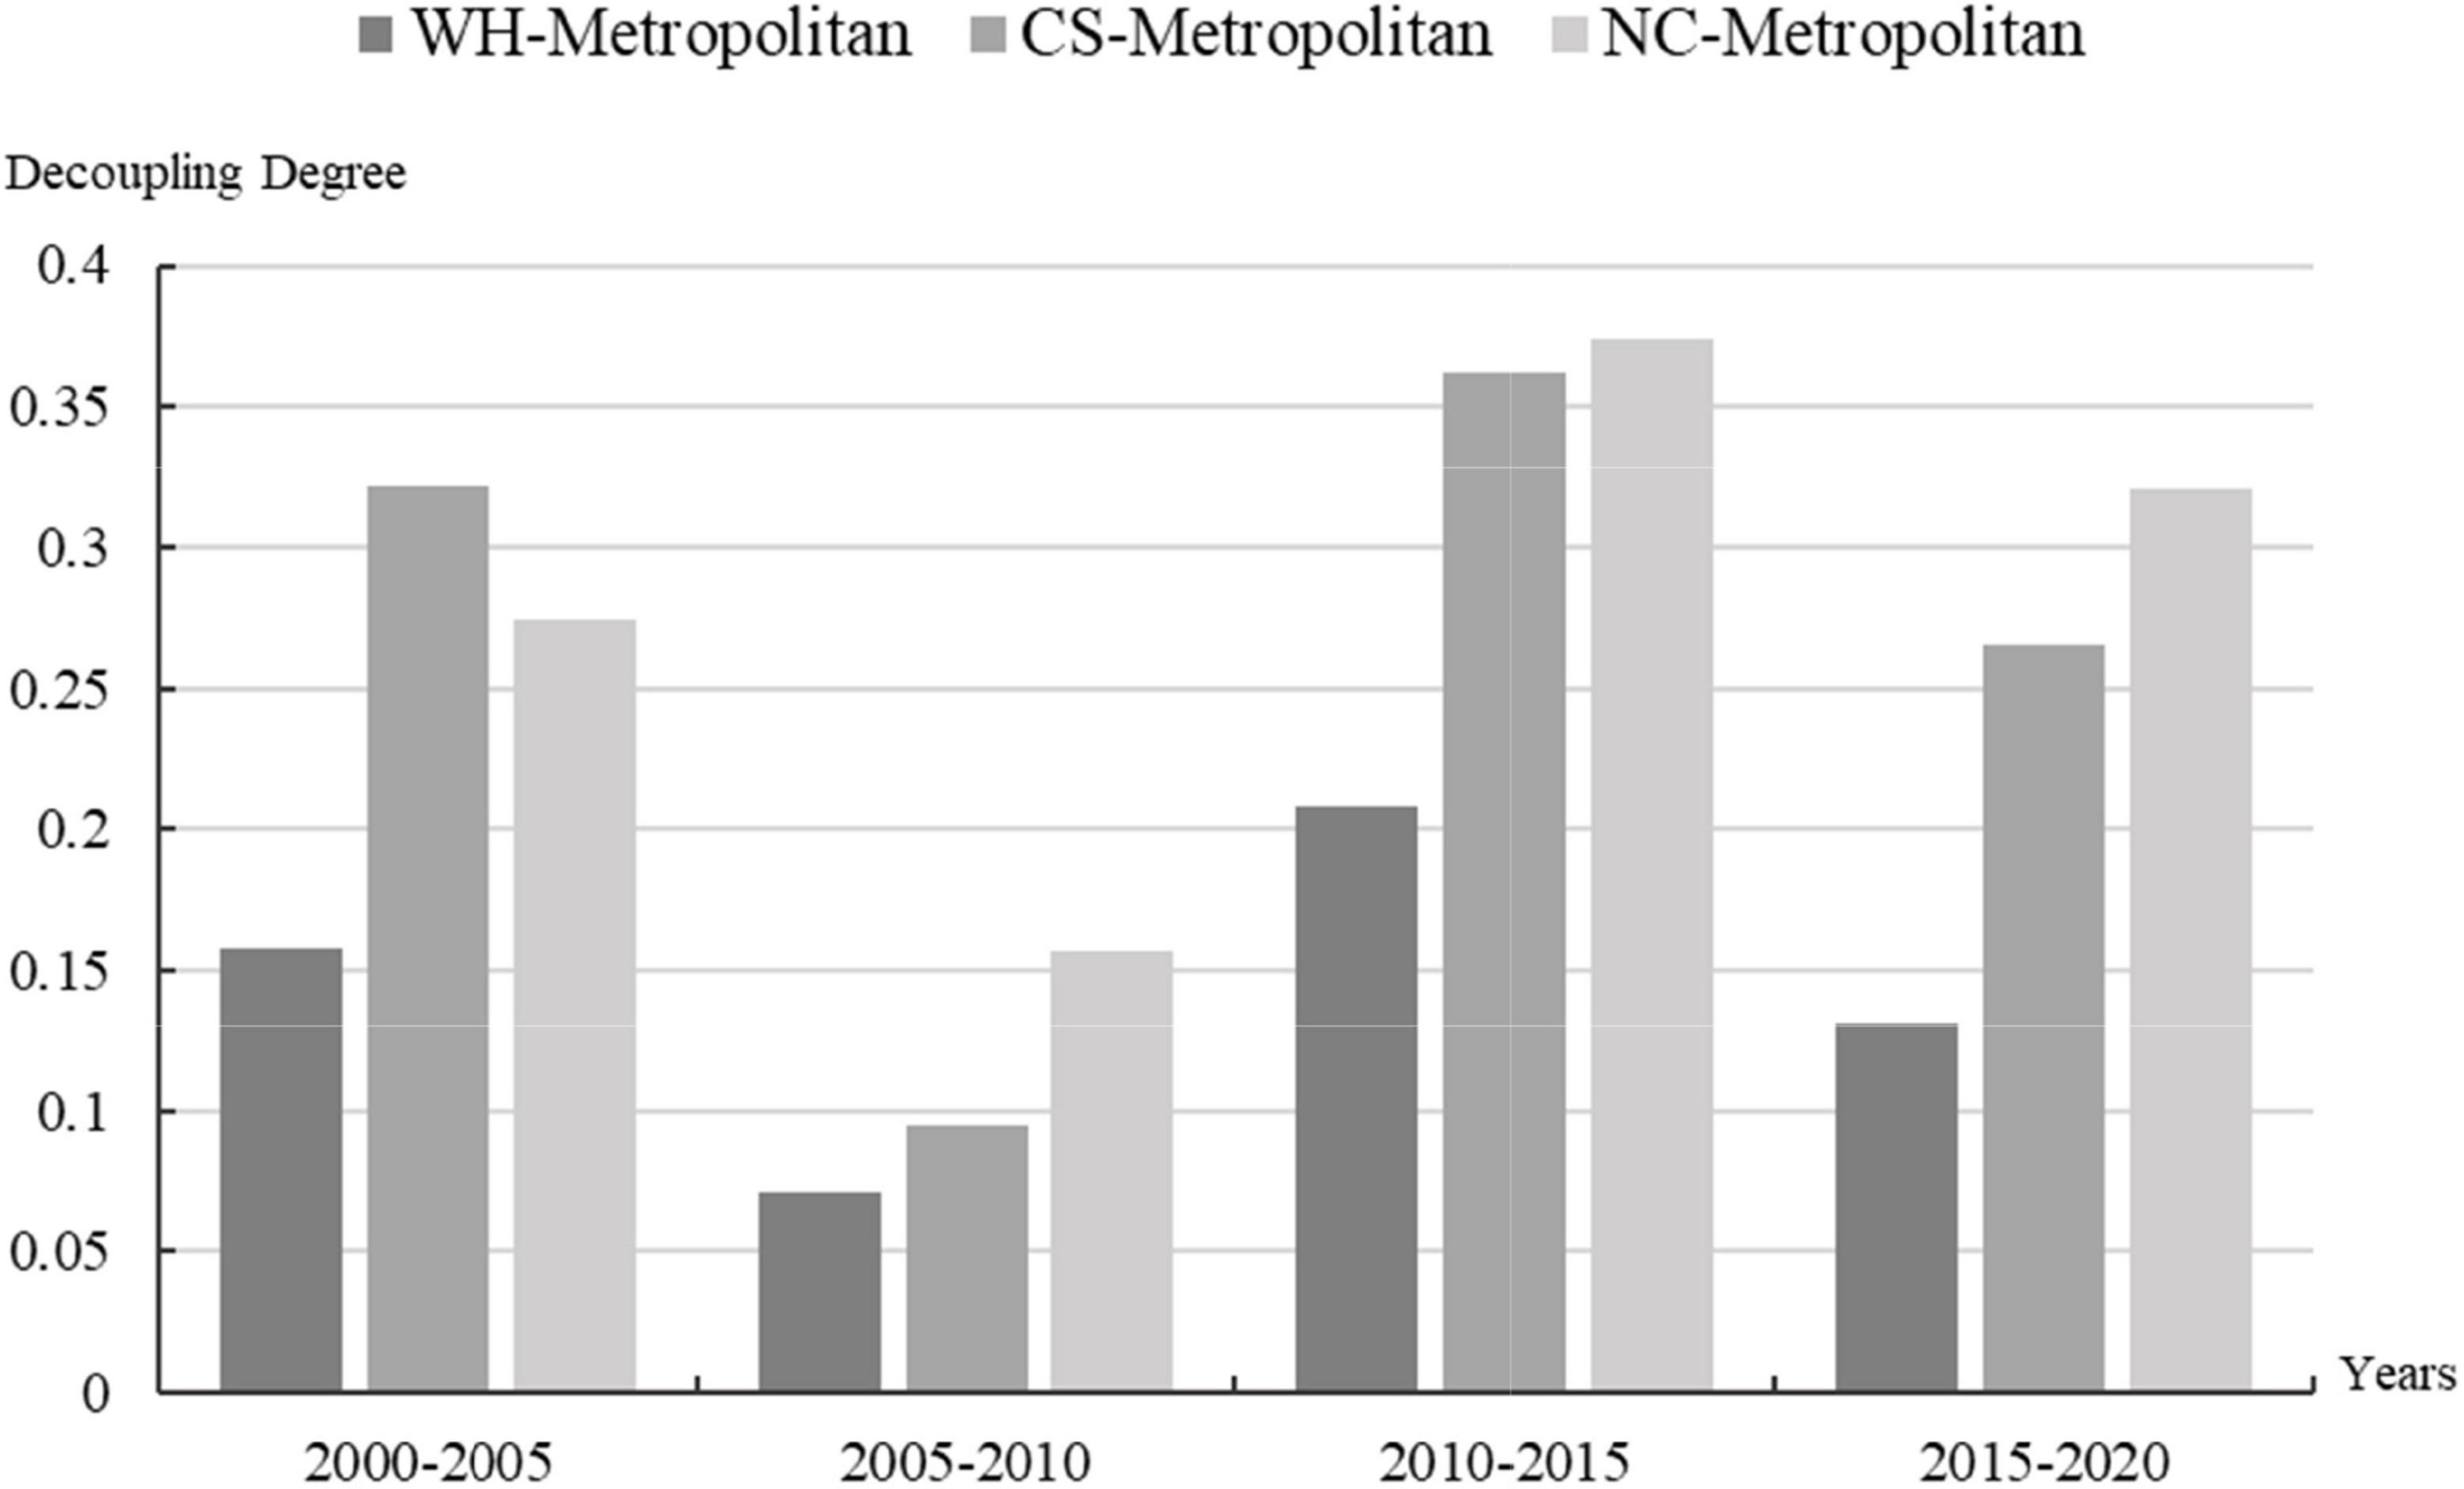
Figure 7. Change in the decoupling degree of “construction land–economy” in the three metropolitan regions from 2000 to 2020.
There are several explanations why the “construction land–economy” coupling at the metropolitan scale is better than the urban agglomeration. First, the foundation and development stages of the metropolitan area are higher than the overall urban agglomeration. Second, the development strategy focuses on catching up, and the role of leadership is inadequate. Third, as the urban agglomeration has a large spatial scope, the overall agglomeration effect is insufficient, and the spillover effect and leadership roles of core cities are not so strong.
Construction land expansion exhibited different expansion characteristics in different development periods and regions. The differences in expansion quality were also found to be closely linked to many elements in the regional spatial functional structure (Ouyang et al., 2022). The results of this study show that after the rapid expansion of the construction land in the study area, the expansion rate started to slow down, ushering in a new period focused on quality improvements. However, the level of coordination between the construction land and the population remains low. The increase in the construction land has neither supported the effective gathering and dispersal of the population nor improved the living environment. The spatio-temporal developments of the construction land and population have not yet reached a coordinated state.
While the coupling between the construction land and the economy in the study area can be characterized as generally good, there are still many places experiencing a shortage of construction lands. The lack of construction lands seems to be a significant problem restricting development (Li et al., 2020b). This problem implies that in the urban agglomerations of the middle reaches of the Yangtze River, the economic intensity of the construction land remains low and that unused lands can be commonly found in the cities. The coupling relationship between the two needs to be further enhanced.
Against the backdrop of high-quality development, new requirements are proposed for the coordinated symbiosis of productive, living, and ecological spaces (Li et al., 2021). These measures could make construction lands effectively support the agglomeration of the economy and population and satisfy the residents’ needs and wellbeing. Haphazard expansion and the low utilization efficiency of land resources should be addressed to generate a more efficient development; achieve better coordination between land use and economy, society, and ecology; and promote coordination and balance among cities.
Several recommendations are proposed for the high-quality development of the study area. First, the government should ensure high-quality land resource planning and develop a rational plan to account for the various land-use types. The organic harmony of different land-use types in urban and rural areas should also be promoted. Second, reforms on the land system and land use policies should be explored and initiated, and the management of land resources should be further strengthened. An information database for land resources should also be developed to record changes in land use. Third, the effective renewal of cities must be continued by strengthening intensive and human-oriented urban land use and accelerating the withdrawal of rural homesteads. Rural hollowing should be reduced, promoting the development of new homesteads instead of demolishing old ones. Fourth, the radiation and driving role of central cities should be strengthened, accelerating population agglomeration and socio-economic construction in small and medium-sized cities and towns. The government should aim to narrow the quality differences in the spatial development between cities and improve the coordination of high-quality development of the regional spatial structure.
Two issues that were not addressed in this study could be further explored in subsequent studies: The first is a comprehensive analysis of the spatial expansion quality of urban agglomerations based on the full perspective of economy, society, and ecology (Ren et al., 2022), and the second is establishing a scientific and systematic evaluation index system to quantitatively evaluate the quality of spatial development of urban agglomerations.
Using three scales (i.e., urban agglomeration, sub-urban agglomeration, and metropolitan), this study utilized the expansion intensity index to analyze the spatio-temporal evolution of construction lands in the urban agglomeration in the middle reaches of the Yangtze River. We used the coordination degree model, the Tapio elastic decoupling model, and the Theil index to explore the coordination and regional differences between the construction land, population, and economy. The main conclusions are as follows:
(1) The construction land in the research area continuously expanded during the study period. The expansion intensity varies at different periods and can be divided into three stages: slow expansion, accelerated expansion, and optimal expansion. In general, the expansion intensities of the CZT-UA and the Changsha metropolitan area were larger than those of the WH-UA and the Wuhan metropolitan area.
(2) Overall, the relationship between urban construction land expansion and the population has not been well-coordinated, but the coordination has gradually improved. Among the sub-urban agglomerations, the coordination degree was highest in the CZT-UA, while the Wuhan metropolitan area was highest at the metropolitan scale. Moreover, the optimization of the man–land coordination relationship was faster at the metropolitan scale than at the urban agglomeration scale.
(3) The decoupling relationship between the construction land expansion and the economy in the study area was found to be of the weak decoupling type. The coupling state was good and exhibited characteristics of further optimization. The coupling in the WH-UA and the Wuhan metropolitan area was the best among the sub-urban agglomerations and the metropolitan regions, while those in the PY-UA and the Nanchang metropolitan area were poor. In addition, the coupling/decoupling relationship at the metropolitan area scale was significantly better than that at the urban agglomeration scale.
The original contributions presented in this study are included in the article/supplementary material, further inquiries can be directed to the corresponding author/s.
QN conceived and designed the research. QN and XO drafted the manuscript, prepared figures, and revised the manuscript. SL discussed the results. All authors read and approved the final manuscript.
This research was funded by the Scientific Research Foundation of Hunan Provincial Education Department of China (No. 21A0506) and National Science Foundation of Hunan Province of China (No. 2021JJ40015).
The authors declare that the research was conducted in the absence of any commercial or financial relationships that could be construed as a potential conflict of interest.
All claims expressed in this article are solely those of the authors and do not necessarily represent those of their affiliated organizations, or those of the publisher, the editors and the reviewers. Any product that may be evaluated in this article, or claim that may be made by its manufacturer, is not guaranteed or endorsed by the publisher.
Chen, Y., Yang, J., Yang, R., Xiao, X., and Xia, J. C. (2022). Contribution of urban functional zones to the spatial distribution of urban thermal environment. Build. Environ. 216:109000. doi: 10.1016/j.buildenv.2022.109000
Fang, C. L. (2014). Progress and the future direction of research into urban agglomeration in China. Acta Geogr. Sin. 69, 1130–1144.
Fang, C. L. (2018). Important progress and prospects of China’s urbanization and urban agglomeration in the past 40 years of reform and opening-up. Econ. Geogr. 38, 1–9.
He, B. J., Wang, J., Zhu, J., and Qi, J. (2022). Beating the urban heat: situation, background, impacts and the way forward in China. Renew. Sustain. Energy Rev. 161:112350. doi: 10.1016/j.rser.2022.112350
Li, G., Sun, S., and Fang, C. (2018). The varying driving forces of urban expansion in China: insights from a spatial-temporal analysis[J]. Landsc. Urban Plan. 174, 63–77. doi: 10.1016/j.landurbplan.2018.03.004
Li, J., Ouyang, X., and Zhu, X. (2021). Land space simulation of urban agglomerations from the perspective of the symbiosis of urban development and ecological protection: a case study of Changsha-Zhuzhou-Xiangtan urban agglomeration. Ecol. Indic. 126:107669. doi: 10.1016/j.ecolind.2021.107669
Li, Y. R., Li, Y., Karácsonyi, D., Yongsheng, W., Wang, J., and Zhengjia, L. (2020b). Spatio-temporal pattern and driving forces of construction land change in a poverty-stricken county of China and implications for poverty-alleviation-oriented land-use policies. Land Use Policy 91:104267. doi: 10.1016/j.landusepol.2019.104267
Li, Z. Y., Luan, W. X., Zhang, Z. C., and Su, M. (2020c). Relationship between urban construction land expansion and population/economic growth in Liaoning Province. China. Land Use Policy 99:105022. doi: 10.1016/j.landusepol.2020.105022
Li, Y. J., Kong, X. S., and Zhu, Z. Q. (2020a). Multi-scale analysis of the correlation patterns between the urban population and construction land in China. Sustain. Cities Soc. 61, 1–12. doi: 10.1016/j.scs.2020.102326
Liu, S., Zhang, H. X., and Cheng, W. Y. (2021). The quality of urban construction land expansion in Shandong Province: based on the analysis of different expansion patterns. Urban Problems 10, 76–84.
Liu, Y. Q., Song, W., and Deng, X. Z. (2019). Understanding the spatiotemporal variation of urban land expansion in oasis cities by integrating remote sensing and multi-dimensional DPSIR-based indicators. Ecol. Indic. 96, 23–37. doi: 10.1016/j.ecolind.2018.01.029
Lv, X., and Huang, X. J. (2013). Research progress and prospect of construction land expansion. Geogr. Geo-Inf. Sci. 29, 51–58.
Ministry of Housing and Urban-Rural Development, P. R. C. (2018). China Urban-Rural Construction Statistical Yearbook. Beijing: China Planning Press.
Ouyang, X., Tang, L., Wei, X., and Li, Y. (2021a). Spatial interaction between urbanization and ecosystem services in Chinese urban agglomerations. Land Use Policy 109:105587. doi: 10.1016/j.landusepol.2021.105587
Ouyang, X., Wei, X., Li, Y., Wang, X. C., and Klemeš, J. J. (2021b). Impacts of urban land morphology on PM2.5 concentration in the urban agglomerations of China. Environ. Manage. 283:112000. doi: 10.1016/j.jenvman.2021.112000
Ouyang, X., Xu, J., Li, J., Wei, X., and Li, Y. (2022). Land space optimization of urban-agriculture-ecological functions in the Changsha-Zhuzhou-Xiangtan urban agglomeration. China. Land Use Policy 117:106112. doi: 10.1016/j.landusepol.2022.106112
Ren, J., Yang, J., Zhang, Y., Xiao, X., Xia, J. C., Li, X., et al. (2022). Exploring thermal comfort of urban buildings based on local climate zones. J. Clean. Prod. 340:130744. doi: 10.1016/j.jclepro.2022.130744
Shen, W., Lu, F. X., and Qin, Y. C. (2019). Analysis of temporal- spatial patterns and influencing factors of urban ecosystem carrying capacity in urban agglomeration in the middle reaches of the Yangtze River. Acta Ecologica Sinica 39, 3937–3951.
Tapio, P. (2005). Towards a theory of decoupling: degrees of decoupling in the EU and the case of road traffic in Finland between 1970 and 2001. Transp. Policy 12, 137–151. doi: 10.1016/j.tranpol.2005.01.001
Wang, H. J., Zhang, B., Liu, Y. L., Yanfang, L., Shan, X., and Yu, D. (2018a). Multi-dimensional analysis of urban expansion patterns and driving forces based on the center of gravity-GTWR model: a case study of the Beijing-Tianjin-Hebei urban agglomeration. Acta Geographica Sinica 73, 1076–1092.
Wang, J., Wei, X., and Guo, Q. (2018b). A three-dimensional evaluation model for regional carrying capacity of ecological environment to social economic development: model development and a case study in China. Ecol. Indic. 89, 348–355. doi: 10.1016/j.ecolind.2018.02.005
Wei, G., Zhang, Z., Ouyang, X., Shen, Y., Jiang, S., Liu, B., et al. (2021). Delineating the spatial-temporal variation of air pollution with urbanization in the belt and road initiative area. Environ. Impact Assess. Rev. 91:106646. doi: 10.1016/j.eiar.2021.106646
Wu, R., Li, Z., and Wang, S. (2021). The varying driving forces of urban land expansion in China: insights from a spatial-temporal analysis. Sci. Total Environ. 766:142591. doi: 10.1016/j.scitotenv.2020.142591
Xiao, R., Yu, X. Y., Xiang, T., Zhang, Z., Wang, X., and Wu, J. (2021). Exploring the coordination between physical space expansion and social space growth of China’s urban agglomerations based on hierarchical analysis. Land Use Policy 109:105700. doi: 10.1016/j.landusepol.2021.105700
Yang, Y. Y., Bao, W. K., Li, Y. H., Wang, Y., and Chen, Z. (2020). Land use transition and its eco-environmental effects in the Beijing–Tianjin–Hebei urban agglomeration: a production–living–ecological perspective. Land 9:285. doi: 10.3390/land9090285
Yao, S. M., Zhou, C. S., and Wang, D. (2016). New perspectives on urban agglomerations in China. Beijing Sci. Press 6, 150–155.
Yi, D., Guo, X., Han, Y., Guo, G., Ou, M., and Zhao, X. M. (2022). Coupling ecological security pattern establishment and construction land expansion simulation for urban growth boundary delineation: framework and application. Land 11:359. doi: 10.3390/land11030359
Yu, J. Q., Zhou, K. L., and Yang, S. L. (2019). Land use efficiency and influencing factors of urban agglomerations in China. Land Use Policy 88:104143. doi: 10.1016/j.landusepol.2019.104143
Zhao, D., Zhao, X., Khongnawang, T., Arshad, M., and Triantafilis, J. (2018). A Vis-NIR spectral library to predict clay in Australian cotton growing soil. Soil Sci. Soc. Am. J. 82, 1347–1357. doi: 10.2136/sssaj2018.03.0100
Keywords: construction land, central region, urban agglomeration, human-land relationship, high-quality development
Citation: Ning Q, Ouyang X and Liu S (2022) Spatio-Temporal Evolution and Quality Analysis of Construction Land in Urban Agglomerations in Central China. Front. Ecol. Evol. 10:912127. doi: 10.3389/fevo.2022.912127
Received: 04 April 2022; Accepted: 24 May 2022;
Published: 17 June 2022.
Edited by:
Bing Xue, Institute of Applied Ecology (CAS), ChinaReviewed by:
Dongxue Zhao, The University of Queensland, AustraliaCopyright © 2022 Ning, Ouyang and Liu. This is an open-access article distributed under the terms of the Creative Commons Attribution License (CC BY). The use, distribution or reproduction in other forums is permitted, provided the original author(s) and the copyright owner(s) are credited and that the original publication in this journal is cited, in accordance with accepted academic practice. No use, distribution or reproduction is permitted which does not comply with these terms.
*Correspondence: Xiao Ouyang, eGlhby5vdXlhbmdAZm94bWFpbC5jb20=; Shaobo Liu, bGl1c2hhb2JvQGNzdS5lZHUuY24=
Disclaimer: All claims expressed in this article are solely those of the authors and do not necessarily represent those of their affiliated organizations, or those of the publisher, the editors and the reviewers. Any product that may be evaluated in this article or claim that may be made by its manufacturer is not guaranteed or endorsed by the publisher.
Research integrity at Frontiers
Learn more about the work of our research integrity team to safeguard the quality of each article we publish.