 John F. Meeder
 Nathan Adelgren
 Susana L. Stoffella
 Michael S. Ross1,3
- 1Institute of Environment, Florida International University, Miami, FL, United States
- 2Andlinger Center for Energy and the Environment, Princeton University, Princeton, NJ, United States
- 3Department of Earth and Environment, School of Environment, Arts and Society, College of Arts, Sciences and Education, Florida International University, Miami, FL, United States
- 4Applied Research Center, College of Engineering and Computing, Florida International University, Miami, FL, United States
Numerous studies address changes in wetland deposition in response to saltwater encroachment driven by the accelerating rate of sea-level rise, by quantifying temporal changes recovered from a vertical sediment sequence. This is the first landscape scale study, based upon 10 core transects representing the heterogeneity of the Southeast Saline Everglades, Florida. By utilizing the known salinity preferences of molluscan assemblages, a Salinity Index was calculated for each core sequence and the recorded salinity changes identified and dated. Radiometric dating utilizing the 210Pb method provides the rate of sediment accumulation and the date of changes identified in the core. The core transects provide the basis for calculation of the rate of saltwater encroachment by comparing the date of saltwater encroachment and the distance between two cores. Thereby, temporal and spatial changes in other sediment parameters in a landscape can also be quantified, such as organic carbon. This paleo-ecological approach to rapidly changing coastal conditions can be utilized to provide scientists and land managers with a record of the past, rate of changing conditions and provide the basis for predicting the future trajectory of their site. Application of this paleo-ecological approach documented increasing rates of saltwater encroachment associated with accelerating rate of sea-level rise: an average rate of 49.1 between 1895 and 1940, 69.2 between 1940 and 1968, 73 between 1968 and 1995 and 131.1 m/yr between 1995 and 2015. Approximately 1.79 km of saltwater encroachment has occurred since 1995, with three partial reversals because of increased freshwater delivery. Associated with saltwater encroachment are changes in sediment organic carbon, decreasing area of marl production and increasing distribution of mangrove. Although the distance of saltwater encroachment is greater in Florida Bay, both changes in sediment organic carbon and mangrove distribution are much less than in Biscayne Bay coastal basins. This heterogeneity is likely the result of differences in tidal ingress efficiency. At the present rate of saltwater encroachment, the freshwater wetlands are predictably lost within a century.
Introduction
This study is the first to determine rates of salt water encroachment (SWE) and changes in sediment organic carbon (SOC) over time by paleo-ecological application of mollusk salinity tolerances contemporaneously with radiometric dating along shore normal transects. (Note: All non-standard abbreviations found in Table 1). The interest in these two subjects is driven by the accelerating rate of global sea-level rise (SLR) which is threatening low-lying coastal areas (Spencer et al., 2016). SLR driven saltwater encroachment (SWE) increases salinity, the most important stressor in the coastal system (Morris et al., 2002; Mitsch and Gosselink, 2015). Increasing salinity triggers changes in: the distribution and type of plant communities (Ellison and Stoddart, 1991; Ellison, 1993; Ross et al., 2000), plant productivity (Blum and Roberts, 2009; Wilson et al., 2018; Charles et al., 2019), organic carbon storage (Neubauer et al., 2013; Doughty et al., 2016; Meeder et al., 2021) and sulfur availability (Sutter et al., 2014; Poulin et al., 2017; Chambers et al., 2019). The combined effects of these changes are a reduction in rates of vertical sediment accumulation, peat collapse, and the formation of inundation ponds in South Florida (Chambers et al., 2015; Meeder et al., 2017; Servais et al., 2019; Wilson et al., 2018; Kominoski et al., 2021). Ultimately, these changing patterns in sediment production and accumulation are preserved in the stratigraphic record (Meeder and Parkinson, 2018). This study pioneers the utilization of paleo-ecological methods in deciphering the stratigraphic record in order to calculate the rate of coastal salinity and SOC change at the landscape scale. As SLR continues to accelerate, widespread submergence of Southeast Florida coastal wetlands and the formation of intertidal and subtidal mudflats is likely (Parkinson et al., 2015; Meeder et al., 2017; Sklar et al., 2019; Parkinson and Wdowinski, 2022).
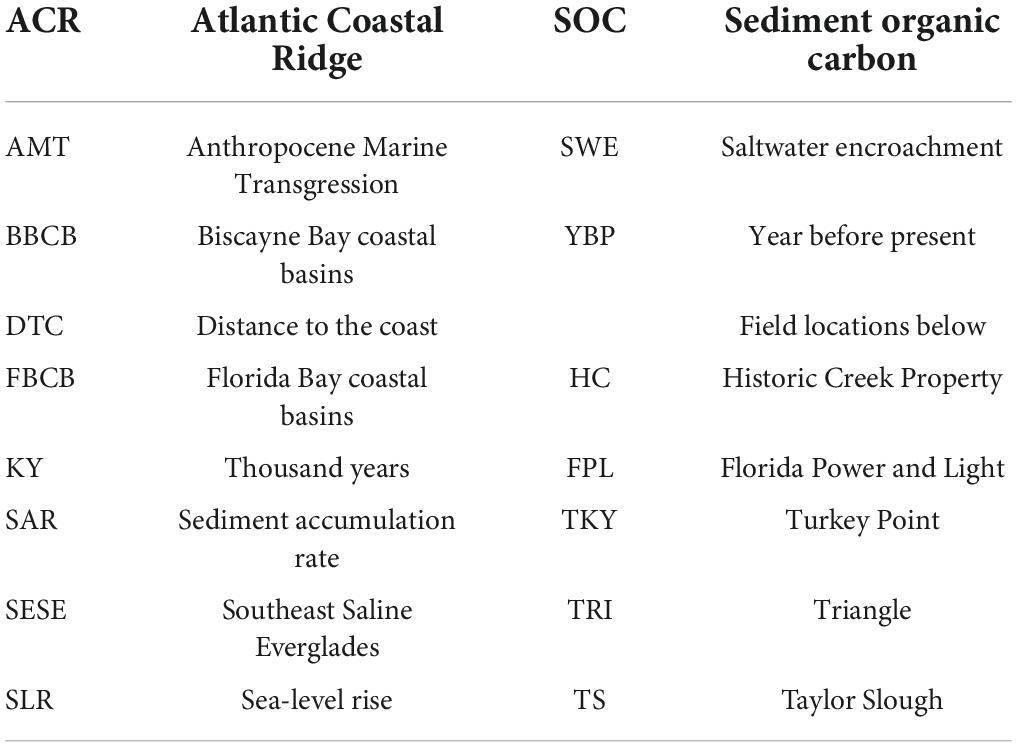
Table 1. Non-standard abbreviations.
Changes in sediment organic carbon are important because coastal wetlands, and mangroves in particular, contain some of the highest SOC content reported including tropical rainforest and are therefore important in the global carbon cycle (Chmura et al., 2003; Mumby et al., 2004; Spalding et al., 2010; Bouillon, 2011). Although coastal wetlands occupy a small percentage of the earth’s surface, they store a disproportionately large volume of organic carbon (Chmura et al., 2003), and their location at the land-sea interface makes these organic carbon stores subject to rapid change in response to SLR. The history of the Holocene exemplifies the influence the rate of SLR has on coastal stability and change. The rate of SLR during the Early Holocene (11 to 6 KYBP) was > 10 mm/yr and coastlines were submerging, leaving little record (Wanless et al., 1994). During the Middle Holocene (6 to 3 KYBP) the rate of SLR decreased to between 2 and 3 mm/yr and coastal wetlands and barrier islands developed under conditions of retreat. The rate of SLR further decreased to < 1 mm/yr approximately 3,000 YBP, marking the beginning of the Late Holocene and stable coastlines (Donoghue, 2011; Kopp et al., 2015). The present mangrove fringe developed around 3,165 YBP and the landward associated freshwater wetland sediment accumulation rates (SAR) were sufficient to maintain their relative elevations in respect to sea level during the last 3 KY, allowing the freshwater wetlands to expand landward with SLR. Around 1900 the rate of SLR increased to 2 mm/yr, beginning a trend of accelerating rate of SLR termed the Anthropocene Marine Transgression: the only global transgression produced by humans (Meeder and Parkinson, 2018). The present global rate of SLR is 3.6 mm/yr (Oppenheimer et al., 2019); in contrast, the regional average rate for south Florida was 6.47 between 2000 and 2021 and 9.41 mm/yr during the last decade (Parkinson and Wdowinski, 2022). Continuing global warming and acceleration in the rate of SLR is predicted for the near future (Sweet et al., 2017; Fox-Kemper et al., 2021) and will likely continue for centuries until ice-free conditions are reached (Levermann et al., 2013). The last time atmospheric CO2 was near present day concentrations was 3 MYA during the Middle Pliocene Warm Period when sea-level was 25 m higher than present (Klaus et al., 2017; Meeder et al., 2019).
The Late Holocene Southeast Saline Everglades (SESE) oligotrophic wetland environment developed east and south of the Late Pleistocene (Hoffmeister et al., 1967) Atlantic Coastal Ridge (ACR) on the broad, slightly seaward dipping ramp lying below 1.5 m (Figure 1). Transverse glades, erosional breaks in the ACR (Meeder and Harlem, 2019), historically drained the central Everglades basin and maintained freshwater wetlands but today serve as conduits for much-reduced Everglades’ flows, including urban and agricultural runoff, to Biscayne Bay. The ramp provides an area for development of wide bands of plant communities and associated facies along the shore-normal salinity gradient, permitting easy recognition of changes associated with SLR driven SWE (Meeder et al., 2017). The SESE is comprised of numerous coastal basins divided into two groups: those found along Biscayne Bay and Card Sound, collectively called Biscayne Bay coastal basins (BBCB), and those found along Barnes Sound and Northeastern Florida Bay collectively called Florida Bay coastal basins (FBCB). BBCBs have greater slopes but are narrower and incoming tidal waters are more saline with efficient exchange in contrast to FBCBs. FBCBs have poor tidal exchange because of the coastal embayments and offshore banks and salinity crises caused by wind and evaporation are common (Lorenz, 2014). Coastal basin topography is produced by different plant communities producing different SARs, with communities along the coast and creek banks exhibiting greater SARs than interior plant communities (Meeder et al., 2017).
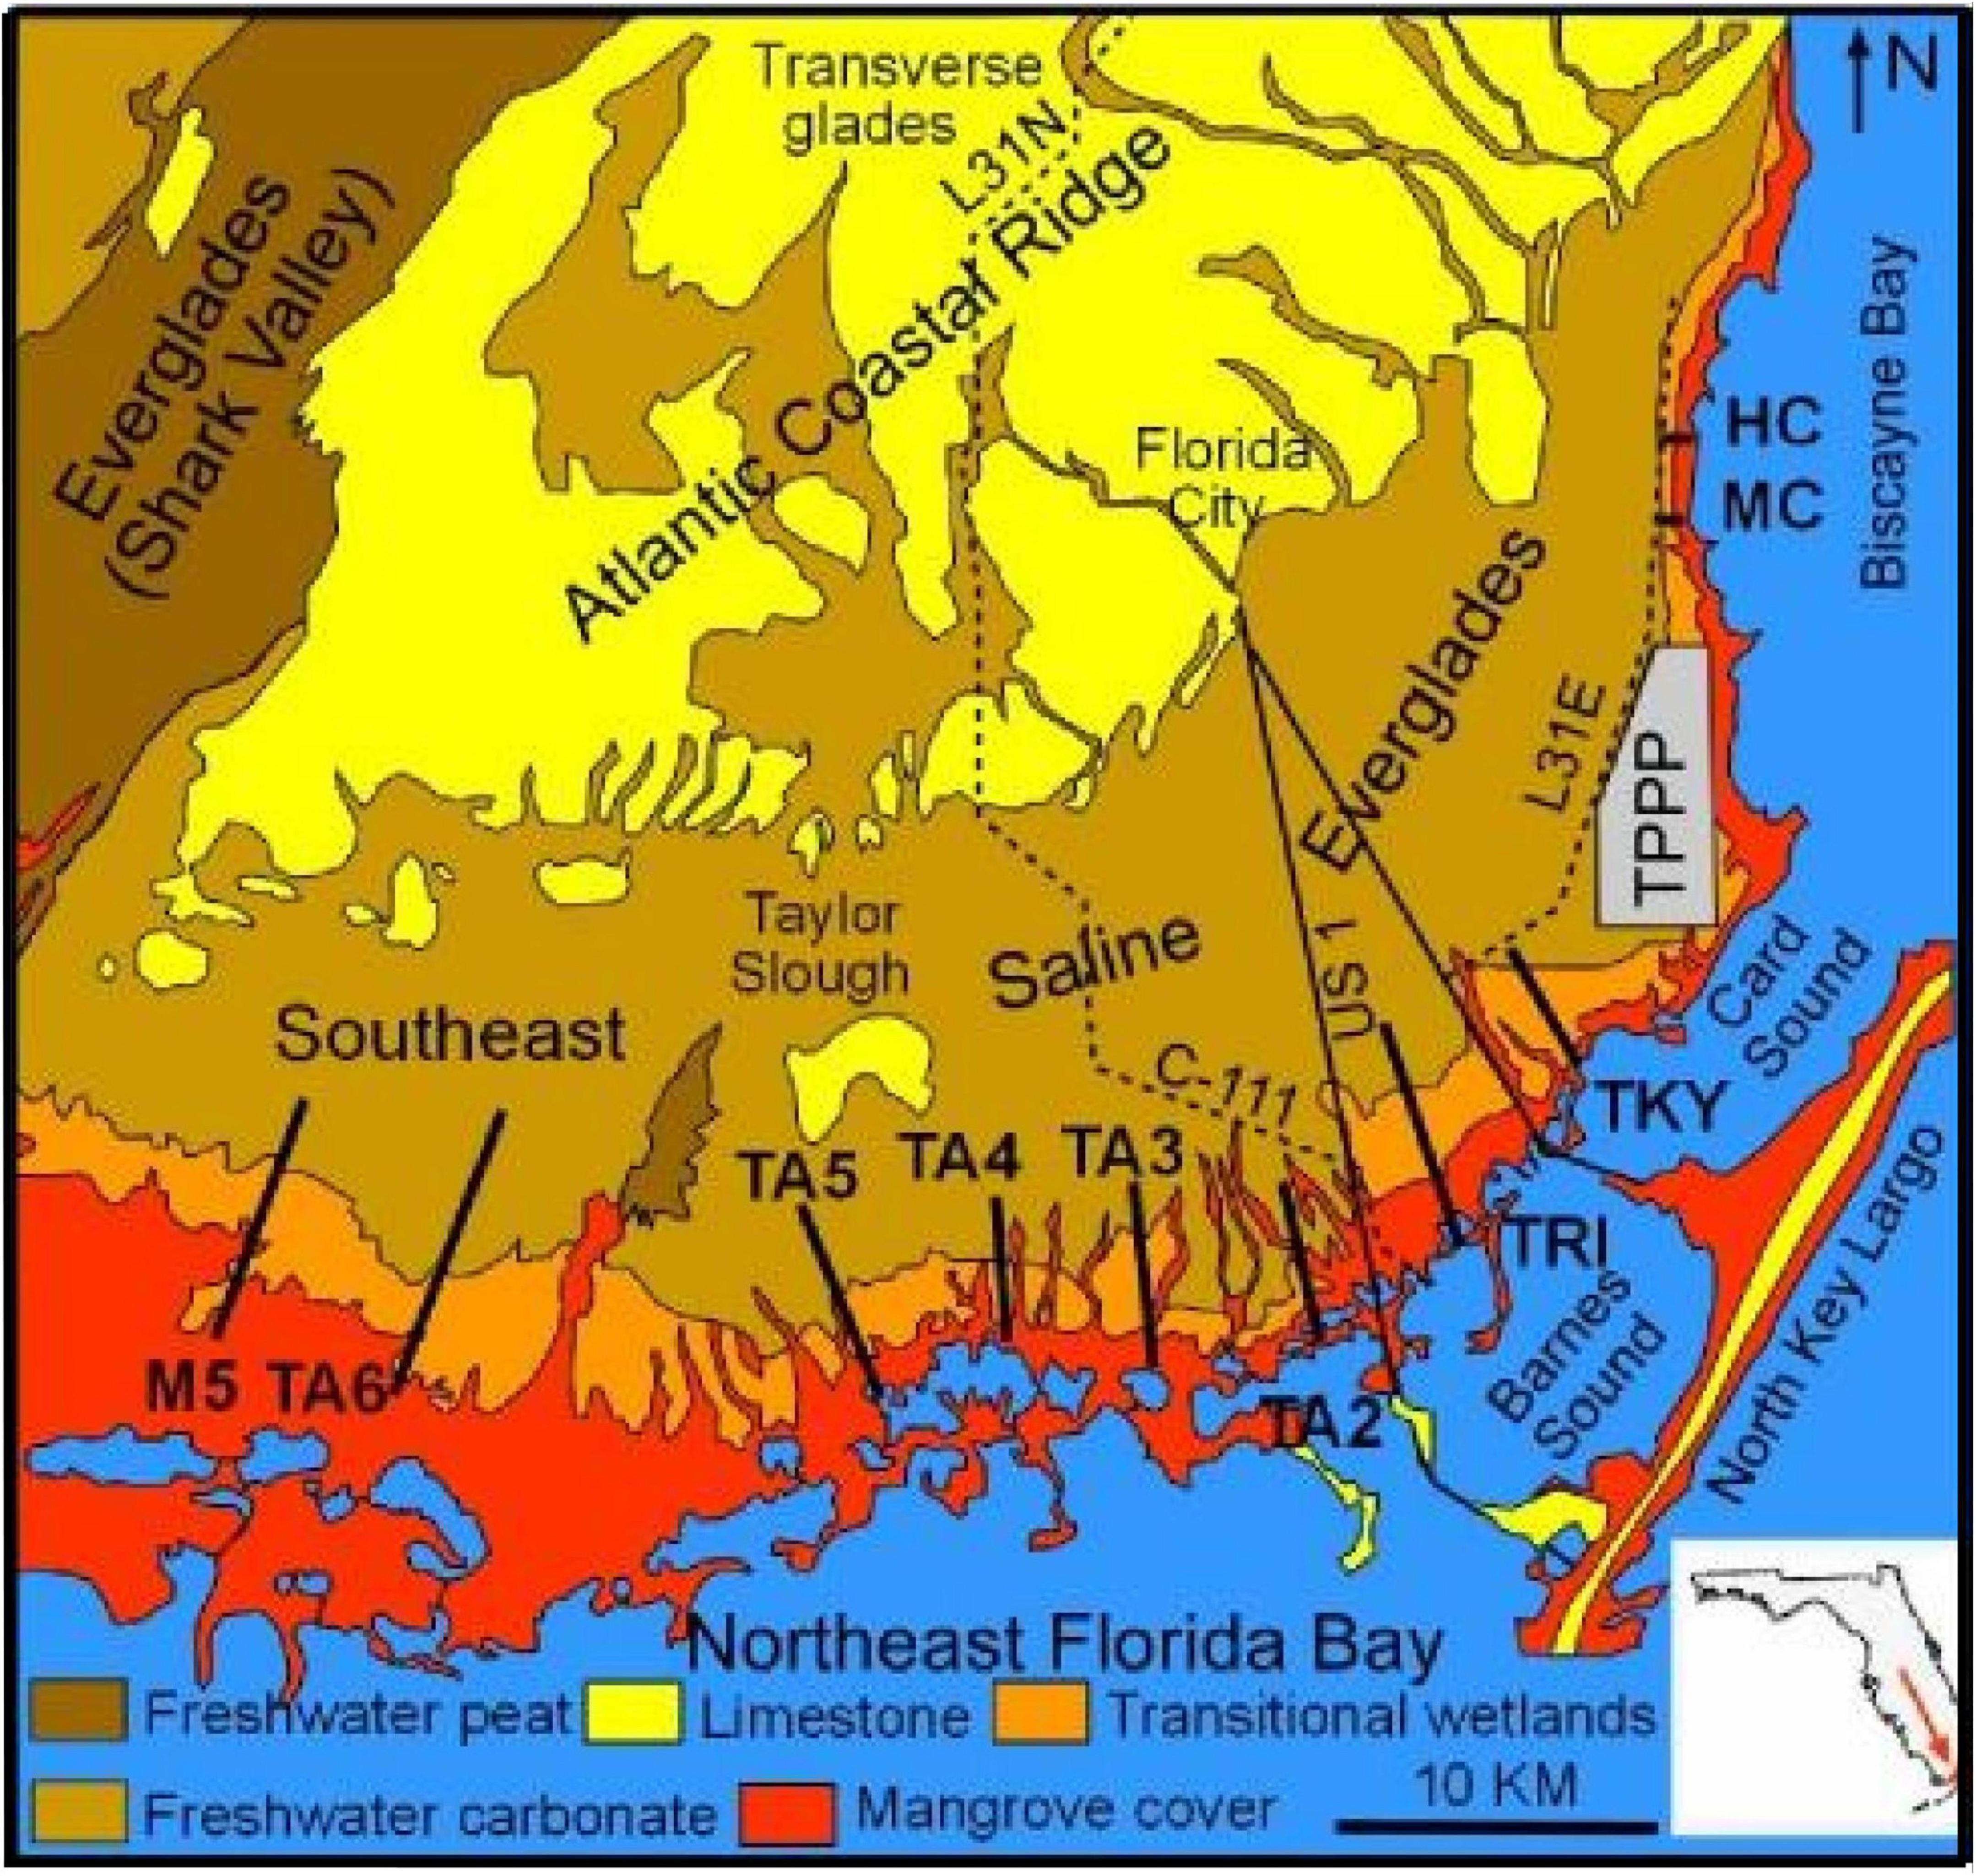
Figure 1. Study area. The heavy black lines are the transect locations. HC, Historic Creek. MC, Mowry Canal. TKY, Turkey Point, TRI, Triangle transect. TA and M5 are locator labels with no specific meaning TPPP, Tukey Point Nuclear Power Plant 210Pb dating was performed on the following cores collected in 1995; TPE, LHC, and CHC (equivalent to 2017 transect TA2), CJB, LJB, and UJB (equivalent to 2017 transect TA3), and EVER 4 and EVER 7 are north of 2017 transect TA4 (Meeder et al., 1996). Core collected in 2017 include EVERl north of TRI, TA2.2, TA2.4, and TA2.6 from transect TA2. TA3.4 and 3.5 are from transect TA3, and EPIOR is found along transect TA4. Locations of 2017 cores along the transects are located in Figure 7 and the distance to the coast for all 2017 cores are listed (Table 4).
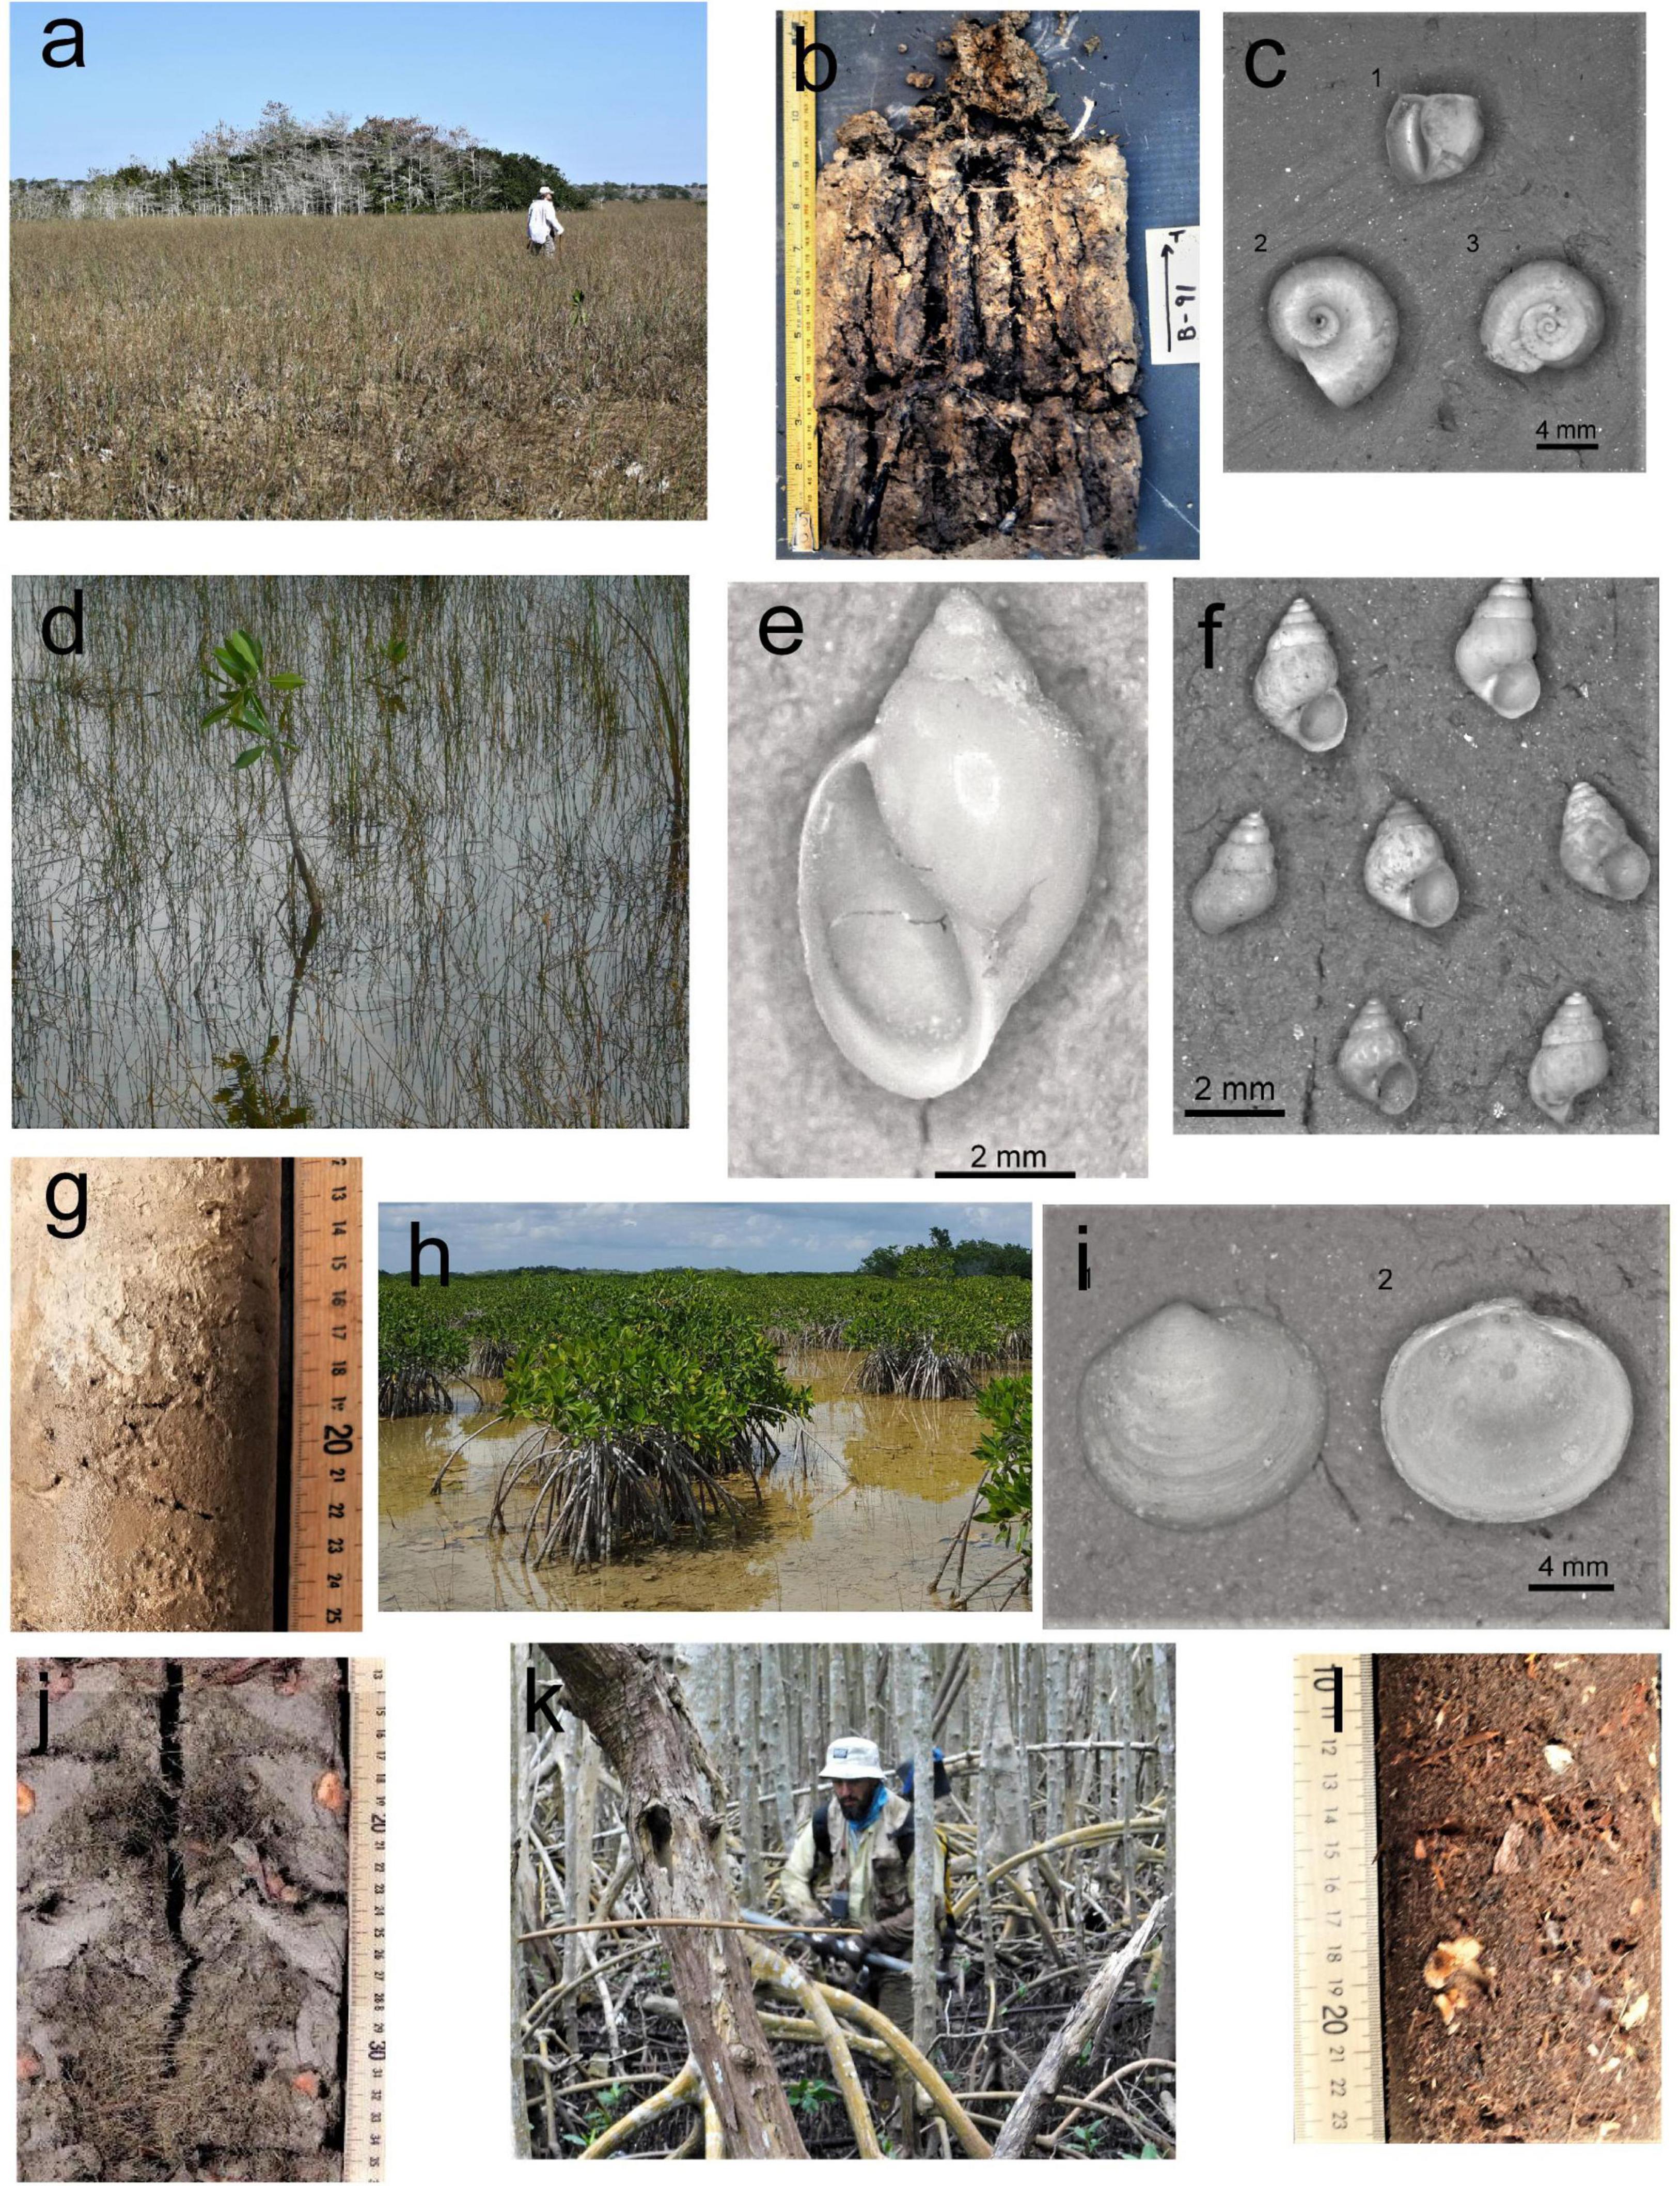
Figure 2. Plant community and associated biogenic sediment with characteristic mollusk. (a) Saw grass community, (b) Saw grass peat marl overlain by white marl (TKYINT, l7–32 cm), (c) immature Planorbella scalaris, typical freshwater gastropod (upper shell 2.2 mm in width), (d) Eleocharis-penphyton prairie, (e) white mail overlying tan marl (Core TKYW: I2–25 cm), (f) the euryhaline Hydrobiid, Littoridinops monoroensis (average 2 mm in height), the most abundant algal grazing gastropod, (g) freshwater Physa cubensis, a detritivore gastropod, (h) mangrove scrub, (i) mangrove peat marl (Core X: 17–35 cm), (j) immature filter feeding marsh clam, Cyrenoida floridana (5.5 mm in height), (k) mangrove fringe, and (l) mangrove peat (Core X: 9–25 cm).
Figure 3. (A) Box-plot illustrating the relationship among bulk density and sediment types. (B) Box-plot illustrating the relationship among SOC density (SOC g/cm3) and sediment types. (C) Box-plot illustrating the relationship among the rate of SOC accumulation (SOC g/cm2/yr) and sediment types. (D) Box-plot illustrating the relationship among the Salinity Index and sediment types.
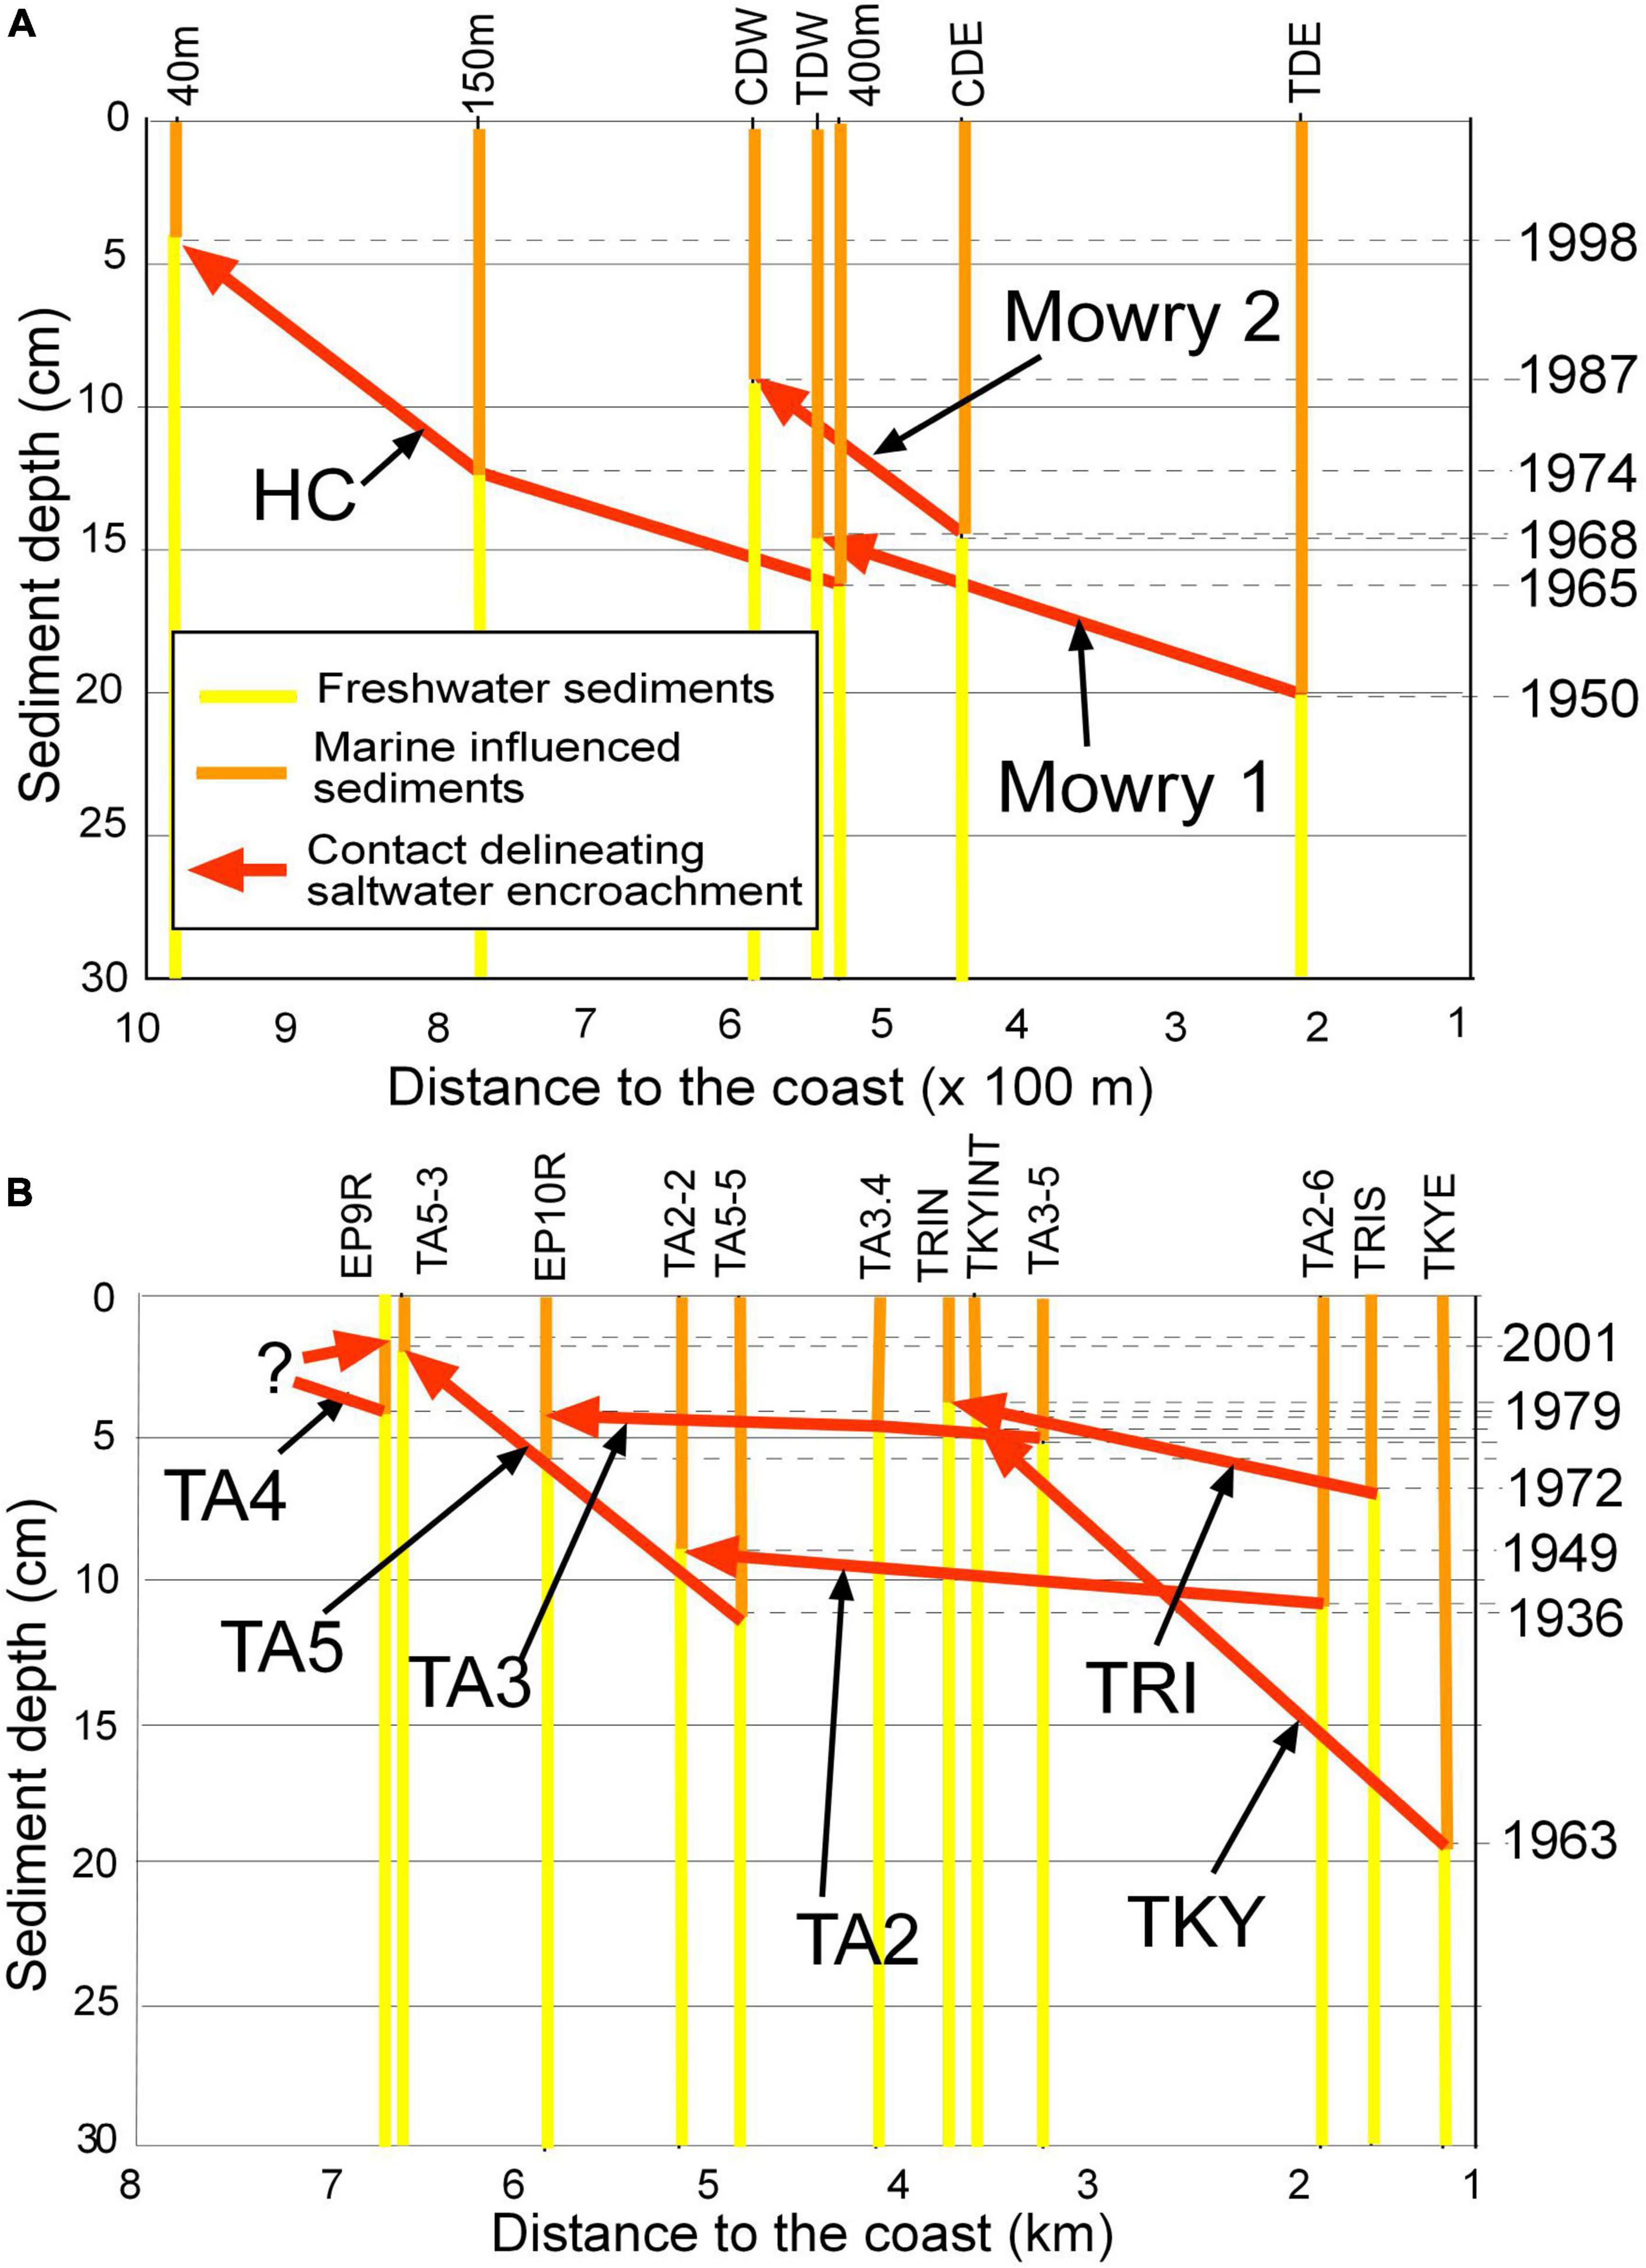
Figure 4. Core pairs from transects indicating the dates of contacts between core pairs and the distance between the cores. The led line separates freshwater (yellow) from marine influenced (orange) sediments, the arrow points in the direction of saltwater encroachment. (A) Short transects from Biscayne Bay coastal basins. (B) Long transects from Florida Bay coastal basins and the Turkey Point transect from Biscayne Bay. Note the change in horizontal scale.
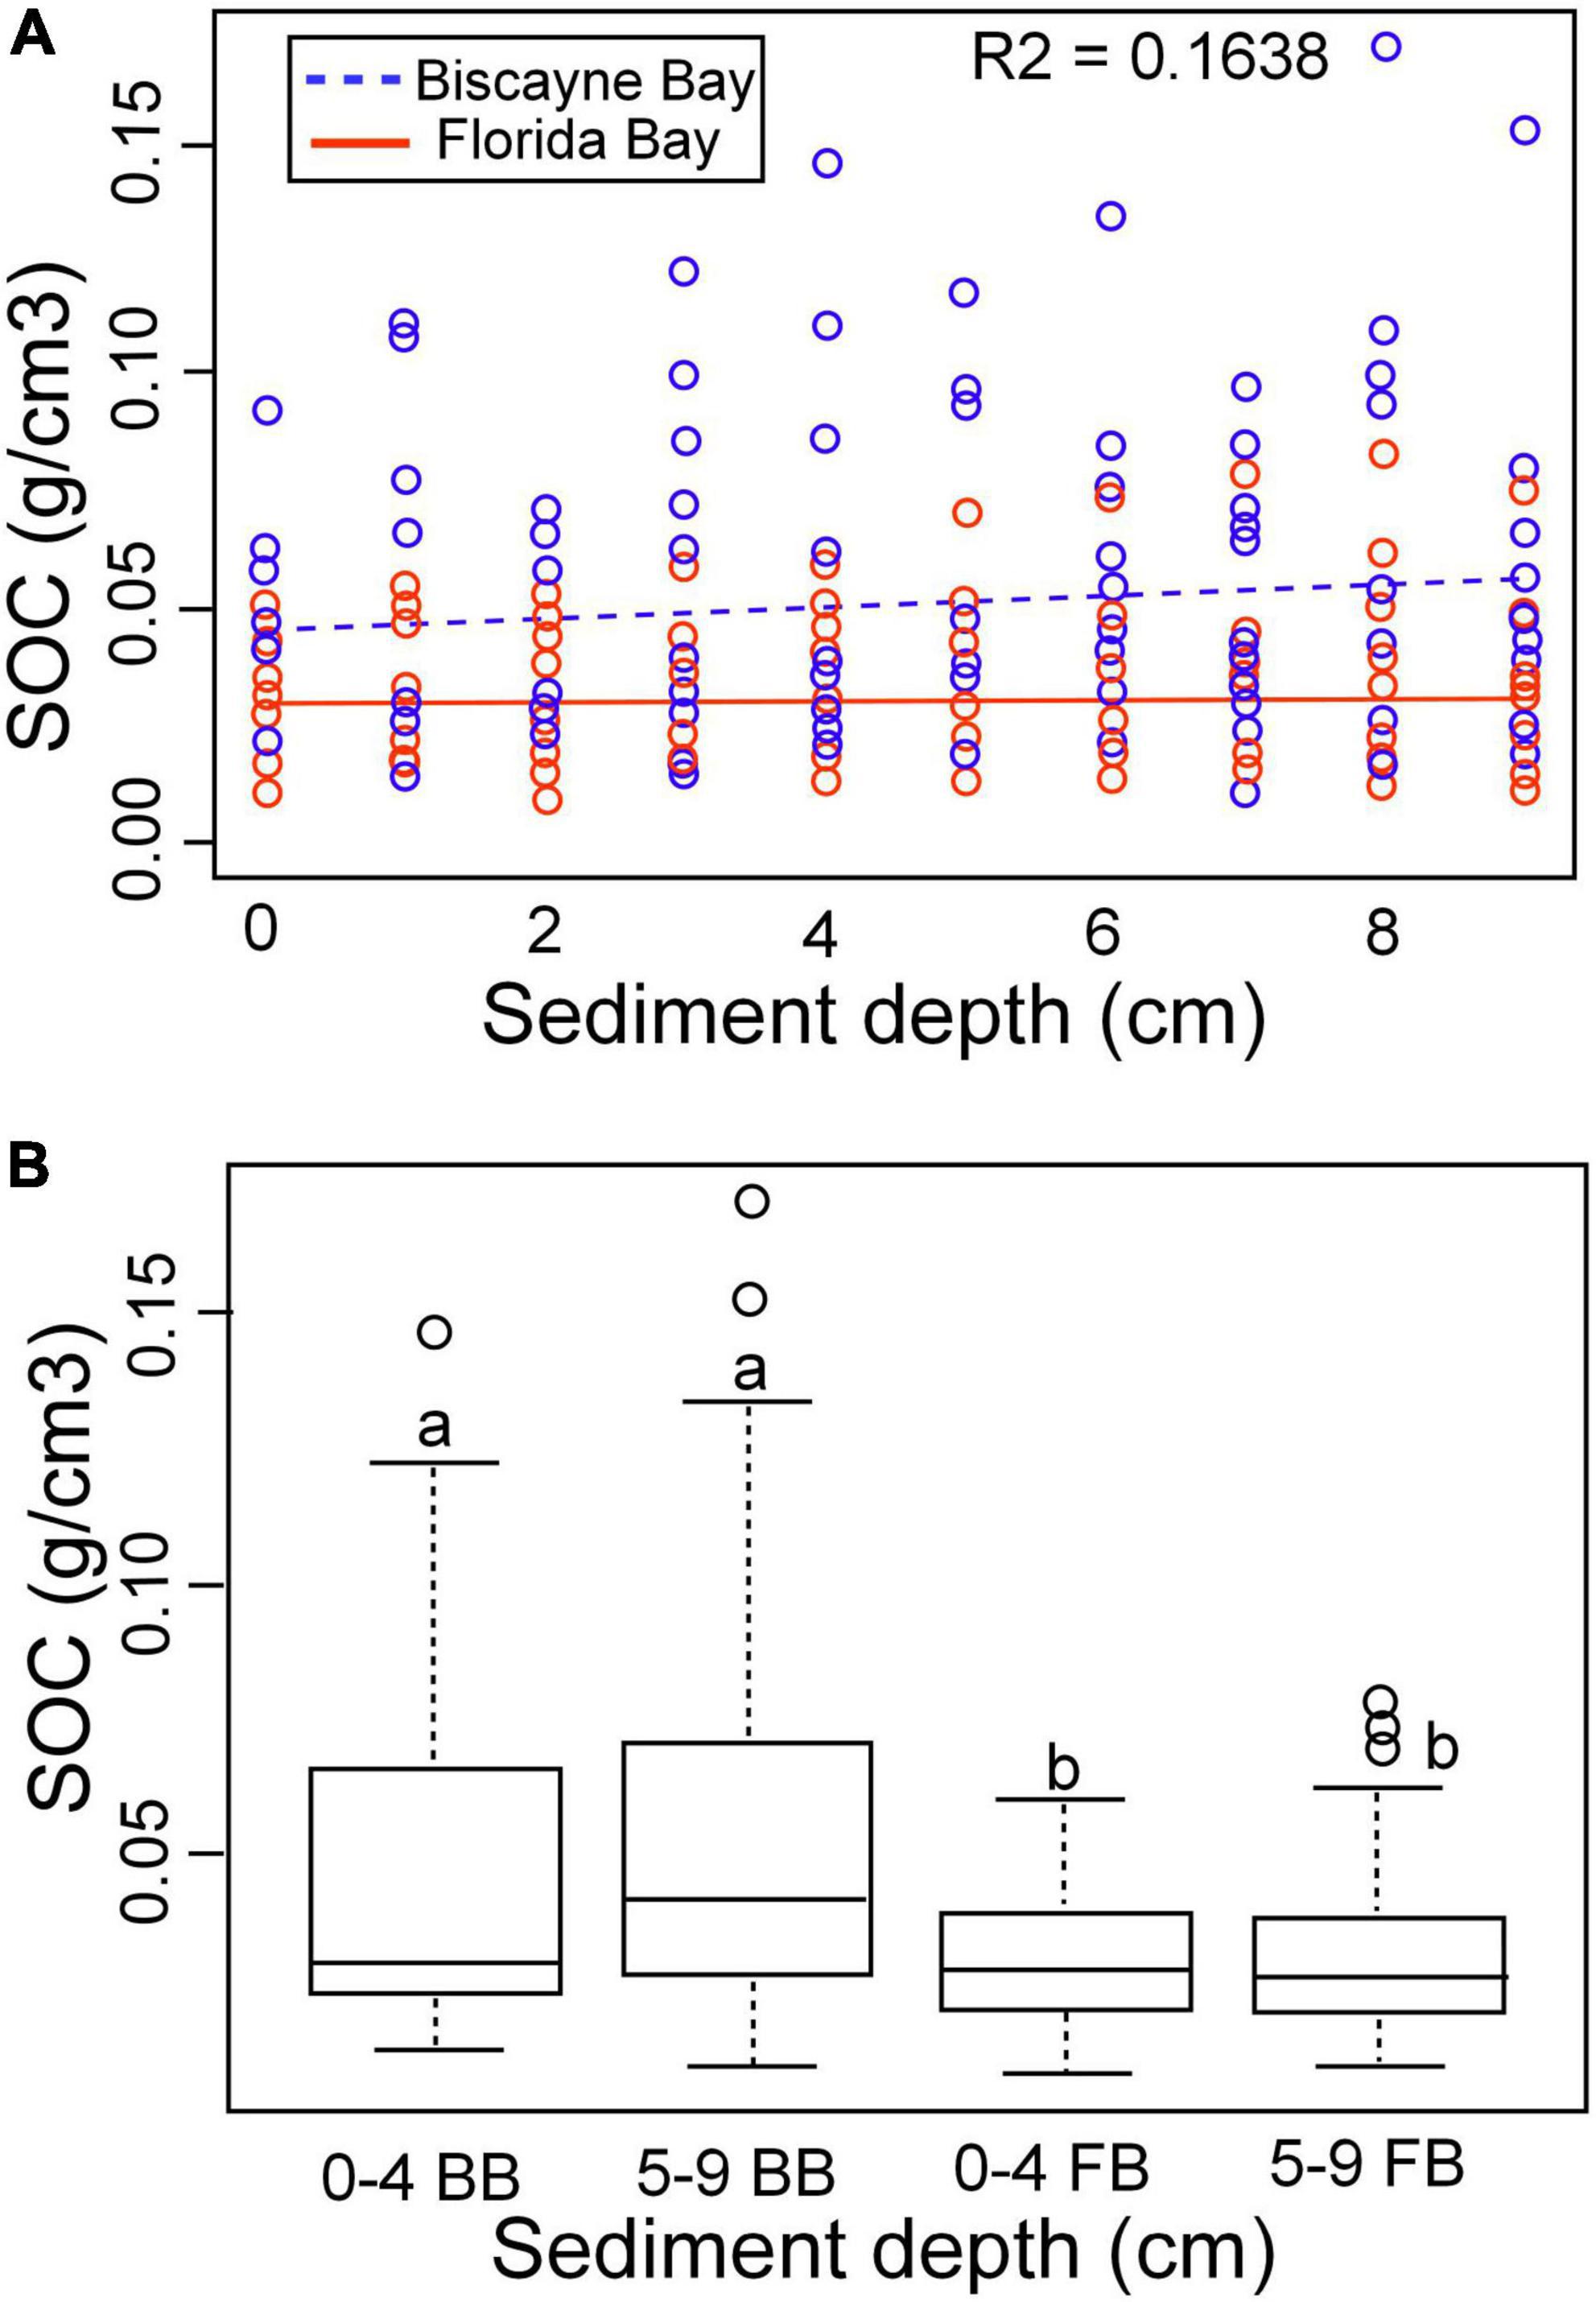
Figure 5. (A) Relationship between SOC density and sediment depth by location. (B) Relationship among SOC, depth interval and location. BB, Biscayne Bay; FB, Florida Bay.
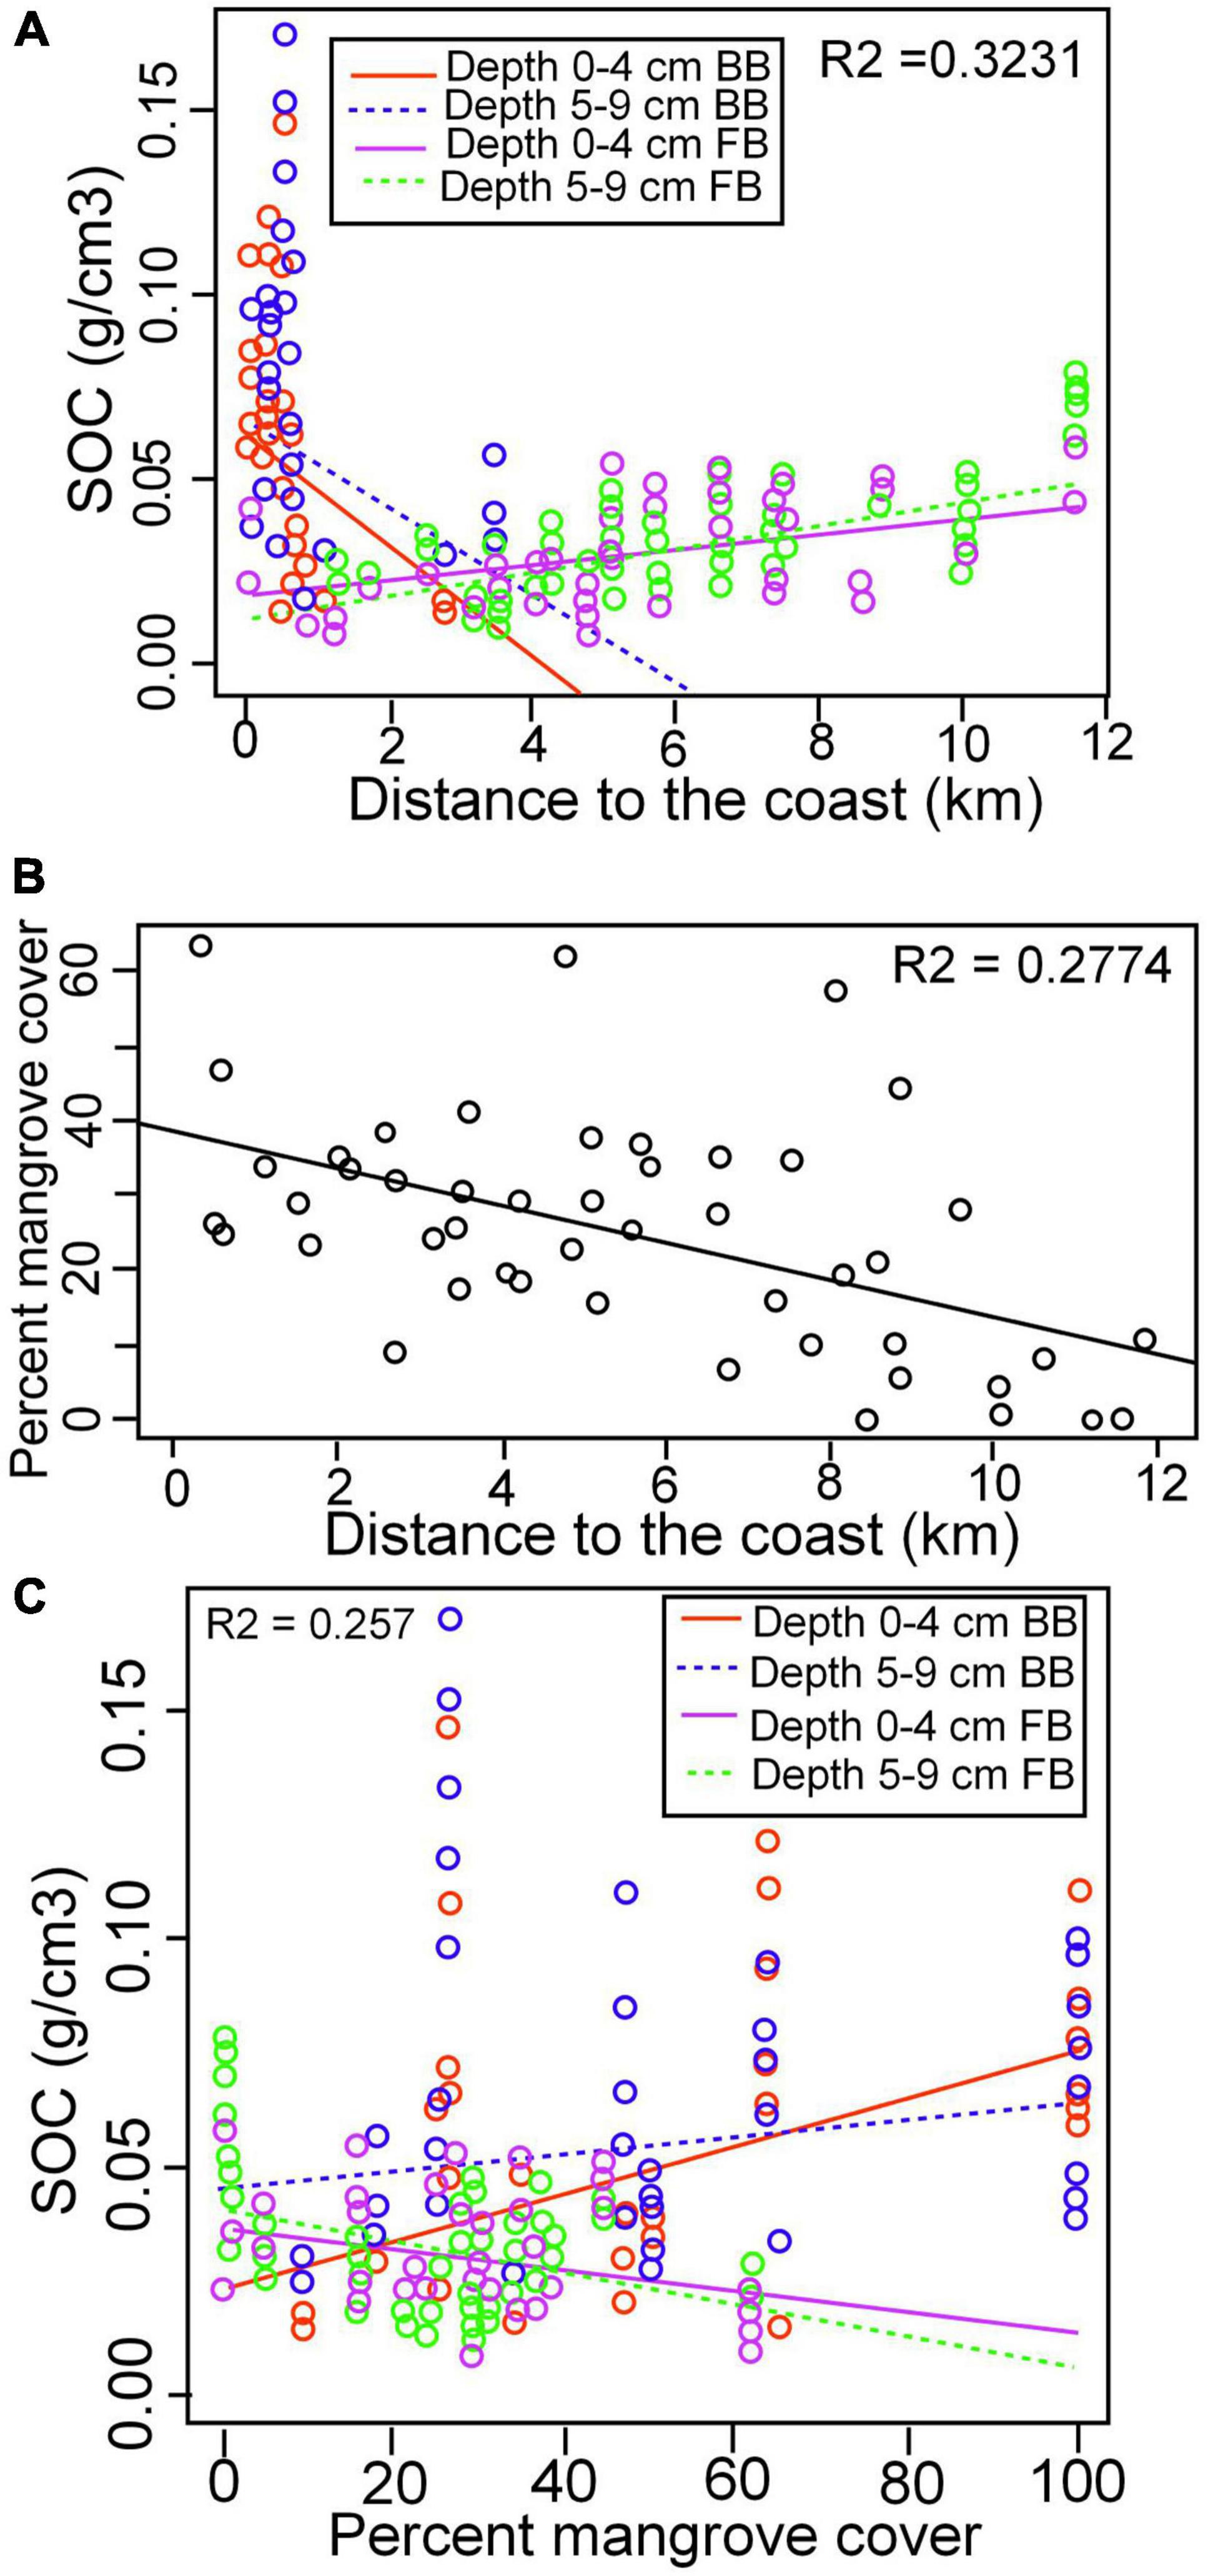
Figure 6. (A) Regression analysis demonstrates the relationship between SOC and DTC by sediment depth interval by location (Supplementary Table 1). (B) Percent mangrove cover as a function of distance to the coast (data from all 50 vegetation sites including the 22 sediment core sites) and (C) Regression analysis demonstrates the relationship between SOC density and percent mangrove cover by location and sediment depth interval (Supplementary Table 1).
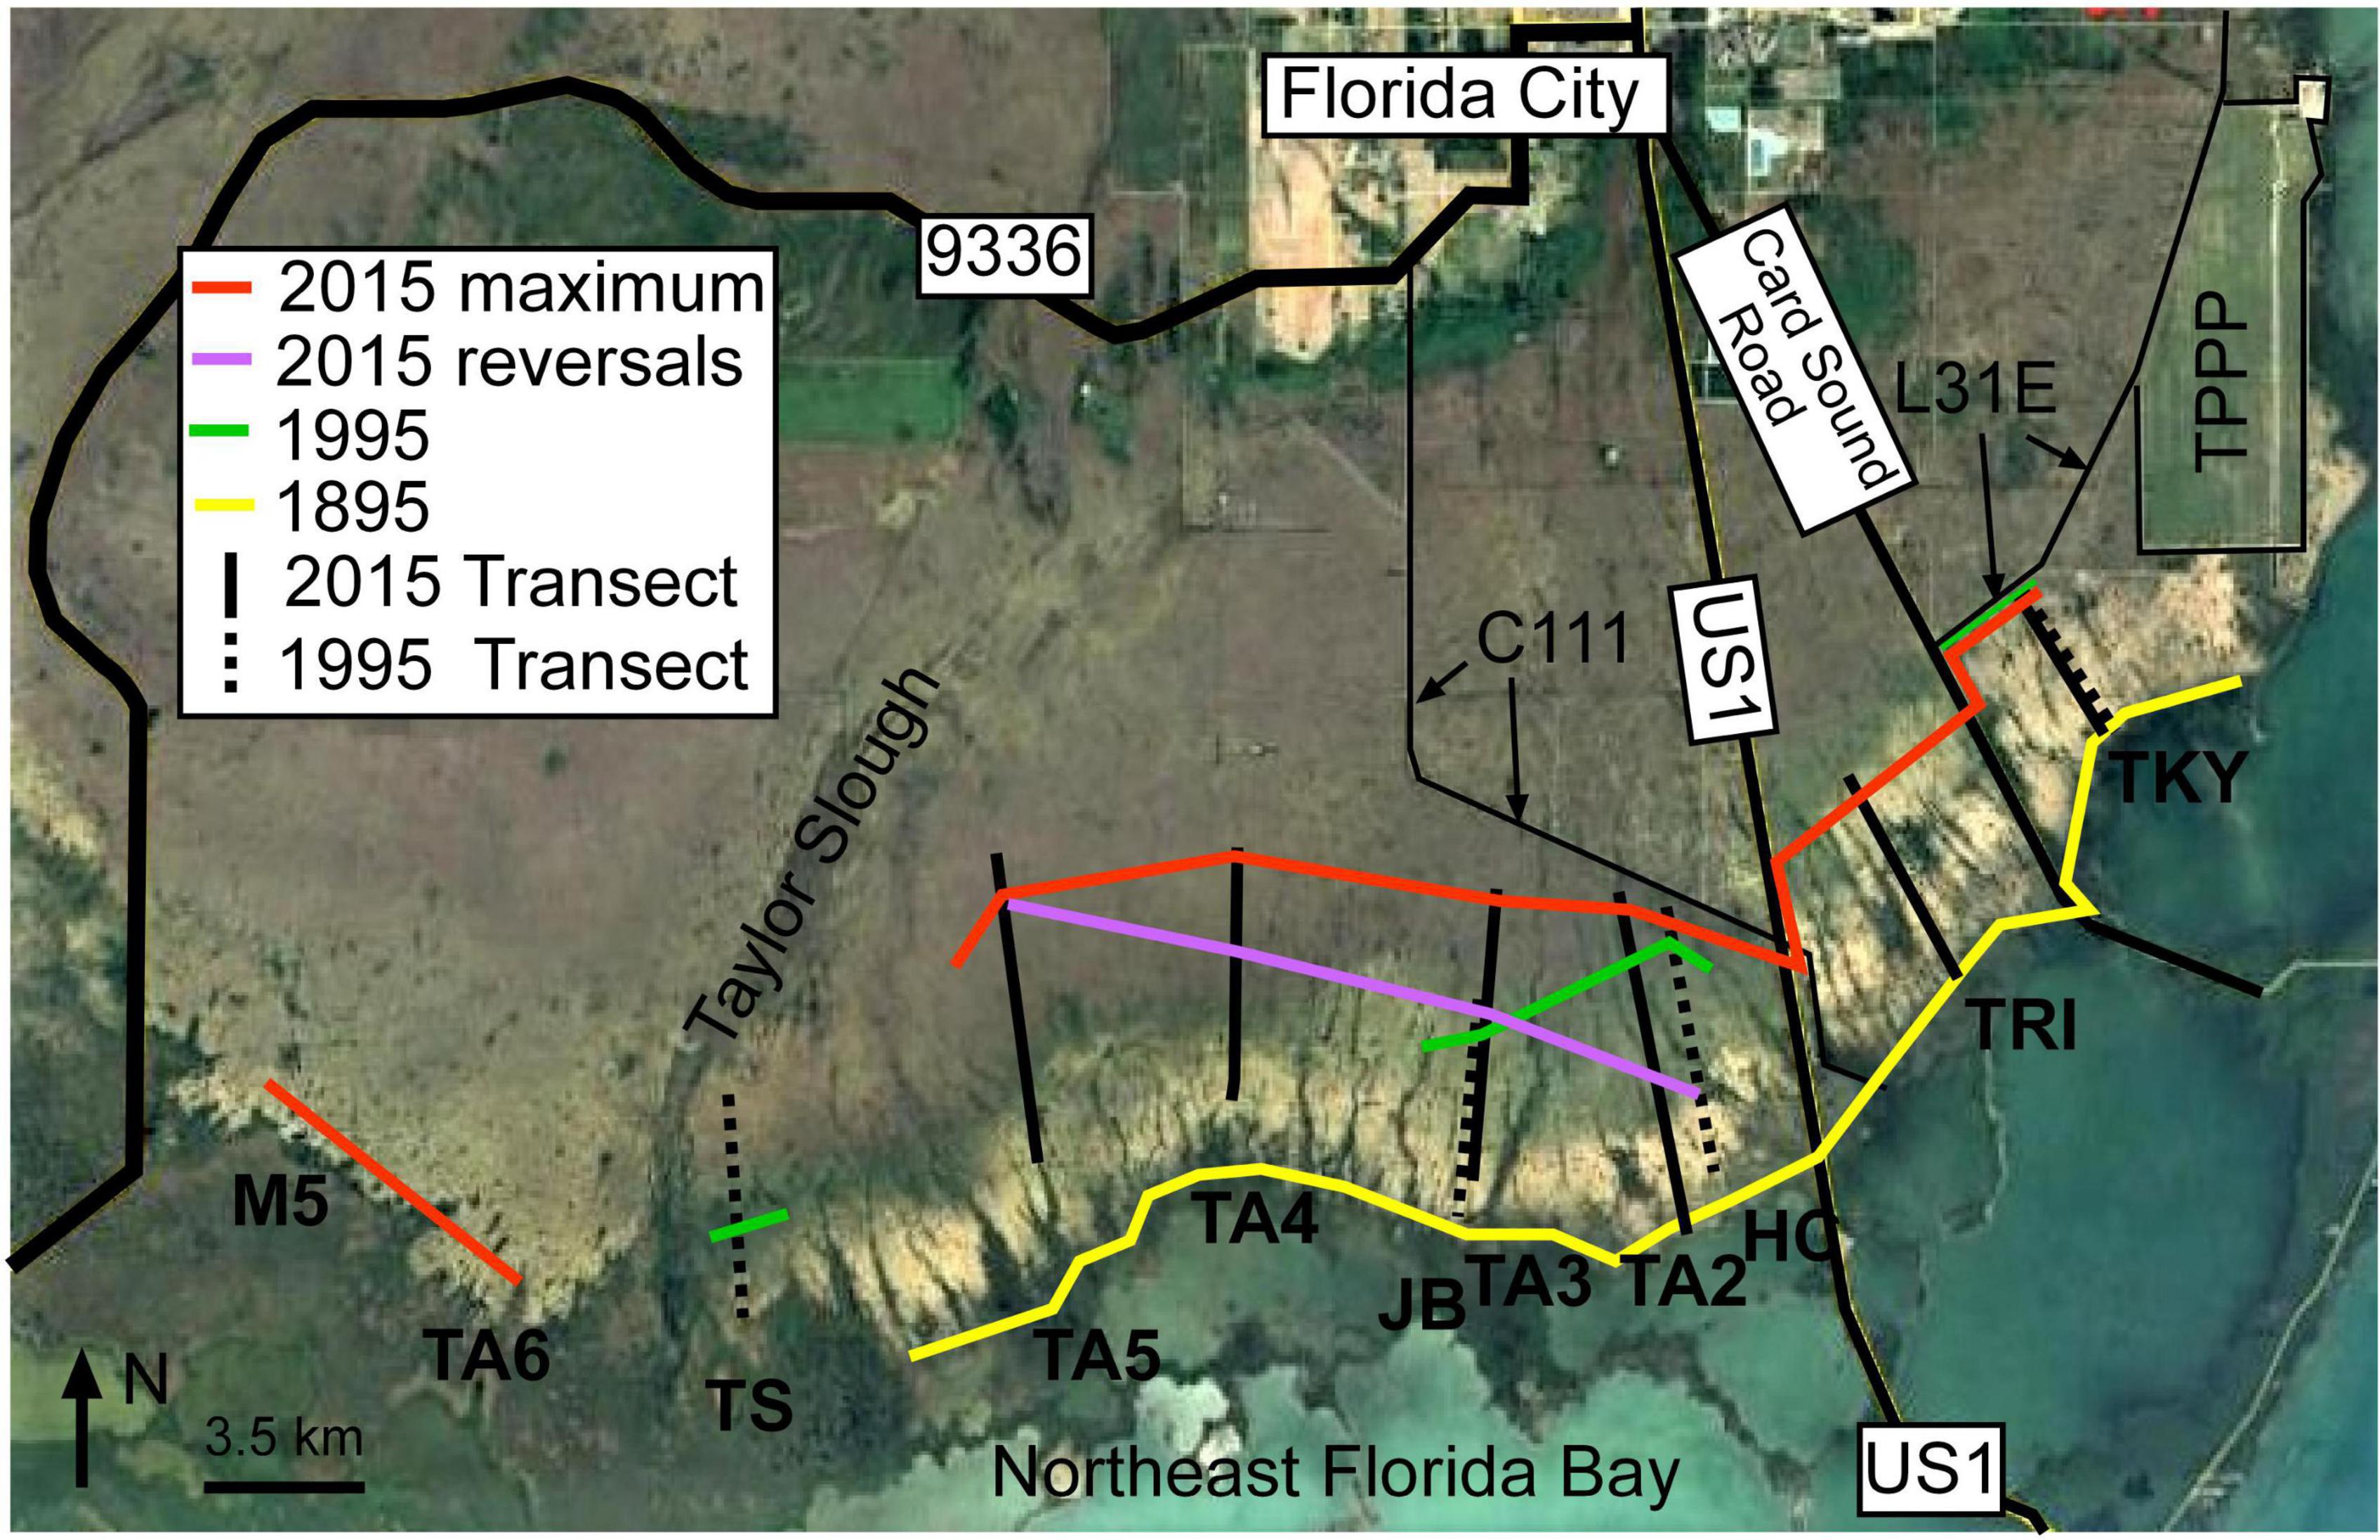
Figure 7. Saltwater encroachment by time. Extent of saltwater encroachment in I895 (Yellow line), 1995 (Green line), 2015 maximum saltwater encroachment (Red line) and 2015 final saltwater encroachment (Purple line). The location of 1995 transects are indicated by black dashed lines and 2015 transects by solid black lines. TPPP, Turkey Point Power Plant.
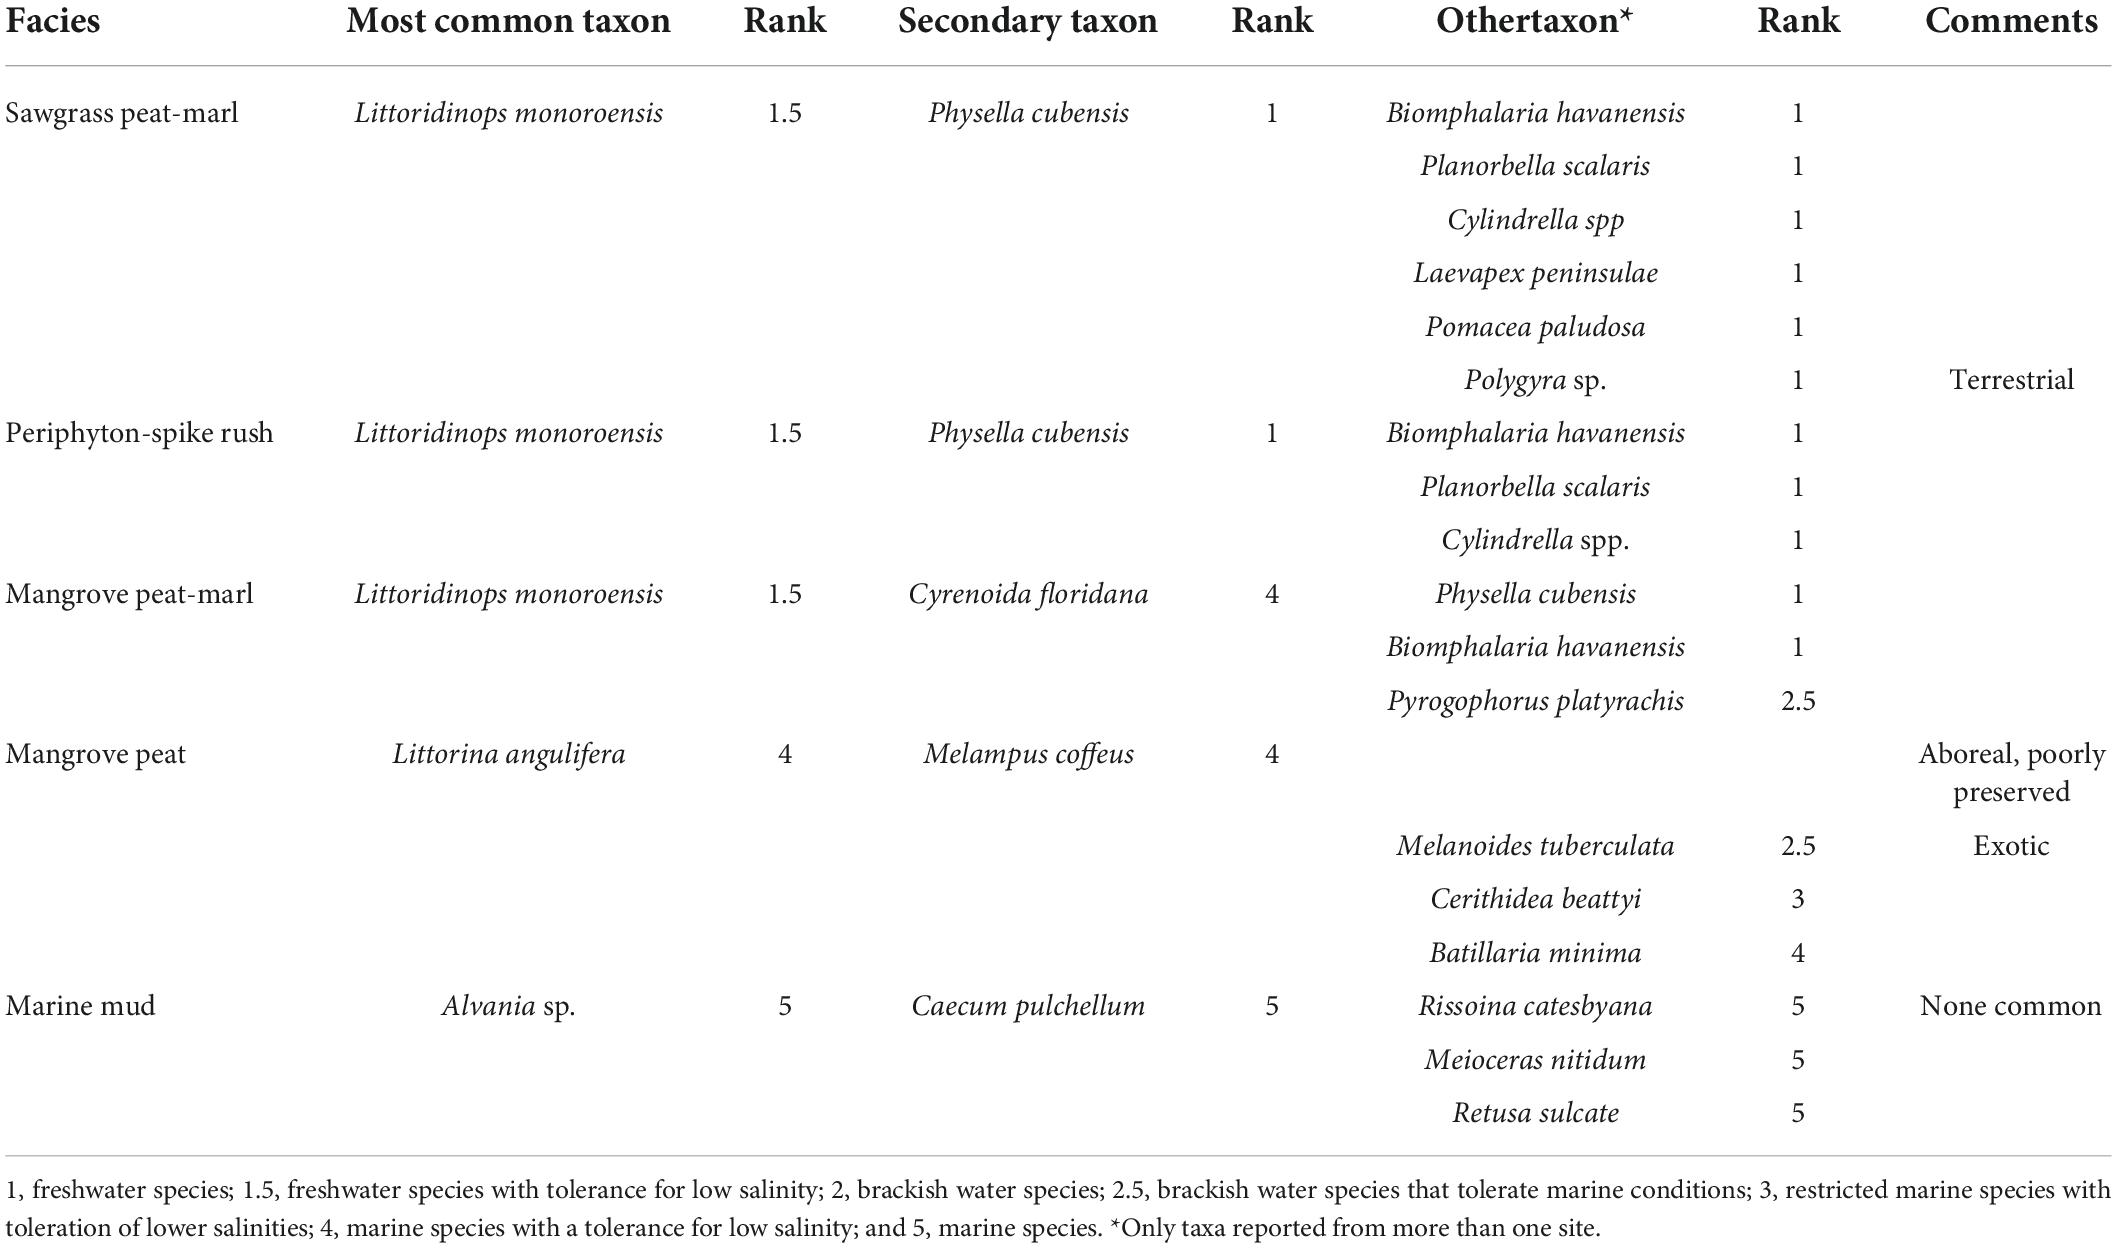
Table 2. Mollusk taxa found in each facies.
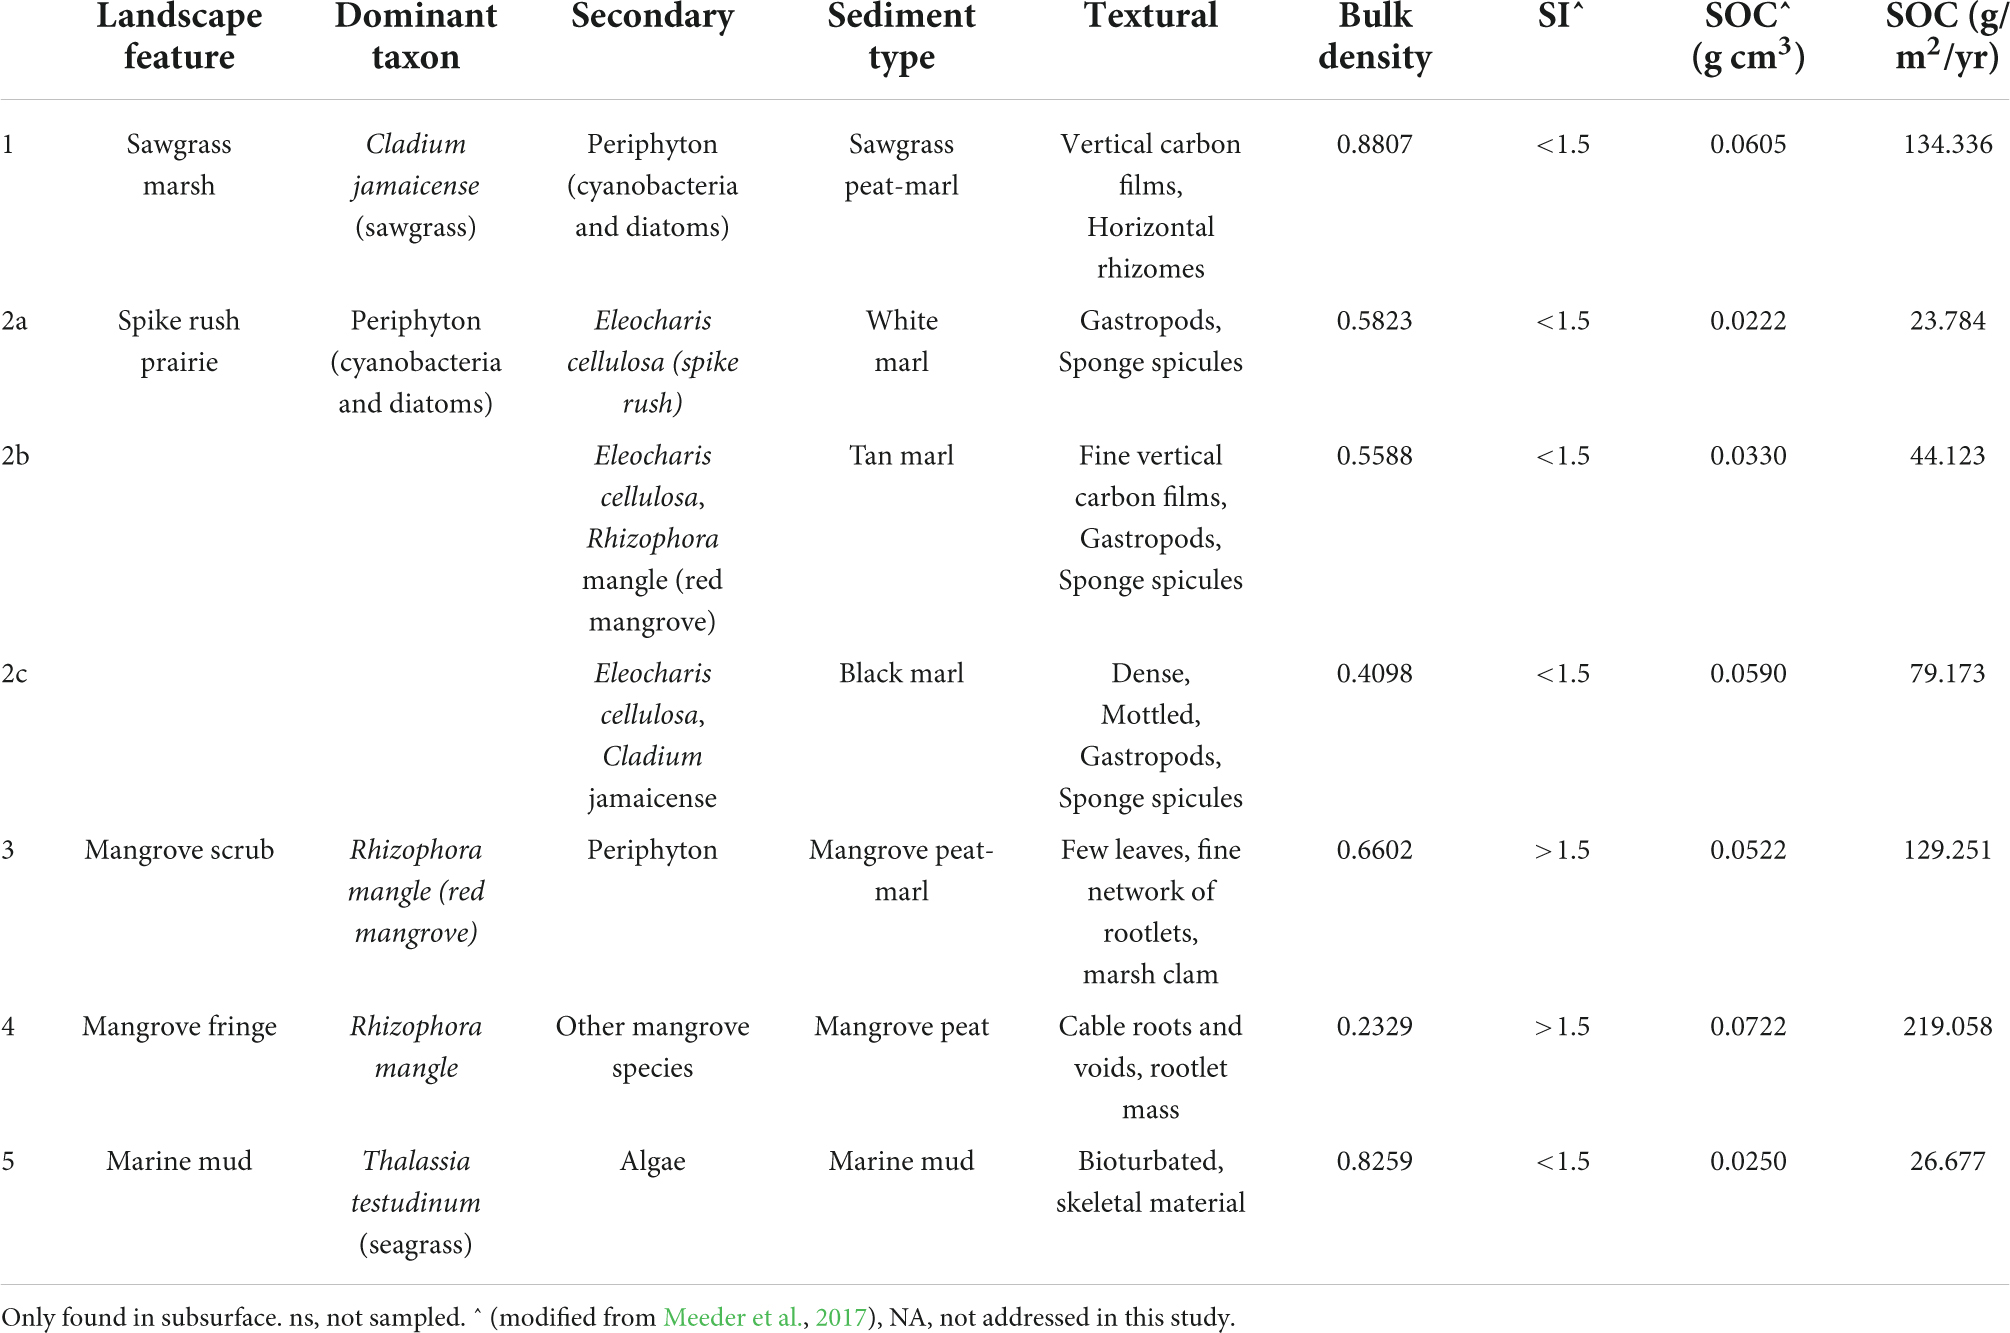
Table 3. Summary of facies characteristics (modified from Meeder et al., 2017).
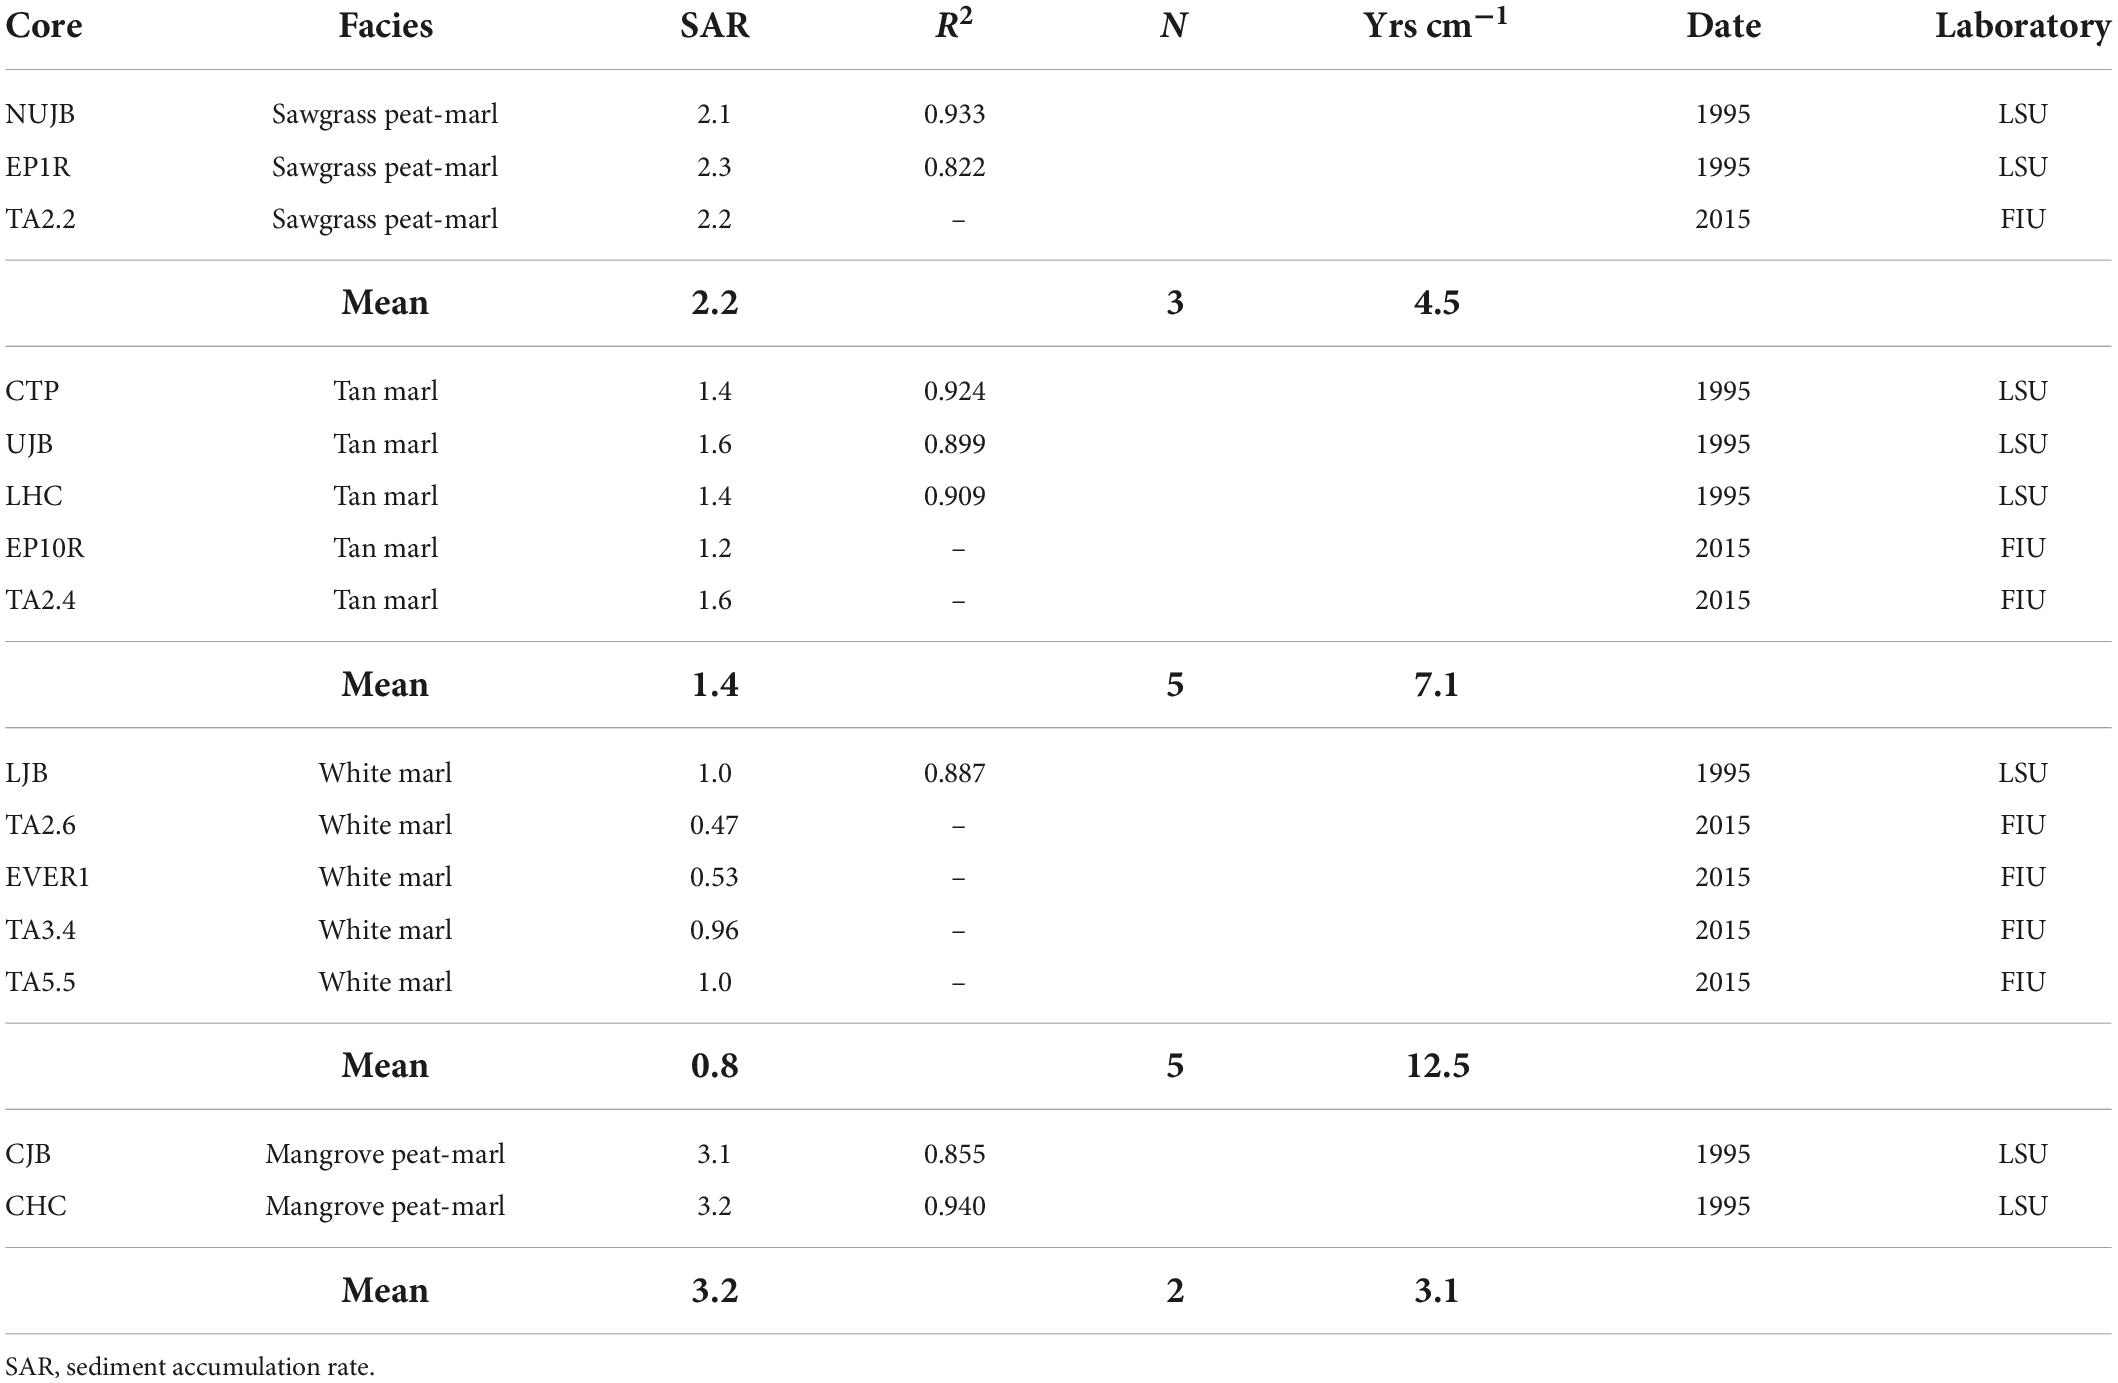
Table 4. Sediment accumulation rates (based upon average accumulation rate for the century).
Observations over the past two decades suggest rapid changes in the SESE environment since a baseline study in 1995 that addressed the period 1895–1995 (Meeder et al., 2017). The most obvious change is mangrove infringement into freshwater marshes, a sign of SWE. This study addresses the rates of SWE and patterns of SOC deposition during the last 20 years and contrasts coastal BBCBs to interior areas of FBCBs. Few studies address how SLR and SWE-driven changes in coastal wetlands affect OC storage at the landscape scale (Lamont et al., 2020; Meeder et al., 2021). The influence of SLR on SWE and the effect of the latter on facies distribution have already been established (Meeder et al., 2017; Meeder and Parkinson, 2018). However, the impacts of acceleration in the rate of SLR on the SWE, SOC deposition patterns, marl production, and the distribution of mangrove are incompletely understood. In order to quantify the effects of SWE it is necessary to address the following objectives: (1) Document the characteristic facies properties and their distributions, (2) Determine the vertical and horizontal distribution of SOC, and (3) Calculate the extent and rate of SWE in each basin. These objectives will document heterogeneity among basins, provide insight on the major cause of changing SOC deposition, contribute to the prediction of the future SESE under conditions of accelerating SLR and address the capacity of coastal wetlands to respond to recent changes in the global climate cycle.
Materials and methods
Field data collection
A geological approach utilized vertical changes in sediment cores and horizontal changes along transects to document shifts in facies, changes in SOC distribution and distances and rates of SWE. Ten shore-normal sediment core transects were established across the sub-environments in the coastal basins (Figure 1). BBCB cores were located within 3.5 km of the coast and focused on mangrove expansion, whereas FBCB transects placed between 1.2 and 11.6 km from the coast addressed the extent of SWE. Sediment cores were collected utilizing 7.6 cm diameter aluminum tubes, transported upright, returned to the laboratory, frozen, and later sectioned frozen at 1 cm intervals, using a miter saw to ensure consistency to a depth of 30 cm. Freezing and using miter saw to cut peats into 1 cm sections is more accurate than trying to cut an organic rich sediment into 1 cm–3 using a razor. Much like cutting a wet sponge. The error is much less than the 9% maximum expansion by ice and is much less variable than hand cutting samples. Marl has little water and doesn’t expand, peat-marls don’t expand very much as marl dominates and peat expansion likely is mostly filling internal pores, and no freezing induced cracks or expansion lobes are observed. If peat expands to their fullest by freezing our peat numbers will be underestimates by the amount of expansion. We’d rather underestimate than overestimate, and our peat densities may be underestimates.
All cores with more than 5% compaction in the field were rejected by comparison between the core length recovered and the depth of the core. Each core interval was split and aliquots used for different analysis. Sediment samples for bulk density and SOC analyses were removed from the center of the 1 cm section to avoid sidewall contamination and minimize the effects of compaction. Samples for 210Pb analyses were collected adjacent to the sample processed for SOC. One-half the core sample was washed through a 1 mm sieve and mollusks were collected and identified for use as a proxy for salinity. Normal (t-test) or non-parametric tests (Dunn’s Test, the Kruskal–Wallis Test and Wilcoxon Rank-Sum Test) were utilized to test the relationship between parameters in data sets that met normality and homogeneity of variance criteria. Predictive analyses were conducted using multiple linear regression (Supplementary Table 1). All tests were conducted using the R programming language (version 3.6.3) which was utilized within the Rstudio IDE (Version 1.3.1093).
Plant communities, mollusks and facies
Plant community data including the descriptions of plant communities and percent mangrove cover were collected from 30 1-m2 plots arranged in a circle of 50 m radius surrounding the sediment core site (Ross et al., 2020). It was important to document differences within and among sediment types (facies) in order to confidently determine change, therefore considerable effort was made in facies characterization. Facies were based upon differences found among the 872 core samples in plant remains, bulk density, SOC, SARs and mollusks as salinity indicators. The biogenic SESE sediment body composition was either organic matter or organically produced calcite (marl), but only SOC was reported.
Plant remains
Plants remains varied among and were characteristic of facies and were the primary source of SOC. Plant remains were described by species, abundance, dimensions, orientation, and growth patterns.
Bulk density and sediment organic carbon content
The dry bulk density was determined by weighing a dry 2 cm3 volume of sediment and the SOM g cm3 (density) was determined by loss on ignition (Dean, 1974). SOM was converted to SOC using a standard conversion factor of 0.58 (Sikora and Stott, 1996). Bulk density and SOC were determined from a 2 cm3 sample, to better address sediment heterogeneity. The relationship between SOC and bulk density was tested.
Sediment accumulation rates
Sediment organic carbon content and bulk density were determined from 2 cm3 samples from select cores and samples sent to an independent laboratory (Dr. David Kadko, FIU) for 210Pb analysis. 210Pb analysis was only performed on seven marl core intervals because of limited funding, the prevalence of marl sediments and the paucity of marl accumulation rate data, while mangrove peat SARs were collected from previously published sources. In addition, eight previously analyzed cores, from several facies, were also utilized (Meeder et al., 2017). 210Pb analysis were not performed on every core, therefore, the average SAR for each sediment type was utilized. The Constant Rate of Supply Model was utilized because cores were long enough to reach baseline 210Pb levels (Appleby and Oldfield, 1992). The variation in marl SOC density and SAR along the coastal gradient was of paramount interest, as there is a paucity of information on such sediments. SAR (mm/yr) was utilized to calculate the period required to accumulate 1 cm of sediment (yr/cm), in order to date the fresh water-marine influenced contact in each core. Dating of different core horizons was necessary in order to calculate the SAR to determine the rate of SWE. The SAR was calculated by converting SOC density to SOC g m2/cm and dividing by the number of years required for that sediment type to accumulate 1 cm, producing a rate expressed as yrs/cm.
Salinity index
All mollusks > 1 mm in diameter were collected, identified and counted. Each mollusk species was assigned an SI value based upon known salinity tolerances (Table 2). A salinity index (SI) was calculated by application of a weighted average technique (Blinn, 1993) using Equation 1:
Where SIspi is the ith species SI, DENSspi is the density of the ith species and DENSsamp is the total number of mollusk individuals.
Salinity index values between 1.0 and 1.5 indicate freshwater influence, and those > 1.5 are marine influenced; selection of SI 1.5 as a transitional value was based on the distribution of the most common gastropod tolerating brackish water (Meeder et al., 2017). The contacts between non-marine and marine influenced sediments in each core in each transect were plotted in fence diagrams. This contact line delineates SWE. The relationship between SI and SOC density was plotted using a box and whiskers graph.
Sediment organic carbon distribution
Sediment organic carbon significantly increased during the last century in BBCBs (Meeder et al., 2021). However, in order to compare BBCBs and FBCBs the BBCB data set was combined with the FBCB data set and different analysis utilized in this report.
Sediment organic carbon vertical distribution
Sediment organic carbon density was calculated for each 1 cm core sample and continuous samples of similar density combined into core intervals. A correlation between vertical SOC density change and SI in each core was tested. The percent difference between SOC values of the lower freshwater interval and upper marine influenced interval was first calculated. Because of the different size intervals and variability within sediment intervals in each core, different statistical tests were employed; T-test were utilized where normality and variance criteria were met and non-parametric tests otherwise, in order to determine significance. In cores, recording more than one salinity change because of SWE reversal and second episode of SWE, the differences between the first salinity change, from fresh to marine, was addressed. The durations of second salinity episodes were often too short, a core interval of only a few cm, for analyses of differences. In cases of no salinity change, the upper facies was tested against the underlying facies, if different.
In addition, an analysis utilizing combined core data, rather than on individual cores was performed. The relationship between SOC and sediment depth was examined with depth treated as a numerical variable on an interval scale and with depth treated as a categorical variable with each datum categorized as either the 0–4 or 5–9 cm interval. In both cases, data from the BBCBs and FBCBs were treated separately using regression analysis.
Sediment organic carbon horizontal distribution
In order to determine the relationship between SOC and distance to the coast (DTC), the SOC for two-sediment depth intervals (0–4, 5–9 cm) were tested against their respective DTC for BBCBs and FBCBs using a regression analysis. In order to determine the relationship between SOC and mangrove cover, the SOC for two sediment intervals (0–4, 5–9 cm) were tested with percent mangrove cover, DTC and by location (BBCBs or FBCBs), also using regression analysis.
Saltwater encroachment
Two most important aspects determining calculation of SWE rate were SI and the accumulation rates of facies (Meeder et al., 2017). Fence diagrams were created for all transects illustrating the contact between freshwater and marine influenced sediments that describes SWE. This contact line also separates facies in BBCBs. The rate of SWE was calculated in four steps. The first was to determine the date of the contact between freshwater and marine influenced sediments in two cores along one transect. The second (Equation 2) was to calculate the difference between the dates from the distal (furthest from the coast) and proximal (closest to the coast) cores providing the time interval:
Where B is the distal and A the proximal core and CD the contact date
The third step was to measure the distance in meters between the two cores :
Where ADTC and BDTC are the proximal and distal core distance to coast respectively
The final step was the calculation of SWE (m/yr) by dividing the distance (m) by the time interval (TI) between two cores:
Where D = Distance (m) and TI (yr) are calculated in Equations 3 and 2 respectively.
Calculations assumed a constant datum among cores, which is a reasonable assumption in this landscape with a slope of < 8 cm/km. Two sources of uncertainty in the calculation of SWE are insufficient elevation data for core sites and calculation of dates from 210Pb analyses. Because of the unreliable elevation data at core sites and insufficient precision in the use of LiDAR, we utilized a horizontal datum base, in order to have a similar datum for all transects. We acknowledge that there is a calculated seaward slope of ∼1.2 km over FBCB distances of 15 km or 8 cm in 100,000 cm (1 km). When graphed there is very little difference between the horizontal and the slope line at the scale of our cross-sections and therefore we feel that using the horizontal datum is adequate. We also recognized that the greater the slope the less SWE and that our calculation of SWE are likely overestimated by ∼ 200 m in FBCBs. In addition, dates derived from 210Pb analyses cannot be considered precise because of small differences in isotope reactions and calculation artifacts. We suggest that dates are accurate within ± 3 years, a figure utilized in many studies.
Results
Plant communities, mollusks, and facies
Four dominant plant communities and associated facies were described based upon bulk density, SOC density, accumulation rates and depositional salinity (Table 3). Plant communities and their associated biogenic sediments were located in bands parallel to the coast and perpendicular to the salinity gradient. The most interior sawgrass community (Figure 2A) and associated peat- marl facies was only found in the subsurface east of the L31E levee and in the area northeast of the Card Sound Road and northwest of the L31E levee in BBCBs. In contrast, the sawgrass facies in FBCBs occupied the northern half of the basins and extended southward to the mangroves in Taylor Slough. The sawgrass peat-marl facies contained a marl matrix with horizontal rhizomes between 1 and 3 cm in diameter and short vertical rootlets and occasional basal culms but no other aboveground material. Extensive sawgrass areas were associated with freshwater sediments that contained moderate but varied SOC content and were brown to black in color (Figure 2B). Only freshwater gastropods were present such as Planorbella scalaris (Figure 2C and Table 2).
The spike rush-periphyton community (Figure 2D) and marl facies, dominated the landscape between the coastal mangroves and the sawgrass ecotone, although lost by mangrove overstep in the northern Biscayne Bay coastal basins and Taylor Slough. The low density, emergent vegetation in the spike rush community maximized the area for periphyton mat and marl production, resulting in a white, low SOC content marl with a massive texture (Figure 2E). The marls contained little plant material except for thin, < 6 mm, vertical carbonaceous films and all marl types contained gastropods, sponge spicules and diatoms, the latter two the only silicates in the system. The euryhaline algal browsing hydrobiid, Litttoridinops monoroensis, was the most abundant mollusk (Figure 2F) and the freshwater detritivore, Physa cubensis, was common (Figure 2G).
The scrub mangrove community (Figure 2H) produced variable peat-marl facies that exhibited similar SOC valves as the sawgrass peat-marl and was gray to tan in color. The density of cable roots and rootlet matrix varied within and between cores (Figure 2I). Large horizontal reddish mangrove rhizomes, up to 1.7 cm in diameter, were abundant and a fine network, < 2 mm in diameter, of rootlets infiltrated the marl matrix. The volume of both rhizomes and rootlets usually increased upwards in core intervals. Cyrenoida floridana, the filter feeding marsh clam (Figure 2J), was the diagnostic mollusk and Litttoridinops monoroensis was the dominant gastropod.
The coastal fringing mangroves in BBCBs (Figure 2K) produced a reddish fibrous peat facies, with abundant horizontal cable roots and a matrix of rootlets (Figure 2L). Red mangrove peat was also found along tidal creeks and embayments in both BB and FBCBs. Numerous mollusks were observed on the mangrove peat surface, although only rare, highly etched arboreal gastropods were found in the peat. The red mangrove fringe was replaced by the “Buttonwood Ridge,” a coastal wash-over levee (Cottrell, 1989), covered with buttonwood and salt marsh grasses along the Florida Bay coast. A marine mud facies was reported at coastal TKY.
Bulk density and sediment organic carbon content
Each facies exhibited different average bulk densities in decreasing order: sawgrass peat-marl (0.8807), marine mud (0.8259), mangrove peat-marl (0.6602), white marl (0.5823), tan marl (0.5588), black marl (0.4098), mangrove peat (0.2329 g cm3) (Figure 3A and Table 3). A Kruskal–Wallis test (p-value of 1.512603513e-19) demonstrated that bulk density was not consistent across the various facies. A Dunn’s Test demonstrated that there was a difference in stochastic dominance of bulk density levels between pairs (Supplementary Table 2A). The average SOC density varied among the facies (Figure 3B) and since the different facies accumulated at different rates (Table 3) the rate of SOC g/m2/yr exhibited more variability than OC density (Figure 3C). The average SOC density for the different facies in descending order were mangrove peat (0.0722), sawgrass peat-marl (0.0605), black marl (0.0590), mangrove peat-marl (0.0522), tan marl (0.0330), marine mud (0.0250) and white marl (0.0222 g cm3) (Figure 3B). A Kruskal–Wallis test (p-value of 5.504501e-87) documented the distribution of SOC density was not consistent across the various facies. A Dunn’s Test demonstrated that there was a difference in stochastic dominance of SOC density levels (Supplementary Table 2B).
Sediment accumulation rates
Sediment accumulation rates for the seven cores analyzed in this study and the eight previously analyzed and the average SAR for each sediment type were presented (Table 4). Each facies exhibited characteristic accumulation rates. The sawgrass peat-marl average accumulation rate was 2.2, tan marl was 1.37 and white marl was 0.79 mm/yr. The average accumulation rate for the two-mangrove peat-marl samples was 3.2 mm/yr. The average SOC accumulation rate (g/m2/yr) for the different facies in descending order were: Mangrove peat (219.058), sawgrass peat-marl (134.336), mangrove peat-marl (129.251), black marl (79.173), tan marl (44.123), marine mud (26.677) and white marl (23.784 g/m2/yr) (Figure 3C). A Kruskal–Wallis test (p-value of 8.7956109e-133) demonstrated that the distribution of SOC accumulation rates were not consistent across the various facies. A Dunn’s Test demonstrated a difference in stochastic dominance of SOC accumulation rate levels between pairs (Supplementary Table 2C). Two differences between SOC density and SOC accumulation rate were black marl accumulation rate differs from mangrove peat but does not differ with SOC density and mangrove peat SOC density differs from mangrove peat-marl but not with SOC accumulation rate. As these differences are minor only density was reported except for cases where rates were required for additional calculations.
Salinity index
Two distinct groups were identified based upon mollusk-determined SI. The first, with SI > 1.5 included the mangrove peat, mangrove peat-marl and marine mud facies and the second including the white, tan and black marls and the sawgrass peat-marl facies with SI values < 1.5 (Table 3 and Figure 3D). However, some white and tan marl sites experienced recent SWE and therefore report SI values > 1.5. Average SI values have little significance other than denoting whether a sample was deposited in fresh or marine influenced water but it is interesting to see the trend for the different facies: sawgrass peat-marl (1.38), black marl (1.27), white marl (1.38), tan marl (1.34), mangrove peat-marl (2.01), mangrove peat (2.46), and marine mud (2.34), although mollusks were rare. The contacts between non-marine and marine influenced facies in each transect were plotted in fence diagrams (Figure 4). This contact line delineates SWE and also separates facies boundaries in BBCBs (Figure 4A) but not in interior FBCBs, where cores do not exhibit facies change. HC, MC and TKY no longer have accommodation space and TRI and TA5 exhibit continuing SWE (Figure 4B). Transects TA4, TA3, and TA2) exhibit SWE reversals and TA2 exhibits a second episode of SWE to its earlier position, all in the last 20 years (Figure 4B).
Sediment organic carbon distribution
Sediment organic carbon vertical distribution
Sediment organic carbon density changed vertically in (21 of the 34 cores), all exhibiting salinity change (Table 5). SOC vertical distribution patterns were divided into three groups: those exhibiting no change in SOC, BBCBs exhibiting increasing SOC and FBCBs exhibiting little change. Of those exhibiting no change, four were BBCB cores composed entirely of marine influenced sediments (HC850, HC600, TDE, and TFE) and nine FBCB cores recorded no SWE, including all cores from TA6 and M5 transects (EVER1, TA4-1, TA4-2, TA5-2, TA6-5, TA6-4, M5-S, M5-I, and M5-N). Eight of the twelve BBCB cores experienced an increase in SOC between 19.55 and 399.6 % for an average increase of 227.7 % and increases in five cores were significant (Table 5). Thirteen of the 22 FBCB cores exhibited vertical changes in sediment salinity, seven exhibited decreases, five increases and one exhibited no change in SOC. The average change was 19.8 % and only one core exhibited an increase and one a decrease in SOC that were significant. The trend of SOC increasing with SWE is much stronger in BBCBs than in interior FBCBs. SOC density was significantly different across location (adjusted R-squared was 0.156 and p-value 2.372e-12) (Figure 5A) but not between the 0–4, 5–9 or combined sediment depth increments (Figure 5B). The mean SOC for the 0–4 cm sediment interval was 0.0476 and 0.0301 and for the 5–9 cm interval 0.0538 and 0.0310 for BBCB and FBCBs respectively (Figure 5B).
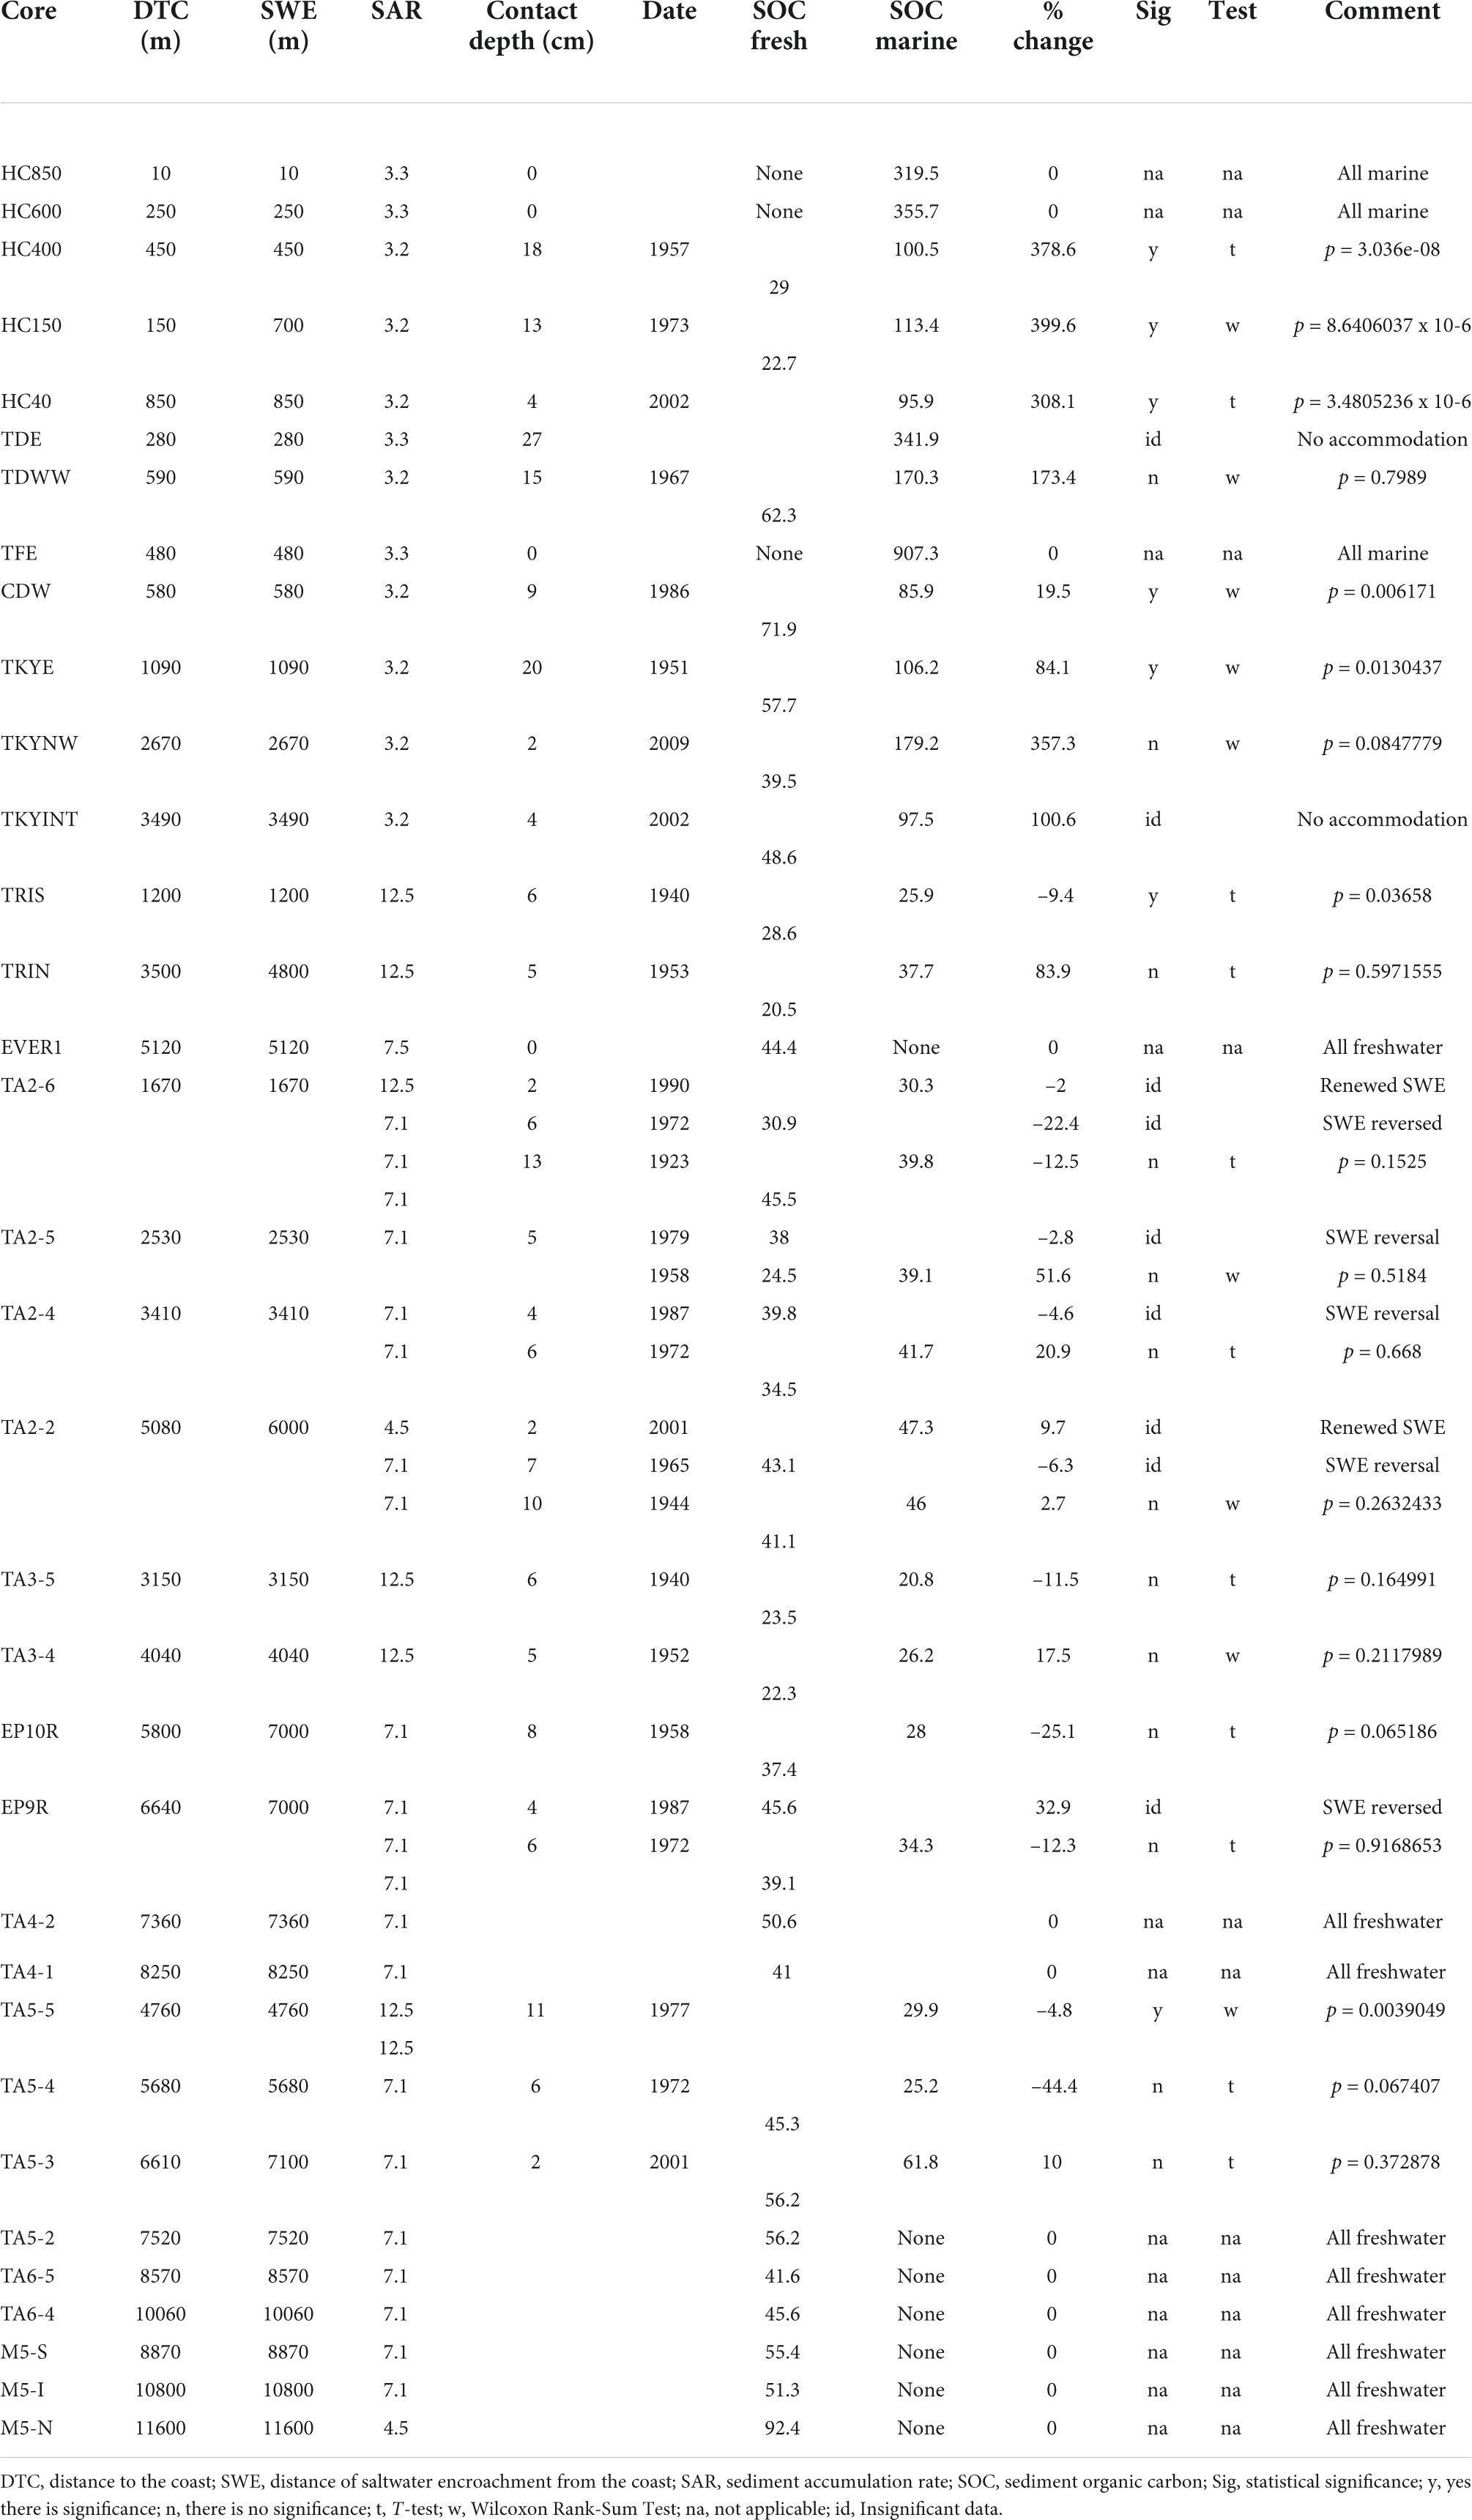
Table 5. Vertical changes in SOC.
Sediment organic carbon horizontal distribution
Increasing SOC density exhibits correlation with increasing DTC in both the 0–4 and 5–9 cm intervals in Florida Bay and exhibit little difference from one another (Figure 6A and Supplementary Table 3). In strong contrast, Biscayne Bay SOC decreased sharply with increased DTC in both the 0–4 and 5–9 cm intervals but the 5–9 cm interval intercept was greater than the 0–4 cm interval. Percent mangrove cover was determined for each core site (Supplementary Table 4). Decreasing percent mangrove cover weakly correlated with increasing DTC for the combined location data (Figure 6B). When data was separated by sediment interval and location, decreasing SOC density correlated with increasing percent mangrove cover in Florida Bay, with little difference in sediment interval (Figure 6C). Increasing SOC density correlated with increasing mangrove cover in both Biscayne Bay sediment intervals. However, the intercept and slope differed significantly between sediment intervals. The 5–9 cm interval had the higher intercept but a lower slope than the 0–4 cm interval.
Salt water encroachment
Salt water encroachment began between 1895 and 1938 in the coastal basins (Supplementary Table 5). SWE data from the Historic Creek transect and Turkey Point were previously calculated (Meeder et al., 2017; Meeder and Parkinson, 2018). The three northern Biscayne Bay transects exhibit the greatest coastal slope while recording an average SWE rate 26.2 m/yr, which generally increased over time until 1995 with loss of accommodation space because of the L31E levee. Fence diagrams illustrate SWE for each transect (Figure 4). M5 and TA6 were located between Shark River and Taylor Slough and did not experience SWE. TS, as of 1995, experienced the lowest rate of SWE (Meeder et al., 2017). SWE along the TRI transect reached inland 4,800 and 7,100 m along TA5 transect by 2015 and has continued along both transects. SWE also reached inland 7,100 m along TA4 prior to a reversal of 900 m back to 6,200 m starting in 2001. Likewise, SWE occurred very rapidly along TA3 transect reaching inland 6,700 m before a reversal back to 4,500 m beginning 1987, a retreat of 2,200 m. Transect TA2 had the most complex salinity record for the previous two decades as SWE reached 6,000 m, reversed to 2,000 and was followed by another episode of SWE that advanced to >7,000 m by 2015. SWE reached inland by 2015 an average of 6,340 m with increasing SWE distance inland from west to east (Figure 4). The three basins (TA2, TA3, and TA4) exhibited average reversals of 2,367 m, increasing to the east. No changes in FBCB facies were observed at > 2 km from the coast in FBCBs. The leading edge of SWE in FBCBs has moved inland ∼ 1.79 km in the last 2 decades.
Salt water encroachment began between 1895 and 1938 in FBCBs and the average extent of SWE by 1940 was 2,825 m, in 1968 was 3,550 m, in 1995 was 4,550 (Meeder et al., 1996, 2017) and in 2015 was 6,340 m. The extent of SWE after reversals in 2015 was 4,233 m very close to the average extent in 1995. The average rate of SWE in the different coastal basins change by time interval. The average of all coastal basins including those that did not experience SWE between 1895 and 1940 was 24.6 m/yr (Figure 7 and Table 6). The average rate of SWE for the period 1940–1968 was 43.0 m/yr and 51.5 m/yr for the period 1968–1995. The highest average rate was 78.7 m/yr for the period 1995–2015 if reversals are not included. The period 1995–2015 was subject to the highest rates of SWE and reversals of SWE and TA2 exhibited the most and fastest changes of all coastal basins.
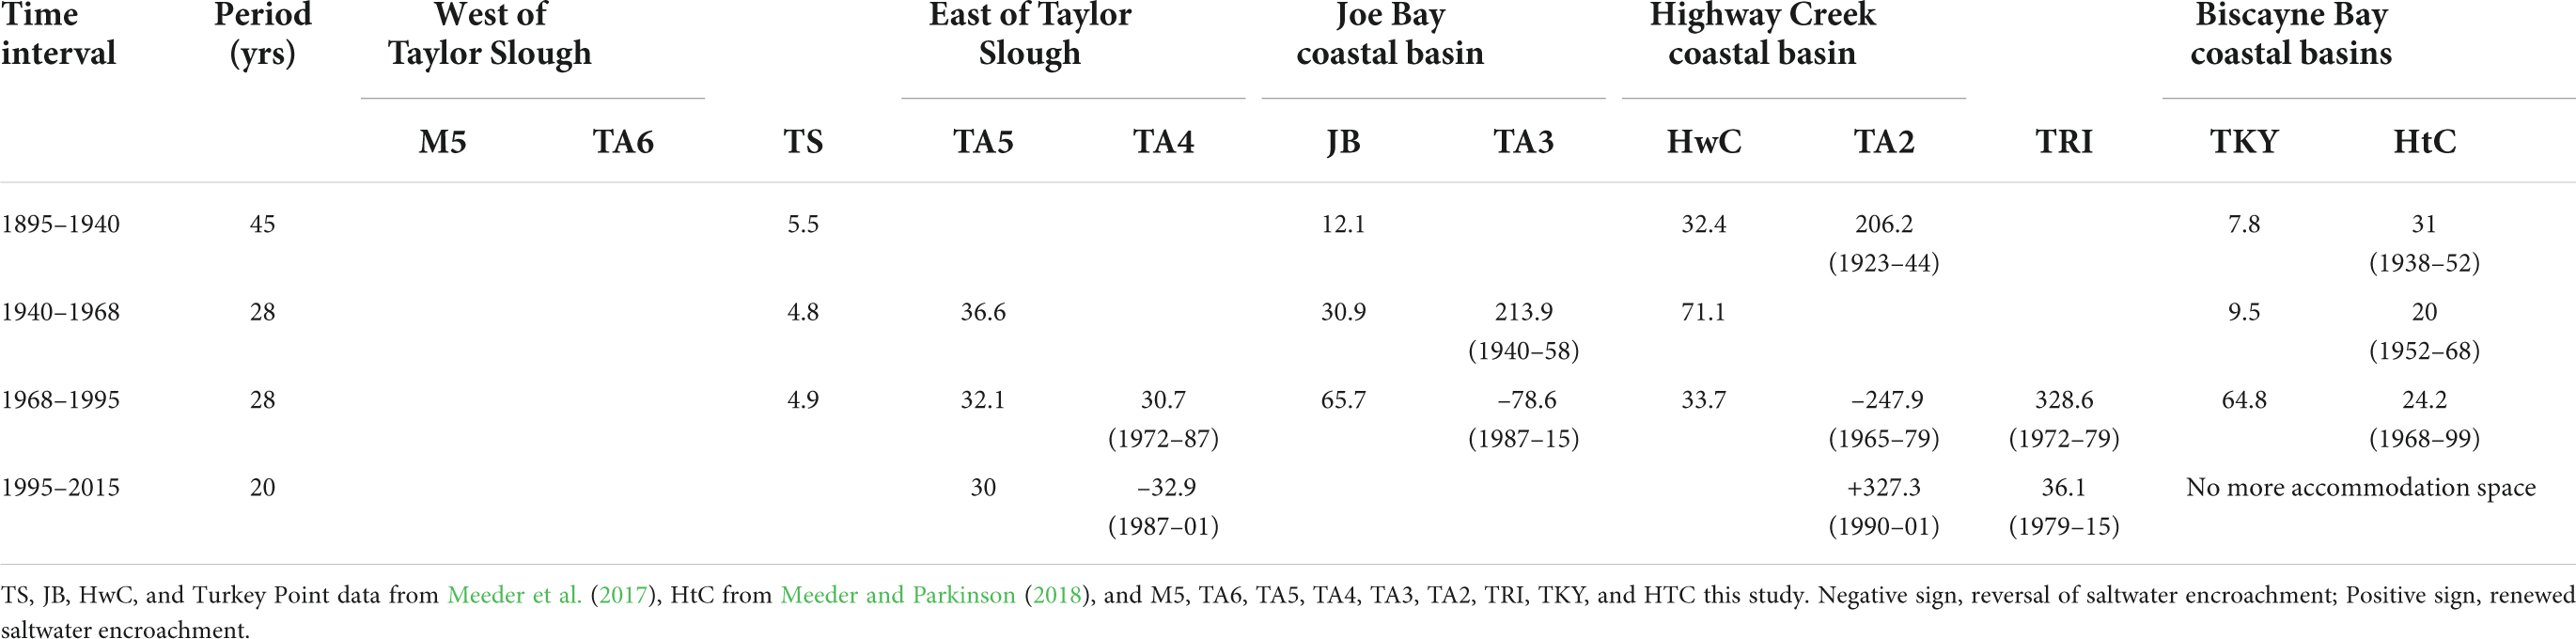
Table 6. Rates of SWE for different coastal basins during different time intervals.
Discussion
Plant communities, mollusks, and facies
In the SESE biogenic environment, preserved plant tissues, especially root remains, are diagnostic in recognition of the living plant community, and most importantly, the sediment type whether associated with the surface plant community or in the subsurface. The four facies of the SESE range from marl to peat and from very little organics to entirely organic, respectively.
Mollusks are as diagnostic as plant remains in the recognition of plant communities and their respective sediments. Paleontological data from fossil assemblages accumulating contemporaneously with living populations provide significant insights into changes in communities and ecosystems on the decadal scale (Kidwell, 2015). The mollusks found in cores are the same species presently found living on the surface with the exception of the introduced exotic gastropod, Melanoides tuberculata, therefore, there is strong fidelity in our use of mollusk assemblages (Valentine et al., 2006). M. tuberculata is found only at the surface and in the top few cm of a few coastal cores.
Mollusks indicate salinity information unique to each plant community, thus they are very useful for paleo-salinity analysis in core sequences. Mollusks are successfully utilized as a proxy for salinity in numerous studies in order to document changes in coastal waters (Brewster-Wingard et al., 2001; Wingard et al., 2003) and estuaries (Ishman et al., 1998; Wingard and Hudley, 2012; Martinez et al., 2013). Mollusk larvae are transported efficiently by tidal water further into the interior than mangrove propagules because propagules require a minimum of 4–8 cm water depth to float (Odum et al., 1982). Thus, mollusks are very good paleo-ecological “early warning” tools for coastal managers of the SWE because they are numerous, easy to identify, provide rapid results and are a very good surrogate for salinity. This is the first utilization of mollusks to determine the rates of SWE along a transect and along 10 transects to determine the heterogeneity of SWE in an entire wetland landscape providing important data for conservation and management decisions.
Bulk density varied among facies which is related to organic content, the higher the organic content the lower the bulk density. The lack of down core changes in bulk density suggests that compaction is not a problem in core interpretation. In addition, as SOC increases the SAR increases. Marls with the lowest SOC density demonstrate the lowest accumulation rates (0.8 mm/yr) and mangrove peats the highest (3.3 mm/yr) (Callaway et al., 1997; Smoak et al., 2013; Breithaupt et al., 2014). The SESE mangrove SAR is higher than the global average of 2.7 mm/yr (Alongi, 2012) but all SARs lag behind the 3.6 mm/yr global rate of SLR (Oppenheimer et al., 2019) and further behind the regional rate of 9.1 mm/yr (Wdowinski et al., 2016). This deficit establishes that submergence of the biogenic SESE will occur in the near future (Parkinson and Wdowinski, 2022).
Saltwater encroachment
Salt water encroachment reflects a balance between freshwater delivery and tidal water ingress driven by SLR. The high tide associated with the accelerating rate of SLR is the primary driver of SWE in the SESE, although changing water delivery is also a contributor (Meeder et al., 2017). Everglades drainage began in 1888 and continued to the 1960s (McVoy et al., 2011) but there’s no evidence of SWE in either BBCBs or FBCBs based upon the lack of inland mangrove expansion in 1938 aerial photographs. Mangrove expansion began with increased rate of SLR between 1900 and 1938 (Meeder and Parkinson, 2018). Managed freshwater delivery increases to Everglades National Park since ∼ 2000 (Musalem, 2016; Battelle Memorial Institute, 2020) and different tidal efficiencies explains the present heterogeneity in SWE among basins.
Recent mollusk assemblages indicate areas of increased saltwater delivery in coastal wetlands, along with the extent of delivery and delivery pathways, providing a record of biological indicators that may capture actual patterns of long-term salinity changes better than salinity measurements alone. For example, the level of maturity in fossil mollusk species indicates the stability of the salinity environment. Mature mollusks suggest a stable salinity environment in contrast to sediment intervals containing only juveniles which may have perished from freshwater intrusion and lack of suspended food for the filter feeding bivalve. Furthermore, the continuing presence of juveniles and lack of adults in a vertical sediment sequence indicate rapid repeated SWE episodes.
The rates of SWE along the ten transects were calculated utilizing molluscan derived SI, with two transects experiencing no SWE and the three Biscayne Bay coastal basins experiencing no further SWE because of the lack of accommodation space. The average rate of SWE for the remaining transects was ∼120 m/yr, greater than the 72 m/yr average rate between 1895 and 1995 (Meeder et al., 2017). SWE moved inland up to 6 km by 1995 and in the last 20 yrs moved inland an average of ∼ 1.79 km (Figure 7). This increase in the rate of SWE is in response to accelerating rate of SLR. No other estimates of the rate of SWE, driven by the accelerating rate of SLR during the last century, are known from other locations.
The rate of SWE increases in FBCBs from west to east, with the highest rates recorded at TA2, near the terminus of the C111 Canal. The SWE reversals are associated with recent experimental freshwater deliveries to Taylor Slough from the C111 Canal by Everglades and South Florida Water Management District hydrologists in attempts to stop or reverse SWE (Musalem, 2016). These water deliveries also increase to the east, with the exception of TA5 which recorded continuous SWE. The continuous SWE at TA5 documents that water delivered to coastal basins further to the east did not directly originate from Taylor Slough, which is the primary target of increased freshwater delivery, but the C111 canal which moves water eastward. A second episode of SWE in TA extended further inland than the first, demonstrating the rapidity of SWE at present sea-level and suggests that these coastal communities do have some resilience to short-term salinity changes. Maintenance of these reversals and further SWE reversal to 1895 levels is unlikely because of the lack of available water for delivery under conditions of accelerating rate of SLR, conditions that limit management options (Sweet et al., 2017). With increasing rate of SLR the rate of SWE is likely to increase.
Salt water encroachment creates salinity stress that: decreases sawgrass productivity (Servais et al., 2019), increases nutrients in this oligotrophic environment changing cyanobacteria composition to non-calcite producers (Browder et al., 1994), may decrease root productivity as plants shift energy utilization to above ground production, and forces a shift in the mollusk community from freshwater to marine. Numerous cations in marine waters alter the freshwater ecosystem: sulfur increases decomposition rate decreasing SOC storage (Sutter et al., 2014; Poulin et al., 2017; Chambers et al., 2019) and Mg and Sr poison calcite crystal growth (Bathurst, 1975). Presently, the threshold for detrimental cation and nutrient loading may not be reached, as most interior wetland salinities are < 2 ppt, however, effects are likely to be catastrophic with increased salinities.
Perhaps the most important process is mangrove infringement which also increases SOC. Mangrove infringement results in decreasing the area of marl production (the spike rush-cyanobacteria community) referred to as “the White Zone’ which is slowing moving landward while shrinking in area (Ross et al., 2002). Since 1938 mangrove expansion has occurred at the expense of the marl-producing environment (Meeder et al., 1996, 2017, 2021; Ross et al., 2000, 2002; Rivera-Monroy et al., 2011; Meeder and Parkinson, 2018). The extinction of the marl producing environment is observed in the northern two BBCB transects by mangrove infringement.
Sediment organic carbon
Spatial and temporal changes in SOC are related to SLR. During the Anthropocene Marine Transgression, SWE transported mangrove propagules landward and over time created a wedge-shaped marine influenced sediment body, decreasing in thickness landward, overlying freshwater sediment (Meeder and Parkinson, 2018). Most vertical and horizontal SOC change is a function of marine mangrove peat with their very high SOC density (0.072 g/cm3) and a SAR of 219.1 g/m2/yr replacing freshwater marl (0.033 g/cm3 and 44.1 g/m2/yr, respectively) in response to SWE, as reported at other sites (Krauss et al., 2011; Raabe et al., 2012; Saintilan et al., 2013; Armitage et al., 2015). South Florida mangrove values are higher than all known terrestrial ecosystems and ∼11 % greater than the mangrove global average (Chmura et al., 2003; Wang et al., 2020). This sequence of mangrove overlying other sediment types is also reported at other South Florida sites (Smoak et al., 2013; Breithaupt et al., 2020; Dontis et al., 2020; Vaughn et al., 2020; Steinmuller et al., 2021). Spatial changes track temporal changes as the area under SWE increases with SLR. Globally, since the beginning of the Anthropocene Marine Transgression, landward migrating mangroves are reported in most low-lying coastlines within their expanding range (Saintilan et al., 2013; Doughty et al., 2016). Mangrove expansion in response to SLR is replacing salt marshes (Gonneea et al., 2019; Watanabe et al., 2019; Dontis et al., 2020), coastal freshwater wetlands (Thom, 1967; Meeder et al., 2017) and colonizing recently created intertidal mudflats (Thom, 1967; Wells and Coleman, 1981; Swales et al., 2012; Chow, 2018).
Mangrove contribute to SOC within two decades as observed in changes from marl to mangrove peat marl in numerous cores (Figure 4B). However, the conversion of mangrove peat-marl to peat requires a much longer time as demonstrate by the thick mangrove peat-marl sequences. This trend of increasing SOC with time is also reported from South China (Chen et al., 2018). This fundamental process is an important one, because increasing SOC increases the SAR which decreases the deficit with SLR. Thus, SOC increases the longer a substrate is exposed to SWE, mangrove recruitment, increased growth and cover. This is supported by the decrease in mangrove cover with increased distance to the coast (Figure 6B) and that SOC increases with increasing mangrove cover (Figure 6C). These two relationships are well illustrated along the HC transect where the SOC density decreases from 0.077 in the mangrove peat facies to 0.030 g/cm3 in the interior mangrove peat-marl facies overlying the basal marl facies with 0.023 g/cm3 (Table 5). The depth interval of young mangrove root development is unclear in the literature. Therefore, depth intervals were compared and the 5–9 cm depth interval in Biscayne Bay cores exhibits a weak trend of higher SOC values than the 0–4 cm interval, likely because of longer period of mangrove deposition and the presence of cable roots in the lower interval. Mangrove SOC contribution in the 5–9 cm interval is lower than in the 0–4 cm sediment interval, when mangrove cover exceeded 60 % (Figure 5B). Cyanobacteria and marl production decrease with increased mangrove cover because of light competition, comprising a major step in peat formation and increasing SOC deposition.
Biscayne Bay coastal basins exhibit statistical increases in temporal and spatial SOC distribution but have expended horizontal accommodation space (Meeder et al., 2021). A general trend of decreasing SOC with increased distance from the coast in BBCBs is documented because of decreasing mangrove cover and SOC contribution (Figure 6A). In contrast, there is no correlation nor consistency between vertical SOC density and change in salinity in the combined FBCB core data set although individual cores exhibit vertical change (Table 5). However, FBCB transects exhibit a small but weakly significant increase in SOC with increased DTC (Figure 6A). This trend exists because interior wetlands have not experienced salinity stress, whereas salinity stress decreases freshwater plant (Wilson et al., 2018; Servais et al., 2019) and periphyton productivity (Mazzei et al., 2018) with increased time since SWE. Furthermore, there are several other reasons SWE produced changes in SOC deposition differ among BBCBs and FBCBs: (1) BBCB transects are within the area of mangrove infringement, whereas FBCBs transects were found further inland overlapping the freshwater-marine influenced sediment contact. (2) Tidal efficiency is greater in BBCBs because the offshore banks and coastal bays decrease tidal exchange in FBCBs resulting in decreased mangrove recruitment and therefore mangrove derived SOC. (3) Propagules are transported by storm or high tides which vary in location and extent, explaining the patchy mangrove distribution. (4) Mollusk larvae are transported further inland with SWE than mangrove propagules because propagules float vertically and contact substrate at depths between 4 and 8 cm (Odum et al., 1982), therefore the area of SWE is greater than the area of mangrove infringement. (5) Mangroves have not been present long enough to contribute to SOC in FBCB interiors.
The SESE is a very dynamic environment because the accelerating rate of SLR driving SWE is increasing the distribution of mangroves while decreasing the area of marl production, changing patterns of SOC deposition and increasing salinity stress in interior basin areas. These changes have occurred within the last century documenting the rapidity of SWE. Rapid SWE, reversal and second episode of SWE in ∼ 20 years demonstrates the sensitivity in wetland response to both SLR and changes in freshwater delivery. Future SOC deposition depends upon mangrove productivity and rate of establishment in this oligotrophic environment with increasing hydroperiod and water depth.
Summary
The paleo-ecological application of molluscan salinity tolerances to determine freshwater from marine influenced sediments in cores and along transects provided a stronger basis for tracking SWE than inland mangrove extent in this study. Stratigraphy recorded physical changes through time and space, calibrated by 210Pb radiometric dating. The rates of SWE varied among coastal basins and the average rate of SWE increased over time with the increasing rate of SLR. SOC increased along the coastal areas in BBCBs but exhibited little change in FBCB interiors. Mangrove infringement is responsible for increases in SOC and the decrease in marl forming environment, but according to mollusk data and constraints on mangrove seed transport (Odum et al., 1982), SWE can extend further inland than mangroves, thus SOC does not necessarily track SWE into the interior.
All facies SARs are deficit to the rate of SLR presently causing inundation ponding, beginning of submergence and marine sediment deposition. The 9.1 mm/yr regional rate of SLR is nearly twice the 5 mm/yr rate predicted to result in the loss of mangrove resilience (Sweet et al., 2017) and three times the highest observed SAR. The marine mud facies is encroaching upon coastal mangrove facies by deposition of suspended sediments during high tides at TKY, as observed in other south Florida locations (Risi et al., 1995; Castañeda-Moya et al., 2010; Smoak et al., 2013), and is likely to expand with continued coastal submergence. Interior areas will continue to receive propagules but further mangrove development is problematic because of the increasing hydroperiod and water depth. At the present rate of SWE the freshwater wetlands of the SESE will be lost within the next 70 years and replaced by submerging mangrove and intertidal followed by subtidal mudflats.
Management considerations
The paleo-ecological utilization of mollusks to determine historic salinities in cores and SWE along transects is a reproducible, fast, easy and an economic method for coastal land manager application. Mollusk assemblages documented SWE reversals, back to 1995 levels, from marine to freshwater, were very rapid and produced by experimental water releases after 2000 (Musalem, 2016). Such a reversal documents that increases in delivery can stop and reverse SWE. However, increasing freshwater delivery may not resolve the long-term problem of SWE for several reasons: (1) It is doubtful that the levels of water delivery during these experiments could be applied throughout the study area because of the limited water supply and delivery problems. (2) As sea-level rises, the drainage potential of delivered water decreases and delivered water stacks up along the coast, increasing hydroperiod and water depth in the interior, and stressing communities prior to SWE and submergence, (3) Increasing water depth extends hydroperiod that adversely affects sawgrass, eliminates marl production (Browder et al., 1994) and increases tidal efficiency. The significance of bottom friction and resistance to flow from emergent vegetation decreases with increasing water depth. (4) Increased freshwater delivery is unlikely to provide long-term solution because of the deficit between SLR and SAR rates (Parkinson and Wdowinski, 2022). (5) Every year freshwater levels have to be elevated 9.4 mm just to maintain elevation with SLR and diminish SWE but the entire SESE will still be exposed to increasing tidal influx which appears counter the CERC directive to “eliminating discharge of damaging flood waters” in the C111 Basin (Perry, 2004). (6) SWE will soon reach the more organic rich sawgrass communities initiating collapse (DeLaune et al., 1994) as observed in marshes west of the SESE (Chambers et al., 2015). Finally, (7) The second episode of SWE at TA2 documents the incredible rapid rate at which SWE occurs at this stage of SLR suggesting that the other FBCBs are likely to experience increased SWE very soon.
Predictably, SWE should reach the toe of the ACR between 2062 and 2070 based upon the 125 m/yr rate of SWE and if the rate of SLR increases as predicted, with no increases in freshwater delivery, SWE will reach the ACR sooner, terminating sawgrass and marl production and decreasing SOC deposition. The conversion from freshwater-saline wetlands to intertidal and subtidal mudflat is inevitable under present conditions of SLR. Submergence exposes the entire Late Holocene sediment package to erosion and export into adjacent marine ecosystems, as well as, the coral reef. This could be a major ecosystem stressor if not mitigated. Perhaps society needs to shift away from the paradigm of protecting what is going to be lost regardless of intervention and expense, in select cases, to directing the trajectory toward novel systems that provide important ecosystem services, before even such actions are too late.
Future work should include continuing hydrographic monitoring of surface water elevation and calculation of deliveries, establishment of permanent SWE monitoring stations with vegetation, sediment, nutrient, SOC water depth and salinity parameters monitored routinely. Experiments should be conducted to determine how increased water depth, hydroperiod, nutrients and salinity affect mangrove, spike rush and sawgrass communities. Understanding how increasing water depth and extended hydroperiod affects successful mangrove propagule settlement, growth and SOC contribution is necessary in order to determine if mangroves can increase cover and maintain ecosystem services until submergence.
Data availability statement
The original contributions presented in this study are included in the article/Supplementary material, further inquiries can be directed to the corresponding author.
Author contributions
JM was responsible for mollusk identification, paleosalinity analysis, field data analysis, and writing the manuscript. NA did the statistical analyses. SS did much of the field work, produced the vegetation field data including mangrove cover, and contributed to the writing of the manuscript. MR wrote the original proposal and funded the project. DK performed the eight recent 210Pb analysis. All authors contributed to the article and approved the submitted version.
Funding
This material is based upon work supported by the National Science Foundation under Grant No. HRD-1547798 and Grant No. HRD-2111661. These NSF Grants were awarded to Florida International University as part of the Centers of Research Excellence in Science and Technology (CREST) Program. This is contribution number 1486 from the Institute of Environment a Preeminent Program at Florida International University.” In addition, South Florida Water Management District grants: C-11679, C-12409, C-4244 and Task Agreement P15AC01625 of Master Cooperative Agreement H5000-10-5040, and Task Agreement Number: P16AC01727 of Cooperative Agreement P16AC00032 provided funding for segments of this project.
Acknowledgments
Jesus Blanco, Santiago Castaneda, Peter Harlem, Alex Martinez- Held, Carlos Pulido, Amy Renshaw, and Rosario Vidales are acknowledged for field and laboratory assistance. Thanks to Randall Parkinson for valuable discussions. Special thanks are extended to the reviewers for their contribution in improving this manuscript.
Conflict of interest
The authors declare that the research was conducted in the absence of any commercial or financial relationships that could be construed as a potential conflict of interest.
Publisher’s note
All claims expressed in this article are solely those of the authors and do not necessarily represent those of their affiliated organizations, or those of the publisher, the editors and the reviewers. Any product that may be evaluated in this article, or claim that may be made by its manufacturer, is not guaranteed or endorsed by the publisher.
Supplementary material
The Supplementary Material for this article can be found online at: https://www.frontiersin.org/articles/10.3389/fevo.2022.908557/full#supplementary-material
References
Alongi, D. M. (2012). Carbon sequestration in mangrove forests. Carbon Manag. 3, 313–322. doi: 10.4155/cmt.12.20
Appleby, P. G., and Oldfield, F. (1992). “Application of 210Pb to sedimentation studies,” in Uranium-series Disequilibrium: Applications to Earth, Marine & Environmental Sciences, eds M. Ivanovich and R. S. Harmon (Oxford: Oxford University Press), 731–778.
Armitage, A. R., Highfield, W. E., Brody, S. D., and Louchouarn, P. (2015). The Contribution of Mangrove Expansion to Salt Marsh Loss on the Texas Gulf Coast. PLoS One 10:e0125404. doi: 10.1371/journal.pone.0125404
Bathurst, R. G. (1975). Carbonate Sediments and Their Diagenesis. Amsterdam: Elsevier Science & Technology.
Battelle Memorial Institute (2020). Final Independent External Peer Review Report Modified Water Deliveries to Everglades National Park and Canal 111 South Dade Projects Combined Operational Plan. CONTRACT NO. W912HQ-15-D-0001 Task Order: W912HQ20F0037. Baltimore: for Department of the Army U.S. Army Corps of Engineers Baltimore District.
Blinn, D. W. (1993). Diatom Community Structure Along Physicochemical Gradients in Saline Lakes. Ecology 74, 1246–1263. doi: 10.2307/1940494
Blum, M., and Roberts, H. (2009). Drowning of the Mississippi Delta due to insufficient sediment supply and global sea-level rise. Nat. Geosci. 2, 488–491. doi: 10.1038/ngeo553
Breithaupt, J. L., Smith, T. J. III, and Sanders, C. J. (2014). Temporal variability of carbon and nutrient burial, sediment accretion, and mass accumulation over the past century in a carbonate platform mangrove forest of the Florida Everglades. JGR Biogeosci. 119, 2032–2048. doi: 10.1002/2014JG002715
Breithaupt, J. L., Smoak, J. M., Bianchi, T. S., Vaughn, D. R., Sanders, C. J., Radabaugh, K. R., et al. (2020). Increasing Rates of Carbon Burial in Southwest Florida Coastal Wetlands. J. Geophy. Res. Biogeosci. 125:e2019JG005349. doi: 10.1029/2019JG005349
Brewster-Wingard, G. L., Stone, J. R., and Holmes, C. W. (2001). Molluscan faunal distribution in Florida Bay, past and present: An integration of down-core and modern data. Bull. Am. Paleontol. 361, 199–231.
Browder, J. A., Gleason, D. R., and Swift, P. J. (1994). “Chapter 16. Periphyton in the Everglades: spatial variation, environmental correlates, and ecological implications,” in Everglades: The Ecosystem and its restoration, eds S. M. Davis and J. C. Ogden (Boca Raton, FL: St Lucie Press), 379–417.
Callaway, J. C., DeLaune, R. D., and Patrick, W. H. Jr. (1997). Sediment accretion rates from four coastal wetlands along the Gulf of Mexico. J. Coast. Res. 13, 181–191. doi: 10.1371/journal.pone.0205176
Castañeda-Moya, E., Twilley, R. R., Rivera-Monroy, V. H., Zhang, K., Davis, S. E.III, and Ross, M. (2010). Sediment and Nutrient Deposition Associated with Hurricane Wilma in Mangroves of the Florida Coastal Everglades. Estuaries Coasts 33, 45–58. doi: 10.1007/s12237-009-9242-0
Chambers, L. G., Davis, S. E., and Troxler, T. G. (2015). “Sea level rise in the Everglades: plant soil-microbial feedbacks in response 2 to changing physical conditions,” in Microbiology of the 3 Everglades Ecosystem, eds J. A. Entry, A. D. Gottlieb, K. Jayachandrahan, and A. Ogram (Boca Raton: CRC Press).
Chambers, L. G., Steinmuller, H. E., and Breithaupt, J. L. (2019). Toward a mechanistic understanding of “peat collapse” and its potential contribution to coastal wetland loss. Ecology 100:e02720. doi: 10.1002/ecy.2720
Charles, S. P., Kominoski, J. S., Troxler, T. G., Gaiser, E. E., Servais, S., Wilson, B. J., et al. (2019). Experimental saltwater intrusion drives rapid soil elevation and carbon loss in freshwater and brackish Everglades marshes. Estuaries Coasts 42, 1868–1881. doi: 10.1007/s12237-019-00620-3
Chen, G., Gao, M., Pang, B., Chen, S., and Ye, Y. (2018). Top-meter soil organic carbon stocks and sources in restored mangrove forests of different ages. For. Ecol. Manag. 422, 87–94. doi: 10.1016/j.foreco.2018.03.044
Chmura, G. L., Anisfeld, S. C., Cahoon, D. R., and Lynch, J. C. (2003). Global carbon sequestration in tidal, saline wetland soils. Glob. Biogeochem. Cycles 17:1111. doi: 10.1029/2002GB001917
Chow, J. (2018). Mangrove management for climate change adaptation and sustainable development in coastal zones. J. Sustain. For. 37, 139–156. doi: 10.1080/10549811.2017.1339615
Cottrell, D. J. (1989). Holocene evolution of the coast and nearshore islands, northeast Florida Bay, Florida, Ph.D. thesis, Miami: University of Miami.
Dean, W. E. (1974). Determination of carbonate and organic matter in calcareous sediments and sedimentary rocks by loss on ignition; comparison with other methods. J. Sed. Res. 44, 242–248. doi: 10.1306/74D729D2-2B21-11D7-8648000102C1865D
DeLaune, R. D., Nyman, J. A., and Patrick, W. H. Jr. (1994). Peat collapse, ponding and wetland loss in a rapidly submerging coastal marsh. J. Coast. Res. 10, 1021–1030.
Donoghue, J. F. (2011). Sea level history of the northern Gulf of Mexico coast and sea level rise scenarios for the near future. Clim. Change 107, 17–33. doi: 10.1007/s10584011-0077-x
Dontis, E. E., Radabaugh, K. R., Chappel, A. R., Russo, C. E., and Moyer, R. P. (2020). Carbon Storage Increases with Site Age as Created Salt Marshes Transition to Mangrove Forests in Tampa Bay. Estuaries Coasts 43, 1470–1488. doi: 10.1007/s12237-02000733-0
Doughty, C. L., Langley, J. A., Walker, W. S., Feller, I. C., Schaub, R., Chapman, S. K., et al. (2016). Mangrove Range Expansion Rapidly Increases Coastal Wetland Carbon Storage. Estuaries Coasts 39, 385–396. doi: 10.1007/s12237-015-9993-8
Ellison, J. C. (1993). Mangrove Retreat with Rising Sea-level, Bermuda. Estuar. Coast. Shelf Sci. 37, 75–87. doi: 10.1006/ecss.1993.1042
Ellison, J. C., and Stoddart, D. R. (1991). Mangrove Ecosystem Collapse during Predicted Sea-Level Rise: Holocene Analogues and Implications. J. Coast. Res. 7, 151–165.
Fox-Kemper, B., Hewitt, H., Xiao, G., Aoalgeirsdottir, G., Drijfhout, S., Edwards, L., et al. (2021). “Chapter 9: Ocean, cryosphere and sea level change,” in Climate change 2021: The physical science basis. Contribution of working group 1 to the sixth assessment report of the intergovernmental panel on climate change. doi: 10.5285/77B64C55-7166-4A06-9DEF-2E400398E452
Gonneea, M. E., Maio, C. V., Kroeger, K. D., Hawkes, A. D., Mora, J., Sullivan, R., et al. (2019). Salt marsh ecosystem restructuring enhances elevation resilience and carbon storage during accelerating relative sea-level rise. Estuaries Coasts Shelf Sci. 217, 56–68. doi: 10.1016/j.ecss.2018.11.003
Hoffmeister, J. E. K., Stockman, W., and Multer, H. G. (1967). Miami Limestone of Florida and its Recent Bahamian counterpart. Geol. Soc. Am. Bull. 78, 175–190. doi: 10.1130/0016-7606196778[175:MLOFAI]2.0.CO;2
Ishman, S. E., Cronin, T. M., Brewster-Wingard, G. L., Willard, D. A., and Verardo, D. J. (1998). A record of ecosystem change, Manatee Bay, Barnes Sound, Florida. J. Coast. Res. 26, 125–138.
Kidwell, S. M. (2015). Biology in the Anthropocene: Challenges and insights from young fossil records. PNAS 112, 4922–4929. doi: 10.1073/pnas.1403660112
Klaus, J. S., Meeder, J. F., McNeill, D. F., Woodhead, J. F., and Swart, P. K. (2017). Expanded Florida reef development during the mid-Pliocene warm period. Glob. Planet. Change 152, 27–37. doi: 10.1016/j.gloplacha.2017.02.001
Kominoski, J., Neubauer, S., Bremen, R., Camacho, A., Camacho-Santamans, A., Charles, S., et al. (2021). Salinity reduces coastal marsh respiration more than photosynthesis. Res. Sq. [Preprint] doi: 10.21203/rs.3.rs-880205/v1
Kopp, R. E., Horton, B. P., Kemp, A. C., and Tebaldi, C. (2015). Past and future sea-level rise along the coast of North Carolina, USA. Clim. Change 132, 693–707. doi: 10.1007/s10584-015-1451-x
Krauss, K. W., From, A. S., Doyle, T. W., Doyle, T. J., and Barry, M. J. (2011). Sea-level rise and landscape change influence mangrove encroachment onto marsh in the Ten Thousand Islands region of Florida. USA. J. Coast. Cons. 15, 629–638. doi: 10.1007/s11852-011-0153-4
Lamont, K., Saintilan, N., Kelleway, J. J., Mazumder, D., and Zawadzki, A. (2020). Thirty-Year Repeat Measures of Mangrove Above- and Below-Ground Biomass Reveals Unexpectedly High Carbon Sequestration. Ecosystems 23, 370–382. doi: 10.1007/s10021-019-00408-3
Levermann, A., Clark, P. U., Marzeion, B., Milne, G., Pollard, D., Radic, V., et al. (2013). The multimillennial sea-level commitment of global warming. Proc. Natl. Acad. Sci. U.S.A. 110, 13745–13750. doi: 10.1073/pnas.1219414110
Lorenz, J. J. (2014). A Review of the Effects of Altered Hydrology and Salinity on Vertebrate Fauna and Their Habitats in Northeastern Florida Bay. Wetlands 34, 189–200. doi: 10.1007/s13157-013-0377-1
Martinez, S., Mahiques, M. M., and Burone, L. (2013). Mollusks as indicators of historical changes in estuarine-lagoonal system (Cananeia-Iquape, SE Brazil). Holocene 23, 888–897. doi: 10.1177/0959683612470175
Mazzei, V., Gaiser, E. E., Kominoski, J. S., Wilson, B. J., Servais, S., Bauman, L., et al. (2018). Functional and compositional responses of periphyton mats to simulated Saltwater intrusion in the Southern Everglades. Estuaries Coasts 41, 2105–2119. doi: 10.1007/s12237-018-0415-6
McVoy, C., Said, W. P., Obeysekera, J., VanArman, J. A., and Dreschel, T. W. (2011). Landscapes and hydrology of the predrainage everglades. Gainesville, FL: University Press of Florida.
Meeder, J. F., and Harlem, P. W. (2019). Origin and development of true karst valleys in Response to late Holocene sea-level change, the Transverse Glades of southeast Florida, USA. Spec. Issue 5, 558–577. doi: 10.1002/dep2.84
Meeder, J. F., and Parkinson, R. W. (2018). SE Saline Everglades Transgressive Sedimentation in Response to Historic Acceleration in Sea-Level Rise: A Viable Marker for the Base of the Anthropocene? J. Coast. Res. 34, 490–497. doi: 10.2112/JCOASTRES-D-17-00031.1
Meeder, J. F., Klaus, J. S., and Grasmueck, M. (2019). Ramp reef depositional facies model for the mid-Pliocene Golden Gates reef member of the Tamiami Formation, south Florida. Facies 65:40.
Meeder, J. F., Parkinson, R. W., Kominoski, J., Ross, M. S., and Castaneda, S. (2021). Anthropocene Marine Transgression and Changing Organic Carbon Storage, Southeast Saline Everglades, Florida, USA. Wetlands 41:41. doi: 10.1007/s13157-021-01440-7
Meeder, J. F., Parkinson, R. W., Ruiz, P. L., and Ross, M. S. (2017). Saltwater encroachment and prediction of future ecosystem response to the response to the Anthropocene Marine transgression, Southeast Saline Everglades, Florida. Hydrobiologia 803, 29–48. doi: 10.1007/s10750-017-3359-0
Meeder, J. F., Ross, M. S., Telesnicki, G. T., Ruiz, P. L., and Sah, J. P. (1996). Vegetation analysis in the C-111-Taylor Slough Basin. Document 1. The Southeast Saline Everglades revisited a half-century of coastal vegetation change, 56p. Document 2. Marine transgression in the Southeast Saline Everglades, Florida; rates, causes and plant-sediment responses. 95p. Final report. To: Dr. Rich Alleman. West Palm Beach: SFWMD.
Morris, J. T., Sundareshwar, P., Nietch, C. T., Kjerfve, B., and Cahoon, D. (2002). Responses of coastal wetlands to rising sea level. Ecology 83, 2869–2877.
Mumby, P., Edwards, A., Aria-Gonzalez, J. E., Lindeman, K. C., Blackwell, P. G., Gail, A., et al. (2004). Mangroves enhance the biomass of coral reef fish communities in the Caribbean. Nature 427, 533–536.
Musalem, R. (2016). A Brief History of Water Control Operations in South Dade 02 02 2016 Workshop. West Palm Beach: South Florida Water Management District.
Neubauer, S. C., Franklin, R. B., and Berrier, D. J. (2013). Saltwater intrusion into tidal freshwater marshes alters the biogeochemical processing of organic carbon. Biogeosciences 10, 8171–8183. doi: 10.1111/gcb.14486
Odum, W. E., McIvor, C. C., and Smith, T. J. I. I. I. (1982). The ecology of the mangroves of South Florida: A community profile FWS/OBS-81/24, 144 pages. Washington D.C: U.S. Fish and Wildlife Service.
Oppenheimer, M., Glavovic, B., Hinkel, J., van de Wal, R., Magnan, A. K., Abd-Elgawad, A., et al. (2019). Sea Level Rise and Implications for Low-Lying Islands, Coasts and Communities. The Intergovernmental Panel on Climate Change, Special Report on the Ocean and Cryosphere in a Changing Climate. Geneva: IPCC.
Parkinson, R., and Wdowinski, S. (2022). Accelerating sea level rise and the fate of south florida coastal wetlands. Geomorphology 412:108329. doi: 10.1016/j.geomorph.2022.108329
Parkinson, R. W., Harlem, P. W., and Meeder, J. F. (2015). Managing the Anthropocene Marine Transgression to 2100 and beyond in the State of Florida, USA. Clim. Change 128, 83–98.
Perry, W. (2004). Elements of South Florida’s Comprehensive Everglades Restoration Plan. Ecotoxicology 13, 185–193. doi: 10.1023/B:ECTX.0000023564.10311.4a
Poulin, B. A., Ryan, J. N., Nagy, K. L., Stubbins, A., Dittmar, T., Orem, W., et al. (2017). Spatial Dependence of Reduced Sulfur in Everglades Dissolved Organic Matter Controlled by Sulfate Enrichment. Environ. Sci. Tech. 51, 3630–3639. doi: 10.1021/acs.est.6b04142
Raabe, E. A., Roy, L. C., and McIvor, C. C. (2012). Tampa Bay coastal wetlands: Nineteenth to twentieth century tidal marsh-to-mangrove conversion. Estuaries Coasts 35, 1145–1162. doi: 10.1007/s12237-012-9503-1
Risi, J., Wanless, H., Tedesco, L., and Gelsanliter, S. (1995). Catastrophic Sedimentation from Hurricane Andrew along the Southwest Florida Coast. J. Coast. Res. 1995, 83–102.
Rivera-Monroy, V. H., Twilley, R. R., Davis, S. E. III, Childers, D. L., Simard, M., Chambers, R., et al. (2011). The Role of the Everglades Mangrove Ecotone Region (EMER) in Regulating Nutrient Cycling and Wetland Productivity in South Florida. Crit. Rev. Environ. Sci. Technol. 41, 633–669. doi: 10.1080/10643389.2010.530907
Ross, M. S., Gaiser, E. E., Meeder, J. F., and Lewin, M. T. (2002). “Multi-taxon analysis of the “white zone”, a common ecotonal feature of South Florida coastal wetlands,” in The Everglades, Florida Bay, and Coral Reefs of the Florida Keys, eds J. Porter and K. Porter (Boca Raton, FL: CRC Press), 205–238.
Ross, M. S., Meeder, J. F., Sah, J. P., Ruiz, P. L., and Telesnicki, G. J. (2000). The southeast saline Everglades revisited: 50 years of coastal vegetation change. J. Veg. Sci. 11, 101–112.
Ross, M., Stoffella, S., Meeder, J., Scinto, L., Vidales, R., Biswas, H., et al. (2020). Recent ecosystem dynamics in the coastal Everglades transition zone. Task Agreement # P15AC01625. Cooperative Agreement # H5000-10-5040/South Florida Natural Resources Center. West Palm Beach: Contract South Florida Water Management District.
Saintilan, N., Wilson, N. C., Rogers, K., Rajkaran, A., and Krauss, K. W. (2013). Mangrove expansion and salt marsh decline at mangrove poleward limits. Glob. Change Biol. 20, 147–157. doi: 10.1111/gcb.12341
Servais, S., Kominoski, J. S., Charles, S. P., Gaiser, E. E., Mazzei, V., Troxler, T. G., et al. (2019). Saltwater intrusion and soil carbon loss: Testing effects of salinity and phosphorous loading on microbial functions in experimental freshwater wetlands. Geoderma 337, 1291–1300. doi: 10.1016/j.geoderma.2018.11.013
Sikora, L. J., and Stott, D. E. (1996). “Soil Organic Carbon and Nitrogen,” in Methods for assessing soil quality, eds J. W. Doran and A. J. Jones (Madison, WI: Soil Science Society of America), 157–167. doi: 10.2136/sssaspecpub49.c9
Sklar, F. H., Meeder, J. F., Troxler, T. G., Dreschel, T., Davis, S. E., and Ruiz, P. L. (2019). “Chapter 16 - The Everglades: At the Forefront of Transition,” in Coasts and Estuaries, eds E. Wolanski, J. W. Day, M. Elliott, and R. Ramachandran (Amsterdam: Elsevier), 277–292. doi: 10.1016/B978-0-12-8140003-1.00016-2
Smoak, J. M., Breithaupt, J. L., Smith, T. J., and Sanders, C. J. (2013). Sediment accretion and organic carbon burial relative to sea-level rise and storm events in two mangrove forests in Everglades National Park. Catena 104, 58–66. doi: 10.1016/j.catena.2012.10.009
Spalding, M. D., Kainuma, M., and Collins, L. (2010). World Atlas of mangroves. London: Earthscan, doi: 10.4324/9781849776608
Spencer, T., Schuerch, M., Nicholls, R. J., Hinkel, J., Lincke, D., Vafeidis, A. T., et al. (2016). Global coastal wetland change under sea-level rise and related stresses: The DIVA Wetland Change Model. Glob. Planet Change 139, 15–30. doi: 10.1016/j.gloplacha.2015.12.018
Steinmuller, H. E., Stoffella, S. L., Vidales, R., Ross, M. S., Dattamudi, S., and Scinto, L. J. (2021). Characterizing hydrologic effects on soil physicochemical variation within tree islands and marshes in the coastal Florida Everglades. Soil Sci. Soc. Am. J. 85, 1269–1280. doi: 10.1002/saj2.20270
Sutter, L. A., Perry, J. E., and Chambers, R. M. (2014). Tidal Freshwater Marsh Plant Responses to low level salinity increases. Wetlands 34, 167–175. doi: 10.1007/s13157-013-0494x
Swales, A., Bentley, S. J., Lovelock, C., and Bell, R. G. (2012). “Sediment Processes and Mangrove-Habitat Expansion on a Rapidly-Prograding Muddy Coast, New Zealand,” in Sixth International Symposium on Coastal Engineering and Science of Coastal Sediment Process, (New Orleans), doi: 10.1061/40926(239)111
Sweet, W., Kopp, R., Weaver, C., Obeysekera, J., Horton, R. M., Thieler, E. R., et al. (2017). Global And Regional Sea Level Rise Scenarios For The United States, Technical Report NOS CO-OPS 083, Washington, DC: National Oceanic and Atmospheric Administration doi: 10.7289/v5/tr-nos-coops-083
Thom, B. (1967). Mangrove Ecology and Deltaic Geomorphology: Tabasco, Mexico. J. Ecol. 55, 301–343. doi: 10.2307/2257879
Valentine, J. W., Jablonski, D., Kidwell, S., and Roy, K. (2006). Assessing the fidelity of the fossil record by using marine bivalves. PNAS 103, 6599–6604. doi: 10.1073/pnas.0601264103
Vaughn, D. R., Bianchi, T. S., Shields, M. R., Kenney, W. F., and Osborne, T. Z. (2020). Increased Organic Carbon Burial in Northern Florida Mangrove-Salt Marsh Transition Zones. Glob. Biogeochem. Cycles 34:e2019GB006334. doi: 10.1029/2019GB006334
Wang, F., Sanders, C. J., Santos, I. R., Tang, J., Schurech, M., Kirwan, M. L., et al. (2020). Global blue carbon accumulation in tidal wetlands increases with climate change. Nat. Sci. Rev. 8:nwaa296. doi: 10.1093/nsr/nwaa296
Wanless, H. R., Parkinson, R. W., and Tedesco, L. P. (1994). “Sea level control on stability of Everglade’s wetlands,” in Everglades: the Ecosystem and Its Restoration, eds S. M. Davis and J. C. Ogden (Delray Beach, FL: St. Lucie Press), 199–224.
Watanabe, K., Koji, S., Rumiko, K., Shigeru, M., and Tomohiro, K. (2019). Relative sea-level change regulates organic carbon accumulation in coastal habitats. Glob. Change Biol. 25, 1063–1077. doi: 10.1111/gcb.14558
Wdowinski, S., Bray, R., Kirtman, B. P., and Wu, Z. (2016). Increasing flooding hazard in coastal communities due to rising sea level: Case study of Miami Beach, Florida. Ocean Coast. Manage. 126, 1–8. doi: 10.1016/j.ocecoaman.2016.03.002
Wells, J. T., and Coleman, J. M. (1981). Periodic mudflat progradation, northeastern coast of South America; a hypothesis. J. Sed. Res. 51, 1069–1075. doi: 10.2110/jsr.51.1069
Wilson, B. J., Servais, S., Charles, S. P., Davis, S. E., Gaiser, E. E., Kominoski, J. S., et al. (2018). Declines in plant productivity drive carbon loss from brackish coastal wetland mesocosms exposed to saltwater intrusion. Estuaries Coasts 41, 2147–2158. doi: 10.1007/s12237-018-0438-z
Wingard, G. L., and Hudley, J. W. (2012). Application of a weighted-averaging method for determining paleosalinity: A tool for restoration of south Florida’s esturaies. Estuar. Coasts 35, 262–280. doi: 10.1007/s12237-011-9441-3
Keywords: mangrove, mollusks, paleoecology, sea-level rise, SE Florida, blue-carbon, freshwater carbonate mud
Citation: Meeder JF, Adelgren N, Stoffella SL, Ross MS and Kadko DC (2022) The paleo-ecological application of mollusks in the calculation of saltwater encroachment and resultant changes in depositional patterns driven by the Anthropocene Marine Transgression. Front. Ecol. Evol. 10:908557. doi: 10.3389/fevo.2022.908557
Received: 30 March 2022; Accepted: 26 August 2022;
Published: 28 September 2022.
Edited by:
Chris Schneider, University of Alberta, CanadaReviewed by:
Karen Thorne, Western Ecological Research Center, United States Geological Survey (USGS), United StatesTroy Hill, National Park Service, United States
Copyright © 2022 Meeder, Adelgren, Stoffella, Ross and Kadko. This is an open-access article distributed under the terms of the Creative Commons Attribution License (CC BY). The use, distribution or reproduction in other forums is permitted, provided the original author(s) and the copyright owner(s) are credited and that the original publication in this journal is cited, in accordance with accepted academic practice. No use, distribution or reproduction is permitted which does not comply with these terms.
*Correspondence: John F. Meeder, amFja21lZWRlckBnbWFpbC5jb20=