 Xuyang Wang
 Yuqiang Li
 Meng Yan4
 Xiangwen Gong
- 1Northwest Institute of Eco-Environment and Resources, Chinese Academy of Sciences, Lanzhou, China
- 2College of Resources and Environment, University of Chinese Academy of Sciences, Beijing, China
- 3Naiman Desertification Research Station, Northwest Institute of Eco-Environment and Resources, Chinese Academy of Sciences, Tongliao, China
- 4College of Agriculture, Inner Mongolia University for Nationalities, Tongliao, China
Extreme climate events have a greater impact on natural and human systems than average climate. The spatial and temporal variation of 16 temperature and nine precipitation extremal indices was investigated using the daily maximum and minimum surface air temperature and precipitation records from 113 meteorological stations in China’s arid regions from 1960 to 2016. The warmth indices [warm spell duration (WSDI); numbers of warm nights, warm days, tropical nights (TR), and summer days (SU)] increased significantly. On the contrary, the cold indices [numbers of frost days (FD), ice days (ID), cool days, and cool nights; cold spell duration (CSDI)] decreased significantly. The number of FD decreased fastest (−3.61 days/decade), whereas the growing season length (GSL) increased fastest (3.17 days/decade). The trend was strongest for diurnal temperature range (DTR) (trend rate = −7.29, P < 0.001) and minimum night temperature (trend rate = 7.70, P < 0.001). The cold extreme temperature events increased with increasing latitude, but the warm extreme temperature events decreased. Compared with temperature indices, the precipitation indices exhibited much weaker changes and less spatial continuity. Overall, changes in precipitation extremes present wet trends, although most of the changes are insignificant. The regionally averaged total annual precipitation for wet days increased by 4.78 mm per decade, and extreme precipitation events have become more intense and frequent during the study period. The spatial variability of extreme precipitation in the region was primarily influenced by longitude. Furthermore, the climate experienced a warm-wet abrupt climate change during 1990s.
Introduction
Climate change can be identified through statistically significant changes in the mean or variability of long-term climate properties (IPCC, 2012). Climate change is inevitably resulting in changes in climate variability and in the intensity, frequency, duration, timing, and spatial extent of extreme climate events (Seneviratne et al., 2012). Changes in the frequency or intensity of extreme climate events will have a greater impact on natural and human systems than changes in average climate because extreme events are more sensitive to climate change than average climate (Easterling et al., 1997, 2000a,b; Patz et al., 2005; McMichael et al., 2006; Thornton et al., 2014). Therefore, it is more urgent to understand extreme climate events than to track changes in the average climate during global warming.
An extreme event is generally defined as the occurrence of a value of a weather or climate variable that is greater than (or less than) a threshold value near the upper (or lower) ends (“tails”) of the variable’s range of observed values. Changes in extreme climate events can be quantified by the extreme climate indices, which have been widely used in extreme climate research. On a global scale, for most land areas with sufficient data, the number of warm days and nights appears to have an overall increasing trend, but the number of cold days and nights have an opposite trend (Frich et al., 2002). Kiktev et al. (2003) confirmed these findings using more robust statistical methods, providing strong evidence that human-induced forcing has recently played a significant role in climate extremes. Subsequently, the global work on temperature and precipitation extremes was updated by Alexander et al. (2006). They showed that more than 70% of the global land area in their sample showed a significant increase in the annual occurrence of warm nights and a significant decrease in the annual occurrence of cold nights. Extreme precipitation changes exhibited a widespread and significant increase, but they were far less spatially coherent than temperature changes. Globally, changes in extreme precipitation did not show a clear distinction between paired urban and non-urban sites, while extreme temperature changes were different between paired urban and non-urban sites (Mishra et al., 2015).
At a regional level, studies of extreme climate indices have been conducted in many regions of the world, including Central and South America (Aguilar et al., 2005; Haylock et al., 2006; Skansi et al., 2013), the Asia-Pacific region (Griffiths et al., 2005), Europe (Klein Tank and Können, 2003; Moberg et al., 2006; Bocheva et al., 2009; Lupikasza, 2009; Siliverstovs et al., 2010), Africa (New et al., 2006; Dike et al., 2020), the Democratic Republic of Georgia (Keggenhoff et al., 2014), the Arabian Peninsula (Alsarmi and Washington, 2014), and Central and South Asia (Klein Tank et al., 2006). These results provide strong evidence that global warming is the key factor causing significant changes in temperature and precipitation extremes, and the changes showed large regional variability since the magnitude and characteristics of climate change will vary within any geographically diverse region. For example, extreme precipitation indices, such as the intensity and frequency of extreme precipitation events or the numbers of days with extreme precipitation and heavy precipitation events, have increased significantly in recent decades in the United States (Karl et al., 1995, 1996; Griffiths and Bradley, 2007; Pryor et al., 2009), central India (Goswami et al., 2006), Japan (Iwashima and Yamamoto, 1993), southern Africa (Mason et al., 1999), southern Brazil (Liebmann et al., 2004), and Bulgaria (Bocheva et al., 2009). However, extreme precipitation events have decreased in Germany (Tromel and Schonwiese, 2007) and Poland (Lupikasza, 2009), and the 95th percentile of annual daily rainfall decreased significantly on the Iberian Peninsula (Rodrigo, 2009). It is thus clear that regional differences have been observed for temperature and precipitation extremes, and this suggests an urgent need to enhance monitoring of extreme climate events from a regional perspective.
In China, there have been many regional analyses of climate extremes. Generally, there appears to have been an overall increase in the numbers of warm days, warm nights, and summer days (SU), and an overall decrease in the numbers of frost days (FD), cold days, and cold nights, but the magnitude of the changes varies across China (Li Z.X. et al., 2011; Zhen and Li, 2014; Guan et al., 2015; Zhong et al., 2017; Wang et al., 2020). Simultaneously, the trends in precipitation extremes presented regional differences in space and time. For example, extreme precipitation events have increased in northern, southwestern, and southern China while decreasing in northeastern, northwestern, and central China (Lu et al., 2014; Li et al., 2015; Sun et al., 2016), indicating that there were regional differences in the changes for all these metrics. Unfortunately, according to the Intergovernmental Panel on Climate Change Assessment Report (Houghton et al., 2001), China is a data-scarce region, making it difficult to describe global precipitation trends from 1976 to 1999. As a result, it is becoming increasingly important to provide more regional analysis for climate extremes and cover a longer period.
The arid regions are extremely sensitive to climate change due to its fragile ecosystems, thus their responses to climate change have become an indicator of global warming. Therefore, researchers are paying increasing attention to the characteristics of temperature and precipitation changes in arid regions (Tabari and Talaee, 2011; Li et al., 2013; Xu L.G. et al., 2015; Wang Y. et al., 2018; Zhu et al., 2018; Luo et al., 2020).
To provide some of the missing knowledge on climate extremes in arid areas, we developed the present study to (a) explore trends in the extreme indices of daily temperature and precipitation in China’s arid regions, and (b) investigate the spatial variation in these extremes, thereby providing important background information to support research on climate extremes in the world’s arid regions.
Data and methods
Study area
China’s arid regions are mainly distributed in the northwest, including parts of Inner Mongolia, Ningxia, Gansu, Qinghai, Tibet, and Xinjiang provinces. This study area covers around 3.09 km2 × 106 km2, extending from 30.0°N to 47.5°N, and from 73.5°E to 117.5°E (Figure 1). Elevation ranges from −160 to 7,435 m above sea level. The lowest place in the study area is Aitin Lake, in the Turpan depression, and the highest place is in the Qinghai–Tibet Plateau. The climate is dominated by continental arid conditions with lesser effects of the East Asian Summer Monsoon. The China Meteorological Background Dataset1 shows that mean annual air temperature ranges from −26 to 15°C (Supplementary Figure 1). Annual total precipitation in the study area ranges from less than 10 mm in the center of Xinjiang Province to more than 500 mm in the northern part of Xinjiang Province and the eastern edge of the study area (Supplementary Figure 2), but the precipitation in most of the study area is less than 200 mm (Xu and Zhang, 2017). In addition, the present study area includes about 90% of the deserts in China, including the Taklamakan Desert, Gurbantunggut Desert, Badain Jaran Desert, Tengger Desert, Qaidam Desert, and Kumtagh desert (Shen et al., 2009).
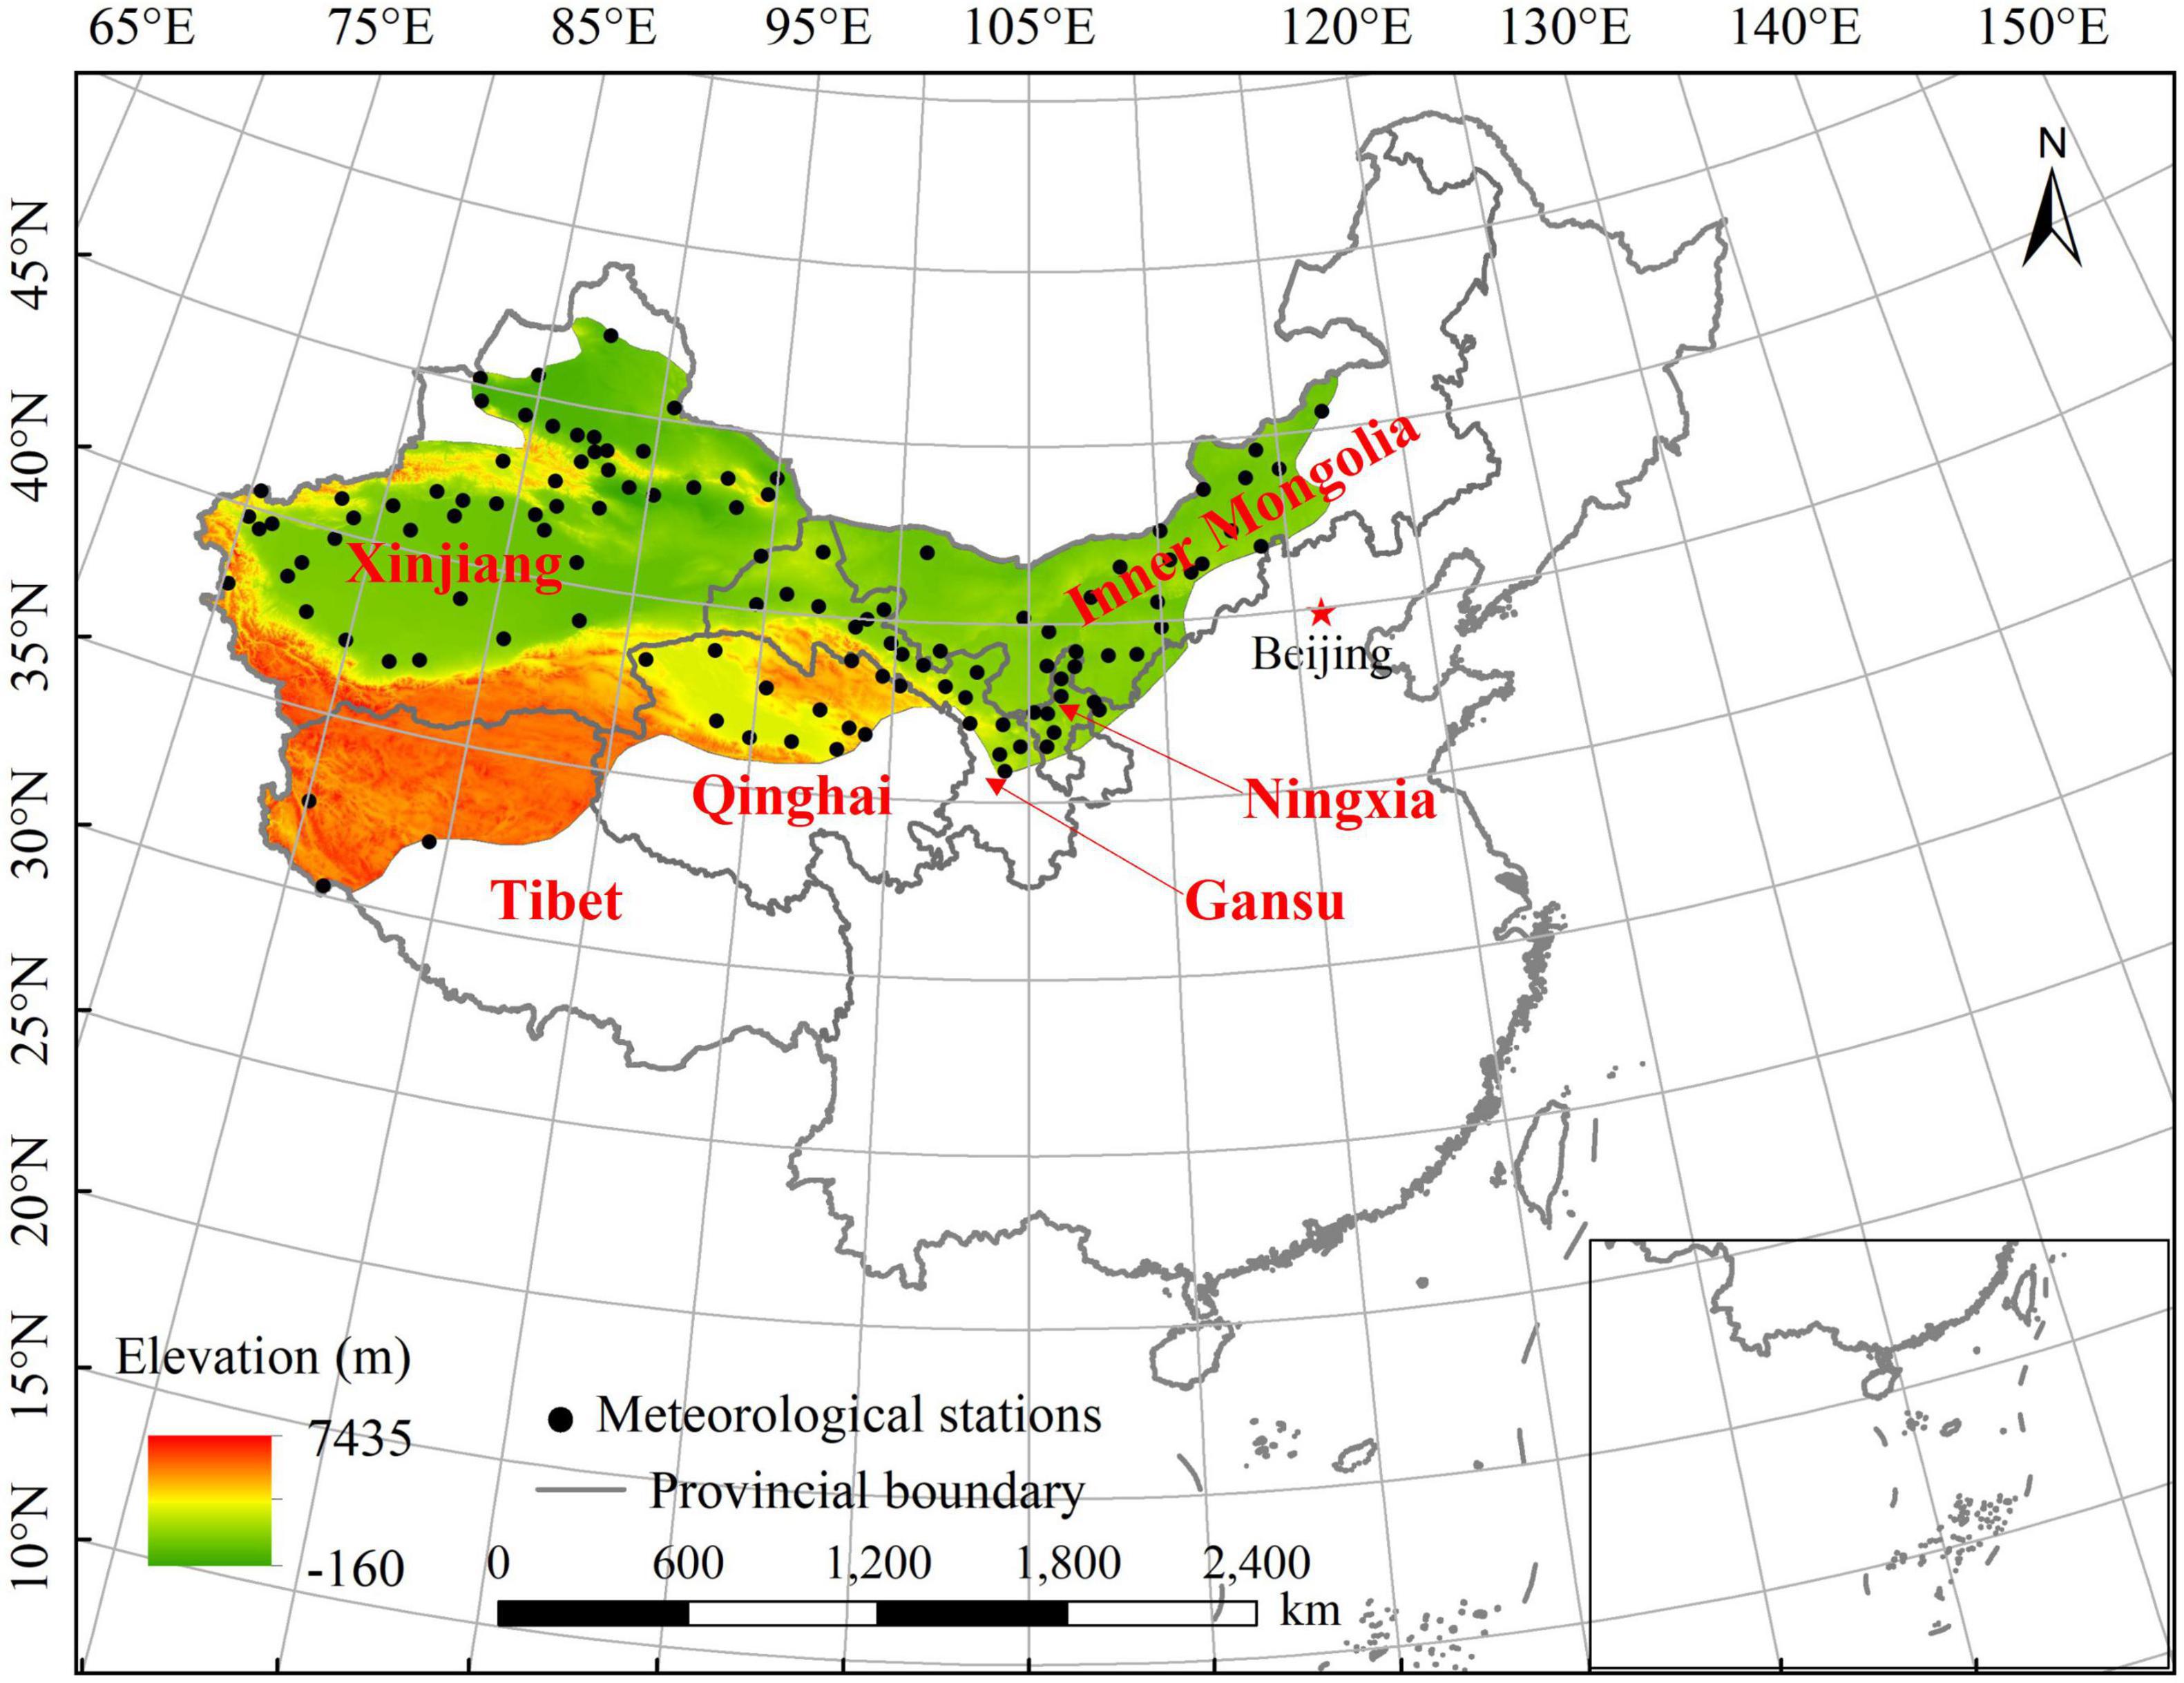
Figure 1. Location of the study area and the distribution of the 113 meteorological stations used in the present study.
Data and quality control
We collected quality-controlled meteorological data from 113 meteorological stations spread across China’s arid regions, including the daily maximum and minimum temperatures, as well as daily precipitation (Figure 1). The China Meteorological Administration’s National Climate Center2 provided data from 1960 to 2016. Because controlling the data quality is a prerequisite for determining climatic indices, we performed additional quality control before calculating the extreme temperature and precipitation indices by using the quality control (QC) module of the RClimdex software (Zhang and Yang, 2004). Specifically, (1) all missing values (currently coded as 99.9) are replaced with a software-recognized internal format (i.e., NA, for not available); and (2) all unreasonable values are replaced with NA. Unreasonable values include (a) a daily minimum temperature that is higher than the daily maximum temperature and (b) a daily rainfall that is less than 0 mm. Furthermore, the QC module detected outliers in daily maximum and minimum temperature, which we defined as daily values that fell outside a range defined as n times the standard deviation (STD) of the value for that day. Based on the criteria used in previous studies, we defined that threshold as the mean plus or minus 5 STD (Rusticucci and Barrucand, 2004; Haylock et al., 2008; Croitoru and Piticar, 2013). Following the QC procedure, we carefully checked the temperature and rainfall series for temporal homogeneity by using the RHtestsV4 software.3 Based on a penalized maximal F-test approach, this application identifies potential change points in a time series (Wang and Feng, 2013). The strict quality control and homogeneity testing significantly improved the dataset’s quality and completeness. Initially, data from 118 meteorological stations were available, but after quality control, we only kept stations with less than 10% missing data from 1960 to 2016; as a result, only 113 stations were used in the analyses.
Index calculations
The World Meteorological Organization-led Climate Change Detection and Indices Expert Group4 established a set of extreme climate indices. We selected 25 of these indices (16 temperature and nine precipitation indices; Table 1) that were suitable for our study area, and calculated their values using the RClimDex software (see text footnote 3), which was developed by Xuebin Zhang and Feng Yang from the Canadian Meteorological Service (Zhang and Yang, 2004). These indices have been widely used around the world to detect changes in the intensity, frequency, and duration of extreme temperature and precipitation events (Klein Tank and Können, 2003; Aguilar et al., 2005; Dos Santos et al., 2011; Croitoru and Piticar, 2013; Guan et al., 2015; Filahi et al., 2016; Sun et al., 2016; Supari et al., 2016; Gbode et al., 2019). Temperature indices can be further grouped into four categories based on the calculation method. The percentile indices are identified using percentile-based thresholds (with values of 10 and 90% for the lower and upper bounds, respectively), and comprise the number of cool days (TX10p), cool nights (TN10p), warm days (TX90p), and warm nights (TN90p). The threshold indices comprise the number of ice days (ID), FD, SU, and tropical nights (TR), which are defined based on a fixed threshold for the recorded temperature. The absolute indices are defined based on the absolute values recorded in the area without considering any threshold, and comprise the monthly minimum value of the daily maximum temperature (TXn), monthly minimum value of the daily minimum temperature (TNn), monthly maximum value of the daily maximum temperature (TXx), and monthly maximum value of daily minimum temperature (TNx). The duration indices include the warm and cold spell durations [Warm spell duration (WSDI) and cold spell duration (CSDI)], growing season length (GSL), and diurnal temperature range (DTR). Precipitation indices include one dry index and eight wet indices, which are further subdivided into two percentile, one threshold, two absolute, two duration, and two other indices (Powell and Keim, 2015).
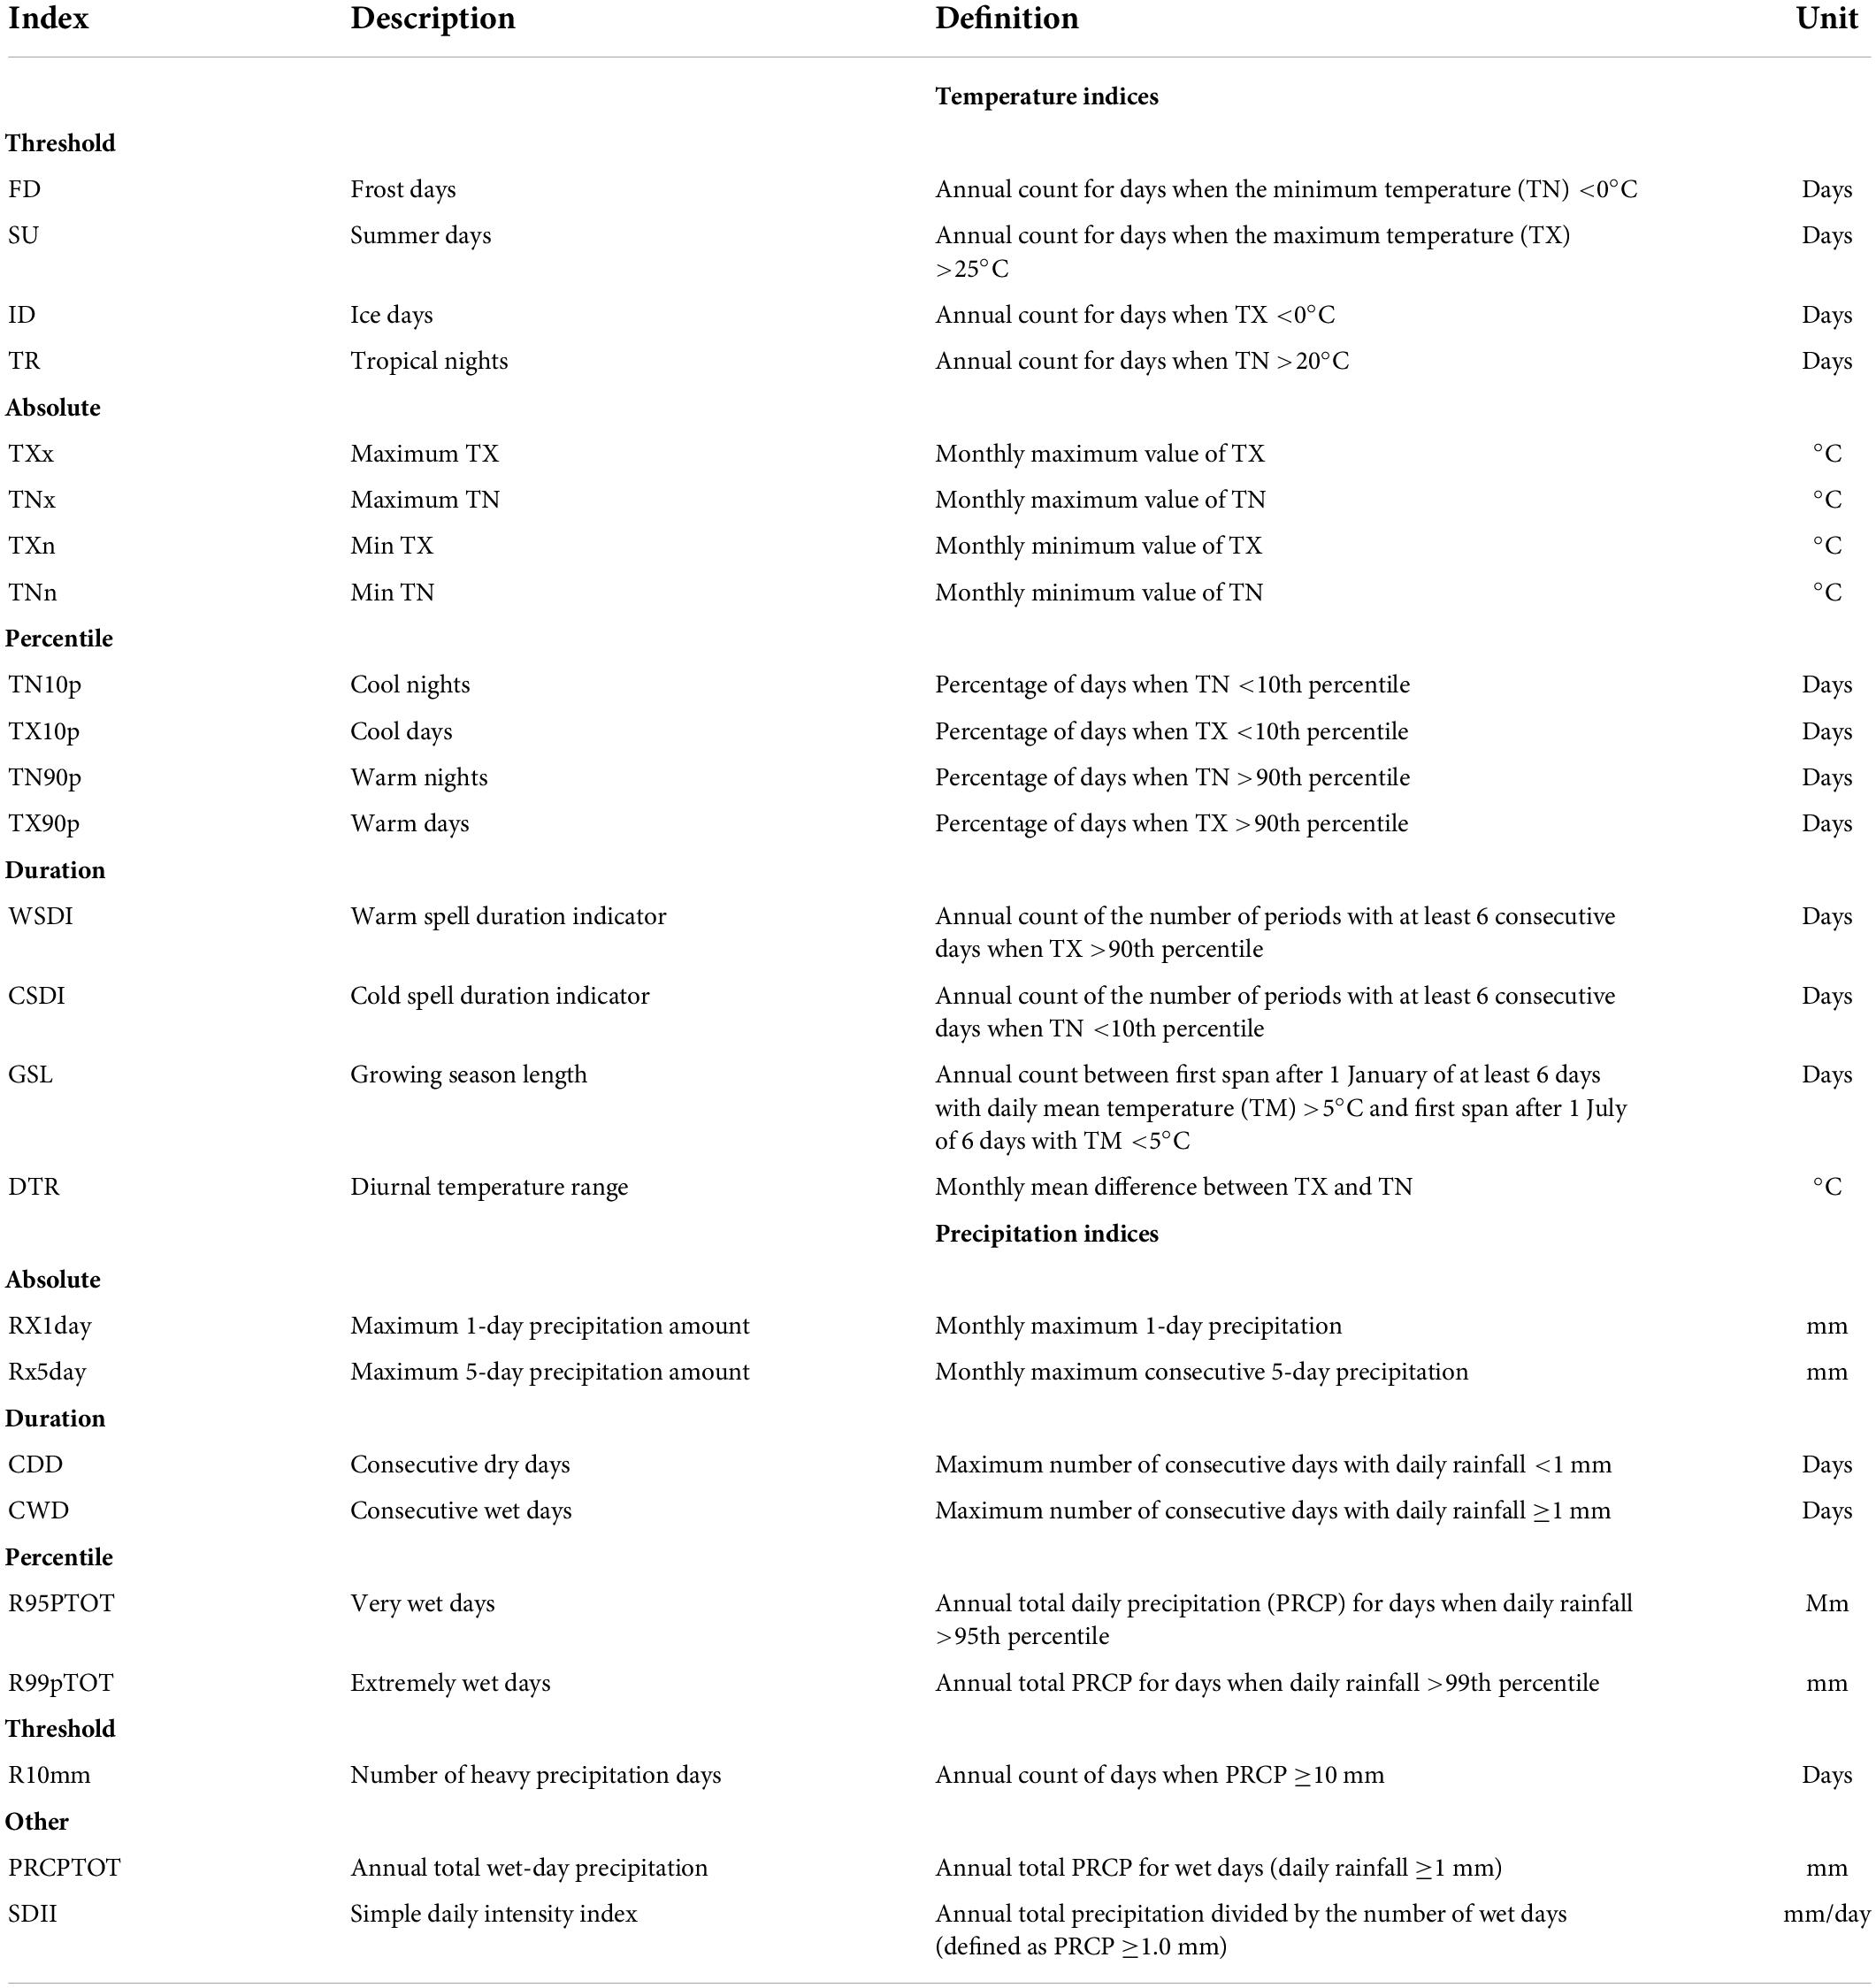
Table 1. Definitions of the temperature and precipitation extremal indices used in this study, which were defined by the Expert Team on Climate Change Detection and Indices (http://etccdi.pacificclimate.org/list_27_indices.shtml).
Analytical methods
To detect significant trends and abrupt changes in climate indices, we used least-squares linear regression combined with the Mann–Kendall test (Kendall, 1990). We used the Z value to determine the trend’s direction and significance level; Z > 0 indicates an increasing trend, while Z < 0 indicates a decreasing trend. The trend is significant at P < 0.05, 0.01, and 0.001, respectively, when the absolute value of Z is greater than or equal to 1.96, 2.58, and 3.30 (Hamed and Rao, 1998). Pearson’s correlation coefficient (r) was used to detect significant relationships between the extremal climate indices and between the climate indices and three geographic characteristics (latitude, longitude, and elevation), and a three-dimensional graph for the climate indices and topographic factors was generated using MATLAB version 2016b.5 In order to define the spatial pattern of trends in the climate indices, we used inverse distance-weighted interpolation with ArcMap 10.3.6
Results and discussion
Extreme temperature event trends
Temporal trends in temperature extremes
For the study period, the regionally averaged values of the warmth indices showed significant increasing trends (P < 0.001), with increasing rates of 2.62 days per decade for SU, 1.73 days per decade for TR, 1.37 days per decade for warm nights (TN90p), and 0.76 days per decade for warm days (TX90p) (Figure 2). The strongest trend was observed for TN90p (Z = 6.48). Alternatively, we observed significant decreases (P < 0.001) of 3.61 days per decade for FD, 1.93 days per decade for ID, 1.25 days per decade for cool nights (TN10p), and 0.53 days per decade for cool days (TX10p). From these results, we conclude that extreme cold events have shown a decreasing trend, whereas extreme warm events have shown an increasing trend. Similar findings have been reported in the Democratic Republic of Georgia (Keggenhoff et al., 2014), the Arabian Peninsula (Alsarmi and Washington, 2014), Africa (New et al., 2006; Gbode et al., 2019), Central and South America (Haylock et al., 2006; Skansi et al., 2013), and Europe (Bocheva et al., 2009; Lupikasza, 2009; Siliverstovs et al., 2010). Changes in TN10 and TN90, which characterize nighttime temperature extremes, showed stronger trends (larger Z values) than changes in TX10 and TX90, which characterize daytime temperature extremes. This finding is consistent with previous research in Inner Mongolia (Yan et al., 2014), Europe (Moberg et al., 2006), South Asia (Revadekar et al., 2013), and the northern China agro-pastoral ecotone (Wang X.Y. et al., 2018), which found that nocturnal warming contributed more to the overall warming process than daytime warming (Manton et al., 2001; Griffiths et al., 2005; Klein Tank et al., 2006).
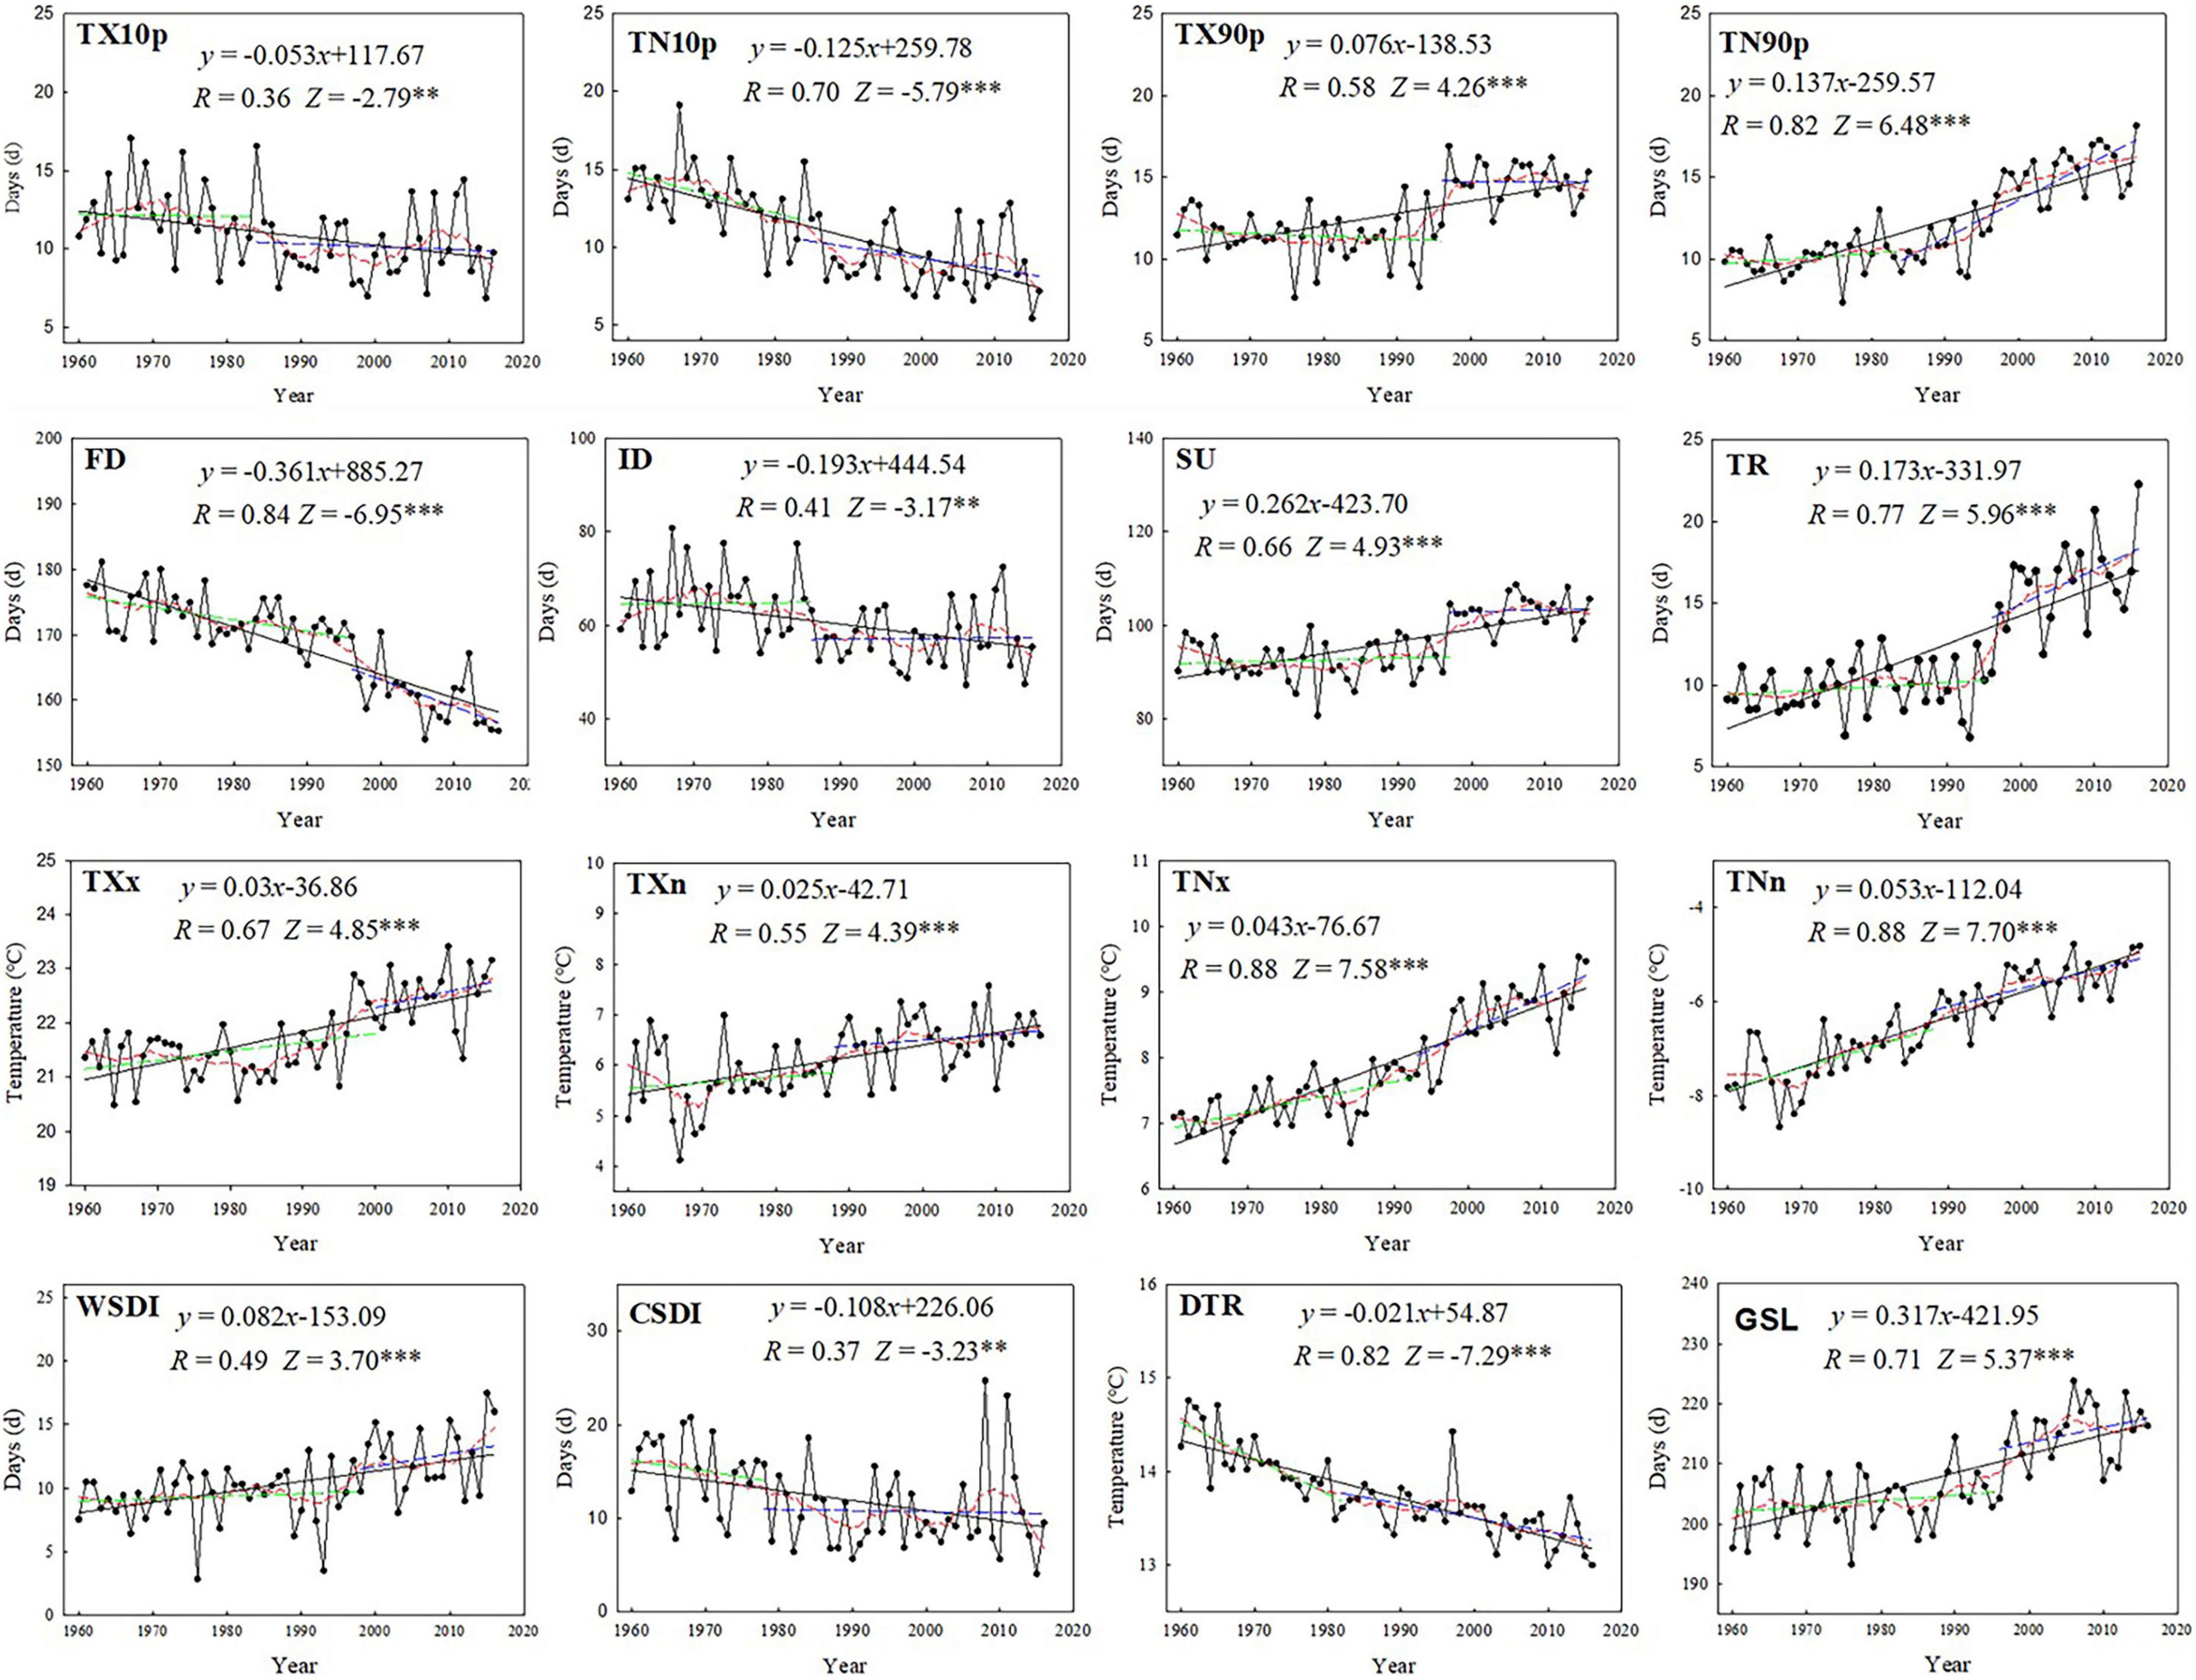
Figure 2. Regionally averaged time series for indices of the extreme temperature events in the arid regions of China from 1960 to 2016. The indices are defined in Table 1. Straight lines represent statistically significant linear regressions; the dashed red line is the smoothed 10-year running average; the dashed green and blue line are linear regressions before and after abrupt years, respectively. Z scores represent the Mann–Kendall test results for the strength of the trend. Significance: ***P < 0.001.
The absolute indices for the warmest day (TXx), coldest day (TXn), warmest night (TNx), and coldest night (TNn) all showed significant warming trends (P < 0.001), with rates of 0.30, 0.25, 0.43, and 0.53°C per decade, respectively, with the trend being strongest for TNn (Z = 7.70). WSDI and GSL both increased at rates of 0.82 and 3.17 days per decade, respectively, for the duration extremes. CSDI and DTR decreased significantly, at rates of 1.08 days per decade and 0.21°C per decade, respectively, with the trend being strongest for DTR (Z = −7.29). This can be explained by the observation that human activities and natural processes emit large quantities of aerosols, and changes in the concentration of aerosols will cause changes in the turbidity of the atmosphere, which will, in turn, affect solar radiation inputs and cause DTR changes (Forster and Solomon, 2003). Aerosol changes caused by human activities are negatively correlated with DTR; that is, increasing atmospheric aerosol content can reduce DTR (Cerveny and Balling, 1998). In addition, the change of GSL in the arid regions of China (3.17 days per decade) was greater than the value for northwestern China as a whole (2.74 days/decade; Song et al., 2015), southwestern China (0.12 days/decade; Li et al., 2012), and the Yangtze River Basin (0.23 days/decade; Wang et al., 2014), but lower than those in an alpine grassland of Central Asia (5.50 days/decade; Hu et al., 2015) and the Yarlung Tsangpo River Basin (4.33 days/decade; Liu et al., 2019).
Spatial trends in temperature extremes
Figure 3 depicts the spatial patterns of the annual trends in extreme temperature indices. Warmth-related indices (SU, TR, TX90p, TN90p, and WSDI) showed increased in most areas, while cold indices (FD, ID, TX10p, TN10p and CSDI) decreased. The decreasing trend for FD was especially noticeable, but there was a significant increasing trend in the center of Xinjiang Province. ID in the Qinghai–Tibet Plateau, located in the northern part of Tibet and Qinghai provinces, has shown a significant decreasing trend. In most of the study area, the absolute indices (TXx, TXn, TNx, and TNn) showed increasing trends, with rates reaching 0.15°C/year. For the duration indices, the increasing trend for GSL was especially obvious. Most of arid China’s GSL showed a significant growth trend, except for a decreasing trend in the central area of Xinjiang Province.
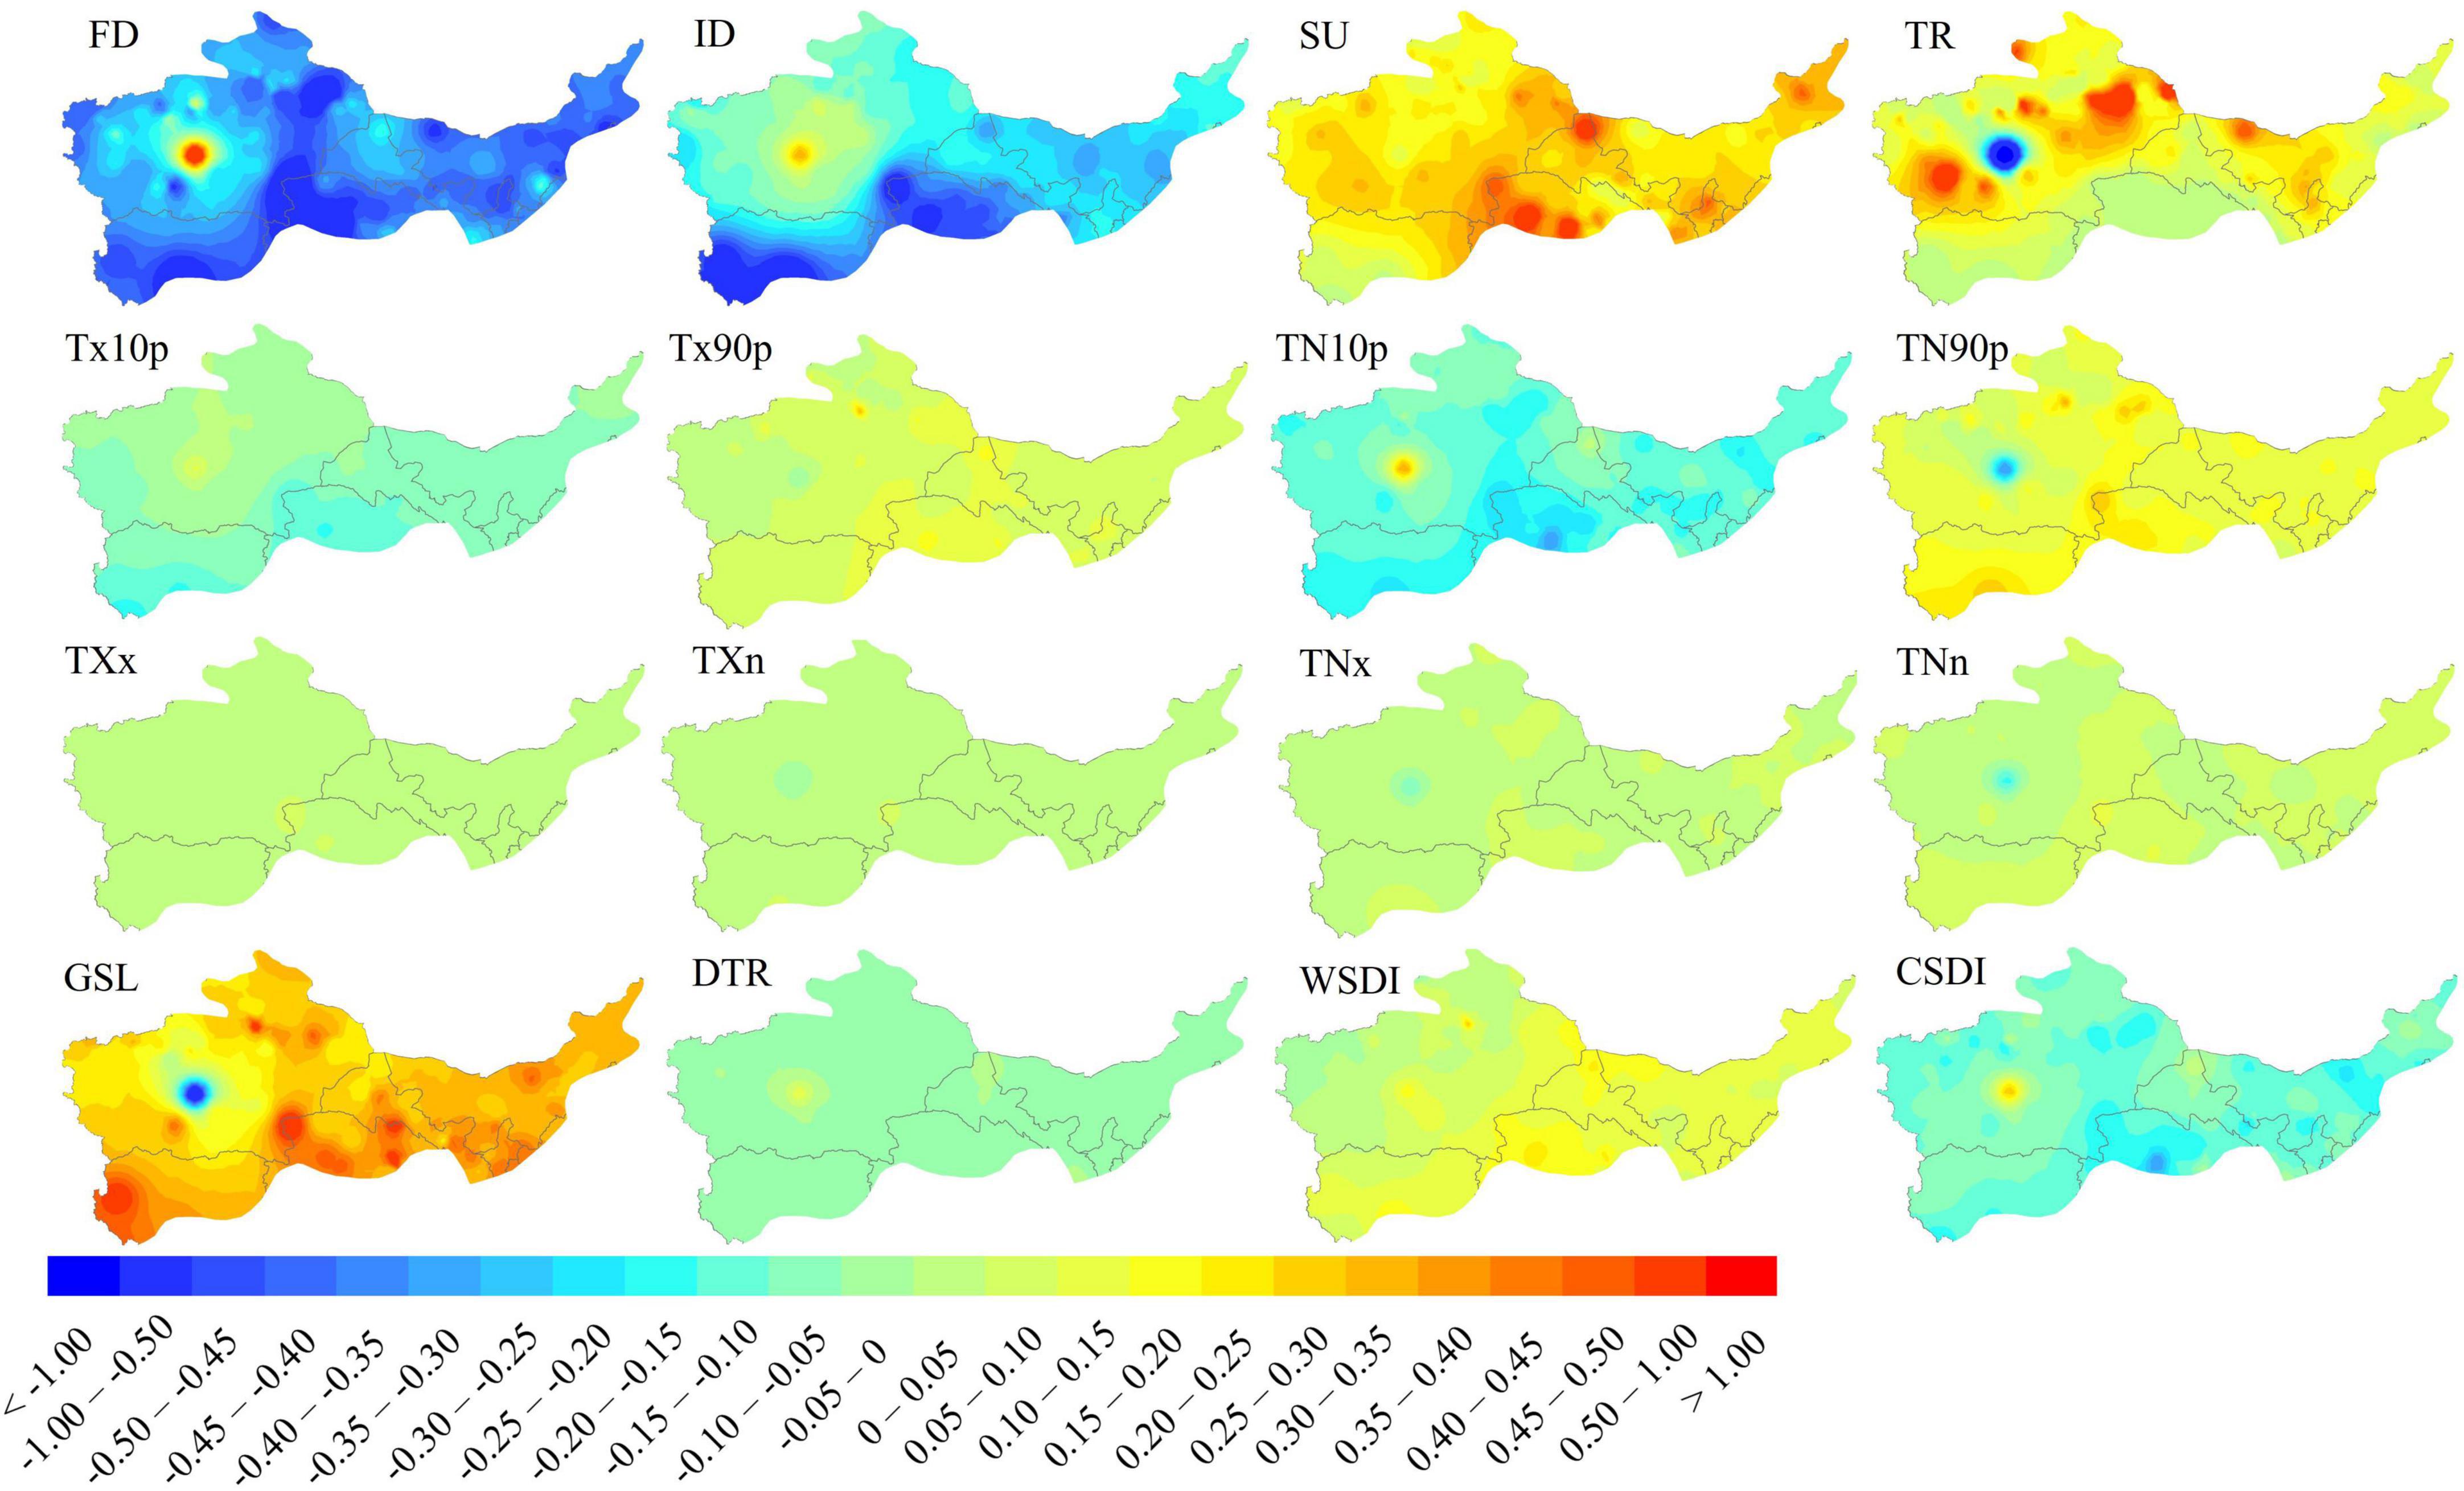
Figure 3. Spatial pattern of the trends for temperature indices from the 113 meteorological stations in the arid regions of China from 1960 to 2016. The indices are defined in Table 1.
The abrupt change in extreme climate events
The abrupt change in extreme temperature events
Table 2 shows that from 1960 to 2016, all the extreme temperature indices experienced abrupt changes. The abrupt climate change for the warmth-related indices and the GSL occurred mostly between 1990s. The abrupt changes occurred in 1997 for SU, 1996 for TR, 2000 for warmest day (TXx), 1993 for warmest night (TNx), 1996 for warm days (TX90p), 1997 for warm nights (TN90p), 1998 for WSDI, and 1996 for GSL. The trends for these warmth-related indices strengthened after the abrupt change, with TR experiencing the greatest increase (which increased by 1.8 days/decade), and the corresponding mean number of days before and after the abrupt change were 9.85 and 16.22 days/year, respectively. However, the abrupt changes for the cold-related indices and DTR appeared earlier (mainly before 1990), except for FD, which changed abruptly in 1996. These changes occurred in 1986 for ID, 1988 for the coldest day (TXn), 1988 for the coldest night (TNn), 1984 for cool days (TX10p), 1984 for cool nights (TN10p), 1978 for CSDI, and 1982 for DTR. For FD, the largest increase was 2.4 days per decade, with corresponding values before and after the abrupt change of 172.64 and 160.65 days/year, respectively.
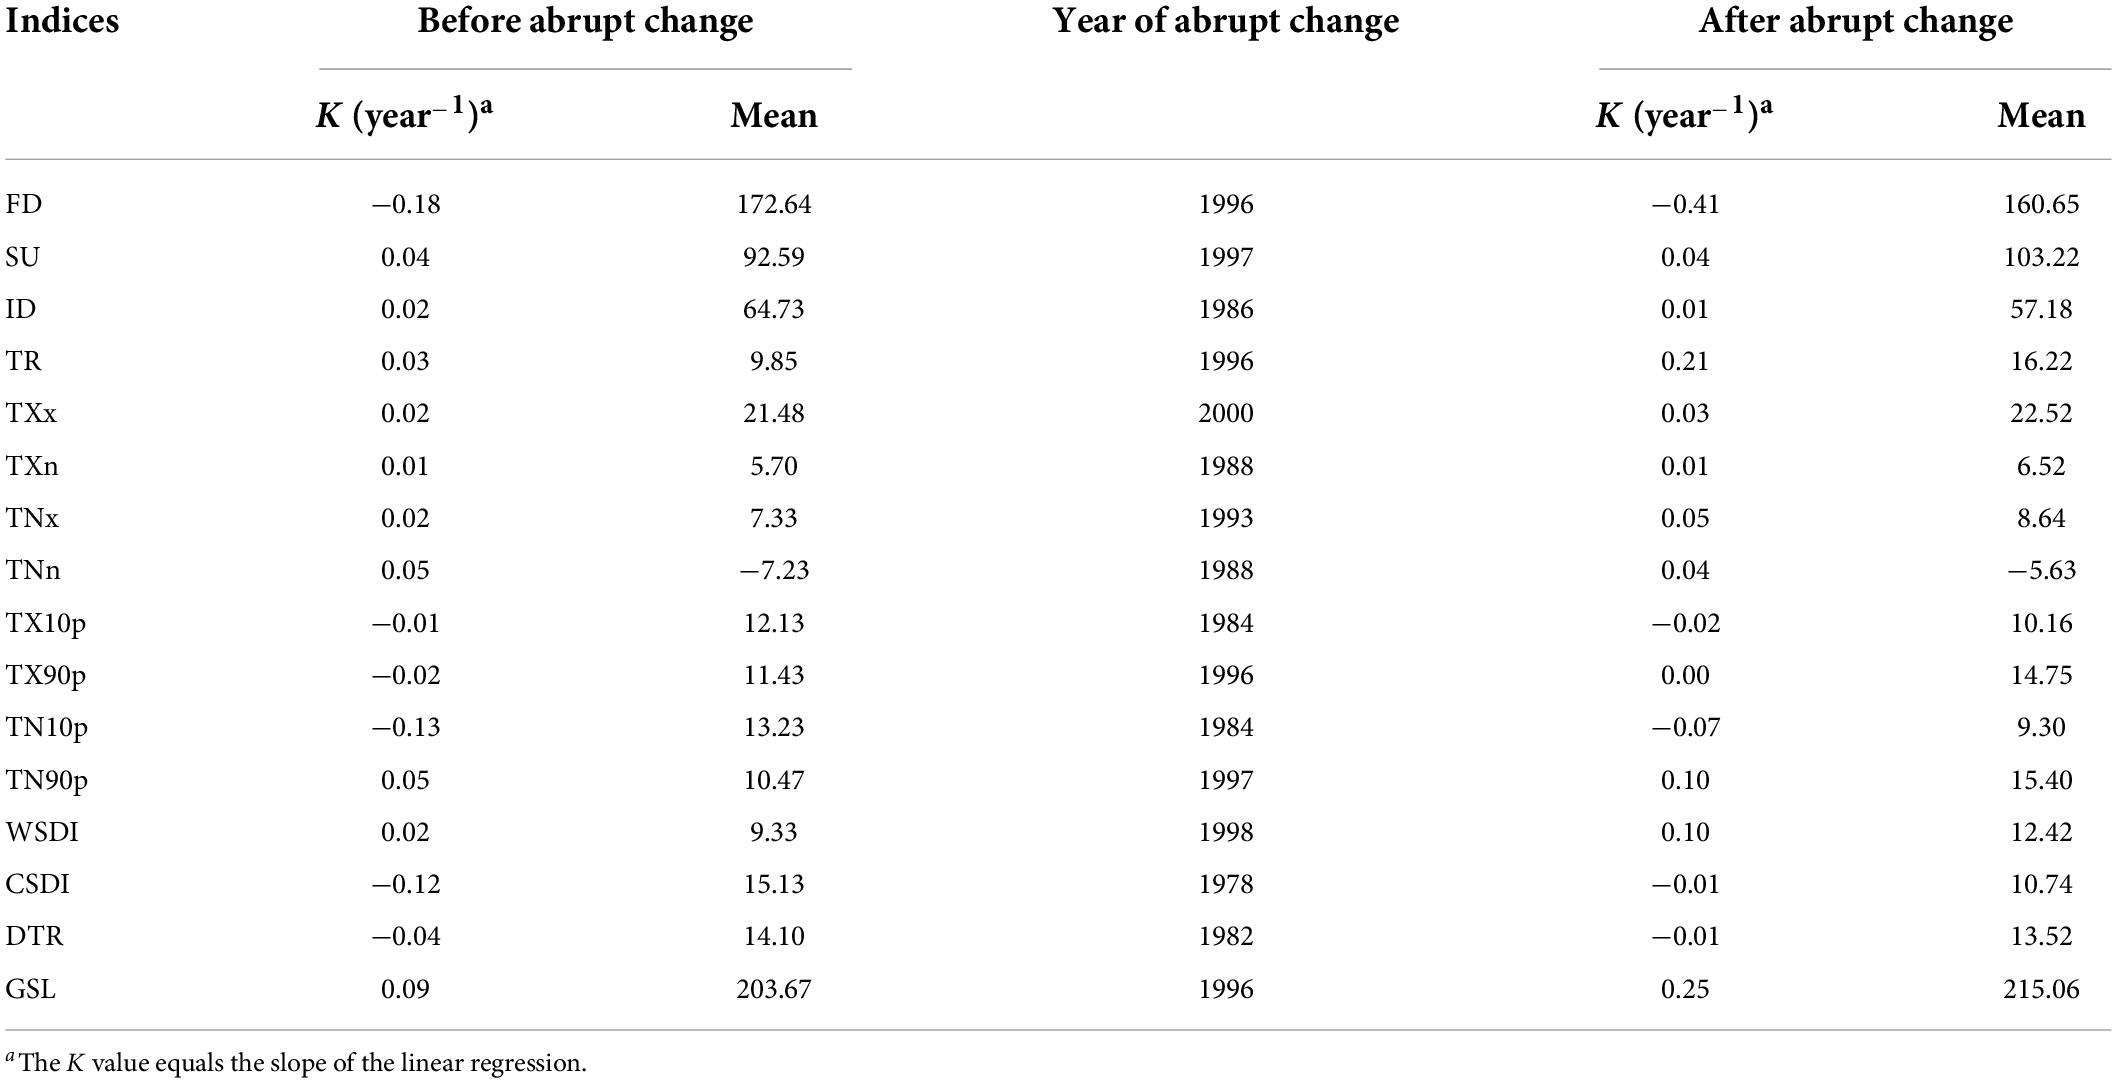
Table 2. Changes in the warmth indices and dates of the abrupt change in extreme temperature events from 1960 to 2016 in arid regions of China.
The abrupt change in extreme precipitation events
We also detected abrupt changes in the extremal precipitation events from 1960 to 2016 (Table 3). The abrupt changes occurred in 1992 for the monthly maximum 1-day precipitation (Rx1day), 2000 for the heavy precipitation days (R10mm), 1995 for the consecutive wet days (CWD), 1992 for the very wet days (R95pTOT), and 2000 for the extremely wet days (R99pTOT); that is, they mainly occurred from 1990 to 2000. The abrupt change for the simple daily intensity index (SDII) and consecutive dry days (CDD) both appeared earlier, in 1970. However, the abrupt change occurred later (after 2000) for the monthly maximum 5-day precipitation (Rx5day, 2001) and the annual total wet day precipitation (PRCPTOT, 2009). PRCPTOT increased the most after the abrupt change, by 42.0 mm/decade, with values of 153.00 and 170.68 mm, respectively, before and after the abrupt change. Combining the above abrupt change in extreme temperature events, we found that the climate experienced a warm-wet abrupt climate change during 1990s in the arid regions of China, mainly due to the global warming and increased regional water cycling, which has led to a climate transition (from hot and dry to warm and wet) in northern Xinjiang (Xu C. et al., 2015, the abrupt change in 1986 for temperature and in 1987 for precipitation), Xinjiang (Li Q. et al., 2011), and northwest China (Shi et al., 2007; Wang et al., 2013). In addition, published studies speculated that the warm and wet tendency will be continuous into the future in Xinjiang Province (Hu et al., 2015).
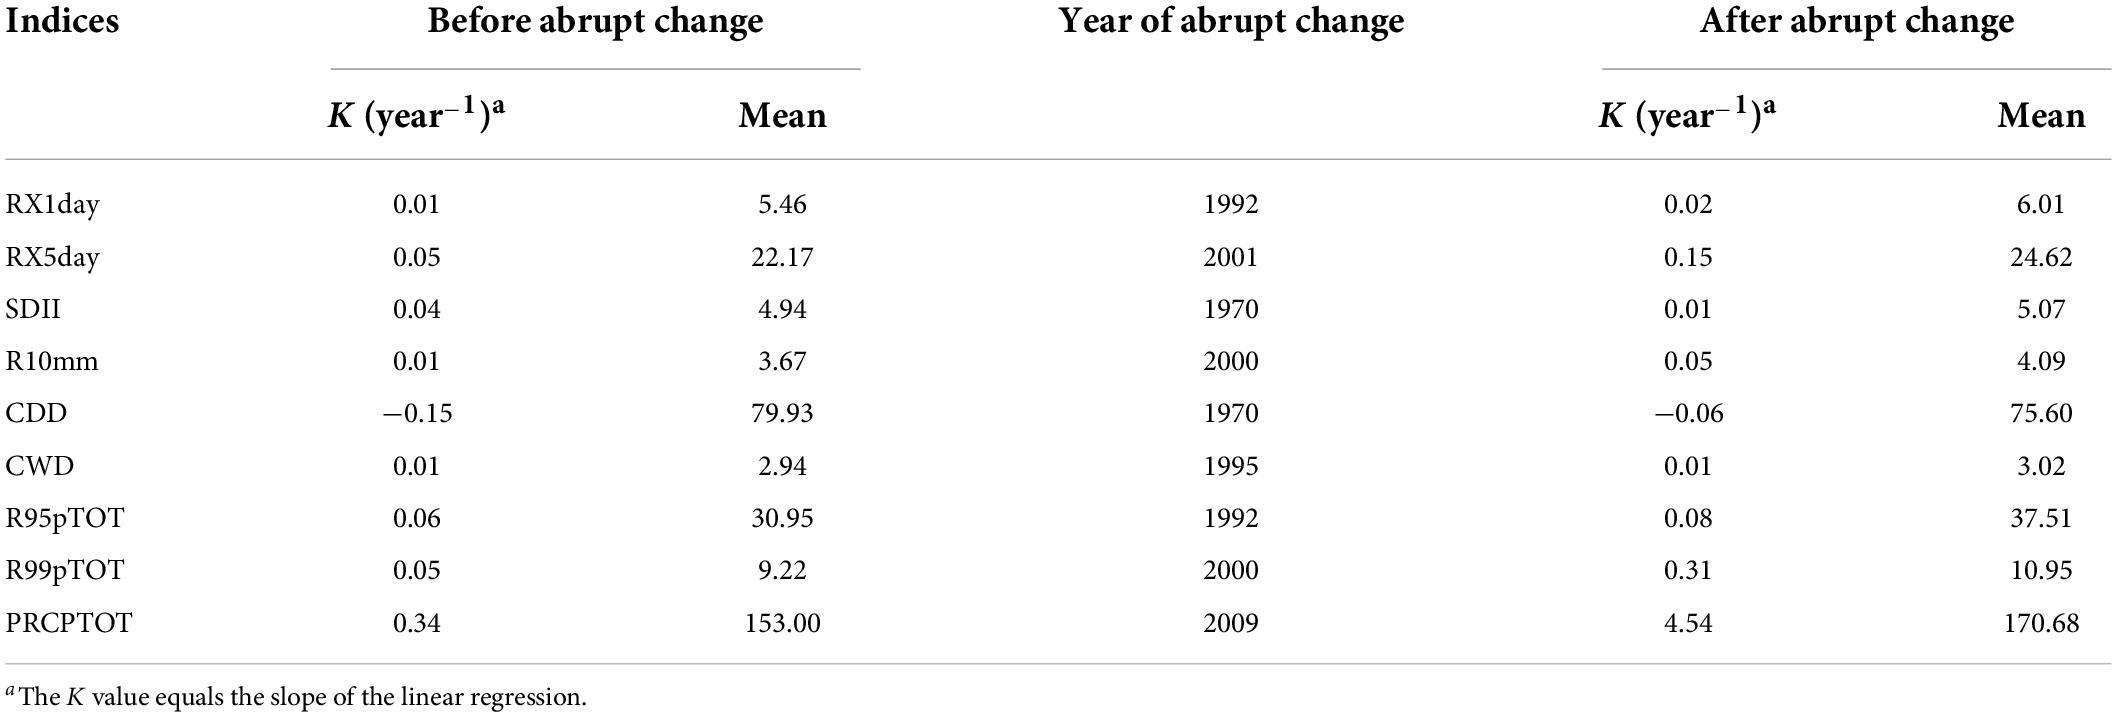
Table 3. Changes in the precipitation indices and dates of the abrupt change in extreme precipitation events during 1960 to 2016 in arid regions of China.
Extreme precipitation event trends
Temporal trends in extreme precipitation events
The extreme precipitation indices in China’s arid regions have shown increasing trends since 1960, except for CDD, which has shown a significant decreasing trend (Figure 4). However, the increases for R99ptot and CWD were not statistically significant. The annual total precipitation for wet days (PRCPTOT) has increased by 4.78 mm per decade (P < 0.01). Likewise, the number of days with heavy precipitation (R10mm) increased significantly (P < 0.01), increasing by 0.16 days per decade (P < 0.01). In addition, the highest monthly 1-day precipitation (RX1day) and highest consecutive 5-day precipitation (RX5day) increased significantly (P < 0.01), at rates of 0.19 and 0.80 mm per decade, respectively. The number of CDD decreased significantly (P < 0.01), by 1.09 days per decade, whereas CWD increased by 0.04 days per decade, but the trend was not significant.
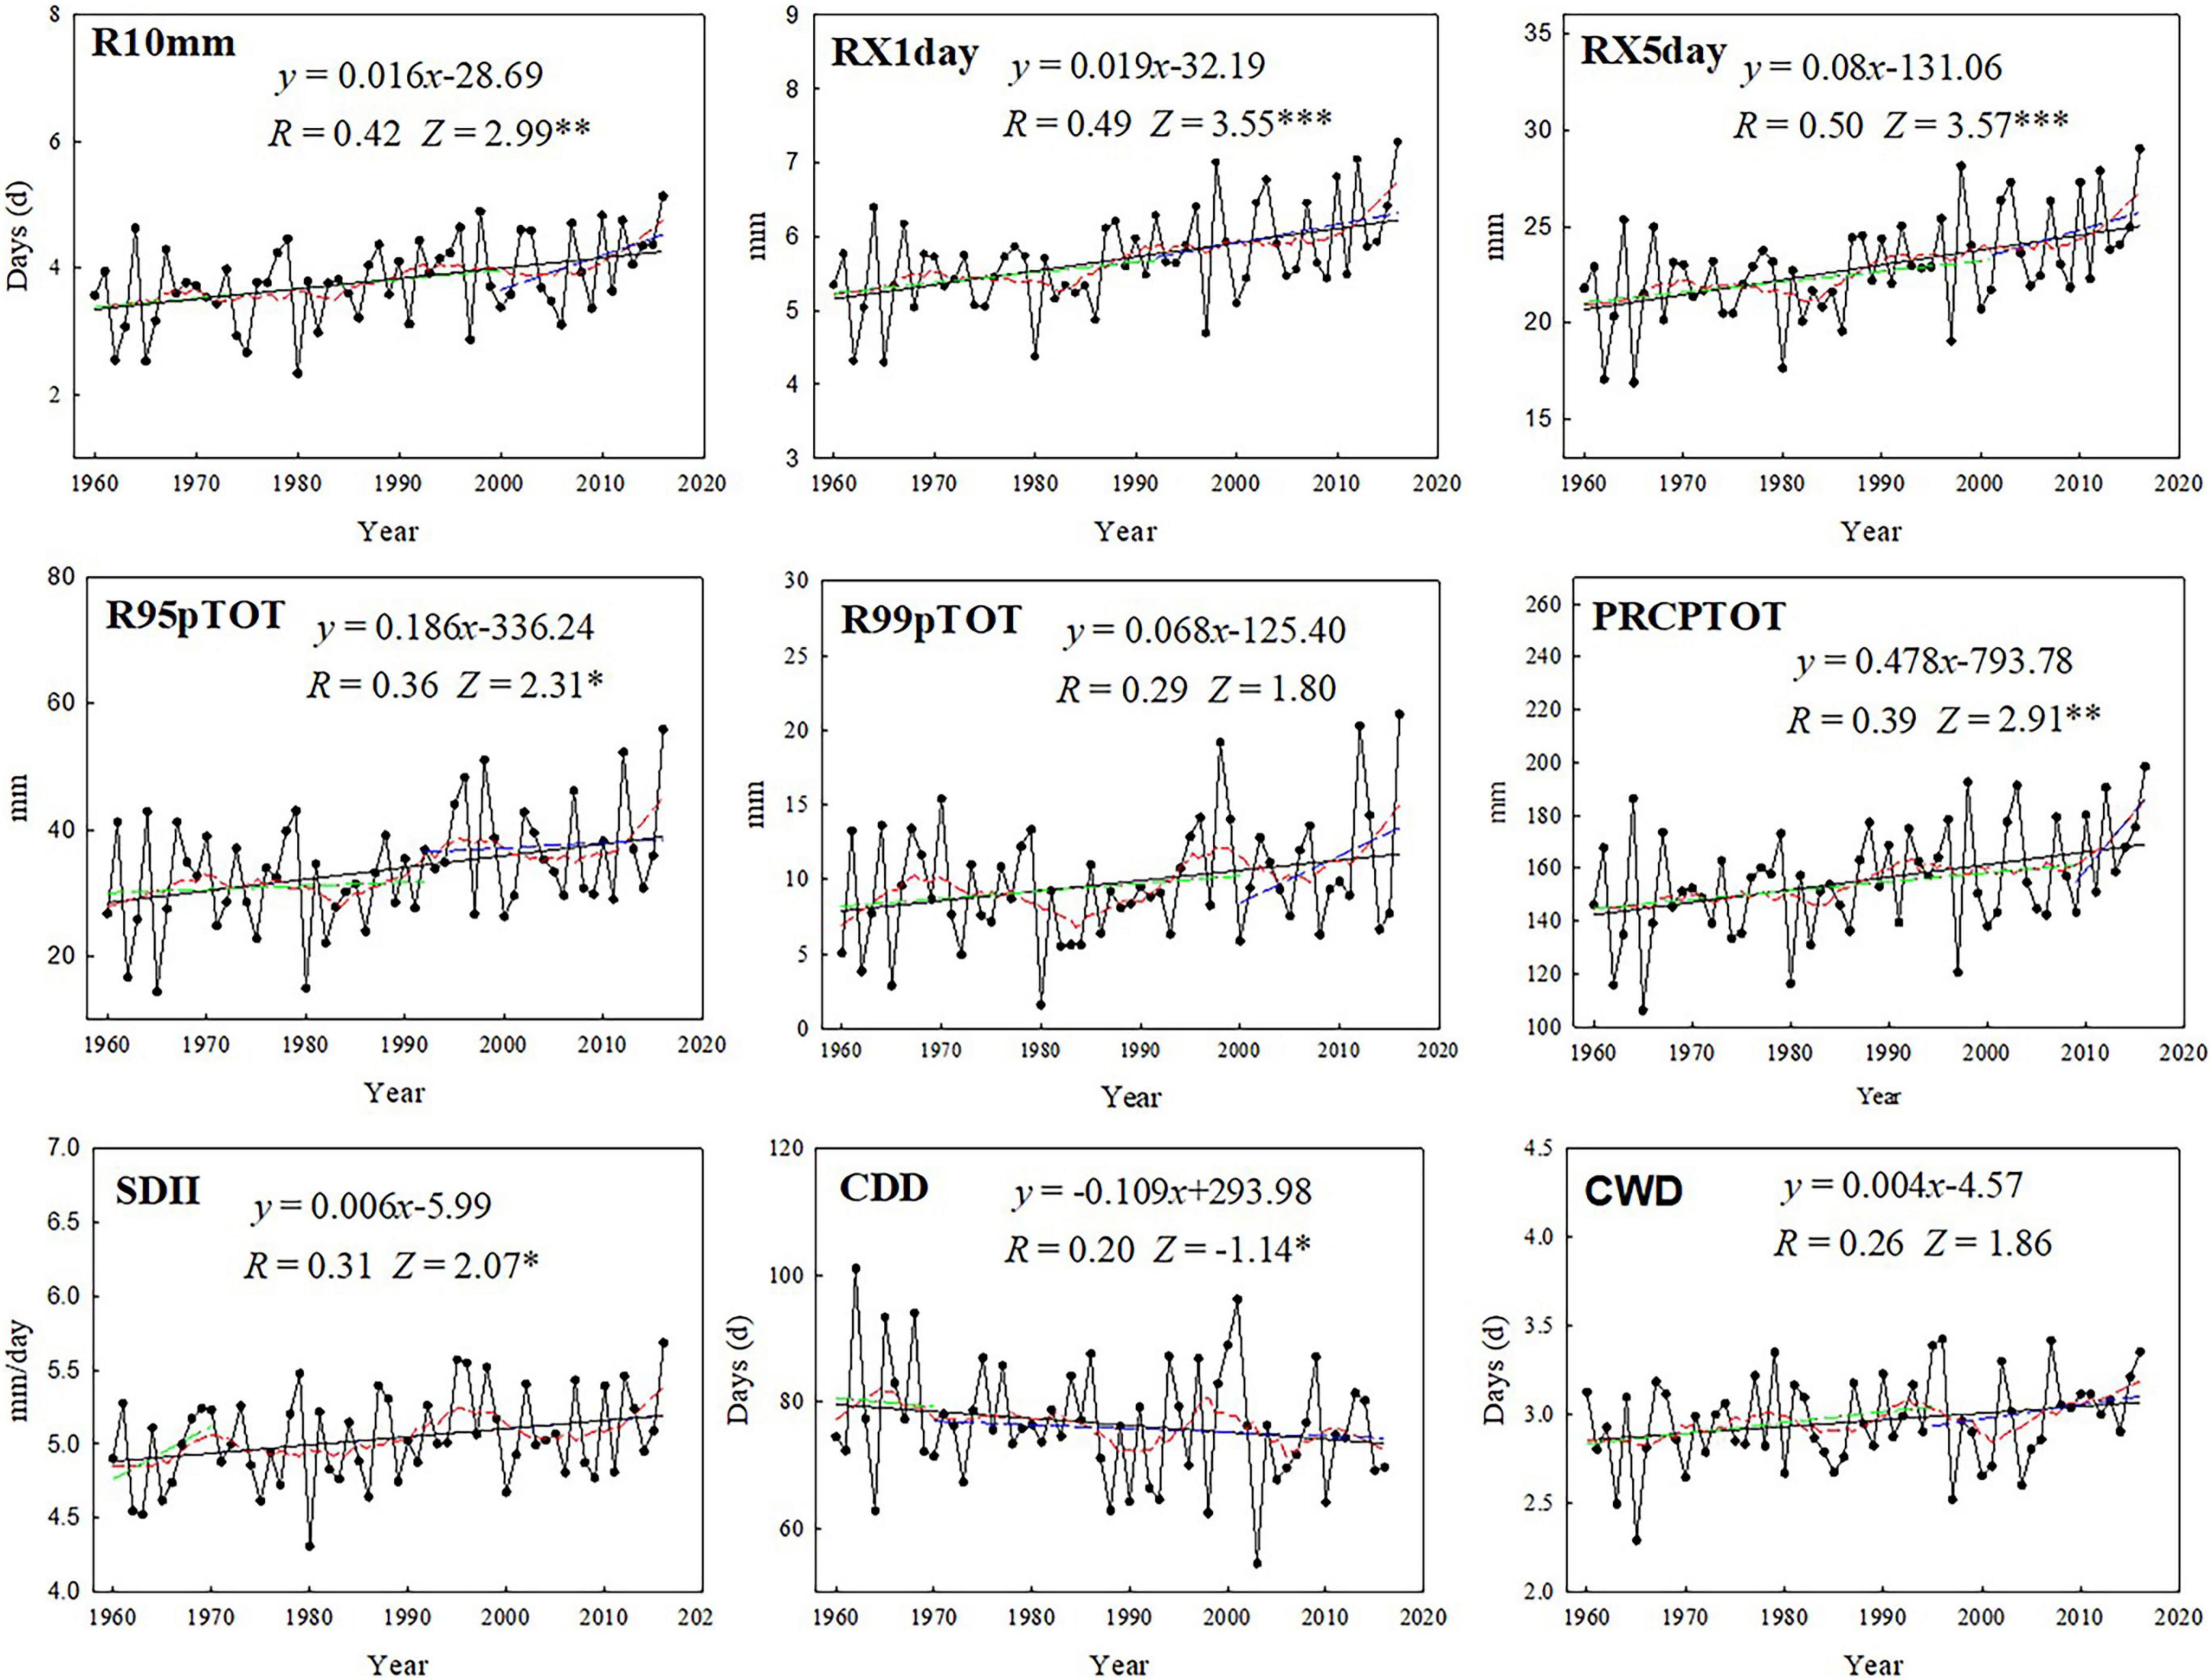
Figure 4. Regionally averaged series for the extreme precipitation indices in the arid regions of China from 1960 to 2016. The indices are defined in Table 1. Straight lines represent statistically significant linear regressions; the dashed red line is the smoothed 10-year running average; the dashed green and blue line are linear regressions before and after abrupt years, respectively. Z scores represent the Mann–Kendall test results for the strength of the trend. Significance: ***P < 0.001; **P < 0.01; *P < 0.05. All other results are not significant.
Based on these findings, we conclude that the total amount of precipitation, as well as the intensity and frequency of extreme precipitation events, have increased in China’s arid regions since 1960. Ning et al. (2021) also confirmed these findings using more robust statistical methods, providing strong evidence that the frequency and participating days of extreme precipitation events exhibit significant increasing trends in arid northwest China. The precipitation indices’ trend strengths were lower than those of the temperature indices. PRCPTOT had the steepest slope (4.78 mm/decade), but RX5day had the strongest trend among the precipitation indices during the study period (Z = 3.57). The rate of increase of PRCPTOT (4.78 mm/decade) was higher than that in China’s Loess Plateau (1.50 mm/decade; Sun et al., 2016), northeastern China (1.65 mm/decade; Song et al., 2015), China’s Yangtze River basin (1.90 mm/decade; Wang et al., 2014), and Romania (4.14 mm/decade; Croitoru and Piticar, 2013), but lower than that in the Democratic Republic of Georgia (7.9 mm/decade; Keggenhoff et al., 2014), Nigeria (8.03 mm/decade; Gbode et al., 2019), and on a global scale (10.59 mm/decade; Alexander et al., 2006), but in Indonesia, PRCPTOT showed a negative trend (−4.30 mm/decade; Supari et al., 2016). In the present study, the rate of increase of RX5day (0.80 mm/decade) was lower than that in northwestern China (0.85 mm/decade) and for China overall (1.90 mm/decade; You et al., 2011), but higher than that in southwestern China (0.03 mm/decade; Li et al., 2012), northeastern China (0.13 mm/decade; Song et al., 2015), and globally (0.55 mm/decade; Alexander et al., 2006).
Spatial trends for precipitation extremes
In most of China’s arid regions, the extreme precipitation indices showed rising trends, except for CDD, which decreased in most regions (Figure 5). The increasing trend for PRCPTOT was especially obvious, but there was a significant decreasing trend in southern Gansu Province and eastern Inner Mongolia. R95pTOT showed overall increases, with the strongest trend in northern Xinjiang and eastern Qinghai province. Although CDD showed a decreasing trend in most of the study area, there was a significant increasing trend in the center of Xinjiang Province and eastern Inner Mongolia. The remaining extreme precipitation indices’ trends revealed less spatial heterogeneity.
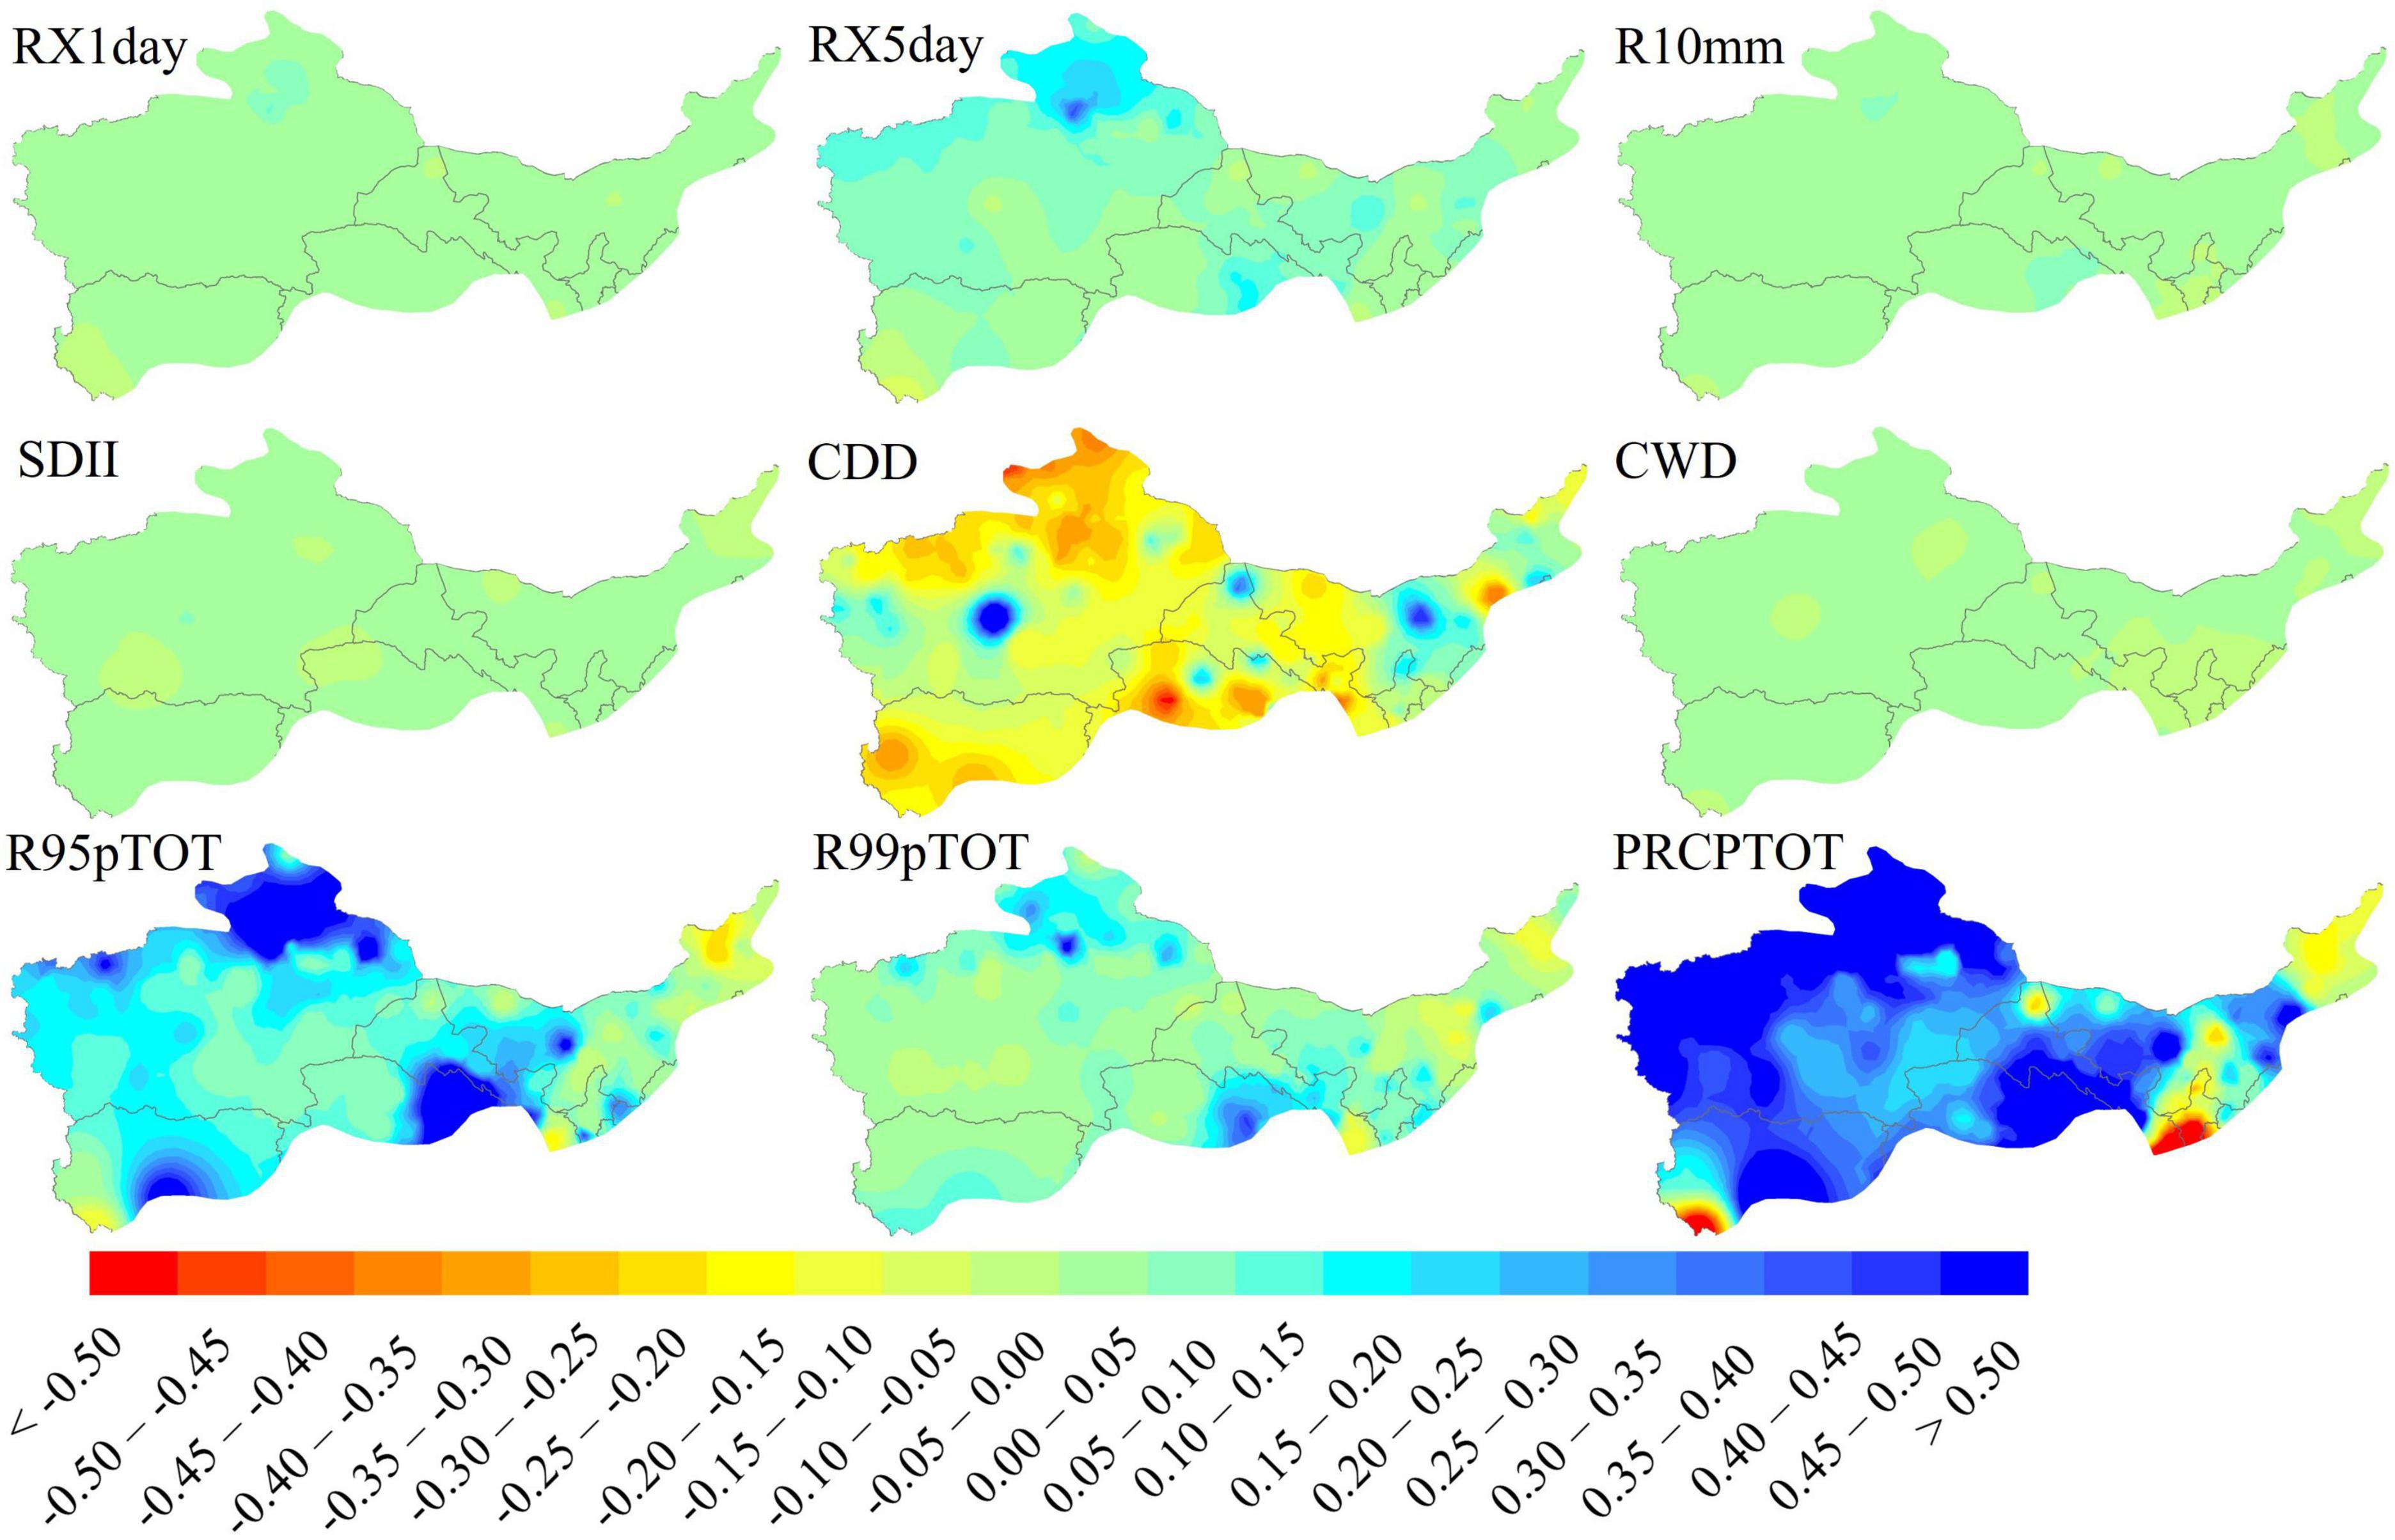
Figure 5. Spatial pattern of the trends for the precipitation indices from the 113 meteorological stations in the arid regions of China from 1960 to 2016. The indices are defined in Table 1.
Relationships between extreme temperature events and geographical factors
Latitude was significantly positively correlated with ID and cold wave duration (CSDI), while significantly negatively correlated with TR and WSDI (Table 4), indicating that the occurrence of cold extreme temperature events increased with increasing latitude while the occurrence of warm extreme temperature events decreased (Figure 6). This mainly results from the fact that latitude influences the distribution of energy across the earth’s surface by changing the angle of incidence of the sun. Specifically, lower latitude areas have a higher angle of solar incidence, so they intercept more solar radiation and receive more heat, leading to higher temperatures in lower latitude areas. In contrast, the temperature is lower at higher latitude areas (Serreze et al., 2000). Furthermore, the DTR decreased significantly with increasing latitude. Longitude was significantly positively correlated with FD, ID, TX10p, TX90p, and TN10p, but significantly negatively correlated with the remaining indices. Altitude had a significant positive correlation with two cold indices (FD and CSDI) (P < 0.01), but a negative correlation with two warmth indices (SU and TR), indicating that cold temperature events increased at high altitudes, while warm temperature events decreased. Two warmth indices (SU and TR) had significant negative correlations with elevation (P < 0.01), whereas two cold indices (FD and CSDI) showed significant positive correlations, indicating that the occurrences of warm temperature events decreased at high elevations while cold temperature events increased. However, this is inconsistent with the results of studies in in the Austrian Alps (Filippo et al., 1997), Rocky Mountains of North America (Fyfe and Flato, 1999), and southwestern China (Li et al., 2012), this may be due to more precipitation in these three regions, which would increase relative humidity and therefore retain more heat in the air (absorbed by the water vapor). There were significant negative correlations between the absolute indices (TXx, TXn, TNx, and TNn) and the longitude and elevation (P < 0.01), implying that the frequency of daily extreme temperature events would decrease as elevation and longitude increased. Furthermore, the GSL was shortened at high elevations.
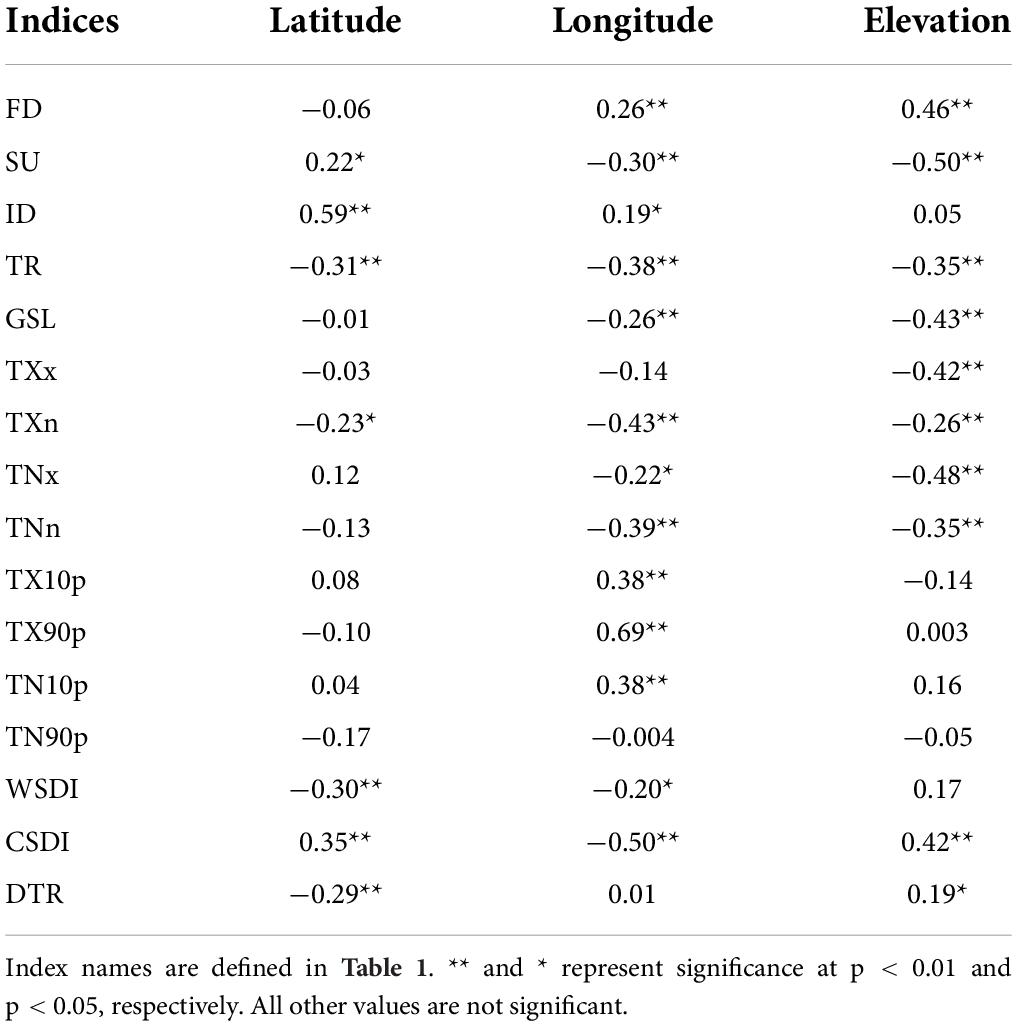
Table 4. Correlations (Pearson’s r) between the temperature extremes from 1960 to 2016 and the latitude, longitude, and elevation of the measurement sites in the arid regions of China.
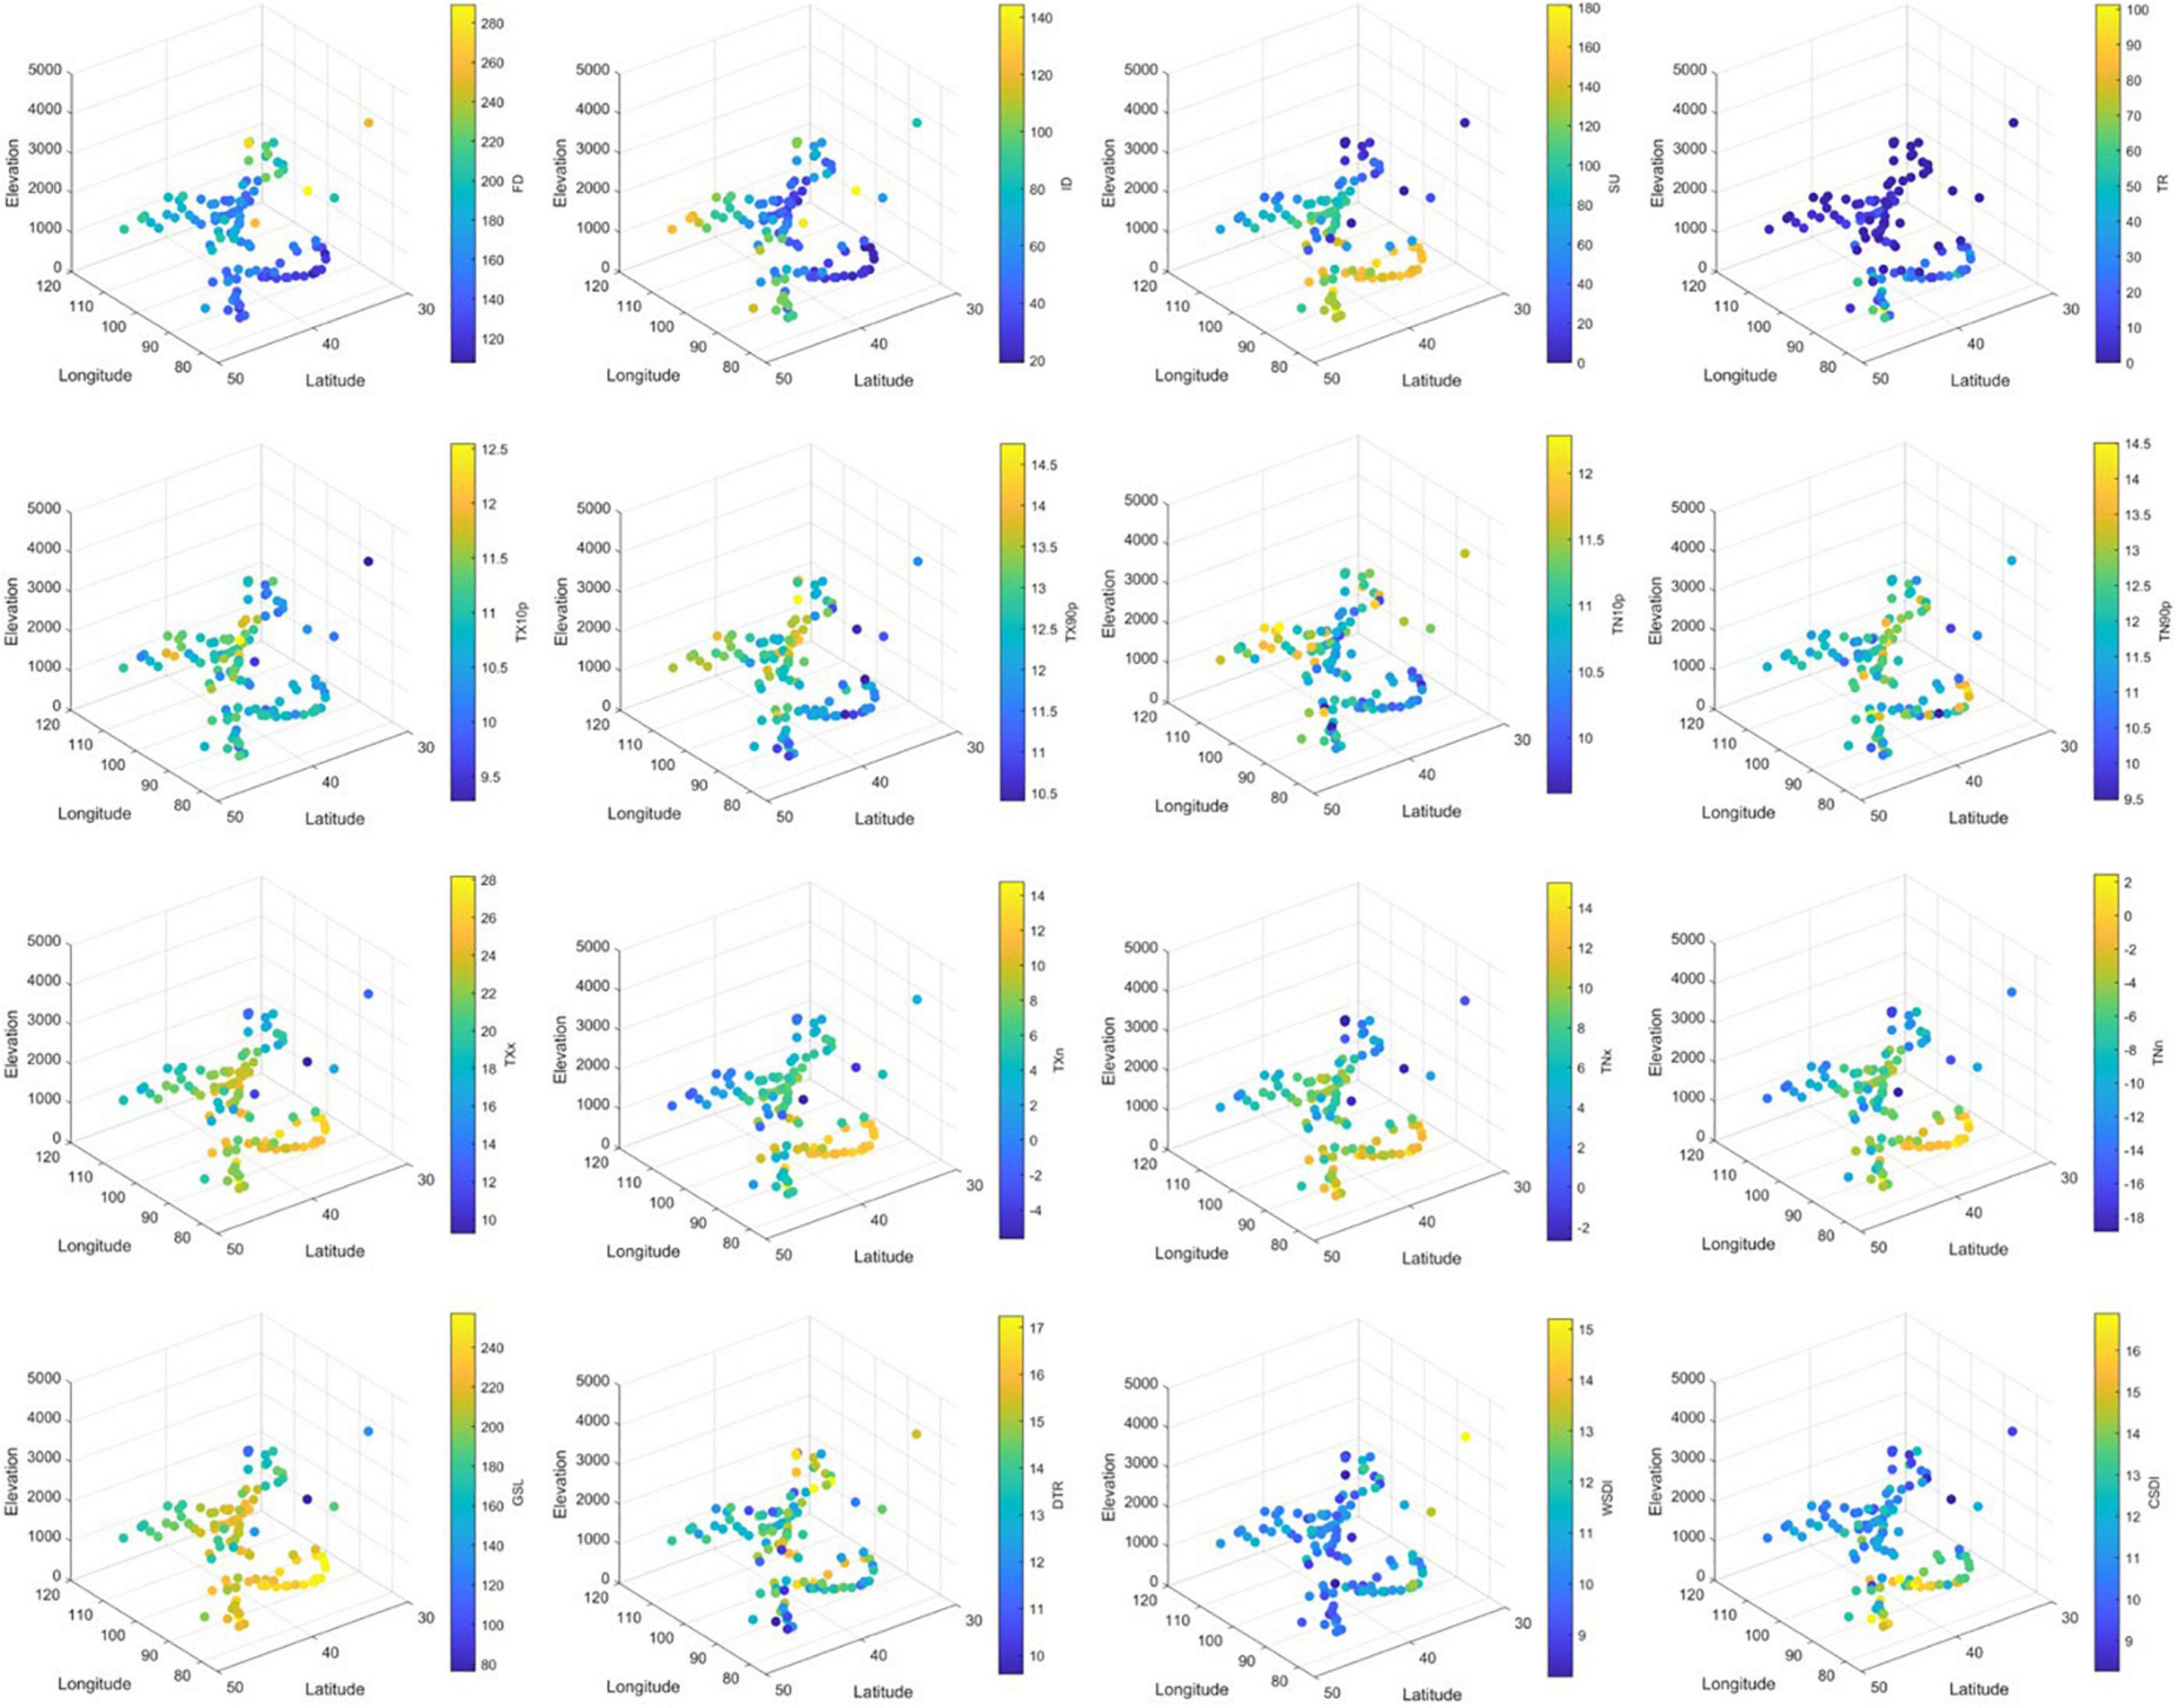
Figure 6. Three-dimensional graph of extreme temperature indices and topographic factors. The indices are defined in Table 1.
Relationships between extreme precipitation events and geographical factors
In the present study, all precipitation indices had no significant correlations with latitude, except for a weak negative correlation with CWD (Table 5). However, all precipitation indices were significantly positively correlated with longitude, except for a significant negative correlation with the number of CDD, indicating that the extreme precipitation events become more common at higher longitude areas (Figure 7), mainly because in China, longitude represents the distance from warm and moist coastal areas, and therefore has an impact on regional climate change by influencing water and energy transportation between these areas and inland areas of China (Zhong et al., 2017). Areas with higher longitudes showed higher frequency and intensity of precipitation because they were closer to coastal areas. Similarly, warming trends and increasing precipitation has become more significant in coastal areas of the northeastern United States than in inland areas (Brown et al., 2010). In addition, all precipitation indices were positively correlated with altitude, although the correlation was only significant for CWD, and the number of CDD was negatively correlated with elevation, although the correlation was not significant.
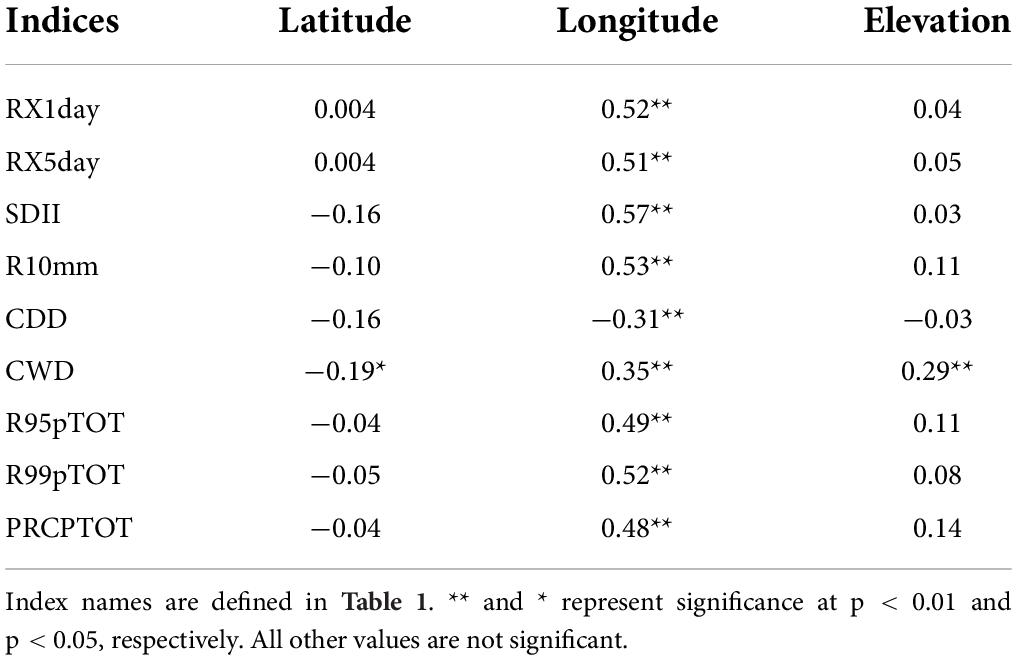
Table 5. Correlations (Pearson’s r) between precipitation extremes from 1960 to 2016 and the latitude, longitude, and elevation of the measurement sites in the arid regions of China.
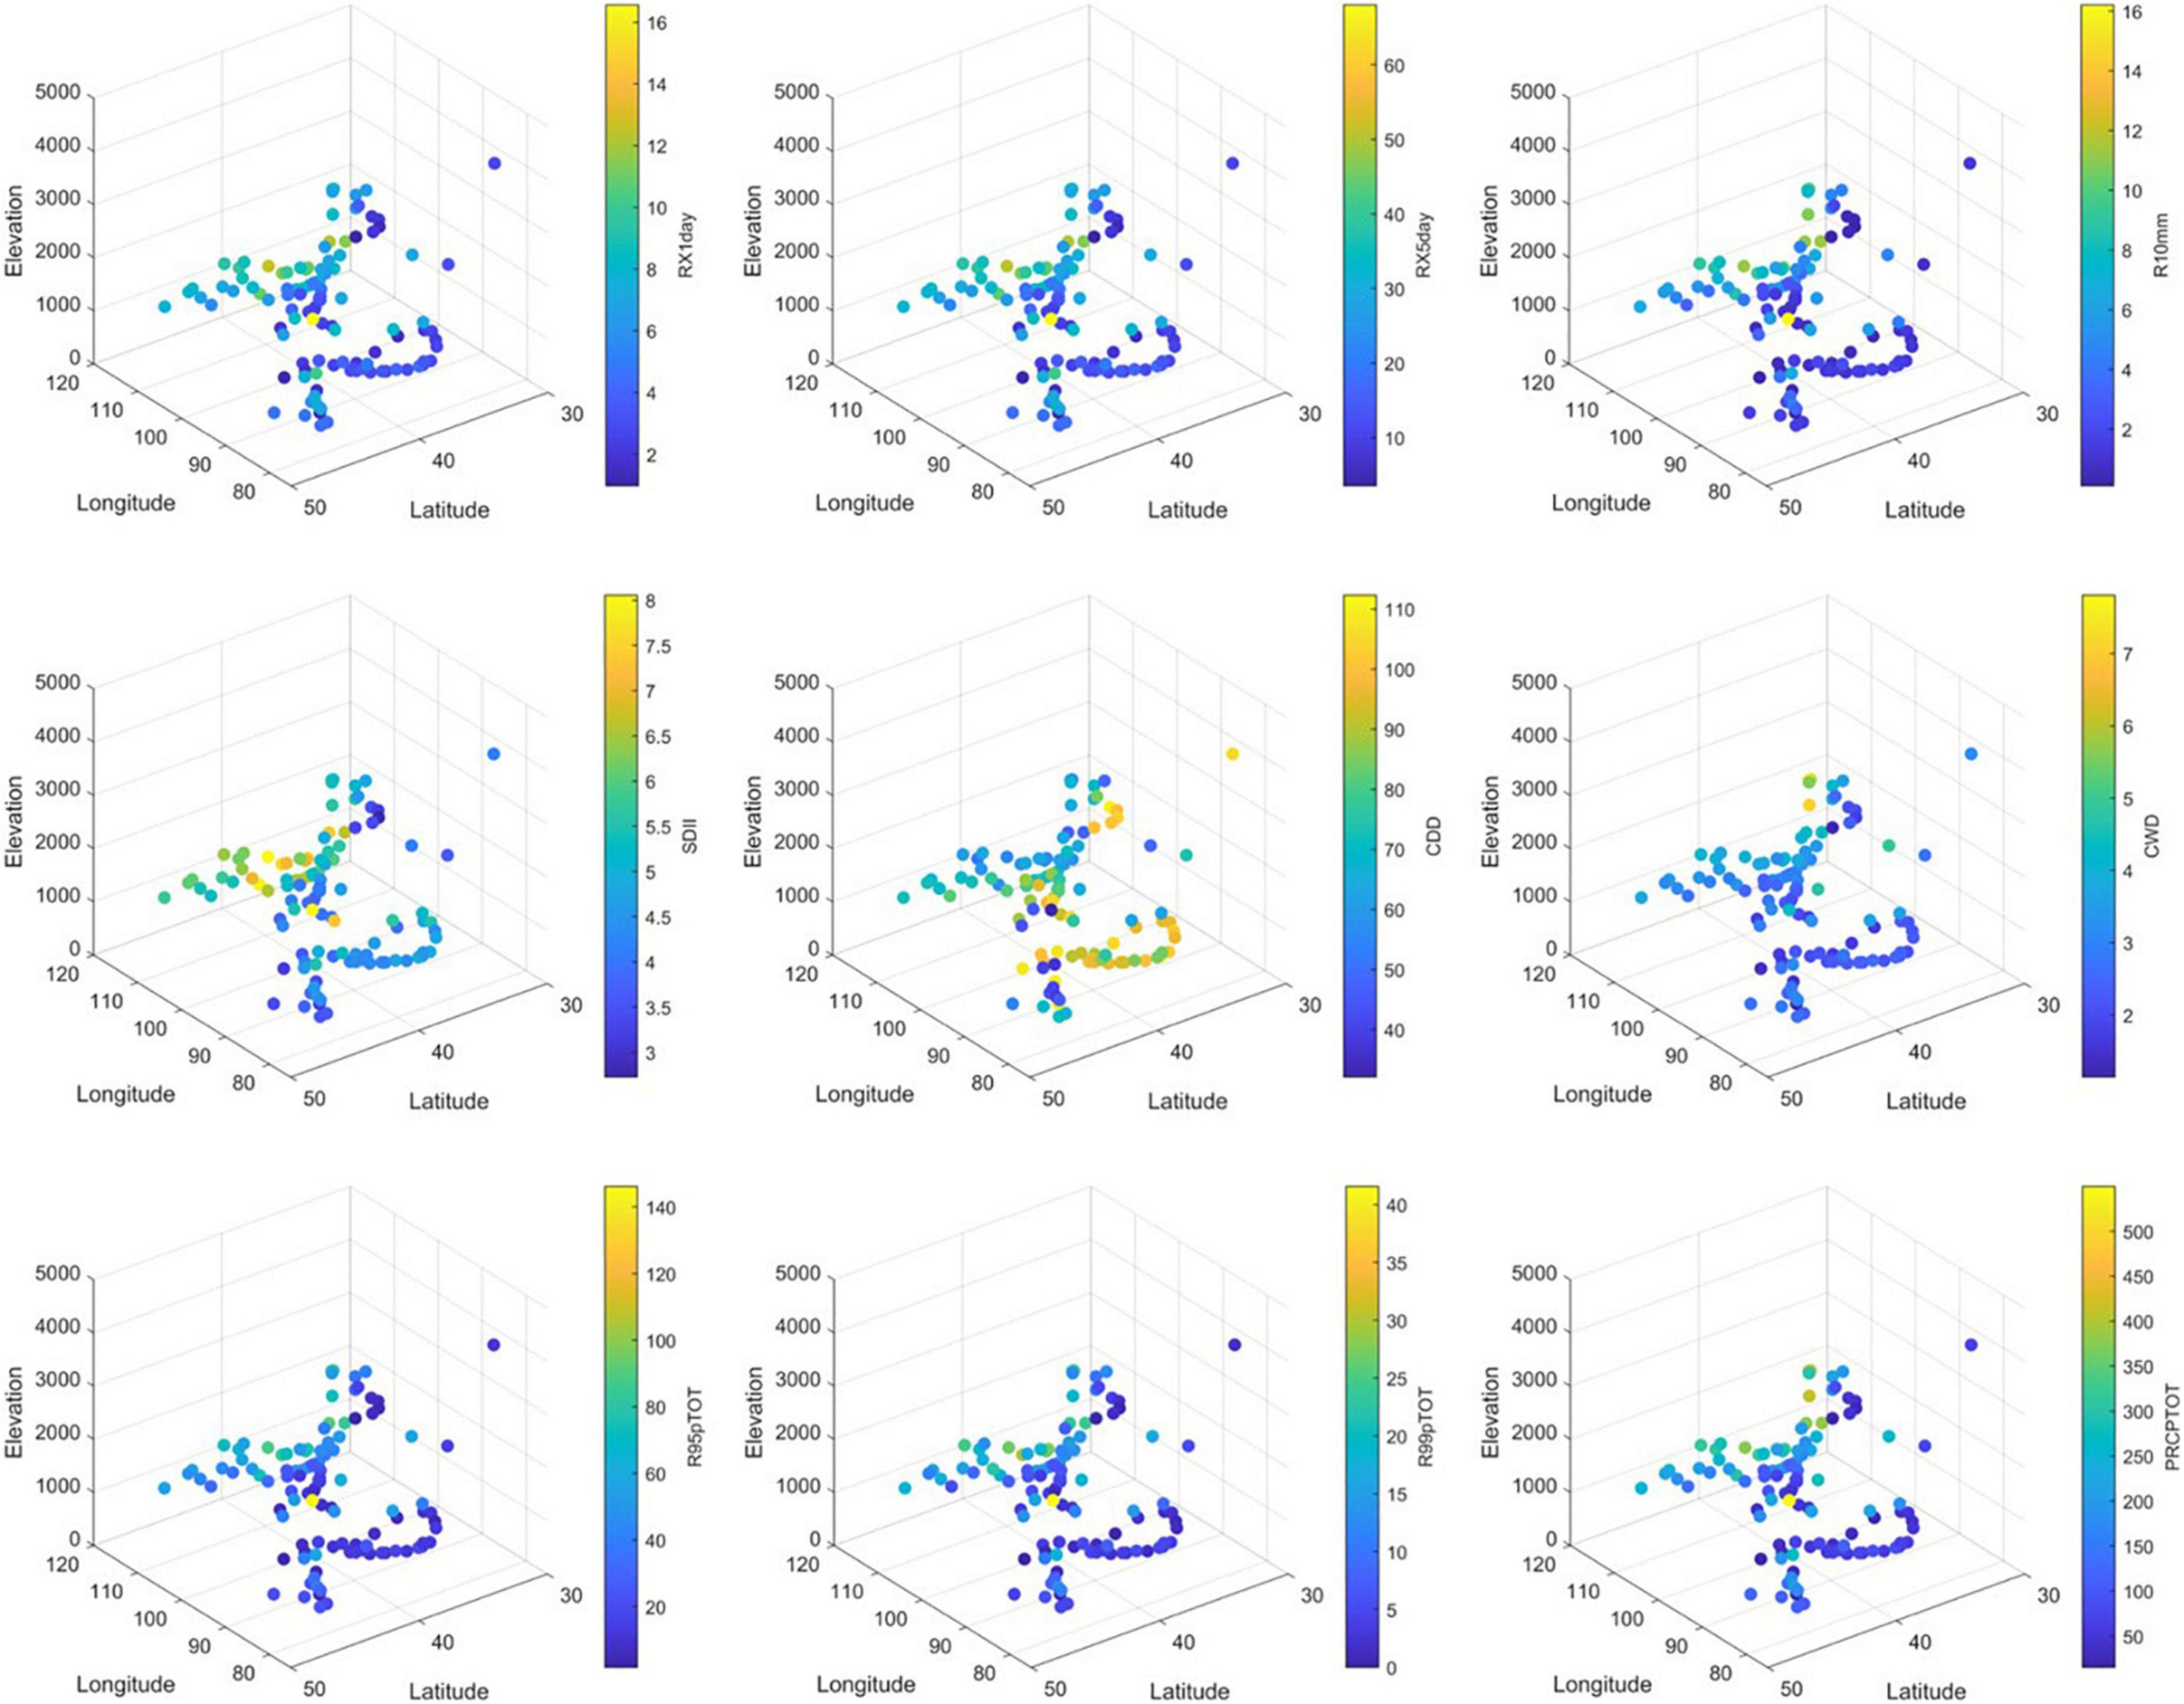
Figure 7. Three-dimensional graph of extreme precipitation indices and topographic factors. The indices are defined in Table 1.
Conclusion
The temperature indices’ change trends in China’s arid regions agreed with the expected results under global warming. The cold indices, which include the number of FD, ID, cool days, cool nights, and CSDI decreased significantly. In contrast, the warmth indices, which include the numbers of SU, TR, warm days, warm nights, and WSDI increased significantly during 1960 to 2016. The warmest day, warmest night, coldest day, and coldest night also increased significantly during the same period. The DTR and GSL showed significant decreasing and increasing trends, respectively. Furthermore, the cold extreme temperature events increased with increasing latitude, whereas the warm extreme temperature events decreased. The warm temperature events decreased at high elevations, whereas cold temperature events increased, and the GSL was shorter at high elevations. The total annual precipitation and the intensity and frequency of extreme precipitation events in arid regions of China have increased since 1960, except for the number of CDD (which decreased) and number of CWD (which showed no significant trend). Longitude was the main factor that affected the spatial variability of extreme precipitation in the region.
Because of the clear trends that we observed, it will be important to continue monitoring temperatures and precipitation in arid China to help planners account for the ongoing trends. This would be easier if more meteorological stations can be installed in areas where the climate is changing rapidly but stations are currently sparsely distributed (e.g., the Qinghai–Tibet Plateau).
Data availability statement
The original contributions presented in this study are included in the article/Supplementary material, further inquiries can be directed to the corresponding author.
Author contributions
YL proposed the general idea of the manuscript. XW conceived and designed the experiments, data processing, analysis and interpretation, and wrote the manuscript. MY and XG gave the resources. All authors contributed to the article and approved the submitted version.
Funding
This research was supported by the Second Tibetan Plateau Scientific Expedition and Research (STEP) program (Grant No. 2019QZKK0305), the National Key R and D Program of China (Grant No. 2017YFA0604803), the National Natural Science Foundation of China (Grant Nos. 31971466 and 32001214), and the Open Fund of Key Laboratory of Desert and Desertification, Chinese Academy of Sciences (Grant No. KLDD-2020-008).
Conflict of interest
The authors declare that the research was conducted in the absence of any commercial or financial relationships that could be construed as a potential conflict of interest.
Publisher’s note
All claims expressed in this article are solely those of the authors and do not necessarily represent those of their affiliated organizations, or those of the publisher, the editors and the reviewers. Any product that may be evaluated in this article, or claim that may be made by its manufacturer, is not guaranteed or endorsed by the publisher.
Supplementary material
The Supplementary Material for this article can be found online at: https://www.frontiersin.org/articles/10.3389/fevo.2022.902813/full#supplementary-material
SUPPLEMENTARY FIGURE 1 | Spatial distribution of mean annual temperature in the arid areas of China.
SUPPLEMENTARY FIGURE 2 | Spatial distribution of annual precipitation in the arid areas of China.
Footnotes
- ^ http://www.resdc.cn/DOI
- ^ http://data.cma.cn
- ^ http://etccdi.pacificclimate.org/software.shtml
- ^ http://etccdi.pacificclimate.org/index.shtml
- ^ https://ww2.mathworks.cn/products/matlab.html
- ^ http://www.esri.com
References
Aguilar, E., Peterson, T. C., Ramírez Obando, P., Frutos, R., Retana, J. A., Solera, M., et al. (2005). Changes in precipitation and temperature extremes in Central America and northern South America, 1961–2003. J. Geophys. Res. 110:D23107. doi: 10.1029/2005JD006119
Alexander, L. V., Zhang, X., Peterson, T. C., Caesar, J., Gleason, B., Klein Tank, A. M. G., et al. (2006). Global observed changes in daily climate extremes of temperature and precipitation. J. Geophys. Res. 111:D05109. doi: 10.1029/2005JD006290
Alsarmi, S. H., and Washington, R. (2014). Changes in climate extremes in the Arabian Peninsula: analysis of daily data. Int. J. Climatol. 34, 1329–1345. doi: 10.1002/joc.3772
Bocheva, L., Marinova, T., Simeonov, P., and Gospodinov, I. (2009). Variability and trends of extreme precipitation events over Bulgaria (1961-2005). Atmos. Res. 93, 490–497. doi: 10.1016/j.atmosres.2008.10.025
Brown, P. J., Bradley, R. S., and Keimig, F. T. (2010). Changes in extreme climate indices for the northeastern United States, 1870–2005. J. Clim. 23, 6555–6572. doi: 10.1175/2010JCLI3363.1
Cerveny, R., and Balling, R. (1998). Weekly cycles of air pollutants, precipitation and tropical cyclones in the coastal NW Atlantic region. Nature 394, 561–563. doi: 10.1038/29043
Croitoru, A. E., and Piticar, A. (2013). Changes in daily extreme temperatures in the extra-Carpathians regions of Romania. Int. J. Climatol. 33, 1987–2001. doi: 10.1002/joc.3567
Dike, V. N., Lin, Z., and Ibe, C. C. (2020). Intensification of summer rainfall extremes over Nigeria during recent decades. Atmosphere 11:1084. doi: 10.3390/atmos11101084
Dos Santos, C. A. C., Neale, C. M. U., Rao, T. V. R., and da Silva, B. B. (2011). Trends in indices for extremes in daily temperature and precipitation over Utah, USA. Int. J. Climatol. 31, 1813–1822.
Easterling, D. R., Horton, B., Jones, P. D., Peterson, T. C., Karl, T. R., Parker, D. E., et al. (1997). Maximum and minimum temperature trends for the globe. Science 18, 364–367. doi: 10.1126/science.277.5324.364
Easterling, D., Evans, J. L., Groisman, P., Karl, T. R., and Ambenje, P. (2000a). Observed variability and trends in extreme climate events: a brief review. Bull. Am. Meteorol. Soc. 81, 417–425.
Easterling, D., Meehl, G., Parmesan, C., Changnon, S. A., Karl, T. R., and Mearns, L. O. (2000b). Climate extremes: observations, modeling, and impacts. Science 289, 2068–2074. doi: 10.1126/science.289.5487.2068
Filahi, S., Tanarhte, M., Mouhir, L., El Morhit, M., and Tramblay, Y. (2016). Trends in indices of daily temperature and precipitations extremes in Morocco. Theor. Appl. Climatol. 124, 959–972. doi: 10.1007/s00704-015-1472-4
Filippo, G., Hurrell, J. W., Marinucci, M. R., and Beniston, M. (1997). Elevation dependency of the surface climate change signal: a model study. J. Clim. 10, 288–296. doi: 10.1175/1520-0442(1997)010<0288:EDOTSC>2.0.CO;2
Forster, P. M., and Solomon, S. (2003). Observation s of a “weekend effect” in diurnal temperature range. Proc. Natl. Acad. Sci. U.S.A. 100, 11225–11230. doi: 10.1073/pnas.2034034100
Frich, P., Alexander, L. V., Della-Marta, P., Gleason, B., Haylock, M., Klein Tank, A. M. G., et al. (2002). Observed coherent changes in climatic extremes during the second half of the twentieth century. Clim. Res. 19, 193–212. doi: 10.3354/cr019193
Fyfe, J. C., and Flato, G. M. (1999). Enhanced climate change and its detection over the Rocky Mountains. J. Clim. 12, 230–243. doi: 10.1175/1520-0442-12.1.230
Gbode, I. E., Adeyeri, O. E., Menang, K. P., Intsiful, J. D. K., Vincent, A., Omotosho, J. A., et al. (2019). Observed changes in climate extremes in Nigeria. Meteorol. Appl. 26, 642–654. doi: 10.1002/met.1791
Goswami, B. N., Venugopal, V., Sengupta, D., Madhusoodan, M. S., and Xavier, P. K. (2006). Increasing trend of extreme rain events over India in a warming environment. Science 314, 1442–1445. doi: 10.1126/science.1132027
Griffiths, G. M., Chambers, L. E., Haylock, M. R., Manton, M. J., Nicholls, N., Baek, H. J., et al. (2005). Change in mean temperature as a predictor of extreme temperature change in the Asia-Pacific region. Int. J. Climatol. 25, 1301–1330. doi: 10.1002/joc.1194
Griffiths, M. L., and Bradley, R. S. (2007). Variations of twentieth-century temperature and precipitation extreme indicators in the Northeast United States. J. Clim. 20, 5401–5417. doi: 10.1103/PhysRevB.71.224119
Guan, Y., Zhang, X., Zheng, F., and Wang, B. (2015). Trends and variability of daily temperature extremes during 1960-2012 in the Yangtze River Basin, China. Glob. Planet. Change 124, 79–94. doi: 10.1016/j.gloplacha.2014.11.008
Hamed, K. H., and Rao, A. R. (1998). A modified Mann-Kendall trend test for autocorrelated data. J. Hydrol. 204, 182–196. doi: 10.1016/S0022-1694(97)00125-X
Haylock, M. R., Hofstra, N., Klein Tank, A. M. G., Klok, E. J., Jones, P. D., and New, M. G. (2008). A European daily high-resolution gridded data set of surface temperature and precipitation for 1950-2006. J. Geophys. Res. 113:D20119. doi: 10.1029/2008JD010201
Haylock, M. R., Peterson, T. C., Alves, L. M., Ambrizzi, T., Anunciação, Y. M. T., Baez, J., et al. (2006). Trends in total and extreme South American rainfall 1960-2000 and links with sea surface temperature. J. Clim. 19, 1490–1512. doi: 10.1175/JCLI3695.1
Houghton, J. T., Ding, Y., Griggs, D. J., Noguer, M., Linden, P. J., Dai, X., et al. (2001). “Observed climate variability and change,” in Contribution of Working Group I to the third Assessment Report of the Intergovernmental Panel on Climate Change, Climate Change 2001: The Science of Climate Change, (Cambridge: Cambridge University Press), 156–159.
Hu, Z., Li, Q., Chen, X., Teng, Z., Chen, C., Yin, G., et al. (2015). Climate changes in temperature and precipitation extremes in an alpine grassland of Central Asia. Theor. Appl. Climatol. 126, 519–531. doi: 10.1007/s00704-015-1568-x
IPCC (2012). “Summary for Policy makers,” in Managing the Risks of Extreme Events and Disasters to Advance Climate Change Adaptation. (A Special Report of Working Groups I and II of the Intergovernmental Panel on Climate Change), eds C. B. Field, V. Barros, T. F. Stocker, D. Qin, D. J. Dokken, K. L. Ebi, et al. (Cambridge: Cambridge University Press).
Iwashima, T., and Yamamoto, R. (1993). A statistical analysis of the extreme event: long-term trend of heavy daily precipitation. J. Meteorol. Soc. Jpn. 71, 637–640. doi: 10.2151/jmsj1965.71.5_637
Karl, T. R., Knight, R. W., and Plummer, N. (1995). Trends in high-frequency climate variability in the twentieth century. Nature 377, 217–220. doi: 10.1038/377217a0
Karl, T. R., Knight, R. W., Easterling, D. R., and Quayle, R. G. (1996). Indices of climate change for the United States. Bull. Am. Meteorol. Soc. 77, 279–292. doi: 10.1175/1520-0477(1996)077<0279:IOCCFT>2.0.CO;2
Keggenhoff, I., Elizbarashvili, M., Amiri-Farahani, A., and King, L. (2014). Trends in daily temperature and precipitation extremes over Georgia, 1971-2010. Weather Clim. Extremes 4, 75–85. doi: 10.1016/j.wace.2014.05.001
Kendall, M. G. (1990). Rank correlation methods. Br. J. Psychol. 25, 86–91. doi: 10.1111/j.2044-8295.1934.tb00727.x
Kiktev, D., Sexton, D. M. H., Alexander, L., and Folland, C. K. (2003). Comparison of modeled and observed trends in indices of daily climate extremes. J. Clim. 16, 560–571. doi: 10.1175/1520-0442(2003)016<3560:COMAOT>2.0.CO;2
Klein Tank, A. M. G., and Können, G. P. (2003). Trends in indices of daily temperature and precipitation extremes in Europe, 1946-99. J. Clim. 16, 3665–3680. doi: 10.1175/1520-0442(2003)016<3665:TIIODT>2.0.CO;2
Klein Tank, A. M. G., Peterson, T. C., Quadir, D. A., Dorji, S., Zou, X., Tang, H., et al. (2006). Changes in daily temperature and precipitation extremes in central and south Asia. J. Geophys. Res. 111:D16105. doi: 10.1029/2005JD006316
Li, B., Chen, Y., Shi, X., Chen, Z., and Li, W. (2013). Temperature and precipitation changes in different environments in the arid region of northwest China. Theor. Appl. Climatol. 112, 589–596. doi: 10.1007/s00704-012-0753-4
Li, Q., Chen, Y., Shen, Y., Li, X., and Xu, J. (2011). Spatial and temporal trends of climate change in Xinjiang, China. J. Geogr. Sci. 21, 1007–1018. doi: 10.1007/s11442-011-0896-8
Li, Y., He, D., Hu, J., and Cao, J. (2015). Variability of extreme precipitation over Yunnan Province, China 1960-2012. Int. J. Climatol. 35, 245–258. doi: 10.1002/joc.3977
Li, Z. X., He, Y. Q., Wang, C. F., Wang, X. F., Xin, H. J., Zhang, W., et al. (2011). Spatial and temporal trends of temperature and precipitation during 1960-2008 at the Hengduan Mountains, China. Quat. Int. 236, 127–142. doi: 10.1016/j.quaint.2010.05.017
Li, Z., He, Y., Wang, P., Theakstone, W. H., An, W., Wang, X. F., et al. (2012). Changes of daily climate extremes in southwestern China during 1961-2008. Glob. Planet. Change 80, 255–272. doi: 10.1016/j.gloplacha.2011.06.008
Liebmann, B., Vera, C. S., Caevalho, L. M. V., Camilloni, I. A., Hoerling, M. P., Allured, D., et al. (2004). An observed trend in central South American precipitation. J. Clim. 17, 4357–4367. doi: 10.1175/3205.1
Liu, C., Li, Y., Ji, X., Luo, X., and Zhu, M. (2019). Observed changes in temperature and precipitation extremes over the Yarlung Tsangpo River Basin during 1970-2017. Atmosphere 10:815. doi: 10.3390/atmos10120815
Lu, H., Chen, S., Guo, Y., He, H., and Xu, S. (2014). Spatio-temporal variation characteristics of extremely heavy precipitation frequency over South China in the last 50 years. J. Trop. Meteorol. 20, 279–288. doi: 10.16555/j.1006-8775.2014.03.010
Luo, M., Ning, G., Xu, F., Wang, S., Liu, Z., and Yang, Y. (2020). Observed heatwave changes in arid northwest China: physical mechanism and long-term trend. Atmos. Res. 242:105009. doi: 10.1016/j.atmosres.2020.105009
Lupikasza, E. (2009). Spatial and temporal variability of extreme precipitation in Poland in the period 1951-2006. Int. J. Climatol. 30, 991–1007. doi: 10.1002/joc.1950
Manton, M. J., Della-Marta, P. M., and Haylock, M. R. (2001). Trends in extreme daily rainfall and temperature in Southeast Asia and the South Pacific: 1961-1998. Int. J. Climatol. 21, 269–284. doi: 10.1002/joc.610
Mason, S. J., Waylen, P. R., Mimmack, G. M., Rajaratnam, B., and Harrison, J. M. (1999). Changes in extreme rainfall events in South Africa. Clim. Change 41, 249–257. doi: 10.1023/A:1005450924499
McMichael, A., Woodruff, R., and Hales, S. (2006). Climate change and human health: present and future risks. Lancet 367, 859–869. doi: 10.1016/S0140-6736(06)68079-3
Mishra, V., Ganguly, A. R., Nijssen, B., and Lettenmaier, D. P. (2015). Changes in observed climate extremes in global urban areas. Environ. Res. Lett. 10:024005. doi: 10.1088/1748-9326/10/2/024005
Moberg, A., Jones, P. D., Lister, D., Walther, A., Alexander, L. V., Brunet, M., et al. (2006). Indices for daily temperature and precipitation extremes in Europe analysed for the period 1901-2000. J. Geophys. Res. 111:D22106. doi: 10.1029/2006JD007103
New, M., Hewitson, B., Stephenson, D. B., Tsiga, A., and Lajoie, R. (2006). Evidence of trends in daily climate extremes over southern and west Africa. J. Geophys. Res. Atmos. 111, 3007–3021. doi: 10.1029/2005JD006289
Ning, G., Luo, M., Zhang, Q., Wang, S., and Zeng, Z. (2021). Understanding the mechanisms of summer extreme precipitation events in Xinjiang of Arid Northwest China. J. Geophys. Res. Atmos. 126:e2020JD034111. doi: 10.1029/2020JD034111
Patz, J. A., Campbell-Lendrum, D., Holloway, T., and Foley, J. A. (2005). Impact of regional climate change on human health. Nature 438, 310–317. doi: 10.1038/nature04188
Powell, E. J., and Keim, B. D. (2015). Trends in daily temperature and precipitation extremes for the southeastern United States: 1948-2012. J. Clim. 28, 1592–1612. doi: 10.1175/JCLI-D-14-00410.1
Pryor, S. C., Howe, J. A., and Kunkel, K. E. (2009). How spatially coherent and statistically robust are temporal changes in extreme precipitation in the contiguous USA? Int. J. Climatol. 29, 31–45. doi: 10.1002/joc.1696
Revadekar, J. V., Hameed, S., Collins, D., Manton, M., Sheikh, M., Borgaonkar, H. P., et al. (2013). Impact of altitude and latitude on changes in temperature extremes over South Asia during 1971-2000. Int. J. Climatol. 33, 199–209. doi: 10.1002/joc.3418
Rodrigo, F. S. (2009). Changes in the probability of extreme daily precipitation observed from 1951 to 2002 in the Iberian Peninsula. Int. J. Climatol. 30, 1512–1525. doi: 10.1002/joc.1987
Rusticucci, M., and Barrucand, M. (2004). Observed trends and changes in temperature extremes over Argentina. J. Clim. 17, 4099–4107.
Seneviratne, S. I., Nicholls, N., Easterling, D., Goodess, C. M., Kanae, S., Kossin, J., et al. (2012). “Changes in climate extremes and their impacts on the natural physical environment,” in Managing the Risks of Extreme Events and Disasters to Advance Climate Change Adaptation, eds C. B. Field, V. Barros, T. F. Stocker, D. Qin, D. J. Dokken, K. L. Ebi, et al. (Cambridge: Cambridge University Press), 109–230.
Serreze, M. C., Walsh, J. E., Chapin, F. S., Osterkamp, T., Dyurgerov, M., Romanovsky, V., et al. (2000). Observational evidence of recent change in the northern high-latitude environment. Clim. Change 46, 159–207.
Shen, Y., Liu, C., Liu, M., Zeng, Y., and Tian, C. (2009). Change in pan evaporation over the past 50 years in the arid region of China. Hydrol. Process. 24, 225–231. doi: 10.1002/hyp.7435
Shi, Y., Shen, Y., Kang, E., Li, D., Ding, Y., Zhang, G., et al. (2007). Recent and future climate change in northwest China. Clim. Chang 80, 379–393. doi: 10.1007/s10584-006-9121-7
Siliverstovs, B., Otsch, R., Kemfert, C., Jaeger, C. C., Haas, A., and Kremers, H. (2010). Climate change and modeling of extreme temperatures in Switzerland. Stoch. Environ. Res. Risk Assess. 24, 311–326. doi: 10.1007/s00477-009-0321-3
Skansi, M., Brunet, M., Sigró, J., Aguilar, E., Arevalo Groening, J. A., Bentancur, O. J., et al. (2013). Warming and wetting signals emerging from analysis of changes in climate extreme indices over South America. Glob. Planet. Change 100, 295–307. doi: 10.1016/j.gloplacha.2012.11.004
Song, X., Song, S., Sun, W., Mu, X., Wang, S., Li, J., et al. (2015). Recent changes in extreme precipitation and drought over the Songhua River Basin, China, during 1960-2013. Atmos. Res. 157, 137–152. doi: 10.1016/j.atmosres.2015.01.022
Sun, W., Mu, X., Song, X., Wu, D., Cheng, A., and Qiu, B. (2016). Changes in extreme temperature and precipitation events in the Loess Plateau (China) during 1960-2013 under global warming. Atmos. Res. 168, 33–48. doi: 10.1016/j.atmosres.2015.09.001
Supari, T. F., Liew, J., and Aldrian, E. (2016). Observed changes in extreme temperature and precipitation over Indonesia. Int. J. Climatol. 37, 1979–1997.
Tabari, H., and Talaee, P. H. (2011). Analysis of trends in temperature data in arid and semi-arid regions of Iran. Glob. Planet. Change 79, 1–10. doi: 10.1016/j.gloplacha.2011.07.008
Thornton, P. K., Ericksen, P. J., Herrero, M., and Challinor, A. J. (2014). Climate variability and vulnerability to climate change: a review. Glob. Change Biol. 20, 3313–3328. doi: 10.1111/gcb.12581
Tromel, S., and Schonwiese, C. D. (2007). Probability change of extreme precipitation observed from 1901 to 2000 in Germany. Theor. Appl. Climatol. 87, 29–39. doi: 10.1007/s00704-005-0230-4
Wang, H., Chen, Y., and Chen, Z. (2013). Spatial distribution and temporal trends of mean precipitation and extremes in the arid region, northwest of China, during 1960-2010. Hydrol. Process. 27, 1807–1818. doi: 10.1002/hyp.9339
Wang, Q., Zhang, M., Wang, S., Ma, Q., and Sun, M. (2014). Changes in temperature extremes in the Yangtze River Basin, 1962-2011. J. Geogr. Sci. 24, 59–75. doi: 10.1007/s11442-014-1073-7
Wang, X. L., and Feng, Y. (2013). RHtestsV4 User Manual. Climate Research Division, Atmospheric Science and Technology Directorate, Science and Technology Branch, Environment Canada, Ontario, Canada. 28. Available online at: http://etccdi.pacificclimate.org/software.shtml (accessed October 20, 2020).
Wang, X. Y., Li, Y., Chen, Y., Lian, J., Luo, Y., Niu, Y., et al. (2018). Temporal and spatial variation of extreme temperatures in an agro-pastoral ecotone of northern China from 1960 to 2016. Sci. Rep. 8:8787. doi: 10.1038/s41598-018-27066-0
Wang, X. Y., Li, Y., Wang, M., Li, Y., Gong, X., Chen, Y. P., et al. (2020). Changes in daily extreme temperature and precipitation events in mainland China from 1960 to 2016 under global warming. Int. J. Climatol. 2020, 1–19. doi: 10.1002/joc.6865
Wang, Y., Yang, J., Chen, Y., Wang, A., and De Maeyer, P. (2018). The spatiotemporal response of soil moisture to precipitation and temperature changes in an arid region, China. Remote Sens. 10:468. doi: 10.3390/rs10030468
Xu, C., Li, J., Zhao, J., Gao, S., and Chen, Y. (2015). Climate variations in northern Xinjiang of China over the past 50 years under global warming. Quat. Int. 358, 83–92. doi: 10.1016/j.quaint.2014.10.025
Xu, L. G., Zhou, H., Li, D., Yao, H., and Wang, H. (2015). Precipitation trends and variability from 1950 to 2000 in arid lands of Central Asia. J. Arid Land 7, 514–526. doi: 10.1007/s40333-015-0045-9
Xu, X. L., and Zhang, Y. Q. (2017). China Meteorological Background Dataset. Data Registration and Publishing System of the Resource and Environmental Science Data Center of the Chinese Academy of Sciences. Beijing: Institute of Geographic Sciences and Natural Resources Research, CAS. doi: 10.12078/2017121301
Yan, H. M., Chen, W. N., Yang, F. X., Liu, J. Y., Hu, Y. F., and Ji, Y. Z. (2014). The spatial and temporal analysis of extreme climatic events in Inner Mongolia during the past 50 years. Geogr. Res. 33, 14–22.
You, Q., Kang, S., Aguilar, E., and Pepin, N. (2011). Changes in daily climate extremes in China and their connection to the large scale atmospheric circulation during 1961-2003. Clim. Dyn. 36, 2399–2417. doi: 10.1007/s00382-009-0735-0
Zhang, X., and Yang, F. (2004). RClimDex (1.0) User Guide. Downsview, ON: Climate Research Branch, Environment Canada.
Zhen, Y., and Li, X. (2014). Recent trends in daily temperature extremes over northeastern China (1960-2011). Quat. Int. 380–381, 35–48. doi: 10.1016/j.quaint.2014.09.010
Zhong, K., Zheng, F., Wu, H., Qin, C., and Xu, X. (2017). Dynamic changes in temperature extremes and their association with atmospheric circulation patterns in the Songhua River Basin, China. Atmos. Res. 190, 77–88. doi: 10.1016/j.atmosres.2017.02.012
Keywords: climate extreme indices, precipitation, temperature, climate trends, arid regions
Citation: Wang X, Li Y, Yan M and Gong X (2022) Changes in temperature and precipitation extremes in the arid regions of China during 1960–2016. Front. Ecol. Evol. 10:902813. doi: 10.3389/fevo.2022.902813
Received: 23 March 2022; Accepted: 11 July 2022;
Published: 27 July 2022.
Edited by:
Tomas Halenka, Charles University, CzechiaReviewed by:
Yuanjian Yang, Nanjing University of Information Science and Technology, ChinaHaijun Deng, Fujian Normal University, China
Guicai Ning, The Chinese University of Hong Kong, China
Copyright © 2022 Wang, Li, Yan and Gong. This is an open-access article distributed under the terms of the Creative Commons Attribution License (CC BY). The use, distribution or reproduction in other forums is permitted, provided the original author(s) and the copyright owner(s) are credited and that the original publication in this journal is cited, in accordance with accepted academic practice. No use, distribution or reproduction is permitted which does not comply with these terms.
*Correspondence: Yuqiang Li, bGl5cUBsemIuYWMuY24=