 Qiaoyun Wang1
 Pengfei Fan
 Lu Zhang
- 1State Key Laboratory of Biocontrol, School of Life Sciences, Sun Yat-sen University, Guangzhou, China
- 2School of Life Sciences, Sun Yat-sen University, Guangzhou, China
- 3Tangjiahe National Nature Reserve, Guangyuan, China
The diet of top predators is vital information needed to determine their ecological function and for their conservation management. However, the elusive habit and low population density of many predators constrains determination of their diets. While the morphological identification of scat contents is the traditional method, DNA metabarcoding has lately proven a more efficient and accurate method of identifying prey taxa. We applied DNA metabarcoding to analyzing the diet of the Eurasian otter (Lutra lutra), a top predator in freshwater ecosystems, using 12S and 16S rRNA mitochondrial primers target vertebrate prey. Diet did not vary among different data removal thresholds of 0.1, 1, 3, and 5%, comprising fishes (>90%), amphibians and birds (>2%), and occasionally mammals (<2%). Both 12S and 16S primers revealed similar otter diets, indicating that a single set of primers with a higher threshold is cost-effective for detecting the main prey taxa. Using 12S primers and a 5% threshold, we found no seasonal variation of otter diet in the Tangjiahe National Nature Reserve. A different prey community was found outside the reserve, which resulted in different prey composition for otters. However, prey taxon richness was not different between otters in- and outside the reserve. Otters preferred Schizothorax spp., the largest-sized fish species in the reserve, whereas they mainly preyed on Triplophysa bleekeri, a small-sized fish species, outside the reserve. Otters’ flexible feeding strategy reflect their high adaptability. However, greater human disturbance outside the reserve may present significant challenges to otters by altering prey communities and reducing prey profitability. Combining fecal DNA metabarcoding and local fish survey will provide opportunities for more detailed studies on the impact of different levels of human disturbances on prey communities and otters.
Introduction
Top predators are particularly important in ecosystems, providing key functions such as controlling food webs, facilitating nutrient cycling, and impeding species invasion (Hammerschlag et al., 2019). Knowledge of top predators’ diet is essential to evaluate their roles in ecosystems, the factors limiting their population persistence, and potential competition with coexisting carnivores (Ritchie et al., 2012; Hammerschlag et al., 2019). However, their elusive habit and low population density make direct observation on the feeding behaviors difficult. Consequently, the indirect analysis of scats is commonly used to assess predator diet (Klare et al., 2011; Monterroso et al., 2018; Shao et al., 2021b).
Morphological analysis of undigested remains in scats is the most common approach to obtain predators’ diets (Klare et al., 2011; Monterroso et al., 2018). However, this method is time-consuming, and results rely heavily on a professional knowledge of morphological classification (Weiskopf et al., 2016; Marcolin et al., 2020). Also, scats may be misidentified as belonging to sympatric species (Monterroso et al., 2018). In addition, it can be difficult to obtain an accurate prey list at species level through observation alone, especially for closely related prey taxa (Keller, 1998; Da Silva et al., 2019) and for those prey species without hard components that are preserved in scats.
The development of next-generation sequencing and DNA metabarcoding offers an efficient and accurate method of dietary analysis (Deagle et al., 2005, 2019; Pompanon et al., 2012). Using DNA metabarcoding allows identification of small or soft prey parts in scats, with more accurate taxonomic identification of both the predator and the prey (Monterroso et al., 2018). Thus, DNA metabarcoding improves our ability to examine predator-prey food webs (Shao et al., 2021b) and is an effective, noninvasive and economical method of determining the biodiversity contained in carnivore scats (Shao et al., 2021a).
DNA metabarcoding has its own shortfalls. For example, it cannot provide information on the size or life stage of prey taxa (Harper et al., 2020), and data quality largely depends on the accuracy and wide coverage of DNA reference databases (Nielsen et al., 2018; Traugott et al., 2020). Different primers may focus on different taxa and using a single universal primer influences what prey species can be identified by this method (Da Silva et al., 2019). Thus, multi-primer metabarcoding is required to reveal a complete diet (Da Silva et al., 2019; Quéméré et al., 2021). For predators that have relatively simple diets (e.g., snow leopard has 10 prey species; Weiskopf et al., 2016) a single primer may be sufficient to reveal their main prey taxa (Browett et al., 2021). Nevertheless, results from different primer sets need to be evaluated to determine a suitable primer set before conducting downstream dietary analyses. Applying a threshold to remove low-abundance reads is a trade-off between retaining as many prey reads as possible and discarding background noise from secondary predation, contamination, and sequencing errors (Deagle et al., 2019). Determining an appropriate threshold before running subsequent dietary analyses is critical to the success of the DNA metabarcoding method.
The Eurasian otter (Lutra lutra) is a top predator in freshwater ecosystems. It is a fish-specialist or an opportunistic predator according to prey availability (Almeida et al., 2012; Reid et al., 2013; Lanszki et al., 2016). Eurasian otters mainly prey on fish, followed by amphibians, reptiles, birds, and invertebrates (Kruuk, 2006; Lanszki et al., 2016). Their diet typically reflects the relative abundance of prey species in their habitat (Copp and Roche, 2003; Almeida et al., 2012). Analyses of otter diet have traditionally been based on morphological identification of undigested prey remains in spraints, usually at a higher taxonomic level than the prey species (Kruuk et al., 1994; Remonti et al., 2010; Reid et al., 2013). Recently, otter researchers have turned to DNA metabarcoding to obtain more accurate prey information, e.g., Eurasian otters (Thalinger et al., 2016; Hong et al., 2019; Kumari et al., 2019; Buglione et al., 2020; Harper et al., 2020; Marcolin et al., 2020; Jang-Liaw, 2021), and giant otters (Pteronura brasiliensis) (Quéméré et al., 2021). In China, the once widespread Eurasian otter populations declined nationwide between the 1950s and 1980s because they were widely harvested (Li and Chan, 2018). At present, they are mainly found in the upper reaches of the great rivers in western and northeastern China (Zhang et al., 2018). Their flexible habitat use requires the study of otters living in different regions and habitat types to ensure their conservation in China (Wang Q. Y. et al., 2021). However, there are few studies of otters in China, especially those concerning ecological traits and functions (Zhang et al., 2018; Wang Z. N. et al., 2021). To date there has been no study of the diet of Eurasian otters on mainland China.
We examine the diet of Eurasian otters in Tangjiahe National Nature Reserve in western China, using DNA metabarcoding. To amplify barcodes of a broad range of vertebrate prey, we developed two sets of universal vertebrate primers targeting mitochondrial DNA (mtDNA) 12S and 16S ribosomal RNA (rRNA). Using this case study, we evaluate the effectiveness of the two sets of primers for revealing prey taxon richness and composition from scats under different data filter thresholds. We compare otter diet and prey preference between seasons and in- and outside the reserve. Our study provides a cost-effective and relatively accurate approach to analyze predator diet, as well as basic dietary data of Eurasian otters in western China to inform their conservation and management.
Materials and Methods
Study Area and Field Survey
We collected otter spraints along the Qingzhu River (river width of 15 ± 1 m), which runs through Tangjiahe National Nature Reserve, locating in Qingxi Town, Guangyuan City, Sichuan Province in western China. It is a tributary of the Pailung River in the Yangtze River watershed. Elevation of our study area ranged from 800 to 1,900 m a.s.l. Mean annual temperature is ∼12°C and mean annual precipitation is ∼1,100 mm (Hu, 2005). The riparian vegetation is mixed evergreen and deciduous broadleaf forest. Field surveys were conducted in two seasons in 2019 (15th April–20th May, and 8th November–16th December). We surveyed 30 km of the Qingzhu River within the reserve and 20 km of the same river outside and downstream of the reserve, by walking along one side of the river and searching for otter spraints. A total of 78 spraints were collected in two seasons (37 were in spring in the reserve, 41 were in autumn along the full 50 km transect). Among these spraints, 64 were collected inside the reserve during over the two seasons while 14 were collected outside the reserve in autumn only. Each spraint was placed in a sterile centrifuge tube, submerged in 95% ethanol for 24 h and then dried with silica gel, and finally stored in −20°C.
We conducted prey surveys inside the reserve in both seasons over the 30 km river surveyed for spraints. Prey surveys were attempted along the 20 km reach of the river outside the reserve, but were abandoned due to a high loss rate of fishing traps. We set fishing traps (size: 32 cm × 24 cm × 5 m, mesh: 4 mm, entrance: 15 cm) with bread as bait (based on our pilot trapping studies comparing effects of different baits). A total of 120 fishing traps were set along the 30 km river, with at least 200 m apart between adjacent ones. Traps were placed from 900 to 1,500 h. We recorded the number and total mass of each captured prey species, as well as the body mass of five randomly selected individuals of each species, and then released them at their capture location. To build a local DNA reference database, we collected tissue samples of each prey species, e.g., fish fins and amphibian toes, from this survey and a pilot fish survey in 2018, in which we set traps in the river overnight to catch rare prey species.
DNA Extraction, Metabarcoding PCR, and Sequencing
We removed fishbone, scales and other solid objects from a spraint and mixed the remains thoroughly by manual stirring. We took 200 mg spraint powder into a 2 ml centrifugal tube for DNA extraction. Spraints were extracted using DNeasy Blood & Tissue Extraction Kit (QIAGEN, Germany), with a few modifications following a previous study (Jang-Liaw, 2021). Tissue samples were extracted using the same kit, following the standard kit protocol. Negative controls (blank extraction controls) were processed as a control for contamination during extraction.
We used two sets of newly-designed primers targeting ∼207 and 241 bp fragments of the mtDNA 12S and 16S genes of vertebrates (Table 1). Although there are commonly used universal vertebrate primers (e.g., 12SV5 from Riaz et al., 2011; MiFish from Miya et al., 2015), they are not efficient for all vertebrates in some cases. For example, Kelly et al. (2014) found that the 12SV5 primer could not detect all fish species from a dozen species in aquariums. To increase the detection of a more complete prey list for predators from scats, we designed new universal vertebrate primer sets. The primers were designed based on the whole mitochondrial genome sequences of nearly 800 species from different vertebrate families, covering all major taxonomic units in Vertebrata. The set of 12S primers consisted of two forward primers and one reverse primer. The two forward primers (F1 and F2) target the same fragment of 12S gene. We used two forward primers because F1 was less effective for a few reptiles. F2 differed several bases from F1 and could complement F1 for reptiles. In an unpublished paper1 we tested the efficiency of our universal primer sets based on in silico PCR, mock communities and environmental DNA samples. For in silico PCR evaluation, our 12S and 16S primers had 94 and 93% successful rates in amplifying 6,537 vertebrate species, based on complete mitochondrial genome sequences downloaded from NCBI Genbank. These results indicated a highly efficient amplification capability for our primers in all groups of vertebrates. Results from tests using mock communities and environmental DNA samples also proved that both sets of primers were effective in detecting all groups of vertebrates (details of design and validation of the primers could be found in see text footnote 1). When conducting PCRs, both F1 and F2 were added a half volume of the forward primer to get more comprehensive results. During PCRs, three replicates were amplified for each DNA sample. PCR amplifications were conducted in a total volume of 25 μl, comprising 0.1 μM each 12S/16S-F/R primers, 2.5 μl DNA loading buffer, 0.5 μl dNTPs, 0.25 μl TransTaq® HiFi DNA Polymerase, and 1 μl extracted DNA. The PCR thermal cycling conditions consisted of 30 s at 98°C, 35 cycles of 15 s at 98°C, 15 s at 50°C, 30 s at 72°C, and a final step of 10 min at 72°C. Negative controls were checked for contamination by using UltraPure™ DNase/RNase-Free Distilled Water (Thermo Fisher Scientific, cat. no 10977015) as template DNA. PCR products and negative controls were checked by agarose gel electrophoresis. Products of three PCR replicates were mixed and purified using Universal DNA Purification Kit (TIANGEN Biotech Co.). Following Feng et al. (2016), purified PCR product of each sample were quantified with a Nanodrop 2000 spectrophotometer (Thermo Fisher Scientific) and adjusted to equal concentration, and then were labeled with a unique 8-bp tag sequence. For each sequencing library, tag-linked products of 20–24 samples were pooled in equal volumes and were used for Illumina library preparation using NEBNext Ultra DNA Library Prep Kit (New England Biolabs Inc.). The library was sequenced on an Illumina HiSeq 2500 platform (Annoroad Gene Technology Co., Ltd, Beijing, China) using the paired-end 150-bp mode.
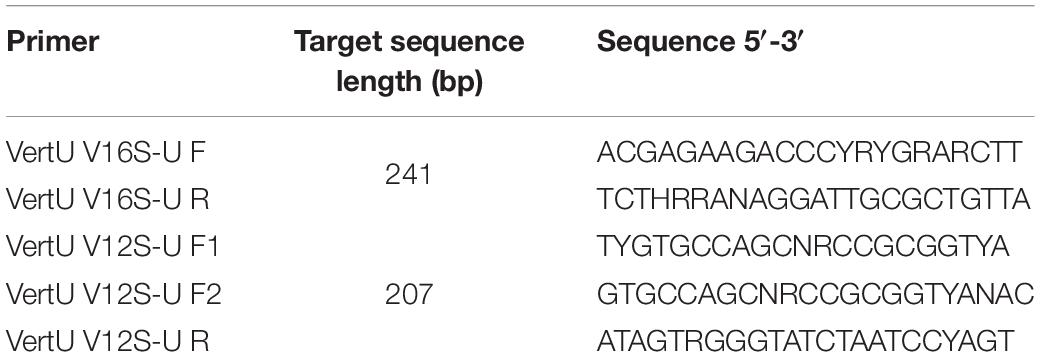
Table 1. PCR primer sets used to amplify 12S/16S fragments in this study.
Sequencing Data Analyses
Local Reference Database of Prey Barcodes
We amplified DNA extractions from tissue samples using the same 12S and 16S primers to build a local prey DNA database. We then Sanger sequenced these samples by both forward and reverse primers on an Applied Biosystems 3730XL DNA Analyzer [Sangon Biotech (Shanghai) Co., Ltd, Shanghai, China]. In total, we sequenced 17 distinct taxa, including 9 fishes, 5 amphibians and 3 mammals found in the Qingzhu River (Table 2). We also used vertebrate sequences with complete mitochondrial genome sequences obtained from NCBI nucleotide database, covering fishes, amphibians, reptiles, and mammals.
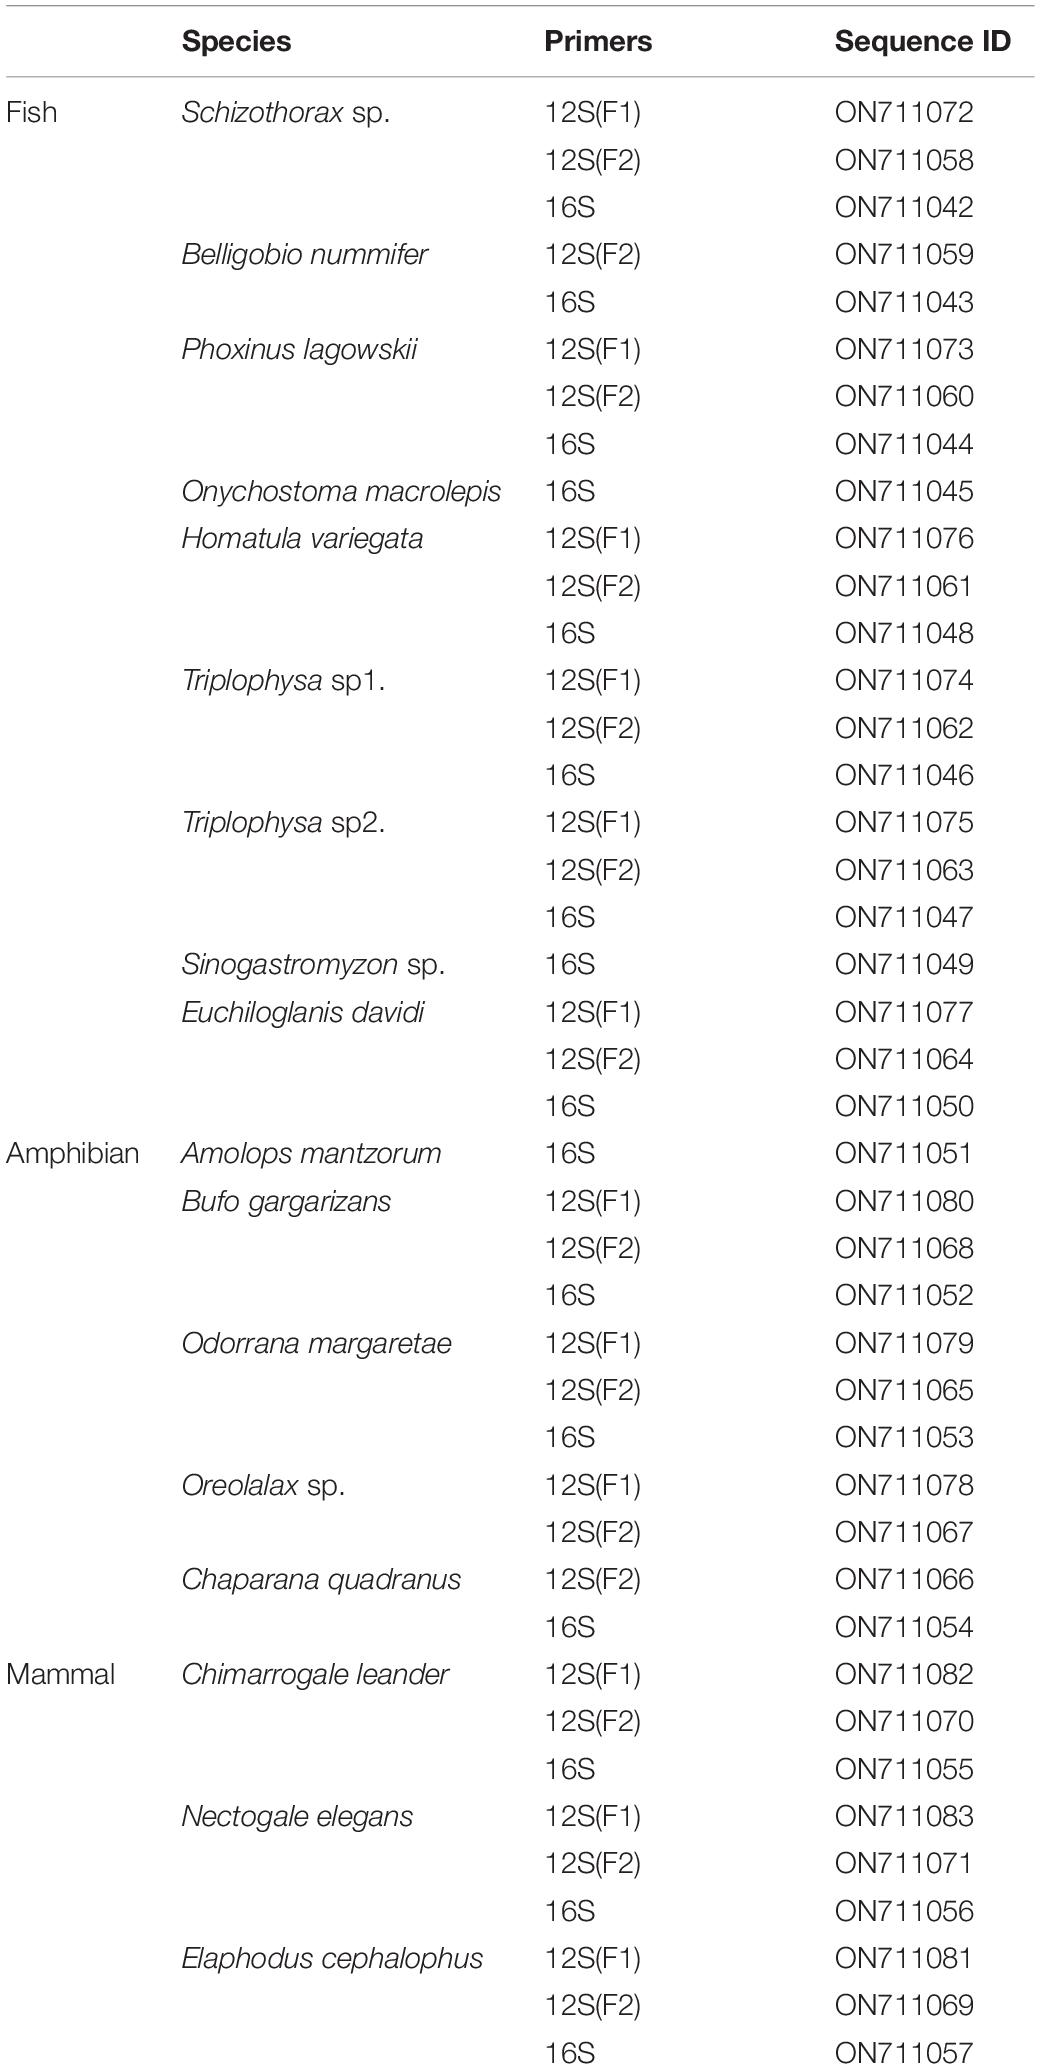
Table 2. A list of sequenced local taxa collected from the Qingzhu River.
Bioinformatics Processing of Metabarcoding Data
Sequenced reads were filtered to remove sequencing adapters and low-quality reads of sequencing quality below 5, using Trimmomatic (Bolger et al., 2014) and FastQC programs.2 Filtered reads were sorted to specific samples by their unique tag sequences using customed Python scripts (details could be found in see text footnote 1), and their primer sequences were trimmed. Trimmed reads were then merged using the software FLASH (Magoè and Salzberg, 2011) with a minimum overlap of 10 bp. The merged sequence reads were then dereplicated and clustered into molecular operational taxonomic units (MOTUs) using the program CD-hit (Fu et al., 2012), with a similarity of ≥98.5% among sequences. MOTUs with less than 10 reads were excluded in subsequent analyses.
We set a 0.1% threshold within a sample to remove reads that were fewer than the threshold or fewer than the count of sequences in the extraction blanks and PCR blanks of the same library (Xiong et al., 2017; Chang et al., 2019; Devloo-Delva et al., 2019). Automatic taxonomic assignments were compared with local DNA database and NCBI nucleotide database. We identified taxa using the following criteria. MOTUs with a best identity score ≥98% with either the local or NCBI databases were assigned to a species for a single matching result, or to a higher-level taxon that encompassed all matching species for multiple matching results. When the best identity score was ≥95% and <98%, we assigned the sequences to the taxonomic level that encompassed all matching species. We excluded sequences with <95% identity (which accounted for ∼0.8% of the total sequences) to increase the accuracy of the taxonomic assignments. Since all of our samples had sufficient sequencing depth and variation in sequencing depth among different samples would have no influence on our results and conclusions (Supplementary Table 1 and Supplementary Figure 1), we did not apply any normalization methods during data processing.
We identified the owner of the scat based on the proportion of predator reads in each sample (usually >30%). If only one predator was detected, the sample was assigned to this species. If multiple predators were present, the sample was assigned to the species with >90% of the total predator reads (Harper et al., 2020). Scats not identified to otters were excluded from subsequent analysis. We removed the sequences of species that are unlikely the otter prey, including humans, large mammals such as takin (Budorcas taxicolor) and wild boar (Sus scrofa), as well as carnivores such as Eurasian otters, Siberian weasels (Mustela sibirica), masked civet (Paguma larvata), domestic cat (Felis catus) and dog (Canis lupus familiaris).
Dietary Analyses
Comparison Between the 12S and 16S Primers and Among Different Data Filter Thresholds
We summarized otter diet composition using the relative read abundance (RRA, i.e., proportional summaries of counts) of each prey taxon in all spraint samples, a quantitative metric which is commonly used in molecular diet analysis (Harper et al., 2020; Shao et al., 2021b).
RRAi was calculated as:
where S is the number of samples, T is the number of prey MOTUs, ni,k is the number of sequences of prey item i in sample k. We did not use an occurrence-based metric (i.e., presence/absence of taxa) because it often overestimates low-frequency taxa (including potential contamination) in sequencing data, and is sensitive to the data filter threshold (Deagle et al., 2019). To compare efficiency and consistency of the 12S and 16S primer sets, we used four filtering thresholds (0.1, 1, 3, and 5%) (Drake et al., 2021). Under each filter threshold, we obtained prey taxon richness based on RRA using the vegan package (Oksanen et al., 2020) in R v4.0.4 (R Core Team, 2021). We then compared the prey taxon richness between the two sets of primers using a Wilcoxon’s signed ranks test. We assessed compositional differences in diets resulting from the 12S and 16S primers based on Bray–Curtis dissimilarity, using permutational multivariate analysis of variance (PERMANOVA) with 999 permutations, and visualized dissimilarity using non-metric multidimensional scaling (NMDS).
We also compared the taxon richness of otter diet among the four thresholds using a Kruskal–Wallis test. Prey composition under the different thresholds were compared using PERMANOVA with 999 permutations.
Diet Comparison Between Seasons and Sites
We compared taxon richness and composition of prey between the two seasons and in- and outside the reserve, based on RRA from the 12S primers under the 5% threshold, using Wilcoxon rank sum test and PERMANOVA with 999 permutations.
Prey Selection
To evaluate prey preference of otters we calculated Jacobs’ index D (Jacobs, 1974), which measures resource use relative to availability. We estimated the index at the genus level according to the prey RRA and the number of fish caught inside the reserve per season (Supplementary Tables 1, 2). Jacobs’ index D was calculated as follow:
where ri is the ratio of the RRA of prey item i to the sum of the RRA of all main prey taxa averaged across all samples obtained from DNA metabarcoding analyses, and pi is the percent of the number of prey item i out of the total number of all main prey taxa obtained from fishing trap surveys. Value of the index ranges from −1 (complete avoidance) to +1 (complete preference), and a value of 0 indicates no preference or avoidance.
Results
We successfully sequenced 75 samples and generated 8.7 Gb of sequence data. One of the 75 sequenced samples was from a Siberian weasel. The Illumina HiSeq sequencing on 74 otter spraints generated 10.1 million reads from 12S primers and 4.1 million reads from 16S primers. Among all sequences, 39.4% were from otters. Another 3.5% of sequences were those with less than 95% identified, with MOTUs <0.1% threshold, belong to Homo sapiens, or erroneous sequences from cross-contamination. The remaining 57.1% sequences were used in the subsequent analyses.
Comparison of Otter Diet Between the 12S and 16S Primer Sets and Among Different Filter Thresholds
With the filter threshold set at 0.1%, both the 12S and 16S primers revealed 32 prey taxa, with 29 taxa shared between them. The 35 identified prey taxa belonged to 22 genera and 12 families. A total of 26 taxa were identified to species level, 8 taxa to genus level, and 1 taxon to family level (Figure 1A). Fish were the most abundant prey (94.9% in 12S results and 93.8% in 16S results) in the otter diet, followed by amphibians (2.5 and 3.8%) and birds (2.2 and 2.1%), while mammals (0.4 and 0.3%) were found occasionally (Figure 1B).
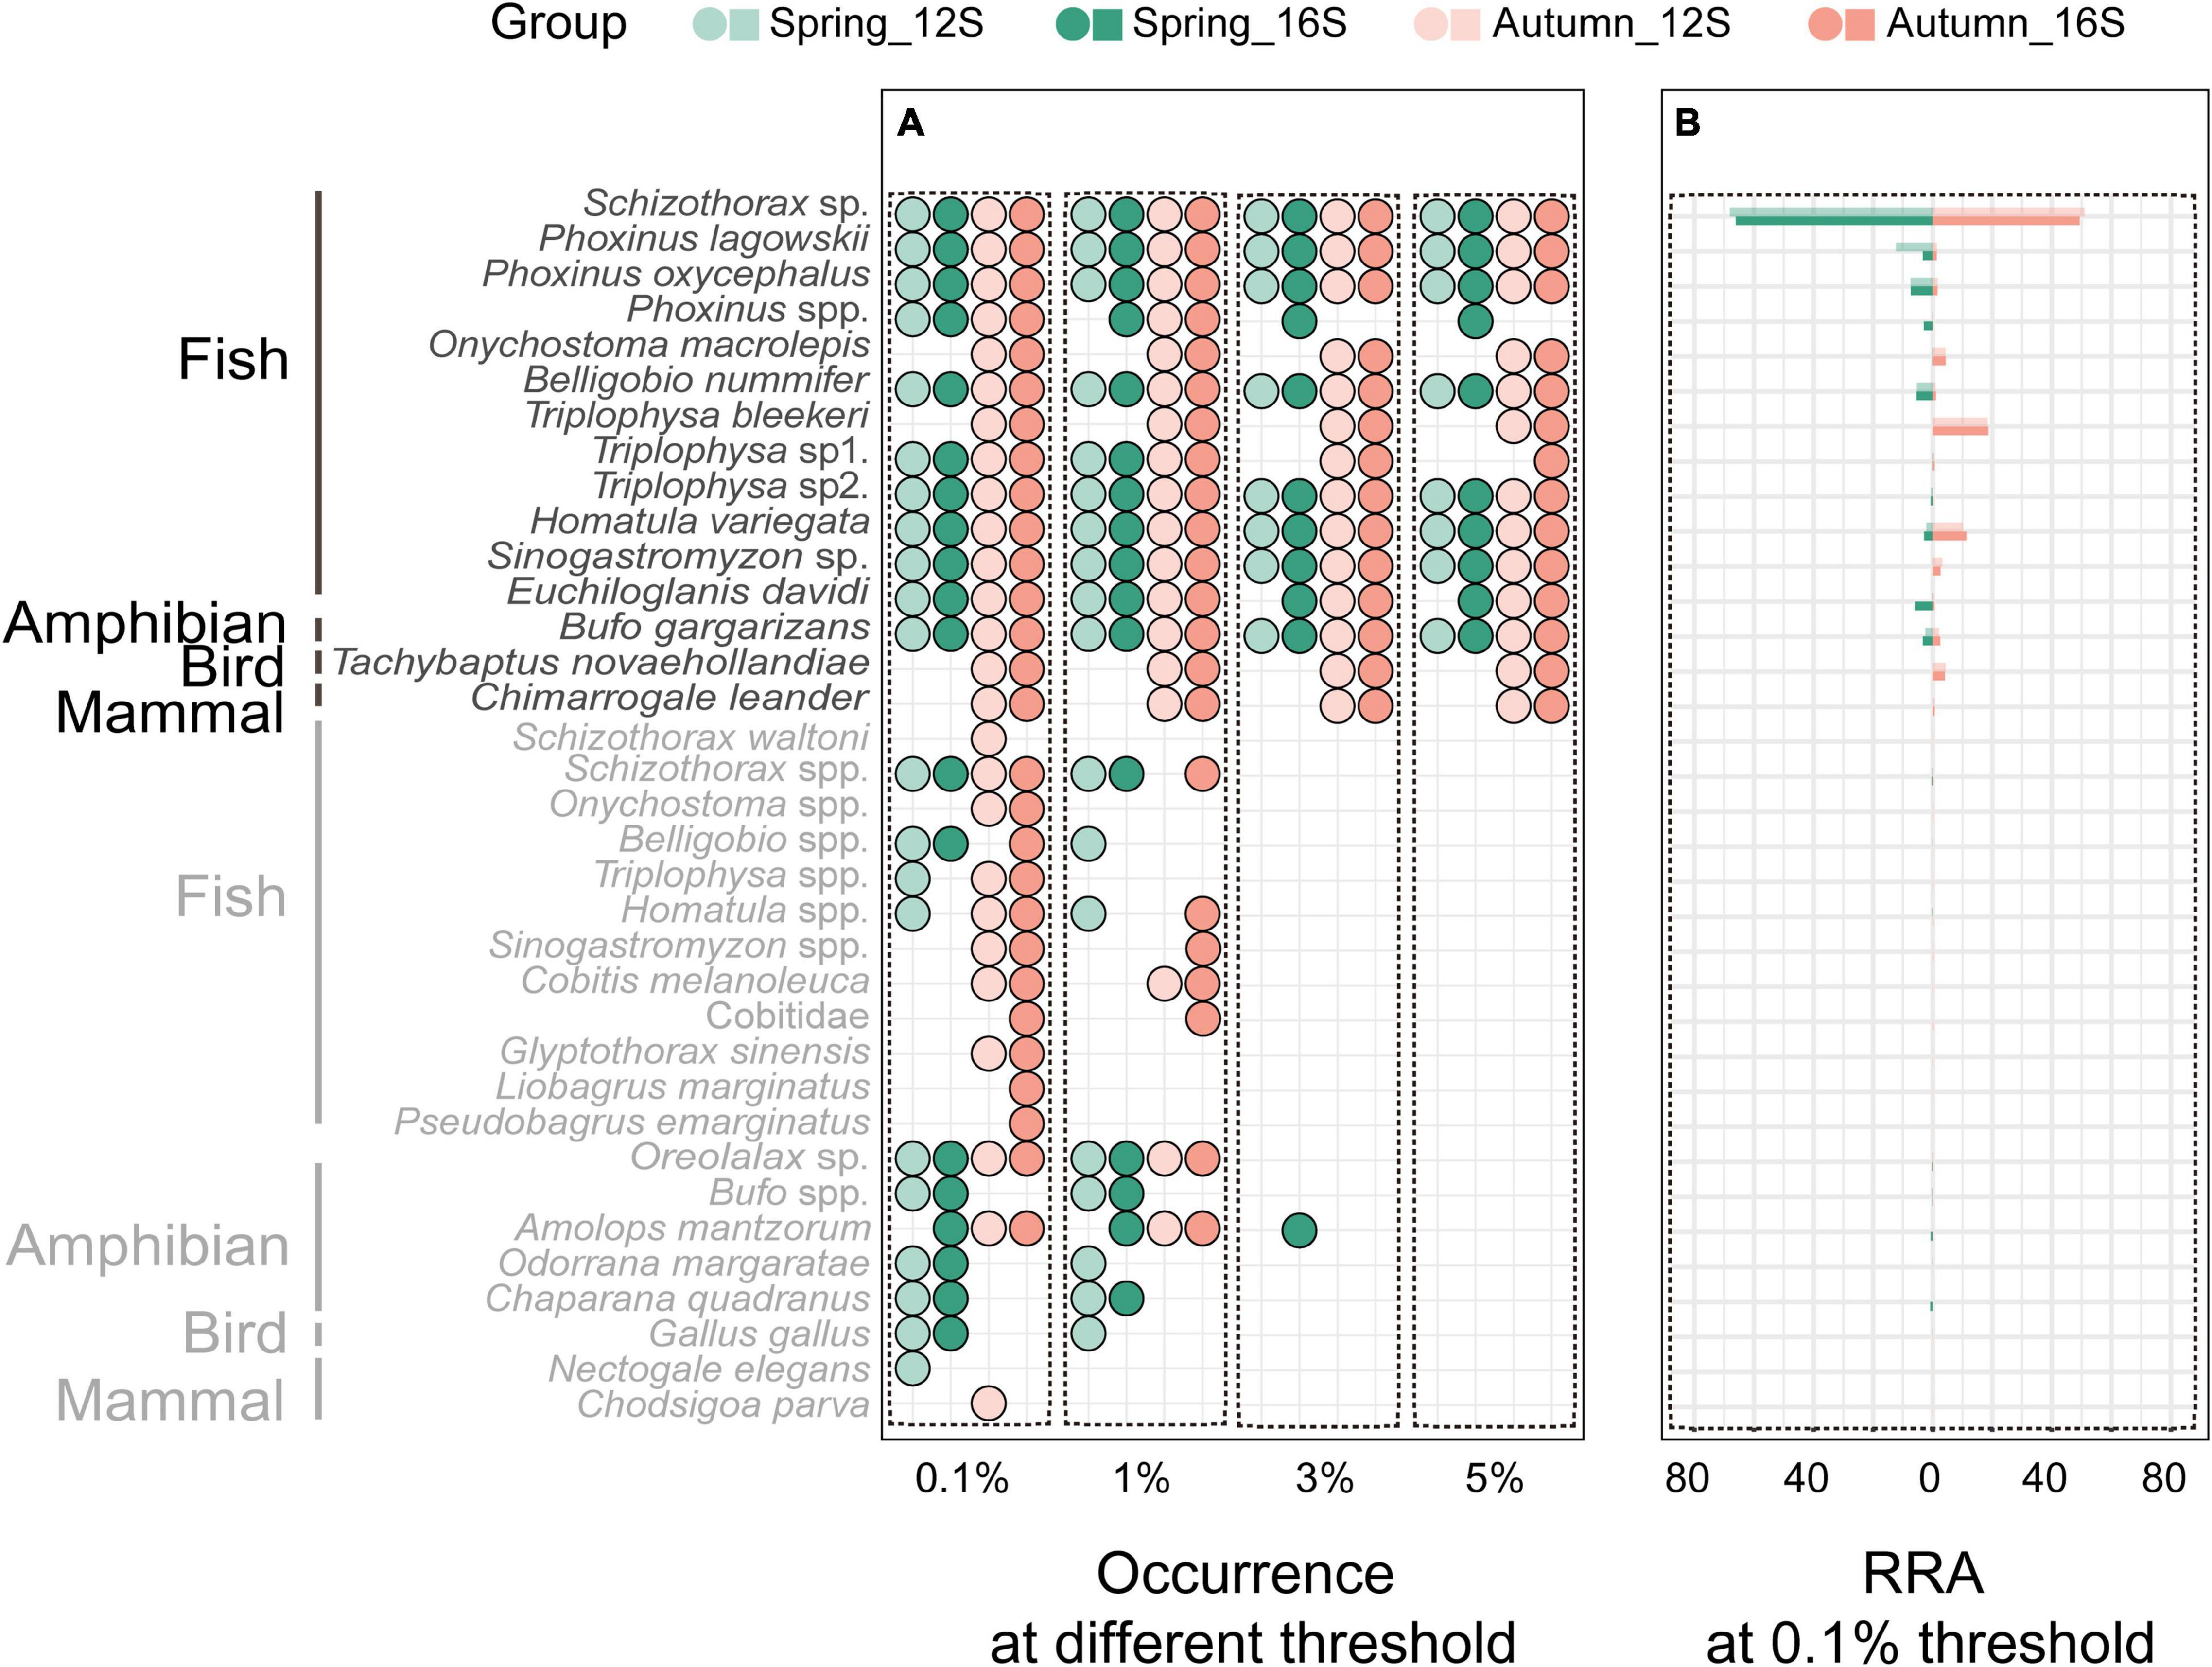
Figure 1. Prey occurrence in all otter spraints under the four data filter thresholds (A), and relative read abundance (RRA) of prey taxa under the 0.1% threshold (B). Taxa in gray are those with <5% RRA.
Differences in prey between the two primer sets were mostly those prey taxa with few reads (≤5% RRA) (Figure 1A). Under the 0.1% threshold, neither prey taxon richness nor diet composition differed between the 12S and 16S primers (Wilcoxon signed-rank test: v = 711, P = 0.315, Figure 2A; PERMANOVA: df = 1, F = 0.295, R2 = 0.002, P = 0.93, Figure 2B, respectively). No difference was found between the two primer sets under other thresholds (Supplementary Figures 2–4).
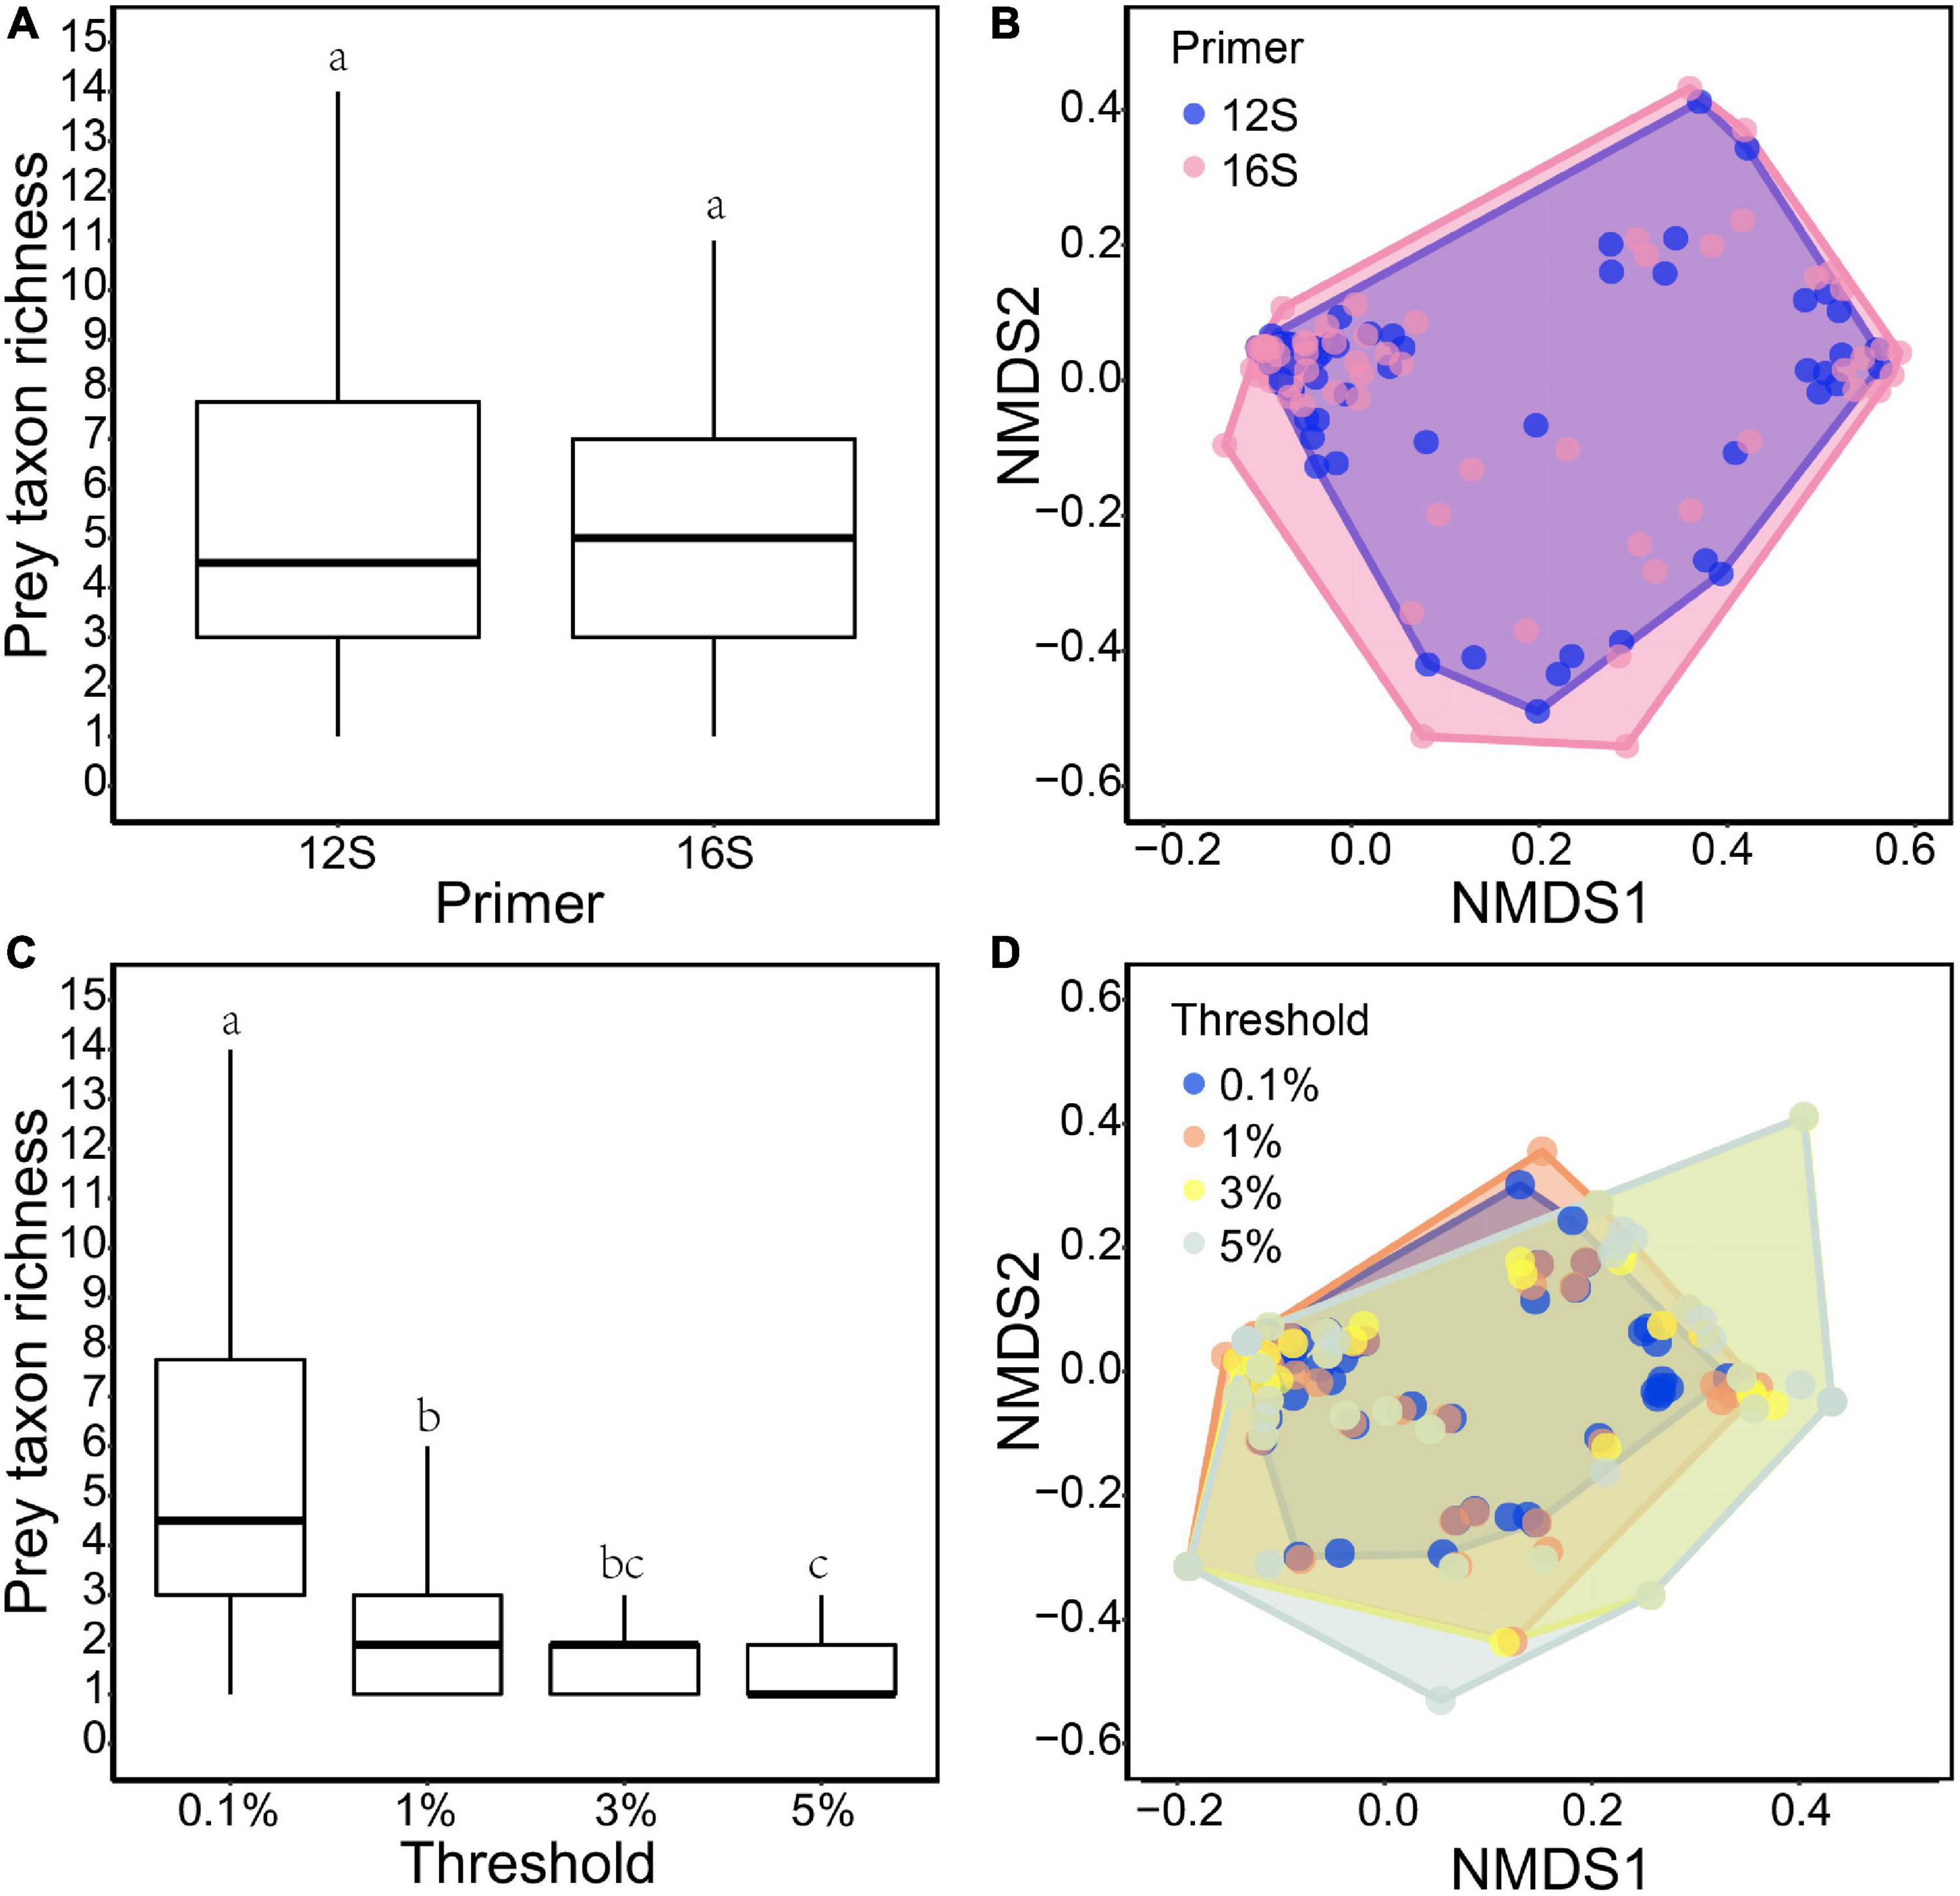
Figure 2. Comparisons of otter diet between 12S and 16S primers under the 0.1% threshold: (A) taxon richness (v = 711, P = 0.315); and (B) NMDS of RRA-based dissimilarity of prey composition (stress: 0.134; F = 0.295, R2 = 0.002, P = 0.93). Comparisons among the four data filter thresholds based on 12S results: (C) taxon richness (X2 = 112.24, P < 0.001); and (D) NMDS of RRA-based dissimilarity of prey composition (stress: 0.101; F = 0.140, R2 = 0.001, P = 1). Different lowercase letters indicate significant differences at P < 0.05.
Different thresholds yielded different prey lists (Figure 1A), resulting in 56.2, 54.9, and 53.8% of the final reads being retained under the 1, 3, and 5% thresholds, respectively. Prey taxon richness differed among thresholds (Kruskal–Wallis test: X2 = 112.24, df = 3, P < 0.001 for 12S results; X2 = 134.18, df = 3, P < 0.001 for 16S results), being lower under higher thresholds (Figure 2C; see also Supplementary Figure 5A for 16S results). However, the main prey taxa (>5% RRA) were identified under all thresholds (Figure 1A). Prey composition was not significantly different among thresholds (PERMANOVA: df = 3, F = 0.140, R2 = 0.001, P = 1 for 12S, Figure 2D; df = 3, F = 0.169, R2 = 0.002, P = 1 for 16S, Supplementary Figure 5B).
Comparison of Otter Diets Between Seasons and Locations
As prey taxon richness and composition were not different between the two primer sets, we used RRA resulted from 12S primers in the following analyses. Although different thresholds yielded different prey taxon richness, the main prey taxa were nevertheless identified under all thresholds. We therefore applied a 5% threshold to analyses of otter diet in Tangjiahe. An overview of the variation in the main prey taxa between samples could be found in Supplementary Figure 6.
Inside the reserve, 95.6–96.7% of RRA were fish. Schizothorax spp. were the most eaten prey, accounting for 70.6–79.3% RRA in both seasons. In autumn, there was an increase in loach (genus Triplophysa, Homatula, and Sinogastromyzon) consumption but a decline in other fish species such as Phoxinus spp. and Belligobio nummifer in otter diet (Figure 3A). However, prey taxon richness (Wilcoxon rank sum test: W = 700, P = 0.575) and composition (PERMANOVA: df = 1, F = 1.942, R2 = 0.323, P = 0.09) did not differ between seasons.
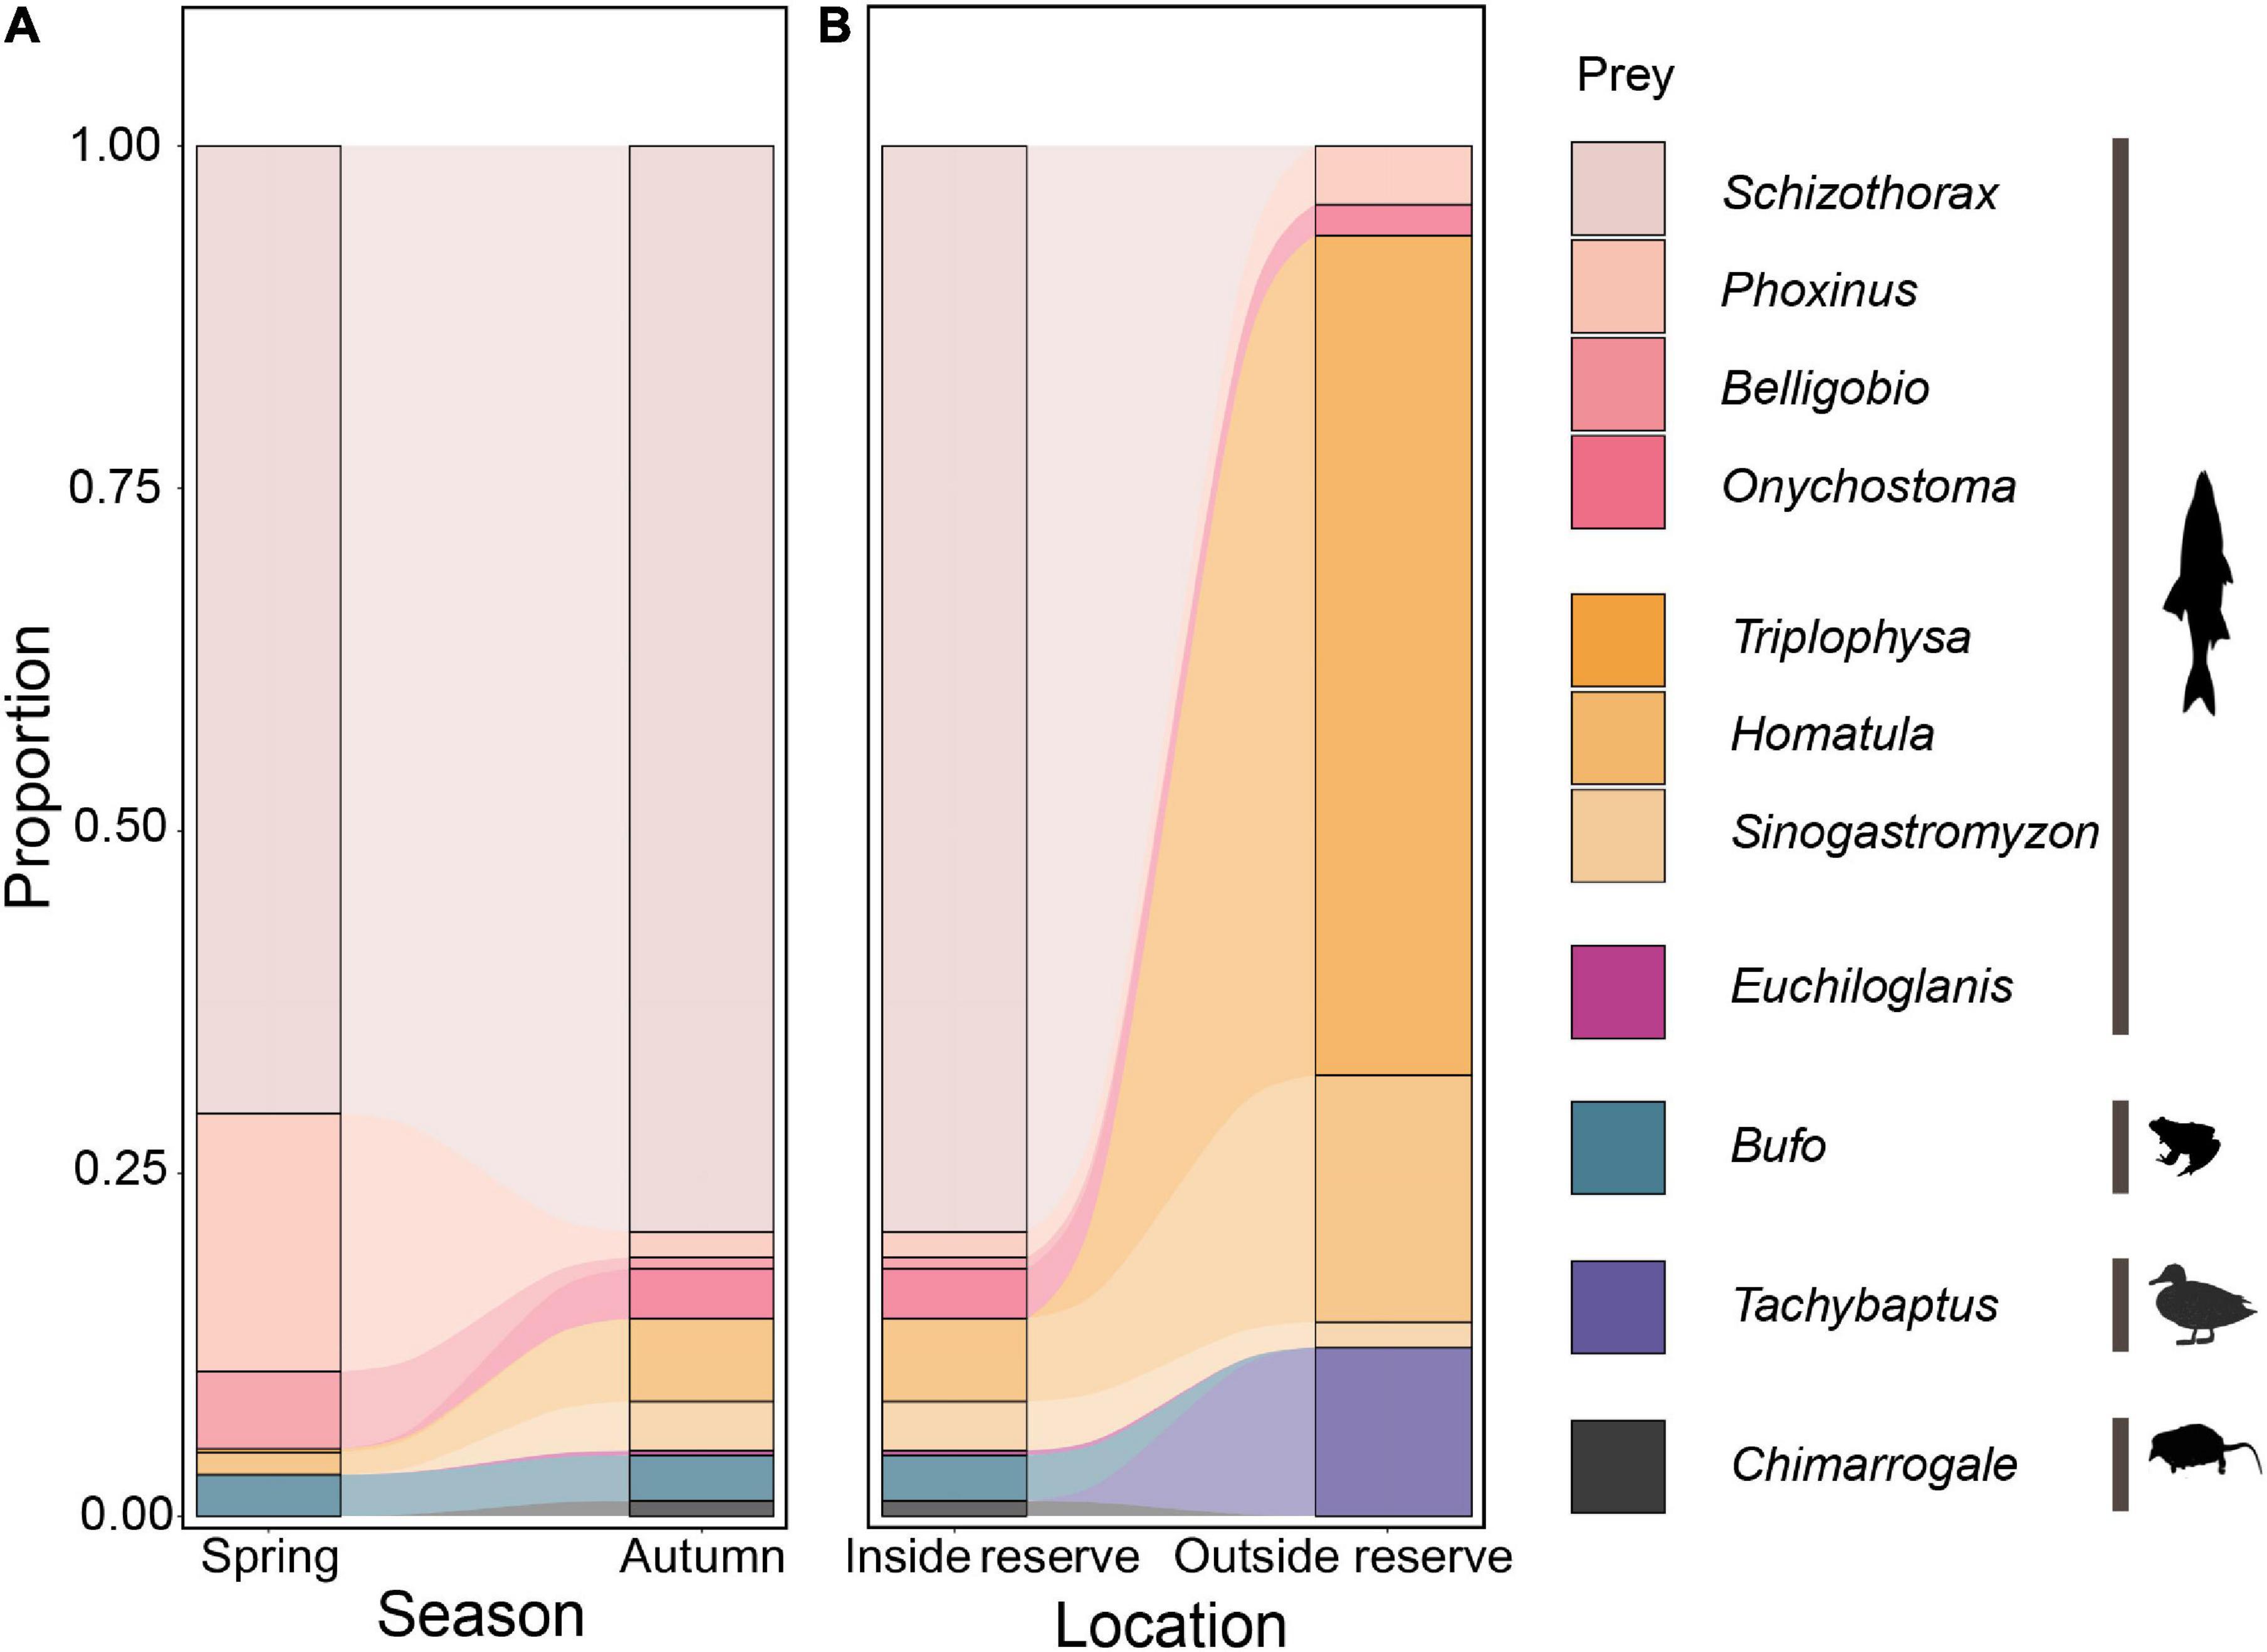
Figure 3. Variation in otter diet between seasons (A) and locations (B), based on relative read abundance of prey taxa in scat DNA (using the 12S primer set).
Outside the reserve, 87.7% of RRA in autumn were fish. Otter diet mainly comprised Triplophysa bleekeri (61.2%), Homatula variegata (18.0%), and Tachybaptus novaehollandiae (12.3%) (Figure 3B). Prey composition differed inside and outside the reserve in autumn (PERMANOVA: df = 1, F = 35.282, R2 = 0.329, P = 0.001). Otters preyed on more loach and birds but less Schizothorax spp., amphibians, or small mammals outside the reserve. However, prey taxon richness did not differ in- and outside the reserve (Wilcoxon rank sum test: W = 246, P = 0.07).
Prey Preference of Otters
We caught five fish taxa in fishing traps, including Schizothorax spp., Phoxinus spp., Homatula spp., B. nummifer, and Euchilohlanis davidi. Unfortunately, we were unable to identify some closely related species by morphological traits when conducting field surveys, such as Schizothorax davidi vs. Schizothorax prenanti, Phoxinus lagowskii vs. Phoxinus oxycephalus, and Homatula variegata vs. Homatula potanini. Therefore, we recorded them at the genus level. The most abundant fish taxa within the reserve were Schizothorax spp. and Phoxinus spp., followed by B. nummifer (Figure 4A). Fish body size decreases from Schizothorax spp. (36.2 ± 5.0 g, n = 243) and E. davidi (22.8 ± 5.7 g, n = 7) to Phoxinus spp. (10.4 ± 0.3 g, n = 708), Homatula spp. (9.8 ± 0.5 g, n = 45), and B. nummifer (17.3 ± 0.6 g, n = 211).
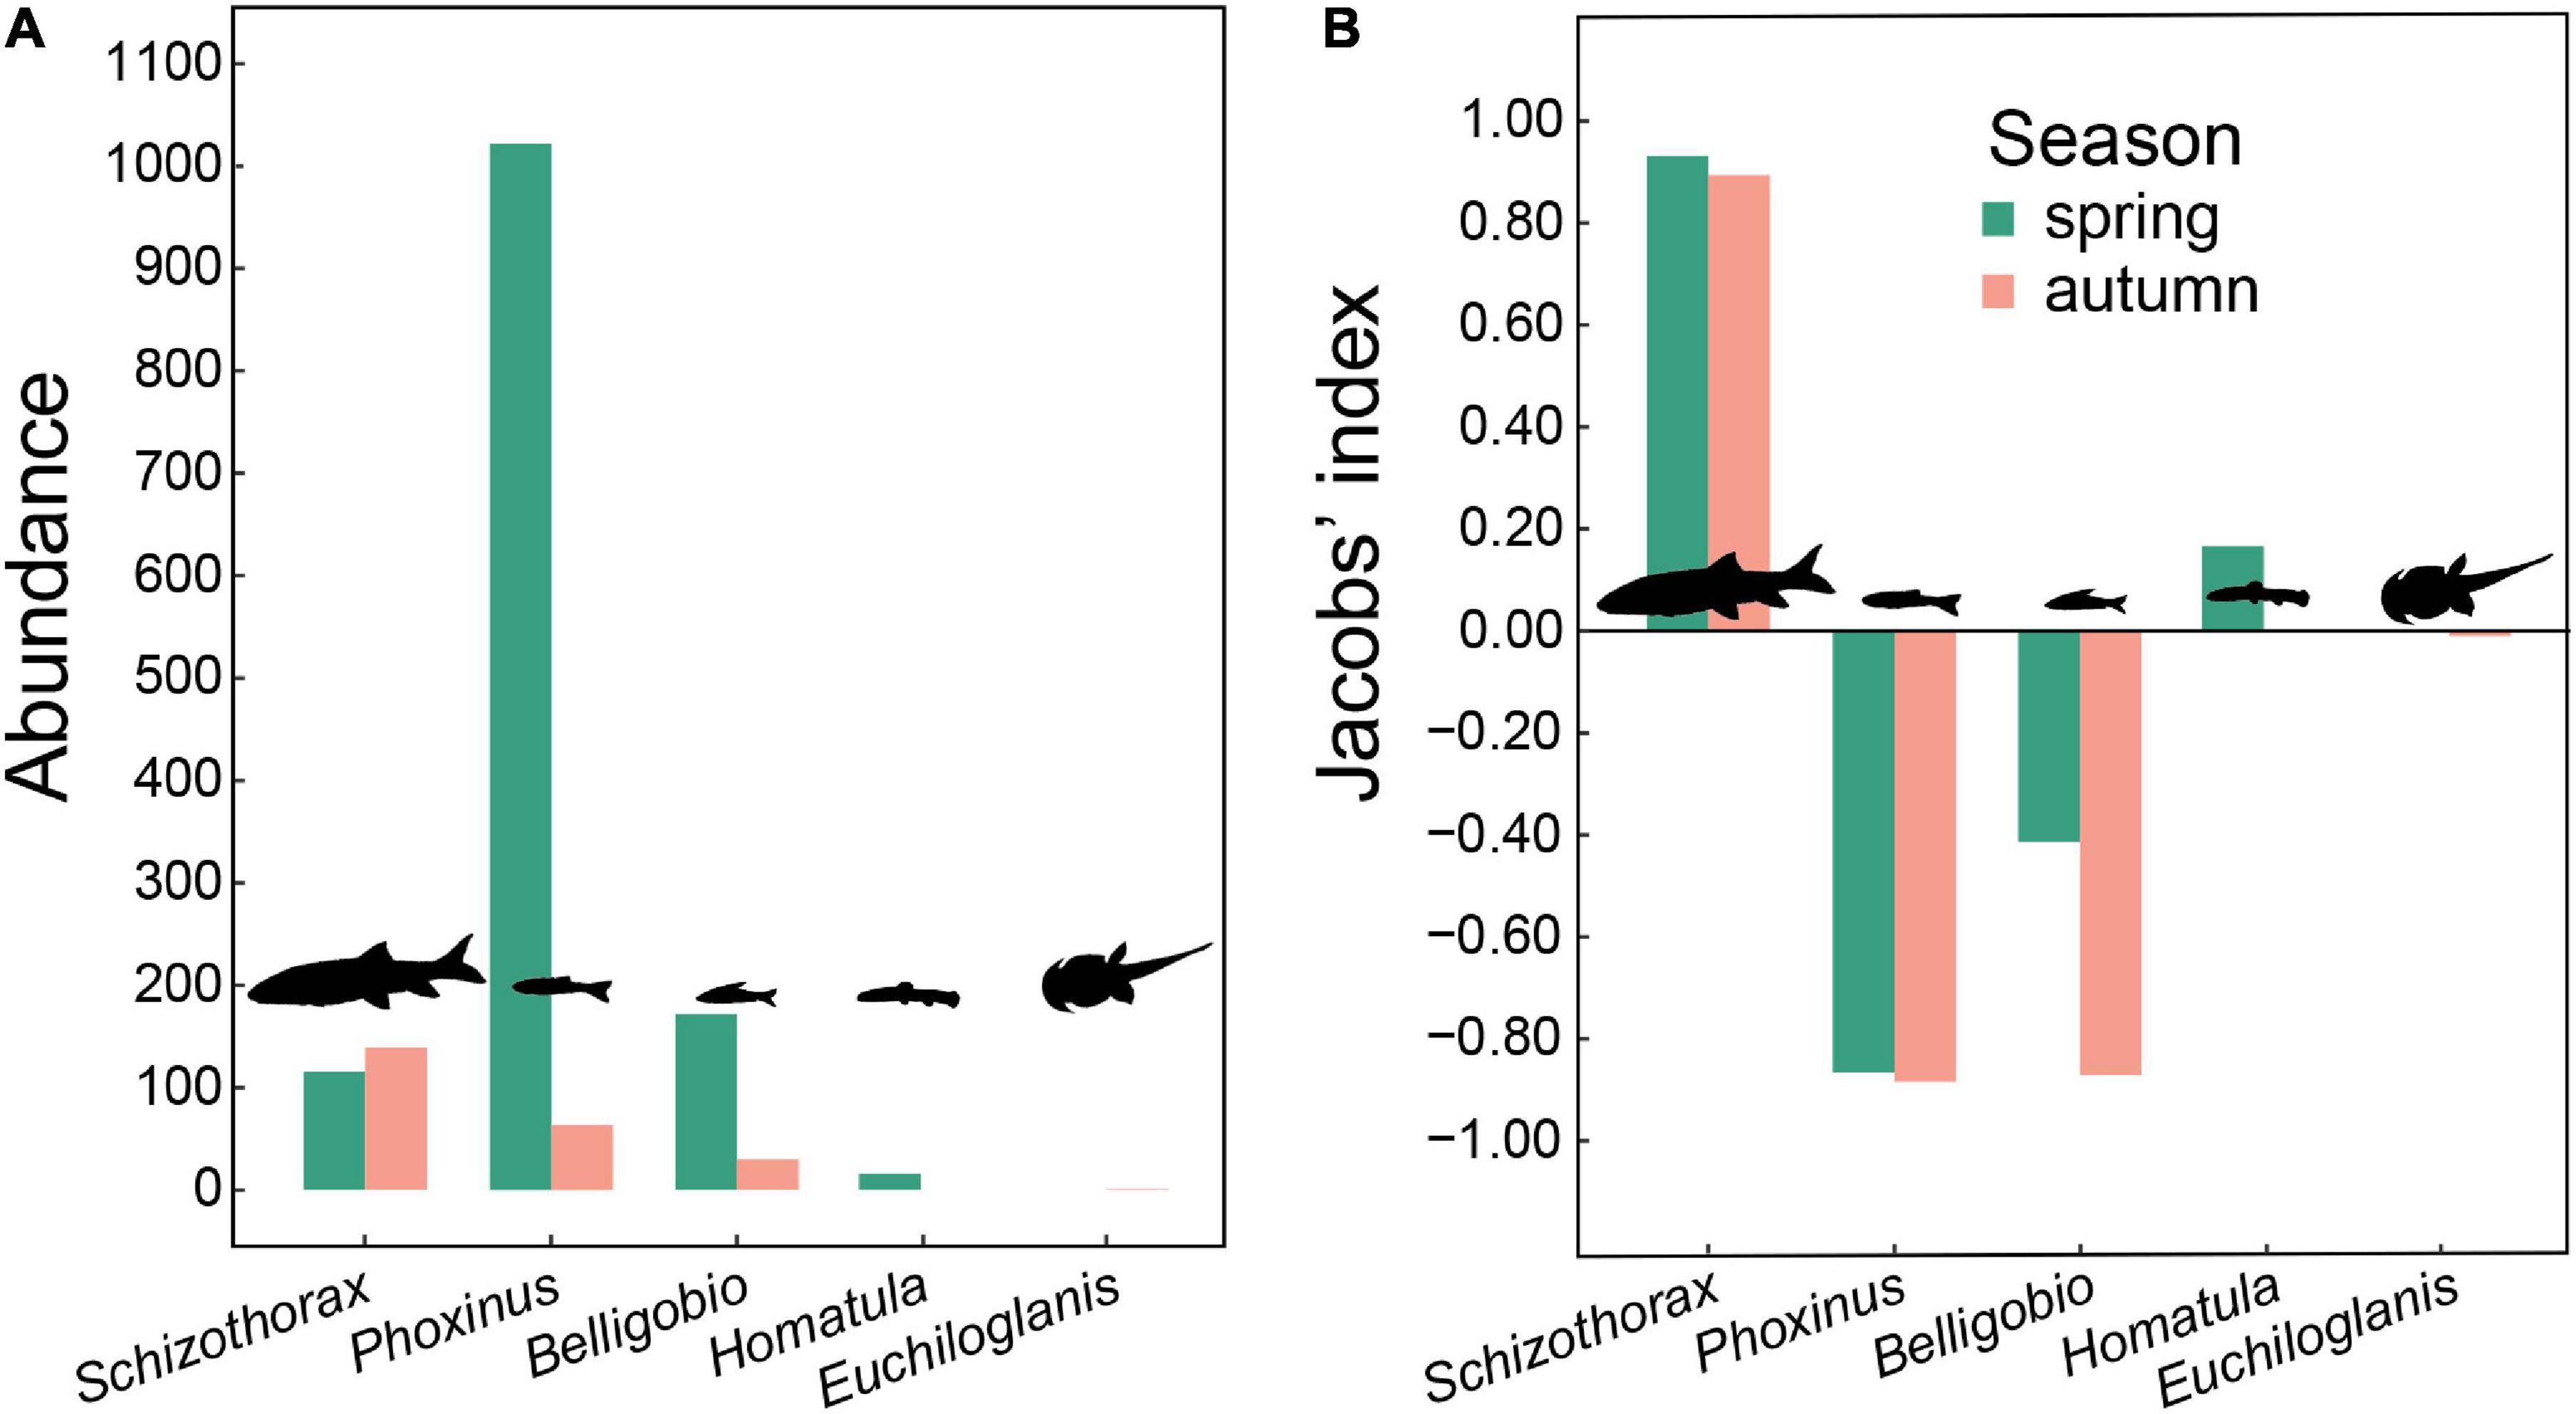
Figure 4. (A) Abundance of fishes from fishing trap surveys, and (B) otter prey preference based on DNA metabarcoding analyses (using the 12S primer set) and fishing trap surveys within Tangjiahe Nature Reserve.
Of all sequences generated from the 12S primers, 96.7% (spring) and 82.1% (autumn) were of these five fish taxa. Otters preferred Schizothorax in both seasons and Homatula in spring, avoided Phoxinus and Belligobio in both seasons, while showing no preference for Homatula in autumn and Euchiloglanis in both seasons (Figure 4B).
Discussion
Using a single set of primers focusing on specific prey groups may produce biased results (Clarke et al., 2014; Piñol et al., 2015). The use of multiple primers should minimize such bias and produce a more comprehensive result (Alberdi et al., 2018; Quéméré et al., 2021). In our study, although slightly different prey taxa were detected when lower thresholds were applied, no difference in prey taxon richness and composition was found between the two sets of primers (Figures 2A,B and Supplementary Figures 2–4), indicating that both primer sets produced a reliable list of the main prey taxa. To develop conservation and management plans for predators, using a single set of our primers to detect important prey taxa could be appropriate, especially when there are few prey taxa in a scat (Weiskopf et al., 2016; Harper et al., 2020). Furthermore, using a single set of broad-range primers is cost-effective (Browett et al., 2021).
A lower data filter threshold increases the inclusion of rare prey taxa (Deagle et al., 2019; Figures 1 and 2C, Supplementary Figure 5A), however, it also increases the inclusion of contamination or sequencing errors (Alberdi et al., 2018; Deagle et al., 2019; Drake et al., 2021). Although different thresholds affected prey taxon richness in our study (Figure 2C and Supplementary Figure 5A), these differences occurred for prey taxa with few sequences, i.e., <5% RRA (Figure 1). The main prey taxa were nevertheless identified under all thresholds. Furthermore, prey composition did not differ among different thresholds (Figure 2D and Supplementary Figure 5B). Using a higher threshold, i.e., 5%, should be sufficient to detect the main prey taxa of Eurasian otters to inform their conservation and management, and the results would be more conservative (Drake et al., 2021).
In contrast to other molecular diet studies (Xiong et al., 2017; Kumari et al., 2019; Shao et al., 2021b), we did not use blocking primers to reduce predator sequences. Since blocking primers may also block prey sequences (Piñol et al., 2014, 2015; Robeson et al., 2018), not using blocking primers can improve the accuracy of prey detection and identify predators simultaneously (Harper et al., 2020). In our study, 39.4% of the total sequences belonged to otters, which left enough prey sequences for diet analyses, similar to a previous study in which 31.1% of the total sequences were otters without using blocking primers (Harper et al., 2020).
Using DNA metabarcoding we obtained a detailed prey list mostly at species level for Eurasian otters in Tangjiahe Nature Reserve. Comparing to otter diet studies using morphological analysis of undigested remains in spraints, our study reached a higher taxon precision, especially for bigger-sized fishes, amphibians, birds, and small mammals (Britton et al., 2006; Alderton et al., 2015; Smiroldo et al., 2019; Harper et al., 2020). In both seasons, otters mainly preyed on fish, followed by amphibians, birds, and mammals, whereas no reptiles were consumed, presenting a diet similar to Eurasian otters in England and continental Europe (Krawczyk et al., 2016; Harper et al., 2020). Our results confirm that otters are mainly piscivorous and thus play a crucial role in redistributing nutrients from aquatic to terrestrial ecosystems and linking energy flows in the two ecosystems (Polis et al., 1997). All fish species caught in trap surveys were found in otters’ spraints, indicating that otters can be an effective biodiversity sampler of fish species in freshwater ecosystems (Shao et al., 2021a).
Although there was no difference in prey composition inside the reserve between the two seasons, otters preyed more on Schizothorax spp. but less other fish species in autumn than in spring (Figure 3A). This is probably because most fish species hide in the deep water and beneath boulders in the cold season (Ding, 1994), while Schizothorax spp. are active all year round based (personal observation, this study). Previous studies have shown that Eurasian otters are flexible in diet choices. Some otters prefer benthic fish (Harper et al., 2020) while others prefer fast-swimming Cyprinids (Grant and Harrington, 2015). Their preferred prey size ranges from small (Harper et al., 2020), medium (Grant and Harrington, 2015), to large (Martínez-Abraín et al., 2020). In general, the most important limitation on otters’ prey choice may be the difficulty of catching prey, which is influenced by depth and openness of water, season, and prey characteristics (Grant and Harrington, 2015; Hong et al., 2019; Martínez-Abraín et al., 2020). In our study, otters avoided small-sized but abundant fish species such as Phoxinus spp. and B. nummifer, but preferred Schizothorax spp. in both seasons, which is a large, fast-swimming and abundant fish species inside the reserve. Because the river section we surveyed is relatively narrow with shallow water (water depth: 46 ± 2 cm, river width: 11 ± 1 m, flow rate: 0.3 ± 0.1 m/s, n = 30 km), a similar energy cost for catching small or larger-sized fish is expected (Martínez-Abraín et al., 2020) and otters prefer to consume larger-sized more profitable species.
Otters preyed on different fish species outside the reserve (water depth: 34 ± 2 cm, river width: 21 ± 2 m, flow rate: 0.3 ± 0.0 m/s, n = 20 km), and preyed much more on birds than inside the reserve (Figure 3B). These results reflect the flexible feeding strategy of otters, showing their great adaptation to different micro habitats. We did not conduct fish surveys outside the reserve as our traps were repeatedly stolen, and thus the diet revealed reflects otters’ prey consumption rather than their confirmed prey preference. Outside the reserve, otters mainly preyed on small-sized and slow-swimming fish, such as Triplophysa spp. and Homatula spp., similar to otters in South Korea, northern and eastern England and Spain (Hong et al., 2019; Harper et al., 2020; Martínez-Abraín et al., 2020). One of the reasons may be that more human disturbances outside the reserve influence the prey community in the river, such that large-sized fish such as Schizothorax spp. have been harvested (Diao, unpublished data). In addition, an overall decrease in the size of fish populations outside the reserve (Diao, unpublished data) may force otters to prey more on secondary prey, such as birds (de la Hey, 2008; Harper et al., 2020).
Conclusion
In conclusion, our study demonstrates that DNA metabarcoding is an effective method of determining otter diet. This approach may also be effective in studying diets of other carnivores, using the same or modified universal primer sets from our study. The method has sufficient precision to reveal variation in diet with changes in habitat or environmental conditions. Our results indicate the flexible feeding strategy of Eurasian otters, reflecting their high adaptability to micro habitats with different prey communities. However, greater human disturbance outside the reserve may present significant challenges to otters by altering prey communities and reducing prey profitability, which affect otters’ survival. Combining fecal DNA metabarcoding and local fish survey will provide opportunities for more detailed studies on the impact of different levels of human disturbances on prey communities and otters.
Data Availability Statement
The datasets presented in this study can be found in online repositories. The data presented in the study are deposited in the NCBI repository, accession number: PRJNA842588.
Ethics Statement
Ethical review and approval was not required for the animal study because we used the scats of otters to show the prey composition.
Author Contributions
PF and LZ conceived and designed the study. PZ designed the mitochondrial universal primers and experimental procedures. LZ, QW, KZ, WC, and LS conducted the field surveys. QW, KZ, and ZW conducted lab work. QW and ZW analyzed the data. QW, LZ, and PF wrote the manuscript. All authors read and approved the final version of the manuscript.
Funding
This study was supported by the National Natural Science Foundation of China (31900372), Tangjiahe National Nature Reserve, and the State Key Laboratory of Biocontrol (Sun Yat-sen University).
Conflict of Interest
The authors declare that the research was conducted in the absence of any commercial or financial relationships that could be construed as a potential conflict of interest.
Publisher’s Note
All claims expressed in this article are solely those of the authors and do not necessarily represent those of their affiliated organizations, or those of the publisher, the editors and the reviewers. Any product that may be evaluated in this article, or claim that may be made by its manufacturer, is not guaranteed or endorsed by the publisher.
Acknowledgments
We thank Dr. L. Yang from Sun Yat-sen University for helping with statistical analyses. We are grateful to colleagues from Tangjiahe National Nature Reserve for assisting with field work.
Supplementary Material
The Supplementary Material for this article can be found online at: https://www.frontiersin.org/articles/10.3389/fevo.2022.902412/full#supplementary-material
Supplementary Figure 1 | Rarefaction curve of all samples (after removal of predatory reads; the vertical line shows the minimum sample reads number within all samples).
Supplementary Figure 2 | Comparisons of otter diet between two primers sets under 1% threshold. (A) Comparison of prey taxon richness of diet. (B) NMDS of RRA-Curtis dissimilarity of prey community (stress: 0.105). N.S. means no significant difference.
Supplementary Figure 3 | Comparisons of otter diet between two primers sets under 3% threshold. (A) Comparison of species richness of diet. (B) NMDS of RRA-Curtis dissimilarity of prey community (stress: 0.064). N.S. means no significant difference.
Supplementary Figure 4 | Comparisons of otter diet between two primers sets under 5% threshold. (A) Comparison of prey taxon richness. (B) Comparison on NMDS of RRA-Curtis dissimilarity of prey community (stress: 0.048). N.S. means no significant difference.
Supplementary Figure 5 | Comparisons of otter diet among four data filter thresholds using 16S results. (A) Comparison of prey taxon richness of diets. (B) Comparison on NMDS of RRA-Curtis dissimilarity of prey communities (stress: 0.106). Different lowercase letters indicate significant differences at P < 0.05. P correction method: “Bonferroni.”
Supplementary Figure 6 | A heatmap showing proportional read counts of main prey taxa in each sample under 5% threshold (using 12S results).
Supplementary Table 1 | Read numbers of prey taxa in each sample under different data removal thresholds.
Supplementary Table 2 | Fish species captured by fishing traps in the Tangjiahe Nature Reserve.
Footnotes
- ^ Wang, Z. C., Liu, X. L., Liang, D., Wang, Q. Y., Zhang, L., and Zhang, P. (2022). VertU: universal multilocus primer sets for eDNA metabarcoding of vertebrate diversity, evaluated by both artificial and natural cases. Mol. Ecol. Resour.
- ^ http://www.bioinformatics.babraham.ac.uk/projects/fastqc/
References
Alberdi, A., Aizpurua, O., Gilbert, M. T. P., and Bohmann, K. (2018). Scrutinizing key steps for reliable metabarcoding of environmental samples. Methods Ecol. Evol. 9, 134–147. doi: 10.1111/2041-210X.12849
Alderton, E., Wicker, C., Sayer, C., and Bradley, P. (2015). The diet of the Malham Tarn otters: understanding the impacts of a native predator. Field Stud. 11:305.
Almeida, D., Copp, G. H., Masson, L., Miranda, R., Murai, M., and Sayer, C. D. (2012). Changes in the diet of a recovering Eurasian otter population between the 1970s and 2010. Aquat. Conserv. Mar. Freshw. Ecosyst. 22, 26–35. doi: 10.1002/aqc.1241
Bolger, A. M., Lohse, M., and Usadel, B. (2014). Trimmomatic: a flexible trimmer for Illumina sequence data. Bioinformatics 30, 2114–2120. doi: 10.1093/bioinformatics/btu170
Britton, J. R., Pegg, J., and Shepherd, J. S. (2006). Revealing the prey items of the otter Lutra lutra in south west England using stomach contents analysis. Folia. Zool. 55, 167–174.
Browett, S. S., Curran, T. G., O’Meara, D. B., Harrington, A. P., Sales, N. G., Antwis, R. E., et al. (2021). Primer biases in the molecular assessment of diet in multiple insectivorous mammals. Mamm. Biol. 101, 293–304. doi: 10.1007/s42991-021-00115-4
Buglione, M., Petrelli, S., Troiano, C., Notomista, T., Rivieccio, E., and Fulgione, D. (2020). The diet of otters (Lutra lutra) on the Agri river system, one of the most important presence sites in Italy: a molecular approach. PeerJ 8:e9606. doi: 10.7717/peerj.9606
Chang, Y., Song, S. J., Li, A. Q., Zhang, Y., Li, Z. L., Xiao, Y. H., et al. (2019). The roles of morphological traits, resource variation and resource partitioning associated with the dietary niche expansion in the fish-eating bat Myotis pilosus. Mol. Ecol. 28, 2944–2954. doi: 10.1111/mec.15127
Clarke, L. J., Soubrier, J., Weyrich, L. S., and Cooper, A. (2014). Environmental metabarcodes for insects: in silico PCR reveals potential for taxonomic bias. Mol. Ecol. Resour. 14, 1160–1170. doi: 10.1111/1755-0998.12265
Copp, G. H., and Roche, K. (2003). Range and diet of Eurasian otters Lutra lutra (L.) in the catchment of the River Lee (south-east England) since re-introduction. Aquat. Conserv. Mar. Freshw. Ecosyst. 13, 65–76.
Da Silva, L. P., Mata, V. A., Lopes, P. B., Pereira, P., Jarman, S. N., Lopes, R. J., et al. (2019). Advancing the integration of multi-marker metabarcoding data in dietary analysis of trophic generalists. Mol. Ecol. Resour. 19, 1420–1432. doi: 10.1111/1755-0998.13060
de la Hey, D. C. (2008). The importance of birds in the diet of otter Lutra lutra on Shapwick Heath. Bioscience Horizons. Int. J. Stud. Res. 1, 143–147. doi: 10.1093/biohorizons/hzn018
Deagle, B. E., Thomas, A. C., McInnes, J. C., Clarke, L. J., Vesterinen, E. J., Clare, E. L., et al. (2019). Counting with DNA in metabarcoding studies: how should we convert sequence reads to dietary data? Mol. Ecol. 28, 391–406. doi: 10.1111/mec.14734
Deagle, B. E., Tollit, D. J., Jarman, S. N., Hindell, M. A., Trites, A. W., and Gales, N. J. (2005). Molecular scatology as a tool to study diet: analysis of prey DNA in scats from captive Steller sea lions. Mol. Ecol. 14, 1831–1842. doi: 10.1111/j.1365-294X.2005.02531.x
Devloo-Delva, F., Huerlimann, R., Chua, G., Matley, J. K., Heupel, M. R., Simpfendorfer, C. A., et al. (2019). How does marker choice affect your diet analysis: comparing genetic markers and digestion levels for diet metabarcoding of tropical-reef piscivores. Mar. Freshw. Res. 70, 8–18. doi: 10.1071/mf17209
Ding, R. (1994). The Fishes of Sichuan, China. Chengdu: Sichuan Publishing House of Science and Technology.
Drake, L. E., Cuff, J. P., Young, R. E., Marchbank, A., Chadwick, E. A., and Symondson, W. O. C. (2021). An assessment of minimum sequence copy thresholds for identifying and reducing the prevalence of artefacts in dietary metabarcoding data. Methods Ecol. Evol. 13, 694–710. doi: 10.1111/2041-210X.13780
Feng, Y. J., Liu, Q. F., Chen, M. Y., Liang, D., and Zhang, P. (2016). Parallel tagged amplicon sequencing of relatively long PCR products using the Illumina HiSeq platform and transcriptome assembly. Mol. Ecol. Resour. 16, 91–102. doi: 10.1111/1755-0998.12429
Fu, L. M., Niu, B. F., Zhu, Z. W., Wu, S. T., and Li, W. Z. (2012). CD-HIT: accelerated for clustering the next-generation sequencing data. Bioinformatics 28, 3150–3152. doi: 10.1093/bioinformatics/bts565
Grant, K. R., and Harrington, L. A. (2015). Fish selection by riverine Eurasian otters in lowland England. Mammal Res. 60, 217–231. doi: 10.1007/s13364-015-0223-3
Hammerschlag, N., Schmitz, O. J., Flecker, A. S., Lafferty, K. D., Sih, A., Atwood, T. B., et al. (2019). Ecosystem Function and Services of Aquatic Predators in the Anthropocene. Trends Ecol. Evol. 34, 369–383. doi: 10.1016/j.tree.2019.01.005
Harper, L. R., Watson, H. V., Donnelly, R., Hampshire, R., Sayer, C. D., Breithaupt, T., et al. (2020). Using DNA metabarcoding to investigate diet and niche partitioning in the native European otter (Lutra lutra) and invasive American mink (Neovison vison). Metabarcoding Metagenom. 4, 113–133. doi: 10.3897/mbmg.4.56087
Hong, S., Gim, J.-S., Kim, H. G., Cowan, P. E., and Joo, G.-J. (2019). A molecular approach to identifying the relationship between resource use and availability in Eurasian otters (Lutra lutra). Can. J. Zool. 97, 797–804. doi: 10.1139/cjz-2018-0289
Hu, J. C. (2005). A Comprehensive Scientific Investigation Report of Tangjiahe Nature Reserve in sichuan Province. Chengdu: Sichuan Science & Technology Press.
Jacobs, J. (1974). Quantitative measurement of food selection: a modification of the forage ratio and Ivlev’s electivity index. Oecologia 14, 413–417. doi: 10.1007/BF00384581
Jang-Liaw, N. H. (2021). A barcoding-based scat-analysis assessment of Eurasian otter Lutra lutra diet on Kinmen Island. Ecol. Evol. 11, 8795–8813. doi: 10.1002/ece3.7712
Keller, T. (1998). The food of Cormorants (Phalacrocorax carbo sinensis) in Bavaria. J. Ornithol. 139, 389–400.
Kelly, R. P., Port, J. A., Yamahara, K. M., and Crowder, L. B. (2014). Using environmental DNA to census marine fishes in a large mesocosm. PLoS One 9:e86175. doi: 10.1371/journal.pone.0086175
Klare, U., Kamler, J. F., and Macdonald, D. W. (2011). A comparison and critique of different scat-analysis methods for determining carnivore diet. Mammal Rev. 41, 294–312. doi: 10.1111/j.1365-2907.2011.00183.x
Krawczyk, A. J., Bogdziewicz, M., Majkowska, K., and Glazaczow, A. (2016). Diet composition of the Eurasian otter Lutra lutra in different freshwater habitats of temperate Europe: a review and meta-analysis. Mammal Rev. 46, 106–113. doi: 10.1111/mam.12054
Kruuk, H., Kanchanasaka, B., O’Sullivan, S., and Wanghongsa, S. (1994). Niche separation in three sympatric otters Lutra perspicillata, L. lutra and Aonyx cinerea in Huai Kha Khaeng, Thailand. Biol. Conserv. 69, 115–120. doi: 10.1016/0006-3207(94)90334-4
Kumari, P., Dong, K., Eo, K. Y., Lee, W. S., Kimura, J., and Yamamoto, N. (2019). DNA metabarcoding-based diet survey for the Eurasian otter (Lutra lutra): development of a Eurasian otter-specific blocking oligonucleotide for 12S rRNA gene sequencing for vertebrates. PLoS One 14:e0226253. doi: 10.1371/journal.pone.0226253
Lanszki, J., Lehoczky, I., Kotze, A., and Somers, M. J. (2016). Diet of otters (Lutra lutra) in various habitat types in the Pannonian biogeographical region compared to other regions of Europe. PeerJ 4:e2266. doi: 10.7717/peerj.2266
Li, F., and Chan, B. P. L. (2018). Past and present: the status and distribution of otters (Carnivora: Lutrinae) in China. Oryx 52, 619–626. doi: 10.1017/s0030605317000400
Magoè, T., and Salzberg, S. L. (2011). FLASH: fast length adjustment of short reads to improve genome assemblies. Bioinformatics 27, 2957–2963. doi: 10.1093/bioinformatics/btr507
Marcolin, F., Iordan, F., Pizzul, E., Pallavicini, A., Torboli, V., Manfrin, C., et al. (2020). Otter diet and prey selection in a recently recolonized area assessed using microscope analysis and DNA barcoding. Hystrix 31, 64–72. doi: 10.4404/hystrix-00260-2019
Martínez-Abraín, A., Santidrián Tomillo, P., and Veiga, J. (2020). Otter diet changes in a reservoir during a severe autumn drought. J. Mammal. 101, 211–215. doi: 10.1093/jmammal/gyz185
Miya, M., Sato, Y., Fukunaga, T., Sado, T., Poulsen, J. Y., Sato, K., et al. (2015). MiFish, a set of universal PCR primers for metabarcoding environmental DNA from fishes: detection of more than 230 subtropical marine species. R. Soc. Open Sci. 2:150088. doi: 10.1098/rsos.150088
Monterroso, P., Godinho, R., Oliveira, T., Ferreras, P., Kelly, M. J., Morin, D. J., et al. (2018). Feeding ecological knowledge: the underutilised power of faecal DNA approaches for carnivore diet analysis. Mammal Rev. 49, 97–112. doi: 10.1111/mam.12144
Nielsen, J. M., Clare, E. L., Hayden, B., Brett, M. T., and Kratina, P. (2018). Diet tracing in ecology: method comparison and selection. Methods Ecol. Evol. 9, 278–291. doi: 10.1111/2041-210X.12869
Oksanen, J., Blanchet, F. G., Friendly, M., Kindt, R., Legendre, P., McGlinn, D., et al. (2020). Vegan: Community Ecology Package. R Package Version 2.5-7. Available online at: https://github.com/vegandevs/vegan (accessed November 27, 2021).
Piñol, J., Mir, G., Gomez-Polo, P., and Agustí, N. (2015). Universal and blocking primer mismatches limit the use of high-throughput DNA sequencing for the quantitative metabarcoding of arthropods. Mol. Ecol. Resour. 15, 819–830. doi: 10.1111/1755-0998.12355
Piñol, J., San Andrés, V., Clare, E. L., Mir, G., and Symondson, W. O. C. (2014). A pragmatic approach to the analysis of diets of generalist predators: the use of next-generation sequencing with no blocking probes. Mol. Ecol. Resour. 14, 18–26. doi: 10.1111/1755-0998.12156
Polis, G. A., Anderson, W. B., and Holt, R. D. (1997). Toward an integration of landscape and food web ecology: the dynamics of spatially subsidized food webs. Annu. Rev. Ecol. Syst. 28, 289–316.
Pompanon, F., Deagle, B. E., Symondson, W. O. C., Brown, D. S., Jarman, S. N., and Taberlet, P. (2012). Who is eating what: diet assessment using next generation sequencing. Mol. Ecol. 21, 1931–1950. doi: 10.1111/j.1365-294X.2011.05403.x
Quéméré, E., Aucourd, M., Troispoux, V., Brosse, S., Murienne, J., Covain, R., et al. (2021). Unraveling the dietary diversity of Neotropical top predators using scat DNA metabarcoding: a case study on the elusive Giant Otter. Environ. DNA 3, 889–900. doi: 10.1002/edn3.195
R Core Team (2021). R: A Language and Environment for Statistical Computing. Vienna, Austria: R for Statistical Computing.
Reid, N., Thompson, D., Hayden, B., Marnell, F., and Montgomery, W. I. (2013). Review and quantitative meta-analysis of diet suggests the Eurasian otter (Lutra lutra) is likely to be a poor bioindicator. Ecol. Indic. 26, 5–13. doi: 10.1016/j.ecolind.2012.10.017
Remonti, L., Prigioni, C., Balestrieri, A., Sgrosso, S., and Priore, G. (2010). Eurasian otter (Lutra lutra) prey selection in response to a variation of fish abundance. Ital. J. Zool. 77, 331–338. doi: 10.1080/11250000903229809
Riaz, T., Shehzad, W., Viari, A., Pompanon, F., Taberlet, P., and Coissac, E. (2011). ecoPrimers: inference of new DNA barcode markers from whole genome sequence analysis. Nucleic Acids Res. 39:e145. doi: 10.1093/nar/gkr732
Ritchie, E. G., Elmhagen, B., Glen, A. S., Letnic, M., Ludwig, G., and McDonald, R. A. (2012). Ecosystem restoration with teeth: what role for predators? Trends Ecol. Evol. 27, 265–271. doi: 10.1016/j.tree.2012.01.001
Robeson, M. S., Khanipov, K., Golovko, G., Wisely, S. M., White, M. D., Bodenchuck, M., et al. (2018). Assessing the utility of metabarcoding for diet analyses of the omnivorous wild pig (Sus scrofa). Ecol. Evol. 8, 185–196. doi: 10.1002/ece3.3638
Shao, X. N., Lu, Q., Xiong, M. Y., Bu, H. L., Shi, X. Y., Wang, D. Y., et al. (2021b). Prey partitioning and livestock consumption in the world’s richest large carnivore assemblage. Curr. Biol. 31, 4887–4897.e5. doi: 10.1016/j.cub.2021.08.067
Shao, X. N., Lu, Q., Liu, M. Z., Xiong, M. Y., Bu, H. L., Wang, D. Y., et al. (2021a). Generalist carnivores can be effective biodiversity samplers of terrestrial vertebrates. Front. Ecol. Environ 19:557–563. doi: 10.1002/fee.2407
Smiroldo, G., Villa, A., Tremolada, P., Gariano, P., Balestrieri, A., and Delfino, M. (2019). Amphibians in Eurasian otter Lutra lutra diet: osteological identification unveils hidden prey richness and male-biased predation on anurans. Mammal Rev. 49, 240–255. doi: 10.1111/mam.12155
Thalinger, B., Oehm, J., Mayr, H., Obwexer, A., Zeisler, C., and Traugott, M. (2016). Molecular prey identification in Central European piscivores. Mol. Ecol. Resour. 16, 123–137. doi: 10.1111/1755-0998.12436
Traugott, M., Thalinger, B., Wallinger, C., and Sint, D. (2020). Fish as predators and prey: DNA-based assessment of their role in food webs. J. Fish Biol. 98, 367–382. doi: 10.1111/jfb.14400
Wang, Q. Y., Zheng, K. D., Han, X. S., He, F., Zhao, X., Fan, P. F., et al. (2021). Site-specific and seasonal variation in habitat use of Eurasian otters (Lutra lutra) in western China: implications for conservation. Zool. Res. 42, 824–832. doi: 10.24272/j.issn.2095-8137.2021.238
Wang, Z. N., Yang, L., Fan, P. F., and Zhang, L. (2021). Species bias and spillover effects in scientific research on Carnivora in China. Zool. Res. 42, 354–361. doi: 10.24272/j.issn.2095-8137.2021.033
Weiskopf, S. R., Kachel, S. M., and McCarthy, K. P. (2016). What are snow leopards really eating? Identifying bias in food-habit studies. Wildl. Soc. Bull. 40, 233–240. doi: 10.1002/wsb.640
Xiong, M. Y., Wang, D. J., Bu, H. L., Shao, X. N., Zhang, D., Li, S., et al. (2017). Molecular dietary analysis of two sympatric felids in the Mountains of Southwest China biodiversity hotspot and conservation implications. Sci. Rep. 7:41909. doi: 10.1038/srep41909
Keywords: high-throughput sequencing, Lutra lutra, scat DNA, prey composition, universal vertebrate primer
Citation: Wang Q, Wang Z, Zheng K, Zhang P, Shen L, Chen W, Fan P and Zhang L (2022) Assessing the Diet of a Predator Using a DNA Metabarcoding Approach. Front. Ecol. Evol. 10:902412. doi: 10.3389/fevo.2022.902412
Received: 23 March 2022; Accepted: 31 May 2022;
Published: 06 July 2022.
Edited by:
Owen S. Wangensteen, UiT The Arctic University of Norway, NorwayReviewed by:
Andjin Siegenthaler, University of Twente, NetherlandsYouri Lammers, UiT The Arctic University of Norway, Norway
Copyright © 2022 Wang, Wang, Zheng, Zhang, Shen, Chen, Fan and Zhang. This is an open-access article distributed under the terms of the Creative Commons Attribution License (CC BY). The use, distribution or reproduction in other forums is permitted, provided the original author(s) and the copyright owner(s) are credited and that the original publication in this journal is cited, in accordance with accepted academic practice. No use, distribution or reproduction is permitted which does not comply with these terms.
*Correspondence: Pengfei Fan, ZmFucGZAbWFpbC5zeXN1LmVkdS5jbg==; Lu Zhang, emhhbmdsdTM4QG1haWwuc3lzdS5lZHUuY24=