
95% of researchers rate our articles as excellent or good
Learn more about the work of our research integrity team to safeguard the quality of each article we publish.
Find out more
ORIGINAL RESEARCH article
Front. Ecol. Evol. , 01 August 2022
Sec. Paleoecology
Volume 10 - 2022 | https://doi.org/10.3389/fevo.2022.900219
This article is part of the Research Topic Past Interactions Between Climate, Land Use, and Vegetation View all 22 articles
 Xiaojin Bing1
 Qichao Yao2*Feifei Zhou1Zhuangpeng Zheng1Maowei Bai1Shixiong Jiang3Chongqing Wang3Keyan Fang1*
The snow cover extent (SCE) on the southeastern Tibet Plateau (SETP) has an important impact on the dynamics of the East Asian winter monsoon and the runoff changes of the first and third largest rivers in Asia, namely, the Yangtze River and the Yarlung Zangbo River. Unfortunately, the shortness of instrumental SCE data of a few decades limits our ability to understand its long-term variability before the industrial era. Here, we developed Abies faxoniana tree-ring total ring width (TRW), early-wood width (EWW), and late-wood width (LWW) chronologies for the past four centuries at Little Qamdo Village (XQDV), Markam County, on the SETP. The most significant positive correlation (r = 0.62, p < 0.01) was found between the EWW chronology and SCE from March to May (SCE3–5). The SCE would affect the onset of the growing season through soil moisture, restricting the early-wood growth of trees. Thus, we presented a reconstruction of SCE3–5 via EWW chronology since AD 1660 for SETP. We observed two abrupt changes from low to high around the years 1685 and 1998 for our reconstructed SCE3–5. In addition, we found that the positive anomalies of the reconstructed SCE3–5 after 1988 cohered with the distinct increase of the East Asian winter monsoon.
Variations in SCE have strong impacts on climate change. The expansion of SCE increases surface albedo and reduces absorbed shortwave radiation. When the snow melts, it increases the latent heat sink at the expense of sensible heat, resulting in cooling in the snow-covered regions. Moreover, snow is also a critical component of the hydrological system in middle/high altitude regions, acting as a reservoir of water and a buffer control for river discharge and associated environmental processes (Groisman et al., 1994; You et al., 2002; Barnett et al., 2005; Zhang, 2005; Li et al., 2008; Räisänen, 2008; Zuo et al., 2012; IPCC, 2013; Qin et al., 2014; Huang et al., 2016).
In turn, snow cover extent (SCE) is highly sensitive to the current warming trend. Due to global warming, the beginning of the snow accumulating season (the end of the snow-melting season) will occur later (earlier) in most of the snow-covered regions, and the SCE will decrease except for very few exceptions (Masahiro et al., 2005). For example, the monotonic trend analysis of Northern Hemisphere SCE over the period of 1972–2006 with the Mann–Kendall test reveals significant declines in SCE during spring over North America and Eurasia, with lesser declines during winter and some increases in fall SCE (Déry and Brown, 2007). In particular, a number of studies have attributed the cause of diminishing spring SCE to Northern Hemisphere warming (Brown et al., 2010; McCabe and Wolock, 2010; Brown and Robinson, 2011).
Snow cover extent in China is primarily situated in the northeastern China, the northern part of Xinjiang Province, and the Tibetan Plateau (TP; Wang, 2012; Wang et al., 2012; Li, 2013; Xi and Zhang, 2013). The southeastern Tibetan Plateau (SETP) is one of the regions with a considerable volume of cryospheric extent (e.g., snow, ice, glacier, and permafrost) outside the polar regions (Liu and Chen, 2000; Qin et al., 2006; Kang et al., 2010; Yang et al., 2011; Immerzeel and Bierkens, 2012; Yao et al., 2018). Besides, as the product of snowfall in winter, the climatic effect of snow cover extent on the TP is also reflected in the coupling of its temporal and spatial variability as well as the circulation situation in winter and summer (Wang and Li, 2012; Wang et al., 2015).
As an important part of the global atmospheric circulation, the influence of the East Asian winter monsoon on the snow on the TP cannot be ignored (An, 2000; Mohtadi et al., 2011). On the one hand, since the terrain on the TP is tall and complex, the way the East Asian winter monsoon affects the region is therefore different from that of the eastern region of China. On the other hand, the spatial distribution of snowfall on the TP is quite different. Studies by Xu et al. (2005) and Xiu-zhong et al. (2010) found that the TP showed a basic distribution of lower SCE in the central hinterland and higher SCE in the surrounding areas. Zhu (2007) have revealed that there is higher SCE on the TP in winter and spring when the East Asian winter monsoon is stronger using both numerical simulation and data analysis. Wang et al. (2015) found there was a significant correlation between winter snowfall on the TP and the East Asian winter monsoon during 1961–2010, noting that since the beginning of the 21st century, the East Asian winter monsoon has been weakening and slowing down. The winter snowfall on the TP, meanwhile, has also shown a falling trend.
The spatiotemporal characteristics and extremity of the above effects in the long-term perspective are not known due to the lack of long-term SCE data from the SETP. The ground and satellite-based SCE records for the region are only a few decades long (Li, 1996; Pu et al., 2007), limiting a sufficient time window to assess the natural variability in SCE in the long-term perspective, and thus proxy data are required for the study of past SCE change.
Several studies have used tree-ring chronologies as a predictor to reconstruct SCE worldwide (Woodhouse, 2003; Timilsena and Piechota, 2008; Anderson et al., 2012; Masiokas et al., 2012; Ram and Mahendra, 2013) and the only reconstructed SCE record on the SETP is 300 years in length, providing the variation of SCE on an inter-decadal scale (Fang et al., 2016). However, almost all of these studies were based on the analysis of total ring-width (TRW) sequences, which were usually sensitive to a climate signal covering several months (Fritts, 2001; Speer, 2010). As a matter of fact, the increase in SCE may delay the growing season, restricting the early-wood growth of trees (Vaganov et al., 1999). Besides, SCE also affects soil moisture, which is an important factor limiting the growth of trees in cold and arid areas (Li et al., 2009; Fan et al., 2010). Thus, tree-ring early-wood variations may be an ideal material for reconstruction of SCE. Moreover, the analysis of the early-wood width (EWW) and late-wood width (LWW) chronologies helps us further understand the seasonality of climate changes and their impact on biomass production (Villanueva-Diaz et al., 2007; Griffin et al., 2013; Dannenberg and Wise, 2016; Torbenson et al., 2016).
The objectives of this study are to (1) identify the SCE3–5 sensitive proxy to reconstruct SCE3–5 variability over the past four centuries on the SETP based on the TRW, EWW, and LWW chronologies from Abies faxoniana trees and (2) further explore the relationship between our reconstructed SCE3–5 history and the East Asian winter monsoon.
The study area is located at Xiao Qamdo Village (XQDV) (98.7°E, 29.3°N), Markam County, on the SETP (Figure 1), which is in the transition zone between the TP and the Western Sichuan Plateau. The mountainous area has a continental plateau climate with high altitude, low temperature, less precipitation, large evaporation, and various climate types (Ye, 1981). Due to the special physical and geographical conditions, the ecosystem in the region has obvious vulnerability characteristics. The Abies faxoniana is the dominant forest species growing along an elevation gradient from 3,607 to 3,618 m a.s.l. in our study area, and the 50 tree-ring samples in this work were collected in October 2019 from 26 Abies faxoniana trees. Our sampling site is located at the upper limit of the forest, where tree growth is usually sensitive to temperature (Fritts, 1976).
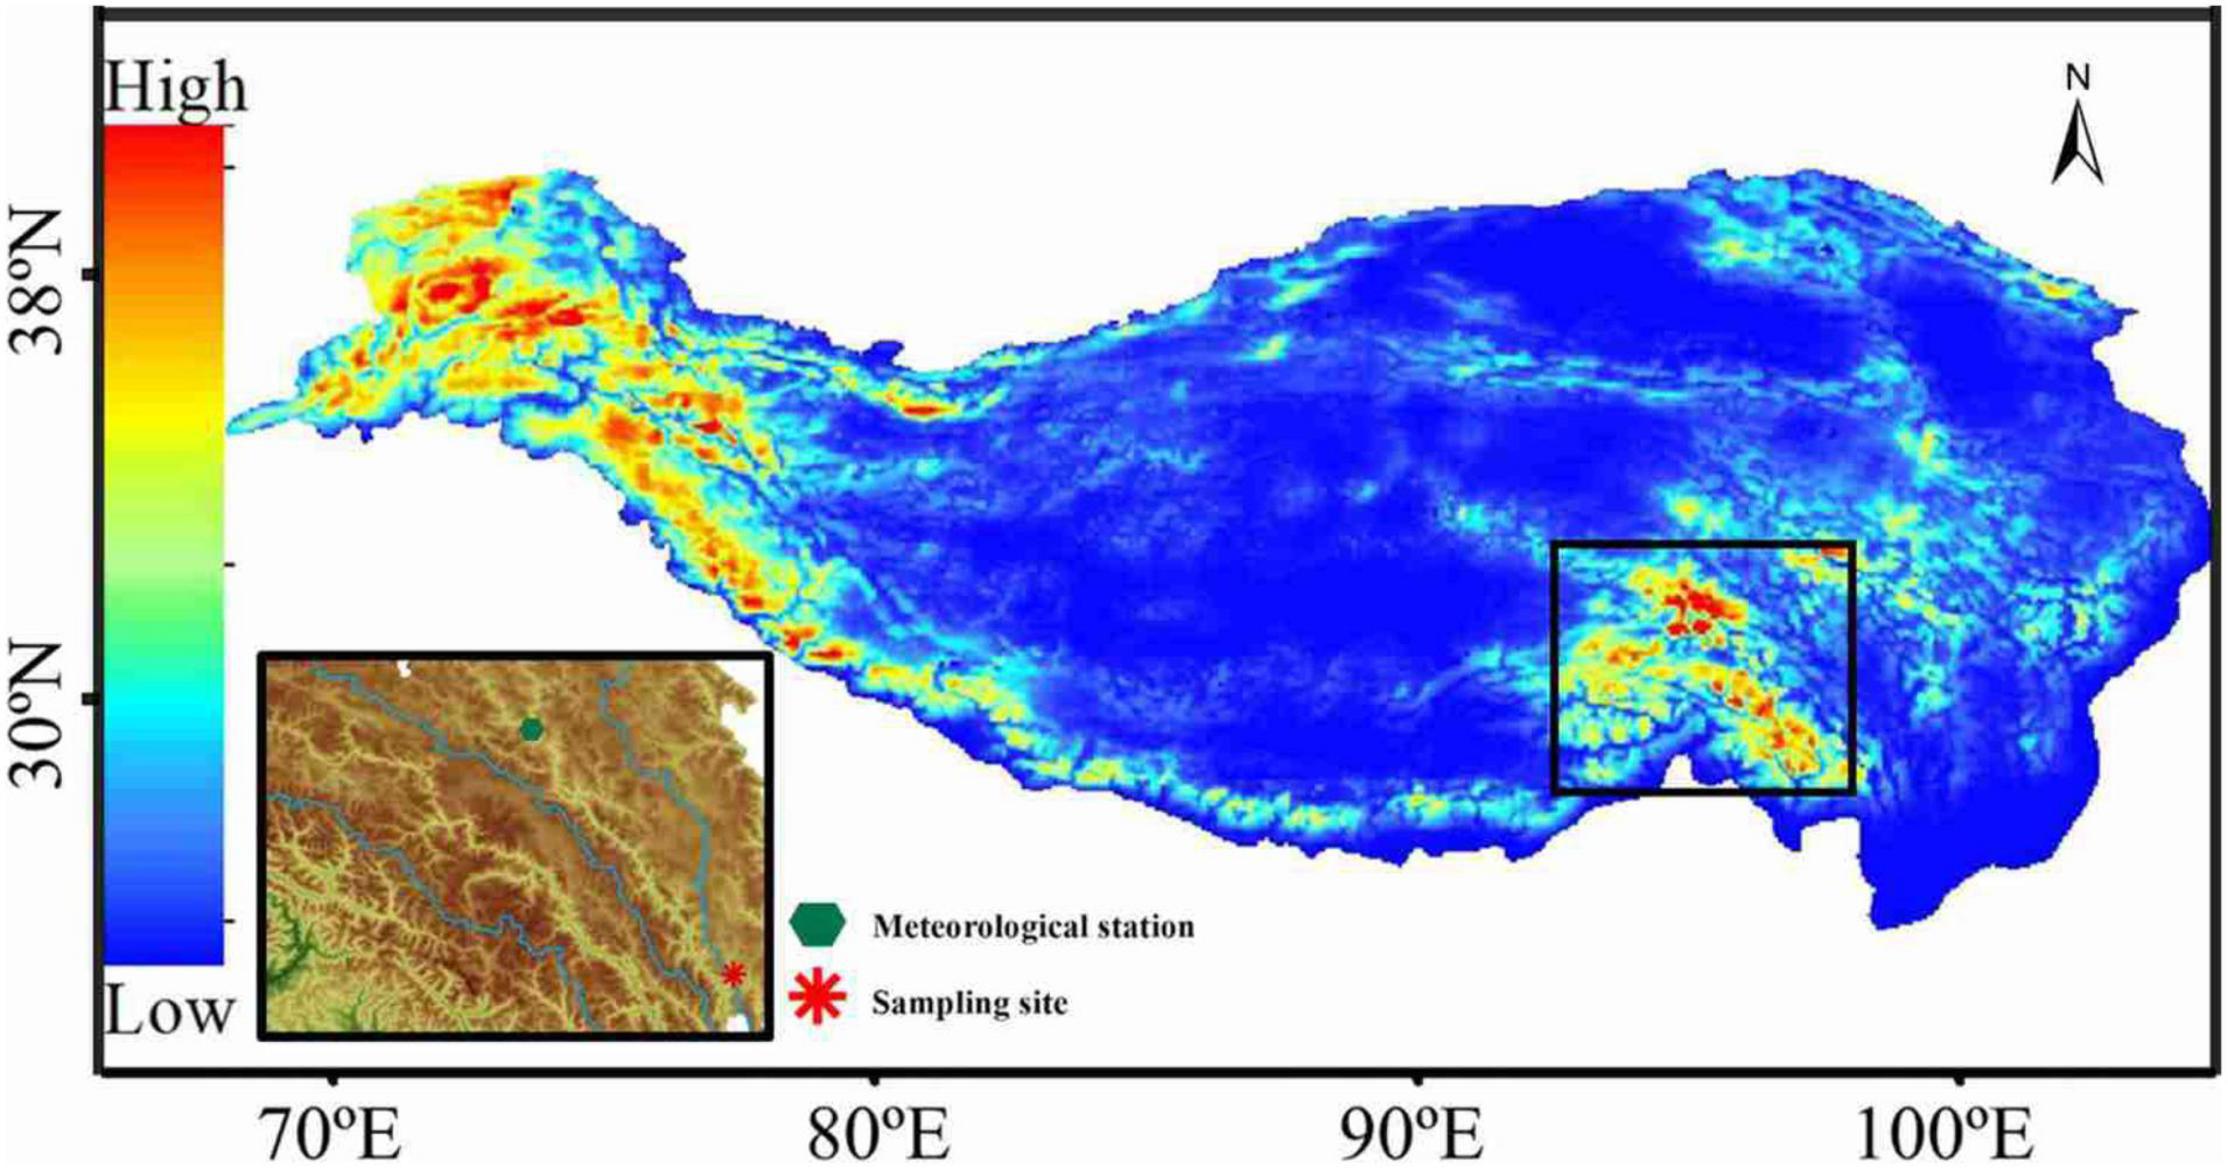
Figure 1. The snow cover distribution and the locations of tree-ring sampling site and meteorological station in this study. The map on the right shows the snow cover on the Tibet Plateau derived by Yan et al. (2021). Blue represents the low snow cover, and red represents the high.
Tree-ring samples were collected and prepared for analysis based on the technique described by Stokes and Smiley (1968) and Fritts (1976). Following the surfacing, samples were scanned using an Epson® Expression 10000 flatbed scanner at resolutions between 800 and 1,200 dpi, depending on the image clarity. Higher resolution images were required to enable the distinction of narrow rings in periods of suppressed growth if the coarser-resolution was deemed inefficient for this purpose. Dating, measuring, and visual cross-dating of annual rings were carried out using the program WinDENDROTM Density (version 2008b). EWW and LWW measurements were aided by the distinct size differentiation of early-wood and late-wood vessels in Abies faxoniana tree samples. Early-wood and late-wood measurements were based on a defined boundary of 40% of the minimum to maximum relative pixel density in the reflectance values, where the onset of late-wood growth was noted as having denser and compacted vessels that were darker in nature (Supplementary Figure 1). Some early-latewood boundaries were adjusted manually to correct for errors in the automatic detection process.
COFECHA was used to verify cross-dating and provide chronology statistics that describe the strength of intercorrelation between tree-ring samples at the study site (Table 1; Holmes, 1983). The chronologies were computed as the robust mean value of the normalized, detrended, and standardized TRW, EWW, and LWW available each year, using the computer programs ARSTAN (Cook and Holmes, 1986). The TRW, EWW, and LWW measurements were standardized to remove the biological growth trend as well as other low-frequency variations due to stand dynamics. In our study, the chronologies were developed with conservative methods by fitting a negative exponential curve or a straight line to any slope. A cubic spline with a 50% frequency-response cutoff equal to 67% of the series length was also used in a few cases when anomalous growth trends occurred. The reliability of each standard chronology was evaluated by the expressed population signal (EPS) and mean series intercorrelation (Rbar) (Cook and Kairiukstis, 1990). Both Rbar and EPS were calculated for a 50-year moving window with 25-year overlaps along the chronology. The reliable part of the chronologies was defined by a threshold of EPS 0.85 (Wigley et al., 1984). The standard (the detrended index chronology) TRW, EWW, and LWW chronologies were produced and were subsequently used throughout the analyses (Fritts, 1976).
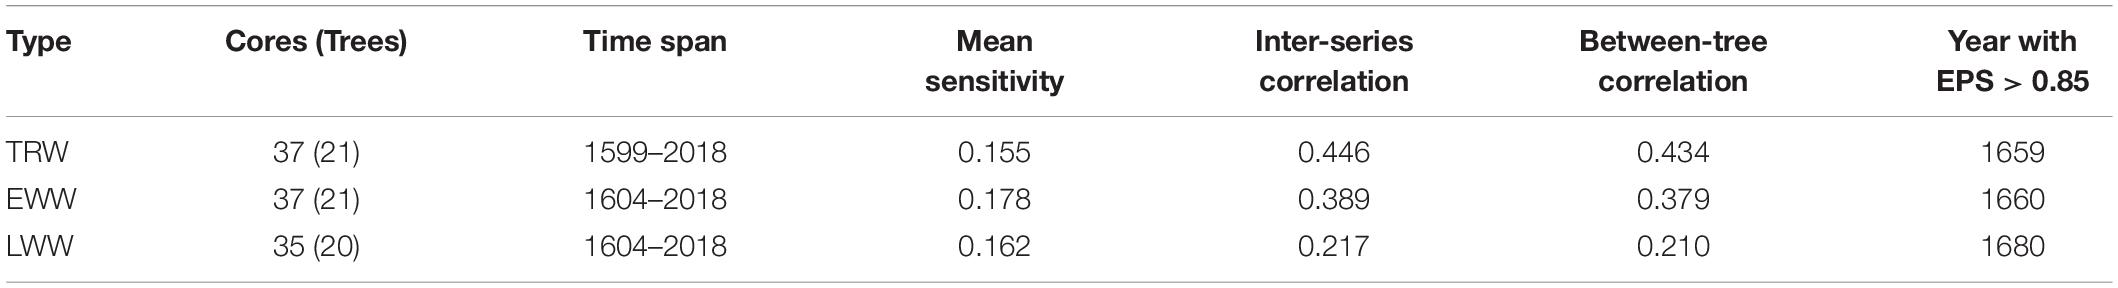
Table 1. Statistics for each chronology at XQDV.
Monthly maximum (Tmax), minimum (Tmin), temperature (°C), and monthly total precipitation (Pre) (mm) records for the period of 1954–2018 were obtained from the nearest meteorological station (Qamdo meteorological station; 31.15°E, 97.17°N, 3307.1 m a.s.l.; Figure 2). The gridded SCE (%) database with weekly resolution covering the northern hemisphere (20°–90°N1; Robinson et al., 2012) was also derived from the Climate Research Unit (CRU)2. The SCE on the TP is mainly distributed in the northwest and southeast, with the largest in the northwest. The spatial range of SCE data used in this study is 93° to 98°E and 29° to 31°N, which belongs to the second largest SCE area on the TP. The time span of the database is from 1966 to 2018, and the spatial resolution is 2° × 2°, mainly compiled based on the snowfall and snow depth data monitored by satellites and stations. These data were reduced to annual and seasonal means and totals.
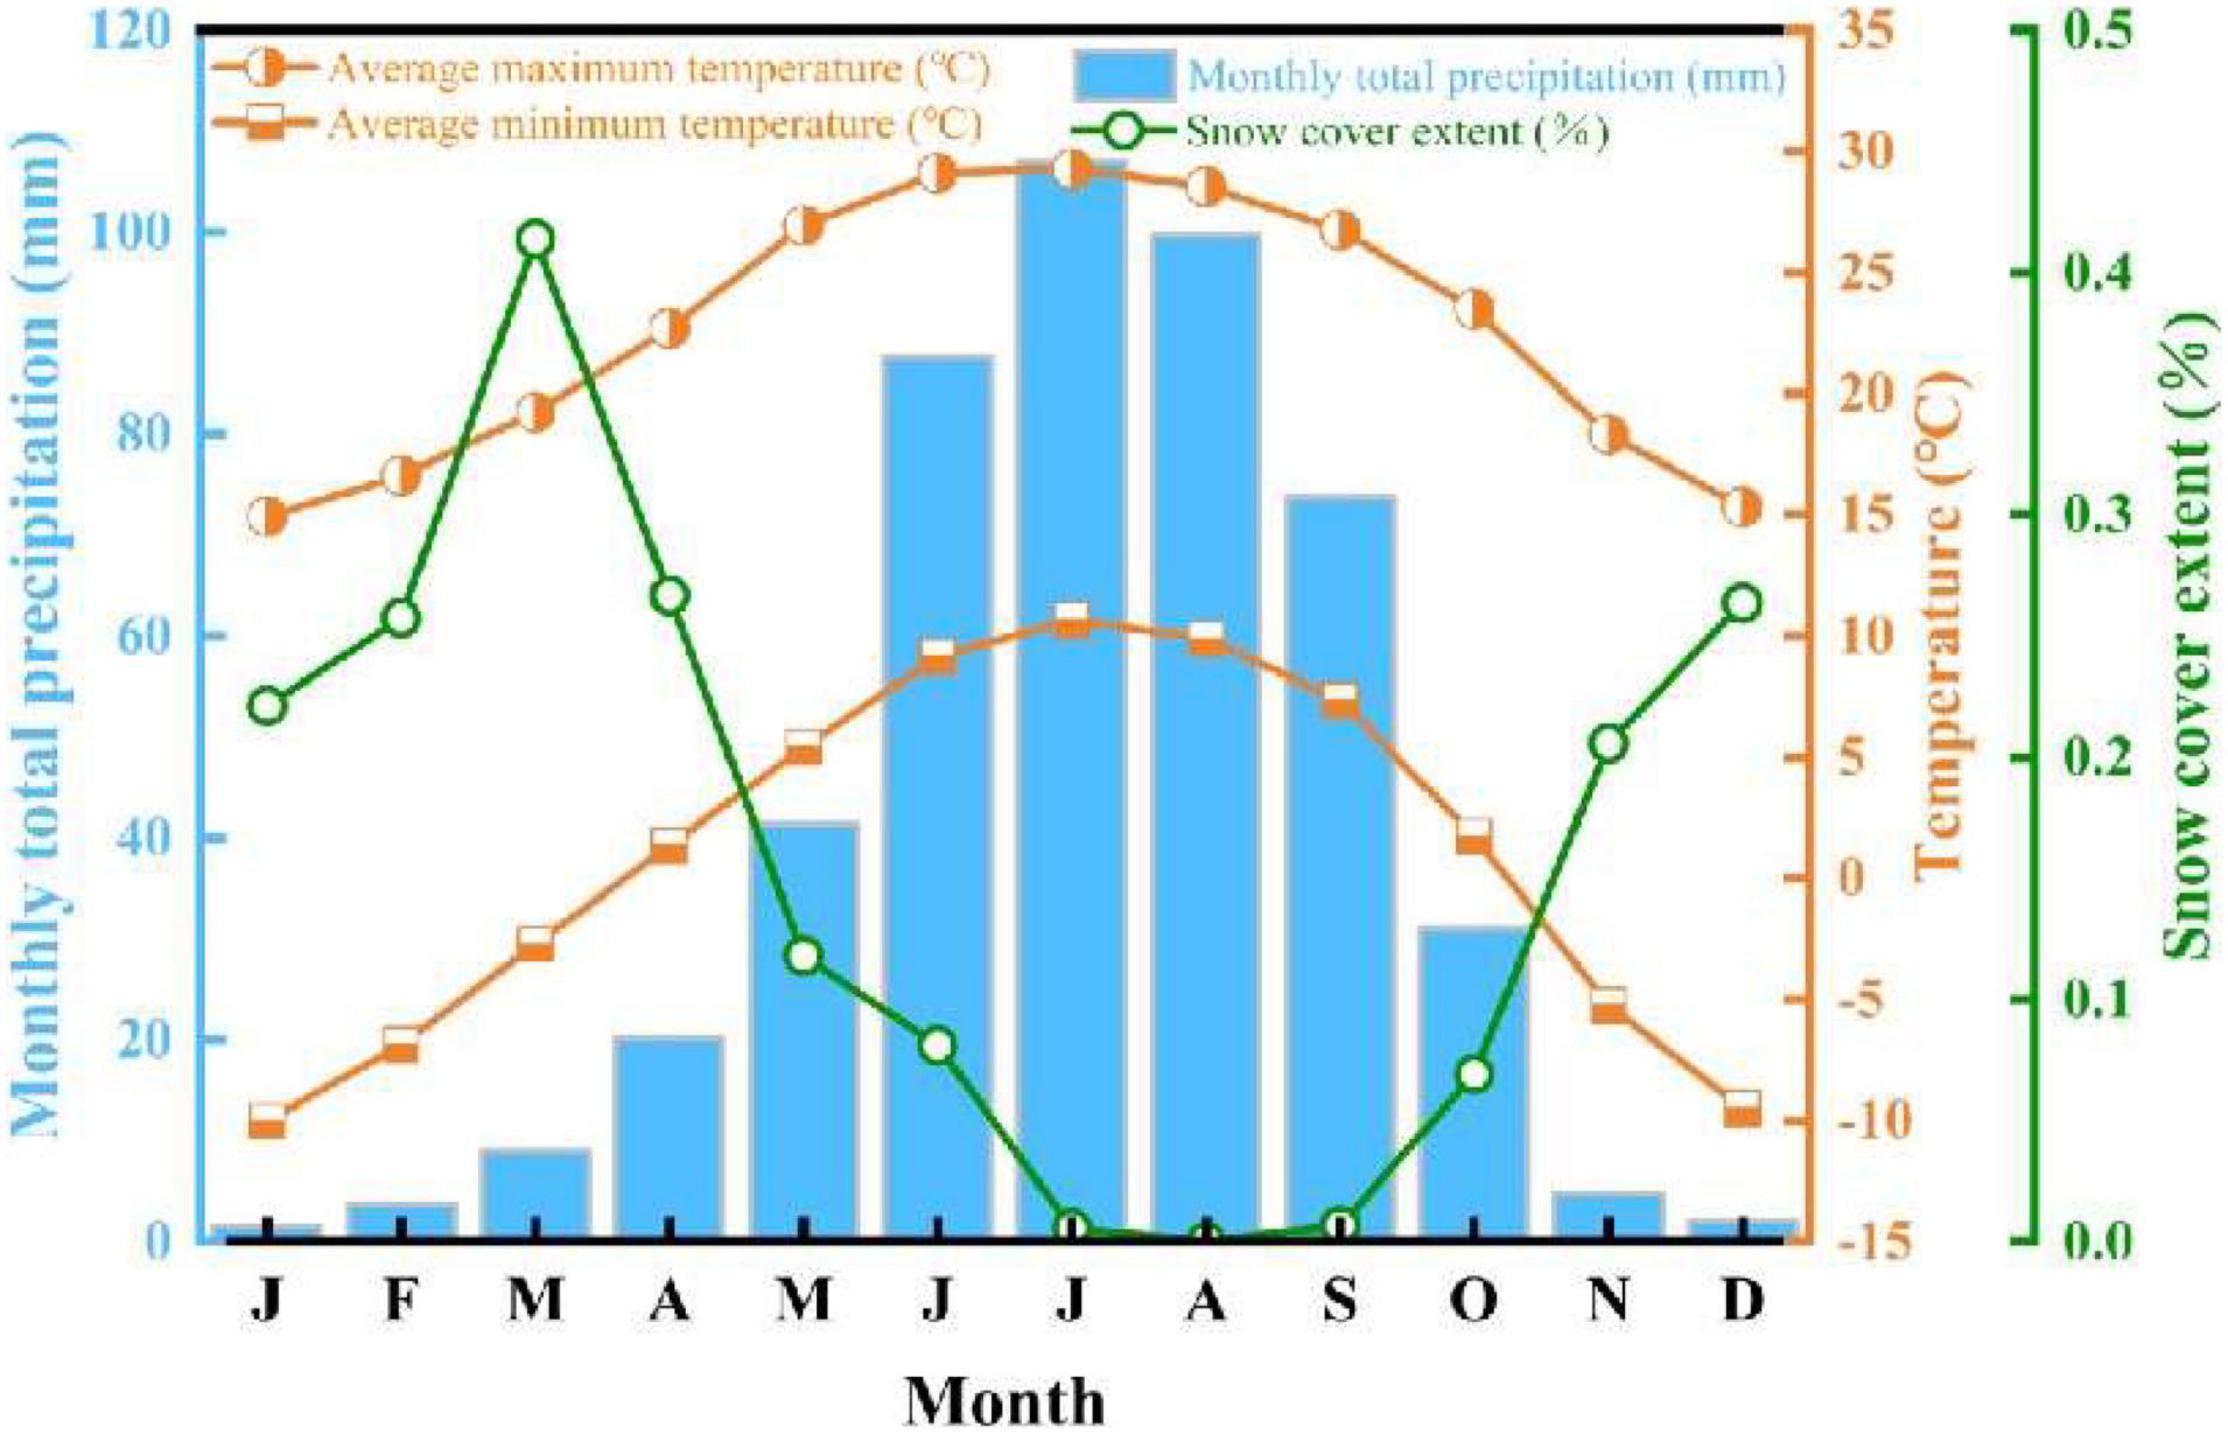
Figure 2. The pattern of monthly maximum (Tmax), minimum (Tmin), temperature (°C), and monthly total precipitation (Pre) (mm) for the period of 1954–2018 and the gridded snow cover extent (SCE) (%) for 1966–2018.
After comparing and analyzing 18 East Asian winter monsoon indexes affecting East Asia, Wang and Chen (2010) classified the East Asian winter monsoon indexes into four categories, namely, East–West pressure difference, low-level wind field characteristics, high-level wind shear, and East Asian Trough, and pointed out that most of the main East Asian winter monsoon indexes showed that the East Asian winter monsoon entered a weakening stage in the 1980s. Other studies have also proved the characteristics of this weakening trend (Zhu, 2008; Liu et al., 2013). For the sake of objectivity, the East Asian trough location index (CW) and the Siberian high-intensity index (SH) during the period of 1961–2010, developed by Wang et al. (2015), are selected to illustrate the linkage of the SCE to the SETP and large-scale circulation in our study.
To evaluate the relationship between climatic variables and the TRW, EWW, and LWW indices for Abies faxoniana, we used correlation analyses, applied with the software Dendroclim (Biondi and Waikul, 2004). All statistical procedures were evaluated at a level of significance at P < 0.05. SCE modeling was conducted using the transfer function approach (Fritts, 1976; Cook and Kairiukstis, 1990). Multiple stepwise linear regression was used to develop a linear model to estimate the dependent SCE variable from a set of potential tree-ring predictors.
Based on the correlation analysis, a linear regression model was developed to reconstruct SCE3–5 via the EWW chronology. In view of the short period of instrumental SCE records used in the reconstruction model, we used the leave-one-out verification method (Michaelsen, 1987) to test the robustness of the calibration model. The evaluative statistics included Pearson’s correlation coefficient (r), the t-value derived using the product mean test (PMT), the raw sign test (ST) and the first-difference sign test (ST1), and the reduction of error (RE) (Cook et al., 1999).
We performed the Mann–Kendall (M-K) abrupt test method (M-K method) on the reconstructed SCE3–5 time series with the trend package in the R program (Yi et al., 2011). The M-K method can determine the time of our reconstructed SCE3–5 mutation according to the two output sequences (UF and UB): if the UF value is greater than 0, it indicates that the sequence shows an upward trend; if the UF value is less than 0, it indicates a downward trend; when the upward or downward trend exceeds the confidence level (α = 0.05), it indicates that the upward or downward trend is significant; if the UF and UB sequences intersect and the intersection is fallen in the confidence level, the time corresponding to the intersection is the time when the mutation starts.
The TRW, EWW, and LWW chronologies were obtained from Abies faxoniana trees at XQDV and spanned the intervals of 1668–2018, 1660–2018, and 1680–2018, respectively (Table 1). The three standardized chronologies showed a good coherence of variability over the common period of 1680–2018 (r = 0.95, P < 0.001 for EWW vs. TRW; r = 0.84, P < 0.001 for LWW vs. TRW; r = 0.80, P < 0.001 for EWW vs. LWW), exhibiting similar growth patterns. The three chronologies revealed sustained high growth patterns in the early-1700s, late-1700s, mid-1850s, mid-1950s, and 2010s, and suppressed growth patterns in the early-1800s, late-1800s, and early-1900s (Figure 3). Based on inter-series correlation and between-tree correlations (Table 1), it appears that LWW chronology may be less sensitive and responsive to climatic fluctuations. The peak correlations (r = 0.95, P < 0.001) were found between the EWW and TRW chronologies (Supplementary Figure 2), which is reasonable as the EWW accounts for most of the TRW.
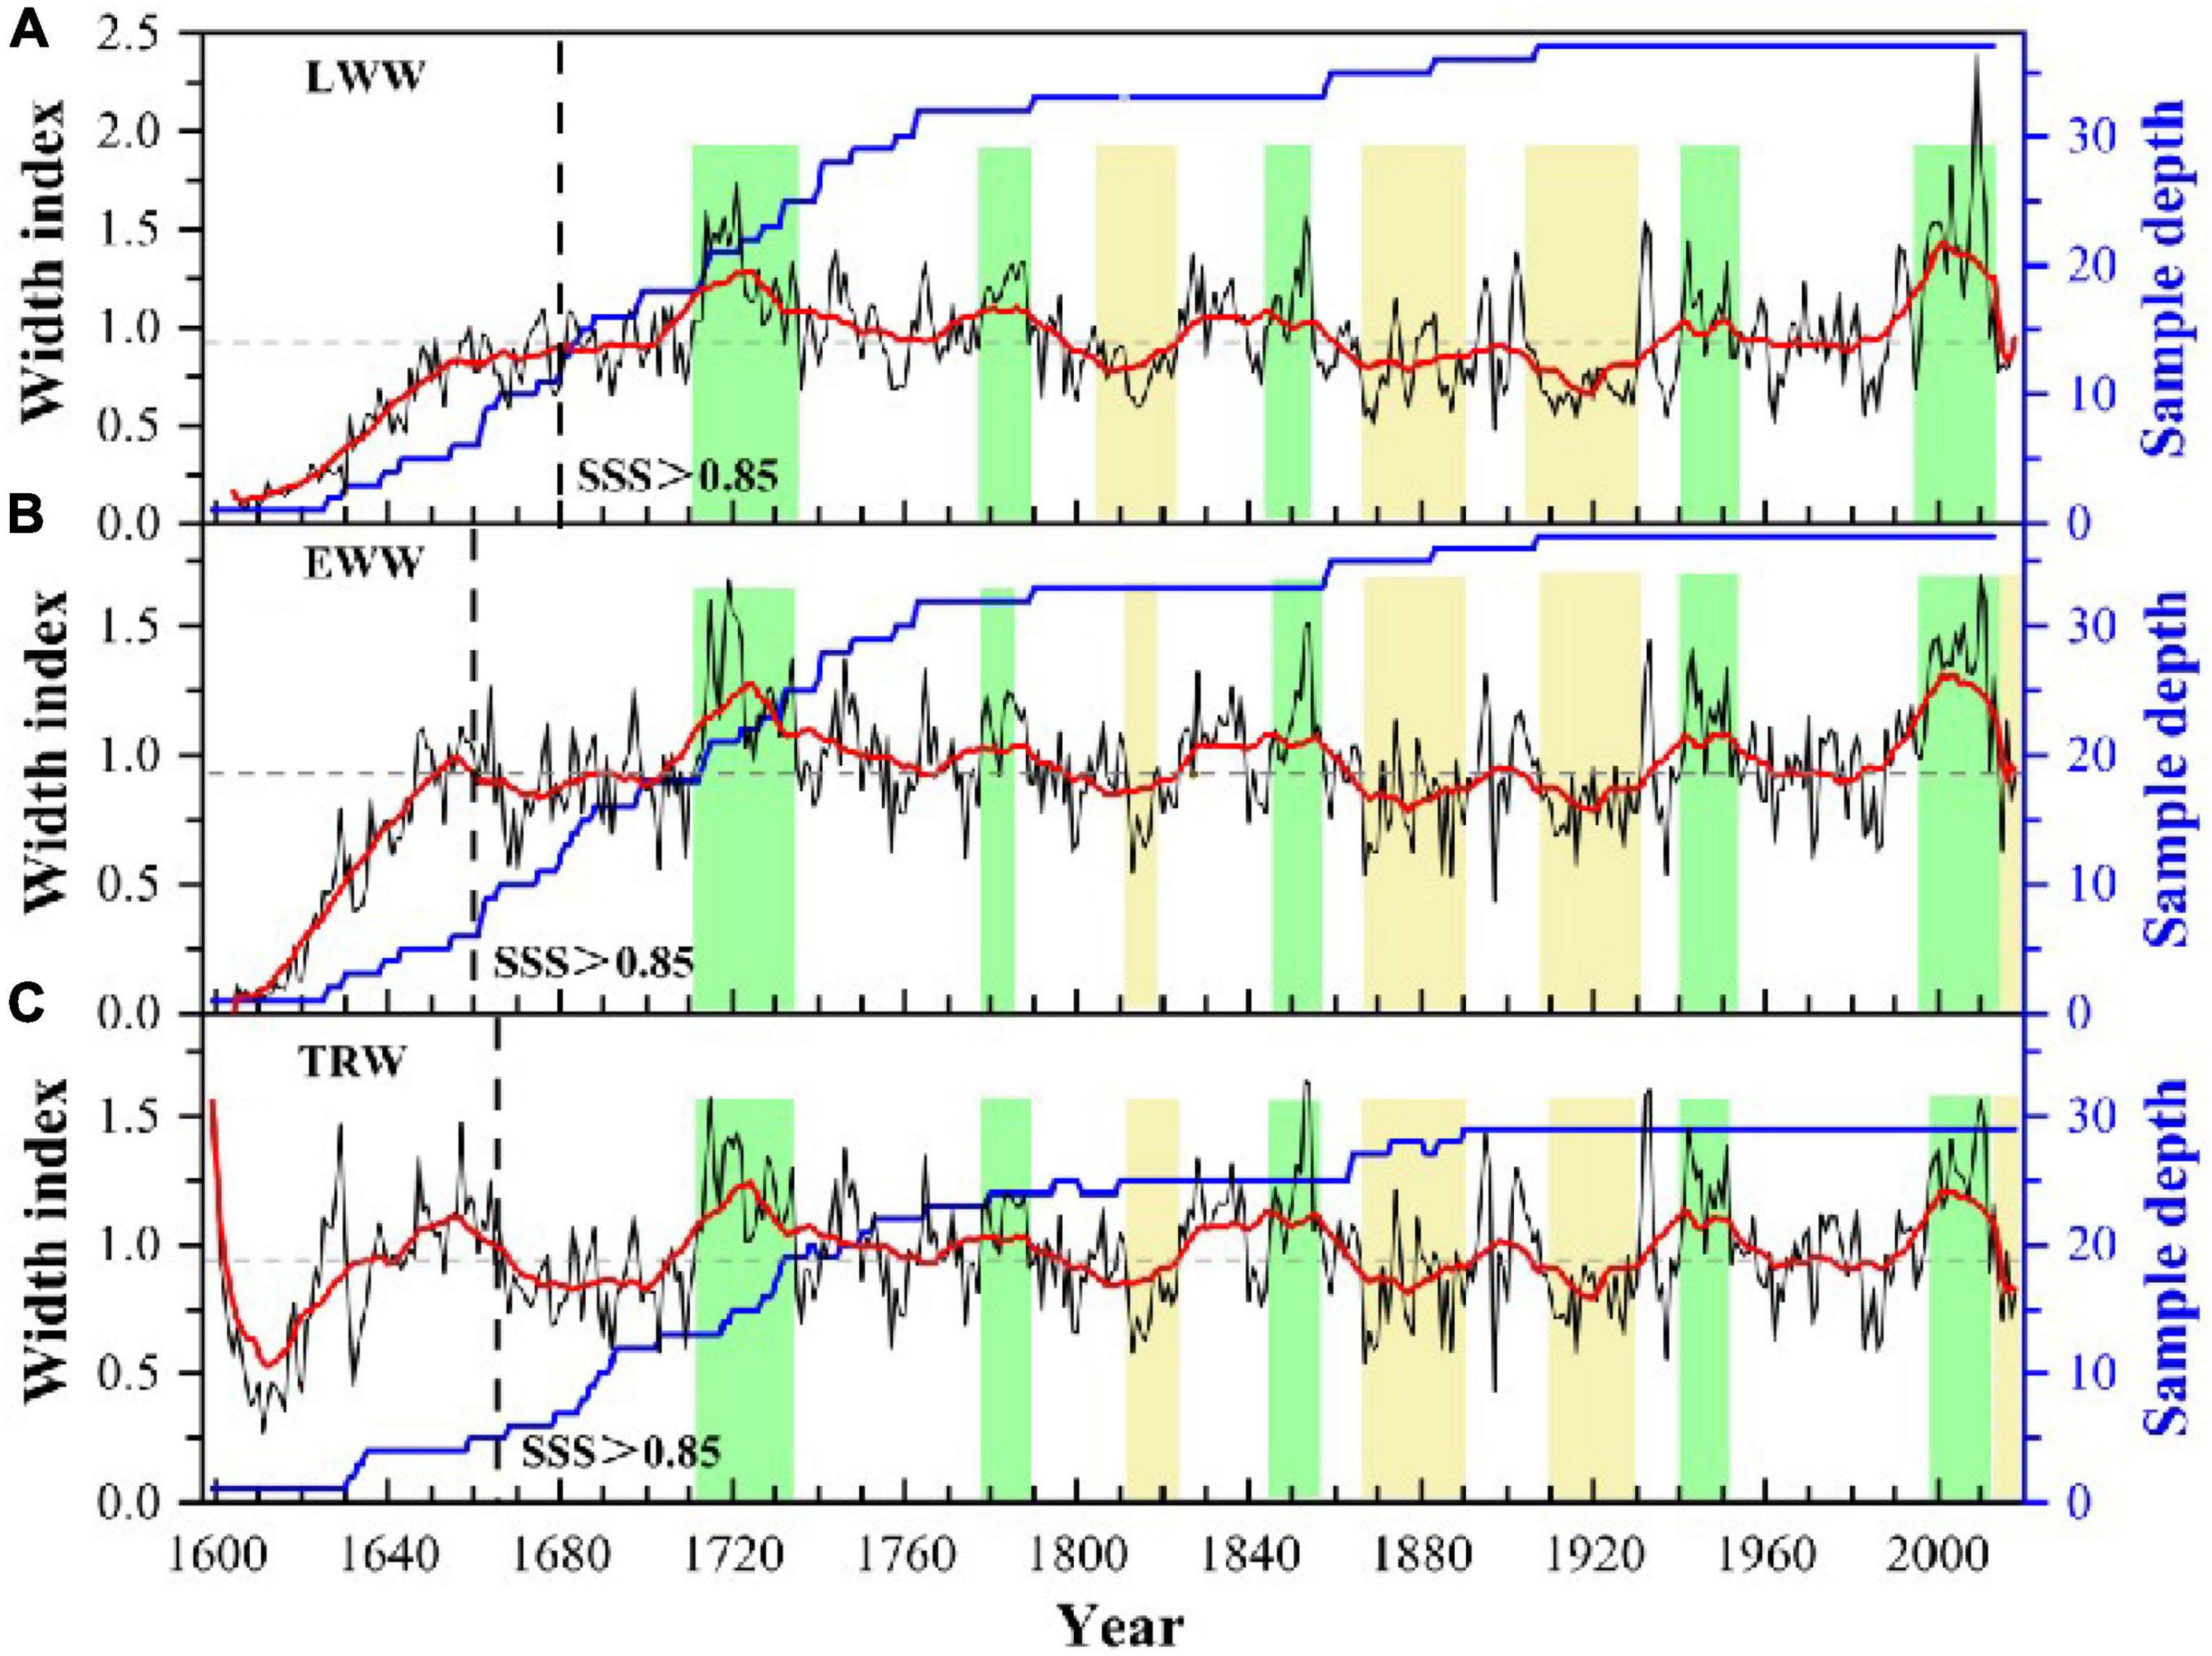
Figure 3. Standard tree-ring indices and the sample depth at XQDV for (A) LWW (1680–2018), (B) EWW (1660–2018), and (C) TRW (1668–2018). Chronologies are smoothed by a 20-year running average (red curves). Yellow shading indicates years of suppressed growth (below the mean), and green shading indicates periods of rapid growth above the mean.
The EWW chronology was significantly positively correlated with monthly SCE for the months of current March (r = 0.52, P < 0.001) and April (r = 0.62, P < 0.001), and the month combination from current March–May (r = 0.59, P < 0.001) during 1979–2013. Interestingly, a significant positive correlation between the EWW chronology and the month combination of the monthly minimum temperature during the pre-growing season was also detected, although the significant correlation was not as high as that with SCE. The strong significant positive correlation between the TRW chronology and monthly minimum temperature occurs in the single month of current December (r = 0.84, P < 0.001), and the month combination from the previous November to current May (r = 0.44, P < 0.01). In contrast, the climate signal reflected by LWW seems to be much weaker because it only shows a significant positive correlation with the monthly minimum temperature in August (r = 0.33, P < 0.01; Figure 4).
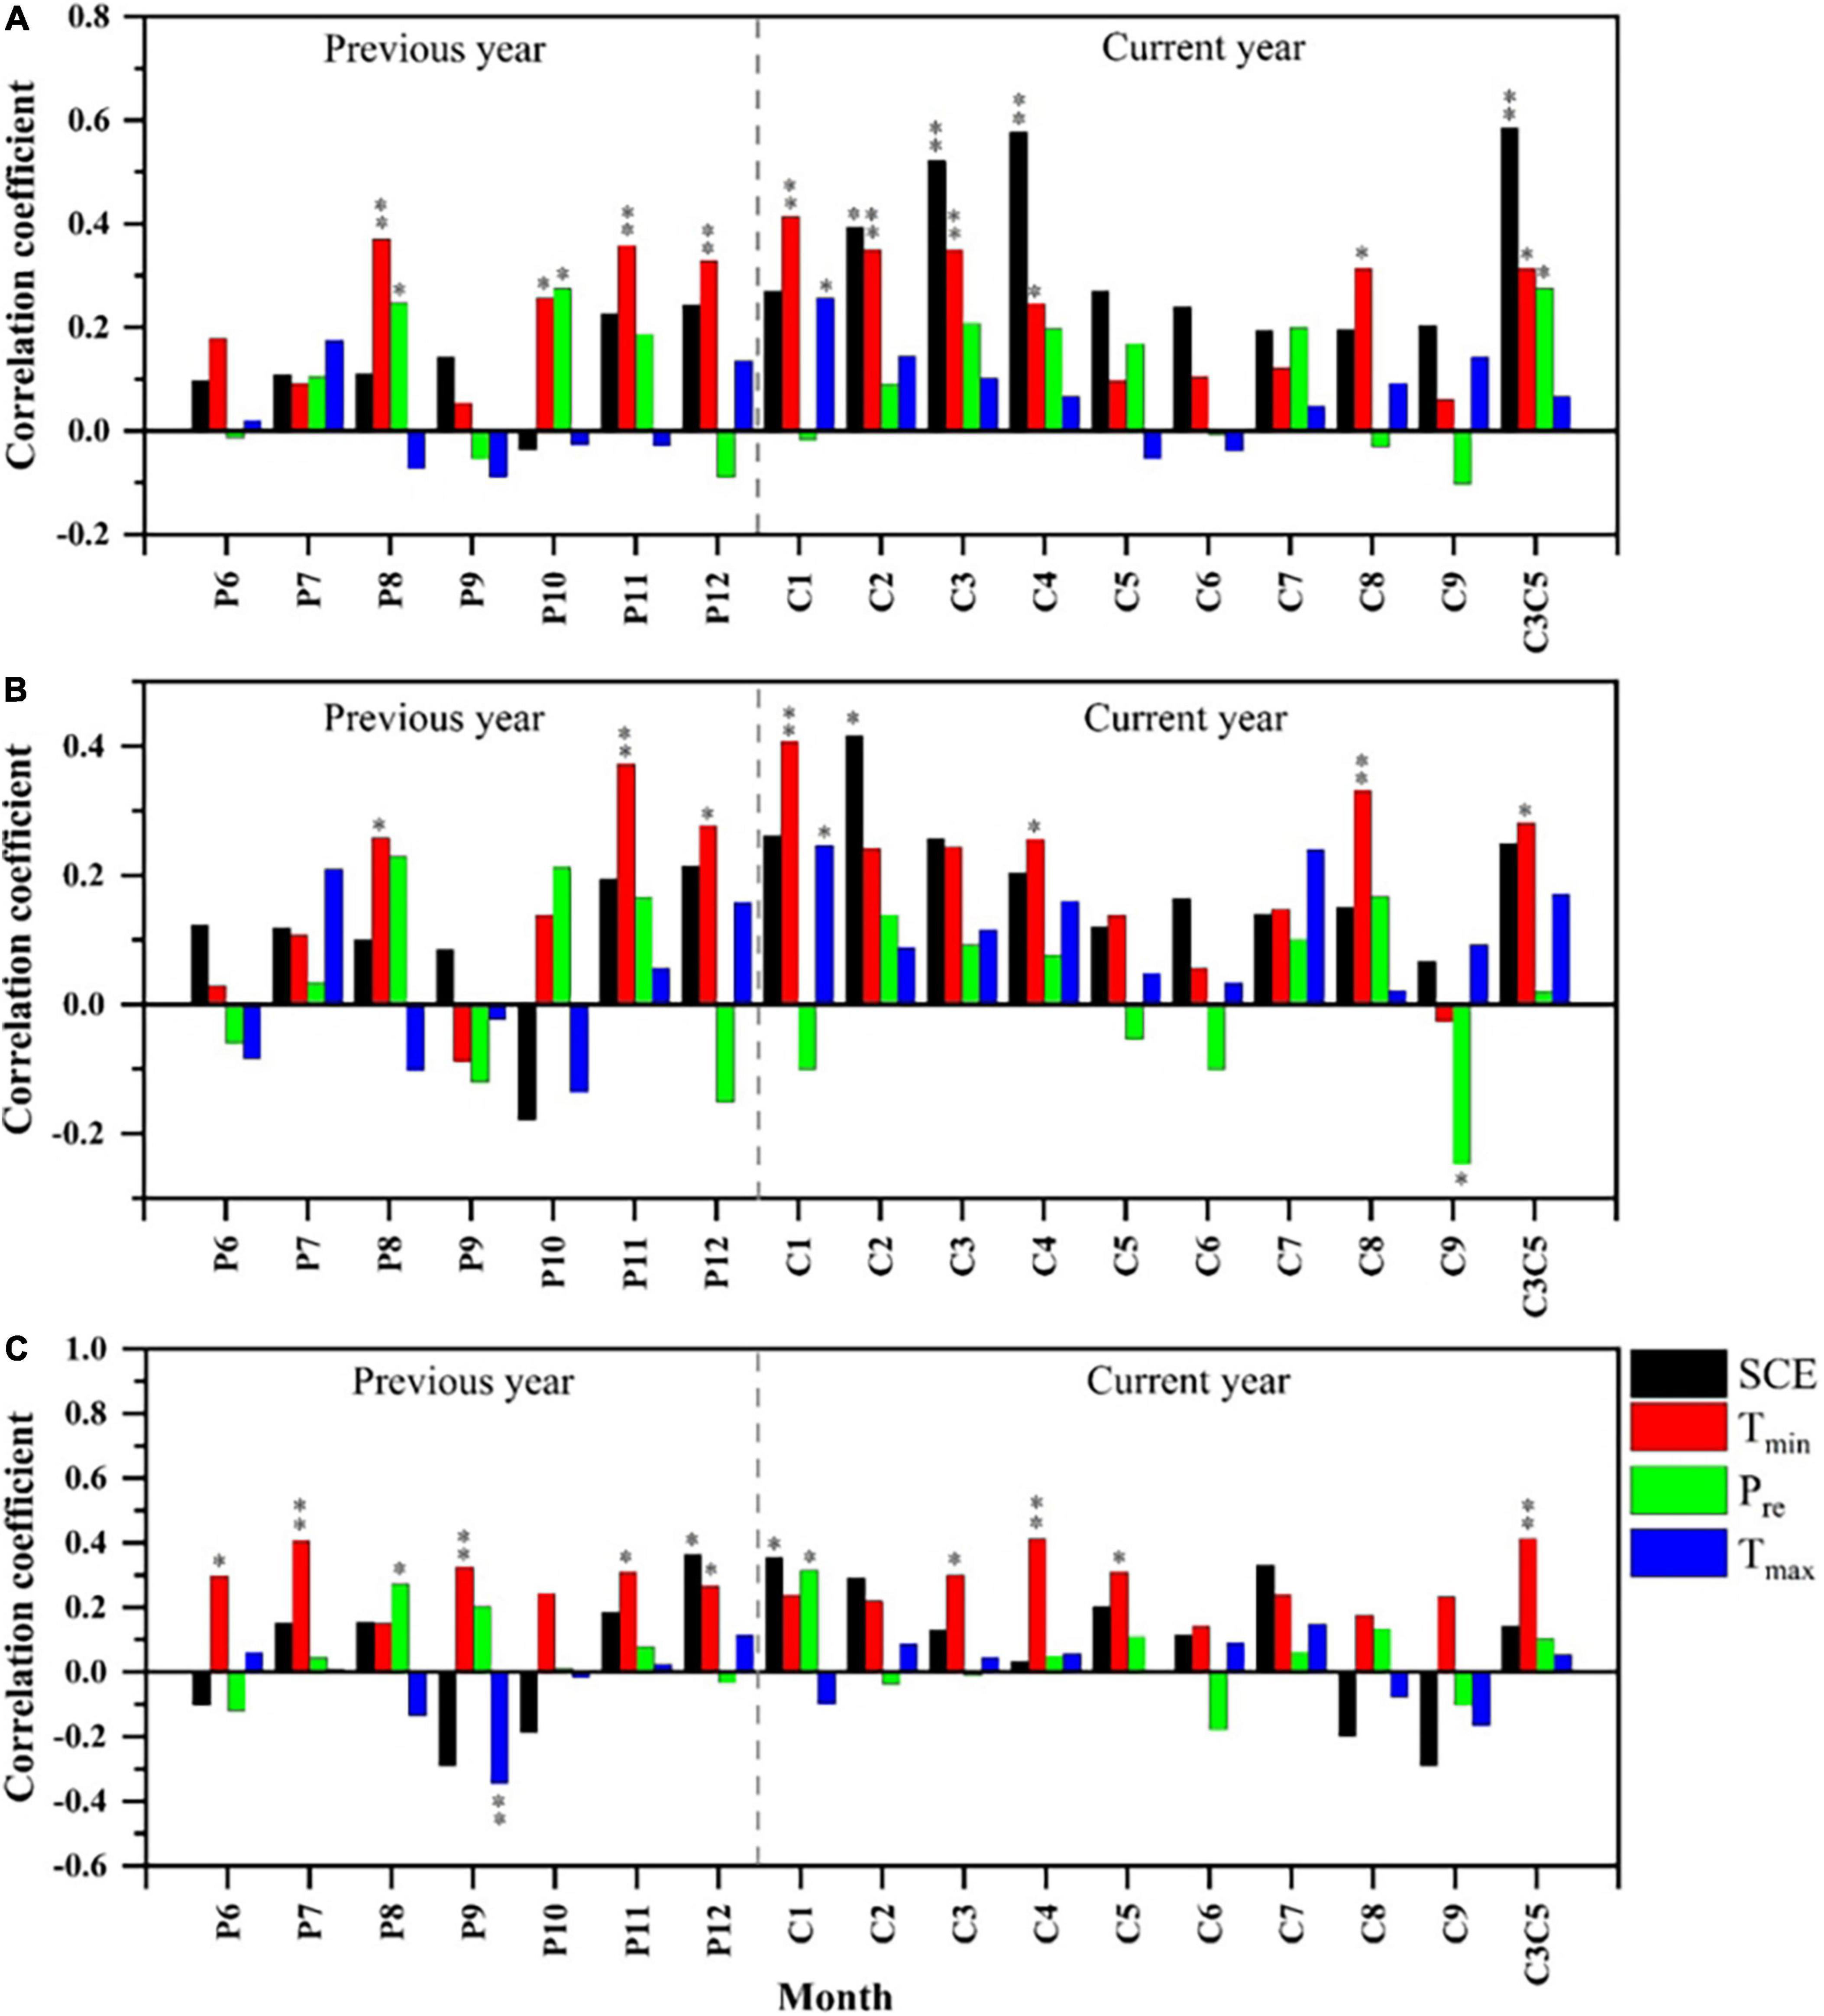
Figure 4. Correlation between (A) EWW, (B) LWW, and (C) TRW chronologies and climatic variables (SCE, Tmin, and Tmax) at XQDV. ** Indicates the significance at the 99% level of confidence and * indicates the significance at the 95% level of confidence.
A highlight of our study is the SCE signal recorded in the EWW chronology (Figure 4A). The EWW data was used to reconstruct the SCE3–5 by identifying the particular months/seasons climate variables. The confidence intervals of correlations are at the 95 and 99% confidence levels. Based on the results of the correlation analysis, a linear regression model between the EWW index and the SCE3–5 for the period of 1979–2013 was developed as follows:
(r = 0.62, R2 = 38.4%), where SCE3–5 represents the snow cover extent data from current March to May.
On the whole, the reconstructed and instrumental SCE3–5 data were in agreement (Figure 5A). According to the test results of the leave-one-out in Table 2, the r value between the reconstructed and the instrumental series is 0.62. ST1 does not reach 95% significance levels, while ST reaches 95% significance levels, indicating that the reconstructed series is more consistent with the instrumental series in low-frequency variation than in high-frequency variation (Liu and Shao, 2000; Figure 5B). The RE value (0.215) is far greater than 0, indicating that the reconstruction results are stable and reliable (Cook et al., 1999). Therefore, based on this model, variations of SCE3–5 in the study area were reconstructed for the period of 1660–2013 CE (Figure 5B).
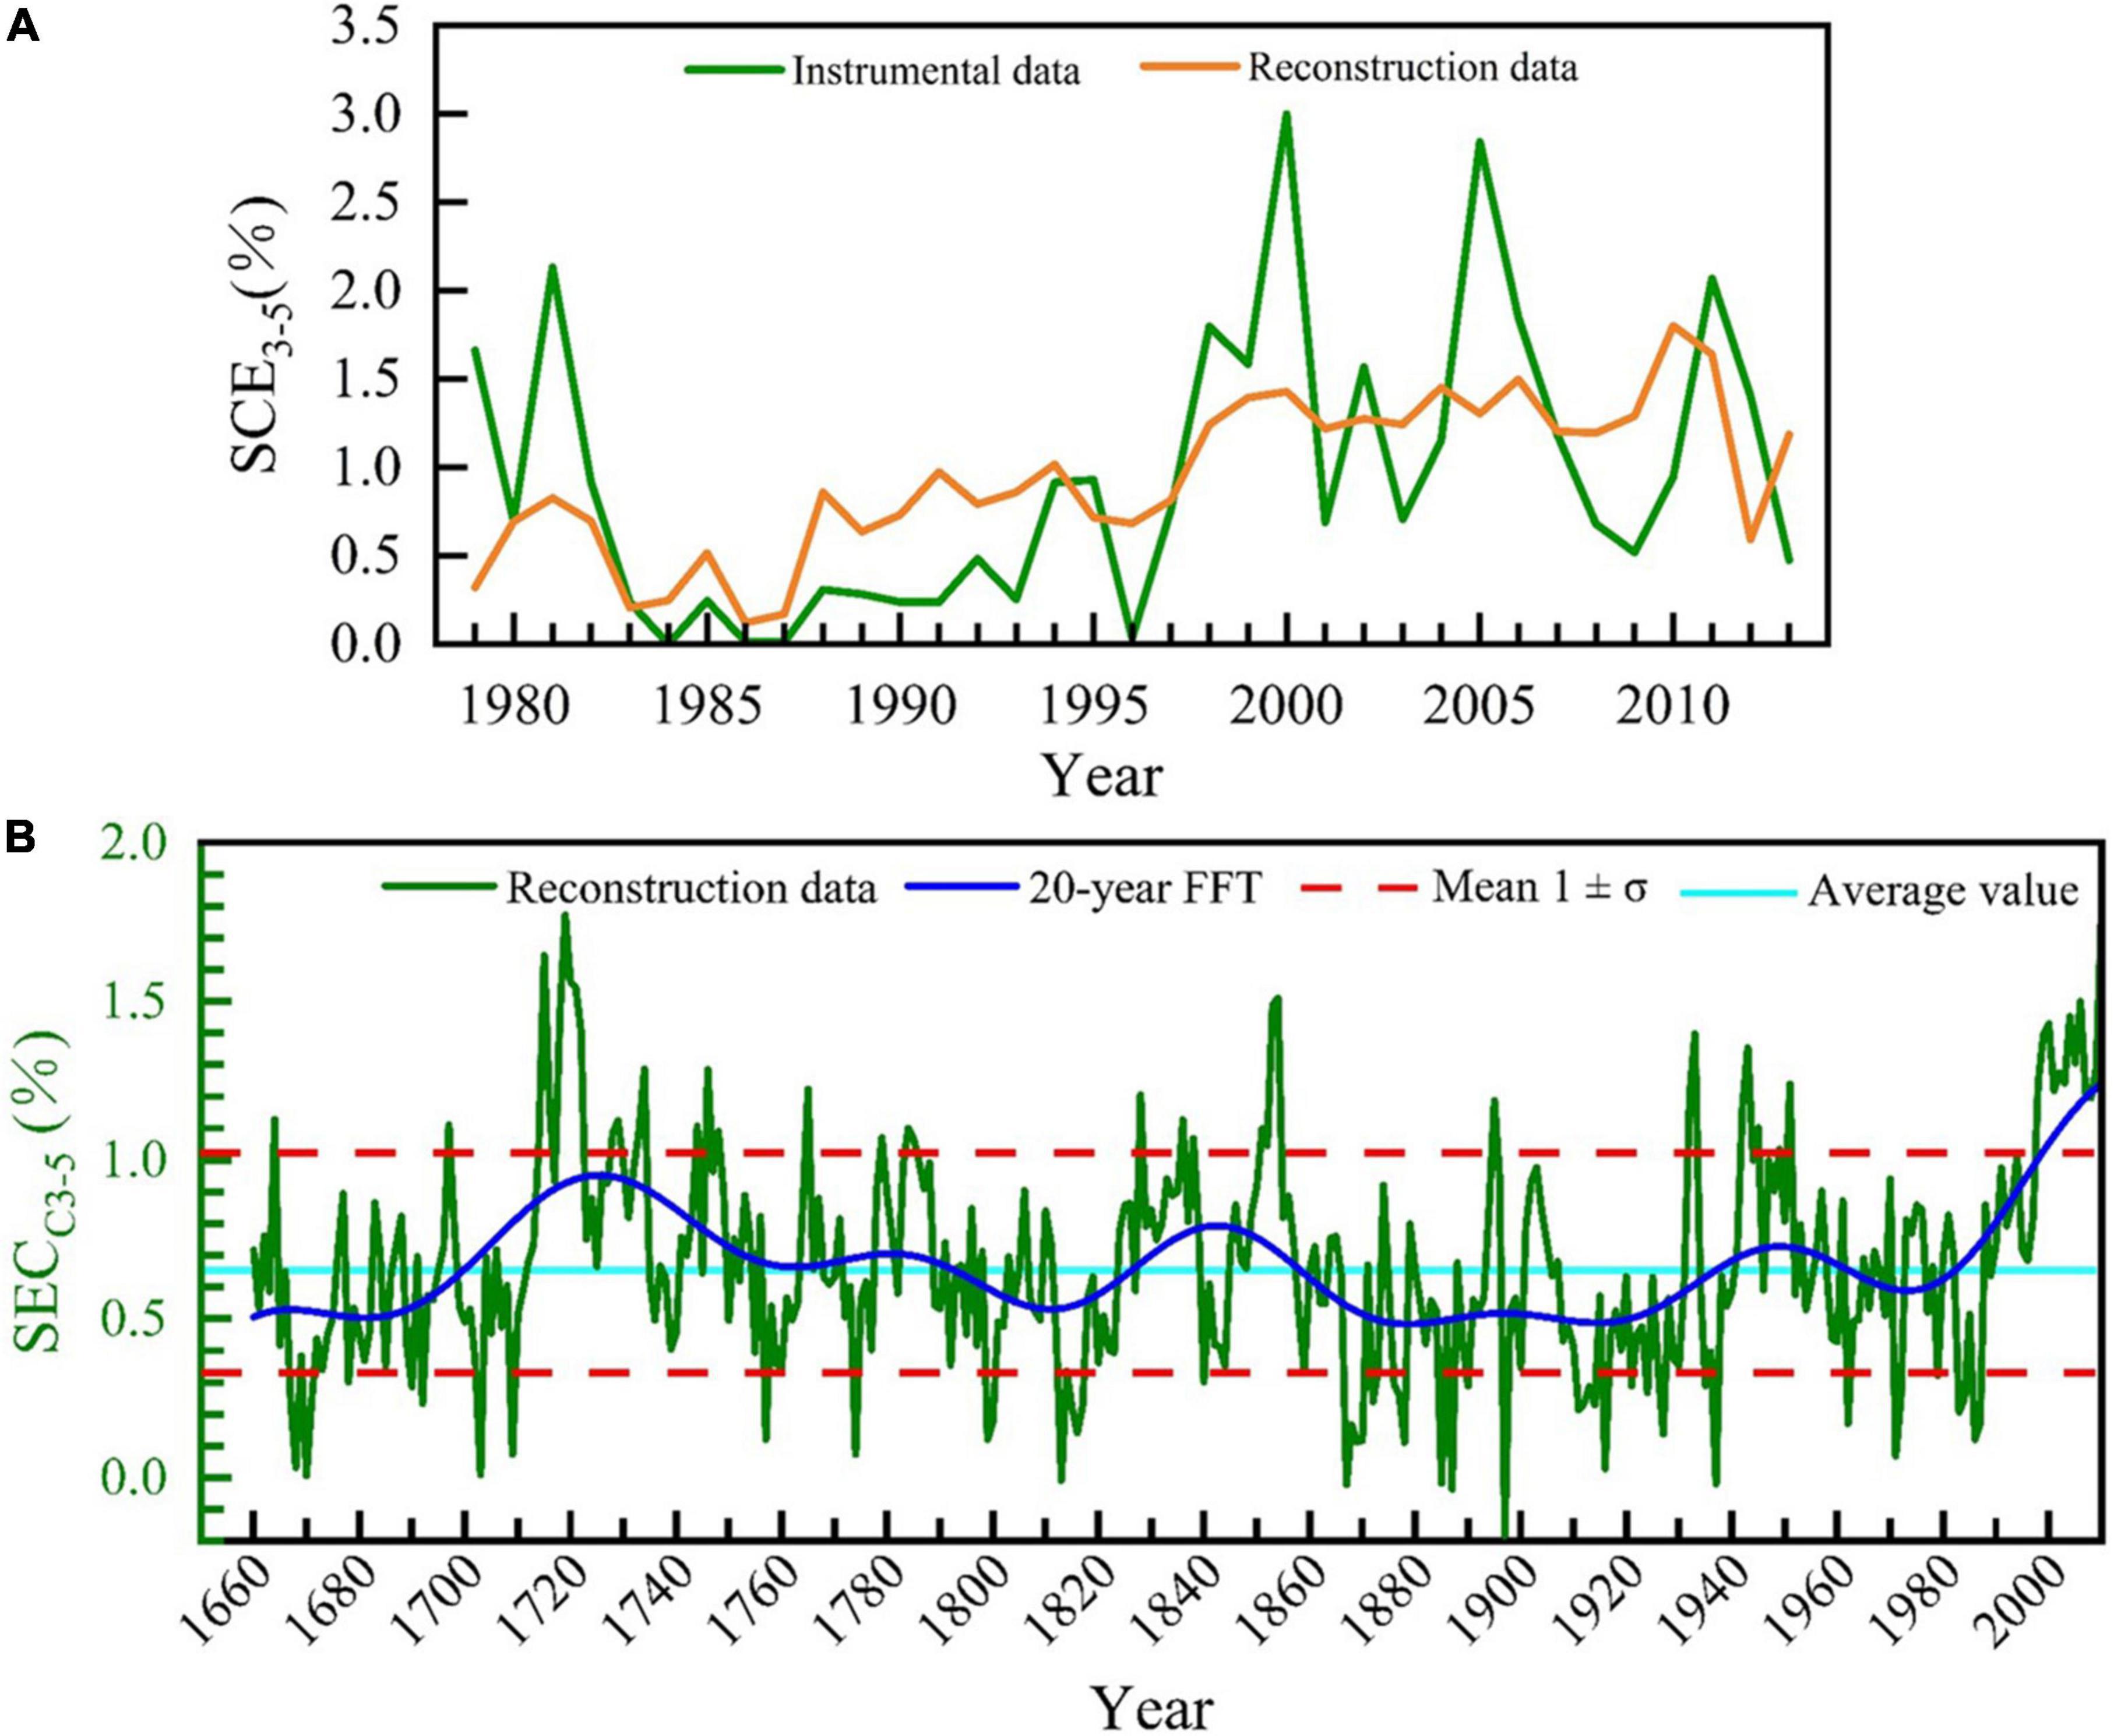
Figure 5. The reconstructed SCE3–5 at XQDV, SETP. (A) A comparison between the raw instrumental data and the raw reconstruction data (1979–2013) and (B) the reconstructed SCE3–5 since 1660 CE and its 20-year moving average. The horizontal light-blue line indicates the mean value of the reconstruction during the period of 1660–2013, and the red broken lines indicate the mean ± 1σ (standard deviation).
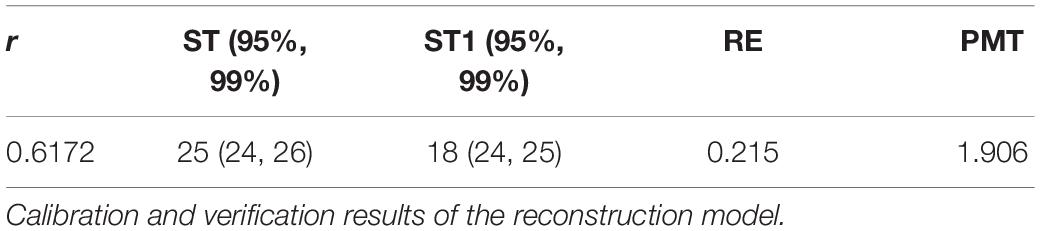
Table 2. Statistical test parameters of the reconstructed SCE3–5 on the SETP.
For the SCE3–5 reconstruction in the reliable period (1660–2013; Figure 5B), SCE3–5 varied between 0 and 1.8%, with a mean of 0.7 ± 0.3%. A year in which the SCE3–5 exceeds the standard of mean ± 1σ (standard deviation) is defined as an abnormal year (Cai et al., 2020). Accordingly, there are 51 years of abnormal high SCE3–5 in our reconstruction results, of which 15 years (29.4%) fall in the period of 1998–2013; and 49 years of abnormal low SCE3–5, of which 9 years (18.4%) fall in the period of 1867–1878 (Figure 5B). The top 10 highest SCE3–5 years are 2010, 1719, 1715, 2011, 1720, 1721, 1854, 2006, 1853, and 1718. The top 10 lowest SCE3–5 years are 1897, 1887, 1867, 1937, 1885, 1813, 1670, 1703, 1668, and 1709 (Figure 5B). Moreover, the 20-year FFT indicates that the high SCE3–5 periods in the past four centuries occur during the period of 1700–1750, 1830–1860, and 1983–2013, and the low SCE3–5 periods occurs during the period of 1660–1700, 1790–1830, and 1860–1940 at the study area (Figure 5B).
The M-K abrupt test shows that the UF(k) curve values are mainly positive from 1680 to 1880, indicating that the reconstructed SCE3–5 shows an increasing trend during these 200 years. Especially during the period of 1720–1800, the UF(k) statistic exceeds the critical value of the 0.05 significance level (the upper limit is 4.5), and the uptrend is more significant. The UF(k) curve values are mainly negative from 1881 to 2000, indicating that the reconstructed SCE3–5 shows a decreasing trend during these 120 years. Especially during the period of 1920–1945, the UF(k) statistic exceeds the critical value of the 0.05 significance level (the lower limit is –3), and the downtrend is more significant. The two curves of UF(k) and UB(k) intersect around 1685 and 1998, respectively, and the intersection is between the critical values. It can be therefore judged that the time points of the two mutations are around 1685 and 1998, respectively (Figure 6B).
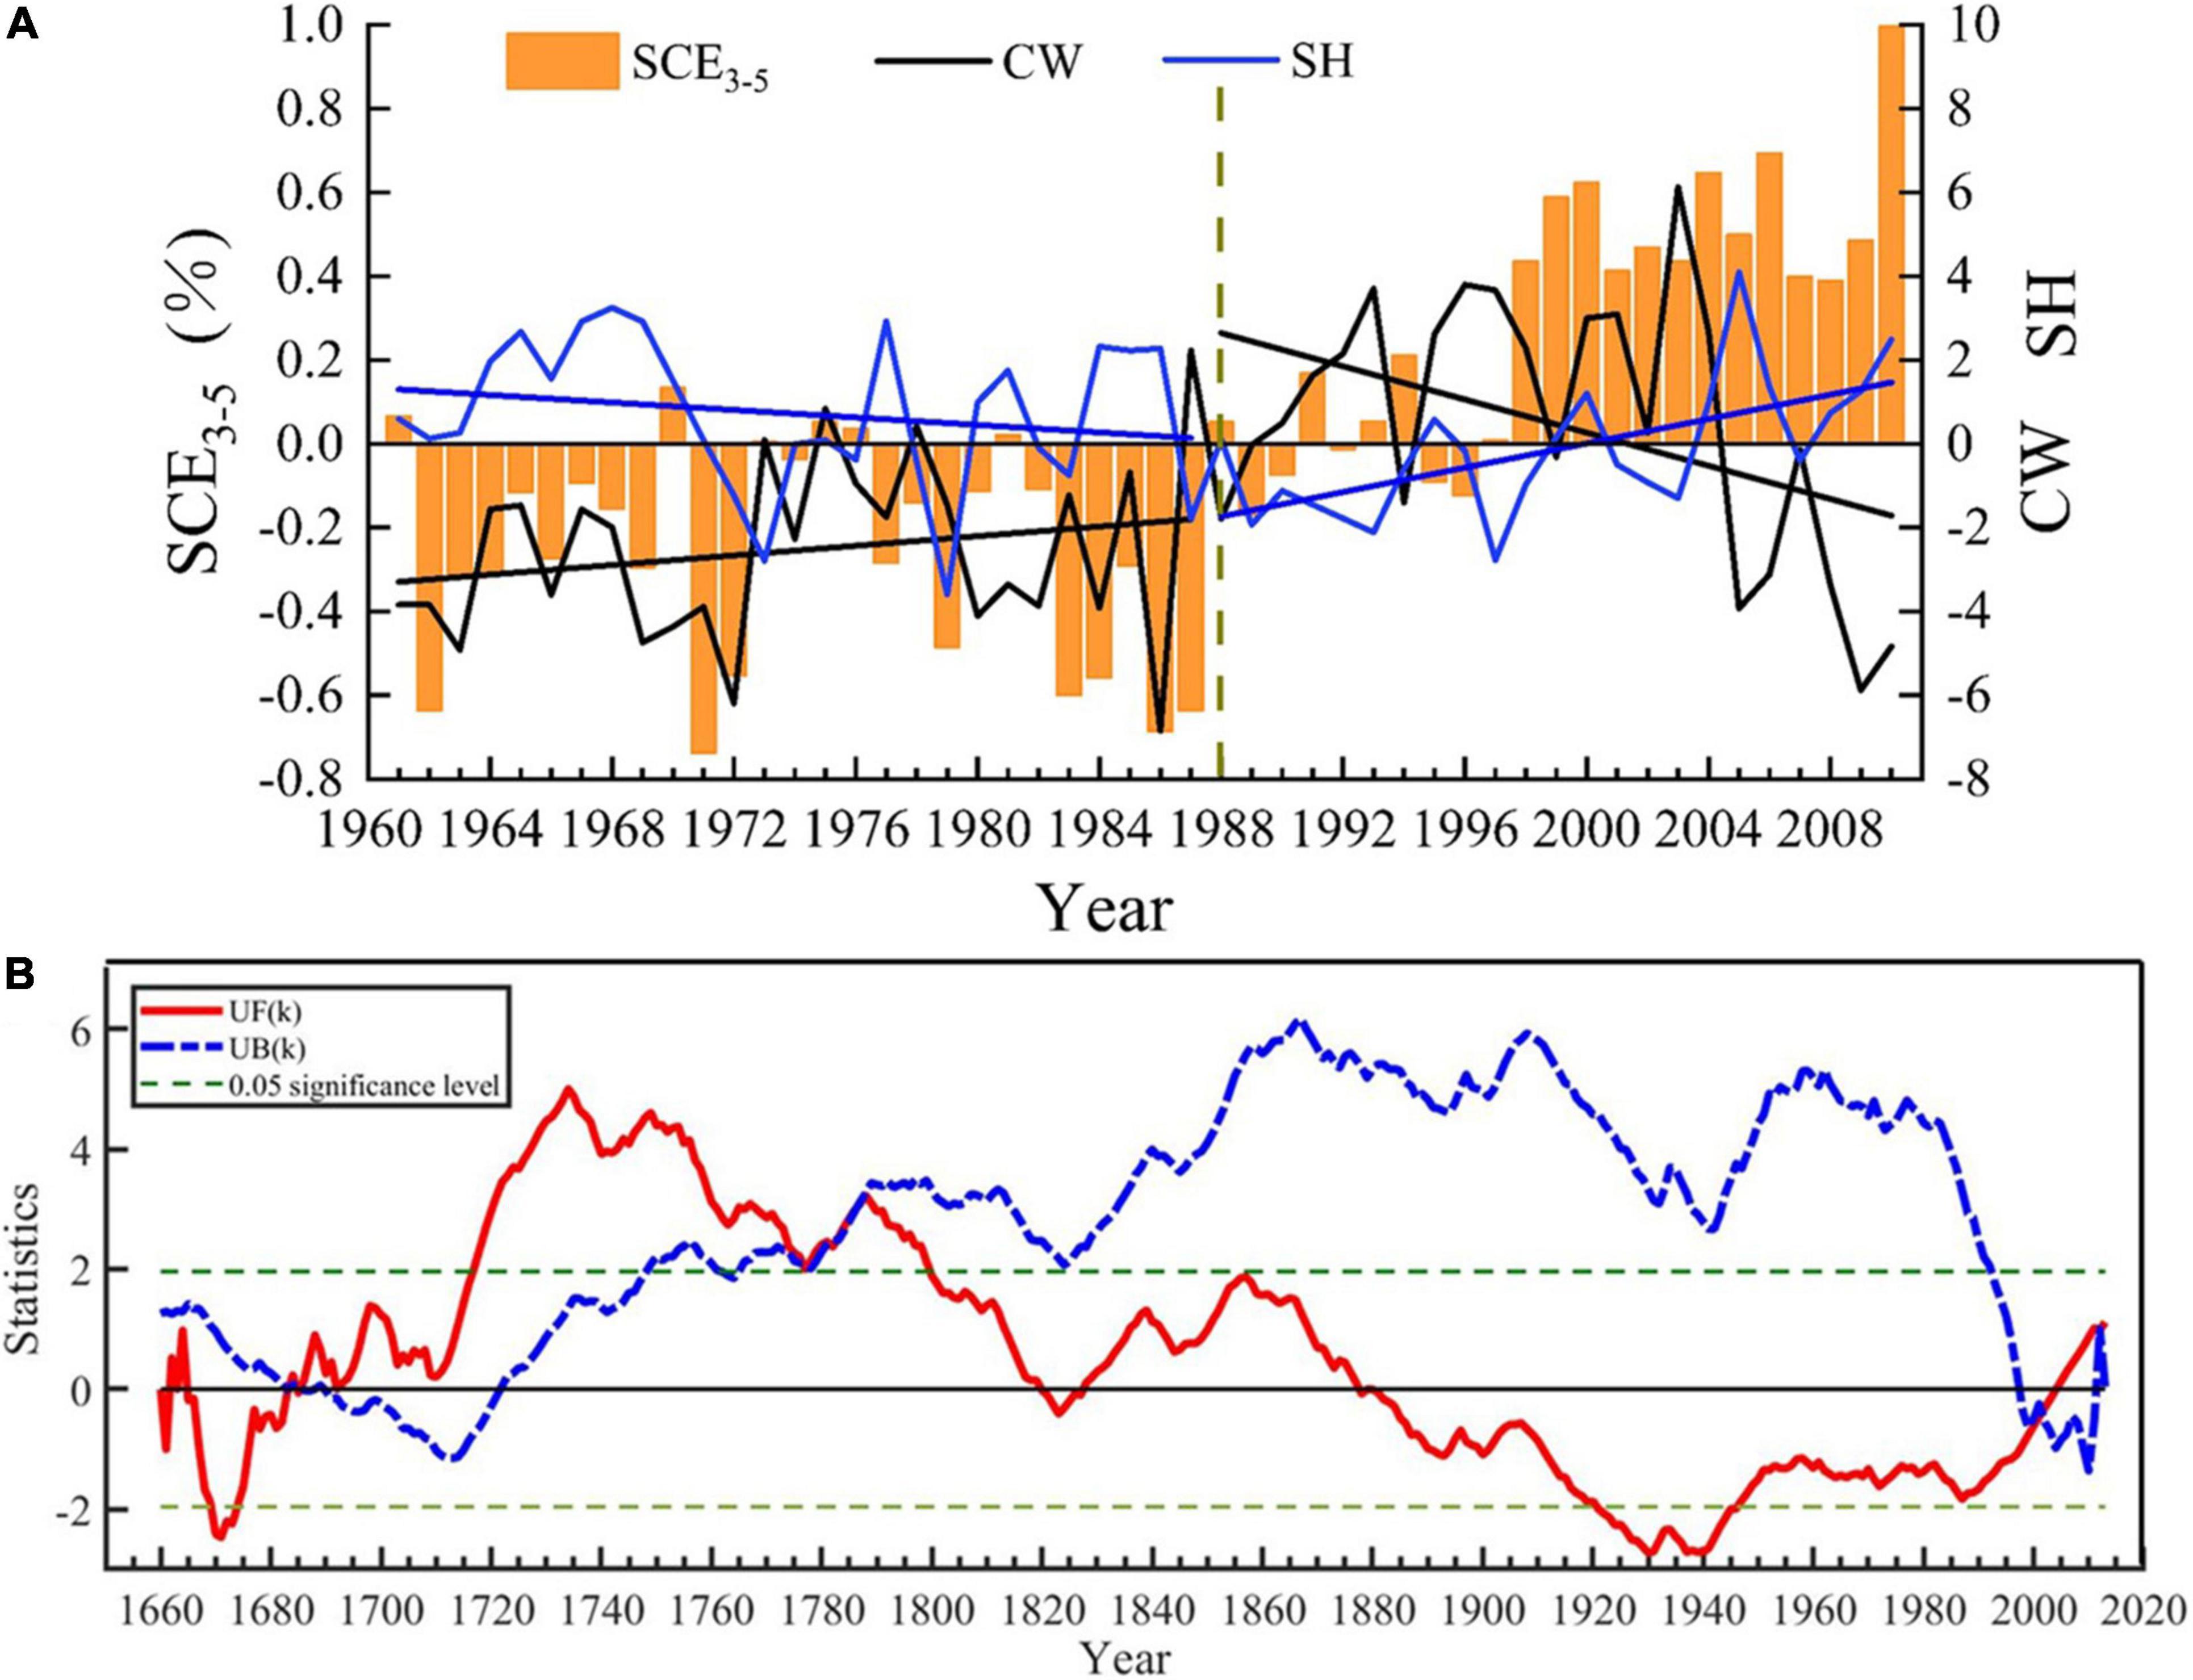
Figure 6. (A) Interannual variation of the anomalies of the East Asian trough location index (CW), Siberian High index (SH), and the reconstructed SCE3–5 values for 1961–2010 on the SETP, and (B) the M-K abrupt test of reconstructed SCE3–5 values during the period of 1660–2013. The green horizontal dotted lines indicate the 0.05 significance level.
Cross-field correlations using the EWW chronology and the reconstructed SCE3–5 developed for the SETP region with gridded CRU scPDSI 4.05 early data (available at http://climexp.knmi.nl; Schrier et al., 2015) were generated for 1955–2013 to understand linkages with regional droughts. The positive correlations between the EWW chronology and reconstructed SCE3–5 with the corresponding months’ CRU scPDSI were observed on the SETP (P < 0.01; Figure 7). The correlation fields showed distinct dipole arrangements with positive relationships over 35° to 45°N, 75° to 100°E and negative relationships over 20° to 35°N, 75° to 85°E (Figure 7).
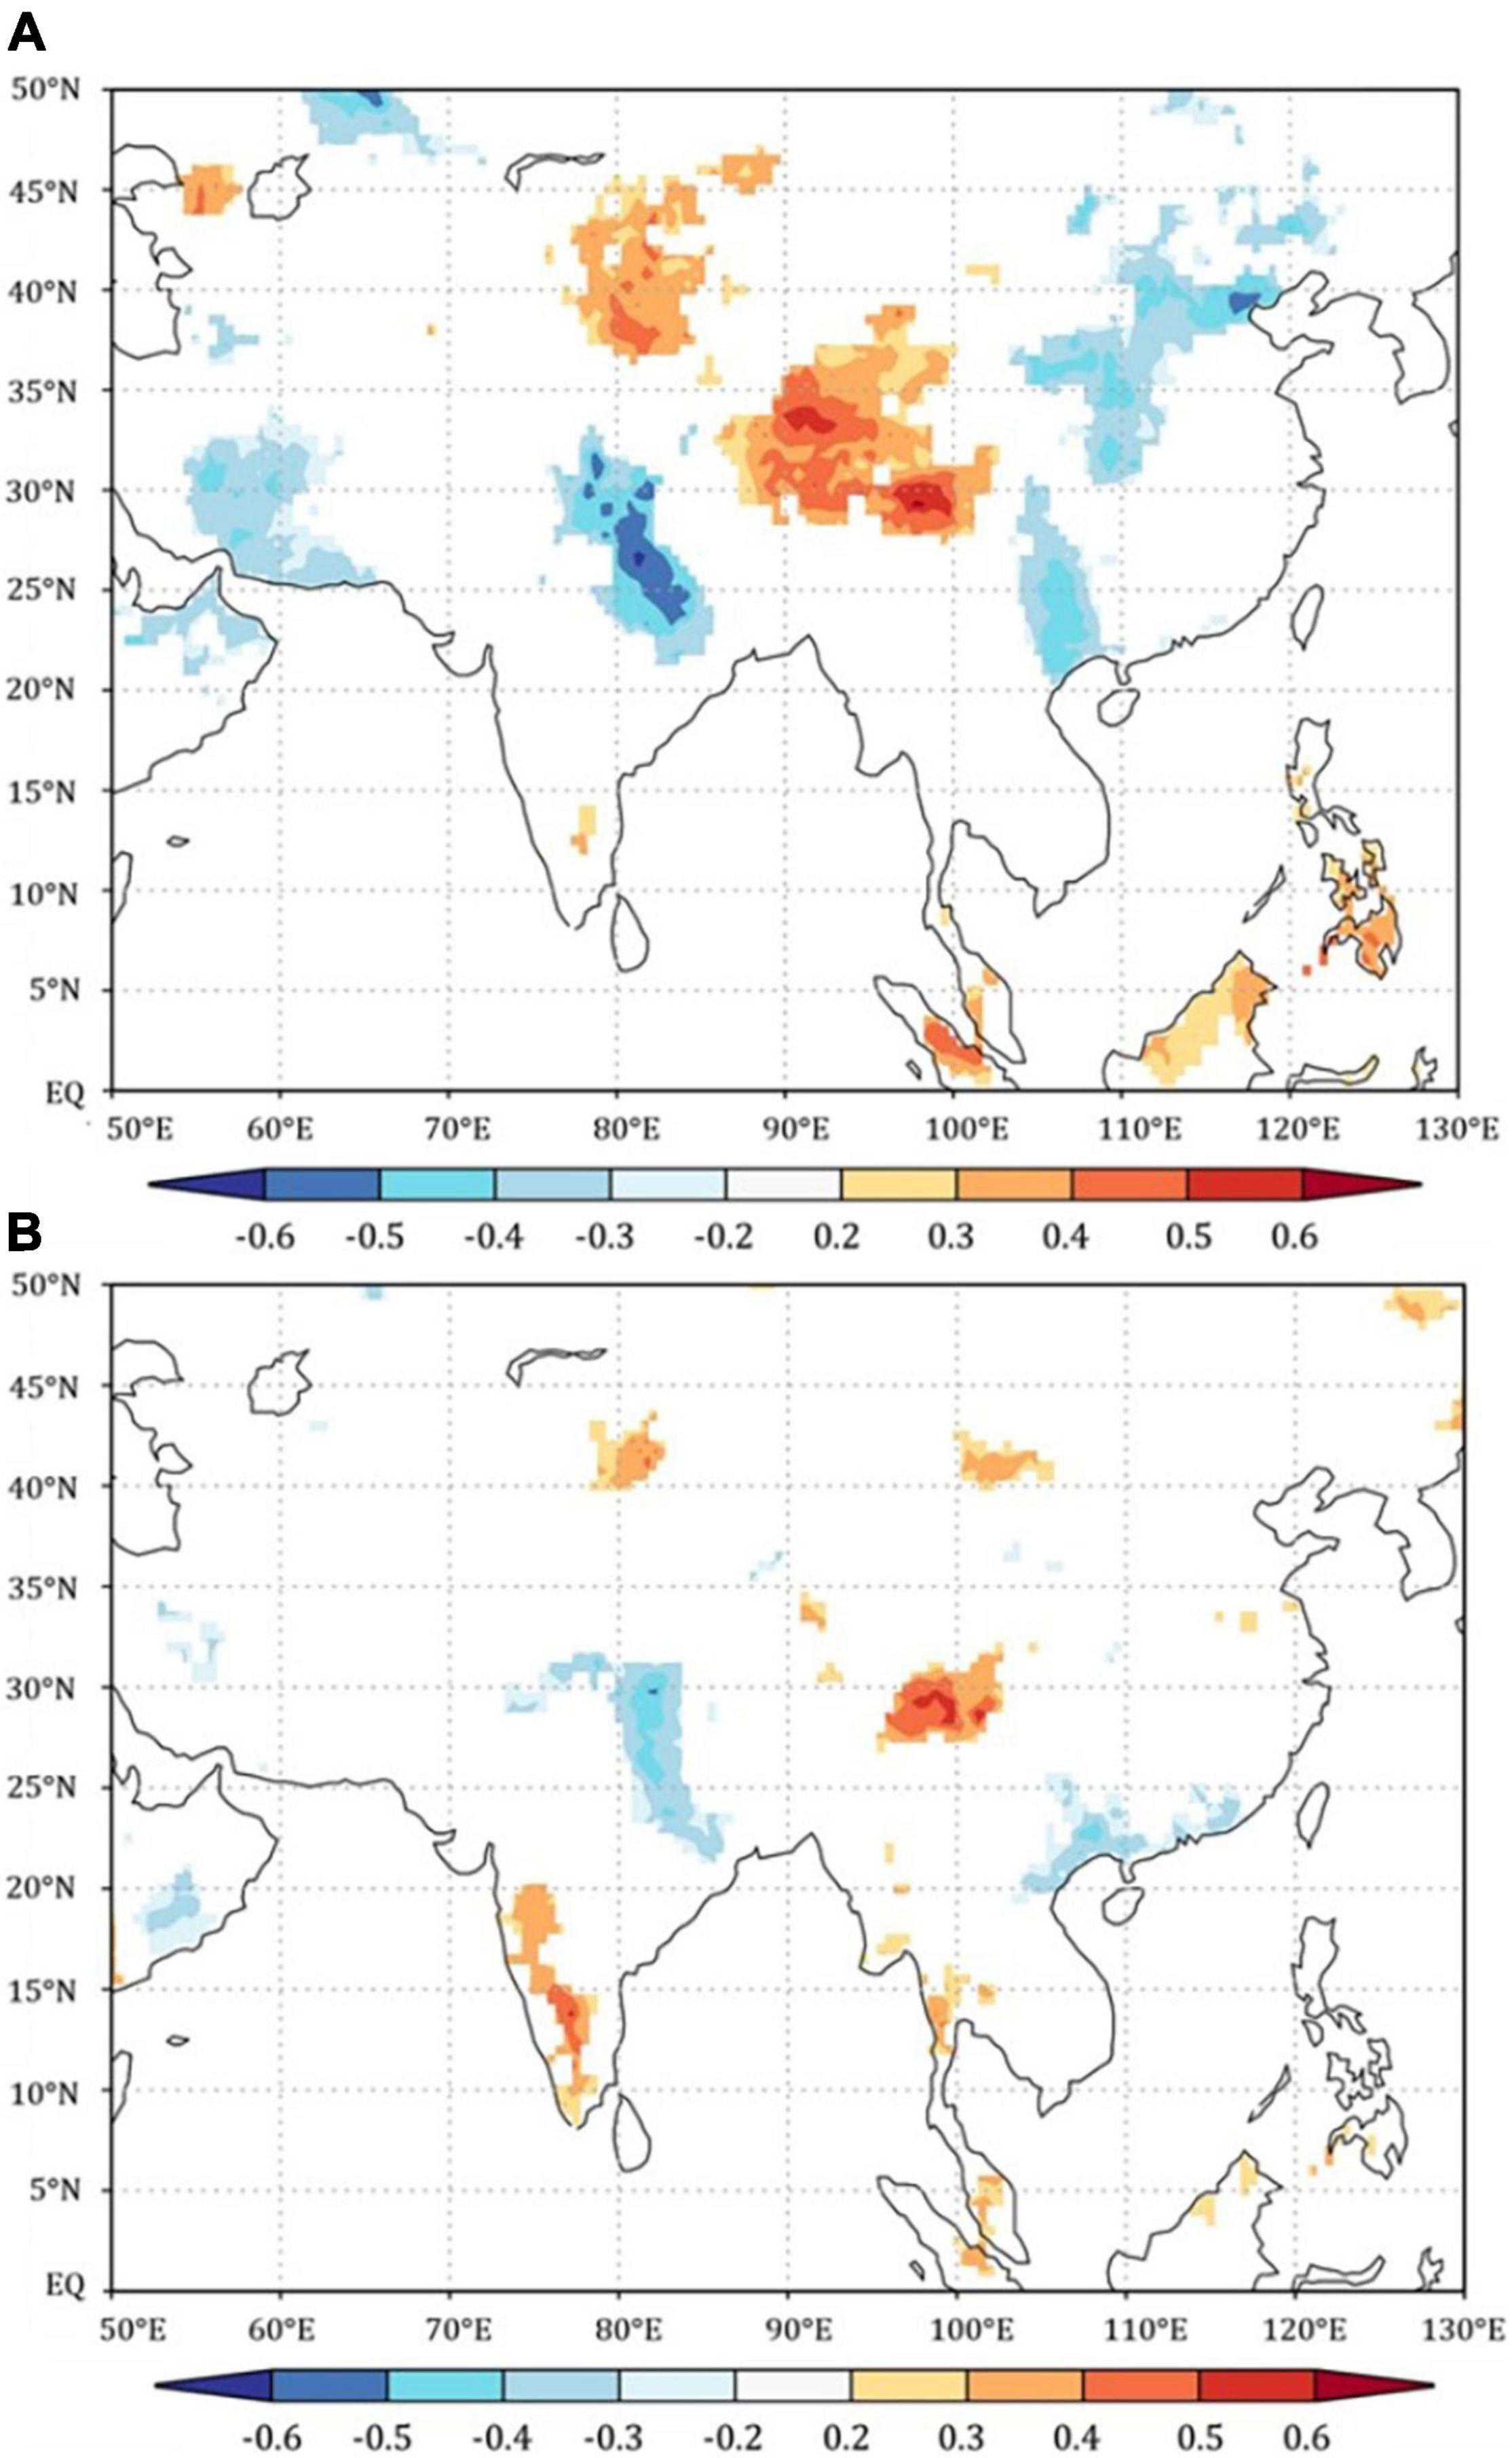
Figure 7. (A) Spatial correlation between the reconstructed SCE3–5 and the corresponding months’ gridded PDSI data for 1955–2013. (B) Same as (A) but between EWW and March-April-May gridded PDSI data for 1955–2013. The images were generated using the climate explorer program.
An inverse correlation between CW and SH was identified (r = –0.51, P > 0.01) (Figure 6A). It can be seen from Figure 6A that both the winter season monsoon index and the reconstructed SCE3–5 values on the SETP had a distinct change around 1988. SH showed a weakening trend for the period of 1961–1987 and then gradually increased in the following 22 years (1989–2010) (Figure 6A). The East Asian trough moved eastward from 1961 to 1988 and slowly moved westward from 1989 to 2010 (Figure 6A).
Furthermore, in order to reveal the relationship between our reconstructed SCE3–5 on the SETP and the East Asian winter monsoon, Figure 8 shows the correlation coefficients between SCE3–5 and the 700 hPa zonal wind and 500 hPa geopotential height field. The reconstructed SCE3–5 and 700 hPa zonal winds have significant characteristics of positive and negative alternating changes in the meridional direction (Figure 8A). This zonal distribution is not only affected by the position change of polar front and subtropical jet stream in winter but also related to the intensity of subtropical jet stream. The distribution area where the 500 hPa geopotential height field and the reconstructed SCE3–5 are significantly correlated (99%) have obvious monsoon characteristics (Figure 8B). The significant correlation region is mainly located in the East Asian trough, which is greatly affected by sea and land. The regions of Eurasia and the American continent that shifted slightly eastward are non-correlated areas, and the area dominated by the ocean is a positively correlated area. However, it is also positively correlated in Asia and Africa, especially in East Asia south of Mongolia. In our study site, the reconstructed SCE3–5 is significantly negatively correlated with 700 hPa zonal wind and is significantly positively correlated with 500 hPa geopotential height field.
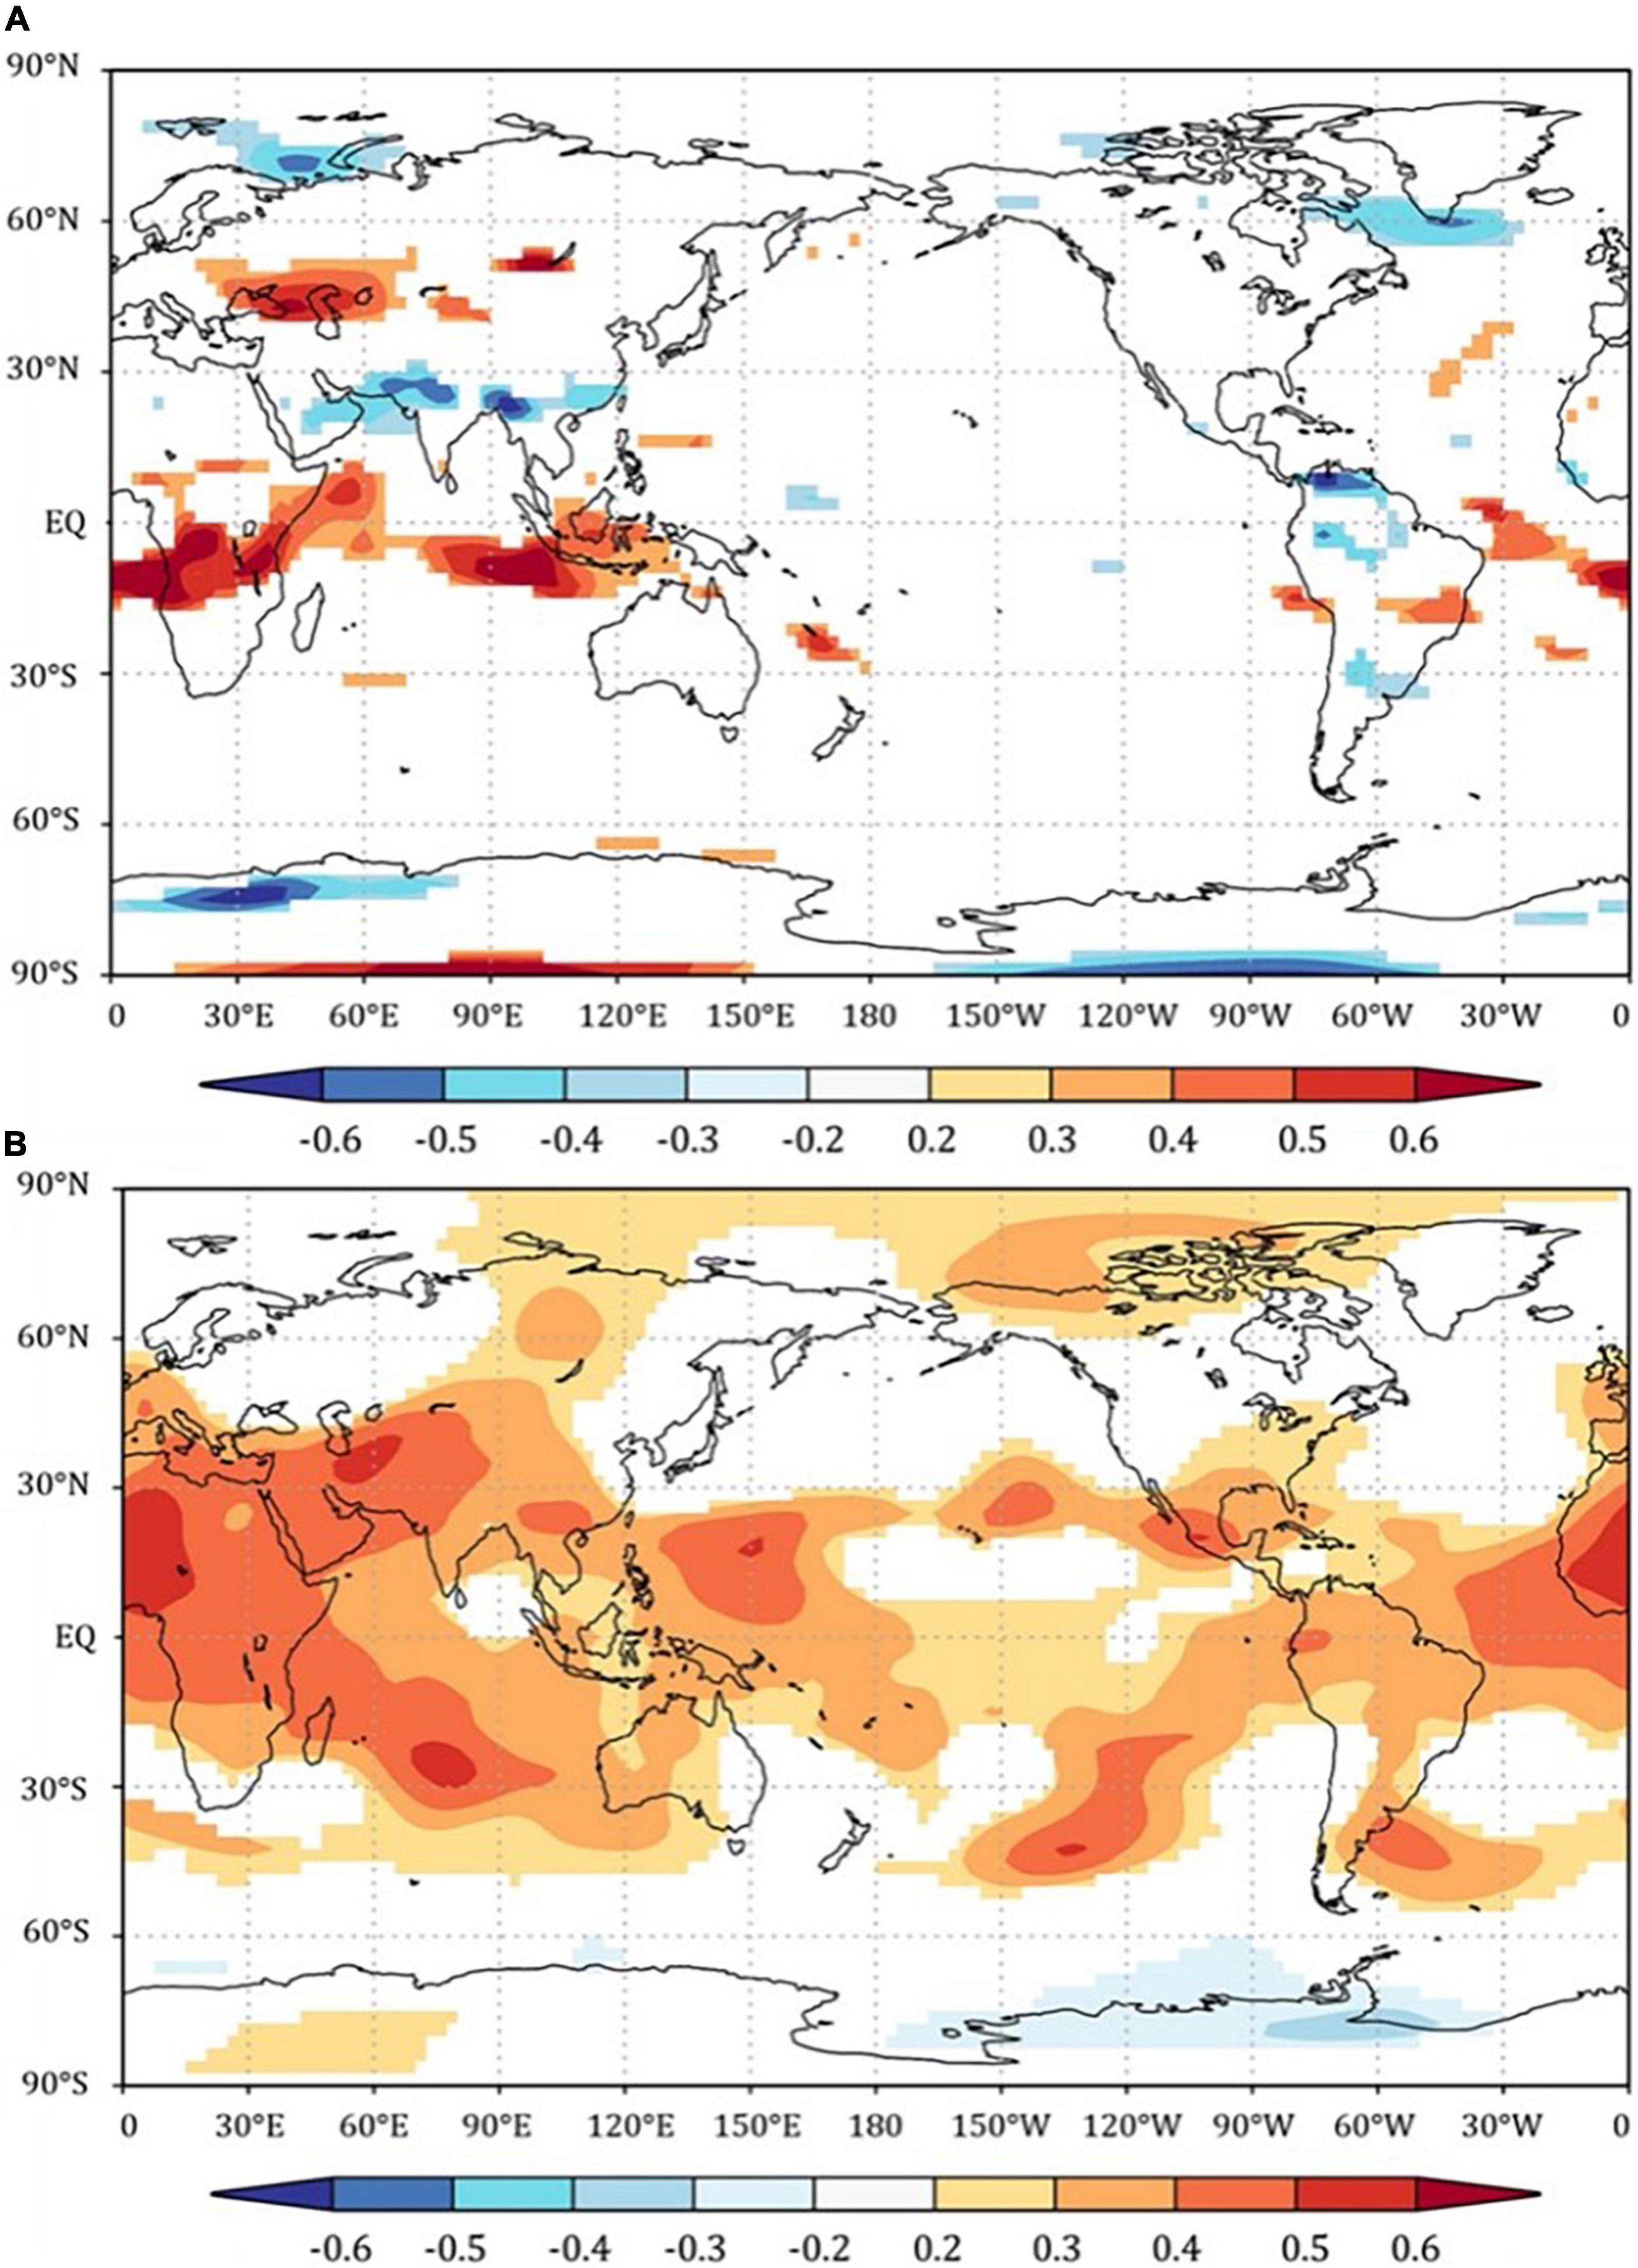
Figure 8. Correlation coefficients between SCE3–5 at the study site and (A) 700 hPa zonal wind and (B) 500 hPa geopotential height field. The shaded area passed the test at a 99% confidence level.
The summer monsoon is not strong enough to bring sufficient precipitation into SETP in the early growing season, during which the growth of ring-width is often the most critical (Gou et al., 2013). Abundant snow melt water plays an important role in promoting the growth of tree-ring at this time (Fang et al., 2015). Climatic conditions before the growing season might affect ring-width growth during the growing period (Fritts, 1976; Camarero et al., 2010). Thicker snow cover can delay spring snowmelt, storing additional water for early-wood growth, which leads to a wider ring (Fang et al., 2015; Li et al., 2019). Thicker snow cover can increase soil moisture content, compensating for water loss caused by drought in spring (Fan et al., 2010). Water deficit in the early stages of the growing season suppresses the rapid expansion of tracheids and cell division in the cambium of trees (Fritts, 1976; Akkemik, 2003). In addition, the thicker snow cover plays an insulating role in maintaining the temperature constant. A higher temperature might benefit the radial growth of spruce trees during the growing season for the growing season is advanced, and there may be less winter damage to the shallow roots of the spruce trees (Liang et al., 2006; Song et al., 2007; Zhu et al., 2009; Zhang et al., 2010, 2015; Zhou et al., 2016; Li X. X. et al., 2017).
Similar to the fact that the change of SCE around the Arctic affects the growth of trees by regulating temperature (Vaganov et al., 1999; Fang et al., 2016), our study also found a significant negative correlation between the reconstructed SCE3–5 and surface temperature (Supplementary Figure 3), and the significant positive correlations between the reconstructed SCE3–5 and EWW and CRU scPDSI on the SETP (Figure 7), indicating that the decrease of SCE is mainly modulated by temperature, and then restricted tree growth by reducing soil moisture. During spring, our study area is drier than the circumpolar region (Fan et al., 2010; Fang et al., 2010), and this period is often the most critical for the growth of tree-ring width (Gou et al., 2013). Therefore, the abundant snowmelt water occurred in the study area during spring plays a very important role in promoting the growth of tree-rings.
The change of SCE is not only affected by air temperature but also affects the degree of regional drought. Therefore, we compared our reconstructed March–May SCE series on the SETP with two tree-ring-based reconstructions obtained from the surrounding research region, i.e., the April–June scPDSI reconstruction (Li J. B. et al., 2017) and winter temperature reconstruction (Huang et al., 2019), on the SETP, respectively. All the consequences were smoothed using the 11-year moving average (Figure 9). It has been shown that the long-term changes of March–May SCE are positive correlated with April–June scPDSI (r = 0.52, P < 0.001, n = 354) and winter temperature (r = 0.34, P < 0.001, n = 348), respectively. Similar common variations, such as the warm-wet periods (corresponding to the high SCE periods) during 1710–1730, 1840–1860, and 1990–2010, as well as the cold-dry periods (corresponding to the low SCE periods) during 1760–1770, 1800–1830, 1860–1890, 1900–1930, and 1960–1990 were found in three series (Figure 9). The pluvial conditions observed during 1948–1958 and 1986–1996 for cold arid western Himalaya (Ram and Mahendra, 2013) are consistent with the high SCE3–5 reconstructed in this study.
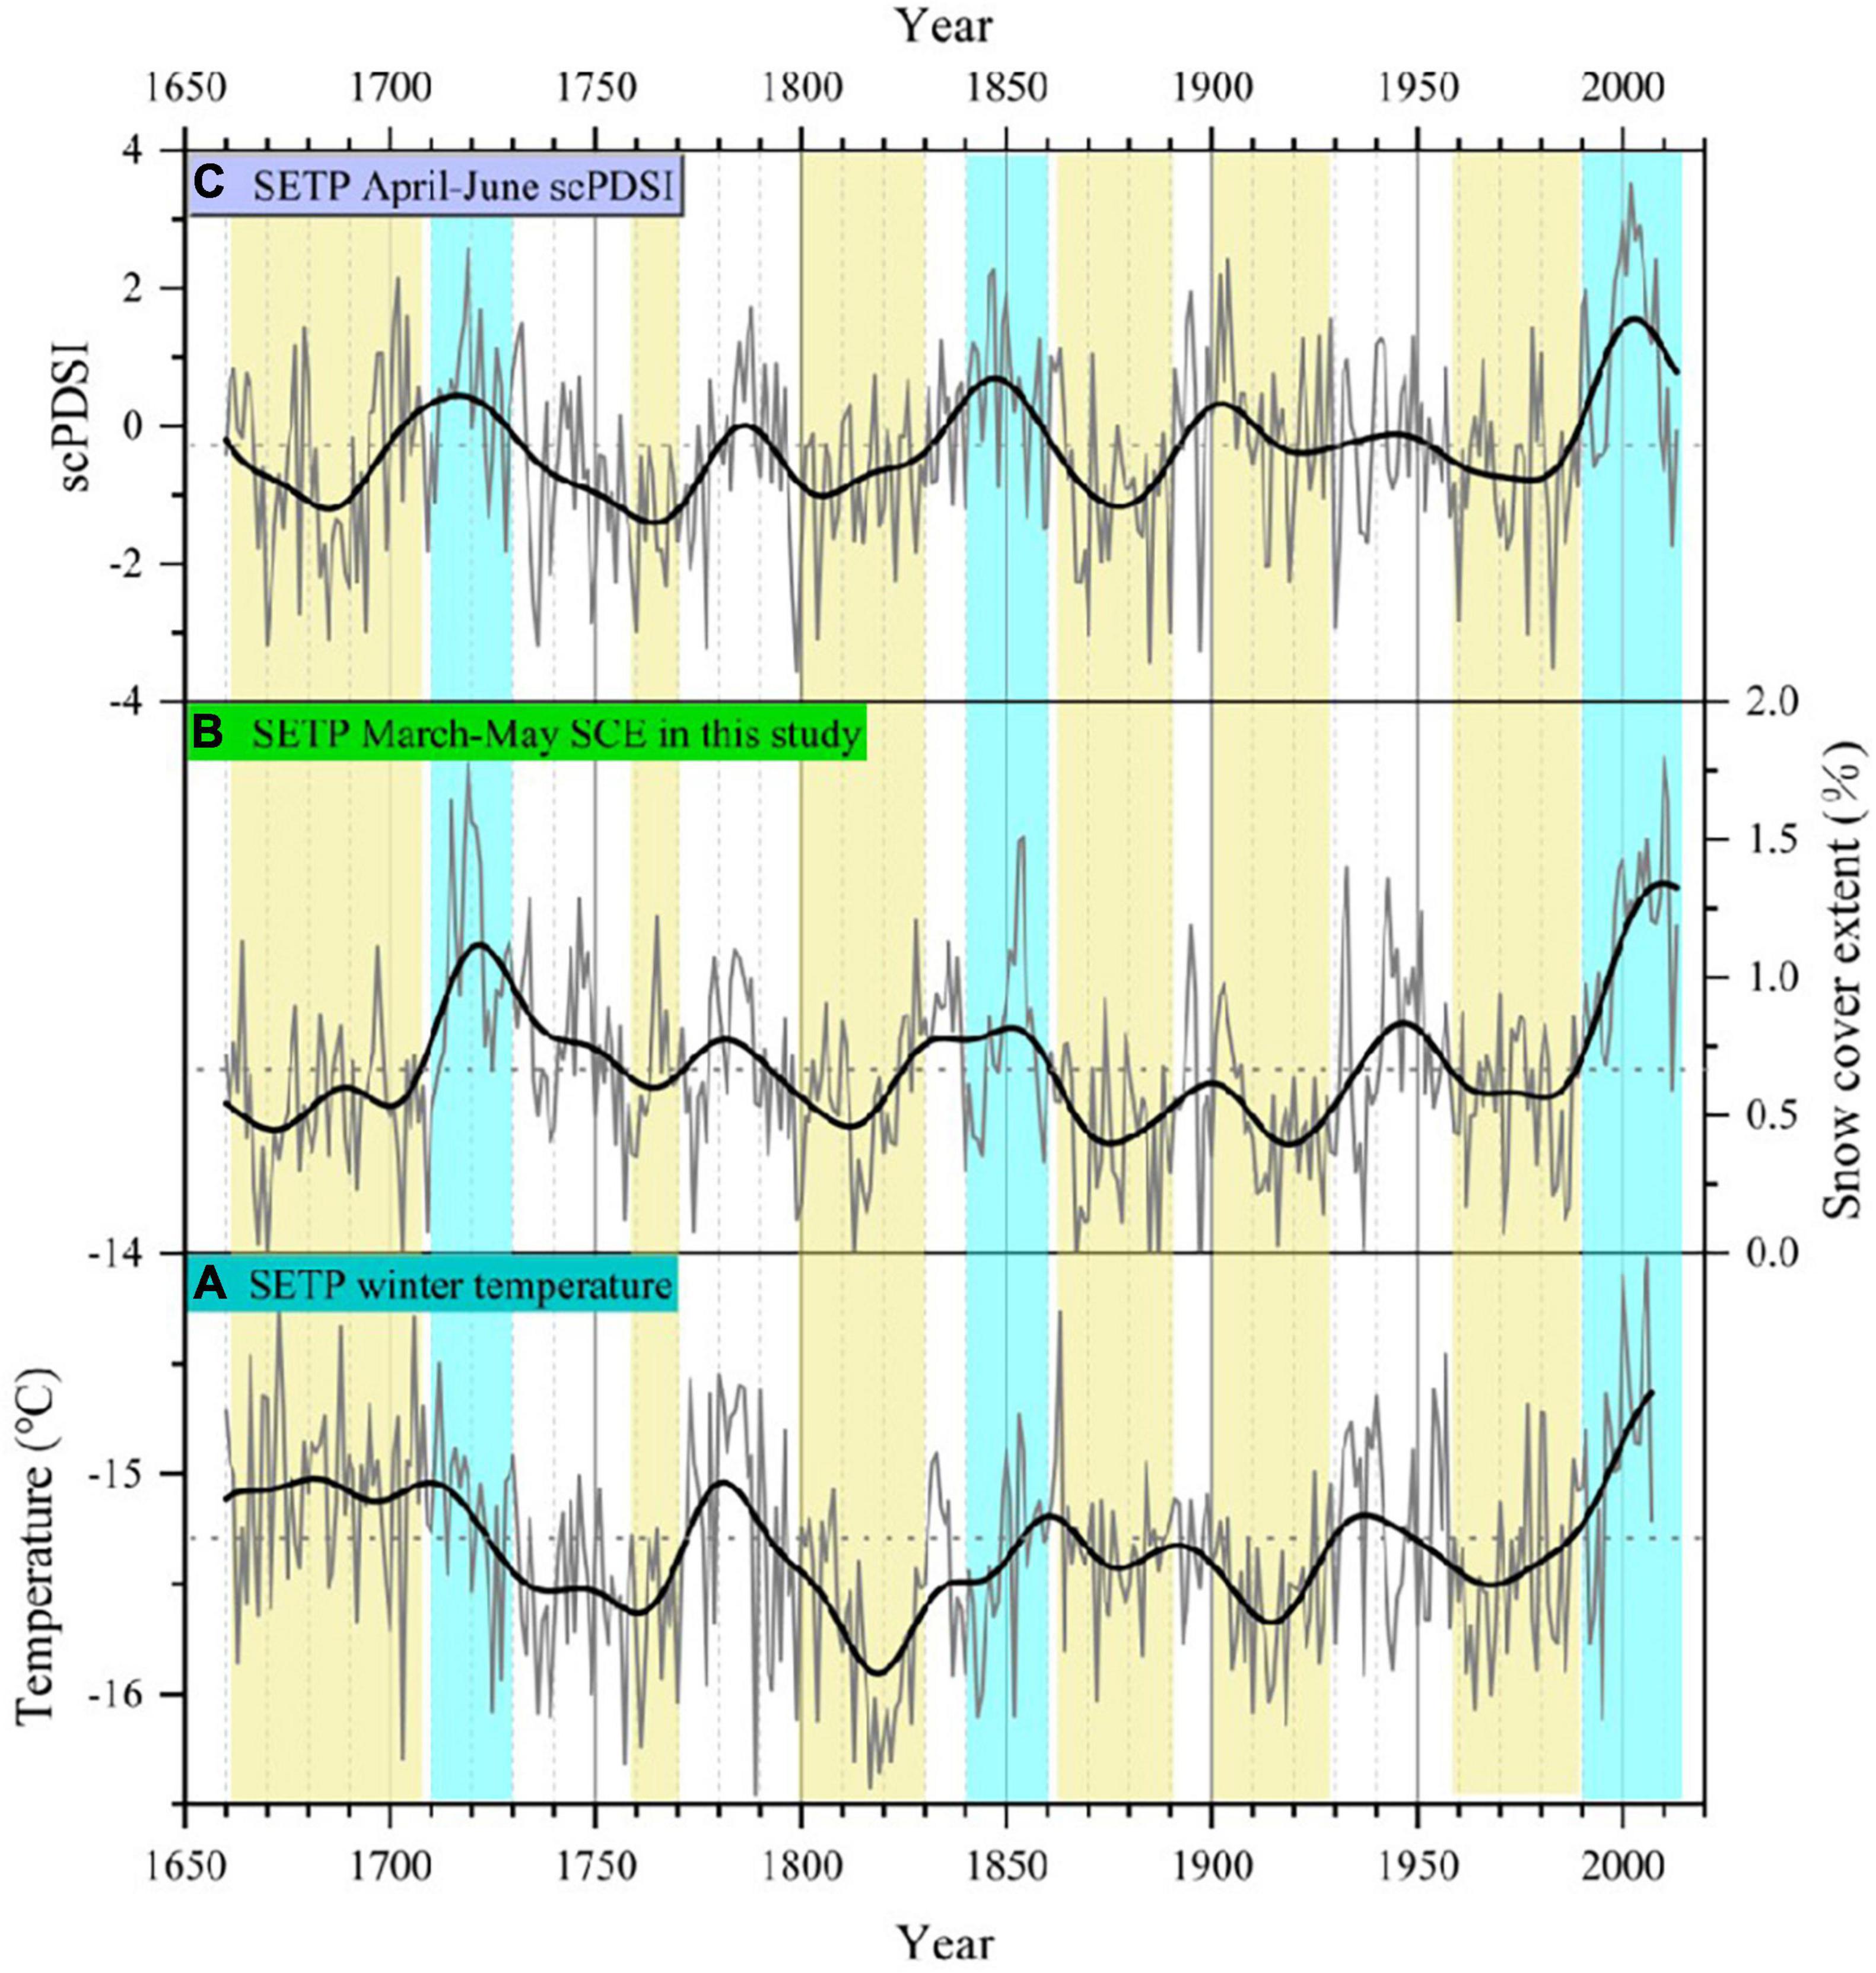
Figure 9. Comparisons of the (A) reconstructed April–June scPDSI on SETP (1660–2013 CE) (Li J. B. et al., 2017), (B) reconstructed SCE3–5 from this study (1660–2013 CE), and (C) reconstructed winter temperature on the SETP (1660–2010 CE) (Huang et al., 2019). The heavy black curve corresponds to the 11-year average smoothing series. Shade bars indicate the common fluctuation periods.
In this study, we focus on the analysis of filtered low-frequency SCE3–5 series, and the reconstructed SCE3–5 values on the SETP were mainly negative anomalies from 1961 to 1987 (the relatively low snowfall), while positive anomalies from 1988 to 2010 (the relatively high snowfall). This indicates that (1) when the East Asian Trough is eastward, the westerly airflow in the high latitudes over East Asia is relatively zonal, corresponding to the ground where the Siberian High is weaker, and the cold air is generally easterly, which is conducive to winter snowfall on the TP. That is, CW (SH) has a positive (negative) correlation with snowfall on the southeast TP; (2) when the East Asian tough is westward, the meridional circulation is dominated in the mid-high latitudes over East Asia, the Siberian High over the ground is relatively strong, and the TP has less snowfall. That is, CW (SH) has a negative (positive) relationship with snowfall on the southeast TP. The transition point of the positive and negative anomalies of the reconstructed SCE3–5 is close to the sudden change time of the East Asian winter monsoon Index (in the year 1986; Figure 6A). The M-K abrupt test shows that the reconstructed SCE3–5 series on the SETP has two abrupt changes from low to high around the years of 1685 and 1998 (Figure 6B), which further convinces us that there is a distinct negative correlation between the reconstructed SCE3–5 on the SETP and the intensity of the East Asian winter monsoon on the interannual scale. Previous studies have shown that the intensity of the Siberian High is stronger during 1960–1970s and weaker during 1980s. The strongest and weakest periods of the Siberian High in recent centuries fell in the 1960s and late 1980s–1990s, respectively (Gong and Wang, 1999). This is the reason why the SCE3–5 we reconstructed on the SETP and the Siberian High were relatively poor after 1996.
A study by Shen et al. (2011) revealed that the lower SCE occurred in the periods of 1840–1880 and 1920–1960, and the higher SCE occurred in the intervals of 1800–1840, 1880–1920, and after 1960, with snow accumulation data from several ice cores on the TP during the last two centuries. A partial disparity existed between our SCE3–5 reconstruction and the finding by Shen et al. (2011), which was mainly because our reconstruction spanned from current March–May, while Shen et al. (2011) concentrated on the annual SCE. Interestingly, the high- and low-value periods in our reconstructed SCE3–5 series are highly consistent with the annual maximum snow depth reconstructed with tree-rings in the north of Tian Shan Mountain, China (Qin et al., 2016). The possible reason is that the SCE on the SETP is controlled by atmospheric circulations (Bamzai, 2003; Shaman and Tziperman, 2005; You et al., 2011; Cohen et al., 2012). Previous studies have also shown an obvious jump in the winter temperature on the TP since 1987 (Wang et al., 2012). There was a simultaneous jump signal between the East Asian winter monsoon circulation around 1986 and the reconstructed SCE3–5 values on the SETP, which indicated a significant correlation between the East Asian winter monsoon and winter-spring snowfall.
The reasons for the abrupt change of SCE3–5 on the SETP from low to high in the late 1980s are the weakening of the East Asian winter monsoon, the enhancement of winter westerly on the southern TP and the increase of snowfall caused by an active westerly disturbance on the interdecadal scale (Liu et al., 2003). The mid-high latitude trough and ridge changes in the northern hemisphere have disturbed the subtropical westerly jet and the positive westerly anomaly on the southern side of the European trough strengthens the subtropical westerly jet. When the westerly airflow encounters the large terrain of the TP to the west, part of it flows eastward and northward and part of it flows to the TP, then the strong southwesterly air brings the warm and humid air in the subtropical region to the TP, forming an atmospheric circulation background that is conducive to the increase of SCE on the TP. Such warm and humid airflow will reduce the formed SCE already, which is also the reason why the 700 hPa zonal wind is negatively correlated with the SCE on the SETP. There is a positive correlation between the SCE3–5 reconstructed by EWW chronology and the geopotential height at 500 hPa, indicating that when the SCE is large, it corresponds to the high pressure near the ground (Fang et al., 2016). The atmospheric circulation system and the complex local topography on the SETP together lead to produce such variation in our reconstructed SCE3–5 history on the SETP (Hu and Liang, 2013).
We developed TRW (1668–2018), EWW (1660–2018), and LWW (1680–2018) Abies faxoniana chronologies, respectively, at Xiao Qamdo Village, Markam County, on the SETP and found peak correlation (r = 0.586, P < 0.01) between EWW chronology and SCE from March to May. Hence, we reconstructed the SCE3–5 on the SETP for the past 354 years, and identified a simultaneous jump signal between the East Asian winter monsoon circulation around 1986 and our EWW-based SCE3–5 reconstruction on the SETP, which indicates the combined effects of the weakening of East Asian winter monsoon, the enhancement of winter westerly on the SETP and the disturbance of westerly activity.
The original contributions presented in this study are included in the article/Supplementary Material, further inquiries can be directed to the corresponding author/s.
FZ, ZZ, and MB did field sampling of the manuscript. XB did data analysis and writing. SJ and CW made preliminary revisions to the manuscript. QY and KF made the final revision of the manuscript. All authors contributed to the article and approved the submitted version.
This study was funded by the National Natural Science Foundation of China (41822101, 41971022, and 41772180), the Strategic Priority Research Program of the Chinese Academy of Sciences (XDB26020000), Swedish FORMAS Project (Future Research Leaders, 2017-01408), State Administration of Foreign Experts Affairs of China (GS20190157002), and fellowship for Youth Talent Support Program of Fujian Province.
The authors declare that the research was conducted in the absence of any commercial or financial relationships that could be construed as a potential conflict of interest.
All claims expressed in this article are solely those of the authors and do not necessarily represent those of their affiliated organizations, or those of the publisher, the editors and the reviewers. Any product that may be evaluated in this article, or claim that may be made by its manufacturer, is not guaranteed or endorsed by the publisher.
The Supplementary Material for this article can be found online at: https://www.frontiersin.org/articles/10.3389/fevo.2022.900219/full#supplementary-material
Supplementary Figure 1 | Schematic diagram of early-wood and late-wood for the Abies faxoniana tree-rings.
Supplementary Figure 2 | Correlations between the annual TRW, EWW, and LWW chronologies for the common period of 1680–2018. Correlations are significant at the P < 0.00001 level.
Supplementary Figure 3 | Spatial correlation between the reconstructed SCE3–5 and the corresponding months’ gridded surface temperature data for 1955–2013.
Akkemik, Ü. (2003). Tree rings of Cedrus libani at the northern boundary of its natural distribution. Int. Assoc. Wood Anat. 24, 63–73. doi: 10.1163/22941932-90000321
An, Z. S. (2000). The history and variability of the East Asian paleomonsoon climate. Quat. Sci. Rev. 19, 171–187. doi: 10.1016/S0277-3791(99)00060-8
Anderson, S., Moser, C. L., Tootle, G. A., Grissino-Mayer, H. D., Timilsena, J., and Piechota, T. (2012). Snowpack reconstructions incorporating climate in the Upper Green River Basin (Wyoming). Tree Ring Res. 68, 105–114. doi: 10.3959/2011-8.1
Bamzai, A. S. (2003). Relationship between snow cover variability and arctic oscillation index on a hierarchy of time scales. Int. J. Climatol. 23, 131–142. doi: 10.1002/joc.854
Barnett, T. P., Adam, J. C., and Lettenmaier, D. P. (2005). Potential impacts of a warming climate on water availability in snow-dominated regions. Nature 438, 303–309. doi: 10.1038/nature04141
Biondi, F., and Waikul, K. (2004). DENDROCLIM2002: A C ++ program for statistical calibration of climate signals in tree-ring chronologies. Compute. Geosci. 30, 303–311. doi: 10.1016/j.cageo.2003.11.004
Brown, R., Derksen, C., and Wang, L. B. (2010). A multi-data set analysis of variability and change in Arctic spring snow cover extent, 1967-2008. J. Geophys. Res. 115:16. doi: 10.1029/2010JD013975
Brown, R., and Robinson, D. (2011). Northern hemisphere spring snow cover variability and change over 1922-2010 including an assessment of uncertainty. Cryosphere Dis. 5, 219–229. doi: 10.5194/tc-5-219-2011
Cai, Q. F., Liu, Y., Zhang, H. Y., Song, H. M., Li, Q., Sun, C. F., et al. (2020). Evolution of the dry-wet variations since 1834 CE in the lüliang mountains, north China and its relationship with the Asian summer monsoon. Ecol. Indic. 121:107089. doi: 10.1016/j.ecolind.2020.107089
Camarero, J. J., Olano, J. M., and Parras, A. (2010). Plastic bimodal xylogenesis in conifers from continental Mediterranean climates. New Phytol. 185, 471–480. doi: 10.1111/j.1469-8137.2009.03073.x
Cohen, J., Furtado, J. C., Barlow, M. A., Alexeev, V. A., and Cherry, J. E. (2012). Arctic warming, increasing snow cover and widespread boreal winter cooling. Environ. Res. Lett. 7, 14007–14014. doi: 10.1088/1748-9326/7/1/014007
Cook, E. R., and Holmes, R. (1986). Users manual for program ARSTAN. Palaeogeogr. Palaeoclimatol. Palaeoecol. 302. doi: 10.2172/138036
Cook, E. R., and Kairiukstis, L. A. (1990). Methods of Dendrochronology: Applications in the Environmental Sciences. Dordrecht: Kluwer Academic Publishers.
Cook, E. R., Meko, D. M., Stahle, D. W., and Cleaveland, M. K. (1999). Drought reconstructions for the continental United States. J. Clim. 12, 1145–1162. doi: 10.1175/1520-04421999012<1145:DRFTCU<2.0.CO;2
Dannenberg, M. P., and Wise, E. K. (2016). Seasonal climate signals from multiple tree ring metrics: a case study of Pinus ponderosa in the upper Columbia River Basin. J. Geophys. Res. Biogeosci. 121, 1178–1189. doi: 10.1002/2015JG003155
Déry, S. J., and Brown, R. D. (2007). Recent northern hemisphere snow cover extent trends and implications for the snow-albedo feedback. Geophys. Res. Lett. 34, 60–64. doi: 10.1029/2007GL031474
Fan, Z. X., Bruning, A., and Cao, K. F. (2010). Tree-ring based drought reconstruction in the central hengduan mountains region (China) since A. D. 1655. Int. J. Climatol. 28, 1879–1887. doi: 10.1002/joc.1689
Fang, K. Y., Frank, D., Zhao, Y., Zhou, F. F., and Seppä, H. (2015). Moisture stress of a hydrological year on tree growth in the Tibetan Plateau and surroundings. Environ. Res. Lett. 10:034010. doi: 10.1088/1748-9326/10/3/034010
Fang, K. Y., Gou, X. H., Chen, F. H., Li, J. B., D’Arrigo, R., Cook, E. R., et al. (2010). Reconstructed droughts for the southeastern Tibetan Plateau over the past 568 years and its linkages to the Pacific and Atlantic Ocean climate variability. Clim. Dyn. 35, 577–585. doi: 10.1007/s00382-009-0636-2
Fang, K. Y., Liu, X. M., Li, Y. J., Zhou, F. F., Dong, Z. P., Cao, C. F., et al. (2016). Interdecadal variations of the snow cover in the southeastern Tibet Plateau recorded in tree rings. Quat. Sci. 36, 993–1001.
Fritts, H. C. (1976). Tree Rings and Climate. New York, NY: Academic Press, 1–584. doi: 10.1038/scientificamerican0572-92
Gong, D. Y., and Wang, S. W. (1999). Long-term variability of the Siberian high and the possible connection to global warming. Acta Geogr. Sin. 54, 125–132. doi: 10.3321/j.issn:0375-5444.1999.02.004
Gou, X. H., Zhou, F. F., Zhang, Y. X., Chen, Q. Y., and Zhang, J. Z. (2013). Forward modeling analysis of regional scale tree-ring patterns around the northeastern Tibetan Plateau, Northwest China. Biogeosci. Dis. 10, 9969–9988. doi: 10.5194/bgd-10-9969-2013
Griffin, D. R., Woodhouse, C. A., Meko, D. M., Stahle, D. W., Faulstich, H. L., Carrillo, C., et al. (2013). North American Monsoon precipitation reconstructed from tree-ring latewood. Geophys. Res. Lett. 40, 954–958. doi: 10.1002/grl.50184
Groisman, P., Karl, T. R., and Knight, R. W. (1994). Observed impact of snow cover on the heat balance and the rise of continental spring temperatures. Nature 263, 198–200. doi: 10.1126/science.263.5144.198
Holmes, R. L. (1983). Computer-assisted quality control in treering dating and measurement. Tree.Ring Bull. 43, 69–78. doi: 10.1006/biol.1999.0214
Hu, H. R., and Liang, L. (2013). Spatial and temporal variations of winter snow over east of Qinghai-Tibet Plateau in the last 50 years. Acta Geogra. Sin. 68:11.
Huang, R., Zhu, H. F., Liang, E. Y., Liu, B., Shi, J. F., Zhang, R. B., et al. (2019). A tree ring-based winter temperature reconstruction for the southeastern Tibetan Plateau since 1340 CE. Clim. Dyn. 5, 3221–3233. doi: 10.1007/s00382-019-04695-3
Huang, X. D., Deng, J., Ma, X. F., Wang, Y. L., Feng, Q. S., Hao, X. H., et al. (2016). Spatiotemporal dynamics of snow cover based on multi-source remote sensing data in China. Cryosphere 10, 2453–2463. doi: 10.5194/tc-10-2453-2016
Immerzeel, W. W., and Bierkens, M. (2012). Asia’s water balance. Nat. Geosci. 5, 841–842. doi: 10.1038/ngeo1643
IPCC (2013). “Summary for policymakers,” in Climate Change 2013: The physical science basis. Contribution of working group I to the Fifth Assessment Report of the Intergovernmental Panel on Climate Change, eds T. F. Stocker, D. Qin, G.-K. Plattner, M. Tignor, S. K. Allen, J. Boschung, et al. (Cambridge, MA: Cambridge University Press).
Kang, S. C., Xu, Y. W., You, Q. L., Flugel, W. A., Pepin, N., and Yao, T. D. (2010). Review of climate and cryospheric change in the Tibetan Plateau. Environ. Res. Lett. 5, 15101–15101. doi: 10.1088/1748-9326/5/1/015101
Li, J. B., Cook, E. R., Chen, F. H., Davi, N., D’Arrigo, R., Gou, X. H., et al. (2009). Summer monsoon moisture variability over China and Mongolia during the past four centuries. Geophys. Res. Lett. 36:L22705. doi: 10.1029/2009GL041162
Li, J. B., Shi, J. F., Zhang, D. D., Yang, B., Fang, K. Y., and Yue, P. H. (2017). Moisture increase in response to high-altitude warming evidenced by tree-rings on the southeastern Tibetan Plateau. Clim. Dyn. 48, 649–660. doi: 10.1007/s00382-016-3101-z
Li, X. (2013). Study on the Relationships Between the Temporal & Spatial of Snow Cover in Winter and Spring over Tibetan Plateau and the Summer Precipitation in Eastern China. M.S. Thesis. Lanzhou: Lanzhou University.
Li, X., Cheng, G. D., Jin, H. J., Kang, E. S., Che, T., Jin, R., et al. (2008). Cryospheric change in China. Glob. Planet. Change 62, 210–218. doi: 10.1016/j.gloplacha.2008.02.001
Li, X. X., Liang, E. Y., Gričar, J., Rossi, S., čufar, K., and Ellison, A. M. (2017). Critical minimum temperature limits xylogenesis and maintains treelines on the southeastern Tibetan Plateau. Sci. Bull. 62, 804–812. doi: 10.1016/j.scib.2017.04.025
Li, X. X., Rossi, S., and Liang, E. Y. (2019). The onset of xylogenesis in Smith fir is not related to outer bark thickness. Am. J. Bot. 106, 1386–1391. doi: 10.1002/ajb2.1360
Liang, E. Y., Liu, X. H., Yuan, Y. J., Qin, N. S., Fang, X. Q., Huang, L., et al. (2006). The 1920 drought recorded by tree rings and historical documents in the semi-arid and areas of northern China. Clim. Change 79, 403–432.
Liu, G., Song, W. L., and Zhu, Y. F. (2013). A statistical prediction method for an East Asian winter monsoon index reflecting winter temperature changes over the Chinese mainland. Acta Meteorol. Sin. 71, 275–285.
Liu, H. B., and Shao, X. M. (2000). Reconstruction of early-spring temperature at Zhen an from 1755 using tree ring chronology. Acta Meteorol. Sin. 58, 223–233. doi: 10.11676/qxxb2000.023
Liu, H. Q., Sun, Z. B., and Zhu, W. J. (2003). Interdecadal relation between snow cover over the Tibetan Plateau and Asian monsoon circulation. J Nanjing Inst. Meteorol. 26, 733–739.
Liu, X. H., and Chen, B. D. (2000). Climatic warming in the Tibetan Plateau during recent decades. Int. J. Climatol. 20, 1729–1742. doi: 10.1002/1097-0088(20001130)20:143.0.CO
Masahiro, H., Daisuke, N., and Akio, K. (2005). Changes in snow cover and snow water equivalent due to global warming simulated by a 20 km-mesh global atmospheric model. Sci. Online Lett. Atmosphere Sola 1, 93–96. doi: 10.2151/sola.2005-025
Masiokas, M. H., Villalba, R., Christie, D. A., Betman, E., Luckman, B. H., Le Quesne, C., et al. (2012). Snowpack variations since AD 1150 in the Andes of Chile and Argentina (30°-37°S) inferred from rainfall, tree-ring and documentary records. J. Geophys. Res 117:D05112. doi: 10.1029/2011JD016748
McCabe, G. J., and Wolock, D. M. (2010). Long-term variability in northern hemisphere snow cover and associations with warmer winters. Clim. Change 99, 141–153. doi: 10.1007/s10584-009-9675-2
Michaelsen, J. (1987). Cross-validation in statistical climate forecast models. J. Appl. Meteorol. Climatol. 26, 1589–1600. doi: 10.1175/1520-045019870262.0.CO
Mohtadi, M., Oppo, D. W., Stephan, S., Stuut, J. B. W., De Pol-Holz, R., Hebbeln, D., et al. (2011). Glacial to Holocene swings of the Australian-Indonesian monsoon. Nat. Geosci. 4, 540–544. doi: 10.1038/ngeo1209
Pu, Z. X., Xu, L., and Salomonson, V. V. (2007). MODIS/Terra observed seasonal variations of snow cover over the Tibetan Plateau. Geophys. Res. Let.t 34, 137–161. doi: 10.1029/2007GL029262
Qin, D. H., Liu, S. Y., and Li, P. J. (2006). Snow cover distribution, variability, and response to climate change in western China. J. Clim. 19, 1820–1833. doi: 10.1175/JCLI3694.1
Qin, D. H., Zhou, B. T., and Xiao, C. D. (2014). Progress in studies of cryospheric changes and their impacts on climate of China. J. Meteorol. Res. 28, 732–746. doi: 10.1007/s13351-014-4029-z
Qin, L., Yuan, Y. J., Zhang, R. B., Wei, W. S., Yu, S. L., Fan, Z. A., et al. (2016). Tree-ring response to snow cover and reconstruction of century annual maximum snow depth for northern Tianshan Mountains China. Geochronometria 43, 9–17. doi: 10.1515/geochr-2015-0026
Räisänen, J. (2008). Warmer climate: less or more snow? Clim. Dyn. 30, 307–319. doi: 10.1007/s00382-007-0289-y
Ram, R. Y., and Mahendra, R. B. (2013). Tree-ring-based snowfall record for cold arid western Himalaya, India since A.D. 1460. J. Geophys. Res. Atmospheres 118, 7516–7522. doi: 10.1002/jgrd.50583
Robinson, D. A., Estilow, T. W., and Noaa Cdr Program. (2012). NOAA Climate data Record (CDR) of northern hemisphere (NH) snow cover extent (SCE), version 1. Asheville: NOAA national centers for environmental information doi: 10.7289/V5N014G9
Schrier, G., Barichivich, J., Harris, I., Jones, P. D., and Osborn, T. J. (2015). Monitoring Global Drought Using the Self-calibrating palmer drought severity index.
Shaman, J., and Tziperman, E. (2005). The effect of ENSO on Tibetan plateau snow depth: a stationary wave teleconnection mechanism and implications for the south Asian monsoons. J. Cli.m 18, 2067–2079. doi: 10.1175/JCLI3391.1
Shen, C. M., Wang, W. C., and Zeng, G. (2011). Decadal variability in snow cover over the Tibetan Plateau during the last two centuries. Geophysical Research Letters 38, L1073. doi: 10.1029/2011GL047288
Song, H. M., Liu, Y., Ni, W. M., Cai, Q. F., Sun, J. Y., Ge, W. B., et al. (2007). Winter mean lowest temperature derived from tree-ring width in Jiuzhaigou region, China since 1750 A. D. Quat. Sci. 27, 486–491. doi: 10.3321/j.issn:1001-7410.2007.04.002
Stokes, M. A., and Smiley, T. L. (1968). An Introduction to Tree-Ring Dating. Tucson: University of Arizona Press doi: 10.1038/268402b0
Timilsena, J., and Piechota, T. (2008). Regionalization and reconstruction of snow water equivalent in the upper Colorado River basin. J. Hydrol. 352, 94–106. doi: 10.1016/j.jhydrol.2007.12.024
Torbenson, M. C. A., Stahle, D. W., Díaz, J. V., Cook, E. R., and Griffin, D. (2016). The relationship between earlywood and latewood ring-growth across North America. Tree Ring Res. 72, 53–66. doi: 10.3959/1536-1098-72.02.53
Vaganov, E. A., Hughes, M. K., Kirdyanov, A. V., Schweingruber, F. H., and Silkin, P. P. (1999). Influence of snowfall and melt timing on tree growth in subarctic Eurasia. Nature 400, 149–151. doi: 10.1038/22087
Villanueva-Diaz, J., Stahle, D. W., Luckman, B. H., Cerano-Paredes, J., Therrell, M. D., Cleaveland, M. K., et al. (2007). Winter-spring precipitation reconstructions from tree rings for northeast Mexico. Clim. Change 83, 117–131. doi: 10.1007/s10584-006-9144-0
Wang, C. H., Li, Y., and Wang, Y. (2015). Impacts of interdecadal variability of circulation and winter monsoon on winter snowfall over the Tibetan Plateau. Clim. Environ. Res. 20, 421–432.
Wang, C. H., Yu, L., and Huang, B. (2012). The impact of warm pool SST and general circulation on increased temperature over the Tibetan Plateau. Adv in Atmospheric Sci. 29, 274–284. doi: 10.1007/s00376-011-1034-3
Wang, C. X. (2012). The Effect of Winter Snow cover over the Tibetan Plateau to the Summer Precipitation at the Yellow River Basin. Master Dissertation. Nanjing: Nanjing University of Information Science & Technology.
Wang, C. X., and Li, D. L. (2012). Spatial-temporal variations of snow cover days and the maximum depth of snow cover in China during recent 50 years. J. Glaciol. Geocryol. 34, 247–256.
Wang, L., and Chen, W. (2010). How well do existing indices measure the strength of the East Asian winter monsoon? Adv. Atmospheric Sci. 27, 855–870.
Wigley, T. M. L., Briffa, K. R., and Jones, P. D. (1984). On the average value of correlated time series with applications in dendroclimatology and hydrometeorology. J. Clim. Appl. Meteorol. 232, 2201–2213. doi: 10.1175/1520-045019840232.0.CO;2
Woodhouse, C. A. (2003). A 431-Yr Reconstruction of western colorado snowpack from tree rings. J Clima. 16, 1551–1561. doi: 10.1175/1520-0442-16.10.1551
Xi, S., and Zhang, Z. F. (2013). Spatial and temporal analysis of snow cover in China in recent 50 years. J. Arid Meteorol 1, 451–456. doi: 10.11755/j.issn.1006-76392013-03-045
Xiu-zhong, S., Yong, L., Xia, Z., and Ying-xin, G. (2010). Analysis on snowfall change characteristic of China in recent 46 years. Plateau Meteorol. 29, 1594–1601.
Xu, X. K., Chen, H., and Zhou, G. Q. (2005). The spatiotemporal distribution of land surface features in the Tibetan Plateau. Clim. Environ. Res. 10, 409–420.
Yan, D. J., Ma, N., and Zhang, Y. S. (2021). A daily, 0.05° Snow depth Dataset for Tibetan Plateau (2000-2018). National Tibetan Plateau Data Center doi: 10.11888/Snow.tpdc.271743
Yang, K., Ye, B. S., Zhou, D. G., Wu, B. Y., Foken, T., Qin, J., et al. (2011). Response of hydrological cycle to recent climate changes in the Tibetan Plateau. Clim. Change 109, 517–534. doi: 10.1007/s10584-011-0099-4
Yao, T. D., Xue, Y. K., Chen, D. L., Chen, F., Thompson, L., Cui, P., et al. (2018). Recent Third Pole’s rapid warming accompanies cryospheric melt and water cycle intensification and interactions between monsoon and environment: multi-disciplinary approach with observation, modeling and analysis. Bull. Am. Meteorol. Soc. 100, 423–444. doi: 10.1175/BAMS-D-17-0057.1
Ye, D. Z. (1981). Some characteristics of the summer circulation over the Qinghai-Xizang (Tibet) Plateau and its neighborhood. Bull. Am. Meteorol. Soc. 62, 14–19.
Yi, X., Yin, Y., Li, G., and Peng, J. (2011). Temperature variation in recent 50 years in the Three-River headwaters region of Qinghai Province. Acta Geogr. Sin. 66, 1451–1465.
You, Q. L., Kang, S. C., Ren, G. Y., Fraedrich, K., Pepin, N., Yan, Y. P., et al. (2011). Observed changes in snow depth and number of snow days in the eastern and central Tibetan Plateau. Clim. Res. 46, 171–183.
You, S. C., Takahashi, K., and Matsuoka, Y. (2002). Climate change impact on surface runoff in China. Quat. Sci. 22, 148–157.
Zhang, R. B., Yuan, Y. J., Wei, W. S., Gou, X. H., Yu, S. L., Shang, H. M., et al. (2015). Dendroclimatic reconstruction of autumn-winter mean minimum temperature in the eastern Tibetan Plateau since 1600 AD. Dendrochronologia 33, 1–7. doi: 10.1016/j.dendro.2014.09.001
Zhang, R. B., Yuan, Y. J., Wei, W. S., Yu, S. L., Shang, H. M., Wang, L. L., et al. (2010). Analysis on mean minimum temperature in the east Tibet from autumn to winter in tree ring of the past 400 years. Plat. Meteorol. 29, 359–365. doi: 10.3788/gzxb20103906.0998
Zhang, T. J. (2005). Influence of the seasonal snow cover on the ground thermal regime: an overview. Rev. Geophys. 43:RG4002. doi: 10.1029/2004RG000157
Zhou, F. F., Fang, K. Y., Zhang, F., Dong, Z. P., and Chen, D. (2016). Climate-driven synchronized growth of alpine trees in the southeast Tibetan Plateau. Plos One 11:e0156126. doi: 10.1371/journal.pone.0156126
Zhu, H. F., Fang, X. Q., Shao, X. M., and Yin, Z. Y. (2009). Tree ring-based February-April temperature reconstruction for Changbai Mountain in Northeast China and its implication for East Asian winter monsoon. Clim. Past 5, 661–666. doi: 10.5194/cp-5-661-2009
Zhu, Y. F. (2008). An index of East Asian winter monsoon applied to description the Chinese mainland winter temperature changes. Acta Meteorol. Sin 66, 781–788.
Zhu, Y. X. (2007). nfluence of snow over the Tibetan Plateau in Winter and spring on Summer Rainfall Distribution in China. Nanjing: Nanjing University of Information Science and Technology.
Keywords: Tibetan Plateau, tree-ring early-wood, climate reconstruction, snow cover extent, East Asian winter monsoon
Citation: Bing X, Yao Q, Zhou F, Zheng Z, Bai M, Jiang S, Wang C and Fang K (2022) March–May Snow Cover Extent Reconstruction for the Past Four Centuries Based on the Tree-Ring Early-Wood on the Southeastern Tibetan Plateau. Front. Ecol. Evol. 10:900219. doi: 10.3389/fevo.2022.900219
Received: 20 March 2022; Accepted: 21 June 2022;
Published: 01 August 2022.
Edited by:
Olga Solomina, Institute of Geography (RAS), RussiaReviewed by:
Guobao Xu, State Key Laboratory of Cryospheric Sciences, Northwest Institute of Eco-Environment and Resources (CAS), ChinaCopyright © 2022 Bing, Yao, Zhou, Zheng, Bai, Jiang, Wang and Fang. This is an open-access article distributed under the terms of the Creative Commons Attribution License (CC BY). The use, distribution or reproduction in other forums is permitted, provided the original author(s) and the copyright owner(s) are credited and that the original publication in this journal is cited, in accordance with accepted academic practice. No use, distribution or reproduction is permitted which does not comply with these terms.
*Correspondence: Qichao Yao, eWFvY2hlbmcwMDk5QDEyNi5jb20=; Keyan Fang, a2ZhbmdAZmpudS5lZHUuY24=
Disclaimer: All claims expressed in this article are solely those of the authors and do not necessarily represent those of their affiliated organizations, or those of the publisher, the editors and the reviewers. Any product that may be evaluated in this article or claim that may be made by its manufacturer is not guaranteed or endorsed by the publisher.
Research integrity at Frontiers
Learn more about the work of our research integrity team to safeguard the quality of each article we publish.