 Honggang Lu
 Jiaxi Zheng*
 Hanyun Ou
 Xijian Li
- Agricultural Economics, School of Business Administration, Zhongnan University of Economics and Law, Wuhan, China
Vulnerability research is an active option for fisheries to adapt to climate change. Based on the vulnerability analysis framework of the vulnerability scoping diagram, a vulnerability evaluation index system for inland fisheries in China was constructed in three dimensions, including exposure, sensitivity and adaptive capacity. The entropy method was used to evaluate the flood disaster vulnerability of China’s inland fisheries from 2010 to 2019 and its decomposition. The temporal and spatial differences between vulnerability and its decomposition were analyzed. Kernel density estimation and factor contribution model were used to analyze the changing trend of vulnerability and main influencing factors. The results show that: during the study period, the vulnerability of inland fisheries in China to flood disasters showed a fluctuating downward trend, and the high vulnerability areas were mainly distributed in South China and the middle and lower reaches of the Yangtze River; the exposure index first decreased and then increased, and the high-exposure regions were mainly concentrated in the middle and lower reaches of the Yangtze River; the sensitivity index first decreased and then increased, and the high-sensitivity areas were concentrated in North-east China, the middle and lower reaches of the Yangtze River, and South China; the adaptive capacity index showed a downward trend, and the areas with lower adaptive capacity were concentrated in the South-west and North-west. From the factor contribution model, the economic losses of fishery floods and the affected area had the greatest impact on the exposure index; fingerling production and freshwater fishery production had the greatest impact on the sensitivity index; the index with a lower contribution to the adaptive capacity index was the total power of fishery machinery and fishery technology promotion. Therefore, building reservoirs, optimizing aquaculture layout and promoting fishery modernization are the keys to reducing the vulnerability of inland fisheries to flood disasters.
Introduction
Fisheries and aquaculture have made a significant contribution to food security, improved dietary structure and increased income for farmers. Since 1961, global fish consumption has grown at an annual average rate of 3.1%, almost twice higher than the annual growth rate of the world population (1.6%). Over the same period, global fish production has doubled, reaching 179 million tons in 2018 (FAO, 2014). China is the world’s largest fish producer and exporter. Since 1991, China’s aquaculture production has exceeded that of the rest of the world combined. By 2018, China’s aquaculture accounted for 57.9% of the world’s aquaculture, with inland and marine fisheries production reaching 31.01 and 31.56 million tons, respectively. However, in recent years, with global warming and rising sea levels, the intensity, frequency and scope of global disasters have been increasing, adversely affecting fishermen, fisheries and economic development. Among them, flood disaster is one of the severe disasters affecting fishery development. In 2005, economic losses caused by floods in China amounted to 2.499 billion yuan, and in 2019, the economic losses reached 6.937 billion yuan, accounting for 51.441% of the total economic losses in fisheries. According to the IPCC report (2019), the global temperature is expected to rise by 1.5°C in the future. This kind of climate change may greatly aggravate the impact of flood disaster on fishery production and restrict the sustainable development of inland fishery.
Therefore, it is necessary to accurately assess the vulnerability of China’s inland fisheries to flood disasters, identify the brittle factors of the inland fisheries’ vulnerability to flood disasters, and comprehensively and systematically describe its basic characteristics, distribution dynamics, regional differences and spatial distribution from temporal and spatial dimensions. This will help to guide China’s inland fisheries to accurately “reduce brittleness” and enhance their disaster resilience.
Literature Review
The concept of vulnerability was first applied in the field of natural disasters. In the early stage of research, some scholars identified and predicted the risk areas of vulnerable groups by calculating the occurrence possibility and impact of disasters (White, 1974). As resource depletion and environmental degradation became increasingly serious in the late 20th century, vulnerability assessment was gradually extended to regional planning, sustainable development, and global environmental status and trend (Timmerman, 1981; Kasperson and Kasperson, 2001). Adger believed that vulnerability refers to a state in which the system exposed to environmental or social changes is sensitive to damage caused by these changes due to the lack of adaptability (Adger, 2006). Turner et al. (2003) believed that vulnerability is the degree of damage that systems, subsystems or system components may experience due to exposure to disasters. The United Nations International Strategy for Disaster Reduction (UNISDR) stated that vulnerability is the inherent property of a system, which is determined by natural, social, economic and environmental factors and processes, and can withstand a variety of stresses (UNISDR, 2004); McCarthy (2001) demonstrated that vulnerability is an effective description of the extent to which a system is susceptible to sustained damages from climate change. In general, vulnerability can be considered as a state in which the system exposed to disturbance evolves in an unsustainable development direction or leads to the possibility of systemic risks due to the sensitivity of internal structures and the lack of adaptive capacity to deal with the disturbance.
Currently, a large amount of literature has focused on disaster vulnerability from both macro and micro perspectives. At the micro-level, Ghosh and Ghosal (2021) analyzed the differences in climate vulnerability between agriculture-dependent villages and forest resource-dependent villages based on flood disasters and analyzed the vulnerability index of farmers to climate change in the study area. Tian and Lemos (2018) examined the impact of farm household assets and labor allocation on climate vulnerability from exposure, sensitivity and adaptive capacity, to illustrate the complex process affecting rural livelihoods and household adaptive capacity. Zhou et al. (2021a) included earthquake disasters in the assessment of farmers’ livelihood strength and systematically measured the livelihood resilience of farmers in Sichuan, China, from four aspects: disaster resistance, buffer capacity, self-organizing capacity and learning ability. On the basis of measuring the climate vulnerability of farmers, Peng et al. (2019) further analyzed the coping strategies of farmers. At the macro level, Hoque et al. (2019) constructed an agricultural livelihood vulnerability index based on the research framework of sensitivity, exposure and adaptive capacity, and analyzed the impact of agricultural livelihoods on climate in various regions of Bangladesh. Based on sensitivity, exposure, and adaptive capacity, Wu et al. (2017) included a landscape fragmentation index for correction (a landscape fragmentation index) to assess the vulnerability of agriculture to flood disasters.
The measurement methods of vulnerability mainly include the comprehensive index method and vulnerability function evaluation method. In addition, an increasing number of studies have integrated GIS and RS technology. Zhang et al. (2017) used the comprehensive index method to measure the vulnerability of the Yellow River Delta wetland ecosystem. Nguyen and Bao (2019) assessed the vulnerability to floods of 10 villages in Quang Binh Province, Vietnam, based on the flood vulnerability index. In addition, Abebe et al. (2018) proposed a flood disaster vulnerability evaluation model based on GIS and Bayesian reliability network to analyze the flood vulnerability in different areas of Toronto. Karimzadeh et al. (2014) used the Analytic Hierarchy Process (AHP) to measure the seismic vulnerability of Tabriz City, and used GIS software for regional division. Guo et al. (2019) established 10 indicators, used the Tosis method to measure the drought disaster vulnerability of maize in the central and western regions of Jilin Province and used GIS software to conduct regional research on disaster vulnerability.
In terms of the assessment of fishery vulnerability, most of the existing studies focus on the climate vulnerability of marine fisheries. Allison et al. (2009) established a vulnerability model to analyze the economic vulnerability of 132 countries and the potential impact of climate change on their capture fisheries. Based on the perspective of food security, Ding et al. (2017) analyzed the impact of climate change on the vulnerability of marine fisheries in 109 countries from three aspects: national exposure, sensitivity and adaptive capacity. Qi et al. (2018) used a vulnerability model to assess the vulnerability of marine fisheries in 11 coastal provinces in China from three aspects: exposure, sensitivity and adaptive capacity. Kim et al. (2018) compared the climatic vulnerability of coastal and inshore fisheries and found that the climatic vulnerability of coastal fisheries was higher than that of inshore fisheries. In addition, there is also literature analyzing the vulnerability of wetland fisheries to climate hazards. Naskar et al. (2018) analyzed the vulnerability of wetland fisheries in West Bengal, India, based on climate indicators and stakeholder-perceived vulnerability indicators of wetland fisheries using long-term quantitative data. Puthiyottil et al. (2021), using a stakeholder-driven approach to quantify the impacts of climate change on wetland fisheries, found around seven potential threats to wetland fisheries from climate change.
Based on the above literature, the current research on disaster vulnerability has been extremely rich, involving the construction of indicator systems, analysis of spatiotemporal characteristics, and discussion of related impact mechanisms. This has laid a solid foundation for further in-depth follow-up research. However, there are still some deficiencies in the existing research. Firstly, the existing research does not clarify the climate vulnerability of the inland fishery in the largest aquaculture-producing country (China). Secondly, few studies focus on flood disasters and inland fisheries for vulnerability assessment and analysis. This paper took 31 provinces (cities) in China as the research area, selected 3 dimensions and 12 indicators of exposure, sensitivity and adaptability, established a vulnerability evaluation model for inland fishery flood disasters and conducted regional evaluation based on GIS spatial analysis technology. This will provide decision-making reference for flood mitigation and sustainable development of China’s inland fisheries.
Methodology and Data
Study Area and Data Source
China is located in the east of Asia, facing the Pacific Ocean to the east. The terrain is high in the west and low in the east. It has obvious monsoon climate characteristics, and the seasonal changes and regional differences in rainfall are extremely obvious. Seasonal characteristics: flood disasters mainly occurred in May–July in the south, and June and July were the main frequent periods; severe flood disasters in the north were concentrated in June–August, and July and August were the most frequent periods. Regional characteristics: China’s seven major river basins (Yangtze River, Yellow River, Huaihe River, Haihe River, Pearl River, Liaohe River, and Songhua River) are closely related to flood disasters. Among them, the Yangtze River, Pearl River and Yellow River basins are the three basins with the highest flood frequency.
China is the world’s largest aquaculture country. The inland water area is about 174,710 km2, accounting for 1.820% of the national land area; the lake area accounts for about 43.066% of the total inland water area, about 75,240 km2, and the aquaculture area is about 21,510 km2; reservoirs The total area is about 23,020 km2, and the cultivable area is about 18,840 km2; the total area of the pond is about 19,220 km2. In recent years, China has strictly controlled the intensity of marine fishing, scientifically expanded new space for aquaculture, and the output of aquaculture has increased year by year. As of 2019, China’s freshwater aquaculture volume reached 30,137,740 tons, and the total aquaculture area reached 51,160 km2. At present, China’s fishery is in a critical period of modernization. The development model is changing from fishing to aquaculture, from resource development to resource conservation and quality benefits, and from traditional farming to ecological health.
In view of the availability of data, this study took 31 provinces (cities) in China as the research object. The period was 2010–2019. Relevant data on the fishery, rainfall and water area, and the rainfall data were obtained from the China Meteorological daily dataset of China’s surface climate data of the National Meteorological Information Center of the Bureau. The fishery-related data was from the “China Fishery Yearbook” and the “China Fishery Statistical Yearbook.” The water area-related data was from the “China Water Conservancy Statistical Yearbook.”
Model Settings
Polsky et al. (2007) decomposed vulnerability into three elements (i.e., exposure, sensitivity, and adaptive capacity) and proposed a vulnerability scoping diagram (VSD) framework. It provides a clear and comprehensive quantitative assessment of vulnerability through multivariate data organization, clear vulnerability connotation and index system construction method (Polsky et al., 2007). In this paper, flood disasters were taken as the exposure factor of inland fisheries and 12 indicators were selected. Then, based on the definition of vulnerability and combined with the VSD vulnerability assessment framework, an evaluation index system was constructed (Table 1). The component, definition and calculation method of indicators of each dimension are presented as follows:
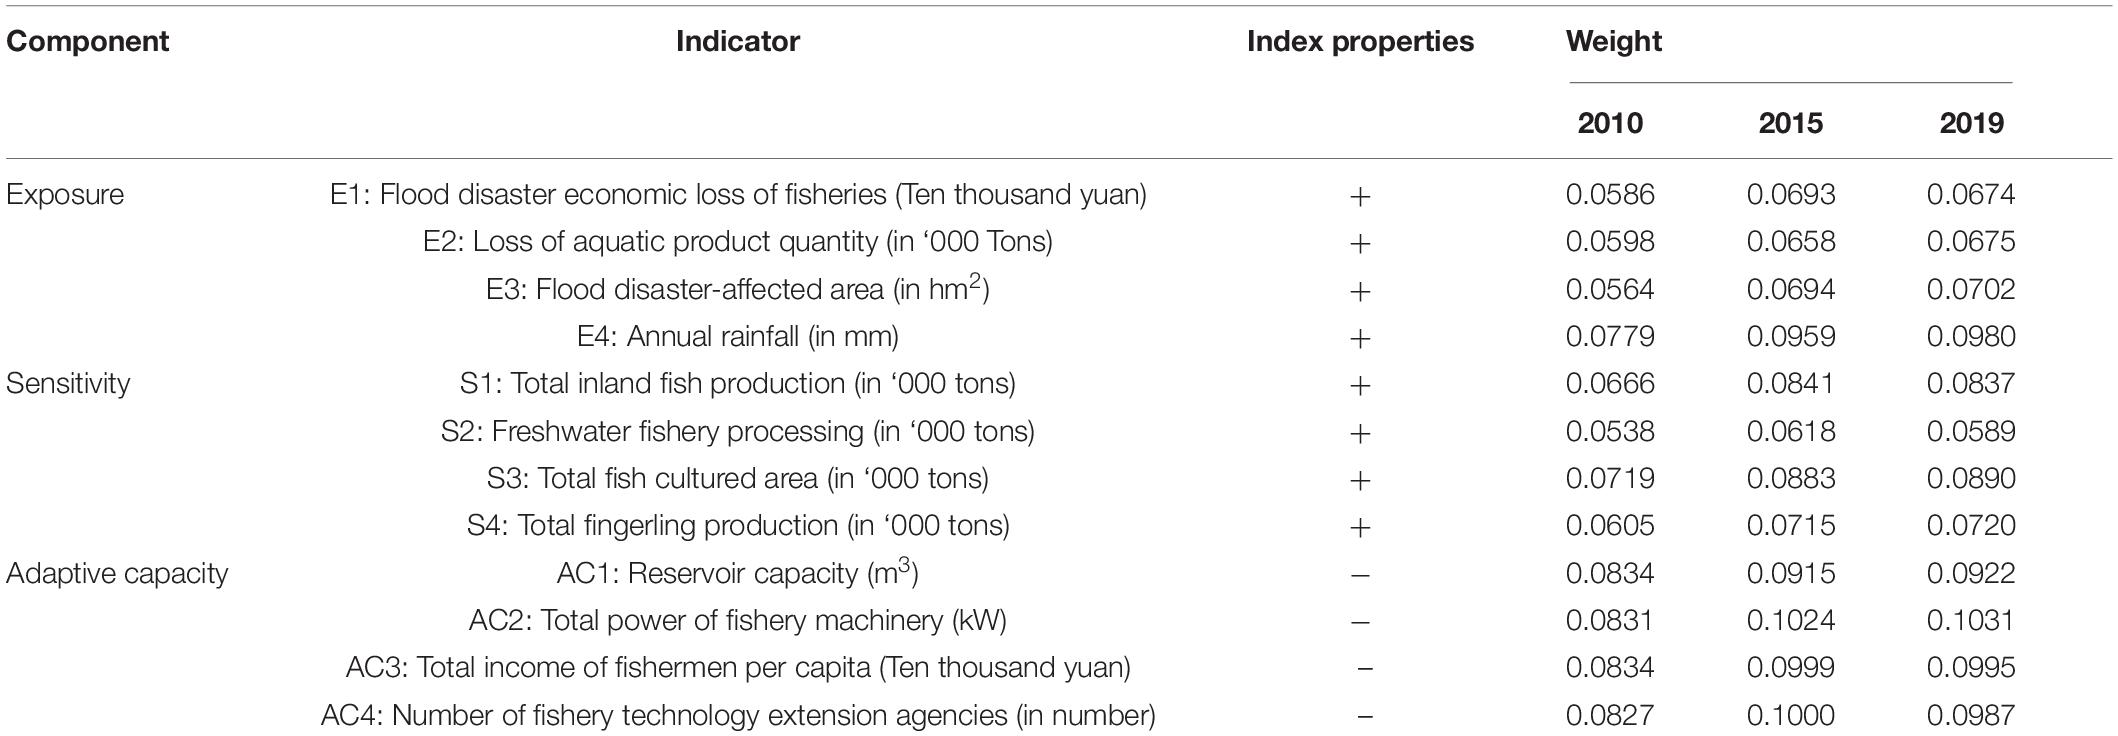
Table 1. Index system of flood vulnerability assessment of inland fisheries in China.
(1) Exposure refers to the extent to which the system is disturbed by the external natural environment and social pressure and reflects the extent to which inland fisheries are affected by flood disasters. The affected area, loss of aquatic products and economic loss of the fishery can directly reflect the impact of flood disaster on fisheries. The amount of rainfall reflects the intensity of flood disasters in a region (Allison et al., 2009; Das et al., 2013). Therefore, the economic loss, aquatic product loss, affected area and the amount of regional rainfall were selected to represent the exposure of inland fisheries to flood disasters.
(2) Sensitivity refers to the degree to which the system is subjected to the positive or negative effects of stress and is used to characterize the sensitivity of the system to disturbance. Total inland fish production, total fish seed production, total fish culture area and fish product processing were selected to represent fishery sensitivity (Handisyde et al., 2006; Allison et al., 2009).
(3) Adaptive capacity refers to the system’s ability to cope with flood disasters and reflects the resilience of the fishery system, which is determined by the economy, technology, infrastructure and staffing. Reservoir capacity, the total power of fishery machinery, the total income of fishermen per capita and fishery technology extension institutions were selected to represent adaptive capacity (Das et al., 2016; Mmia et al., 2019).
Data Standardization
In the flood disaster vulnerability assessment of fisheries, in order to eliminate the dimensional differences and the differences in action direction between initial assessment indicators, the original data were normalized using the range to make all indicators have the same action direction (Xu et al., 2019).
Positive indicator: the degree of vulnerability increases with the increase of index values, i.e., the index property is “+,” and positive index normalization is obtained by
Negative index: the degree of vulnerability decreases with the increase of index values, i.e., the index property is “−,” and negative index normalization is obtained by
where max(Xij) and min(Xij) represent the maximum and minimum value of the j index, respectively;Xij and are the original index value and the normalized value of item j, respectively, i = 1, 2, 3,……, m;j = = 1, 2, 3,……, n. In this paper, m is the research sample of Chinese provinces, m = 31; n is the number of evaluation indexes, n = 12.
Index Weight Calculation
For a fishery flood disaster vulnerability assessment system, it is necessary to select suitable methods to determine the weight of each index. At present, two methods are mainly used to assign weight: subjective weighting method such as the analytic hierarchy process, expert investigation method and BP neural network technology is highly dependent on experts, subjective and difficult to objectively evaluate the difference of indicators; the entropy weight method, which assigns weight according to the difference between indicators, thus avoiding the subjective will of experts and truly reflecting the influence degree of indicators. In this paper, the entropy weight method was selected to determine weight (Xu et al., 2018; Zhou et al., 2021b), and the specific calculation process is as follows:
(1) Based on the normalized value, determine the index weight yij:
(2) Calculate the entropy of the jth index ej:
(3) Calculate the difference coefficient of item j as gj:
(4) Calculate the weight of each index wj:
Vulnerability Model Establishment
Flood disaster vulnerability measurements of inland fisheries reflect the internal relationship between exposure, sensitivity and adaptive capacity. Higher exposure and sensitivity indices indicate higher vulnerability of fisheries. On the contrary, a higher adaptive capacity index indicates a higher capability of the fishery to cope with disasters, i.e., the lower vulnerability degree.
According to the method of Polsky et al. (2007) and Morales et al. (2014), a VSD model was constructed to analyze the vulnerability of inland fisheries to flood disasters:
where V represents vulnerability; E represents exposure; S is sensitivity; AC is adaptive capacity. The weights of E, S and AC were calculated by the entropy method:
Where wej,wsj, and waj are the weights of the j index of exposure, sensitivity and adaptive capacity, respectively; yeij,ysij, and yaij are the normalized values of the first indicator of exposure, sensitivity and adaptive capacity, respectively. Based on the existing studies (Boori et al., 2016; Weis et al., 2016), the exposure, sensitivity, and adaptive capacity indexes were divided into four categories according to the natural breakpoint method and visualized by ArcGis software, in order to intuitively display the flood disaster exposure, sensitivity and adaptability of inland fisheries in China.
Kernel Density Estimation
Kernel density estimation uses a continuous density curve to express the distribution of vulnerability to flood disasters in China’s inland fisheries. This method does not use prior knowledge of data distribution or any assumptions. It is only based on the characteristics of the sample data and uses a non-parametric estimation kernel. The density function avoids the defect of subjectively setting the function form in the parameter analysis. Therefore, this method was used in this paper to compare the kernel density curves of different years to reveal the dynamic evolution characteristics of the flood vulnerability of inland fishery and their decomposition at the provincial scale. It is expressed as:
where n is the number of provinces, yi is the vulnerability (exposure, sensitivity, and adaptive capacity) of i, is the mean value of all provincial vulnerabilities (exposure, sensitivity, and adaptive capacity) in the current year; K (.) and h represent the core function and bandwidth of stata software.
Factor Contribution Model
A prerequisite for effective vulnerability reduction is to identify and analyze the main influencing factors. In the research on the identification of influencing factors, the factor contribution model has been widely used (Zhou et al., 2018; Yuan et al., 2021). Based on the factor contribution calculation model, the main contributing factors of flood vulnerability of inland fisheries in each province of China were analyzed. The calculation equation is as follows:
where Oj is the contribution of item j to vulnerability; Ij is the index deviation degree, which is equal to 1 minus the normalized value Xij; wjis the weight of each indicator.
Results and Analysis
Vulnerability Assessment of China’s Inland Fisheries to Floods
To sum up, this paper calculated the measurement results of the vulnerability of inland fisheries to flood disasters in 31 provinces (cities) in China. In order to visually show the evolution trend of vulnerability to flood disasters of inland fisheries in China, this paper firstly depicted the columnar trend of the mean and median vulnerability of inland fisheries to flood disasters at the country level from 2010 to 2019 (see Figure 1). Furthermore, in order to facilitate the investigation of the dynamic trend of the vulnerability of inland fisheries to floods at the regional level, the regions were divided based on the administrative geographical divisions prescribed by China, combining the differences in climate between the north and the south and the distribution of inland fisheries (Zeng et al., 1990; Zhao et al., 2022), i.e., North-east China (Heilongjiang, Jilin, and Liaoning), Huanghuai District of North China (Beijing, Tianjin, Hebei, Shanxi, Neimeng, Shandong, and Henan), the middle and lower reaches of the Yangtze River (Shanghai, Jiangsu, Zhejiang, Anhui, Jiangxi, Hubei, and Hunan), South China (Guangdong, Guangxi, Hainan, and Fujian), South-west (Yunnan, Guizhou, Chongqing, Sichuan, and Xizang), North-west (Shanxi, Gansu, Qinghai, Ningxia, and Xinjiang). Thus, a line graph of the average vulnerability to flood disasters of inland fisheries in China as a whole and six regions was drawn (see Figure 2).
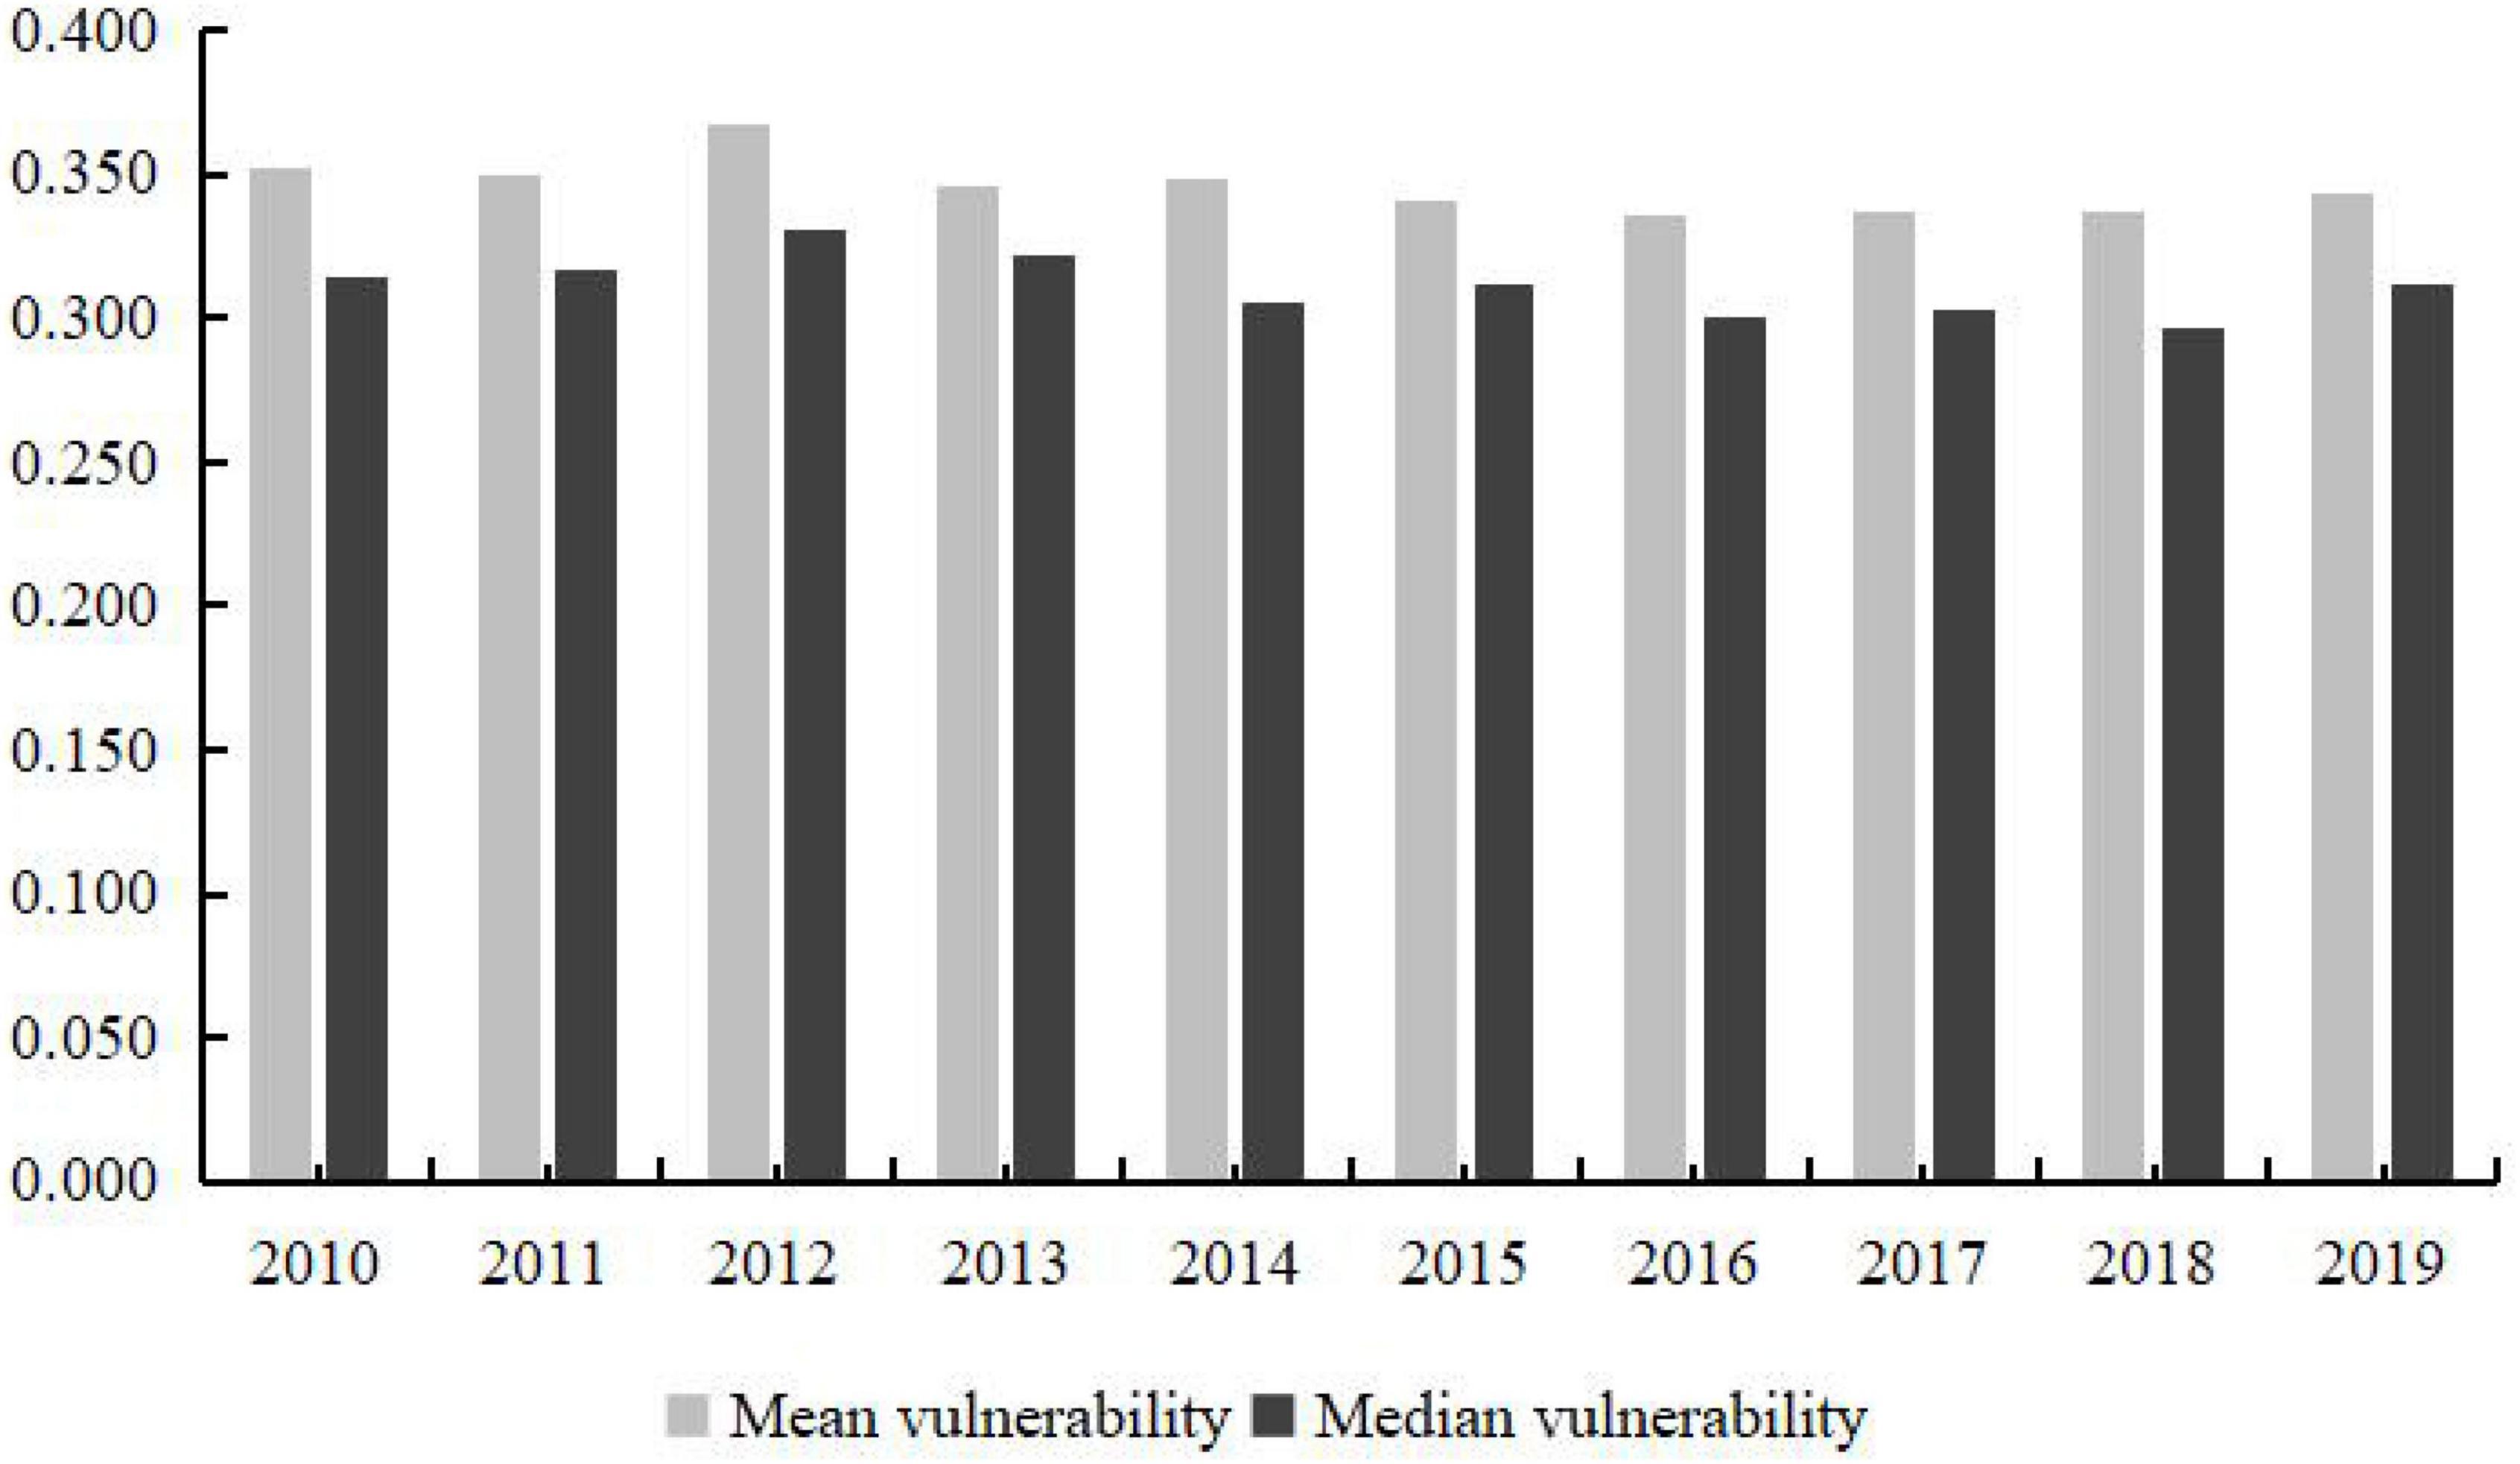
Figure 1. Mean and median vulnerability to flood disasters of provincial inland fisheries from 2010 to 2019.
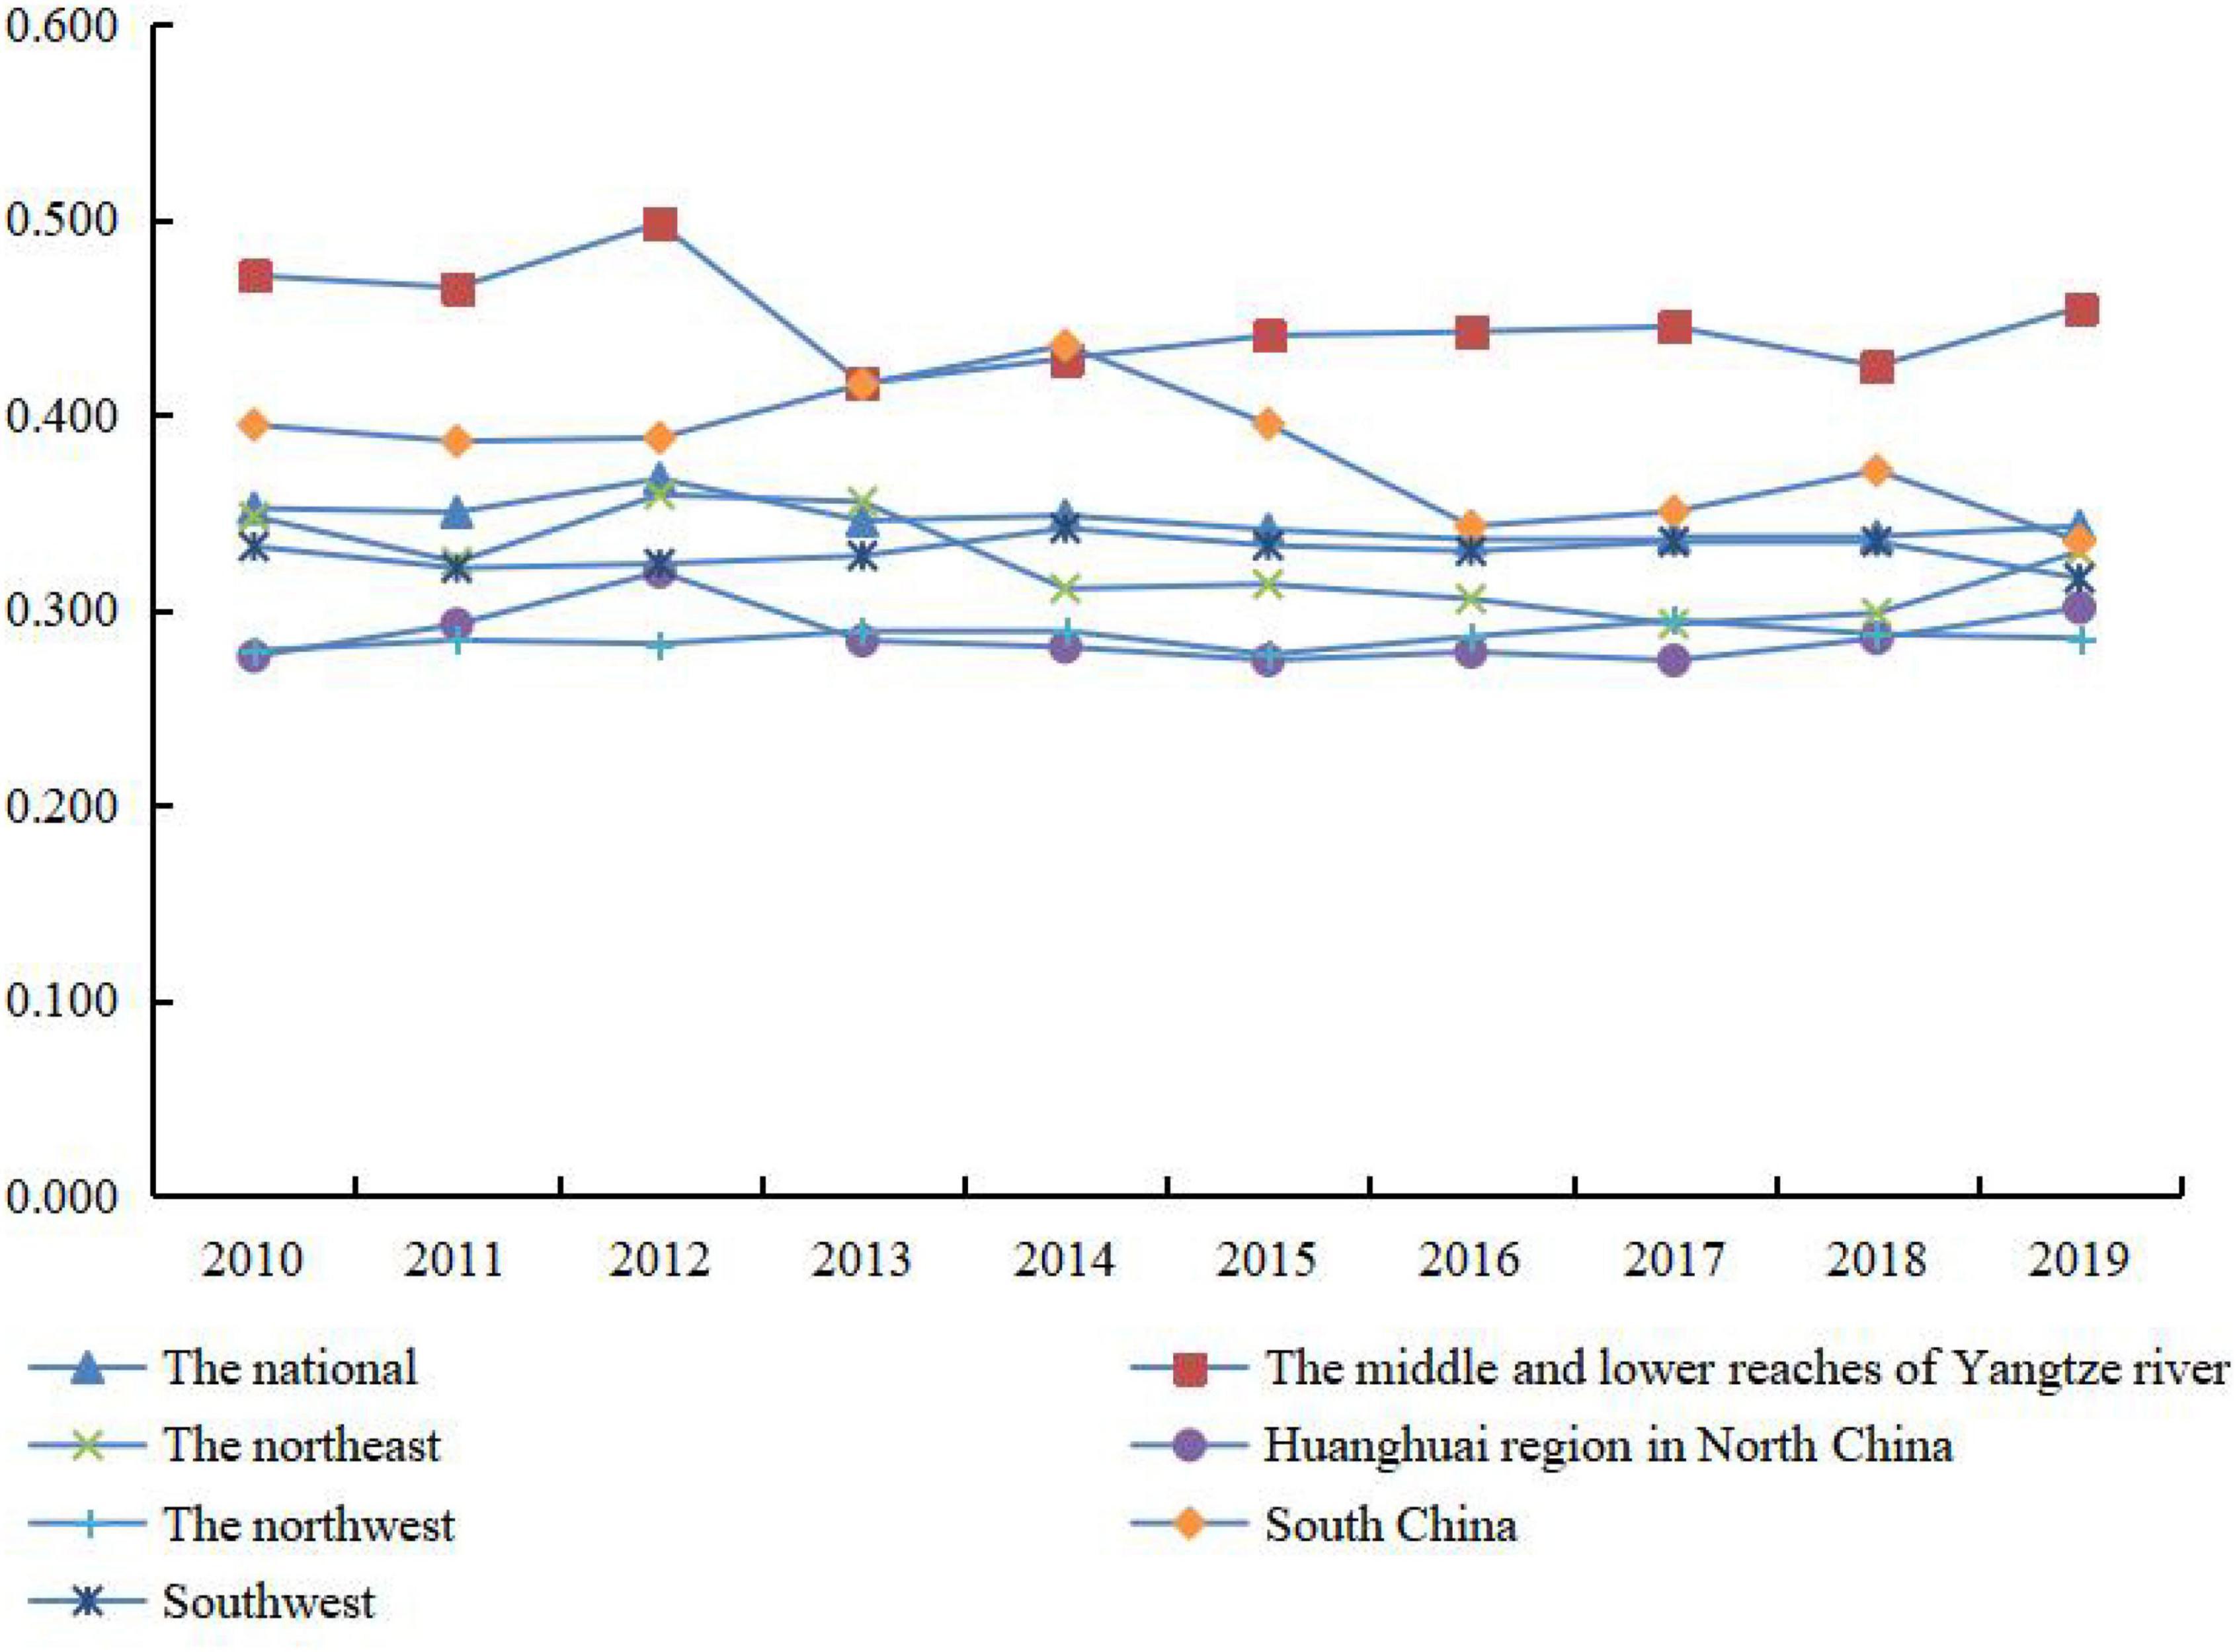
Figure 2. Variation trend of vulnerability to flood disasters in China’s inland fisheries from 2010 to 2019.
At the country level, the vulnerability to flood disasters of inland fisheries in China from 2010 to 2019 showed a fluctuating downward trend (see Figure 1). The mean and median values in 2010 were 0.352 and 0.314, respectively, and dropped to 0.343 and 0.311 in 2019, indicating that the overall vulnerability of inland fisheries to flood disasters in the country and each province improved. From the perspective of time trend, from 2010 to 2012, the mean value of China’s inland fishery flood disaster vulnerability increased from 0.352 to 0.367, and the median increased from 0.314 to 0.331. The reason is that in 2012, seven tropical cyclones made landfall along the coast of China, and the rainfall increased sharply. More than 420 rivers across the country experienced floods that exceeded the warning water level, 70 rivers experienced floods that exceeded the guaranteed water level, and 40 rivers experienced floods that exceeded historical records. Among them, there were 5 flood peaks in the mainstream of the Yangtze River, the largest flood since 1981 in the upper reaches; 4 flood peaks in the mainstream of the Yellow River, the largest flood in the upper and middle reaches since 1989, which caused serious damage to the inland fishery. From 2013 to 2019, the average vulnerability of China’s inland fisheries of flood disasters was basically stable, and the vulnerability index first decreased from 0.346 in 2013 to 0.336 in 2016, and then increased to 0.343 in 2019. This is due to the impact of flood disasters and the strategic adjustment of the Chinese government in fishery development in recent years. In 2013, the strategic policy of “giving priority to, combining breeding and fishing, and focusing on breeding” has vigorously promoted the transformation of fishery development mode. As a result, the construction of the fishery modernization system has been accelerated, and the level of fishery mechanization and the income of fishermen have increased significantly. Then, in 2016, China successively issued the “Guiding Opinions of the Ministry of Agriculture on Accelerating the Promotion of Fishery Transformation and Adjustment of Structure” and “The Thirteenth Five-Year Plan for the Development of National Fisheries,” clarifying that the fishery development goals as “improves quality and efficiency, reduces the quantity and increases income, and promotes green development.” Both fishery production and fishery processing have increased significantly, leading to an increase in the vulnerability index.
From a regional perspective (see Figure 2), the evolution trend of vulnerability to floods in inland fisheries in the seven regions showed an overall trend of rising first and then falling. The averages in South China and the middle and lower reaches of the Yangtze River were higher than the national average; the averages in North-west China and the Huanghuai region in North China were lower than the national average. The vulnerability index in South China fell significantly during the sample period, with a decline of 15.126%; The vulnerability index of the middle and lower reaches of the Yangtze River, the North-east region and the South-west region decreased slightly during the sample period by 3.484%, 5.180%, and 4.924%, respectively; while the vulnerability index of the Huanghuai region in North China and the North-west region increased. During the sample period, the growth rates were 9.004% and 2.291%, respectively. The vulnerability of inland fisheries to flood disasters among the seven regions has tended to be close after 2016, indicating that under the policy support in 2016 and the policy of “four transformations and four optimizations,” inland fisheries tend to develop in a coordinated manner.
Non-parametric Kernel Density Estimation
Using the panel data of vulnerability, exposure, sensitivity and adaptive capacity measured above, the non-parametric kernel density estimation method was used to analyze the dynamic evolution law of the vulnerability of inland fishery flood disaster and its decomposition. Due to space limitations, data from 2010, 2015, and 2019 were selected as reference standards, and the results are shown in Figure 3.
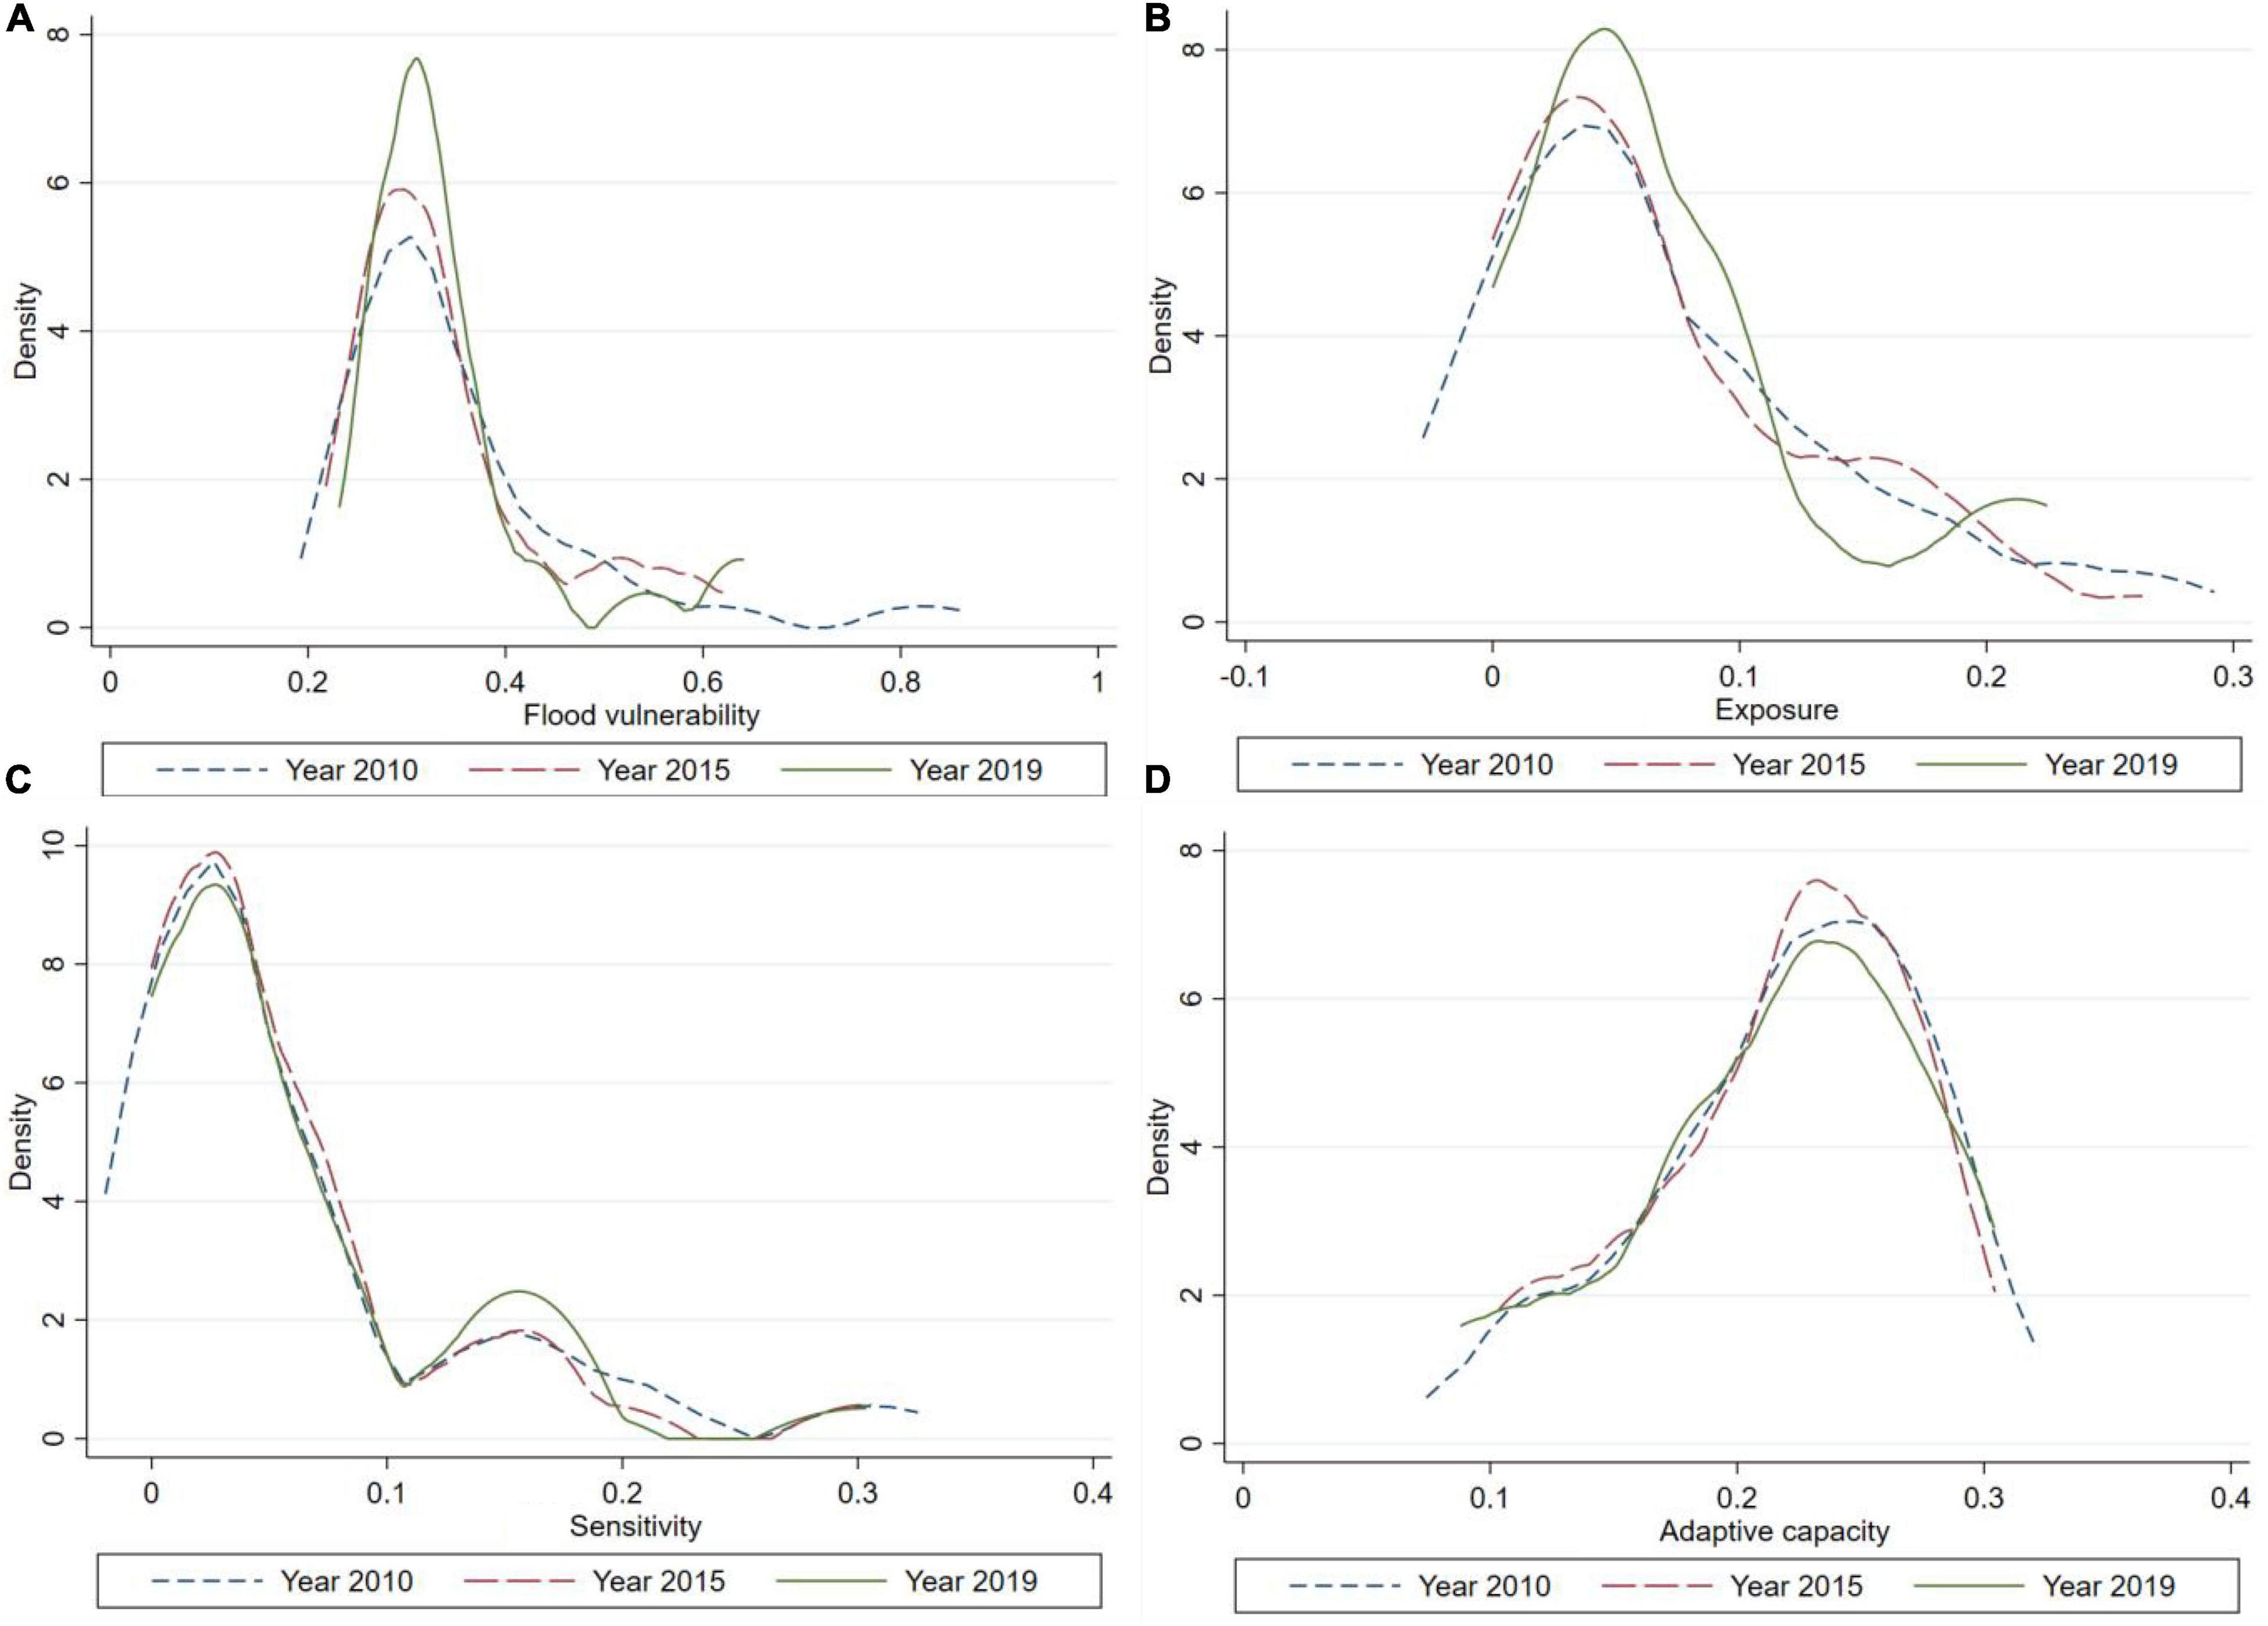
Figure 3. Dynamic evolution distribution of vulnerability to floods and its decomposition terms in China’s inland fisheries. (A) Flood vulnerability. (B) Exposure. (C) Sensitivity. (D) Adaptive capacity.
Figure 3A depicts the dynamic distribution and evolution of vulnerability to flood disasters in inland fisheries in China. Firstly, from the perspective of the central position, the central position of the vulnerability index in 2010, 2015, and 2019 first moved to the left and then to the right, indicating that the vulnerability of China’s inland fisheries to flood disasters first decreased and then increased, which is consistent with the previous results. Secondly, in terms of shape, the kernel density curves of the vulnerability index in 2010, 2015, and 2019 all showed a relatively obvious “single peak” state, indicating that the vulnerability of inland fisheries in China to flood disasters showed a convergence trend. Finally, from the point of view of the change in the peak height of the distribution curve, during the observation period, the peak height showed an upward trend. It shows that some provinces were more seriously affected by disasters in recent years, so the absolute difference expanded during the observation period. In addition, the distribution curve had obvious right-tailed characteristics, and the distribution ductility showed a trend of gradually narrowing. It shows that the gap in the vulnerability index of provinces across the country was gradually narrowing.
Figures 3B–D describe the dynamic evolution trends of exposure, sensitivity, and adaptive capacity during the sample observation period, respectively. It can be seen from Figure 3B that in general, the nuclear density curve moved to the right, the wave crest becomes steeper, the wave crest height increased, the left tail of the curve converged to the center, and the right tail shrinked. This indicates that the flood exposure index of inland fisheries in China increased as a whole, and the absolute difference increased. Specifically, compared with those in 2010, in 2015, the curve shifted slightly to the left, the main peak became larger, and the right tail shrank, indicating that the overall exposure index decreased, the absolute difference expanded, and the gap between provincial exposure indexes narrowed. Compared with that in 2015, in 2019, the curve shifted to the right, the main peak became larger, and the right tail further shrunk, indicating that the exposure index increased as a whole, and the distribution was concentrated, tending to converge. From Figure 3C, the variation range of the inner core density curve during the investigation period was small, the peak height decreased in general, and the peak evolved from “single peak” to “double peak,” indicating that the sensitivity of China’s inland fishery had a certain gradient. The effect was weakly polarized. Although China’s provinces (cities) inland fisheries have achieved significant growth in recent years, given the obvious heterogeneity of resource endowments and policy constraints affecting the sensitivity index among different provinces, Some provinces cannot catch up with provinces with high sensitivity index in terms of production and processing in the short term, and the gap between them is likely to continue to widen for a period of time. It can be seen from Figure 3D that the inner core density curve was generally shifted to the left, the main peak value decreased, and the left tail shrank, indicating the adaptive capacity1 of the inland fishery in China to flood disasters improved during the study period, and the absolute difference narrowed.
Analysis of Temporal and Spatial Vulnerability Variation
The flood vulnerability assessment results and the spatial distribution of vulnerability index levels of provincial inland fisheries in China from 2010, 2015, and 2019 are shown in Figure 4. From Figure 4A, the flood vulnerability of inland fisheries in China showed a declining trend during the study period. The average flood disaster vulnerability index of China’s inland fisheries in 2010 was 0.352, with Hubei Province, Jiangxi Province and Anhui Province ranking in the top three (i.e., 0.823, 0.610, and 0.508, respectively). In 2010, severe floods occurred in China, with floods exceeding warning levels in many regions of the Yangtze River basin. Inland fishery production was seriously damaged and the area of affected aquaculture reached 674,171 hm2, of which the total affected aquaculture area (366,371 hm2) in Hubei, Jiangxi, and Anhui accounted for more than half of the total affected area in China. In 2015, the overall precipitation increased and flooding affected 20 provinces (cities). However, during the 12th Five-Year Plan period2, China’s flood control capacity was significantly improved, the affected area and economic loss of fisheries decreased considerably and the average flood disaster vulnerability index of inland fisheries decreased to 0.341. In 2019, the flood disaster was serious and sustained heavy rainfall occurred in South China and northern South China, which increased the exposure of inland fisheries. Fortunately, with the effective improvement of the adaptability of each region, the vulnerability index of inland fisheries to flood disasters did not increase significantly in 2019, reaching only 0.343.
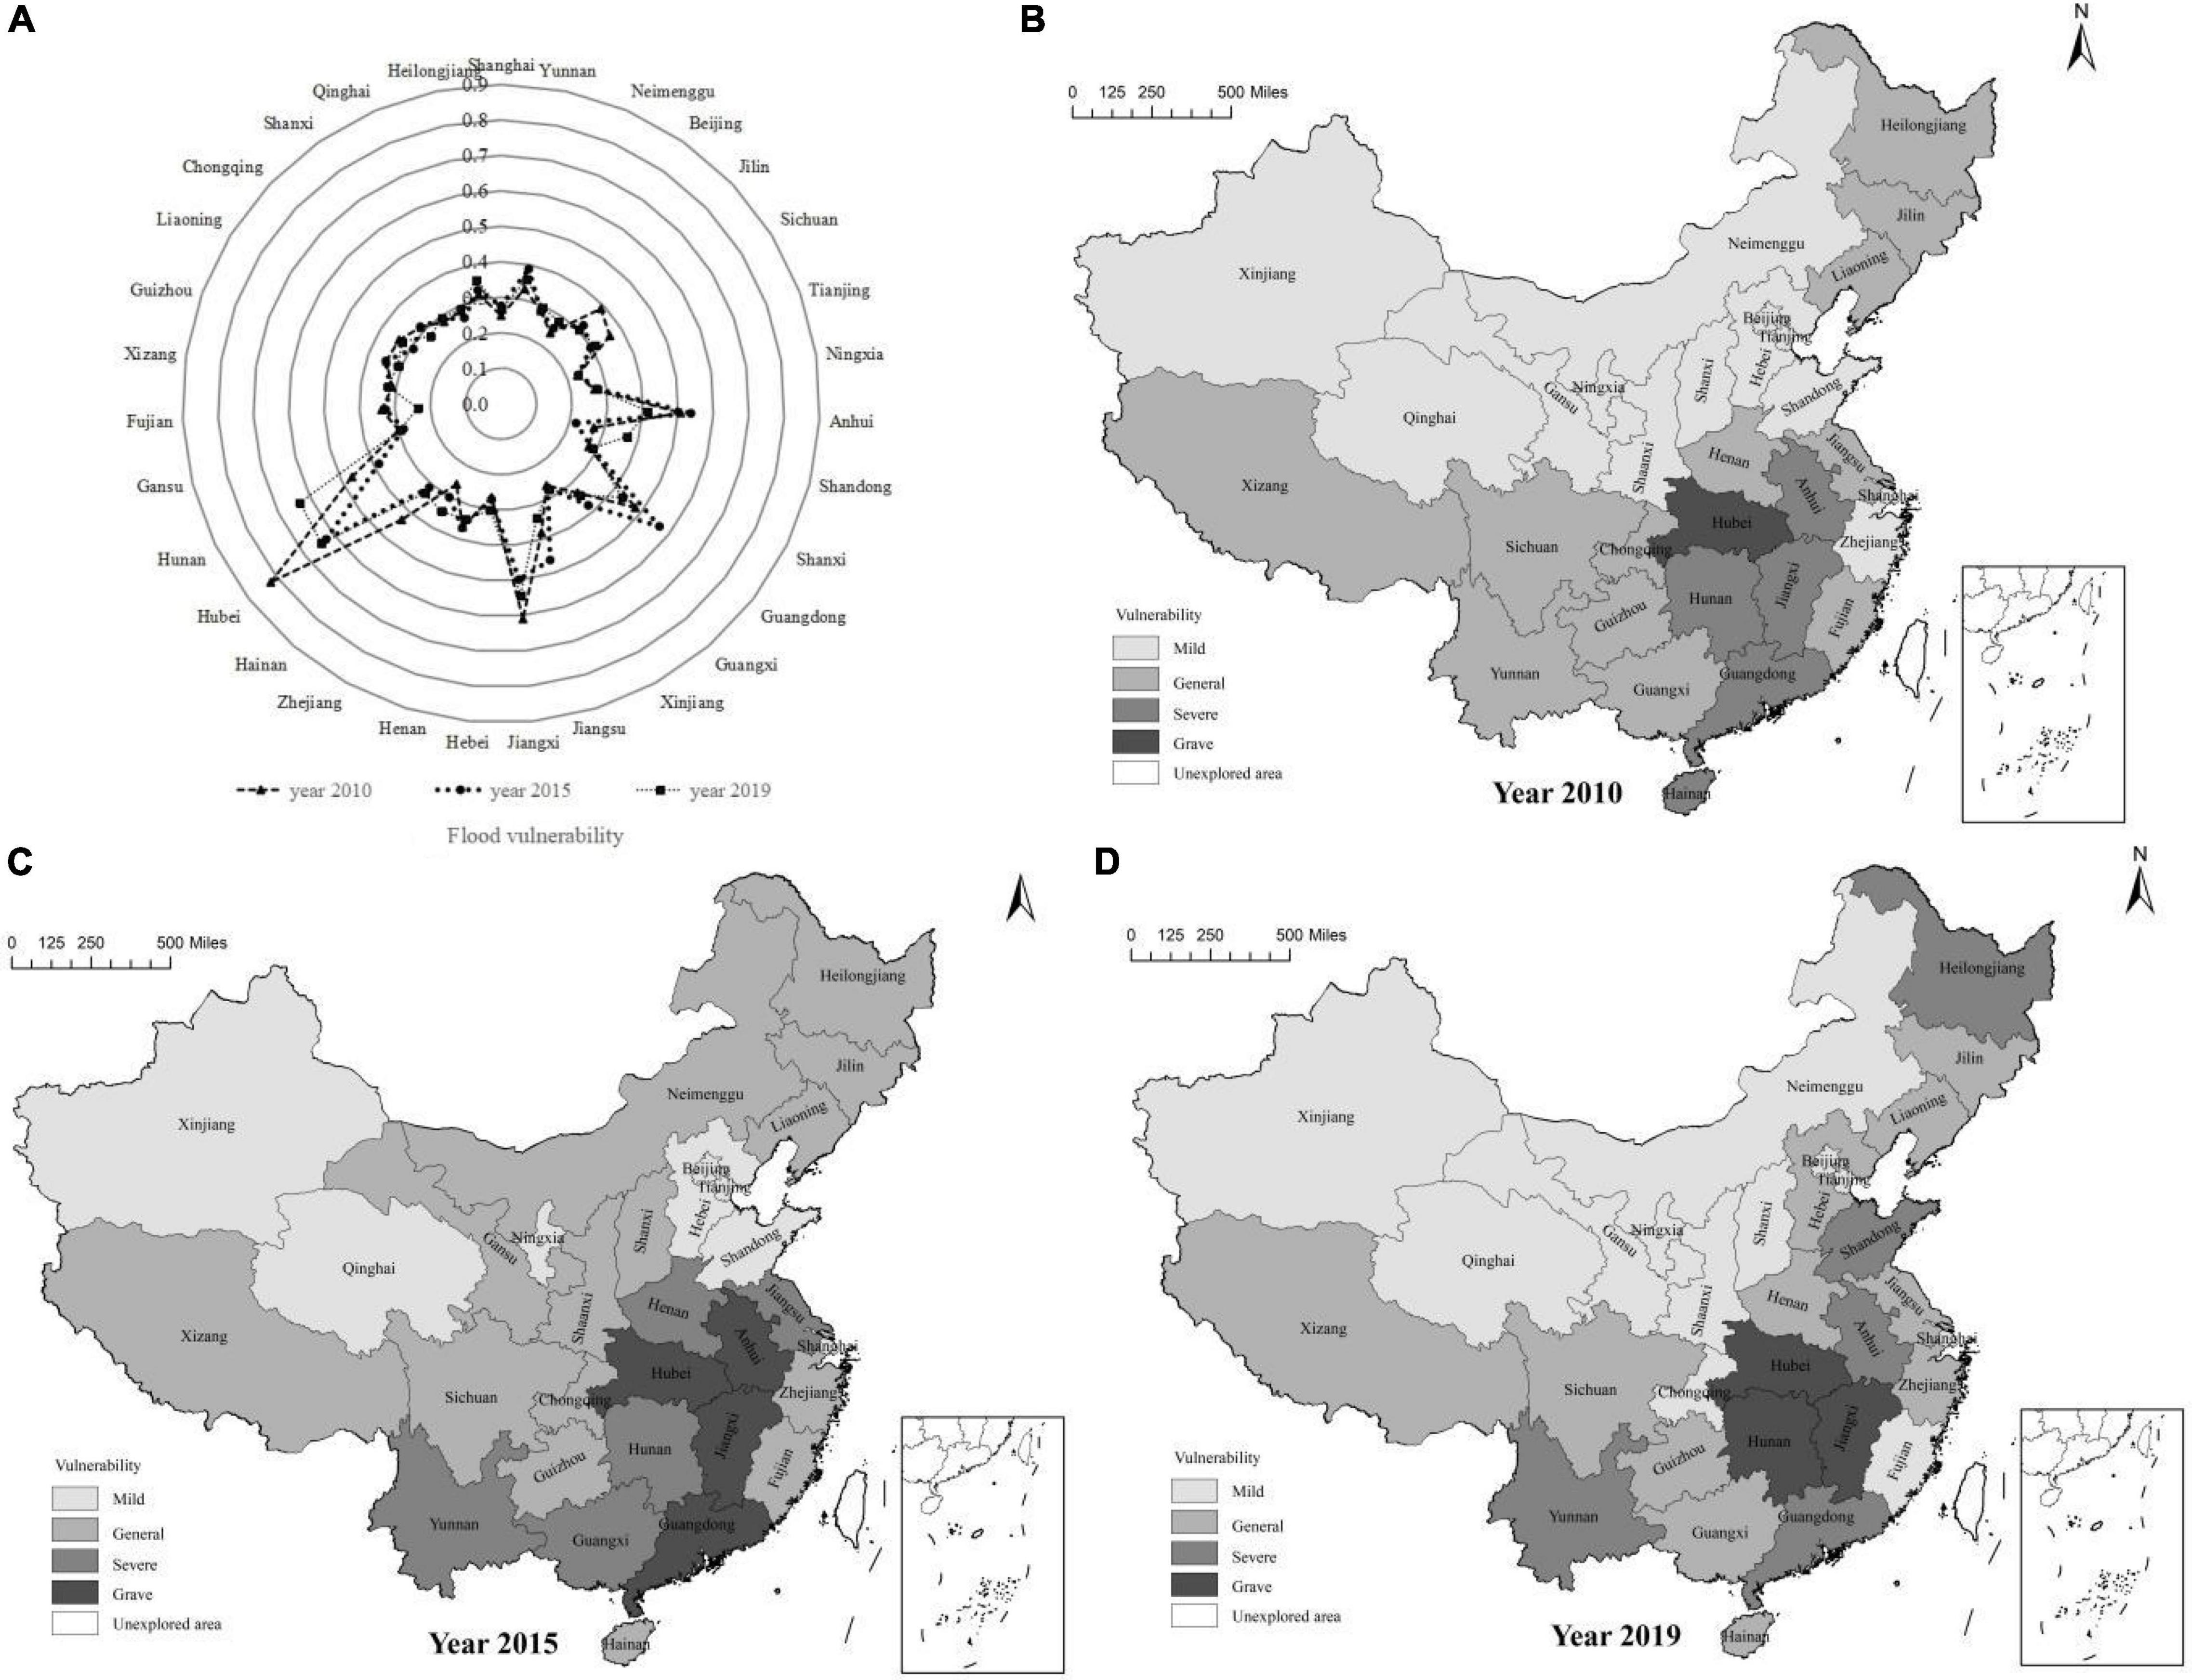
Figure 4. Flood vulnerability assessment results and spatial distribution characteristics of inland fisheries in China from 2010 to 2019. Based on the standard map no. GS(2020)4619 of the standard map service website of the Ministry of Natural Resources, the base map is not modified. (A) Represents the radar diagram. (B) Represents the year 2010. (C) Represents the year 2015. (D) Represents the year 2019.
From Figures 4B–D, the areas of high vulnerability to flood disasters in China’s inland fisheries are mainly distributed in the middle and lower reaches of the Yangtze River, with an overall spreading trend. In 2010, only Hubei Province was severely vulnerable to disasters. In 2015, the scope of flood disasters expanded, leading to an increase in disaster-prone areas. Hubei, Anhui, Guangxi and Jiangxi were in severe flooding-prone areas. In 2019, the flood disaster vulnerable areas were concentrated in Hubei, Jiangxi, and Henan. In recent years, Hubei province has been a severe disaster-prone area because it has unique advantages in fishery resources, with freshwater fishery production ranking first in China. In addition, most areas of Hubei are located in the middle reaches of the Yangtze River, which is prone to frequent flood disasters, resulting in a high level of flood disaster vulnerability in Hubei Province.
Analysis of Temporal and Spatial Exposure Variation
The evaluation results of inland fishery flood exposure and spatial distribution of Exposure index levels of Chinese provinces from 2010, 2015, and 2019 are shown in Figure 5. As can be seen from Figure 5A, from 2010, 2015, and 2019, inland fishery flood disaster exposure in Chinese provinces (cities) showed an overall trend of first decreasing and then increasing. In 2010, the average flood disaster exposure index in China was 0.072. The inland fisheries in Hubei and Jiangxi provinces were seriously affected by flood disasters, with a high level of the flood disaster exposure index (i.e., 0.238 and 0.263, respectively). In 2015, the average flood disaster exposure index in China decreased to 0.069 due to effective flood control, which reduced the affected area and economic loss caused by flood disasters. In 2019, the average flood exposure index in China increased to 0.072. This was due to the continuous rainfall caused by Typhoon “Limaki” in Shandong Province in 2019, which resulted in severe losses of inland fisheries and increased overall exposure.
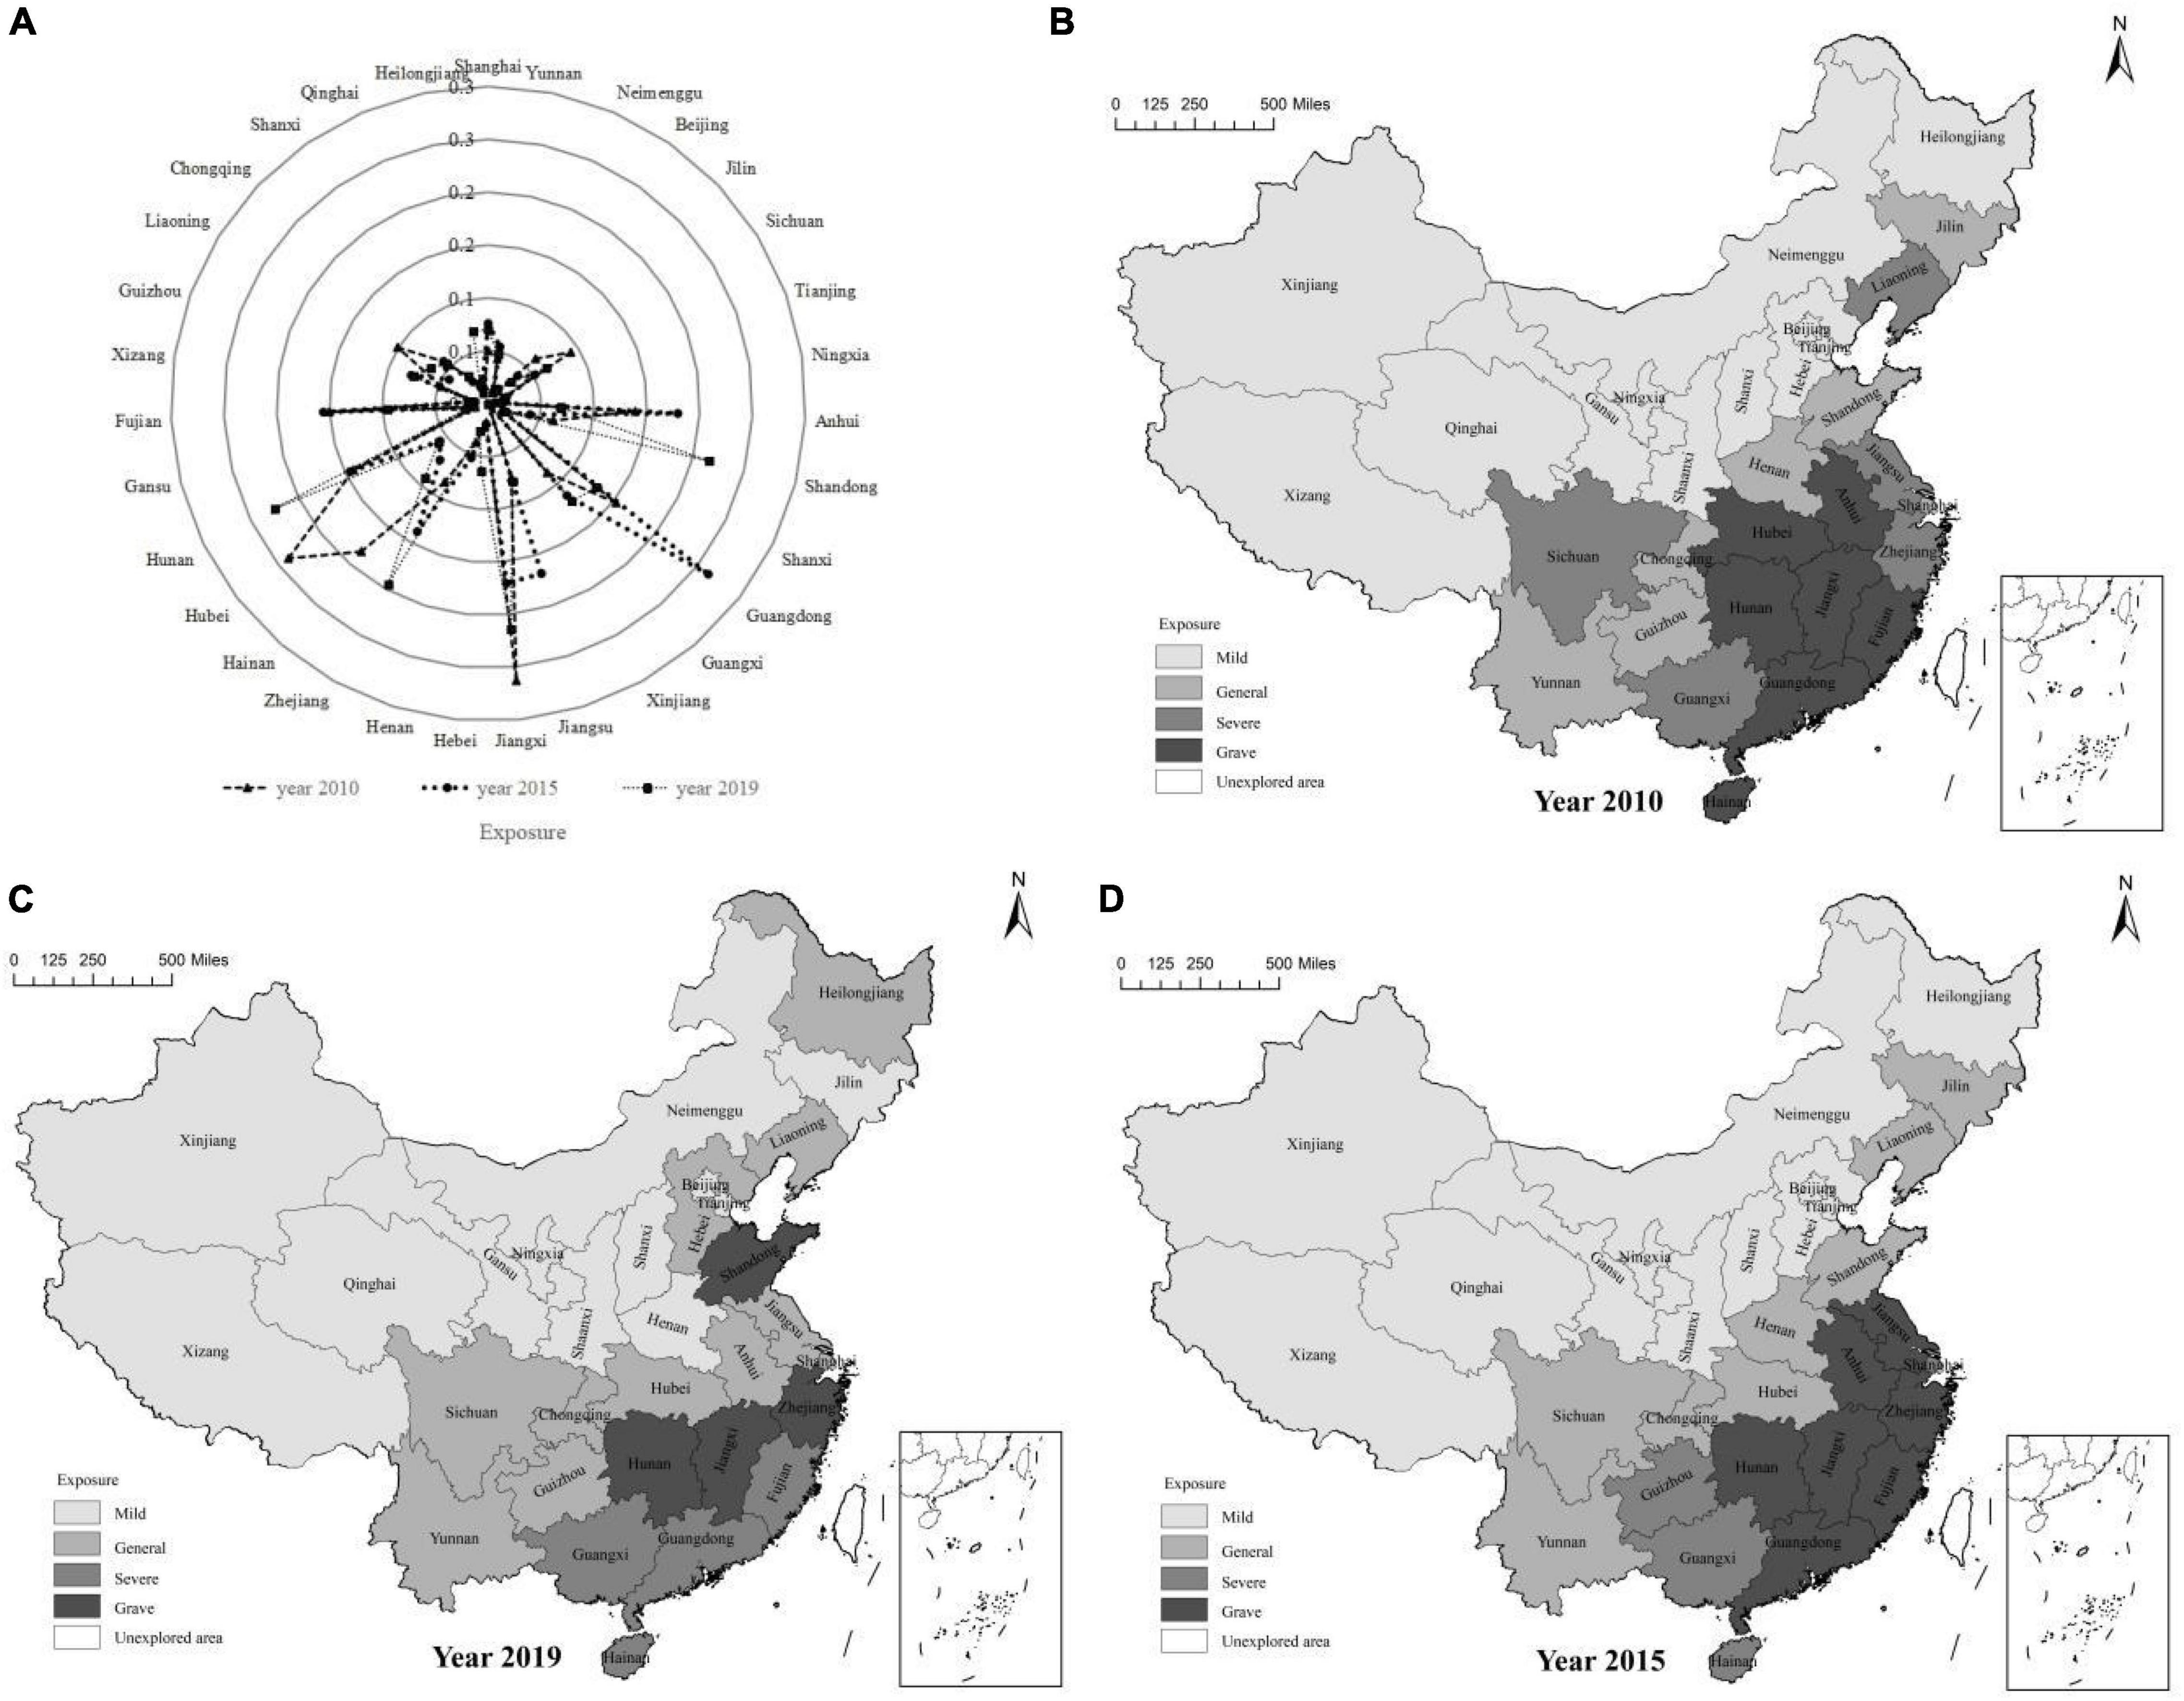
Figure 5. Evaluation results and spatial distribution characteristics of flood disaster exposure of inland fisheries in China from 2010 to 2019. (A) Represents the radar diagram. (B) Represents the year 2010. (C) Represents the year 2015. (D) Represents the year 2019.
From Figures 5B–D, the areas with high flood exposure are concentrated in South China and the middle and lower reaches of the Yangtze River. In 2010, the areas with severe exposure included Hubei, Anhui, Hunan, Guangdong, Hainan, and Jiangxi provinces, which were affected by heavy rainfall. The economic losses caused by floods in these provinces reached 8.359 million yuan, accounting for 75.23% of the total national economic loss. In 2015, the areas with more severe exposures expanded, with Jiangsu and Zhejiang provinces becoming more severely exposed. In 2019, areas with severe exposure decreased, concentrated in Hunan, Anhui and the coastal provinces such as Zhejiang, Guangdong, Hainan, Fujian, and Guangxi.
Temporal and Spatial Variation Characteristics of Sensitivity
Figure 6 shows the sensitivity evaluation results and spatial distribution of flood disaster vulnerability of Chinese inland fisheries from 2010, 2015, and 2019. From Figure 6A, the flood disaster sensitivity of inland fisheries in Chinese provinces from 2010 to 2019 first decreased and then increased. In 2010, 2015, and 2019, average flood disaster sensitivity indexes of inland fisheries were 0.060, 0.056, and 0.059, respectively. Particularly, the flood disaster sensitivity of the fishery in Hubei (0.306, 0.306, and 0.304 in 2010, 2015, and 2019, respectively) was much higher than that in other regions, ranking first in China. Hubei province is one of the important provinces in the development of freshwater fisheries in China and has ranked first in freshwater aquatic products in China for 25 consecutive years, which has resulted in a simultaneous increase in sensitivity.
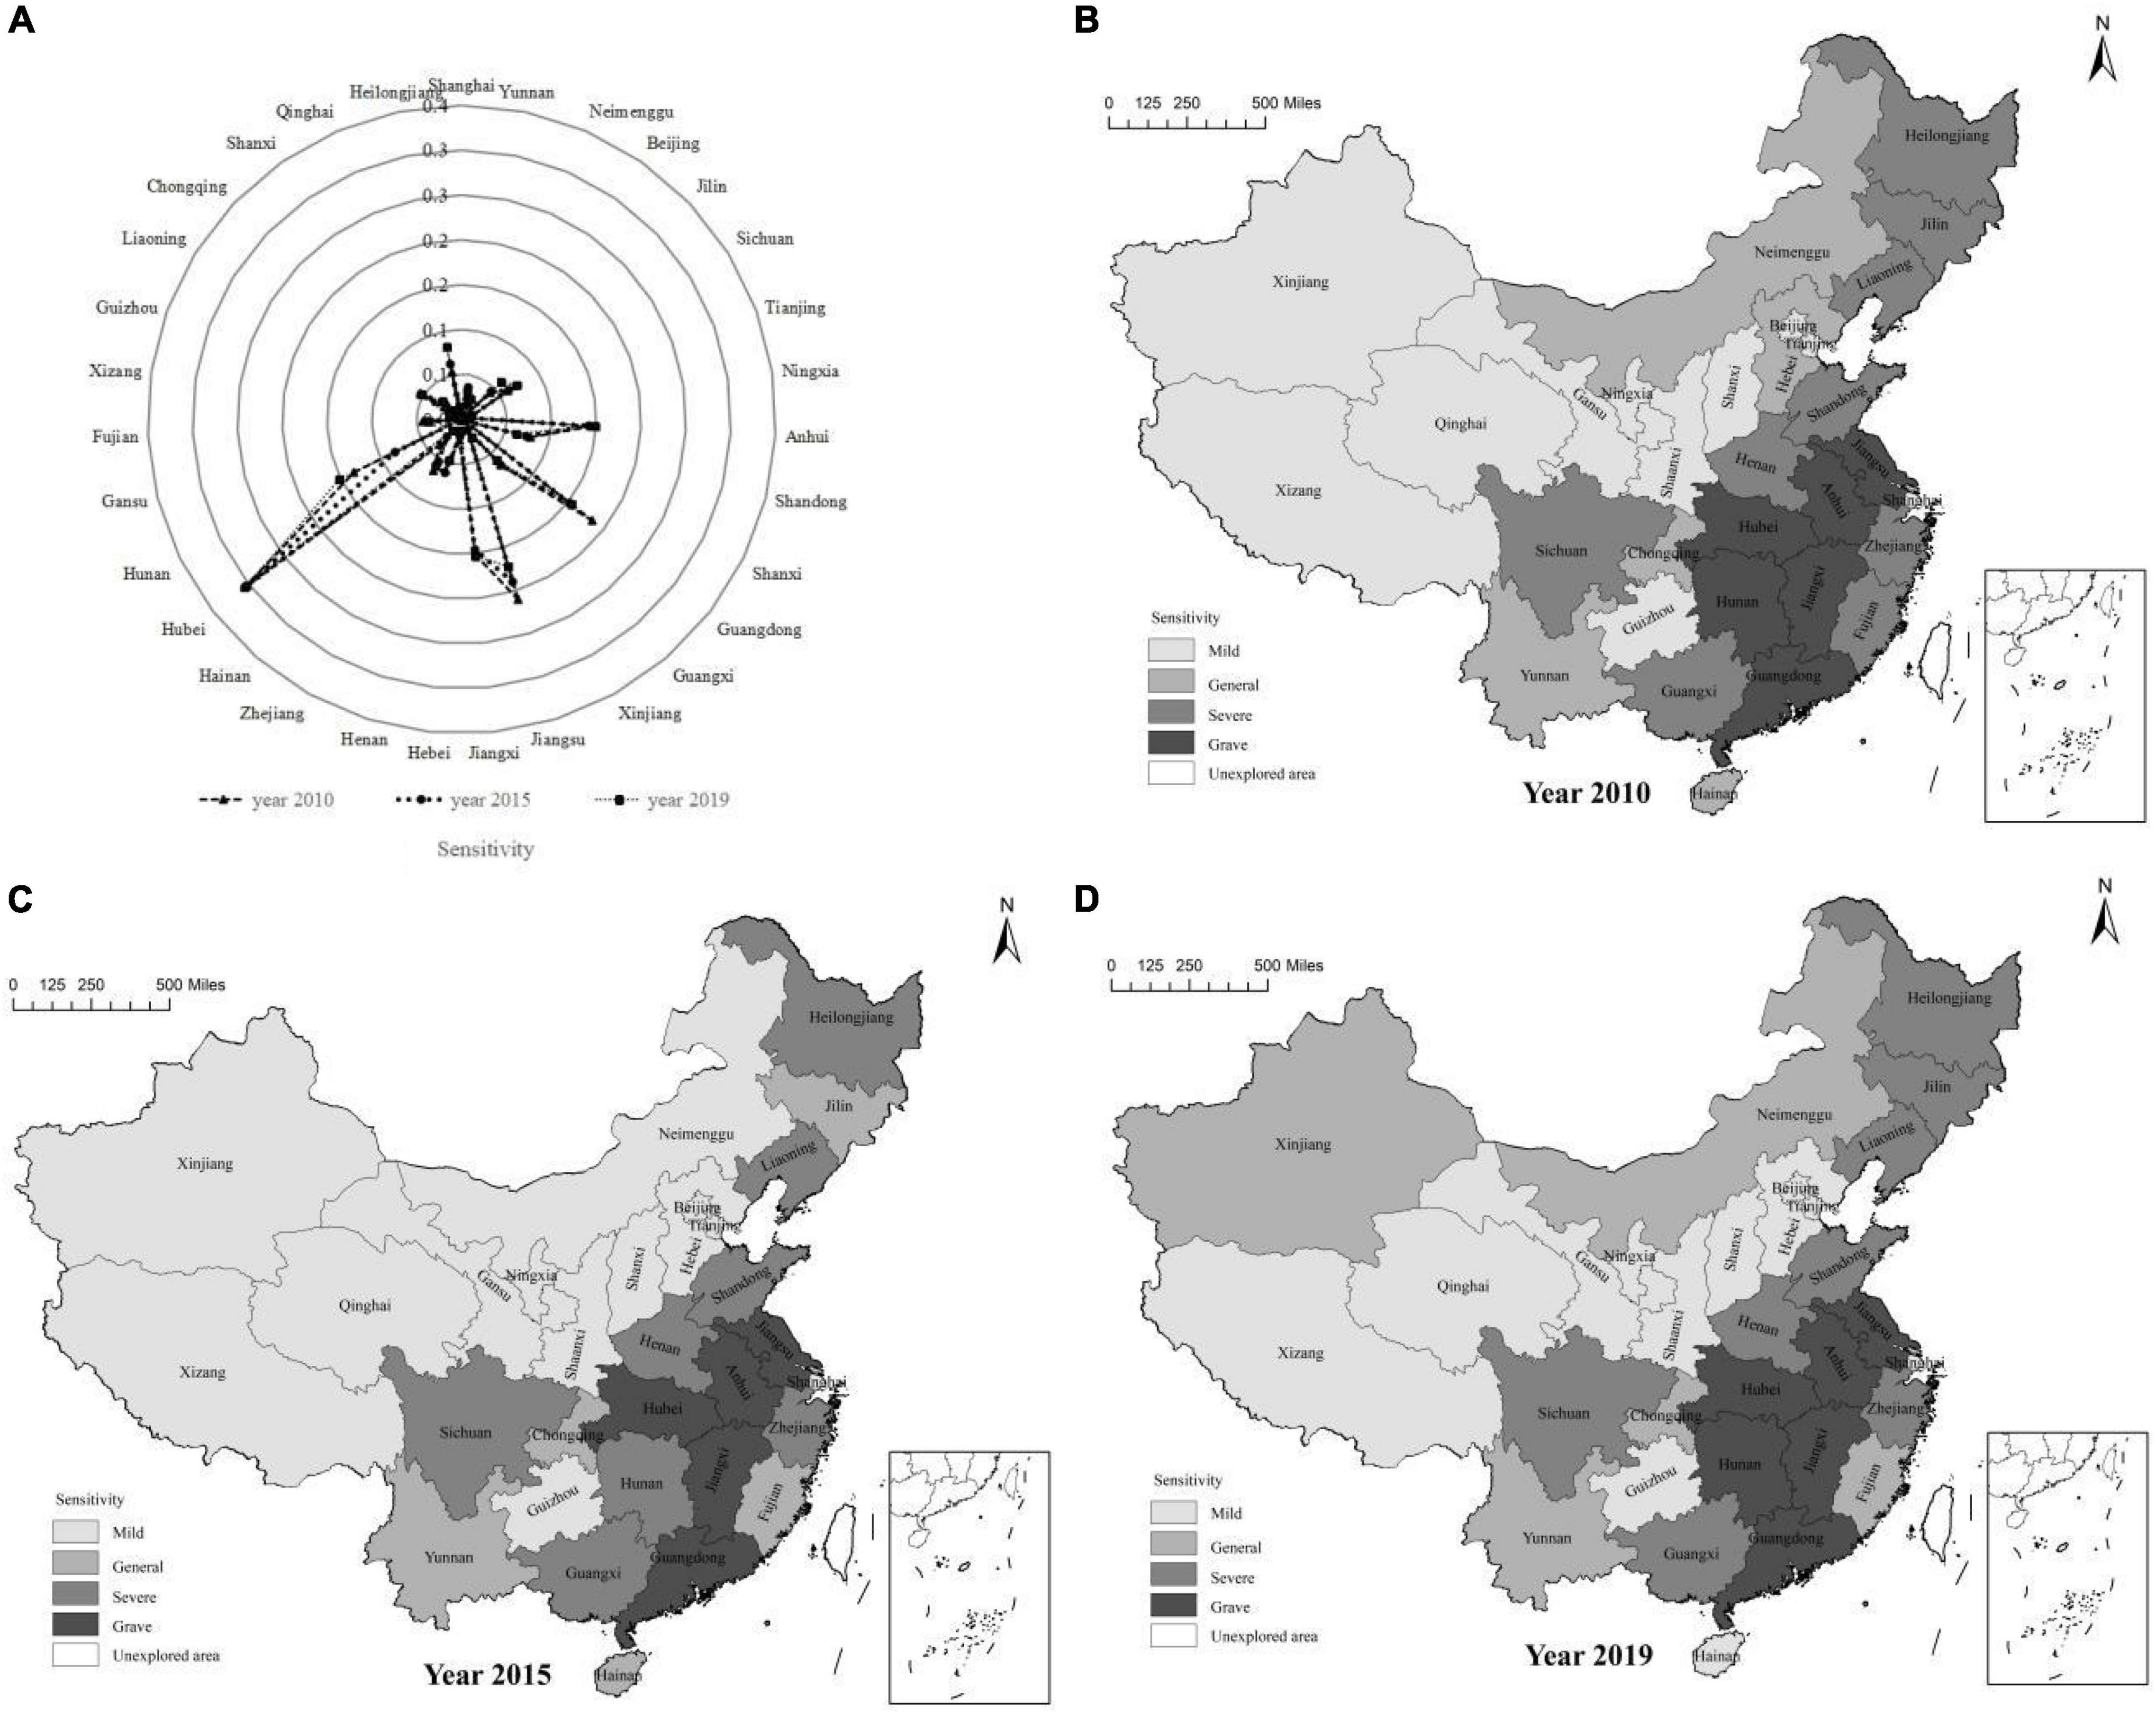
Figure 6. Evaluation results and spatial distribution characteristics of flood disaster sensitivity of inland fisheries in China from 2010 to 2019. (A) Represents the radar diagram. (B) Represents the year 2010. (C) Represents the year 2015. (D) Represents the year 2019.
According to Figures 6B–D, the areas with high sensitivity to flood disasters are concentrated in North-east China, the middle and lower reaches of the Yangtze River, and South China. In 2010, the most sensitive provinces including Hubei, Hunan, Jiangsu, Jiangxi, Anhui, and Guangdong accounted for 71.54% of the total production of fish species and 62.68% of the total freshwater aquatic products. Hunan province did not become a seriously sensitive area in 2015 because of its weak fishery processing capacity, with only 147,352 tons of freshwater products for processing. In 2019, Hunan province again became a severely sensitive area with the number of freshwater products for processing increasing to 212,098 tons, thus increasing the sensitivity level.
Temporal and Spatial Variation Characteristics of Adaptive Capacity
The evaluation results of adaptive capacity and spatial distribution of flood disaster vulnerability of inland fisheries in Chinese provinces (cities) from 2010, 2015, and 2019 are shown in Figure 7. From Figure 7A, during the inspection period, the adaptive capacity of inland fisheries in China’s provinces (cities) to flood disasters was generally improved, while the adaptive capacity index dropped from 0.220 in 2010 to 0.212 in 2019. Among them, the adaptive capacity of the Xizang was always at the lowest level, with the adaptive capacity index of 0.297, 0.304, and 0.304 in 2010, 2015, and 2019, respectively. Although Xizang has lake resources that account for 35.1% of the country’s total area, under the constraints of water resources protection and policy, Xizang’s freshwater fishing is limited and the total amount of aquaculture is not large, resulting in the low income of fishermen, the low level of fishing machinery, and less promotion of fishery science and technology. There was no major improvement, and thus the adaptive capacity was at the lowest level. On the contrary, the adaptive capacity of Jiangsu Province was at the highest level in the whole country, and the adaptive capacity index in 2010, 2015, and 2019 were 0.0978, 0.104, and 0.088, respectively. This is due to the fact that Jiangsu Province is located in the middle and lower reaches of the Yangtze River and rich in water resources and fishery resources. The income of fishermen and the promotion of science and technology are at the forefront of the country.
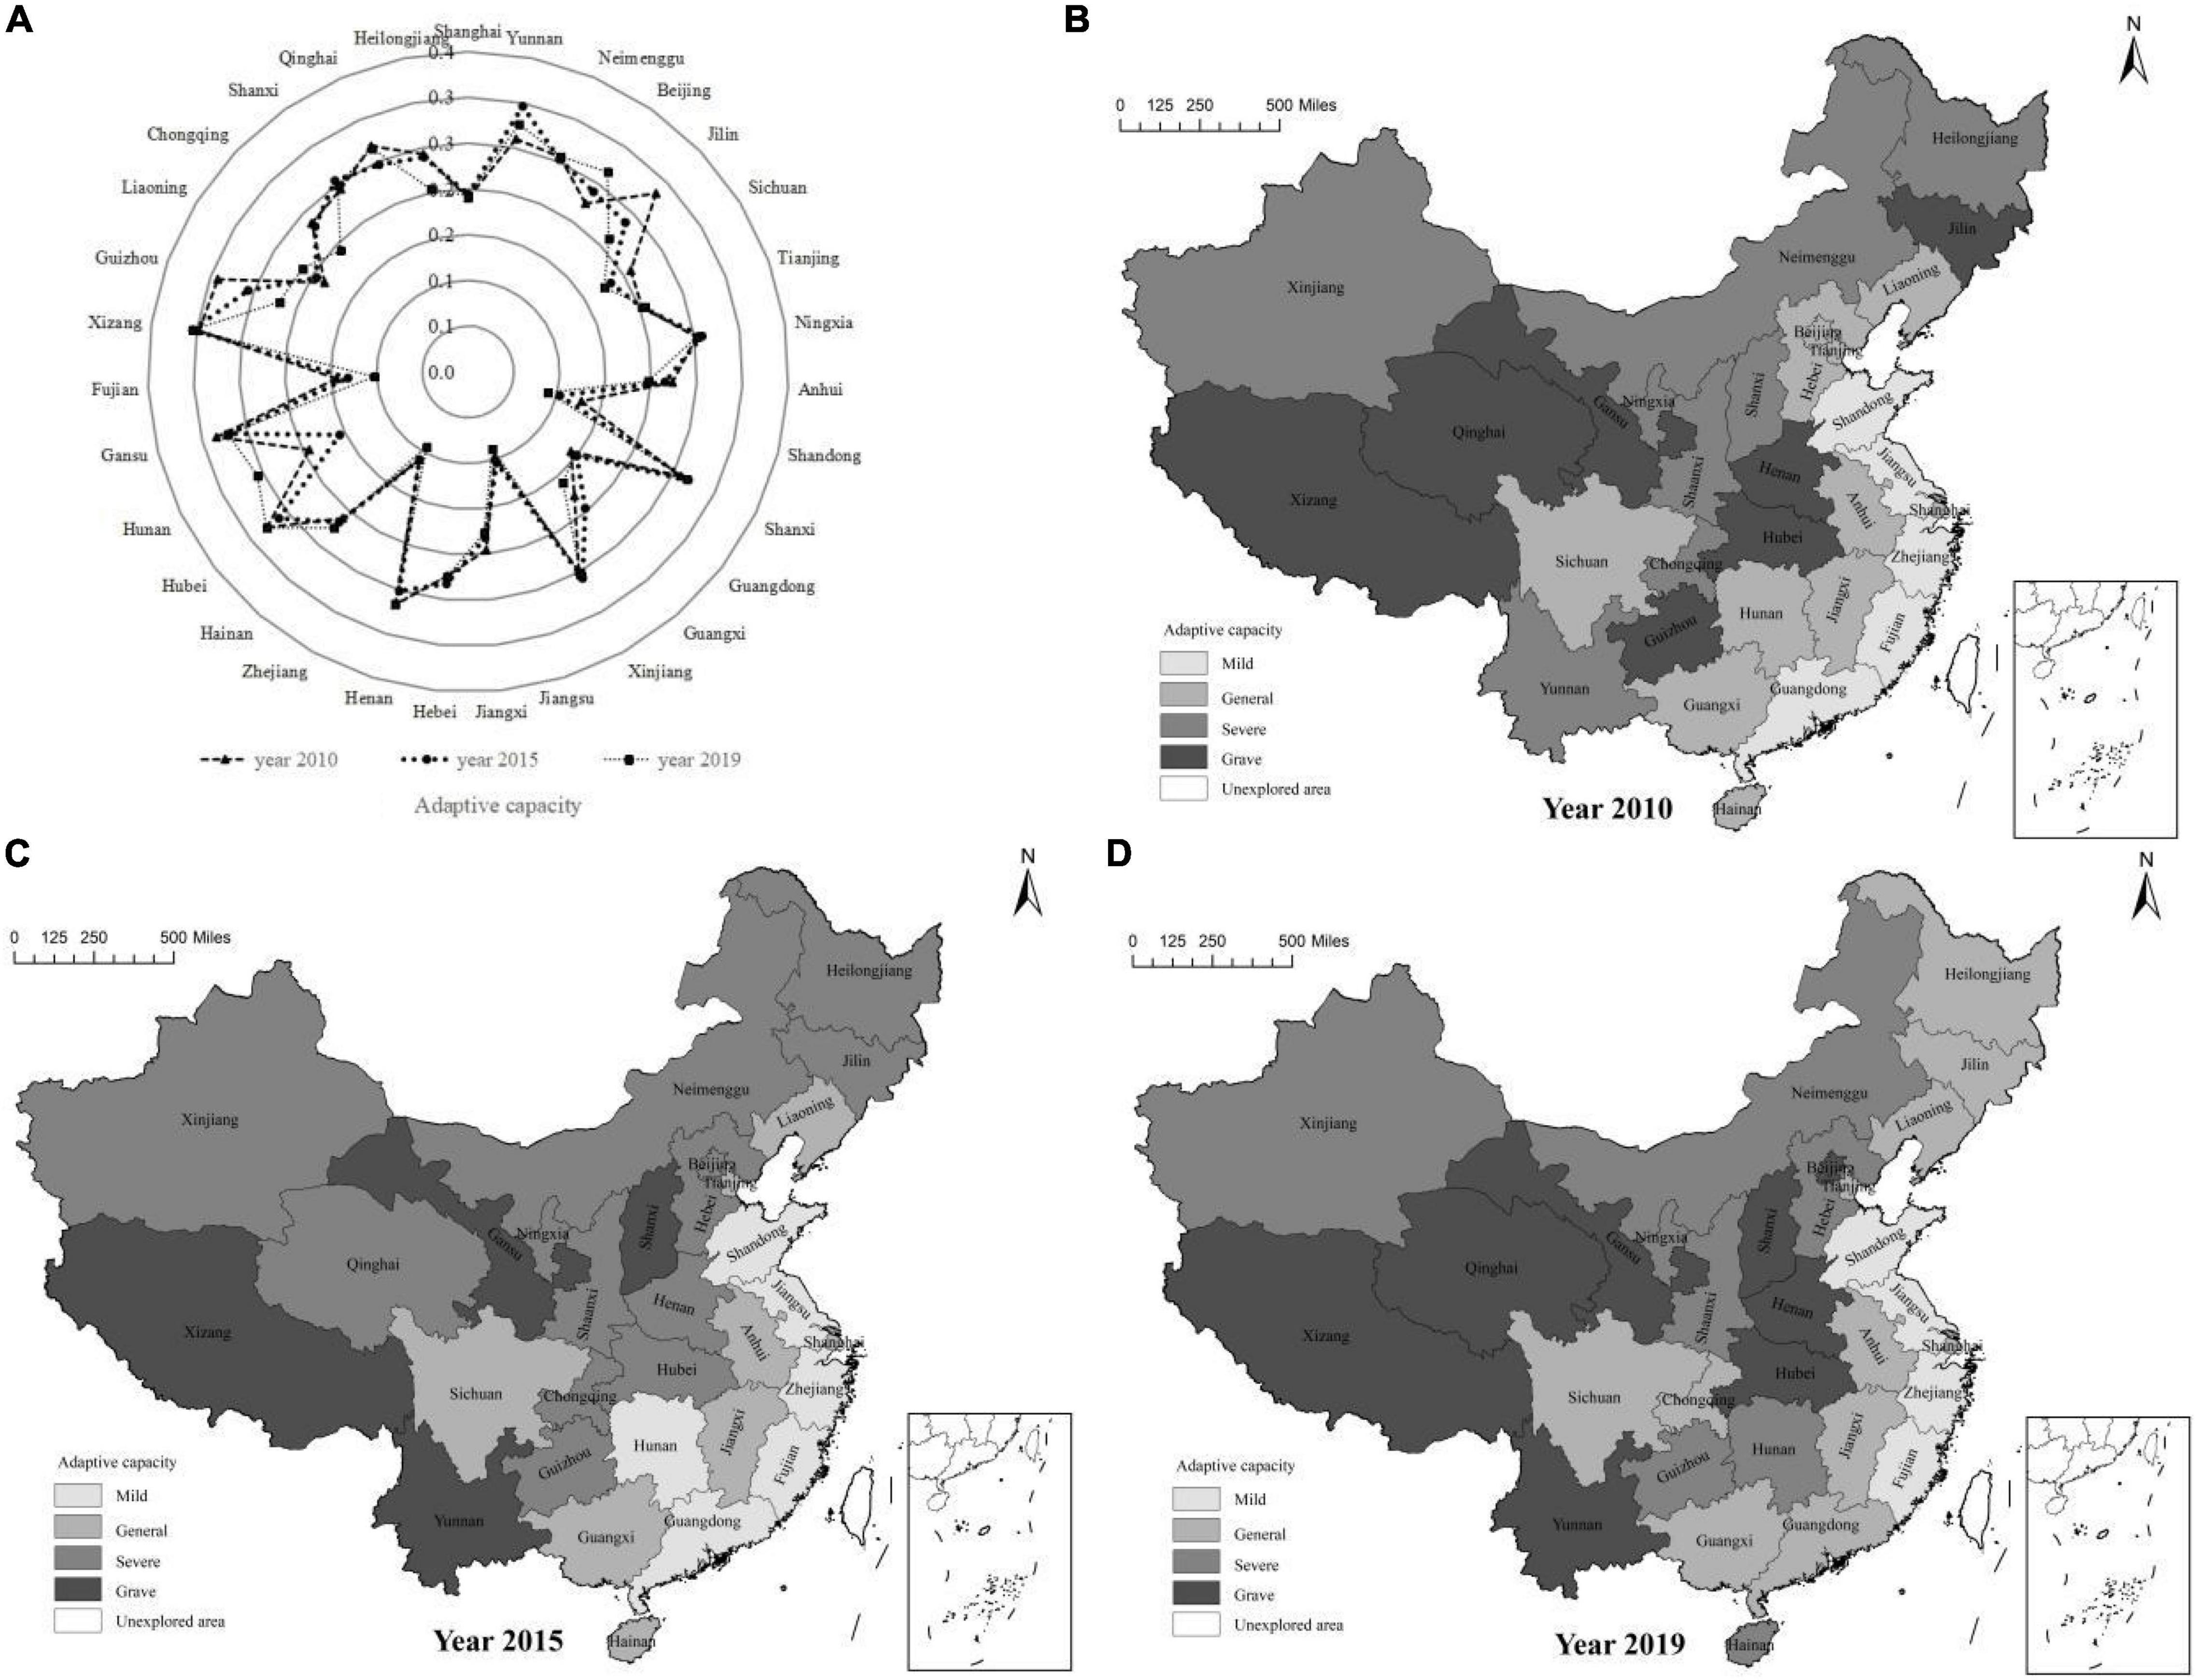
Figure 7. Evaluation results and spatial distribution characteristics of flood disaster adaptive capacity of inland fisheries in China during 2010–2019. (A) Represents the radar diagram. (B) Represents the year 2010. (C) Represents the year 2015. (D) Represents the year 2019.
As can be seen from Figures 4B–D, the areas with poor adaptability were mainly concentrated in the South-west and North-west regions. In 2010, the regions with poor adaptive capacity were Xizang Autonomous Region, Gansu Province, Qinghai Province, Jilin Province, Henan Province, Hubei Province and Guizhou Province. Among them, Xizang Autonomous Region, Gansu Province, Qinghai Province, Jilin Province, and Guizhou Province were not the main provinces of fishery production, and thus their adaptive capacity was relatively weak. As one of the main provinces of fishery production, Hubei and Henan provinces had weak adaptability due to the low level of fishermen’s income. The net income of fishermen per capita in Hubei and Henan provinces was 7,700 and 7,016 yuan, which was lower than the average in China. The level of fishery mechanization was at a low level in the country, resulting in insufficient adaptability. In 2019, the adaptability of Yunnan Province, Shanxi Province and Beijing City decreased. During the observation period, the top four provinces in terms of adaptability were Zhejiang, Jiangsu, Fujian and Shandong. What they had in common was the high level of fishery mechanization and net income of fishermen per capita.
Analysis of Vulnerability Contribution of Inland Fisheries to Flood Disaster
In order to further diagnose the influencing factors of vulnerability to flood disasters in China’s inland fisheries, the factor contribution model was used to calculate the contribution of each index factor from exposure, sensitivity and adaptive capacity, and the top two factors were selected. Significant contribution factors were studied (Table 2), in order to explore the key factors that lead to the increase of vulnerability to flood disasters in China’s inland fisheries, and provide a reference for the decision-making of sustainable development of China’s inland fisheries.
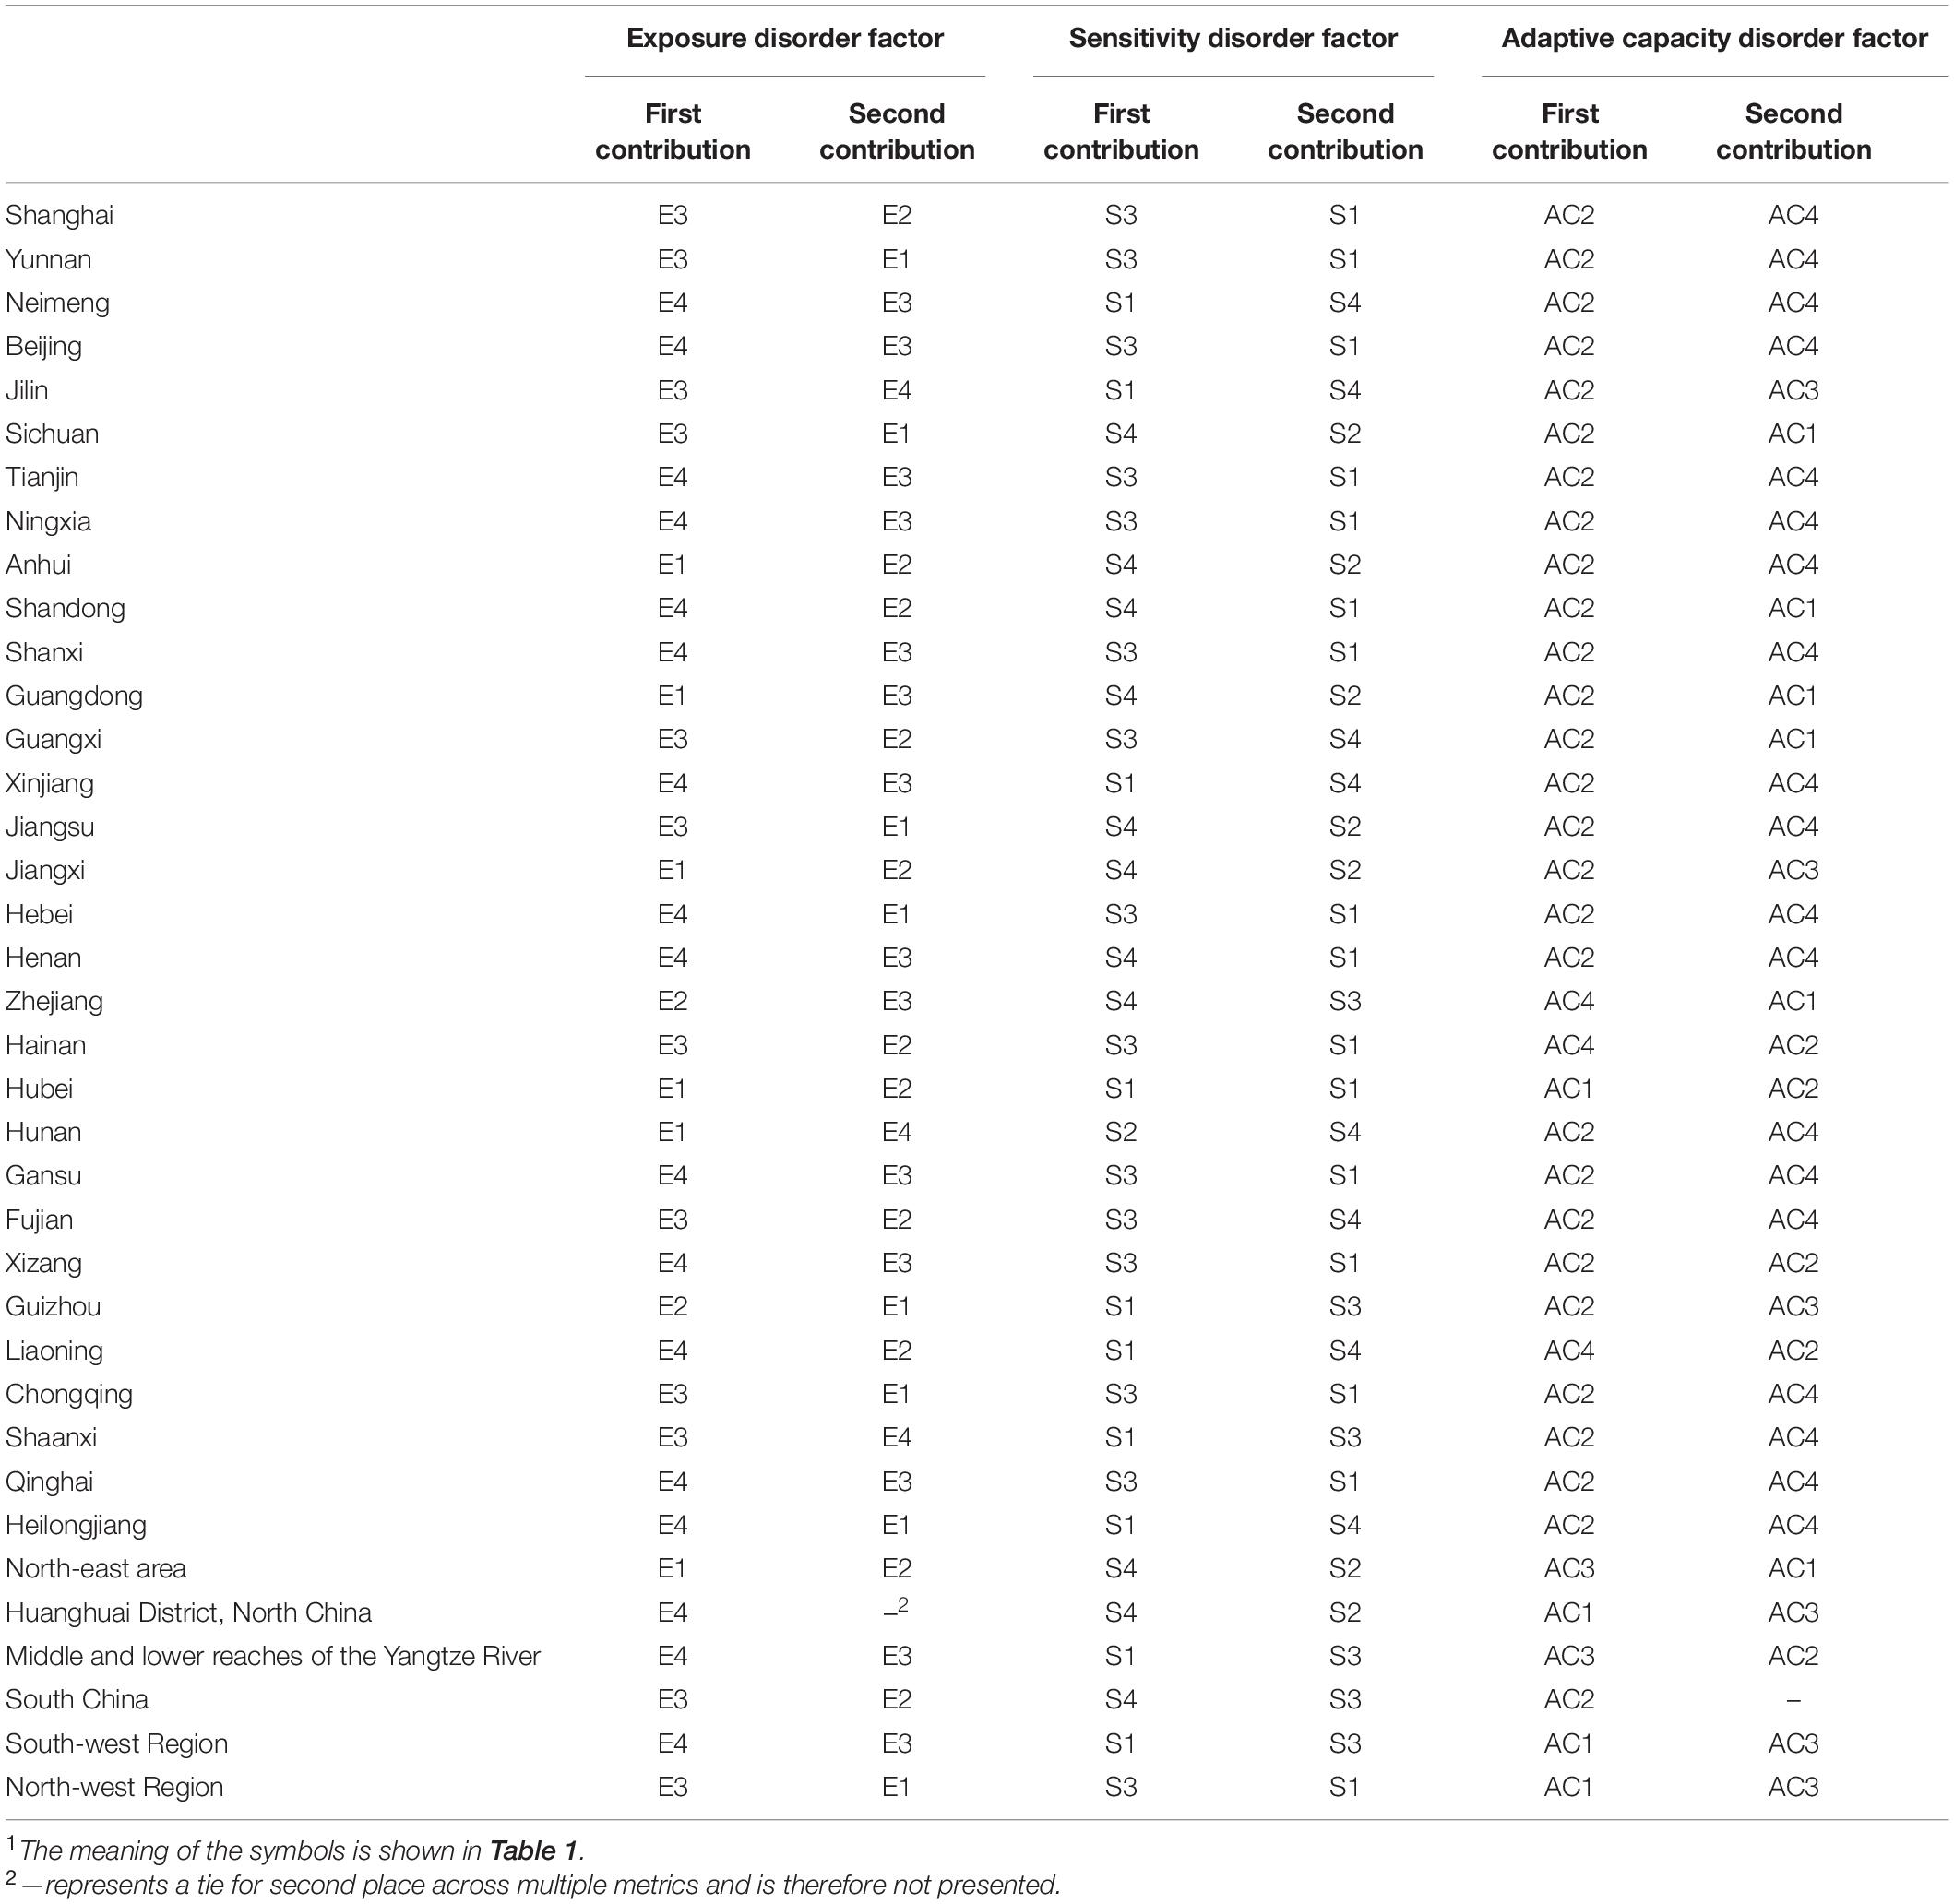
Table 2. Contribution of each index factor of vulnerability to flood disasters of inland fisheries in China in 20191.
Identification of exposure contributing factors: overall, the main contributing factors affecting the exposure to inland fishery flood disasters in China are the economic losses of fishery flood disasters and the affected area. The average contribution of the two factors was 9.064% and 9.028%, respectively. Therefore, strengthening the planning and construction of fishery flood control infrastructure, improving fishery disaster prevention and mitigation emergency plans, and enhancing fishermen’s emergency response capabilities should become the key optimizing the future inland fishery system. In terms of sub-regions, the main factors of exposure in the middle and lower reaches of the Yangtze River and South-west China were rainfall and the affected area.
Identification of Sensitivity Contributing Factors: the main contributing factors that affected the sensitivity of China’s inland fisheries to flood disasters were fingerling production and freshwater fishery production. From a regional perspective, the main contributing factors to the sensitivity of the middle and lower reaches of the Yangtze River were fishery production and fishery processing. The focus should be on fishery processing and fishery production, strengthening the construction of infrastructure and cold chain transportation equipment, effectively deploying aquatic products from various regions for real-time processing and reducing the impact of disasters; the main contributing factors to the sensitivity of North-east China and the Huanghuai region of North China were the production of fingerlings and the number of fingerlings processed. It is necessary to increase the disaster prevention measures of fingerlings and develop the fishery product processing industry simultaneously; the South-west and North-west regions were sensitive to the stability of aquaculture are aquaculture area and aquaculture output, flood control measures should be implemented focusing on fishery and aquaculture to reduce the risk of flood disasters.
Identification of contribution factors of adaptive capacity: the factors with lower contribution rates affecting the adaptive capacity of inland fisheries in China were the total power of fishery machinery and the promotion of fishery technology. The contribution rates of the two factors were 2.273% and 5.742%, respectively. In terms of sub-regions, the North-east region, the Huanghuai region of North China, the North-west region and the South-west region need to be strengthened in terms of reservoir capacity and fishermen’s income. They should also focus on developing modern fishery and improving infrastructure construction, especially in the North-west region under resource and environmental constraints. The South-west region should focus on improving the efficiency of fishery production to ensure the supply of aquatic products as the minimum requirement. The middle and lower reaches of the Yangtze River and South China urgently need to improve the fishermen’s income and the level of fishery mechanization. As important areas of China’s inland fishery output, the development mode of the fishery should be transformed, the support of scientific and technological equipment should be strengthened, and the comprehensive production capacity of the fishery, market competitiveness should be improved.
Conclusion and Discussion
In this paper, by constructing an evaluation index system of vulnerability to floods and floods of inland fisheries in China, the entropy weight method was used to quantitatively evaluate the vulnerability of inland fisheries to floods and floods in China’s provinces. The main conclusion is as below:
(1) From the national level, from 2010 to 2019, the vulnerability of China’s inland fishery to floods showed a downward trend. At the regional level, the average value of South China and the middle and lower reaches of the Yangtze River was higher than the national average; the average value of North-west China and the Huanghuai region of North China was lower than the national average; from the perspective of decline, the vulnerability index of South China decreased during the sample period. The vulnerability index of the Huanghuai region in North China and the North-west region increased. (2) From the perspective of the evolution characteristics of dynamic distribution, the distribution characteristics of vulnerability and its decomposition item index showed a certain difference, the vulnerability index showed a trend of first decline and then rise, and the internal difference decreased; the exposure index showed an upward trend, and the absolute difference expanded; the sensitivity index had a certain gradient effect, showing a weak polarization; the adaptability index improved during the investigation period, and the absolute difference narrowed. (3) During the study period, the flood vulnerability index showed a downward trend, and the high vulnerability areas were mainly distributed in the middle and lower reaches of the Yangtze River; the exposure index first decreased and then increased, and the high exposure areas were mainly concentrated in the middle and lower reaches of the Yangtze River and the middle and lower reaches of the Yangtze River and South China; the sensitivity index first decreased and then increased, and the high sensitivity areas were concentrated in North-east China, the middle and lower reaches of the Yangtze River, and South China; the adaptability index showed a downward trend, and the areas with poor adaptability were mainly concentrated in the South-west and North-west area. (4) The dominant factors affecting the vulnerability of floods and floods in China’s provinces had both local consistency and their characteristics. Overall, the economic losses of fishery floods and the affected area had the greatest impact on the exposure index; fish production and freshwater fishery output has the greatest impact on the sensitivity index; the indicators with a lower contribution to the adaptability index were the total power of fishery machinery and the promotion of fishery technology. From a local point of view, each region had main factors that affect its vulnerability. The vulnerability of inland fisheries to flood disasters can be reduced only by reducing various factors according to the regional characteristics and development level can effectively reduce.
Mitigation of the impact of flood disaster on fishery production should be based on the perspective of vulnerability. The first is to strengthen the flood control system for fishery flood disasters and reduce the direct impact of flood disasters on fisheries and fishermen using climate warning, reservoir construction, and fishery insurance. The second is to optimize and adjust the layout of aquaculture productivity, build advantageous production areas for inland fishery production based on high standards, high quality and high efficiency, and simultaneously expand new space for aquaculture. Based on fully guaranteeing disaster prevention and control, other suitable areas should also be expanded scientifically. The third is to speed up the construction of modern fishery, focus on existing high-quality fishery enterprises, vigorously build the entire fishery industry chain, and increase the research and development of key technologies such as improved seed breeding, research and development, cold chain transportation, deep processing, and tail water treatment, so as to realize the integration of the industry chain.
Based on the perspective of vulnerability, this paper constructed an evaluation index system for the vulnerability of inland fisheries to floods from three aspects: Exposure, sensitivity and adaptive capacity, and the vulnerability of inland fisheries to flood disaster in China was comprehensively analyzed from the spatio-temporal scale. This has certain reference significance for China’s inland fishery to prevent floods and achieve sustainable development. However, it should be noted that this study also has shortcomings. For example, limited by the availability of data, the period of this paper is small, and it is impossible to analyze the time series development of China’s inland fisheries more comprehensively. In addition, due to space limitations, this paper does not conduct in-depth research on the influencing factors. Particularly, if the disaster resistance and mitigation capabilities of China’s inland fisheries can be truly alleviated through effective and orderly policy support, this will be a future scientific proposition worthy of in-depth study.
Data Availability Statement
Publicly available datasets were analyzed in this study. This data can be found here: https://libvpn.zuel.edu.cn/s/data.cnki.net/yearbook/Single/N2021090041.
Author Contributions
JZ and HL: conceptualization, formal analysis, and investigation. HL: methodology and software. HL, HO, YL, and XL: validation. JZ: resources, writing—original draft preparation, writing—review and editing, and project funding acquisition. HO, YL, and XL: data curation. JZ: supervision. All authors have read and agreed to the published version of the manuscript.
Funding
This project was supported by the Key Project of Discipline Construction of Zhongnan University of Economics and Law, “A Study on the Effective Connection between Consolidating and Expanding Poverty Alleviation Achievements and Rural Revitalization” (Project No. XKHJ202118).
Conflict of Interest
The authors declare that the research was conducted in the absence of any commercial or financial relationships that could be construed as a potential conflict of interest.
Publisher’s Note
All claims expressed in this article are solely those of the authors and do not necessarily represent those of their affiliated organizations, or those of the publisher, the editors and the reviewers. Any product that may be evaluated in this article, or claim that may be made by its manufacturer, is not guaranteed or endorsed by the publisher.
Footnotes
- ^ Because the adaptive capacity is a negative indicator, the greater the adaptive capacity index. It means that the adaptive capacity of the region is weaker, and vice versa.
- ^ The Twelfth 5-Year Period: 2010 to 2015.
References
Abebe, Y., Kabir, G., and Tesfamariam, S. (2018). Assessing urban areas vulnerability to pluvial flooding using gis applications and bayesian belief network model. J. Clean. Prod. 174, 1629–1641. doi: 10.1016/j.jclepro.2017.11.066
Allison, E. H., Perry, A. L., Badjeck, M. C., Neil Adger, W., Brown, K., Conway, D., et al. (2009). Vulnerability of national economies to the impacts of climate change on fisheries. Fish Fish. 10, 173–196. doi: 10.1111/j.1467-2979.2008.00310.x
Boori, M. S., Choudhary, K., and Kupriyanov, A. V. (2016). Vulnerability analysis on Hyderabad city, India. Comput. Opt. 40, 752–758. doi: 10.18287/2412-6179-2016-40-5-752-758
Das, M. K., Sharma, A. P., Sahu, S. K., Srivastava, P. K., and Rej, A. (2013). Impacts and vulnerability of inland fisheries to climate change in the ganga river system in india. Aquat. Ecosyst. Health Manage. 16, 415–424. doi: 10.1080/14634988.2013.851585
Das, M. K., Srivastava, P. K., Rej, A., Mandal, M. L., and Sharma, A. P. (2016). A framework for assessing vulnerability of inland fisheries to impacts of climate variability in india. Mitig. Adapt. Strateg. Glob. Change 21, 279–296. doi: 10.1007/s11027-014-9599-7
Ding, Q., Chen, X., Hilborn, R., and Chen, Y. (2017). Vulnerability to impacts of climate change on marine fisheries and food security. Mar. Policy 83, 55–61. doi: 10.1016/j.marpol.2017.05.011
FAO. (2014). The State of World Fisheries and Aquaculture 2014 Opportunities and Challenges. Rome: Food and Agriculture Organization of The United Nations. Available online at: https://www.fao.org/3/i3720e/i3720e.pdf.
Ghosh, M., and Ghosal, S. (2021). Climate change vulnerability of rural households in flood-prone areas of Himalayan foothills, West Bengal, India. Environ. Dev. Sustain. 23, 2570–2595. doi: 10.1007/s10668-020-00687-0
Guo, Y., Wang, R., Tong, Z., Liu, X., and Zhang, J. (2019). Dynamic evaluation and regionalization of maize drought vulnerability in the midwest of jilin province. Sustainability 11:4234. doi: 10.3390/su11154234
Handisyde, N. T., Ross, L. G., Badjeck, M. C., and Allison, E. H. (2006). “The Effects of Climate Change on World Aquaculture: A Global Perspective,” Final Technical Report, Aquaculture and Fish Genetics Research Programme. Stirling: University of Stirling. doi: 10.1002/hyp.6620
Hoque, M. Z., Cui, S., Xu, L., Islam, I., Tang, J., and Ding, S. (2019). Assessing agricultural livelihood vulnerability to climate change in coastal bangladesh. Int. J. Environ. Res. Public Health 16: 4552. doi: 10.3390/ijerph16224552
Karimzadeh, S., Miyajima, M., Hassanzadeh, R., Amiraslanzadeh, R., and Kamel, B. (2014). A gis-based seismic hazard, building vulnerability and human loss assessment for the earthquake scenario in tabriz. Soil Dyn. Earthq. Eng. 66, 263–280. doi: 10.1016/j.soildyn.2014.06.026
Kasperson, J. X., and Kasperson, R. E. (2001). International Workshop on Vulnerability and Global Environmental Change. Stockholm: Stockholm Environment Institute.
Kim, B. T., Lee, J. S., and Suh, Y. S. (2018). Assessment of vulnerability to climate change in coastal and offshore fisheries of korea under the rcp scenarios: for the south coast region. Ocean Polar Res. 40, 37–48. doi: 10.4217/OPR.2018.40.1.037
McCarthy, J. J. (2001). Climate change 2001: Impacts, Adaptation, and Vulnerability. Contribution of Working Group II to the Third Assessment Report of the Intergovernmental Panel on Climate Change. Cambridge: Cambridge University Press.
Mmia, B., Ab, B., Gkk, C., Mak, B., and Bp, B. (2019). Vulnerability of inland and coastal aquaculture to climate change: evidence from a developing country. Aquac. Fish. 4, 183–189. doi: 10.1016/j.aaf.2019.02.007
Morales, Y. L., Diéguez, E. T., Garibay, A. N., Morales, F., and Jiménez, J. N. (2014). Hydroclimatic vulnerability and soil degradation in agricultural semiarid regions. Terra Latinoam. 32, 47–58.
Naskar, M., Roy, K., Karnatak, G., Nandy, S. K., and Roy, A. (2018). Quantifying climate change induced threats to wetland fisheries: a stakeholder-driven approach. Environ. Dev. Sustain. 26, 2811–2830. doi: 10.1007/s10668-017-0018-6
Nguyen, C. T., and Bao, V. N. (2019). Application of flood vulnerability index in flood vulnerability assessment: a case study in mai hoa commune, tuyen hoa district, quang binh province. Sustain. Water Resour. Manage. 5, 1917–1927. doi: 10.1007/s40899-019-00337-y
Peng, L., Xu, D., and Wang, X. (2019). Vulnerability of rural household livelihood to climate variability and adaptive strategies in landslide-threatened western mountainous regions of the Three Gorges Reservoir Area. China. Clim. Dev. 11, 469–484. doi: 10.1080/17565529.2018.1445613
Polsky, C., Neff, R., and Yarnal, B. (2007). Building comparable global change vulnerability assessments: the vulnerability scoping diagram. Glob. Environ. Change 17, 472–485. doi: 10.1016/j.gloenvcha.2007.01.005
Puthiyottil, M., Sarkar, U. K., Lianthuamluaia, L., Karnatak, G., Hassan, M. A., Kumari, S., et al. (2021). Floodplain wetlands of eastern India in a changing climate: trophic characterization, ecological status, and implications for fisheries. Aquat. Ecosyst. Health Manag. 24, 47–56. doi: 10.14321/aehm.024.03.07
Qi, C., Shen, W., and Bing, Y. (2018). Assessing the vulnerability of marine fisheries in china: towards an inter-provincial perspective. Sustainability 10:4302. doi: 10.3390/su10114302
Tian, Q., and Lemos, M. C. (2018). Household livelihood differentiation and vulnerability to climate hazards in rural China. World Dev. 108, 321–331. doi: 10.1016/j.worlddev.2017.10.019
Timmerman, P. (1981). Vulnerability, Resilience and The Collapse of Society. A Review of Models and Possible Climatic Applications. Toronto: University of Toronto.
Turner, B., Kasperson, R. E., Matson, P. A., Mccarthy, J. J., Corell, R. W., Christensen, L., et al. (2003). A framework for vulnerability analysis in sustainability science. Proc. Natl. Acad. Sci. U.S.A. 100, 8074–8079. doi: 10.1073/pnas.1231335100
UNISDR (2004). Living with Risk: A Global Review of Disaster Reduction Initiatives. United Nations. Geneva: UNISDR.
Weis, S. W. M., Agostini, V. N., Roth, L. M., Gilmer, B., Schill, S. R., Knowles, J. E., et al. (2016). Assessing vulnerability: an integrated approach for mapping adaptive capacity, sensitivity, and exposure. Clim. Change 136, 615–629. doi: 10.1007/s10584-016-1642-0
White, G. F. (1974). Natural Hazards, Local, National, Global. Oxford: Oxford University Press. doi: 10.2307/213594
Wu, F., Sun, Y., Sun, Z., Wu, S., and Zhang, Q. (2017). Assessing agricultural system vulnerability to floods: a hybrid approach using emergy and a landscape fragmentation index. Ecol. Indic. 105, 337–346. doi: 10.1016/j.ecolind.2017.10.050
Xu, D., Deng, X., Guo, S., and Liu, S. (2019). Sensitivity of livelihood strategy to livelihood capital: an empirical investigation using nationally representative survey data from rural China. Soc. Indic. Res. 144, 113–131. doi: 10.1007/s11205-018-2037-6
Xu, D., Liu, E., Wang, X., Tang, H., and Liu, S. (2018). Rural households’ livelihood capital, risk perception, and willingness to purchase earthquake disaster insurance: evidence from southwestern China. Int. J. Environ. Res. Public Health 15:1319. doi: 10.3390/ijerph15071319
Yuan, Z. L., Shi, X. X., Qian, H., Wang, H. K., and Yang, F. X. (2021). Vulnerability assessment of agricultural drought in Hebei Province during 2010-2018. J. Water Resour. Water Eng. 32:8.
Zeng, X. C., Zhao, N. G., Shi, D. K., Ren, M. L., and Yang, L. B. (1990). Compilation of fishery regionalization in Inland and Land waters of China. Fishery Regionalization in Inland Waters of China. Hangzhou: Zhejiang Science.
Zhang, X., Wang, L., Fu, X., and Li, H. (2017). Ecological vulnerability assessment based on pssr in yellow river delta. J. Clean. Prod. 167, 1106–1111. doi: 10.1016/j.jclepro.2017.04.106
Zhao, Y. J., Zheng, F. L., Yao, Y. Q., and Zhang, J. Q. (2022). Spatial-temporal variation of agrometeorological disasters in China from 1978 to 2018. J. Nat. Disasters 202, 198–207.
Zhou, S. E., Zhang, M. J., and Wang, S. J. (2018). Assessment of vulnerability in natural social system in Hexi, Gansu. Resour. Sci. 40, 452–462. doi: 10.18402/resci.2018.02.20
Zhou, W., Guo, S., Deng, X., and Xu, D. (2021a). Livelihood resilience and strategies of rural residents of earthquake-threatened areas in Sichuan Province, China. Nat. Hazards 106, 255–275. doi: 10.1007/s11069-020-04460-4
Keywords: flood disaster, vulnerability, spatial and temporal differences, China, inland fisheries
Citation: Lu H, Zheng J, Ou H, Liu Y and Li X (2022) Vulnerability Assessment and Spatio-Temporal Difference Analysis of Inland Fisheries Flood Disaster in China. Front. Ecol. Evol. 10:899786. doi: 10.3389/fevo.2022.899786
Received: 19 March 2022; Accepted: 12 April 2022;
Published: 12 May 2022.
Edited by:
Dingde Xu, Sichuan Agricultural University, ChinaReviewed by:
Huang Kai, University of Chinese Academy of Sciences, ChinaFangting Xie, Jiangxi Agricultural University, China
Copyright © 2022 Lu, Zheng, Ou, Liu and Li. This is an open-access article distributed under the terms of the Creative Commons Attribution License (CC BY). The use, distribution or reproduction in other forums is permitted, provided the original author(s) and the copyright owner(s) are credited and that the original publication in this journal is cited, in accordance with accepted academic practice. No use, distribution or reproduction is permitted which does not comply with these terms.
*Correspondence: Jiaxi Zheng, NDcwNTA3MzU1QHFxLmNvbQ==