 Orly Cohen1
 Lilach Hadany
 Eli Geffen
 Sarig Gafny
- 1Faculty of Life Sciences, School of Zoology, Tel Aviv University, Tel Aviv, Israel
- 2Faculty of Life Sciences, School of Plant Sciences and Food Security, Tel Aviv University, Tel Aviv, Israel
- 3Faculty of Marine Sciences, Ruppin Academic Center, Michmoret, Israel
Microsatellite loci have been shown to vary according to environment. We studied allelic length variation and diversity in eight microsatellite loci along a sharp climatic and habitat gradient in Israel, using the eastern spadefoot toad (Pelobates syriacus) as our model system. We found a gradual increase in allele lengths from north to south. We used a distance-based redundancy analysis (dbRDA) to associate between allele length and habitat and climatic measures and found that geography and annual climate explained the significant variation in allele length. We also used additional measurements pertaining to demography, heterozygosity and allelic diversity to explore four different hypotheses that might explain the variations in allele length. Our results suggest that the changes we observed in allele lengths may not be purely random but could be influenced by the differential mutation rate and/or local environmental conditions operating at the different locations.
Introduction
Past alternative models of microsatellite evolution have suggested that every locus can vary independently in length over time (e.g., Goldstein et al., 1995). However, recent studies mapping promoter elements, transcription start sites, and binding motifs for transcription factors with some microsatellites, have suggested an influence of nearby genes on mechanisms such as transcriptional interference (Hannan, 2012; Brittain et al., 2014; Vieira et al., 2016; Zhang and Ashizawa, 2017). Current reviews suggest that microsatellite DNA is part of the functional genome and has an important role in chromatin and gene regulation (e.g., Garrido-Ramos, 2017). Finally, a recent study on sunflowers revealed that out of 3,325 microsatellites, 14.4% had an allele length that significantly correlated with gene expression (Ranathunge et al., 2020).
The discovery that maize and barley microsatellite allele lengths vary predictably with climatic variables (Vigouroux et al., 2003; Nevo et al., 2005) suggests a significant role of the various demographic, historic, or environmental conditions in microsatellite evolution. The correlation between allele length and altitude in Mexican, South-American, and North- American maize populations was explained by Rayburn et al. (1985) using an association to genome size (Poggio et al., 1998). In short-season environments (i.e., high altitude) a smaller genome can be replicated more quickly and, similarly, shorter microsatellite alleles are selected for in such environments. Furthermore, several global-scale studies on human populations have demonstrated a directional decrease in microsatellite allele lengths from eastern Africa (Prugnolle et al., 2005; Ramachandran et al., 2005; Amos et al., 2008), a pattern that was attributed to time since the first migration out of Africa. Several hypotheses could explain such directional trends in microsatellite diversity:
Genetic drift
Microsatellites were previously hypothesized to be selectively neutral (Charlesworth et al., 1994). Under this hypothesis, we would expect heterozygosity, but not mean allele length, to be positively correlated with the effective population size Ne (Kimura and Crow, 1964).
Heterozygote instability
Empirical evidence (Amos et al., 1996, 2008) suggests that “heterozygous sites show increased mutability due to an extra round of DNA replication when they are recognized and “repaired” in heteroduplex DNA formed during synapsis” (Amos, 2016). This hypothesis suggests that differences in heterozygosity, due for example to population size or demographic processes, will lead to higher relative mutation rates (Amos et al., 2008). Therefore, compared with small populations, in larger populations, where heterozygosity is higher, mean allele length will be higher if loci are expanding (i.e., increasing in number of alleles) and lower if loci are contracting (i.e., decreasing in number of alleles). Because microsatellite length is finite, whereas many loci may have room to expand in length, many others can only contract. Thus, under this hypothesis, we expect a strong correlation between effective population size (or observed heterozygosity) and mean allele length, with the sign of the correlation coefficient being either positive or negative (Amos et al., 2008; Amos, 2010).
Stress-induced mutagenesis
Many empirical studies have shown that environmental stress induces a state of hypermutation in bacteria (Harris et al., 1997; Galhardo et al., 2007), as well as in eukaryotes (Heidenreich, 2007; Bristow and Hill, 2008; Sharp and Agrawal, 2012). There are several possible mechanisms to explain the occurrence and benefits of hypermutation under stressful environmental conditions (Forche et al., 2011; Rosenberg et al., 2012; Torres-Barcelo et al., 2013). For example, if maladapted individuals increase their mutation rate, then the population adapts faster and the overall population mean fitness increases (Bjedov et al., 2003; Ram and Hadany, 2012; Ram et al., 2018). Thus, stress-induced mutagenesis implies that more mutations are expected to accumulate in a population during extreme environmental events, regardless of population size and heterozygosity level. Under this hypothesis, we therefore expect allele diversity to positively correlate with environmental stress, while allele length can either increase or decrease with stress.
Natural selection
Microsatellite allele length may be directly selected by biological, environmental, or climatic variables (Vigouroux et al., 2003; Amos and Clarke, 2008; Amos et al., 2008). Allele length may affect fitness by regulating the expression and structure of nearby genes (e.g., Schmidt and Anderson, 2006; Gao et al., 2013). One example of this is that of the decrease in allele lengths of maize with increase in altitude across a wide geographic range (Vigouroux et al., 2003). Under this hypothesis, we expect allele lengths of some loci to correlate with an environmental gradient or with environmental stability, independent of genetic diversity or heterozygosity. The sign of the correlation coefficient may be positive or negative, depending on the locus.
For this study, we collected P. syriacus tadpole samples from 22 vernal pools located along a steep climatic gradient in Israel (Figure 1). We used eight published microsatellite markers to estimate mean allele lengths, allelic richness, Shannon’s diversity, and observed heterozygosity for each sampled pool. To explain the observed variation in allele length along the climatic gradient in Israel and to test for a fit for each of the hypotheses presented above, we used dbRDA and mixed models.
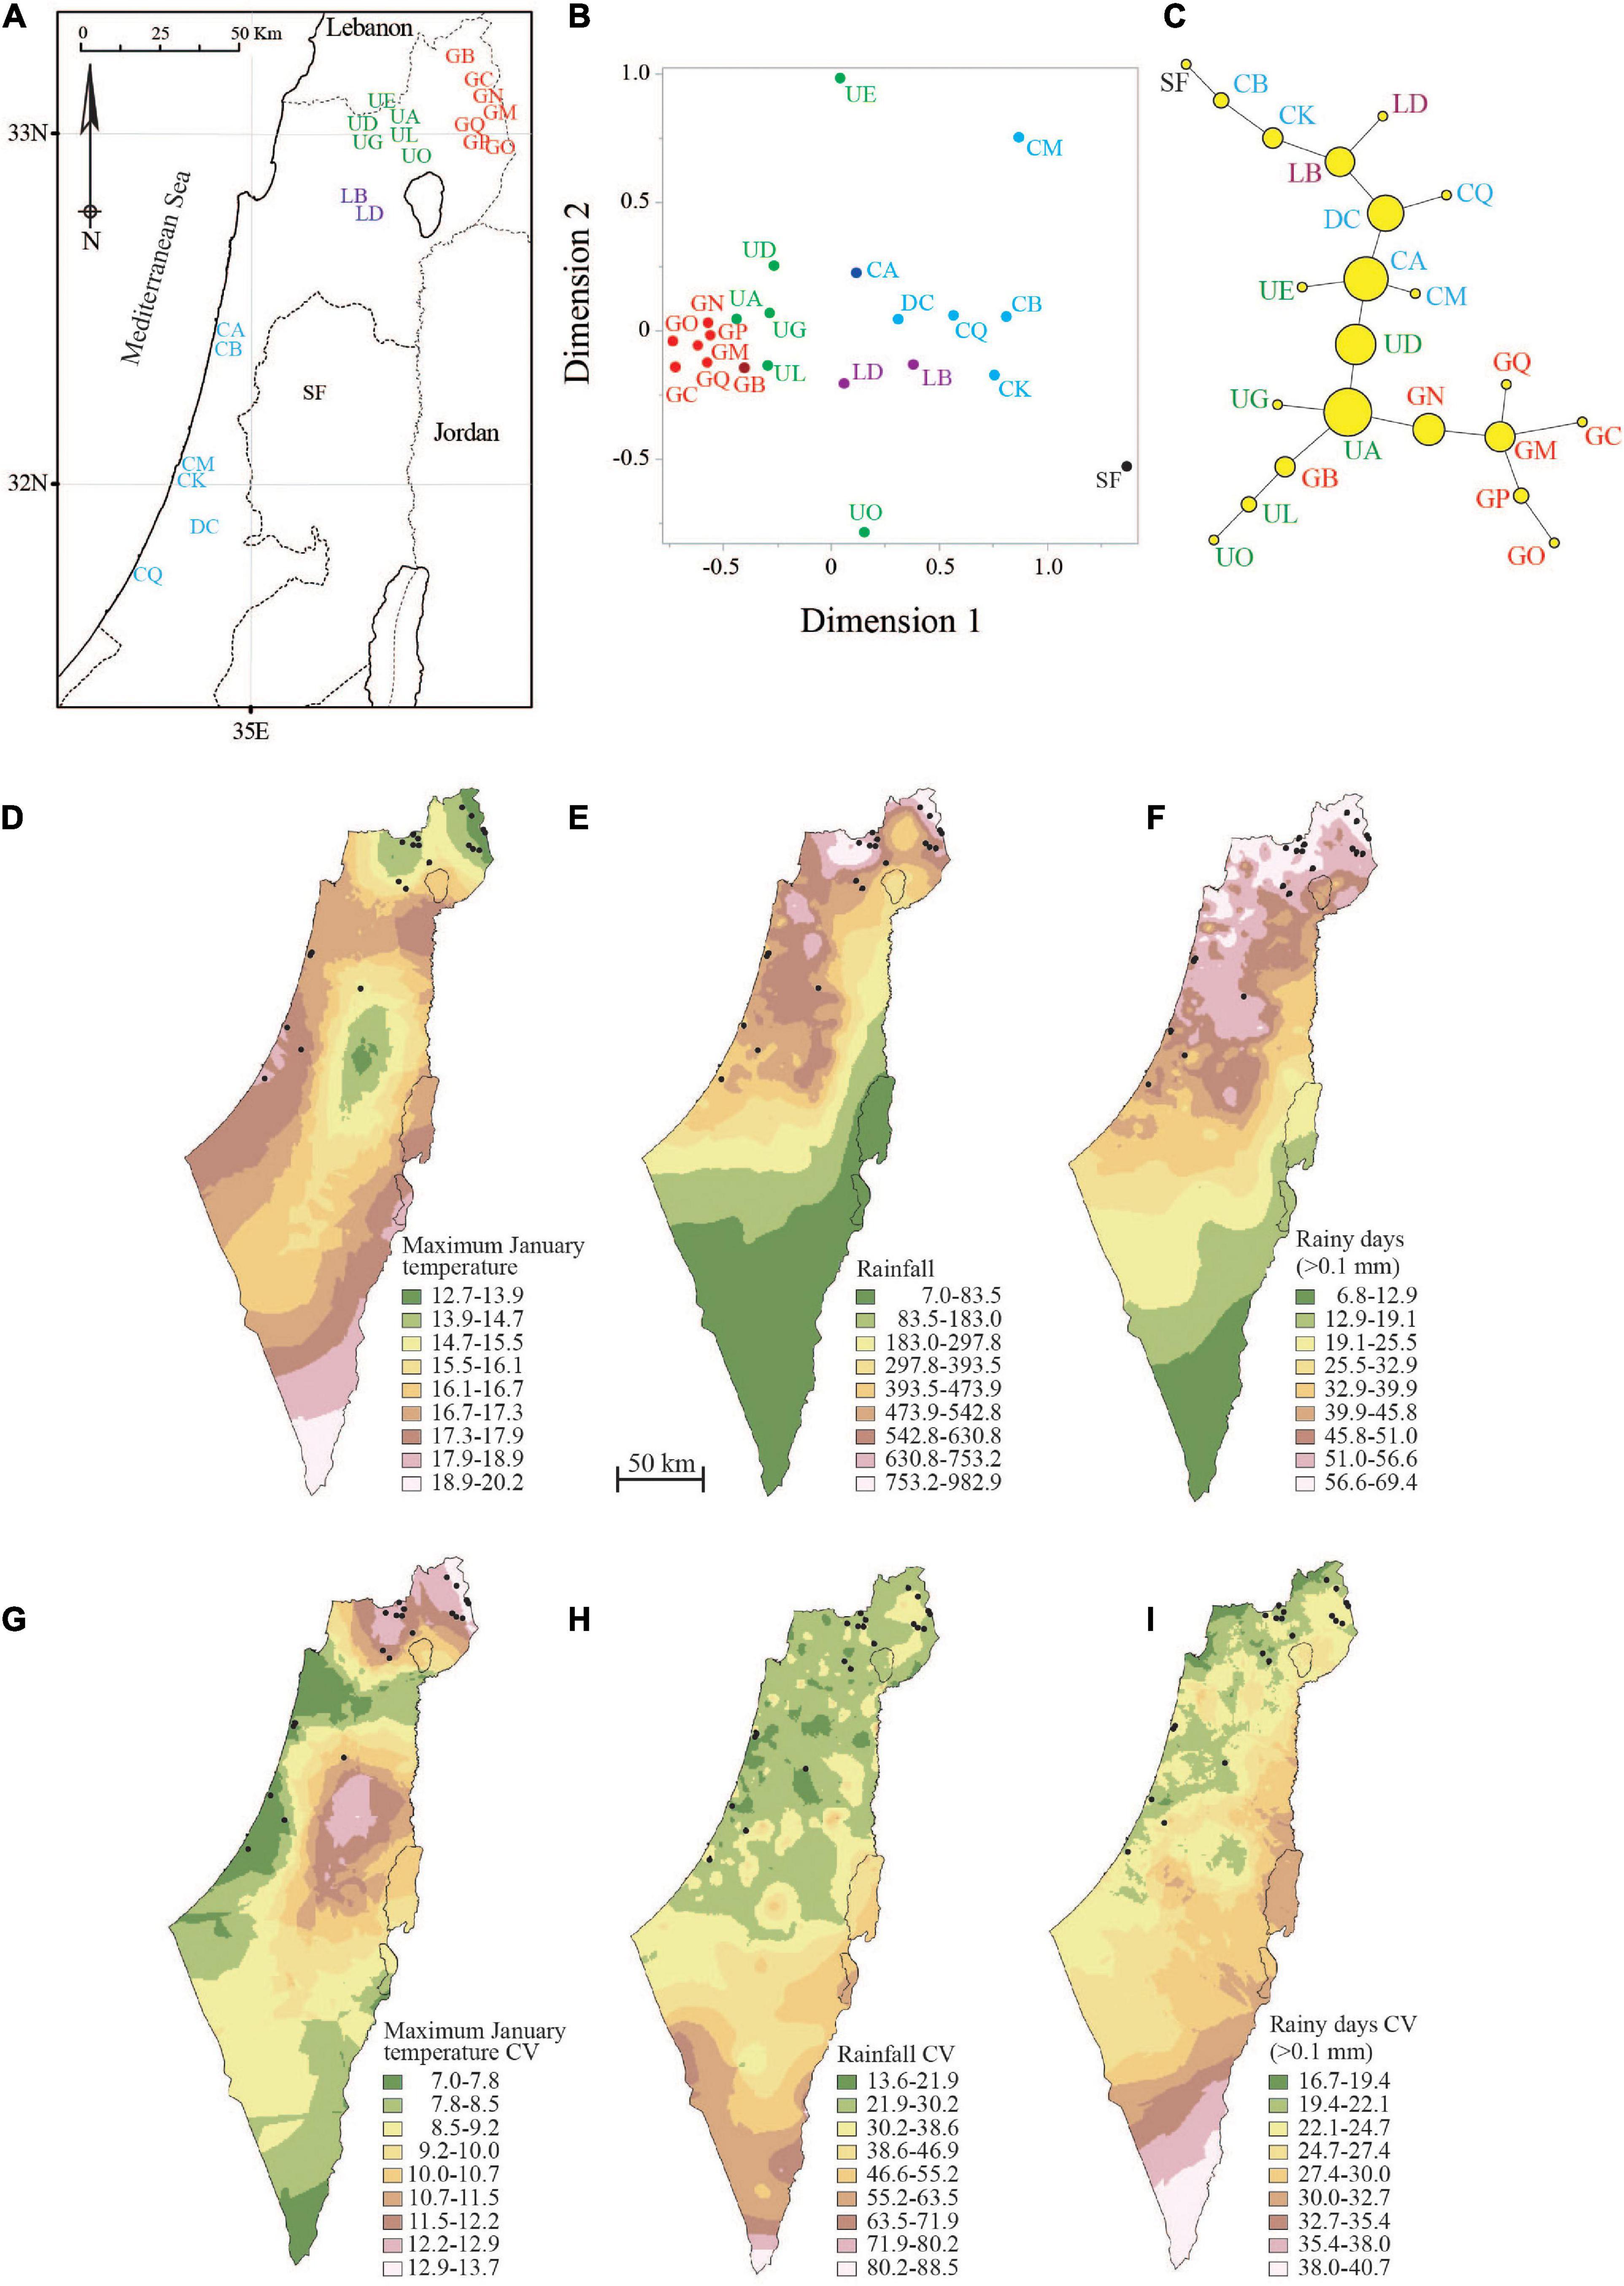
Figure 1. Location of sampled pools (A), PROXSCAL multidimensional scaling (B) and minimum spanning network of Nei’s DA distance (C) between pools, spatial projection over Israel of mean annual maximum temperature in January (D; °C), mean annual rainfall (E; mm), mean annual number of rainy days (F; > 0.1 mm), coefficient of variation (CV) of annual maximum temperature in January (G; %), CV of mean annual rainfall (H; %), and CV of mean annual number of rainy days (I; %). Climatic data (133 temperature recording stations and 559 rainfall monitoring stations across Israel) were obtained from the Israel Meteorological Service (IMS) for the years 1999–2018. Vernal pools sampled in this study are denoted by region-colored codes or circles (Golan Heights—red, Upper Galilee—green, Lower Galilee—purple, Samaria—black, and coastal plain—light blue). Node size on the minimum spanning network reflects betweenness centrality.
Materials and methods
Study system
The climatic processes affecting mtDNA variation along a steep gradient in Israel have been studied by Munwes et al. (2010). Here, we used a similar set of vernal pools, with the eastern spadefoot toad (Pelobates syriacus) as our model system. This species is a fossorial toad, spending the hot and dry periods in deep burrows in the soil that it digs with its hind legs. It occupies terrestrial habitats in open uncultivated lands such as sparse forests, steppe, semi-desert, and rocky areas. Spawning sites in this species comprise stagnant temporary water bodies, as well as large permanent pools. In Israel, the species is known to breed only in ephemeral pools and the adults are philopatric, breeding in the same vernal pool in consecutive years (Gafny, 1986).
The distribution range of P. syriacus extends to southern Romania in the north, Greece in the west, Iran in the east, and Israel in the south (Agasyan et al., 2009). In Israel, it is found from the Golan Heights and Galilee in the north to throughout the central coastal plain, which includes its present southernmost breeding site—Robert’s pool near Ashdod (Munwes et al., 2010). Although Israel is at the southernmost edge of its distribution, there is a steep gradient in environmental conditions within Israel (Figure 1). The northern regions of the country are relatively colder and wetter, with a more stable climate. The vernal pools in the north are filled every year and retain water for long periods (7–10 months) with relatively low variability among years. In contrast, the coastal plain is more arid, with a higher inter-annual variability in precipitation and its vernal pools consequently retain water for shorter periods (up to 5 months) and in some years do not fill at all (Munwes et al., 2010). Spadefoot toad species display extreme variation in larval period duration, due in part to the evolution of thyroid hormone (TH) physiology (Hollar et al., 2011). Eastern spadefoot toad tadpoles exhibit plasticity in the timing of metamorphosis (Székely et al., 2010). Furthermore, environmental factors have been shown to affect developmental traits in the tadpoles, conducing to rapid metamorphosis in drying ephemeral ponds (Storz and Travis, 2007).
The northern (i.e., core-like) and southern (i.e., edge; Munwes et al., 2010) populations of the spadefoot toad in Israel differ in several life-history traits (Gafny, 1986). Breeding season in the coastal plain is from early January to late February, while in the Upper Galilee it is from mid-March to mid-April. Females lay a long string of eggs (mean ± SD: 8,954 ± 5,229 eggs, n = 19; Gafny, 1986), which develop to metamorphosis in about 80 days in the coastal plain and 180 days in the Upper Galilee and Golan Heights. On average, in the coastal plain only about 30% of pool tadpole populations successfully metamorphose, and of those about 45% die later from dehydration. The main reason for the low survival rates in the coastal plain is the early desiccation of the vernal pools, before the tadpoles can achieve metamorphosis or find appropriate shelter. In contrast, at least 70% of the Galilee and Golan Heights tadpole populations successfully metamorphose (Gafny, 1986). Additionally, post-metamorphic individuals are also smaller in the coastal plain (1.3–4.0 g) relative to those at the same developmental stage in the north of Israel (4.5–9.3 g; Gafny, 1986). Body size and stored fat at metamorphosis are thought to be important correlates of fitness in amphibians (Morey and Reznick, 2000). Post-metamorphic individuals in the coastal plain must tolerate the dry and unfavorable conditions for much longer than in the northern regions. The coastal plain, which is the southernmost edge of the species’ range, is thus also ecologically marginal (Munwes et al., 2010).
Sample collection
The study was conducted in 22 vernal pools known as breeding sites for Pelobates syriacus in Israel (Table 1, Supplementary Table 1, and Figure 1). The sampling sites spanned northern and central Israel, including the southernmost known breeding site for this species. Most DNA samples were collected over a period of 4 years (79%; 2012–2015). We also incorporated DNA samples collected between 2006 and 2010 (21%) by Munwes et al. (2010).
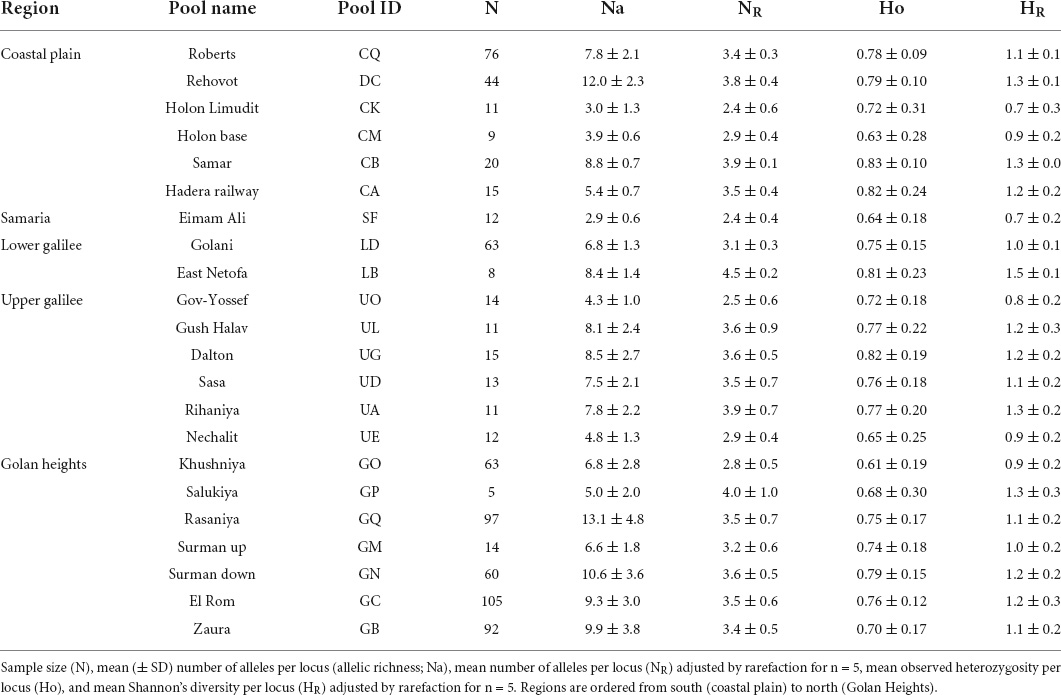
Table 1. Genetic diversity measures for the vernal pools sampled in this study.
We visited each vernal pool 2–3 times annually, during winter and spring (Oct-May), and each time sampled 15–20 tadpoles. The tadpoles were measured (TL—snout to end of tail). Newly hatched tadpoles (≤3 cm) were collected whole and tail-tip samples were taken from larger tadpoles. All samples were stored in 96% alcohol and kept frozen until analysis. To maximize the chance of sampling tadpoles from different spawns (i.e., individuals that are not full siblings), we spatially sampled from around each pool. Most of the pools were small (diameter < 50,m) and shallow (< 1,m), enabling extensive sampling. To further verify that our samples were not composed of highly related individuals, we conducted a relatedness analysis using ML-Relate (Kalinowski et al., 2006). We identified full sibs using the 95% confidence set for R = 0.5 approach. We also mapped out the matrix of relatedness between all tadpoles sampled in each region using PROXCAL multidimensional scaling (Commandeur and Heiser, 1993).
Microsatellite analyses
We used eight published microsatellite loci (Cohen et al., 2021; Supplementary Table 2), a set of genetic markers that is particularly suitable for individual-level analysis (Wan et al., 2004). Genomic DNA samples from P. syriacus were sent to the Evolutionary Genetics Core Facility (EGCF) at Cornell University for genomic library construction via Illumina MiSeq sequencing. Five samples from pools across Israel were used to construct the microsite library. The EGCF provided a msatcommander (Faircloth, 2008) output file with thousands of potential microsatellite primer pairs. We identified polymorphic loci even before the PCR testing step by sorting the output data file. We looked for loci with tetramer motifs, size range of 150–400 bp, annealing temperature of 58–60°C, and 7–10 alleles. The primers we finally selected were tested using a 25 μl PCR mix containing 12.5 μl KAPA2G Fast ReadyMix (KAPA Biosystems), 10 μM of forward and reverse primers, 1 μl of DNA and 9 μl of PCR-grad water. The PCR cycling protocol included an initial denaturation step (3 min, 95°C), followed by 35 cycles of denaturation (15 s, 95°C), annealing (15 s, 57°C), and extension (15 s, 72°C), and a final extension step (3 min, 72°C). After preliminary testing, we retained eight optimal primers (Supplementary Table 2). Forward primers were labeled with fluorescent dyes (6-FAM, Tamra, HEX, and ROX) for use in two multiplex reactions. Genotyping was performed using an ABI 3500xl Genetic Analyzer with the GeneScanT 600 LIZ size standard (Applied Biosystems). Peaks were scored manually in GeneMarker (version 1.97, SoftGenetics).
Allelic diversity and genetic structure
We tested the presence of null allele, stuttering, and large allele dropout using Micro-Checker (version 2.2.3; Van Oosterhout et al., 2004). Deviation from Hardy-Weinberg equilibrium (HWE) and evidence of linkage disequilibrium (LD) were calculated using Genepop (version 4.4; Rousset, 2008).
We evaluated the overall population structure and isolation by distance (IBD) using the Bayesian methods implemented in the program STRUCTURE 2.3.3 (Pritchard et al., 2000). We tested two possible ancestry and allele frequency model combinations (i.e., admixture/correlated model and no admixture/independent model), and performed four independent runs for each. Following an initial test, we set a burn-in period of 20,000 iterations and 20,000 MCMC repeats for each run. We set K (the number of possible populations) to between 4 and 15. The most likely K was inferred from ΔK (Evanno et al., 2005) as implemented in the program Structure Harvester (Earl and von Holdt, 2012). Graphical representation of structure results was produced using Distruct 1.1 (Rosenberg, 2004).
We used Nei’s corrected average of allele length differences between populations (DA; Nei and Li, 1979), implemented in Arlequin (Excoffier et al., 2005), to evaluate the genetic distance between all pools. Nei’s corrected average of allele length differences between populations (DA; Nei and Li, 1979) is a Rst-like distance, and for our dataset Nei’s DA was almost linearly identical to the Goldstein et al. (1995) (δμ)2 distance (r2 = 0.988, P < 0.0001), which is the squared pairwise difference in mean allele length summed over all loci. Since we were interested in the differences in allele length between pairs of pools, (δμ)2 distance would usually be the most appropriate measure to use. However, because (δμ)2 distance is highly sensitive to outliers, we used Nei’s DA instead. Using the DA matrix, we explored the overall genetic structure with PROXSCAL multidimensional scaling (MDS; Commandeur and Heiser, 1993) and minimum spanning network (MSN; Excoffier and Smouse, 1994).
We examined genetic diversity using three common measures: observed heterozygosity (Ho), number of alleles per locus (allelic richness; Na), and Shannon’s diversity (H; Pielou, 1966). These diversity measures were calculated per pool using GeneAlEx (version 6.5; Peakall and Smouse, 2012). Since the number of samples (N) significantly correlated with Na (r2 = 0.37, P = 0.002) and H (r2 = 0.18, P = 0.049), but not with Ho (r2 < 0.05, P = 0.866) or Ne (r2 < 0.05, P ≥ 0.708), we adjusted pool Na and H values for n = 5 using the rarefaction approach of Chao et al. (2014) implemented in the Past program (version 4; Hammer et al., 2001).
Climate and habitat effects on allele length variation and diversity
Two of our hypotheses posited that allele length variations are associated with environmental changes and/or stability. We therefore chose to focus on three annual climatic variables of high relevance for spadefoot toad breeding behavior and tadpole survival (Gafny, 1986): the mean daily maximum temperature in January (MJT), the annual rainfall (AR), and the number of days with more than 0.1 mm rain (RD). We obtained climate data from the Israel Meteorological Service (IMS) for the past 20 years (1999–2018), from 127 permanent stations that record temperature and 559 stations that record rainfall across the country. For each year, the annual rainfall and number of rainy days were recorded from August 1 to July 31 of the following year. For each IMS station, we calculated the mean and the coefficient of variation (CV) for MJT, AR, and RD. The mean and CV data were then projected over a map of Israel by ordinary kriging and extraction by mask using ArcGIS (version 10, ESRI). These mean and CV projections (Figure 1) are added to provide the reader with a comprehensive view of the climatic gradient in temperature and rainfall and the climate stability across Israel. For each vernal pool, we calculated the mean and the coefficient of variation (CV) for MJT, AR, and RD from the closest IMS stations (Supplementary Table 1).
Pools in the north of Israel are situated on heavy soil types (terra rosa, rendzina, basaltic protogrumusols, basaltic), while the pools on the coastal plain are usually associated with lighter soil types (sand dunes, hamra, grumusols; Ravikovitch, 1992). These differences in soil types could exert a differential selection pressure on P. syriacus in regard to burrowing into the soil, food type, and nutrient availability, etc. We used the four soil characteristics found in key soil types in Israel (proportion of clay, silt, fine sand, and gross sand; Ravikovitch, 1992) to represent the habitat in the vicinity of the pools (Munwes et al., 2010).
We used Principal Component Analysis (PCA) to reduce the number of predictors and retained the components with an eigenvalue ≥ 1 (Kaiser criterion; Kaiser, 1960). Geographic distance between pools was represented in our analysis by a single predictor, the first component of the PCA on northern and eastern UTM coordinates (thereafter Geography PC1; eigenvalue = 1.9, % of variance = 96.1). Using PCA on the four soil (i.e., habitat) variables, the first two components, soil PC1 (eigenvalue = 2.3, % of variance = 57.1) and soil PC2 (eigenvalue = 1.6, % of variance = 39.8), accounted together for 97.9% of the variance in soil types. Soil PC1 correlated with clay and silt (r≅ 0.90), and soil PC2 with sand particle size (r≅ 0.79). PCA collapsed the mean daily maximum temperature in January (MJT), the annual rainfall (AR), and the number of days with more than 0.1 mm rain (RD) into a single climate predictor (thereafter climate PC1; eigenvalue = 2.6, % of variance = 86.4). The climate CV variables were collapsed into two principal components: climate CV PC1 (eigenvalue = 1.4, % of variance = 45.2), which correlated with the CV in rainfall and number of rainy days (r≅0.81), and climate CV PC2 (eigenvalue = 1.1, % of variance = 36.4), which correlated with the CV in maximum January temperature (r = 0.94). The two climate CV components together accounted for 81.6% of the variance in the climate CV variables.
To address collinearity among the predictors in our model, we used the Variance Inflation Factor (VIF), and any predictor with VIF ≥ 10 was excluded from further use. Collinearity was below the above threshold for all predictors (VIF ranged 1.3–7.9; Table 2).
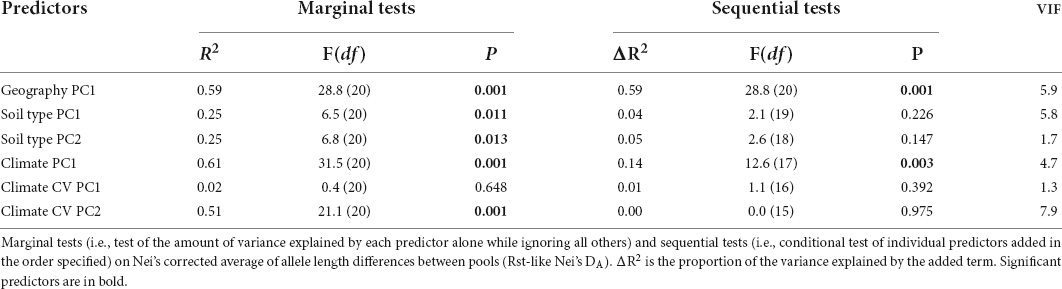
Table 2. The results of dbRDA on allele length variation.
Differentiating among the working hypotheses required us to associate allele length variation with both environmental variation and stability (proxy for environmental and habitat selection) and geographical distance (proxy for reproductive isolation and founder effects). We used distance-based redundancy analysis (dbRDA; Legendre and Anderson, 1999; McArdle and Anderson, 2001) to explore the association between Nei’s corrected average allele length differences between populations (DA) and a set of climatic and environmental variables. The dbRDA is an ordination procedure, which is constrained to find linear combinations of the predictor variables that explain the greatest variation in the DA matrix. We used marginal tests to explore the amount of variance explained by each predictor alone while ignoring all others, and sequential tests to explore the amount of variance explained by each individual predictor added in a specified order. In the sequential tests, we added geographic distance first and the climatic variables last. P-values were evaluated using randomizations. The dbRDA models were calculated using PERMANOVA + (version 7, PRIMER-E Ltd.).
We also explored the effect of geographic distance, soil type, and climate on the observed heterozygosity (Ho), rarefaction-adjusted Shannon’s diversity (HR), and rarefaction-adjusted allelic richness (NR) using the general linear mixed-model (GLMM). In these models, locus, geography PC1, soil type PC1 and PC2, climate PC1, and climate CV PC1 and PC2 were the predictors, and region (Table 1) was set as a random effect. We used a normal distribution and the identity link function. P-values were evaluated using randomizations. We used the total effect as a measure of variable importance (i.e., effect size) following the Saltelli (2002) method. The total effect reflects the relative contribution of each predictor, both alone and in combination with other factors, in a way that is independent of the model type and fitting method. The GLMM models were fitted using JMP Pro (version 16, SAS Inc.).
Ne and migration rate estimation
We estimated contemporary effective population size (Ne) from the microsatellite data using two approaches: The molecular co-ancestry method of Nomura (2008), and the bias-corrected linkage disequilibrium (LD) method (Waples and Do, 2010). Both methods are implemented in the program NeEstimator (version 2; Do et al., 2014).
We also estimated recent asymmetric migration rates among pools using the software BayesAss (version 3.0, Wilson and Rannala, 2003). BayesAss implements an MCMC algorithm for Bayesian inference of asymmetric rates of recent immigration among populations. We ran the program with different mixing parameters until the acceptance rates were between 20 and 60%, as recommended by the manual. The final mixing parameters were dM = 0.3, dA = 0.5, and dF = 0.6 for the coastal plain pools and dM = 0.1, dA = 0.5, and dF = 0.6 for the northern pools. Each run was set at 106 MCMC iterations, 50,000 burn-in period, and a sampling interval of 100.
Results
Genetic relatedness within pools
We sampled 22 vernal pools spanning 200 km along a sharp climatic gradient (Table 1 and Figure 1). The tadpoles we sampled were not composed of clusters of full sibs. First, each geographical region showed a wide distribution of allele frequencies, which in most cases were not strongly positively or negatively skewed (Supplementary Figure 1). Second, the frequency of full sib relationships among tadpoles (95% confidence set for relatedness = 0.5) was very low (1.37% in the coastal plain, n = 13,781 pairwise comparisons; 2.6% in the Lower Galilee, n = 3,152; 2.0% in the Upper Galilee, n = 2,831; 0.6% in the Golan Heights, n = 93,123). Last, mapping out the relatedness among tadpoles using PROXCAL MDS revealed a wide scatter within most rain pools (Supplementary Figure 2), suggesting that most of the individuals were unrelated.
Prior genetic analyses
The frequency of null allele, deviation from Hardy-Weinberg equilibrium (HWE) and evidence of linkage disequilibrium (LD) are presented in Supplementary Tables 3–5. We did not detect evidence for stuttering and large allele dropout. Locus Psy 2 showed a significant heterozygote deficit and was the only one suspected of having null alleles.
Population diversity and genetic subdivision
The polymorphic microsatellite loci we used had an allele length range of 134–384 bp, and the difference between the longest and shortest allele within each locus ranged from 68 to 154 bp. A distinct decrease was evident in mean (± SD) standardized allele length from south (coastal plain: 257.9 ± 47.7) to north (Golan Heights: 240.2 ± 55.9): that is, from the edge of the species distribution to the core (Figure 2 and Supplementary Figure 1). While a comparison of mean allele length between regions showed a significant difference [F(3, 31) = 15.6, P ≤ 0.0001], the significant interaction in this model [region*locus: F(21, 144) = 3.1, P ≤ 0.0001] implied that the trend of change in the regional means varies between loci. For example, the difference between northern and southern regions is not as strong in some loci (i.e., Psy 6 and 17), and Lower Galilee has a low mean in Psy 3 but a high mean in all other loci (Figure 2).
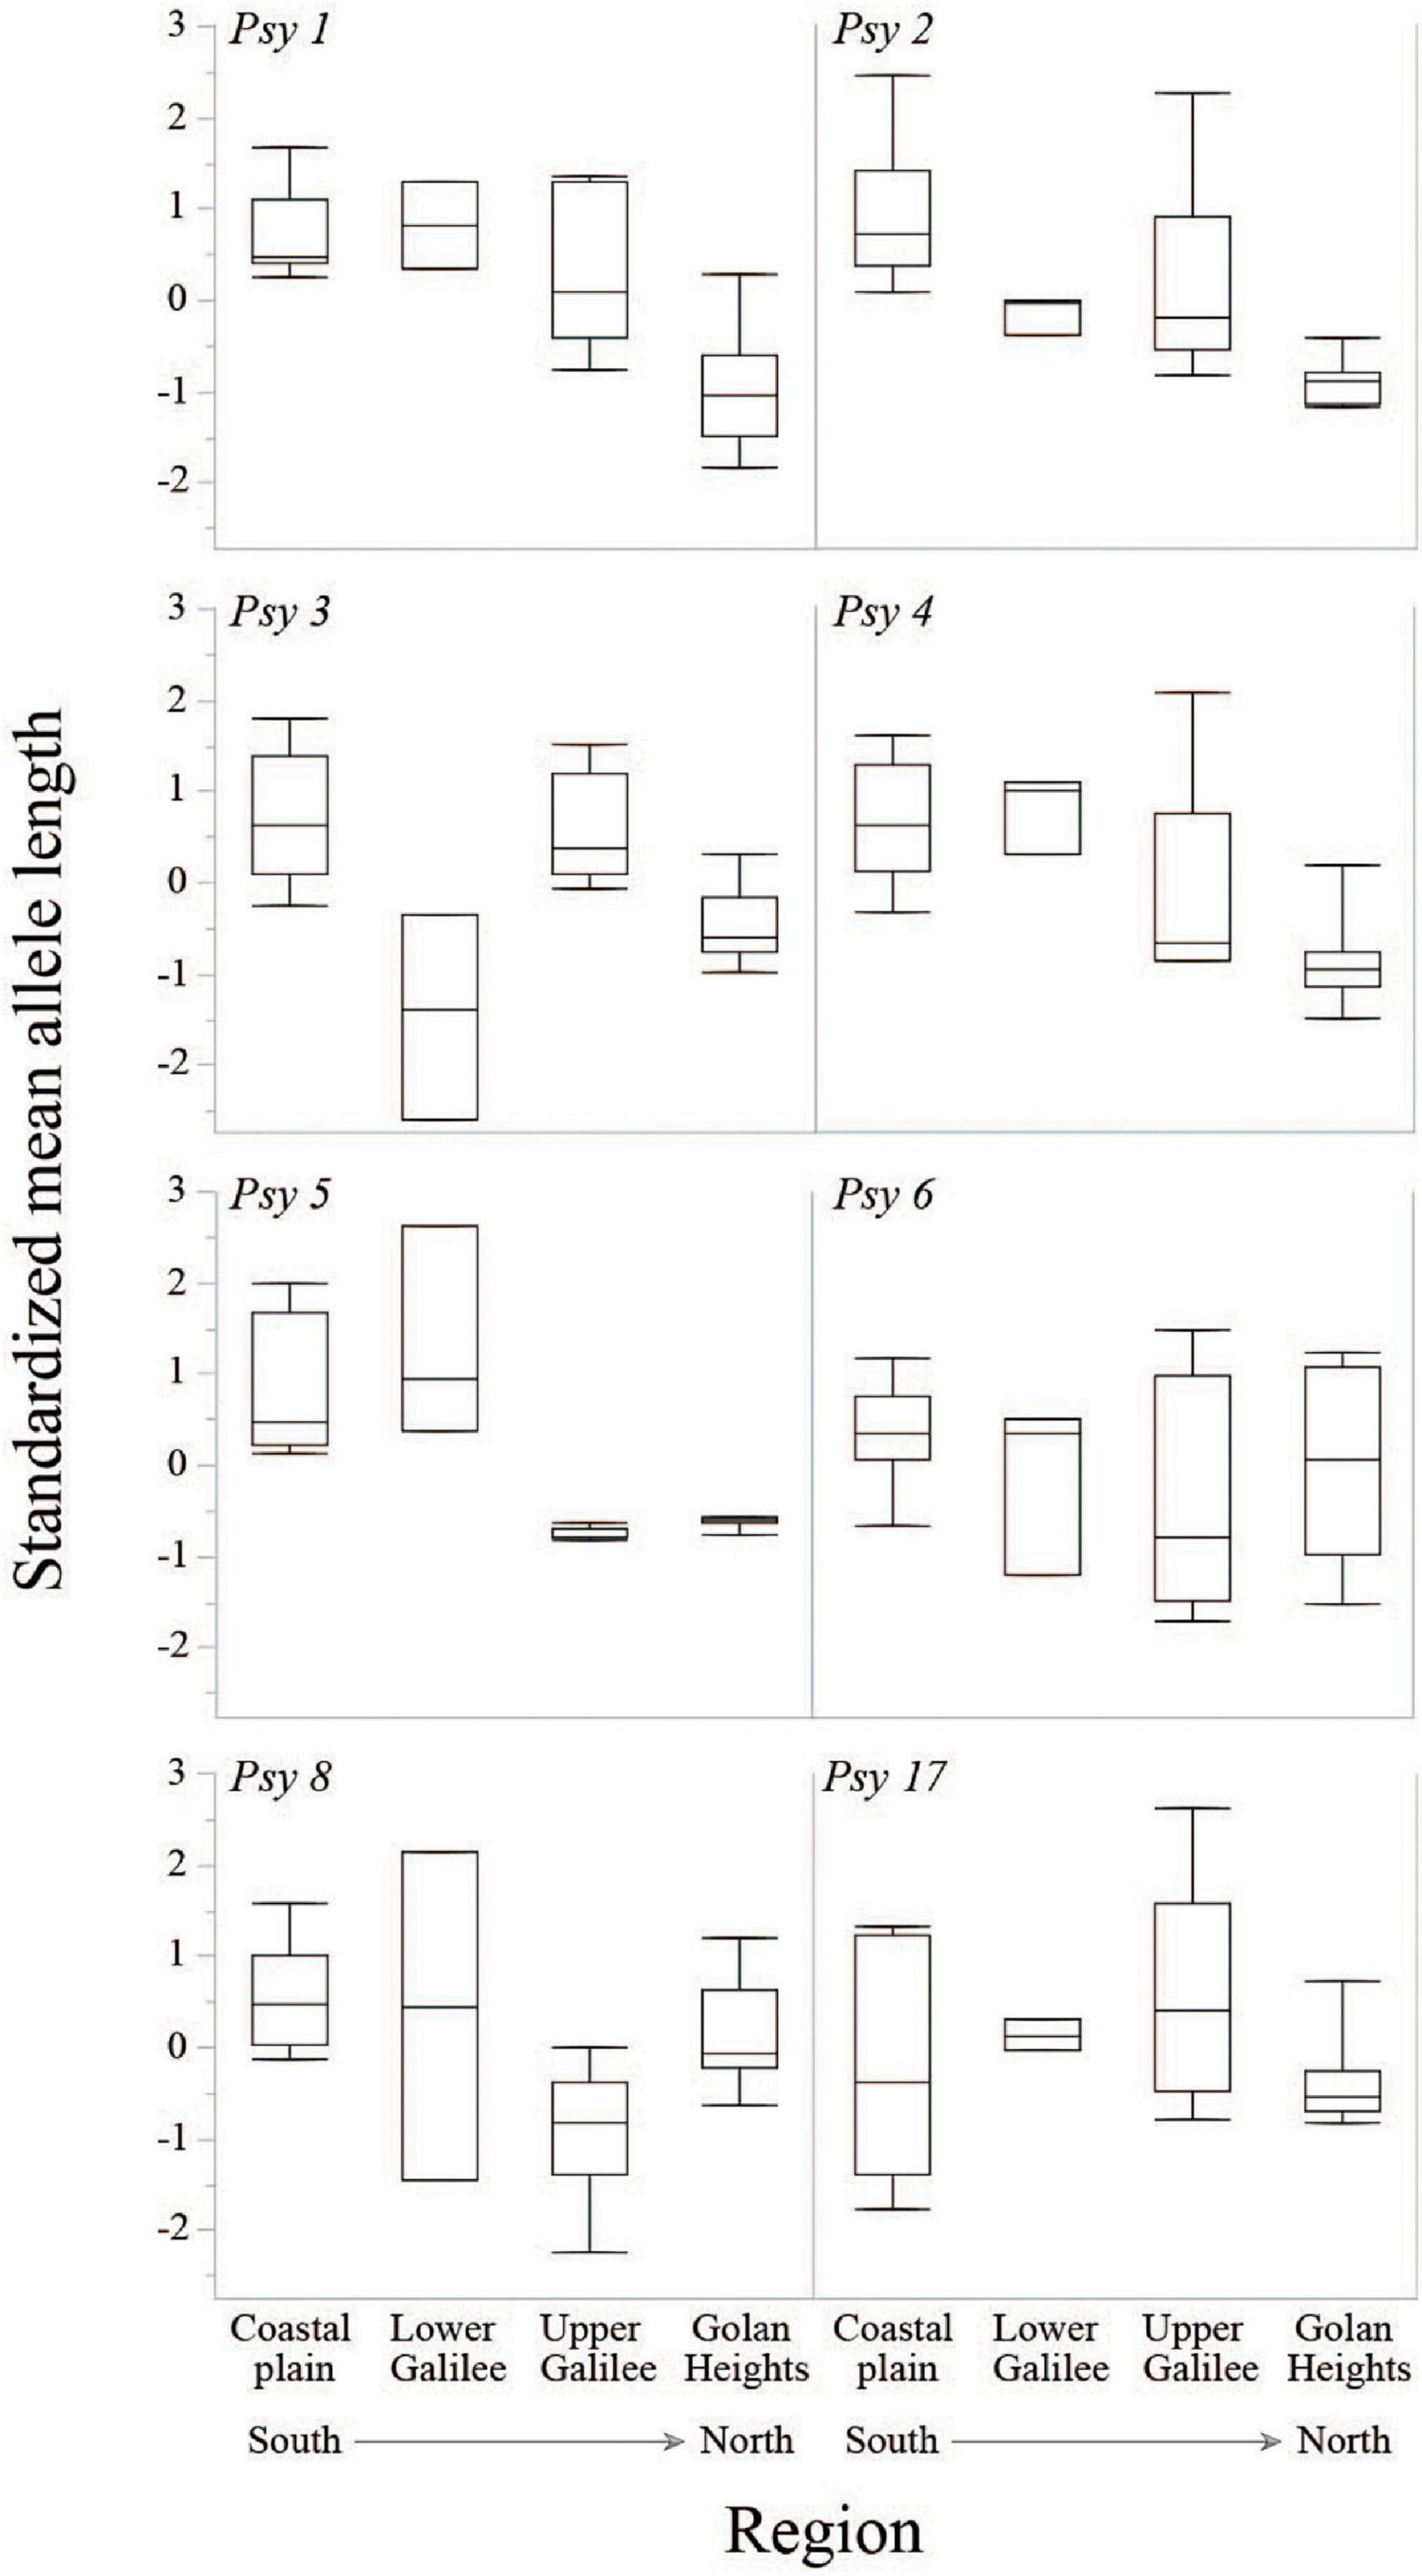
Figure 2. Quantile box plots for standardized mean allele length for region and locus. Regions are ordered from south to north.
Results of the STRUCTURE analysis using two different models of ancestry and allele frequency were very similar (i.e., similar number of pool clusters). We selected to use the results of the more biologically realistic model, the admixture-correlated model. The most likely clustering according to ΔK included eight clusters (Supplementary Table 6 and Supplementary Figure 3). Pools in the coastal plain were clustered together, except for the most southern pool (CQ). The pools in the Upper Galilee were also grouped into one cluster. The pools in the Golan Heights, however, were divided in this analysis into four clusters.
The Nei’s DA distance also showed a clear division of the pools according to geography (Figures 1A–C). The PROXCAL MDS plot (Figure 1B) shows three clear clusters (Golan Heights, Upper Galilee, and coastal plain/Lower Galilee), which accounted for 98.5% of the genetic variation (stress = 0.03). Further, the minimum spanning network connected most pools according to their geographical position (Figure 1C). The Lower Galilee (LB, LD) and Samaria (SF) pools deviated from this trend and were clustered with the coastal plain pools.
Analysis of asymmetric migration rate showed that in all pools most breeding individuals were originated from their natal pool (84.6% ± 10.6), and the rate of migration between pools was generally low (1.2% ± 1.9 and 1.7% ± 3.1 of individual were migrants in a given pool for northern and southern pools, respectively; Supplementary Table 7).
Climate and habitat effects on allele length variation and diversity
In Figure 1, we provided a spatial projection of the three climatic variables (annual maximum January temperature, annual rainfall, and annual rainy days) that most influenced amphibian breeding in the study area. We also present the spatial projection of annual CV, a measure of climatic stability, for these climatic variables. Temperature, rainfall, and number of rainy days all range widely on a gradient from north to south. Mean maximum temperature in January is about 13°C at the northernmost pools and 17.5°C at the southernmost pools (Figure 1D). Rainfall averages about 870 mm at the northern pools but only 430 mm at the southern pools (Figure 1E). The number of rainy days at the northern pools averages about 63 days, while at the southern pools it averages about 43 days (Figure 1F). Maximum temperature during January becomes less stable with increasing elevation, with coastal locations experiencing more stable temperatures among years (Figure 1G). Rainfall (Figure 1H) and the number of rainy days (Figure 1I) become less consistent among years toward the south.
To determine whether geography, soil type (i.e., habitat), and climate characteristics can explain the variation in pool allele length, we tested for association between Nei’s DA (i.e., a distance matrix between pools based on allele length) and a set of predictors, using dbRDA (Table 2 and Figure 3). The marginal tests showed that all predictors, except climate CV PC1, were significantly correlated with the Nei’s DA distance, and that geography, climate, and climate CV (PC2) each accounted for at least 50% of the variance in the DA distance matrix. In the sequential test, we ordered the predictors such that the geography predictor (i.e., isolation by distance and founder effect hypotheses) was entered first into the model, and the climatic predictors (i.e., natural selection and stress-induced mutagenesis hypotheses) were entered last. Geography significantly accounted for 59% and climate accounted for an additional 14% of the variance in the DA distance. All the other predictors did not account for any unique variation that was not already explained by geography and climate (Table 2). The dbRDA ordination diagram demonstrates that geography and the climatic factors account for separate trajectories in the variation of the DA projected data (Figure 3). Using the same dbRDA model with the (δμ)2 distance revealed both geography (56%, P = 0.001) and climate (13%, P = 0.003) also to be significant effects.
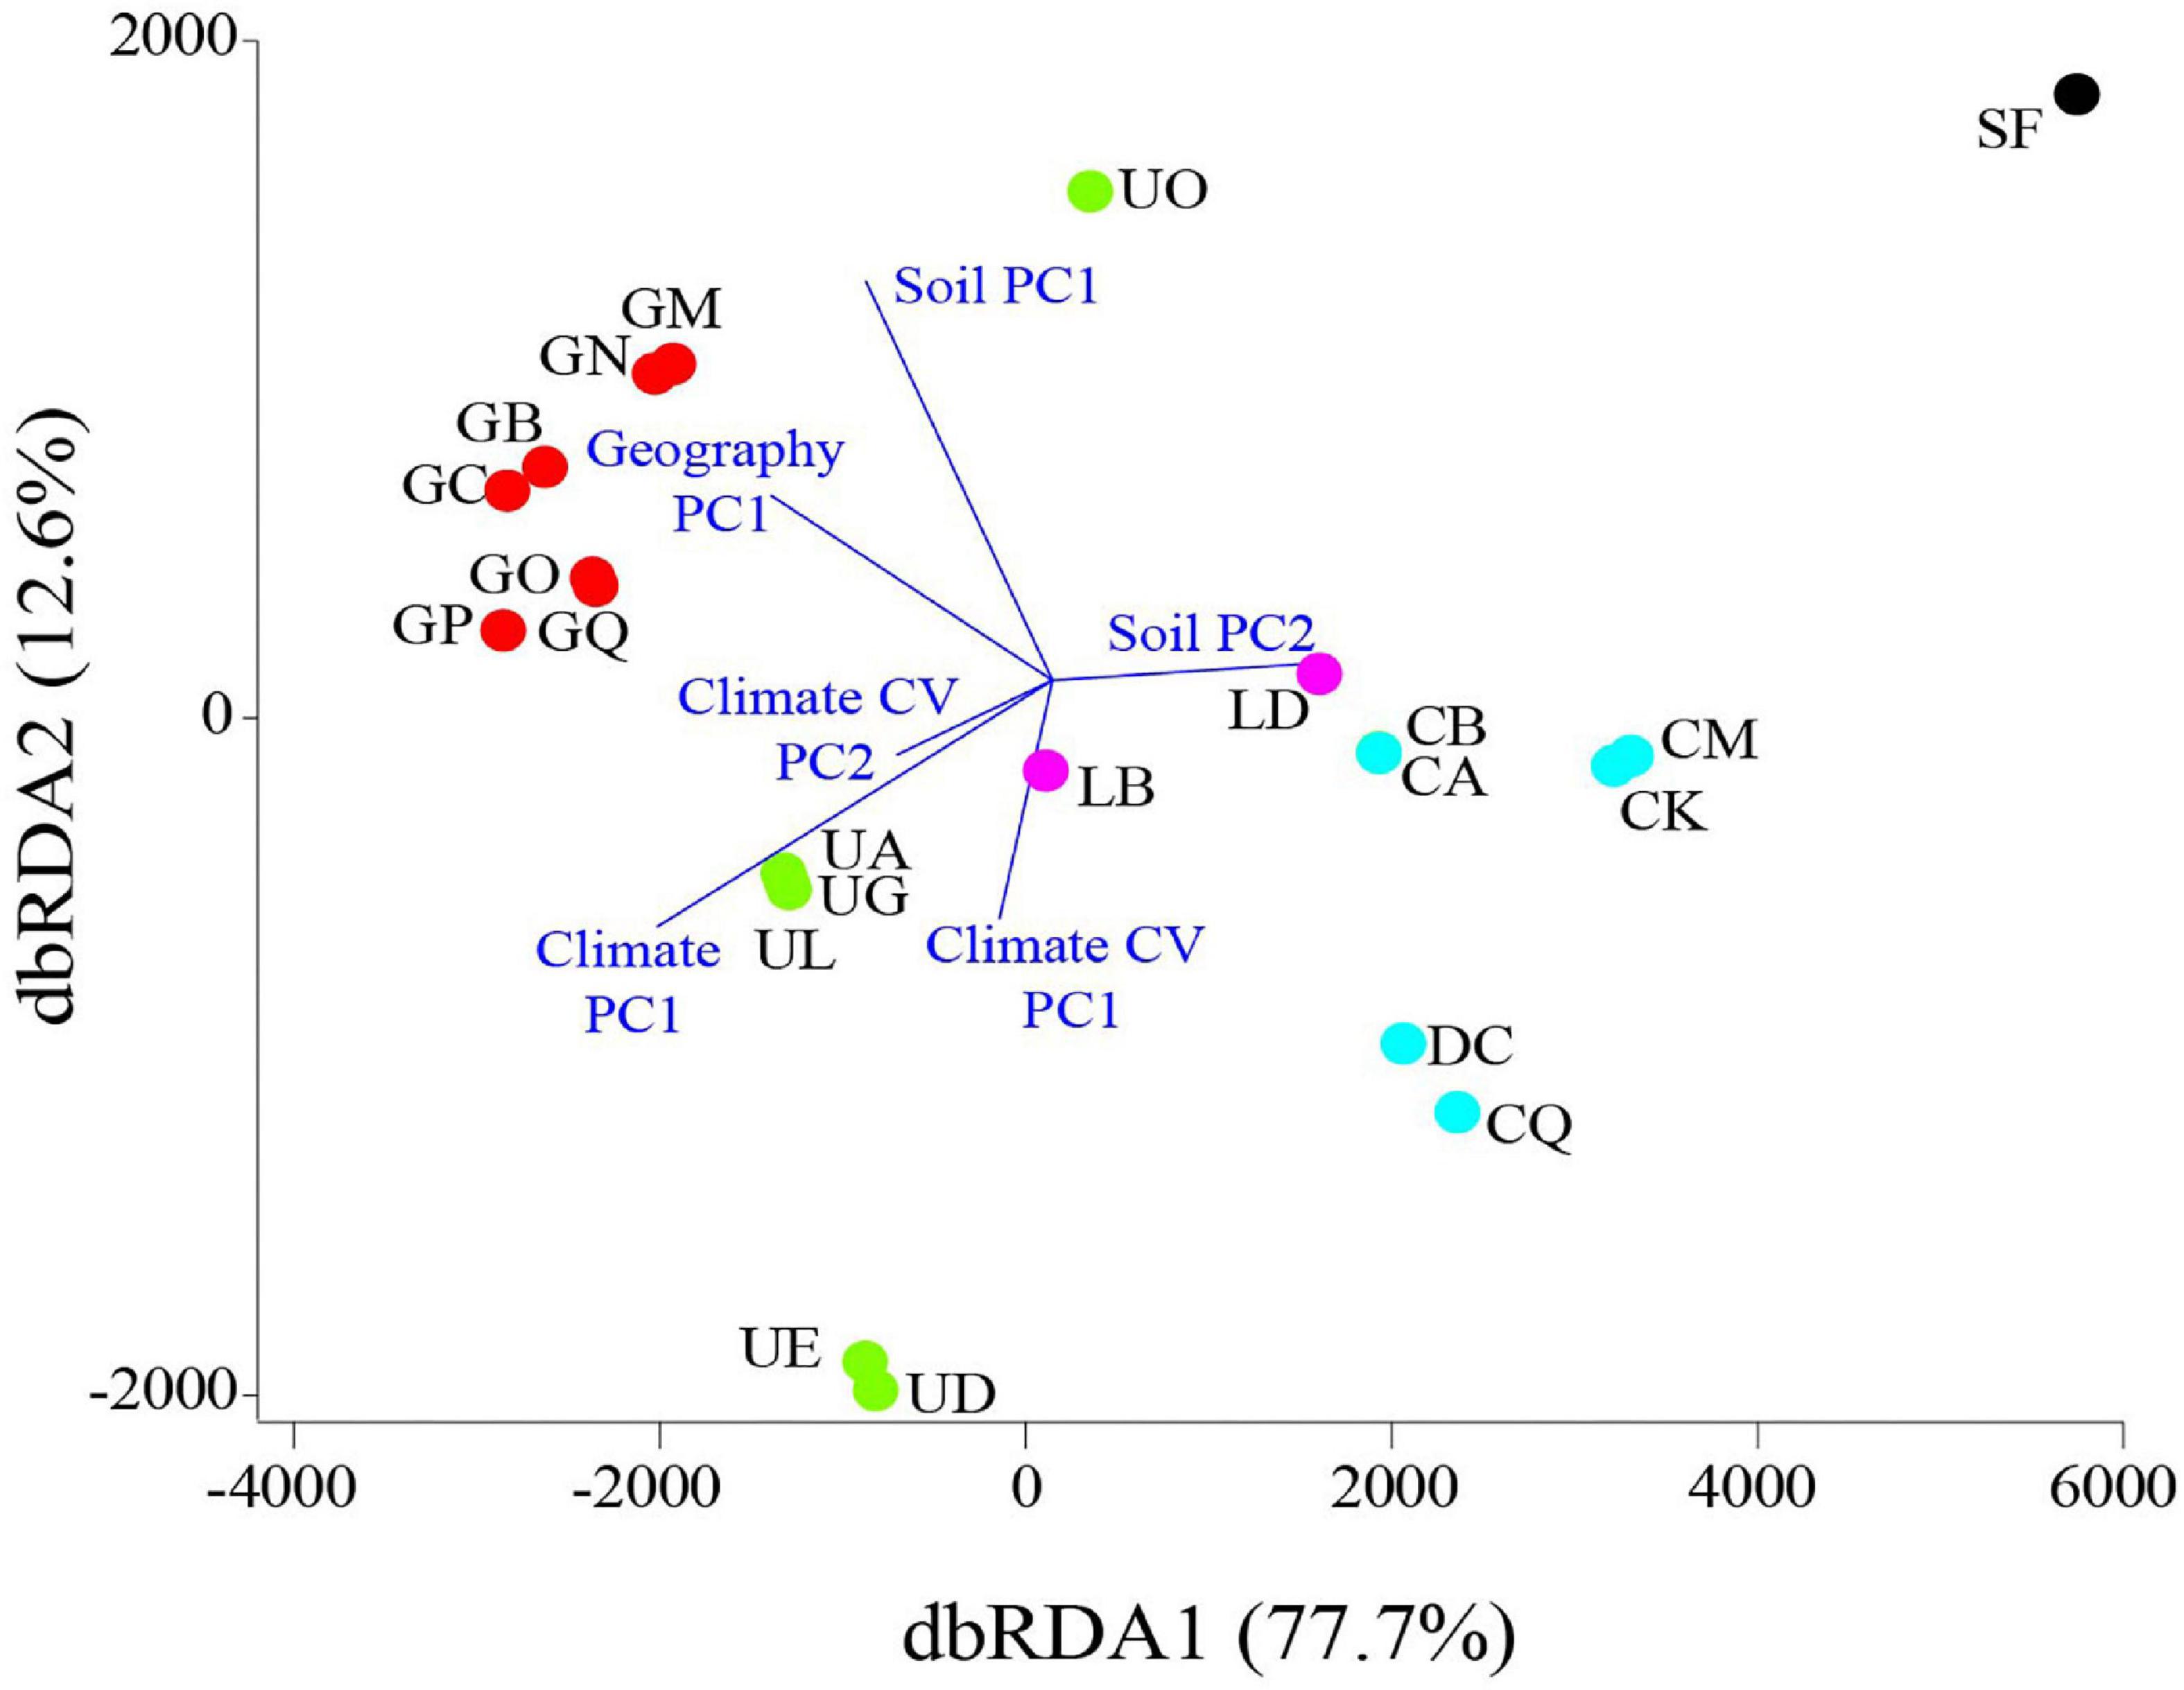
Figure 3. Distance-based Redundancy analysis (dbRDA) ordination diagram for the geography PC1, soil PC1 and PC2, climate PC1, and the climate CV predictors. The location scores on the first two dbRDA dimensions are denoted by region-colored circles (legend in Figure 1), and the vector overlays are denoted in blue. The size and direction of each vector is representative of the strength and direction of influence of it in the model.
Additional dbRDA locus-by-locus models revealed that for specific loci the Nei’s DA distance was significantly influenced by the geography of pools [Psy 1: F(20) = 50.5, P = 0.001; Psy 2: F(20) = 18.1, P = 0.007; Psy 4: F(20) = 16.0, P = 0.007; Psy 5: F(20) = 22.8, P = 0.002], soil composition [Psy 1: PC2, F(18) = 18.8, P = 0.041; Psy 2: PC1, F(19) = 18.9, P = 0.024; Psy 8: PC1, F(19) = 10.9, P = 0.043 and PC2, F(18) = 47.3, P = 0.019], and climate [Psy 3: F(17) = 21.4, P = 0.024; Psy 5: F(17) = 54.2, P = 0.001]. Psy 6 and Psy 17 were not significantly influenced by any of the predictors.
Since the heterozygote instability and the genetic drift hypotheses are both associated with population demography, we also explored the association between the above predictors and Ho, HR and NR; all of which could reflect on population size or the presence of a bottleneck (Table 1). Ho was not significantly associated with the Nei’s DA matrix [dbRDA marginal test: F(20) = 0.0, P = 0.999]. HR and NR were not significantly associated with the geography of pools (F = 0.5, P ≥ 0.36 in both models; Table 3). For Ho, only loci Psy 2 and 5 were significantly associated with geography (Supplementary Figure 4). However, both NR and HR were positively associated with climate PC1, soil PC1, and climate CV PC1, and negatively associated with soil PC2 (Table 3 and Supplementary Figure 4). Psy 5 was the only locus that did not associate with climate for HR and NR, and the only locus negatively associated with climate for Ho (Supplementary Figure 4). In other words, genetic diversity (i.e., HR and NR) in seven out of eight loci was associated with climate and soil variation. Most importantly, the total effect in these models showed that climate is by far (0.56–0.57) the most influential effect on HR and NR (Table 3). Ho was most affected by the difference between loci (total effect = 0.725), and secondly by the climate variation (total effect = 0.391).
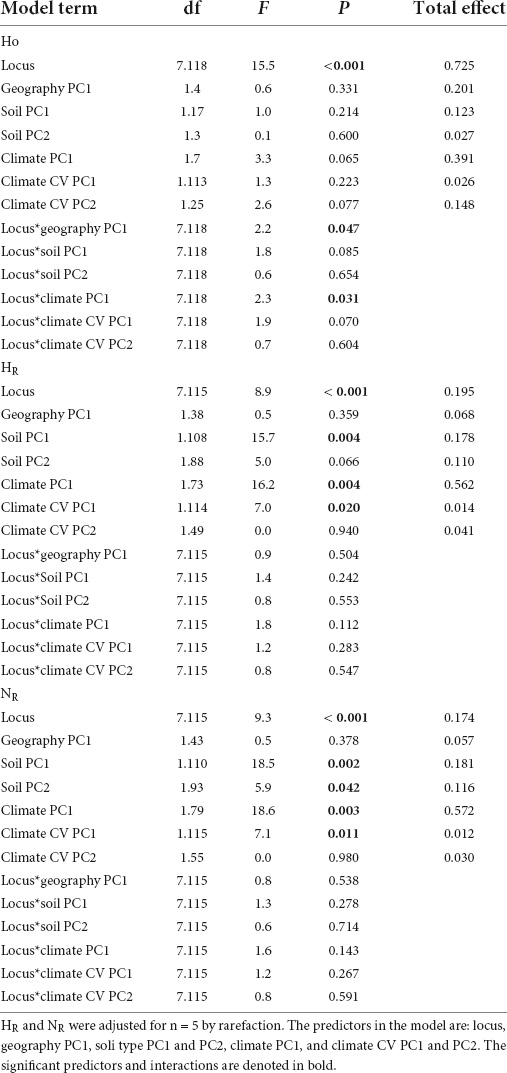
Table 3. Mixed-model results (coefficient ± SE, F, P, and total effect) for observed heterozygosity (Ho), Shannon’s diversity (HR), and allelic richness (NR).
Ne and diversity associations
Finally, we also tested for regional differences in effective population size (i.e., Ne) in order to directly address the predictions of the heterozygote instability and the genetic drift hypotheses. Ne estimates (i.e., log-transformed contemporary effective population size; Supplementary Table 8) from the co-ancestry model [GLMM; F(3, 15) = 0.51, P = 0.684] and the bias-corrected linkage disequilibrium (LD) model [F(3, 17) = 0.06, P = 0.978] did not significantly differ between regions. Further, neither of the Ne estimates significantly correlated with Ho [co-ancestry model: r = 0.21, F(1, 17) = 1.02, P = 0.326; linkage disequilibrium model: r = 0.09, F(1, 6) = 0.78, P = 0.409], HR [co-ancestry model: r = 0.36, F(1, 16) = 02.55, P = 0.129; linkage disequilibrium model: r = 0.33, F(1, 17) = = 2.03, P = 0.172], and NR [co-ancestry model: r = 0.36, F(1, 17) = 2.48, P = 0.134; linkage disequilibrium model: r = 0.36, F(1, 17) = 2.45, P = 0.136].
Discussion
A latitudinal cline was found in allele length along the distribution range of P. syriacus in Israel: alleles were shorter on average in the northern populations, where environmental conditions are more suitable for amphibians (e.g., rainfall is higher), and longer alleles were more frequent in edge populations, where environmental conditions are less suitable. Overall, the dbRDA results suggested geography and climate as the key predictors for the variation in allele length. The variation in NR and HR was explained by the environmental predictors, while geography (i.e., isolation by distance) showed an insignificant effect. Climate stability (i.e., CV) was shown in these analyses to be a poor predictor of allele length and diversity.
The level of microsatellite variability is determined by several characteristics. Whereas most tandem repeats are unstable compared to non-repeated DNA stretches, the mutation rates can vary widely between loci, ranging from 10–3 to 10–7 per cell division (Gemayel et al., 2010). The close proximity of multiple nearly identical DNA sequences causes frequent recombination or slippage events, generating new alleles that differ in the number of repeat units. A model by Legendre et al. (2007) of the variability of tandem repeats suggested, first, that variation in the number of repeats increases exponentially with increasing number of repeat units; second, that repeat variability increases with increasing unit length; and third, that repeat instability increases with increasing purity (i.e., misalignment of the different repeat units). Higher mutation rates at longer microsatellites have been shown in bacteria, chickens, chimpanzees, and humans (Whittaker et al., 2003; Brandström and Ellegren, 2008; Kelkar et al., 2008; McDonald et al., 2011; Payseur et al., 2011).
Latitudinal clines in microsatellite allele length that correlate with environmental conditions have been previously found in fungi (Michael et al., 2007) and birds (Johnsen et al., 2007), in the genes regulating the circadian clock. Longer alleles, which are more common in P. syriacus edge populations, are prone to higher instability. This higher instability can potentially lead to phenotypic diversity. Thus, higher microsatellite instability can be an adaptive advantage under the fluctuating environmental conditions existing in the periphery (e.g., Munwes et al., 2011). In other words, long microsatellite loci could be considered local mutators. Second-order selection could favor the spread of such local mutators during adaptive evolution, through hitchhiking together with the favorable phenotypes they generate (Kashi and King, 2006).
In the Introduction, we posited four hypotheses for the observed latitudinal cline in allele lengths, and below we examine the evidence supporting each one of these.
Genetic drift and heterozygote instability
Under these hypotheses we expected to observe a correlation between Ne and diversity, and in the case of heterozygote instability, a correlation with mean allele length (the sign of this correlation may be either negative or positive). Our data analyses revealed an increase in allele length from northern to southern populations, but this change in allele length was not significantly correlated with Ho levels nor with Ne. Ne was similar among the four geographic regions using both estimates (i.e., from the co-ancestry and the LD models) and did not significantly correlate with any of the diversity measures. Furthermore, pool tadpole population densities in the south (i.e., edge of distribution) were not significantly lower than those of the pools in the north of Israel (Munwes et al., 2010). The lack of difference in Ne between regions and the lack of correlation between Ne and allele diversity do not fit the key prediction of the genetic drift hypothesis: lower genetic variation in pools of small Ne. Moreover, the lack of correlation between Ne and allele size variation does not fit the prediction of the heterozygote instability hypothesis. Finally, the Ho and diversity measures did not significantly correlate with geographic distance, the effect size for geographic distance was small, and its model estimates did not differ from zero.
Stress-induced mutagenesis
Under this hypothesis we expected allelic diversity to positively correlate with environmental stress, regardless of population size and heterozygosity level, while mean allele length could either increase or decrease with stress. In this study, stress was considered to be correlated with an environmental gradient (from mild to harsh) or with the annual stability of environmental conditions (e.g., temperature, rainfall), measured by coefficient of variation over years. Our results revealed that allelic diversity significantly varied with the climate but not with the climatic stability predictors (Table 2 and Figure 3). The harsher living conditions in the south (i.e., at the distribution edge; Munwes et al., 2010) are expected to result in a higher mutation rate, which is expressed by longer alleles (e.g., Whittaker et al., 2003). The similar range of allele sizes found in the different regions along the gradient was not predicted by this hypothesis but could be explained by the more intense selection in the southern populations that restricted a wider range of alleles. Further, microsatellite diversity in the southern populations, where climatic conditions for P. syriacus survival and breeding are marginal (Munwes et al., 2010), were similar to those of the northern populations, contrasting with the prediction of the stress-induced mutagenesis hypothesis of higher microsatellite diversity in the southern populations.
Natural selection
Under this hypothesis (i.e., direct selection, where alleles are either longer or shorter with gradient), we expected allele length to negatively or positively correlate with a climatic or environmental gradient or with environmental stability, independent of genetic diversity or heterozygosity. Overall, our results revealed that climate had a strong significant effect on allele length. The amount of rainfall is a predictor for the hydroperiod (i.e., the duration of water availability in the vernal pool), and the number of rainy days is a key signal for the onset of breeding in P. syriacus (Gafny, 1986; Munwes et al., 2010). Our results are in line with those of other recent other studies and reviews that have provided evidence of an association between genetic structure and the environment (e.g., Schmidt and Anderson, 2006; McCairns and Bernatchez, 2008; Ortego et al., 2012; Stojak et al., 2019). Further support for an environmental effect on microsatellite variation comes from the study by Cohen et al. (2021), which revealed a significant correlation between climatic variation among successive years, primarily the amount of rainfall and number of rainy days, and both microsatellite allelic composition and diversity (15% of the total explained genetic variance). Cohen et al. (2021) sampled seven rain pools, which we also sampled for the present study, making their earlier study’s results highly relevant. However, explaining our results according to the natural selection hypothesis is currently controversial, as most microsatellite loci in the genome are generally thought to be neutral, with allele length changing due to drift.
Another interesting result was that geographical distance (i.e., IBD) showed a strong correlation with variation in allele length among pools but not with allele diversity. In our system, climate explained much of the variation in pool allele diversity. Notably, P. syriacus is a highly philopatric species (Gafny, 1986); a fact supported by the exceptionally low rates of migration we calculated among vernal pools (Supplementary Table 7). Furthermore, in the recent past (i.e., late nineteenth century) the temporary wetland habitat during winter was vast and continuous, enabling individual toads unrestricted migration to nearby pools (Levin et al., 2009). Over the past 150 years, the wetland habitat, mostly in the coastal plain, has dramatically declined (> 90%), resulting in the physical isolation of temporary pools. Given the toads’ philopatric behavior and the loss of wetlands, we expected a strong signature of isolation by distance, which was indeed observed in the allele length variation. However, we also found that the effect of climate was meaningful (i.e., 14% of the variation in allele length). These findings concur with those of Munwes et al. (2010), who showed that soil type and hydroperiod were both predictors of mtDNA substructure for a similar set of pools, and together accounted for 25% of the variance in genetic distances between pools. Such variation in pool diversity measures is often associated with population size and founder effect, which are also related to the location of pools relative to the core of distribution. In the present study system, we did not detect differences in contemporary Ne, and the variation in allele diversity between pools was largely explained by the climate regime.
Study limitations
Although we have associated genetic structure and microsatellite allele length variation with climatic predictors, our interpretation has several limitations that should be considered. First, we selected eight loci on the basis of the observed variability, thus relating to those loci that were highly variable to start with. This was done to obtain sufficient power for our analyses. Although it is unlikely that allele range is associated with function (e.g., control of genes), the processes governing loci at the extreme variability range may differ from random. Second, our study was limited both in the number of loci and locations, and in the geographic span, although it had the advantages of a sharp environmental gradient and a suitable model animal. Last, we do not know the genomic position of the microsatellite loci we used and cannot link between these loci and functionality, making our support for the natural selection hypothesis partial. The discussion of whether natural selection, heterozygote instability, drift, or stress-induced mutagenesis are important processes that drive allele size variation thus continues. While our findings do not provide a definitive answer, they do suggest a role for the physical environment. Follow-up studies combining suitable model systems located in sharp environmental gradients, accurate information on microsatellite position in the genome and their association with expression and function of nearby genes, together with experimental work, are needed in order to better understand how environmental variation affects microsatellite allele length and diversity under natural conditions.
Data availability statement
The original contributions presented in the study are included in the article/Supplementary material. Further inquiries can be directed to the corresponding author/s.
Ethics statement
This study was conducted with permits from the Israeli Nature and Parks Authority for capturing and sampling populations of the eastern spadefoot toad across Israel (2012/38376, 2013/39322, and 2015/40845). All procedures performed in this study were in accordance with the ethical standards of the State of Israel.
Author contributions
SG and EG designed the project. OC, SG, and EG collected the samples in the field. OC conducted all the genetic analysis in the lab. OC, YR, and EG obtained the climatic data and conducted the statistical analyses. OC and EG drafted the manuscript, and created the figures. All authors contributed to data interpretation and writing of the manuscript.
Funding
This research was supported by Tel Aviv University and Ruppin Academic Center internal funds.
Acknowledgments
We would like to thank Bina Perl and Naomi Paz for their constructive and editorial comments, Yishai A. Weissman and Michal Sasson for their dedicated assistance with sampling tadpoles and with laboratory procedures, and Hadi Ben Eliyahu, Yael Ballon, Liron Goren, Oren Kolodny, and Talya Oron for assistance in the field.
Conflict of interest
The authors declare that the research was conducted in the absence of any commercial or financial relationships that could be construed as a potential conflict of interest.
Publisher’s note
All claims expressed in this article are solely those of the authors and do not necessarily represent those of their affiliated organizations, or those of the publisher, the editors and the reviewers. Any product that may be evaluated in this article, or claim that may be made by its manufacturer, is not guaranteed or endorsed by the publisher.
Supplementary material
The Supplementary Material for this article can be found online at: https://www.frontiersin.org/articles/10.3389/fevo.2022.893856/full#supplementary-material
Supplementary Data 1. Microsatellite data.
Supplementary Data 2. Environment variables per pool.
References
Agasyan, A., Tuniyev, B., Isailovic, J. C., Lymberakis, P., Andrén, C., Cogalniceanu, D., et al. (2009). Pelobates syriacus. The IUCN red list of threatened species. e.T58053A11723334.
Amos, W. (2010). Heterozygosity and mutation rate: Evidence for an interaction and its implications. BioEssays 32, 82–90. doi: 10.1002/bies.200900108
Amos, W. (2016). Heterozygosity increases microsatellite mutation rate. Biol. Lett. 12:20150929. doi: 10.1098/rsbl.2015.0929
Amos, W., and Clarke, A. (2008). Body temperature predicts maximum microsatellite length in mammals. Biol. Lett. 4, 399–401. doi: 10.1098/rsbl.2008.0209
Amos, W., Flint, J., and Xu, X. (2008). Heterozygosity increases microsatellite mutation rate, linking it to demographic history. BMC Genet. 9:72. doi: 10.1186/1471-2156-9-72
Amos, W., Sawcer, S. J., Feakes, R., and Rubinsztein, D. C. (1996). Microsatellites show mutational bias and heterozygote instability. Nat. Genet. 13, 390–391. doi: 10.1038/ng0896-390
Bjedov, I., Tenaillon, O., G´erard, B., Souza, V., Denamur, E., Radman, M., et al. (2003). Stress-induced mutagenesis in bacteria. Science 300, 1404–1409. doi: 10.1126/science.1082240
Brandström, M., and Ellegren, H. (2008). Genome-wide analysis of microsatellite polymorphism in chicken circumventing the ascertainment bias. Genome Res. 18, 881–887. doi: 10.1101/gr.075242.107
Bristow, R. G., and Hill, R. P. (2008). Hypoxia and metabolism. Hypoxia, DNA repair and genetic instability. Nat. Rev. Cancer 8, 180–192. doi: 10.1038/nrc2344
Brittain, A., Stroebele, E., and Erives, A. (2014). microsatellite repeat instability fuels evolution of embryonic enhancers in Hawaiian drosophila. PLoS One 9:e101177. doi: 10.1371/journal.pone.0101177
Chao, A., Gotelli, N. J., Hsieh, T. C., Sander, E. L., Ma, K. H., Colwell, R. K., et al. (2014). Rarefaction and extrapolation with Hill numbers: A framework for sampling and estimation in species diversity studies. Ecol. Monog. 84, 45–67. doi: 10.1890/13-0133.1
Charlesworth, B., Sniegowski, P., and Stephan, W. (1994). The evolutionary dynamics of repetitive DNA in eukaryotes. Nature 371, 215–220. doi: 10.1038/371215a0
Cohen, O., Ram, Y., Hadany, L., Gafny, S., and Geffen, E. (2021). Annual climatic fluctuations and short-term genetic variation in the eastern spadefoot toad. Sci. Rep. 11:13514. doi: 10.1038/s41598-021-92696-w
Commandeur, J. J. F., and Heiser, W. J. (1993). Mathematical derivations in the proximity scaling (PROXSCAL) of symmetric data matrices. Leiden: Department of Data Theory, Leiden University.
Do, C., Waples, R. S., Peel, D., Macbeth, G. M., Tillett, B. J., and Ovenden, J. R. (2014). NeEstimator V2: Re-implementation of software for the estimation of contemporary effective population size (Ne) from genetic data. Mol. Ecol. Res. 14, 209–214. doi: 10.1111/1755-0998.12157
Earl, D. A., and von Holdt, B. M. (2012) Structure harvester: A website and program for visualizing STRUCTURE output and implementing the evanno method. Conserv. Genet. Resour. 4, 359–361. doi: 10.1007/s12686-011-9548-7
Evanno, G., Regnaut, S., and Goudet, J. (2005). Detecting the number of clusters of individuals using the software STRUCTURE: A simulation study. Mol. Ecol. 14, 2611–2620. doi: 10.1111/j.1365-294X.2005.02553.x
Excoffier, L., and Smouse, P. (1994). Using allele frequencies and geographic subdivision to reconstruct gene trees within a species – molecular variance parsimony. Genetics 136, 343–359. doi: 10.1093/genetics/136.1.343
Excoffier, L., Laval, G., and Schneider, S. (2005). Arlequin ver. 3.0: An integrated software package for population genetics data analysis. Evol. Bioinform. 1, 47–50. doi: 10.1177/117693430500100003
Faircloth, B. C. (2008). MSATCOMMANDER: Detection of microsatellite repeat arrays and automated, locus-specific primer design. Mol. Ecol. Res. 8, 92–94. doi: 10.1111/j.1471-8286.2007.01884.x
Forche, A., Abbey, D., Pisithkul, T., Weinzierl, M. A., Ringstrom, T., Bruck, D., et al. (2011). Stress alters rates and types of loss of heterozygosity in Candida albicans. mBio 2, e00129–11. doi: 10.1128/mBio.00129-11
Gafny, S. (1986). The biology and ecology of the Syrian spadefoot toad Pelobates syriacus in Israel. M.Sc thesis. Tel Aviv: Tel Aviv University.
Galhardo, R. S., Hastings, P. J., and Rosenberg, S. M. (2007). Mutation as a stress response and the regulation of evolvability. Crit. Rev. Biochem. Mol. Biol. 42, 399–435. doi: 10.1080/10409230701648502
Gao, C., Ren, X., Mason, A. S., Li, J. N., Wang, W., Xiao, M. L., et al. (2013). Revisiting an important component of plant genomes: Microsatellites. Funct. Plant Biol. 40, 645–661. doi: 10.1071/FP12325
Garrido-Ramos, M. A. (2017). Satellite DNA: An evolving topic. Genes 8:230. doi: 10.3390/genes8090230
Gemayel, R., Vinces, M. D., Legendre, M., and Verstrepen, K. J. (2010). Variable tandem repeats accelerate evolution of coding and regulatory sequences. Ann. Rev. Genet. 44, 445–477. doi: 10.1146/annurev-genet-072610-155046
Goldstein, D. B., Ruiz Linares, A., Cavalli-Sforza, L. L., and Feldman, M. W. (1995). Genetic absolute dating based on microsatellites and the origin of modern humans. Proc. Natl. Acad. Sci. U.S.A. 92, 6723–6727. doi: 10.1073/pnas.92.15.6723
Hammer, Ø, Harper, D. A. T., and Ryan, P. D. (2001). PAST: Paleontological statistics software package for education and data analysis. Palaeont. Electron. 4, 1–9.
Hannan, A. J. (2012). Tandem repeat polymorphisms: Mediators of genetic plasticity, modulators of biological diversity and dynamic sources of disease susceptibility. Adv. Exp. Medi. Biol. 769, 1–9. doi: 10.1007/978-1-4614-5434-2_1
Harris, R. S., Feng, G., Ross, K. J., Sidhu, R., Thulin, C., Longerich, S., et al. (1997). Mismatch repair protein MutL becomes limiting during stationary-phase mutation. Genes Dev. 11, 2426–2437. doi: 10.1101/gad.11.18.2426
Heidenreich, E. (2007). Adaptive mutation in Saccharomyces cerevisiae. Crit. Rev. Biochem. Mol. Biol. 42, 285–311. doi: 10.1080/10409230701507773
Hollar, A. R., Choi, J., Grimm, A. T., and Buchholz, D. R. (2011). Higher thyroid hormone receptor expression correlates with short larval periods in spadefoot toads and increases metamorphic rate. Gen. Comp. Endocrinol. 173, 190–198. doi: 10.1016/j.ygcen.2011.05.013
Johnsen, A., Fidler, A. E., Kuhn, S., Carter, K. L., Hoffmann, A., Barr, I. R., et al. (2007). Avian clock gene polymorphism: Evidence for a latitudinal cline in allele frequencies. Mol. Ecol. 16, 4867–4880. doi: 10.1111/j.1365-294X.2007.03552.x
Kaiser, H. F. (1960). The application of electronic computers to factor analysis. Educ. Psychol. Meas. 20, 141–151. doi: 10.1177/001316446002000116
Kalinowski, S. T., Wagner, A. P., and Taper, M. L. (2006). ML-RELATE: A computer program for maximum likelihood estimation of relatedness and relationship. Mol. Ecol. Notes 6, 576–579. doi: 10.1111/j.1471-8286.2006.01256.x
Kashi, Y., and King, D. G. (2006). Simple sequence repeats as advantageous mutators in evolution. Trends Genet. 22, 253–259. doi: 10.1016/j.tig.2006.03.005
Kelkar, Y. D., Tyekucheva, S., Chiaromonte, F., and Makova, K. D. (2008). The genome-wide determinants of human and chimpanzee microsatellite evolution. Genome Res. 18, 30–38. doi: 10.1101/gr.7113408
Kimura, M., and Crow, J. F. (1964). The number of alleles that can be maintained in a finite population. Genetics 49, 725–738.
Legendre, M., Pochet, N., Pak, T., and Verstrepen, K. J. (2007). Sequence-based estimation of minisatellite and microsatellite repeat variability. Genome Res. 17, 1787–1796. doi: 10.1101/gr.6554007
Legendre, P., and Anderson, M. J. (1999). Distance-based redundancy analysis: Testing multispecies responses in multifactorial ecological experiments. Ecol. Monog. 69, 1–24.
Levin, N., Elron, E., and Gasith, A. (2009). Decline of wetland ecosystems in the coastal plain of Israel during the 20th century: Implications for wetland conservation and management. Landscape Urban Plan. 92, 220–232. doi: 10.1016/j.landurbplan.2009.05.009
McArdle, B. H., and Anderson, M. J. (2001). Fitting multivariate models to community data: A comment on distance-based redundancy analysis. Ecology 82, 290–297.
McCairns, R. J. S., and Bernatchez, L. (2008). Landscape genetic analyses reveal cryptic population structure and putative selection gradients in a large-scale estuarine environment. Mol. Ecol. 17, 3901–3916. doi: 10.1111/j.1365-294X.2008.03884.x
McDonald, M. J., Wang, W.-C., Huang, H.-D., and Leu, J.-Y. (2011). Clusters of nucleotide substitutions and insertion/deletion mutations are associated with repeat sequences. PLoS Biol. 9:e1000622. doi: 10.1371/journal.pbio.1000622
Michael, T. P., Park, S., Kim, T. S., Booth, J., Byer, A., Sun, Q., et al. (2007). Simple sequence repeats provide a substrate for phenotypic variation in the Neurospora crassa circadian clock. PLoS One 2:e795. doi: 10.1371/journal.pone.0000795
Morey, S., and Reznick, D. A. (2000). A comparative analysis of plasticity ln larval development in three species of spadefoot toads. Ecology 81, 1736–1749.
Munwes, I., Geffen, E., Friedmann, A., Tikochinski, Y., and Gafny, S. (2011). Variation in heteroplasmy and repeat length of the mtDNA control region along a core-edge gradient in the eastern spadefoot toad (Pelobates syriacus). Mol. Ecol. 20, 2878–2887. doi: 10.1111/j.1365-294X.2011.05134.x
Munwes, I., Geffen, E., Roll, U., Friedmann, A., Daya, A., Tikochinski, Y., et al. (2010). The change in genetic diversity down the core-edge gradient in the eastern spadefoot toad (Pelobates syriacus). Mol. Ecol. 19, 2675–2689. doi: 10.1111/j.1365-294X.2010.04712.x
Nei, M., and Li, W. H. (1979). Mathematical model for studying genetic variation in terms of restriction endonucleases. Proc. Natl. Acad. Sci. U.S.A. 76, 5269–5273. doi: 10.1073/pnas.76.10.5269
Nevo, E., Beharav, A., Meyer, R. C., Hackett, C. A., Forster, B. P., Russell, J. R., et al. (2005). Genomic microsatellite adaptive divergence of wild barley by microclimatic stress in ‘Evolution Canyon’, Israel. Biol. J. Linnean. Soc. 84, 205–224. doi: 10.1111/j.1095-8312.2005.00425.x
Nomura, T. (2008). Estimation of effective number of breeders from molecular coancestry of single cohort sample. Evol. Appl. 1, 462–474. doi: 10.1111/j.1752-4571.2008.00015.x
Ortego, J., Riordan, E. C., Gugger, P. F., and Sork, V. L. (2012). Influence of environmental heterogeneity on genetic diversity and structure in an endemic southern Californian oak. Mol. Ecol. 21, 3210–3223. doi: 10.1111/j.1365-294X.2012.05591.x
Payseur, B. A., Jing, P., and Haasl, R. J. (2011). A genomic portrait of human microsatellite variation. Mol. Biol. Evol. 28, 303–312. doi: 10.1093/molbev/msq198
Peakall, R., and Smouse, P. E. (2012). GenAlEx 6.5: Genetic analysis in Excel. Population genetic software for teaching and research–an update. Bioinformatics 28, 2537–2539. doi: 10.1093/bioinformatics/bts460
Pielou, E. C. (1966). The measurement of diversity in different types of biological collections. J. Theo. Biol. 13, 131–144. doi: 10.1016/0022-5193(66)90013-0
Poggio, L., Rosato, M., Chiavarino, A. M., and Naranjo, C. A. (1998). Genome size and environmental correlations in maize (Zea mays, Poaceae). Ann. Bot. 82, 107–115. doi: 10.1006/anbo.1998.0757
Pritchard, J. K., Stephens, M., and Donnelly, P. (2000) Inference of population structure using multilocus genotype data. Genetics 155, 945–959. doi: 10.1093/genetics/155.2.945
Prugnolle, F., Manica, A., and Balloux, F. (2005). Geography predicts neutral genetic diversity of human populations. Curr. Biol. 15, R159–R160. doi: 10.1016/j.cub.2005.02.038
Ram, Y., Altenberg, L., Liberman, U., and Feldman, M. W. (2018). Generation of variation and a modified mean fitness principle: Necessity is the mother of genetic invention. Theor. Pop. Biol. 123, 1–8. doi: 10.1016/j.tpb.2018.02.004
Ram, Y., and Hadany, L. (2012). The evolution of stress-induced hypermutation in asexual populations. Evolution 66, 2315–2328. doi: 10.1111/j.1558-5646.2012.01576.x
Ramachandran, S., Deshpande, O., Roseman, C. C., Rosenberg, N. A., Feldman, M. W., and Cavalli-Sforza, L. L. (2005). Support from the relationship of genetic and geographic distance in human populations for a serial founder effect originating in Africa. Proc. Natl. Acad. Sci. U.S.A. 102, 15942–15947. doi: 10.1073/pnas.0507611102
Ranathunge, C., Wheeler, G. L., Chimahusky, M. E., Perkins, A. D., Pramod, S., and Welch, M. E. (2020). Transcribed microsatellite allele lengths are often correlated with gene expression in natural sunflower populations. Mol. Ecol. 29, 1704–1716. doi: 10.1111/mec.15440
Ravikovitch, S. (1992). The soils of Israel: Formation, nature and properties. Tel Aviv: Hakibbutz Hameuchad Publishing House.
Rayburn, A. L., Price, H. J., Smith, J. D., and Gold, J. R. (1985). C-band heterochromatin and DNA content in Zea mays. Am. J. Bot. 72, 1610–1617. doi: 10.2307/2443312
Rosenberg, N. A. (2004). DISTRUCT: A program for the graphical display of population structure. Mol. Ecol. Notes 4, 137–138. doi: 10.1046/j.1471-8286.2003.00566.x
Rosenberg, S. M., Shee, C., Frisch, R. L., and Hastings, P. J. (2012). Stress-induced mutation via DNA breaks in Escherichia coli: A molecular mechanism with implications for evolution and medicine. BioEssays 34, 885–892. doi: 10.1002/bies.201200050
Rousset, F. (2008). Genepop’007: A complete re-implementation of the genepop software for windows and linux. Mol. Ecol. Res. 8, 103–106. doi: 10.1111/j.1471-8286.2007.01931.x
Saltelli, A. (2002). Making best use of model evaluations to compute sensitivity indices. Comput. Phys. Commun. 145, 280–297. doi: 10.1016/S0010-4655(02)00280-1
Schmidt, A. L., and Anderson, L. M. (2006). Repetitive DNA elements as mediators of genomic change in response to environmental cues. Biol. Rev. Cambridge Phil. Soc. 81, 531–543. doi: 10.1017/S146479310600710X
Sharp, N. P., and Agrawal, A. F. (2012). Evidence for elevated mutation rates in low-quality genotypes. Proc. Natl. Acad. Sci. U.S.A. 109, 6142–6146. doi: 10.1073/pnas.1118918109
Stojak, J., Borowik, T., Gorny, M., McDevitt, A. D., and Wojcik, J. M. (2019). Climatic influences on the genetic structure and distribution of the common vole and field vole in Europe. Mamm. Res. 64, 19–29. doi: 10.1007/s13364-018-0395-8
Storz, B. L., and Travis, J. (2007). Temporally dissociated, trait-specific modifications underlie phenotypic polyphenism in Spea multiplicata tadpoles, which suggests modularity. Sci. World J. 7, 715–726. doi: 10.1100/tsw.2007.159
Székely, P., Tudor, M., and Cogalniceanu, D. (2010). Effect of habitat drying on the development of the eastern spadefoot toad (Pelobates syriacus) tadpoles. Amph. Rept. 31, 425–434. doi: 10.1163/156853810791769536
Torres-Barcelo, C., Cabot, G., Oliver, A., Buckling, A., and MacLean, R. C. (2013). A trade-off between oxidative stress resistance and DNA repair plays a role in the evolution of elevated mutation rates in bacteria. Proc. Royal Soc. B 280:20130007. doi: 10.1098/rspb.2013.0007
Van Oosterhout, C., Hutchinson, W. F., Wills, D. P. M., and Shipley, P. (2004). Micro-checker: Software for identifying and correcting genotyping errors in microsatellite data. Mol. Ecol. Notes 4, 535–538. doi: 10.1111/j.1471-8286.2004.00684.x
Vieira, M. L. C., Santini, L., Diniz, A. L., and Munhoz, C. D. (2016). Microsatellite markers: What they mean and why they are so useful. Gen. Mol. Biol. 39, 312–328. doi: 10.1590/1678-4685-GMB-2016-0027
Vigouroux, Y., Matsuoka, Y., and Doebley, J. (2003). Directional evolution for microsatellite size in maize. Mol. Biol. Evol. 20, 1480–1483. doi: 10.1093/molbev/msg156
Wan, Q. H., Wu, H., Fujihara, T., and Fang, S. G. (2004). Which genetic marker for which conservation genetics issue? Electrophoresis 25, 2165–2176. doi: 10.1002/elps.200305922
Waples, R. S., and Do, C. (2010). Linkage disequilibrium estimates of contemporary Ne using highly variable genetic markers: A largely untapped resource for applied conservation and evolution. Evol. Appl. 3, 244–262. doi: 10.1111/j.1752-4571.2009.00104.x
Whittaker, J. C., Harbord, R. M., Boxall, N., Mackay, I., Dawson, G., and Sibly, R. M. (2003). Likelihood-based estimation of microsatellite mutation rates. Genetics 164, 781–787.
Wilson, G. A., and Rannala, B. (2003). Bayesian inference of recent migration rates using multilocus genotypes. Genetics 163, 1177–1191.
Keywords: genetic drift, heterozygote instability, stress-induced mutagenesis, natural selection, environmental gradient, environmental stability, hydroperiod
Citation: Cohen O, Ram Y, Hadany L, Geffen E and Gafny S (2022) The effect of habitat and climatic on microsatellite diversity and allele length variation. Front. Ecol. Evol. 10:893856. doi: 10.3389/fevo.2022.893856
Received: 10 March 2022; Accepted: 24 August 2022;
Published: 20 September 2022.
Edited by:
Alison G. Nazareno, Federal University of Minas Gerais, BrazilReviewed by:
Evandro Marsola Moraes, Federal University of São Carlos Sorocaba, BrazilFernando Faria Franco, Federal University of São Carlos, Brazil
Copyright © 2022 Cohen, Ram, Hadany, Geffen and Gafny. This is an open-access article distributed under the terms of the Creative Commons Attribution License (CC BY). The use, distribution or reproduction in other forums is permitted, provided the original author(s) and the copyright owner(s) are credited and that the original publication in this journal is cited, in accordance with accepted academic practice. No use, distribution or reproduction is permitted which does not comply with these terms.
*Correspondence: Eli Geffen, Z2VmZmVuZUB0YXVleC50YXUuYWMuaWw=
†These authors have contributed equally to this work