- 1School of Management Science and Engineering, Shandong University of Finance and Economics, Jinan, China
- 2Institute of Marine Economy and Management, Shandong University of Finance and Economics, Jinan, China
- 3School of Mathematics and Computer Application Technology, Jining University, Jining, China
Previous studies have estimated the influence of control measures on air quality in the ecological environment during the COVID-19 pandemic. However, few have attached importance to the comparative study of several different periods and evaluated the health benefits of PM2.5 decrease caused by COVID-19. Therefore, we aimed to estimate the control measures' impact on air pollutants in 16 urban areas in Beijing and conducted a comparative study across three different periods by establishing the least squares dummy variable model and difference-in-differences model. We discovered that restriction measures did have an apparent impact on most air pollutants, but there were discrepancies in the three periods. The Air Quality Index (AQI) decreased by 7.8%, and SO2, NO2, PM10, PM2.5, and CO concentrations were lowered by 37.32, 46.76, 53.22, 34.07, and 19.97%, respectively, in the first period, while O3 increased by 36.27%. In addition, the air pollutant concentrations in the ecological environment, including O3, reduced significantly, of which O3 decreased by 7.26% in the second period. Furthermore, AQI and O3 concentrations slightly increased compared to the same period in 2019, while other pollutants dropped, with NO2 being the most apparent decrease in the third period. Lastly, we employed health effects and environmental value assessment methods to evaluate the additional public health benefits of PM2.5 reduction owing to the restriction measures in three periods. This research not only provides a natural experimental basis for governance actions of air pollution in the ecological environment, but also points out a significant direction for future control strategies.
Introduction
The international spread of Coronavirus Disease 2019 (COVID-19) is affecting public health worldwide (Wang et al., 2020a). The first case was detected in Wuhan before it rapidly disseminated throughout China. Afterward, it spread to more than 210 countries and regions (Ali and Alharbi, 2020), developing as an international health threat (Huang et al., 2020). According to the latest real-time statistics of the World Health Organization, as of 16 March 2022, the total number of confirmed cases of COVID-19 reached 4.5847 trillion, and the cumulative death toll reached more than 6 million1. Since the outbreak of COVID-19, China has gone through three critical periods for initial epidemic prevention: the initial outbreak on 23 January 2020, the cluster of epidemic outbreaks in Beijing's Xinfadi market on 11 June 2020, and the policy that people stayed at their current residing localities during the Spring Festival in 2021. As the control measure of the COVID-19 outbreak was an external interference, its impact can be quantified by adopting quasi-experimental approaches. As a result, the three periods provide a unique opportunity to investigate the air quality response to such anthropogenic disruptions. The impact of the blockade triggered by the initial outbreak of COVID-19 in the world has attracted a great deal of attention (Briz-Redón et al., 2021; Gupta et al., 2021; Ju et al., 2021; Querol et al., 2021). People were frightened, and the blockade rules were strictly observed since there was no known drug or vaccine against the disease when COVID-19 first broke out during the Spring Festival in 2020 and the epidemic recurrence in Beijing's Xinfadi market. This is due to the efforts of the government and the fear of the people.
During the policy period of staying in place for Chinese New Year 2021, people were relieved from initial fear following a year of cohabitation with COVID-19, partial vaccination, and partial relaxation in industrial sectors to avoid the economic hardships experienced during the first lockdown cycle (Mahato and Pal, 2022). It is necessary to analyze the impact and differences of control measures in different stages on air pollution along with the results of the differences for a more detailed and scientific air pollution prevention and control strategy. It is universally known that China implemented an array of dramatic control measures during COVID-19 to minimize human interaction and prevent the virus from spreading further (Kraemer et al., 2020), including staying put during the spring festival, closing schools and workplaces and implementing remote office and teaching, canceling public events, restricting gatherings and traffic, carrying out strict home isolation, and even blocking out the entire city2.
Undoubtedly, enacting these restrictions was accompanied by a significant economic loss in addition to affecting the daily lives of people around the world (Anderson et al., 2020; Meo et al., 2020; Brodeur et al., 2021). Firstly, the capital market has been severely impacted due to the disease quickly expanding across the country. Additionally, countries have imposed travel restrictions and restricted production activities to prevent the spread from escalating again, which has triggered concern of an impending economic crisis and downturn (Nicola et al., 2020). In particular, the pandemic has also affected the supply of the energy sector, such as the oil and power sector (Chiaramonti and Maniatis, 2020). The blockade has achieved great success in curbing COVID-19. For it to work, the world has to deal with severe economic crises, chronic hunger, mass unemployment, and a range of other problems (Berkowitz and Basu, 2021; Rasul et al., 2021), all of which the world is still coping with (Kassa and Grace, 2020). In addition, the fiscal policy effectively contributed to the economic development in the time duration of the COVID-19 pandemic thus far (Ren et al., 2022). Generally, the global pandemic of COVID-19 has had an extensive and far-reaching impact on the development of the world economy. It will not only reconstruct the core concepts and fundamental connotations of economic globalization but also reshape the ecosystem of the world economy and promote fundamental changes in the global governance system (Jones, 2020).
Nevertheless, there have been unintentional ecological and environmental benefits during the pandemic. Much empirical research has focused on the impact of prevention measures in the COVID-19 pandemic on air pollution. Zhang et al. (2021) employed a two-way fixed effects model and an interrupted time-series analysis to explore the impacts of the control measures on air pollution during the COVID-19 outbreak. They detected that the related decrease in air pollutant concentrations was more evident over time since the lockdown began. Wang et al. (2021) utilized a difference-in-differences (DID) model to assess the implication of intra-city mobility declines on air pollution in 325 Chinese cities, finding that cities with restriction measures have a 12.2% greater decrease in AQI. Furthermore, this reducing impact varies with distinct types of air contaminants. Lu et al. (2021) constructed a machine learning prediction model to quantify changes in NO2, SO2, PM2.5, and PM10 levels induced by the first-level public health emergency response of 174 cities in China to COVID-19. They found the short-term emission control effect ranges from 53.0 to 98.3% for all cities, and southern cities show a significantly stronger effect than northern cities (p < 0.01). Compared with megacities, small-medium cities show a similar control effect on NO2 and SO2, but a larger effect on PM2.5 and PM10.
Additionally, the change in air pollutants indicated high spatial heterogeneity. The provinces with a reduction in PM2.5 and PM10 >20 and >40% reduction in NO2 during the impact period were mainly concentrated southeast of the “Hu Line.” In addition, different types of cities show different response and resilience patterns to the pandemic (Zeng and Wang, 2022). Although COVID-19's blockade has led to a temporary improvement in air quality (He et al., 2020), it comes at the cost of curbing economic development. Furthermore, most of the reduction in pollutant concentrations in 2020–2021 appears to result from a long-term declining trend rather than COVID-19 (Hwang and Lee, 2022). Moreover, during the resumption of work, the economy recovered, and there was an increase in energy consumption. CO2 and NO2 emissions increased significantly, reaching the level before the blockade (Zhou et al., 2022).
Air pollution has caused great damage to the ecological environment and human health, causing serious economic losses (Hao et al., 2021). As a result, numerous scholars have carried out studies on the health benefits of improving air quality in recent years (Zhang et al., 2007; Chen et al., 2010; Xie, 2011). Several studies have been conducted on the health effects of COVID-19 lockdown through their impact on air quality. Wang et al. (2021) assessed the excess risk (ER) of six pollutants and the AQI based on health risk (HAQI) to determine the health impacts of various air pollutants. They found that PM2.5 was the most health risk factor and HAQI values were all lower during COVID-19. Liu et al. (2021) used a novel COVID-19 government response tracker dataset to quantify the causal impacts of lockdown measures on air pollution using a DID approach. They discovered that across the 76 nations and areas involved in the restriction measures of the COVID-19 outbreak, the estimated avoided premature deaths owing to air pollution decreases range from 99,270 to 146,649 fatalities. Additionally, Shi et al. (2021) studied the long-run health implications of reducing PM2.5 during the Thirteenth Five-Year Plan. They determined the total premature deaths acquiring the relative risk of PM2.5 exposure from former research and found that the yearly PM2.5 level decreased from 49.7 μg/m3 in 2015 to 33.2 μg/m3 in 2020. Premature deaths declined from 1,186,201 and 446,415 in 2015 to 997,955 and 368,786 in 2020, respectively. In Seoul and Daegu, improved air quality has lowered premature mortality and saved health costs (Seo et al., 2020).
Moreover, Lam et al. (2022) selected fifteen cities worldwide to investigate the public health co-benefits of PM2.5 reduction during a period when various non-pharmaceutical interventions (NPIs) were adopted in the COVID-19 pandemic. Due to the high PM2.5 background with a large population, there were tremendous health co-benefits for cities in India and China. New Delhi has received the largest co-benefits, saving over 14,700 premature deaths. Bai et al. (2022) examined the PM2.5 variations between the COVID-19 lockdown and found that the national average of PM2.5 decreased by 18 μg/m3, and the mean PM2.5 for most sites decreased by 30–60%. The total avoided premature death due to PM2.5 reduction is 9,952 in China, with a dominant contribution (94%) from anthropogenic emission changes.
Beijing is one of the capital economic centers. It is regarded as a major metropolis globally, playing a vital role in political, economic, cultural, scientific, and technological innovation. However, air pollution has long been a major concern in this area, particularly during the winter (Vu et al., 2019). Due to the peculiar geography, air pollution in this location is frequently more severe than in other places when weather conditions are adverse (Wang et al., 2017). In addition, Beijing was impacted by contaminants carried from other locations in addition to local air pollution, particularly during periods of serious air pollution (Zhang et al., 2015). Furthermore, since the implementation of the restriction policy after the initial COVID-19 epidemic, except for power plants and large enterprises, almost all factories have been closed and traffic was also restricted. Moreover, Beijing is the city with the highest proportion of people, as high as 70.9%, staying put during the Spring Festival in 20213. Such restrictions should have greatly improved the state of the ecological environment. However, severe regional air pollution persisted despite the adoption of stringent controls, and greater efforts should be made to avert heavy air pollution (Wang et al., 2020b).
There have been substantial studies conducted on the influence of preventive and control measures on air pollutants all over the world since the outbreak of COVID-19 which have drawn some meaningful conclusions. However, there are still at least three deficiencies in most existing studies, which are of great research value or significance. Firstly, most studies merely analyze the situation in a specific period without comparative studies on diverse periods. Suppose the distinctions in different periods and the causes of the differences are ignored. It is not adequate to dig out more factors that need to be considered to prevent and control air pollution. Secondly, the data scale used in most studies is provincial data. However, there are gaps in economic development and the natural environment among various regions in the same province. Therefore, a unified air pollution control strategy cannot be adapted to local conditions. Thirdly, most studies solely analyze its impact on air quality without additional research value. However, our ultimate goal in improving air quality is to minimize the damage to human health and economic losses. As a result, the assessment of related health benefits can make us feel the benefits of air pollution prevention, encouraging human beings to take the initiative to reduce emissions and air pollution. The research focus of this study attempts to make up for the deficiency of the above research. This study aims to (i) determine whether the COVID-19 control measures have a causal impact on the air quality; (ii) evaluate the health benefits and avoidable economic costs due to changes in PM2.5 concentration during COVID-19; and (iii) carry on the comparative analysis of three critical periods in China regarding the impact of restriction measures on air pollution, health benefits, and avoidable economic losses of PM2.5 changes due to COVID-19.
Our study adopted data including daily air pollutant concentrations, meteorological information of 16 urban areas in Beijing, and designed the least squares dummy variable model and DID method to evaluate the implication of the initial COVID-19 breakout, the reemergence of the epidemic in the Xinfadi market, and the policy period that people stayed in place for Lunar New Year of 2021, respectively. We discovered that restriction measures did have an apparent impact on most air pollutants, but there were discrepancies in the three periods. The AQI fell by 7.8%, and SO2, NO2, PM10, PM2.5, and CO concentrations were lowered by 37.32, 46.76, 53.22, 34.07, and 19.97%, respectively, during the initial outbreak of COVID-19 in 2020, while O3 increased by 36.27%. In addition, the air pollutants concentrations in the ecological environment, including O3, reduced significantly, of which O3 decreased by 7.26%, and AQI and PM2.5 fell by 22.61% and 45.12%, respectively, when the epidemic outbreak occurred in Beijing's Xinfadi market. Moreover, AQI and O3 concentration increased slightly in comparison to the same period in 2019, while other pollutants dropped, with NO2 being the most apparent decrease during the policy of staying in place for the Lunar New Year of 2021. And Spring Festival had a great impact on the concentration of NO2 and CO.
In addition, based on health-related data, such as exposed population and outpatient morbidity and mortality, we innovatively estimated the health benefits and avoided economic costs brought by the changes in PM2.5 pollution as a result of the pandemic. Specifically, we applied Poisson regression relative risk models and environmental value evaluation approaches to analyze the avoided health risks and economic losses of PM2.5 reduction in the 16 municipal districts of Beijing in these three periods, adopting the secondary standard limit of 35 μg·m−3. In other words, we used the impact of control measures on changes in air pollutants to calculate the indirect health impacts of the pandemic. We found differences in health effects and avoided economic loss among the three periods in each urban area due to the gaps in PM2.5 changes, exposure population, outpatient incidence, and mortality in different urban areas. In addition, the avoided total health and economic loss owing to the PM2.5 reduction affected by the restriction actions in three pandemic periods were 82,747.65 million yuan [95% CI (3,406.4, 10,879.1)], 11,143.71 million yuan [95% CI (3,826.43, 16,949.1)], and 871.65 million yuan [95% CI (350.54, 1,165.95)], respectively.
The main innovations and contributions of this research are as follows:
(a) Previous research merely studied and compared the air pollutant concentrations over a year or months before and after the outbreak. The unique characteristics of different critical periods have received little attention. In this study, we carried out targeted research for various crucial periods in China. We made comparisons both in the changes in air pollutant concentrations and indirect health benefits of the COVID-19 epidemic by affecting PM2.5 pollutants. Targeted and more detailed control measures for serious air pollution can be formulated by exploring the particularity of different vital epidemic periods.
(b) Most former studies have relied on relatively macro and large-scale data from various countries, provinces, or cities to carry out their research. However, there are distinctions in the ecological environment, resource elements, air quality, and the intensity of control measures in specific regions, such as towns or urban areas, which cannot be generalized. Consequently, district-level and low-scale data are adopted to conduct research for elaborate prevention, control, and governance of regional air pollution.
(c) We still have no idea how the specific value of such changes is reflected in our daily lives if the study solely reports how and to what extent COVID-19 affects variations in air pollutant concentrations. Further research value is assessed in this study, which includes the health effects and economic benefits of PM2.5 reductions induced by COVID-19. This work will present more valuable information for air pollution prevention and control decision-makers. Still, it will also play a vital role in implementing early warning and prevention measures related to air pollution and human health.
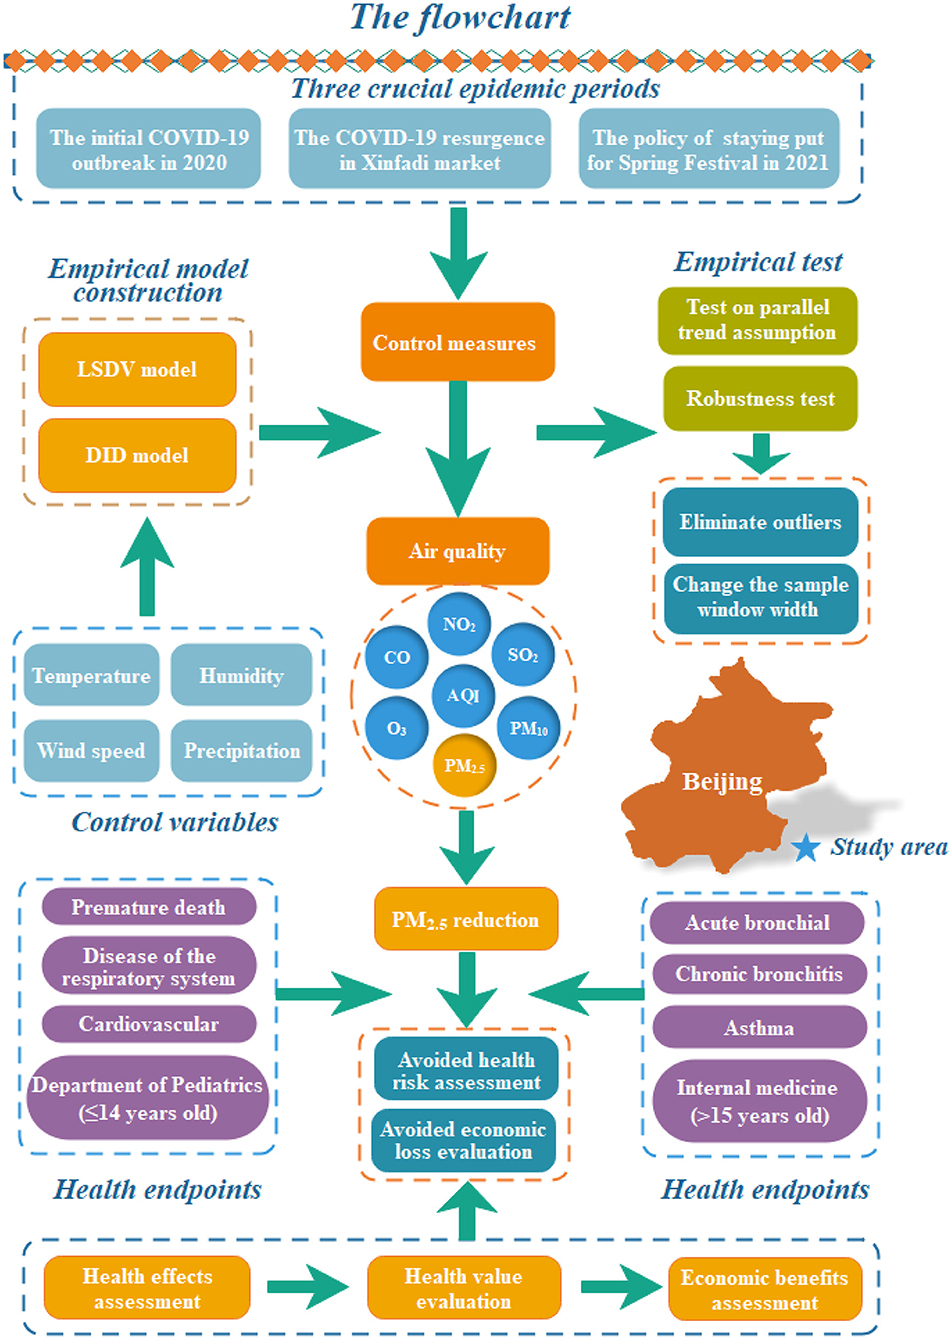
The following is the organization of the rest of the study. Section Methodology explains the empirical strategy and the value assessment methods. Section Data describes the data sources and processing. Section Empirical Study on the Effect of Control Measures on Air Quality discloses the effects of restriction efforts on air quality over three periods, respectively. Section PM2.5 Reduction-Induced Health Benefit Evaluation assesses the indirect health effects and avoided economic loss of the prevention actions in the COVID-19 pandemic by affecting air pollution. Section Discussions on Recommendations for Meticulous Control of Air Pollution discusses the recommendations of control measures to improve air quality, and Part 7 contains the conclusions. The flowchart of this study is as follows (Figure 1).
Methodology
This section describes the methods adopted in this article, and it consists of two parts. Part one is the empirical strategy and part two is the value assessment methods.
Impact of Restriction Measures on Air Pollution
The empirical model was mainly utilized to evaluate the impact of control measures on air pollutants in three periods. The least-squares dummy variable model and DID model were used in this study.
Least Squares Dummy Variable Model
First, we adopted the least squares dummy variable (LSDV) method to explore the impact of the Chinese New Year in 2020 and COVID-19 restrictions on air pollution. Hence, this study mainly used an urban panel data model with a fixed effect, as follows:
where ln Pit represents the explained variable, which is obtained by logarithmizing the daily average concentration of air pollutants in region i on day t. The value of “Covid” was 1 if the day falls within the initial COVID-19 epidemic period (24 January 2020–29 February 2020). “Covid” denoted the core explanatory variable for this model. If COVID-19's prevention and control measures can improve air quality, its regression coefficient should be significantly negative. “Holiday” was 1 when it falls within Chinese New Year (4 February 2019–10 February 2019 or 24 January 2020–2 February 2020). If not, it has a value of 0. It belongs to a dummy variable. “Other holidays” connotes the dummy variable for vacations except for Chinese New Year. Wit represents the weather variables in region i on day t. They are variables added to control the influence of meteorological conditions on air pollutants. Xit denotes other control factors, incorporating the impact of Month. μi connotes urban fixed effects, which is used to control regional heterogeneity. πt represents the date fixed effects and εit denotes the error term.
Second, we still employed the LSDV model to analyze the influence of the outbreak of COVID-19 in Beijing's Xinfadi market on air contaminants. Our main method is following:
The COVID-19 epidemic broke out in Beijing's Xinfadi market on 11 June 2020, and the number of cases was not cleared until 6 August 2020. As a result, the value of “Market” was 1 if the day falls within the epidemics outbreak period in Beijing's Xinfadi market (11 June 2020–6 August 2020). “Other holidays” is a dummy variable for holidays during the epidemic outbreak in the Xinfadi market. The explanation of , Wit, Xit, μi, πt, and εit is the same as the equation (1).
Differences-In-Differences Model
The DID model (Jiménez and Perdiguero, 2017) has been frequently utilized to assess the causal influence of control measures taken by the government on the atmosphere and to distinguish policy effects from other impacting variables. These models may avoid uncontrolled and unexpected factors in the time leading up to and after adopting the regulations (Li and Lin, 2017).
As the policy of staying put during the Spring Festival in 2021 coincided with the Chinese Spring Festival in 2021, which influences factory production, people's travel, and entertainment, separating the impact of the Spring Festival holiday effect becomes indispensable (Fu and Gu, 2017). Consequently, this study uses the DID model to estimate the impact of a policy, which stated that people stayed in place for the Lunar New Year in 2021, on air quality. The experimental group consisted of air quality data from 2021, while the control group consisted of data from the same time in 2019 due to the unusual epidemic and complicated situation in the Chinese New Year 2020. We collected data for 10 days before and after the Chinese New Year in 2021 (1 February 2021–21 February 2021) and 2019 (25 January 2019–13 February 2019). The DID model goes like this:
where “Treat” belongs to a grouping dummy variable whose value was 1 if it falls within 2021, and it took the value 0 for 2019. The value of “Holiday” was 1 when it falls after the Chinese New Year (4 February 2019 or 11 February 2021) during the sample period. The interaction term “Holiday × Treat” connotes the policy effect of staying put during the holiday of Lunar New Year's Eve in 2021.
Hausman test is applied to determine whether the model is valid, and we have corroborated that the usage of fixed effects in Equations (1, 2) is reasonable. The explained variables in all equations take the value of its logarithm to eliminate potential heteroscedasticity and decrease data fluctuations. The relative variations are easier to grasp (Bel and Holst, 2018; Lin and Zhu, 2019).
PM2.5 Reduction-Induced Health Effects and Economic Benefits
This section is the methods employed in three steps of health benefits assessment. First, we evaluated the environmental health effect combined with the Poisson regression relative risk model and the relation coefficient β of exposure-response model. Second, we assessed the environmental health value using the value of a statistical life. Third, we evaluated the health and economic benefits according to the calculated results of each health endpoint's health effects and unit economic value in the previous two steps.
Environmental Health Effect Assessment
Below, the estimation equation simulates the associated population health risks (Huang et al., 2012). This expression illustrates the correlations between changes in PM2.5 concentration and changes in human health endpoints.
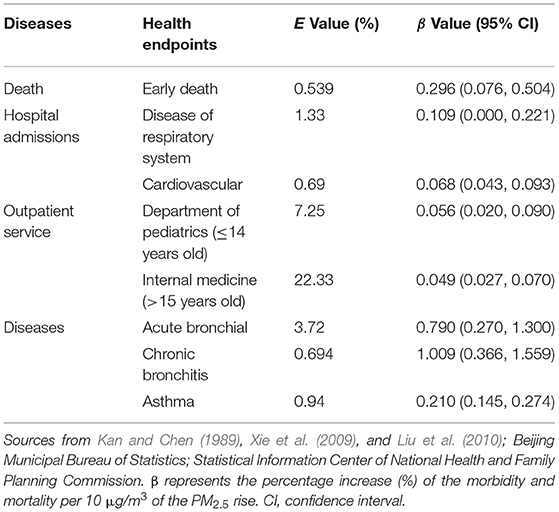
where C denotes the daily PM2.5 concentration and C0 represents the limit of the secondary concentration of PM2.5 pollutants. In this article, we chose 35 μg/m3 as C0. P is the number of exposed populations. This study selects the resident population at the end of the year to replace. β indicates a coefficient in the explosion-response relationship that connotes the percentage of the health impacts of variation for each 10 μg/m3 rise in PM2.5 levels, as indicated in Table 1. E and E0 are the health effects under C and C0 concentrations, respectively, and ΔE is the change of health effects. According to the existing research (Huang and Zhang, 2013; Xie et al., 2014; Li et al., 2017a), the selected health endpoints affected by PM2.5 are premature death, respiratory disease hospitalization, cardiovascular disease hospitalization, internal medicine clinic, pediatrics clinic, acute bronchitis, chronic bronchitis, and asthma. Additionally, the variations of the health impacts (ΔHE) induced by PM2.5 can be acquired utilizing the formula below based on the exposure population (Pop).
Research on exposure-response relationship coefficients was conducted to increase the reliability of air pollution damage to residents and reduce errors as much as possible. Numerous scholars, such as Kan et al. (2004); Xie et al. (2009); Lv and Li (2016), have ultimately proposed an exposure-response relationship coefficient that is suitable for China taking into account differences in pollutant concentrations at home and abroad and also the different effects of pollutants such as PM2.5 on various races and populations. Table 1 shows the relationship coefficient (β) of exposure-response model and the benchmark incidence (E value) of corresponding health endpoints based on previous research findings.
This study adopted the achievement reference method since the relative deficiency of the latest analyzed data in China. The incidence of premature death was acquired from the Beijing Regional Statistical Yearbook (CSY., 2020) and the Statistical Bulletin of National Economic and Social Development 4 published on the Beijing Bureau of Statistics' official website. The hospitalization rates of respiratory and cardiovascular diseases were attained from the Fifth National Health Service Survey and Analysis report released by the Statistical Information Center of the National Health and Family Planning Commission 5 in 2015. Additionally, the incidence of medical and surgical outpatients was estimated from the percentage of Beijing's medical and surgical outpatients in the total number of outpatients according to the literature (Kip Viscusi et al., 1991; Xie et al., 2015; Lv and Li, 2016). Finally, the baseline incidence (E value) of acute and chronic bronchitis and asthma was determined concerning the research results of predecessors.
Environmental Health Value Evaluation
The value of a statistical life (VOSL) is how residents are willing to lower the risk of death by employing money. This study applied the VOSL method to assess the economic cost of premature death due to PM2.5 based on VOSL research results in Beijing (Xie, 2011; Huang and Zhang, 2013). In recent years, Beijing residents' statistical life expectancy value has been estimated by adopting per capita gross domestic product (GDP) and the Consumer Price Index (CPI) (Matus et al., 2012; Lu et al., 2017; Giannadaki et al., 2018; Maji et al., 2018). The following is the calculation method:
where VOSL t and VOSL k are Beijing's statistical life value in t and k years, respectively, %ΔP and %ΔG are the growth rates of CPI and per capita GDP in Beijing from k to t years. β1 is the coefficient of income elasticity, and its value in this study is 0.8 (Lanzi et al., 2016).
The disease cost approach is utilized to estimate outpatient and hospitalization expenses in this study. The economic loss induced by outpatient and hospitalization expenses includes two parts: the outpatient and hospitalized medical costs per capita and the lost work time due to disease treatment. The unit cost estimation formula is as follows (Zhang et al., 2007):
where i is the ith health endpoint, ECi is the unit economic loss of outpatient or hospitalization, ECi, p is the per capita medical expense, including direct and indirect medical expenses, GDPp represents the cost of absenteeism per capita on a daily basis, estimated by the daily per capita GDP, and Ti, L is the number of days of absenteeism caused by treating ith health endpoint diseases. The time spent missing work in the outpatient clinic is calculated using a 0.5-day rule (Wei and Shi, 2018; Han et al., 2019). In addition, the outpatient expenses are taken from the China Health and Family Planning Statistical Yearbook of 2020 issued by the National Health and Family Planning Commission. The hospitalization expenses and length of stay are obtained by adopting Wei and Shi's (2018) estimation method.
Since chronic bronchitis treatment is slow, the treatment costs are difficult to calculate. Consequently, the disease cost method is not suitable for determining its economic cost. This study applied the achievement reference method to estimate chronic bronchitis according to 32% of Kip Viscusi's et al. (1991) statistical life value. Additionally, the unit economic loss of acute bronchitis was calculated by outpatient cost according to Huang and Zhang's (2013) ratio of the unit economic value of outpatient clinic to acute bronchitis. Table 2 shows the average hospitalization or outpatient days, medical expenses, and unit economic loss cost for each health endpoint.
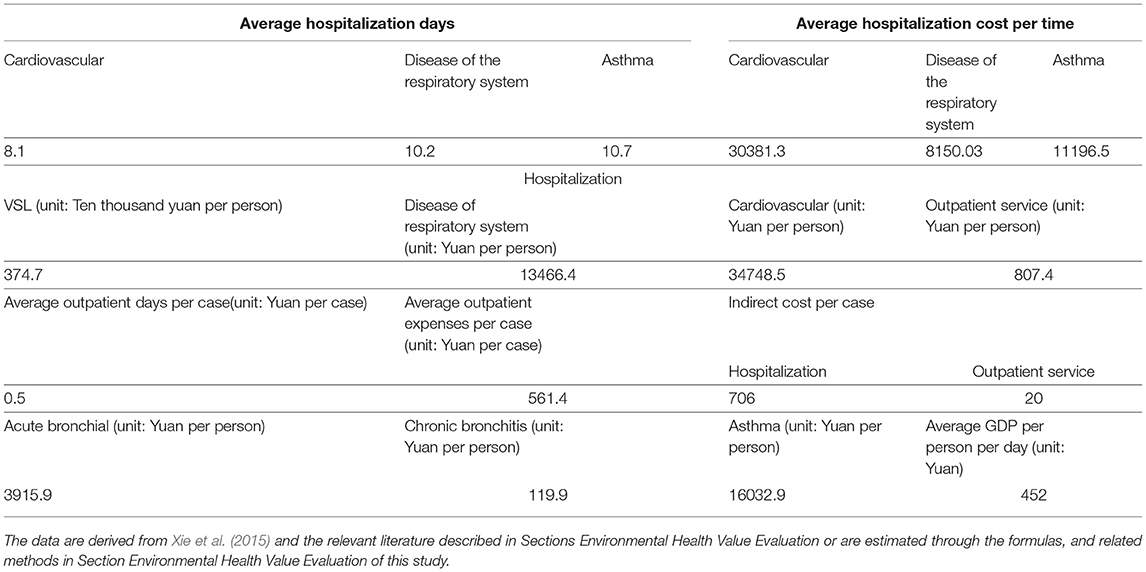
Table 2. Days of hospitalization, outpatient service and their medical expenses for health endpoints and unit economic loss value in 2020.
Health and Economic Benefits Evaluation
Eventually, the overall economic loss of health impacts induced by PM2.5 can be evaluated utilizing the formula below (Yin et al., 2017).
where EL denotes the overall health and economic benefits of residents brought by PM2.5 reduction and Vi connotes the unit economic value of the i th health endpoint, obtained by the equation below (Hammitt and Robinson, 2011).
where IncomeBeijing_2009 and IncomeBeijing_2020 represent Beijing's income in 2009 and 2020 correspondingly, e is the elastic coefficient, and then the VBeijing_2009 and VBeijing_2020 are the values of 2009 and 2020 correspondingly in Beijing. The economic value in 2020 (VBeijing_2020) can be acquired referring to the IncomeBeijing_2009 in Hammitt and Robinson (2011) and Equation 10.
Data
This section describes the data sources and processing in empirical analysis and health benefits assessment of PM2.5 pollution, respectively, including air quality and meteorological data required in empirical analysis, and related data employed in health benefits assessment of PM2.5 pollution.
Air Quality and Meteorological Data
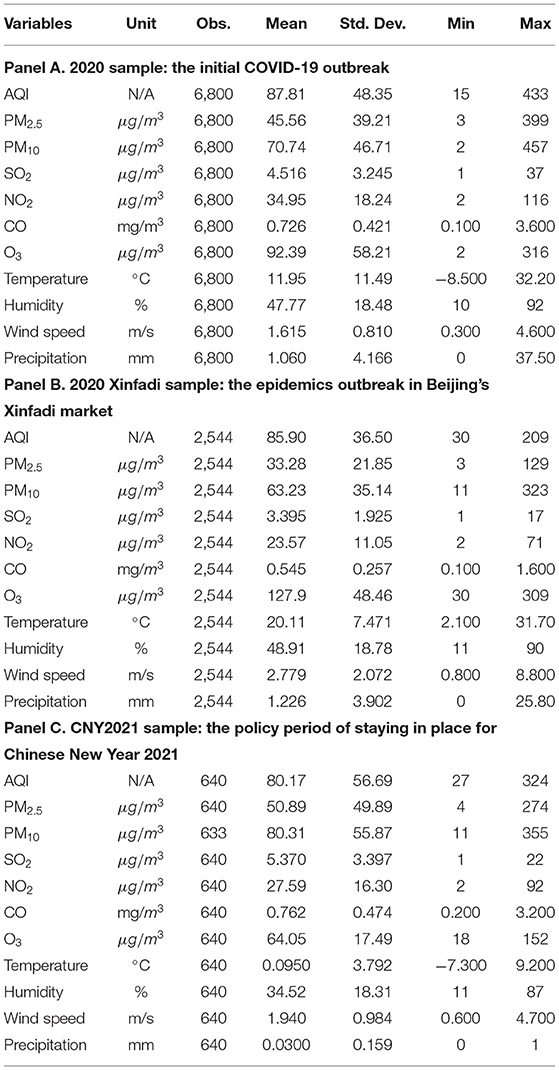
Air quality data was taken from the Qingyue Open Environment Data Center 6. We attained relevant air quality data, including the daily AQI, PM2.5, PM10, SO2, NO2, CO, and O3 concentrations from 16 urban areas in Beijing from the following periods: (i) 1 January 2019–29 February 2020, the period containing the Chinese New Year 2020 and the initial COVID-19 outbreak; (ii) 11 June 2020–6 August 2020, the period including the outbreak of Beijing's Xinfadi market from the beginning to the end; and (iii) 1 February 2021–21 February 2021, the period containing the implementation of policy that people stayed in place for Lunar New Year in 2021. Meteorological data were sourced from Huiju data7 and the National Meteorological Information Center8. We gathered daily meteorological data of three periods same as air quality information, including mean temperature, mean relative humidity, mean wind speed, and precipitation (accumulated over 8 h) on a daily basis for 16 urban districts in Beijing. Table 3 presents the summary statistics of our important variables.
Data Related to Health Benefit Evaluation of PM2.5 Pollution
The GDP, per capita GDP, CPI, and year-end resident population (exposed population) data in various districts of Beijing are obtained from the Beijing Regional Statistical Yearbook of 2020 (CSY., 2020) or the Beijing Bureau of Statistics (or government), the Beijing District Bureau of Statistics (or government), and the official website of the National Bureau of Statistics9, etc. In addition, the mortality, morbidity, per capita hospitalization, and outpatient expenses were obtained or estimated from the Beijing Regional Statistical Yearbook of 2020, the Statistical Bulletin on National Economic and Social Development of Beijing in 2020 published by the Beijing Municipal Bureau of Statistics10, the Statistical Information Center of National Health and Family Planning Commission11, and survey data from the China Asthma Alliance.
It is challenging to acquire or estimate detailed data, such as mortality, the statistical value of life, prevalence rate, outpatient, hospitalization expenses, and length of stay, for each district in Beijing. Therefore, this study uniformly adopts the corresponding data of Beijing in the same year. Moreover, this article uses the corresponding data in the next year or the preliminary accounting data from the district people's government and the Bureau of Statistics to supplement the missing or unpublished data.
Empirical Study on the Effect of Control Measures on Air Quality
This section indicates the effect of restriction measures during the COVID-19 outbreak on the air pollutant concentrations in three significant periods. Each period has two parts: the graphical analysis and empirical model regression results.
The Initial COVID-19 Outbreak in 2020
In this part, we firstly analyzed the changes in air contaminants during the initial COVID-19 outbreak in 2020 based on the variation of pollutant concentration distribution diagrams. Secondly, we conducted a further simulation and indicated the influence of preventive measures on air pollution based on LSDV model regression results.
The Variation of Pollutant Concentration Distributions
As a visual demonstration of changes in air pollutants, the mapping tool in ArcGIS10.2 was employed to graphically portray the pollutant concentration distributions of 16 urban areas in Beijing. The work is achieved by comparing the emissions of air contaminants in each urban area before and after taking measures to stop the further spread of the COVID-19 epidemic. As shown in Figure 2, the temporal and spatial distribution of different air pollutants in various urban areas has obvious heterogeneity. Specifically, except for no significant change in the O3 concentration, the AQI and other air pollutant concentrations seem to be much lower than the normal concentration during the epidemic prevention and control measures, which provides supporting evidence for the effectiveness of epidemic control efforts to decrease air pollution. In the following section, we further simulate the effect obtained by the LSDV model.
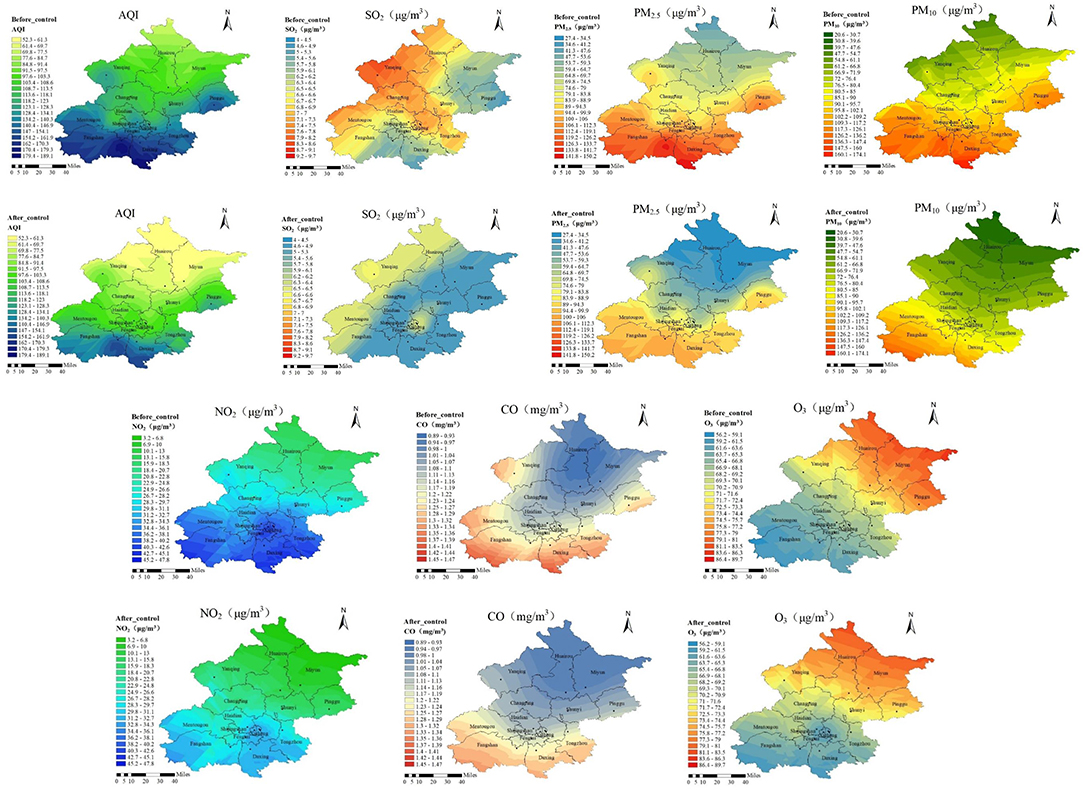
Figure 2. Variations of AQI, SO2, PM2.5, PM10, NO2, CO and O3 concentration distribution before and after control measures.
The Impact of Control Efforts on air Pollution
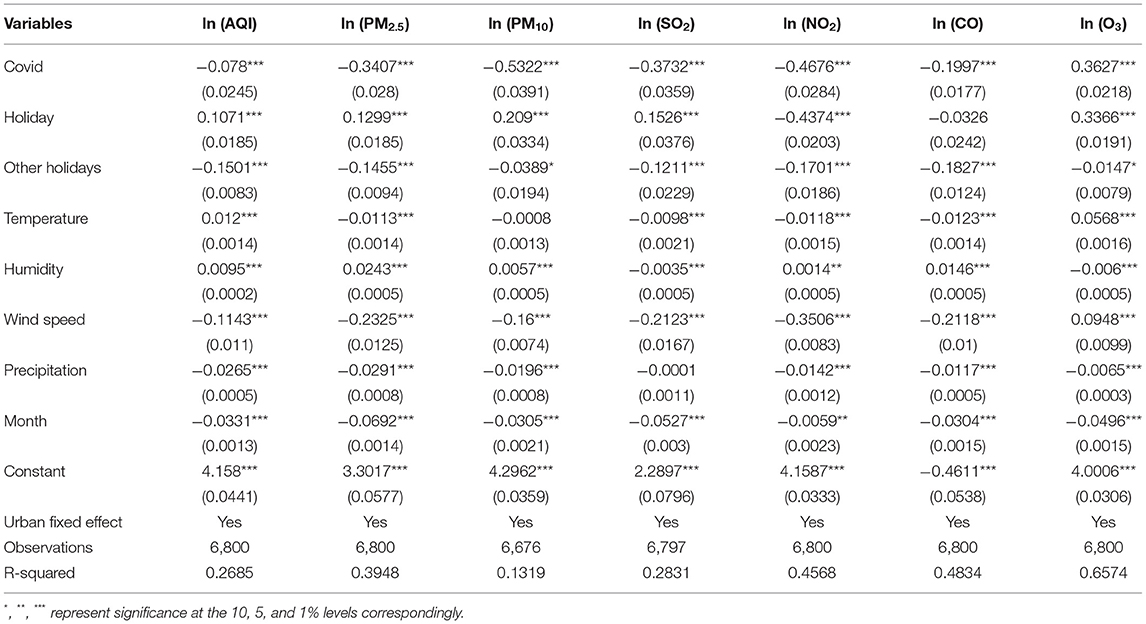
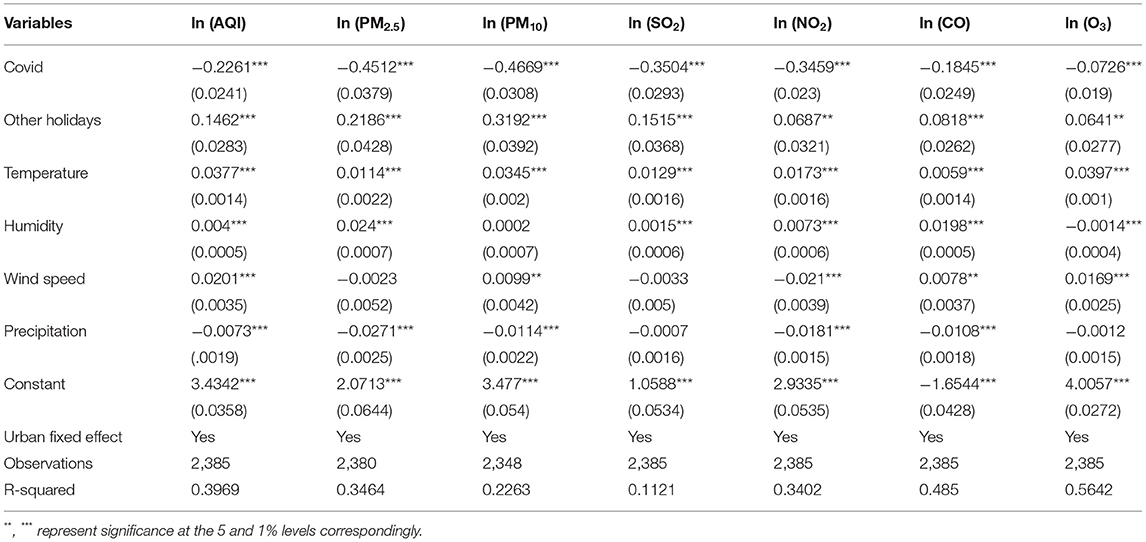
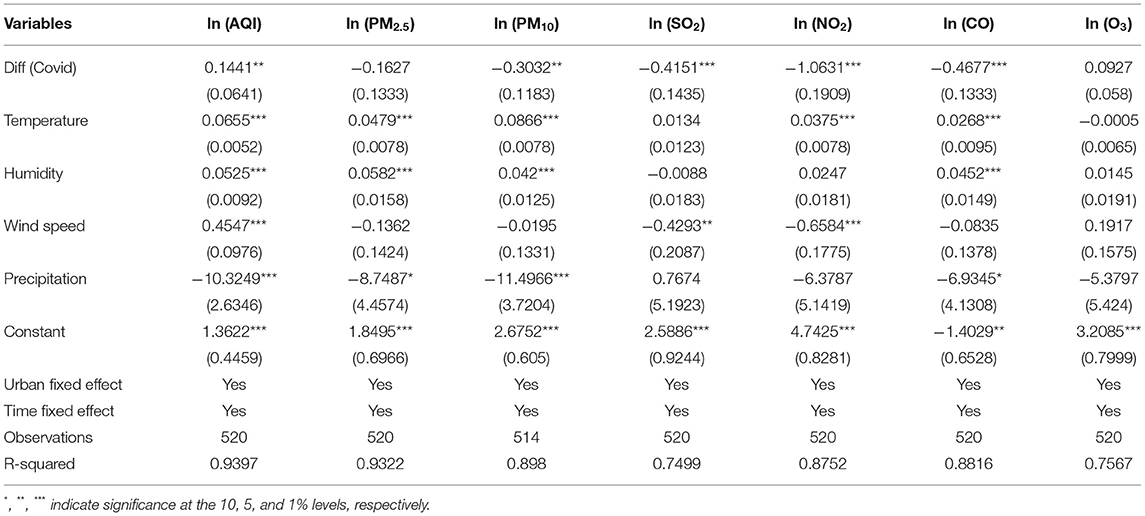
First, we conducted a regression employing the LSDV model on the influencing variables of air pollution from 1 January 2019 to 29 February 2020, as shown in Table 4. We discovered that except for the increase in O3, which increased by 36.27%, other air pollutant concentrations declined significantly when restriction measures were implemented, indicating that they have alleviated the air pollution. The AQI dropped by 7.8%, while NO2 reduced by 46.76%. At the same time, PM2.5, SO2, PM10, and CO had different degrees of decline, which fell by 34.07, 37.32, 53.22, and 19.97%, respectively. Spring Festival had a great impact on the concentration of NO2. Furthermore, other holidays reduced pollutants even if their impact on PM10 and O3 was small. In addition, related weather variables explain plenty of changes in air pollutant concentrations. The time variable (month) shows the long-run temporal tendency of the monthly fluctuation of air pollutants (Wang et al., 2010) and substantially impacts air quality. These constants are statistically crucial because they effectively balance the errors that other terms in the model do not take into account and ensure that the residual's average value is zero.
Mobility restrictions and rapid reduction of pollutants emitted by vehicles and industry following the lockdowns are possible explanations for short-term air quality improvement (Dang and Trinh, 2021; Jiang et al., 2021). The decline in economic activity and traffic restrictions during the epidemic directly led to changes in China's energy consumption, resulting in a decline in carbon emissions and air pollution levels, alleviating ecological and environmental pollution (Muhammad et al., 2020). Due to the restrictions on human activities and traffic, the pollutant concentrations in China have sharply dropped in a few days, especially NO2 and PM10 (Dutheil et al., 2020; Liu et al., 2020). O3 participates in photochemical reactions, and its concentration is often opposite to the change of emission due to the non-linear characteristics of the chain reaction (Kim et al., 2017).
The COVID-19 Resurgence in the Xinfadi Market
In this part, we firstly analyzed the variations in air quality during the cluster of COVID-19 outbreaks in Beijing's Xinfadi market based on the changing trend of pollutant concentrations diagrams. Secondly, we further simulated and revealed the relationship between control measures and air quality based on LSDV model regression results.
The Changing Trend of Pollutant Concentrations
As a visual demonstration of changing trend in pollutant concentrations, we used the mapping tools in Minitab19 to graphically describe the time trend of each pollutant. This is achieved by comparing the emissions of air pollutants in 16 urban areas of Beijing before and after the outbreak in the Xinfadi market. As illustrated in Figure 3, the pollutant concentrations in each urban area briefly decrease after taking measures, in which PM2.5 is the most obvious and the decline of AQI is relatively slow. In addition, the concentrations of PM2.5, CO, and AQI have an upward trend after a period of control measures. The time trends of different air pollutants in various urban areas are generally similar, proving evidence of the effectiveness of epidemic control measures to reduce air pollution. Below, we will further simulate the effect derived from the LSDV model.
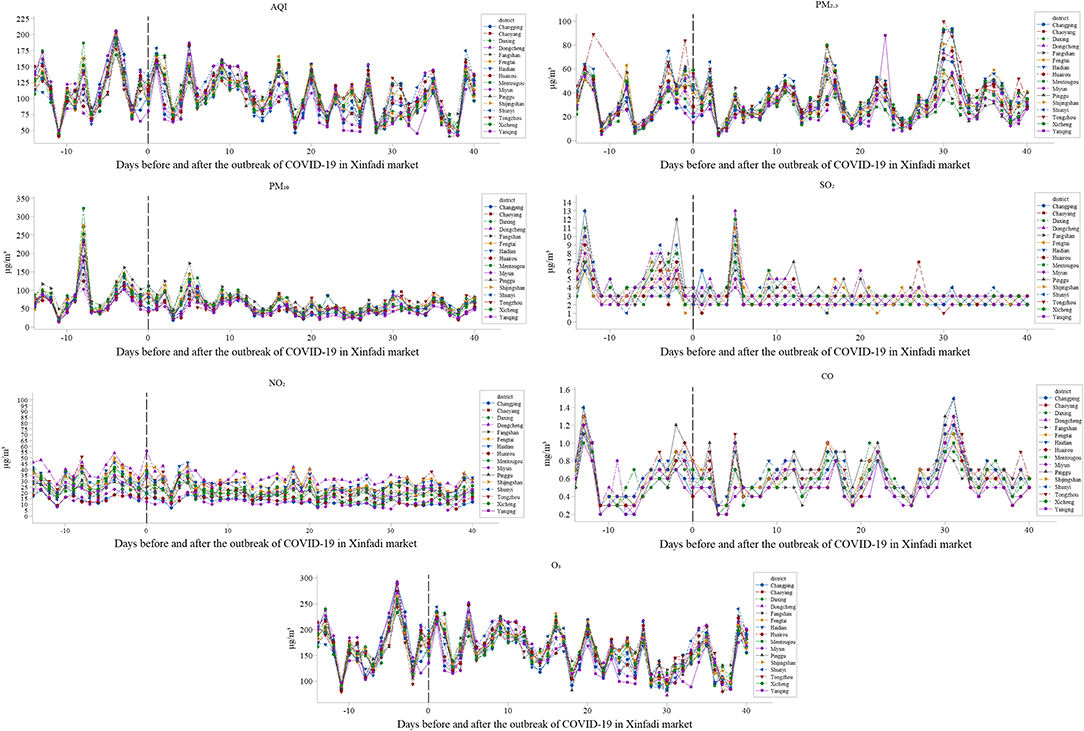
Figure 3. The changing trend of pollutant concentrations before and after the COVID-19 outbreak in Beijing's Xinfadi market. The vertical open black line denotes the start of the cluster of epidemic outbreaks in the Beijing's Xinfadi market.
The Effect of Restriction Actions on Air Quality
Second, we still implement a regression applying the LSDV method on the contributors impacting air pollution from 11 June 2020 to 6 August 2020 (Table 5). Similar to the first period, findings revealed that enacting prevention measures during Beijing's Xinfadi market outbreak significantly lowered air pollutant concentrations. The AQI dropped by 22.6% and NO2 reduced by 34.6%. Meanwhile, PM2.5, SO2, PM10, and CO concentrations fell by 45.1, 35.0, 46.7, and 18.5%, respectively, indicating that control measures improved air quality. PM10 and PM2.5, related to vehicle exhaust emissions and industrial processes, declined most obviously. Compared with the first period, the reduction of PM10, SO2, NO2, and CO was less. The recurrence of the outbreak in the Xinfadi market was only a small-scale aggregated outbreak in Fengtai District and was brought under control in about a week. Furthermore, Industrial sectors return to work and production with partial relaxation of the epidemic's control measures to avoid the economic hardships experienced during the first lockdown. In addition, appropriate people's travel and traffic flow are allowed, which might explain these results. It is worth mentioning that the O3 concentration has also decreased by 7.26%, which may be the reduction and dispersion of emissions in NOx and volatile organic compounds (VOCs) precursors (Yang et al., 2019). Other festivals have a greater impact on PM10 and PM2.5 and less impact on NO2, SO2, CO, which may be due to restrictions on travel, play, and related activities since the initial outbreak of COVID-19 in 2020. Thus, NO2, SO2 and CO levels have few changes during the epidemic outbreak of Xinfadi market. Meteorological factors also show strong explanatory power that is coherent with the previous regression findings.
The Policy Period of Staying in Place for Lunar New Year in 2021
In this part, we first compared the air quality changes in the policy period of staying in place for Lunar New Year based on the comparison of pollutant concentrations variations between 2020 and the same period in 2019. Secondly, we further simulated and indicated the impact of control measures on air quality based on DID model regression results.
The Comparison of Pollutant Concentrations With 2019
For a visual representation of the comparison between the control and the treatment groups in air pollution, we used the mapping tools in Minitab19 to graphically describe the time trends before and after the Spring Festival in 2019 and 2021. As shown in Figure 4, except for O3, the concentrations of all pollutants decreased during the Spring Festival policy in 2021, especially that of AQI, PM2.5, and PM10. In addition, for a period after the end of the policy, the concentration of pollutants in 2020 was often lower than that in 2019, which provides evidence of the effectiveness of epidemic control measures to reduce air pollution. Below, we will further simulate the effect acquired from DID model.
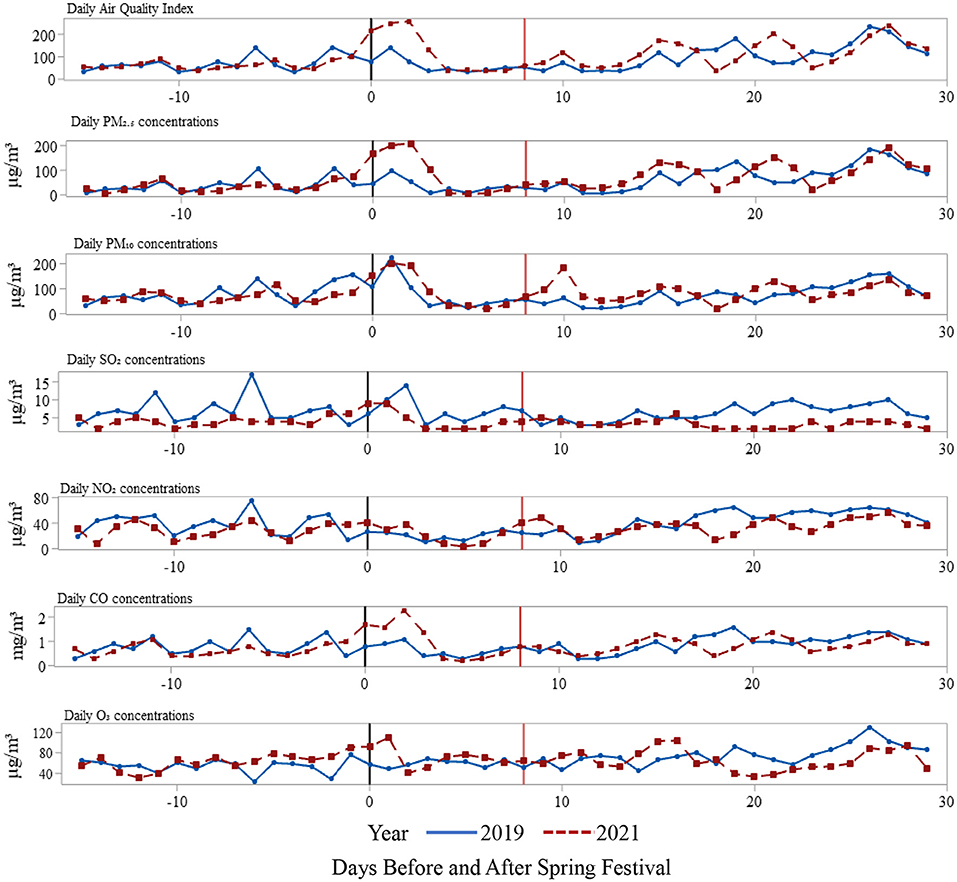
Figure 4. The comparison of pollutant concentrations changes between 2020 and the same period in 2019. The vertical solid black line connotes the beginning of Chinese New Year holiday, while the vertical solid red line denotes the end of Chinese New Year holiday.
The Influence of Control Measures on Air Quality
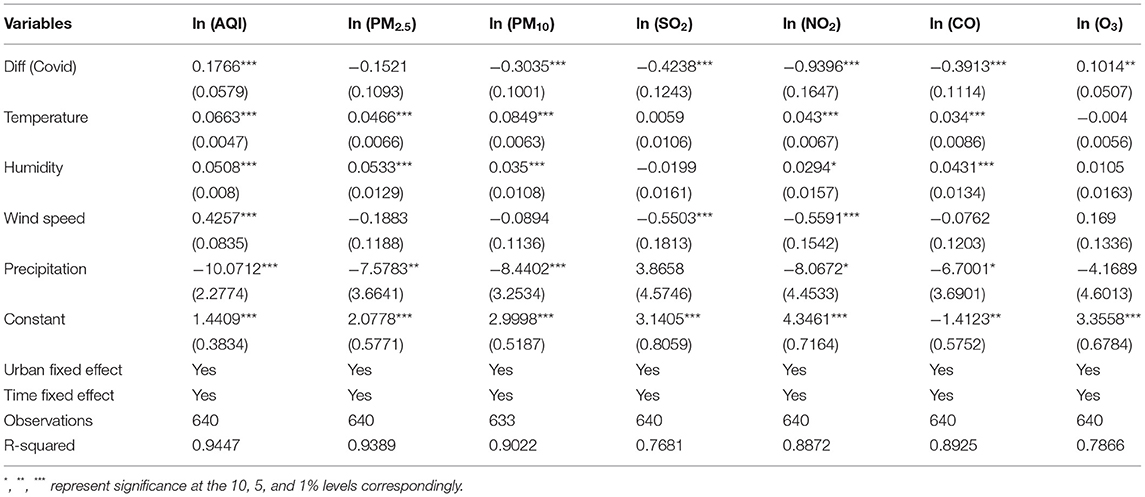
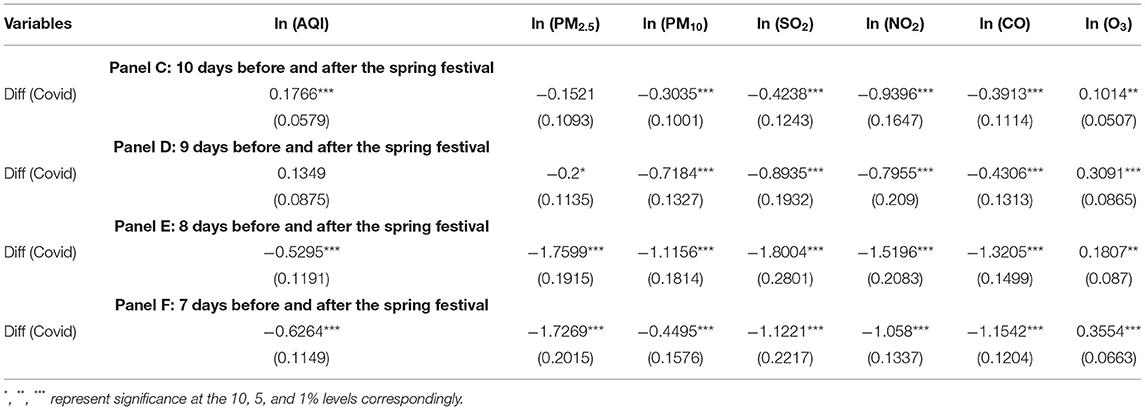
Finally, we adopted the DID model to explore the impact of the policy period people stayed put during the Spring Festival in 2021 on air quality. This model can quantify the net impact of prevention efforts on air pollutants in the COVID-19 pandemic by separating restriction measures from the Chinese New Year holiday effect. The air quality data in 2019 were chosen as the control group (no controls), and the air quality data for 2021 were used as the treatment group. The DID analysis (Table 6) revealed that prevention efforts had improved air quality in comparison to the same time in 2019, with the most significant impact on NO2. The pollutant was primarily related to a decline in economic development and transportation constraints, which resulted in reduced energy usage and lowered emissions (Filonchyk et al., 2020). This was followed by PM10, SO2, and CO, which dropped by 30.35, 42.38, and 39.13%, respectively. However, AQI increased during this period compared to the same time in 2019, and no significant effect on PM2.5 was observed.
On the one hand, some pollutant concentrations have not significantly fallen in comparison with the first period. People staying at their current residing localities during the Spring Festival in 2021 may reduce the migration index but has a relatively small impact on the urban travel intensity index. On the other hand, several major pollutant concentrations in the third period declined more than in the second period, probably due to the large flow of people during the Spring Festival. The prevention and control measures of the COVID-19 pandemic are more stringent than the second period to prevent the large-scale recurrence of the epidemic similar to the Spring Festival in 2020, which might the explanations of these results.
Test on Parallel Trend Assumption
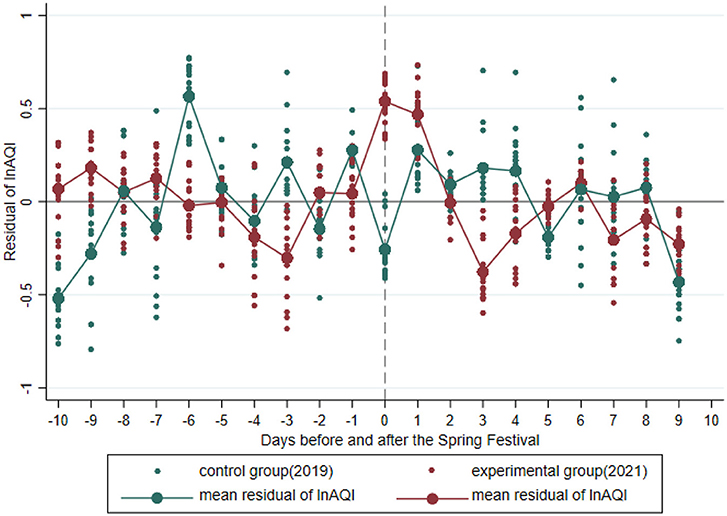
The DID model requires consistency in the development tendency over time between the experimental and the control group (Wan et al., 2019). Therefore, we tested the parallel trend hypothesis to ascertain if the pollutant concentration trends of the control and the treatment groups are parallel before the implementation of the intervention measure. Firstly, it can be seen that before the implementation in Section The Comparison of Pollutant Concentrations With 2019 (Figure 4), the trend of air pollutants in the control group (2019) and the treatment group (2021) was basically the same before the intervention. Consequently, our research may be able to pass the parallel trend hypothesis test. The residual diagram of the estimated coefficients of the model equation (3) was drawn to exhibit the policy effect better. Figure 5 shows the time trend of residuals of air quality for 10 days before and following the Spring Festival after excluding weather effects and other potential complicating variables. In both the control and treatment groups, the residual errors are standardized to zero, as can be observed (Li et al., 2017b).
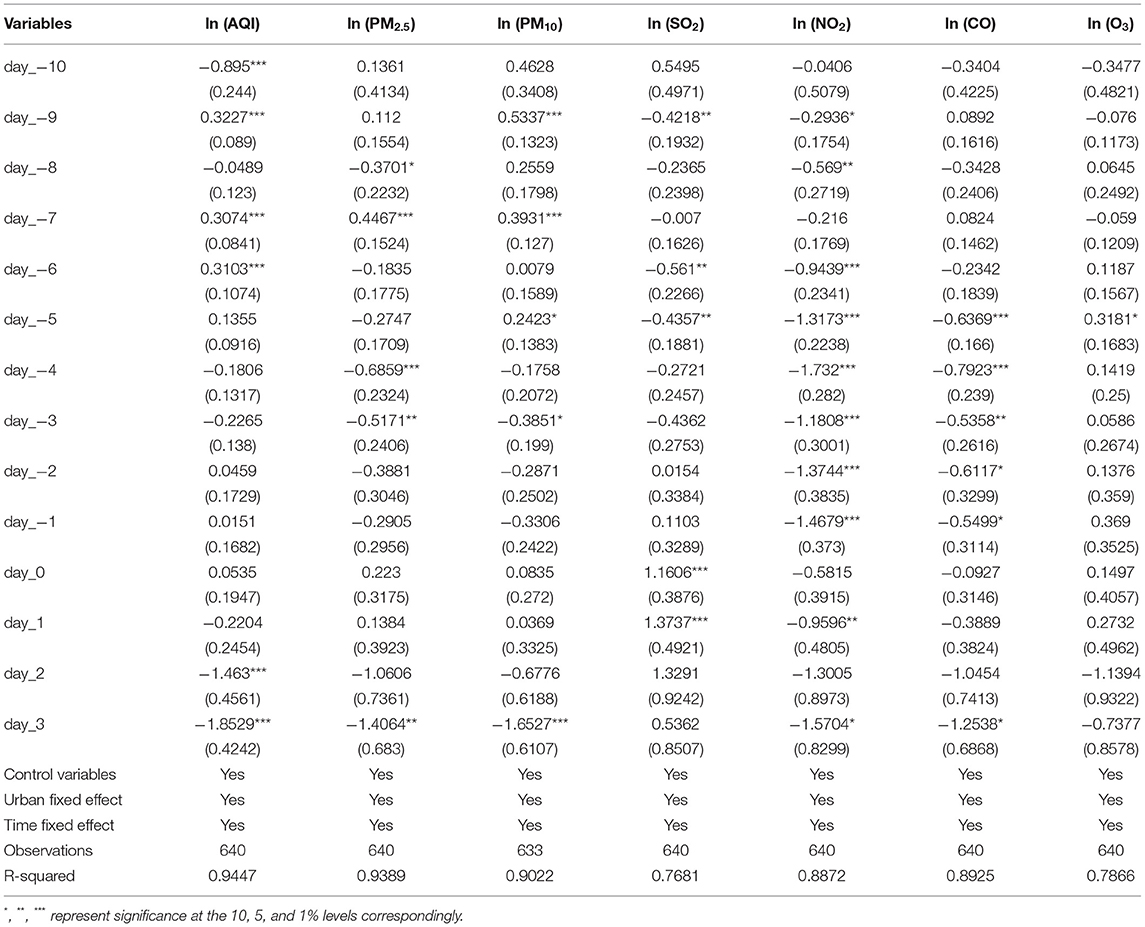
We conducted further counterfactual research utilizing the model below (Equation 11) to examine the parallel trend assumption with greater rigor (Guo et al., 2020). Specifically, we included interaction terms between the grouping variable “Treat” and the temporal tendency of the 10 days before carrying out the restriction work to validate the parallel tendency of the 10 days before enacting the prevention efforts. The commencement of the intervention actions and the following 3 days were incorporated to avoid complete collinearity. The parallel tendency hypothesis is met if the interaction items of 10 days before implementing the restriction efforts exist no apparent impact on the independent variables.
where d denotes the days since the beginning of the intervention policy, trendid indicates the time tendency, and γ1 is a series of estimated coefficients for the 10 days before the preventative measures start, indicating the divergence in pollutant indexes between the control and treatment groups when making a comparison to the time before implementing the intervention policy.
Table 7 presents the estimated results of model 11. Most of the estimated results for the first 10 days before the prevention efforts are near zero. Besides, most of the coefficients are not statistically significant, as we can observe. In addition, Figure 6 depicts the tendency of AQI estimation coefficients. We find that the coefficients are mostly close to zero before carrying out the measures, and that there is no obvious trend. The findings above indicate that the treatment and experimental groups have the same tendency before enacting the control measures (Zhang et al., 2020).
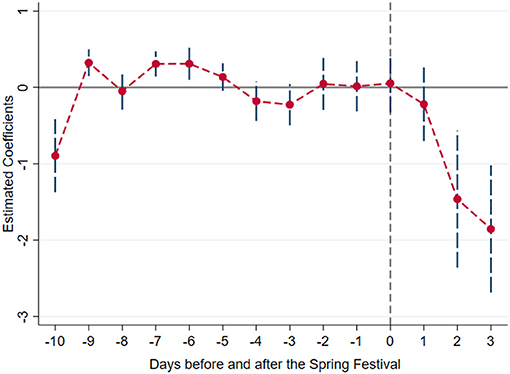
Figure 6. Tests on parallel trends hypothesis. The vertical dashed gray line denotes the initiation of the policy of staying in place for Lunar New Year of 2021.
Robustness Tests
Further evidence is provided to prove the robustness of our empirical findings. First, we evaluate if our conclusions are still true if the width of the sample window changes. The initial sample window of our research includes 10 days before and after the Chinese New Year. We removed the head and tail for 1–3 days, respectively, and re-evaluated our model. Table 8 show the findings of our research. The majority of the coefficients had similar orientations and magnitudes to our earlier results (i.e., coherent with Table 6).
Furthermore, considering that Chaoyang District, Haidian District, and Xicheng District intensified control efforts in the COVID-19 epidemic, we further confirmed whether the estimated results are robust by excluding Chaoyang District, Haidian District, and Xicheng District to prevent interference in economically developed areas. Table 9 shows only the impact of the other 13 urban areas. All the estimated results are robust to this series of changes, which indicates that our research results are not dominated by the super-developed urban areas most impacted by the pandemic.
PM2.5 Reduction-Induced Health Benefit Evaluation
We estimated the health effects and health economic benefits of PM2.5 reduction induced by COVID-19 epidemic control measures in three periods based on the results of previous studies. The estimation process adopts the PM2.5 concentration, resident population, GDP data, and related calculation formulas. We utilized the secondary standard limit of the annual average value of PM2.5 in China's Environmental Air Quality Standard (GB3095-2012) 35 μg·m−3. Specifically, we determined the PM2.5 concentration in the absence of the COVID-19 epidemic (P1) using the percentage decrease of PM2.5 concentration (Z%) due to the COVID-19 epidemic and the actual PM2.5 concentration data (P2) in each district of Beijing: P1 = P2/(1-Z%).
First, the P1 and exposed population data were substituted into the Poisson regression relative risk model (equations (4) and (5)), and the change of health effect (ΔE1) when there was no COVID-19 epidemic could be estimated. The change of health effect (ΔE2) when the COVID-19 occurred in each district of Beijing can be acquired through P2 in the same way. Then, the difference in the change of health effect (ΔE3 = ΔE1−ΔE2) can be obtained. The variation of health effect (ΔE4) attributed to the PM2.5 decrease owing to the restriction measures of COVID-19 outbreak can be obtained by dividing by the sum of days of the year (d) and multiplying by the number of days of each sample period (m):ΔE4 = Δ E3*m/d.
Finally, ΔE4 is brought into the model (9) to determine the monetary value of each health endpoint's economic benefits owing to the variation of PM2.5 concentration employing the unit economic value of each health effect. This section mainly consists of two parts: estimation and analysis of the avoided health risk owing to PM2.5 changes in Beijing during the initial epidemic outbreak in 2020, the epidemic outbreak in Beijing's Xinfadi market in 2020, and the policy period of staying in place for Lunar New Year of 2021. Besides, the health and economic benefit assessment results due to the PM2.5 changes in Beijing during these three special periods are estimated and analyzed, as described below.
Avoided Health Risk Assessment
In this part, we evaluated the health effect of each health endpoint of PM2.5 reduction caused by the COVID-19 epidemic. Then, we assessed the total health effects of 16 urban areas in Beijing by adding up the health effects of all health endpoints.
Health Endpoint Effects Assessment
We summarized the avoided health risks' estimation results of health endpoints in Beijing's 16 urban areas during the above three epidemic periods. Generally, the findings demonstrate that PM2.5 reduction induced by restriction efforts has impacted each health endpoint, as observed in Table 10. Additionally, the degree of health endpoints affected by PM2.5 pollution varies depending on PM2.5 concentration, exposure population, outpatient incidence, and mortality in various urban areas. Similarly, the health effects of the same area are also various in distinct epidemic periods. Specifically, the health effects between different periods exist differences. It is estimated that the health effect of the PM2.5 decrease induced by the outbreak in the Xinfadi market is the greatest. It has a more extended sample period. For this reason, there is a greater impact of PM2.5 reduction than that of the other two periods, which are possible explanations. On the contrary, the policy of staying in place for the Lunar New Year in 2021 has a relatively short duration, so it brings a small influence due to PM2.5 reduction. As a result, its health effect is smaller than the former two. Furthermore, the number of health beneficiaries in divergent regions is also heterogeneous. The three periods have the greatest impact on the health of Chaoyang District and Haidian District while having little effect on Mentougou, Huairou, and Yanqing areas. The top three health endpoints for the health benefits owing to PM2.5 decrease are acute bronchitis, internal medicine clinic, and chronic bronchitis, accounting for about 80% of the total health effects. Cardiovascular diseases are relatively uncommon among hospitalized patients. Besides, the decline in PM2.5 caused by control measures in the three epidemic periods probably avoided premature deaths of 1,117 cases [95% CI (328, 1,676)], 1,273 cases [95% CI (339, 2098)], and 115 cases [95% CI (33, 175)], respectively.
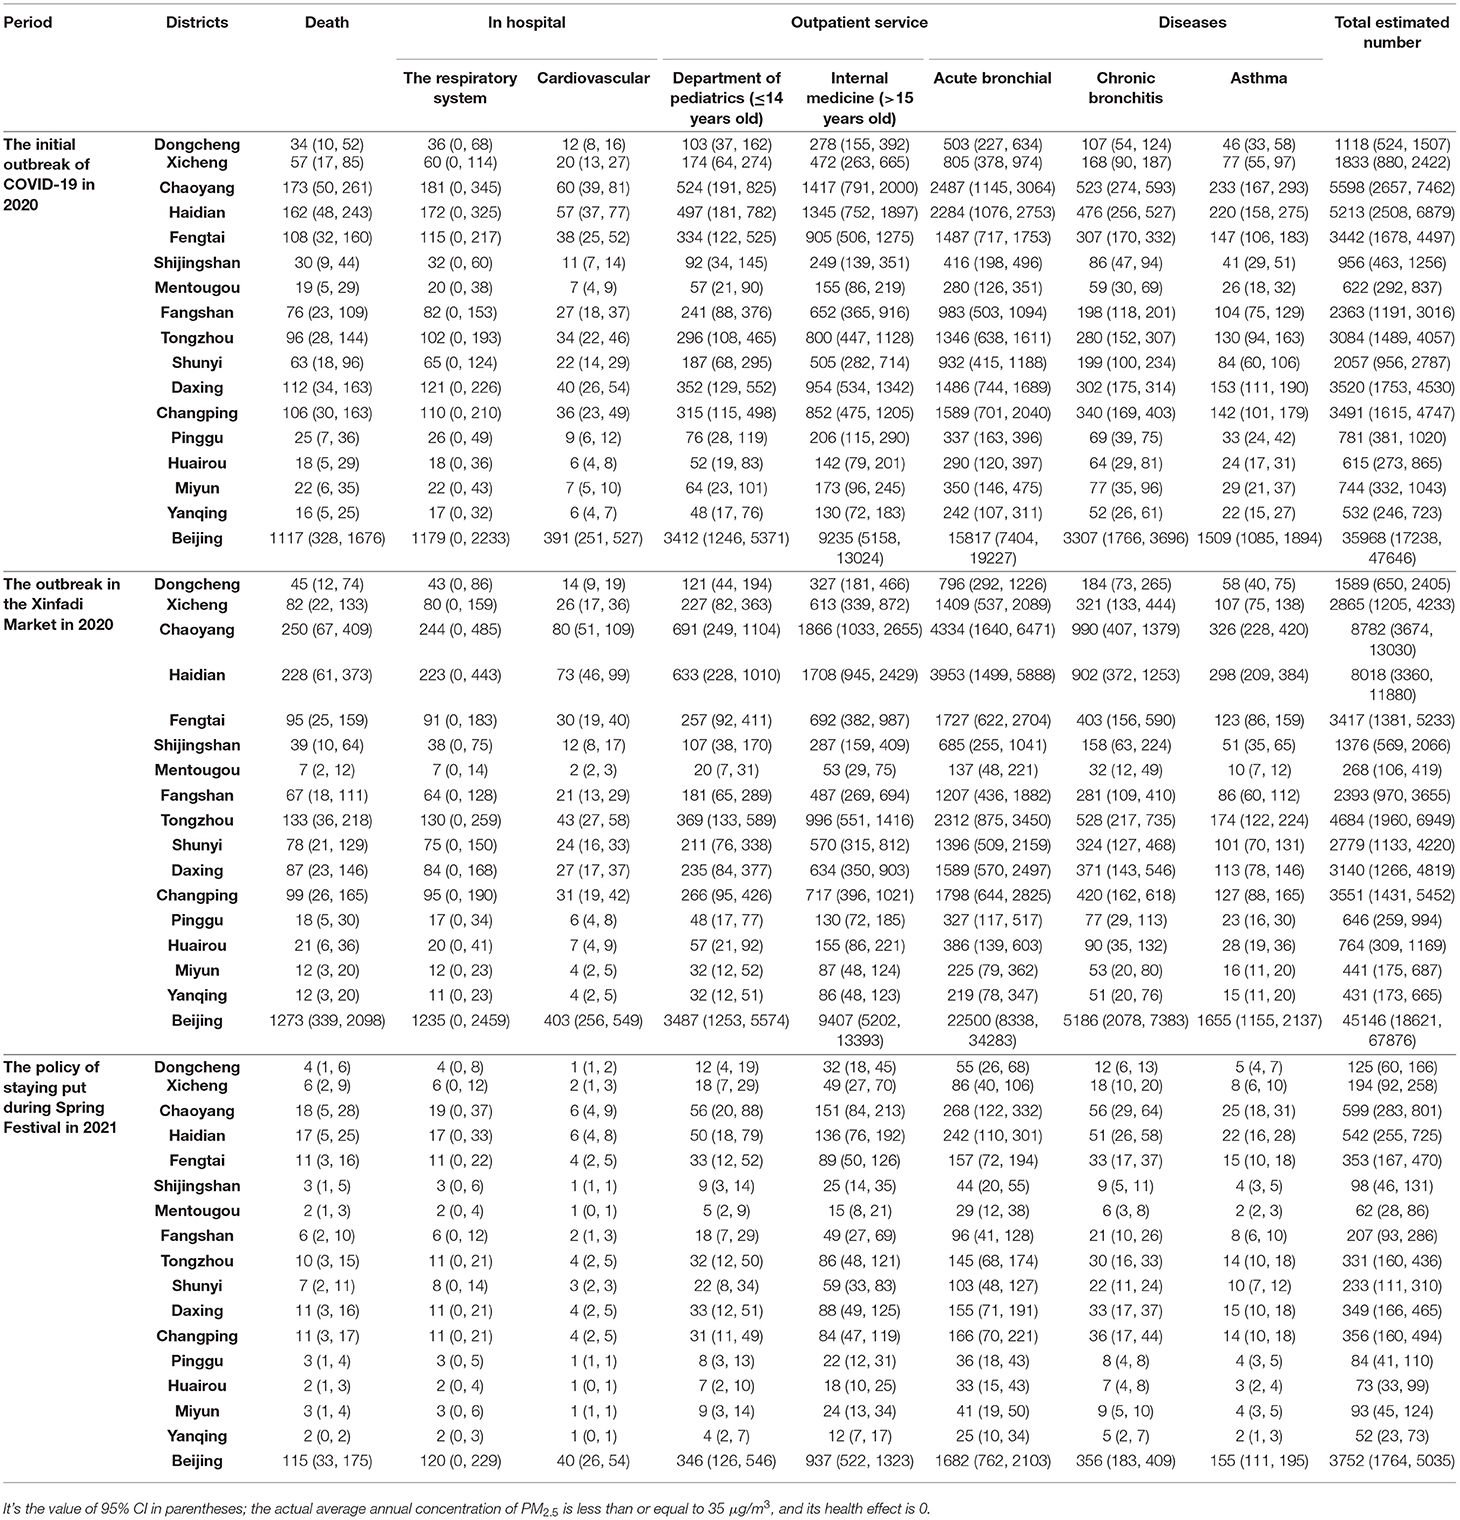
Table 10. Evaluated amount of health effects induced by PM2.5 reduction caused by the COVID-19 epidemic of 16 districts of Beijing in three periods (C0= 35 μg/m3).
Total Health Effects Assessment
Table 11 shows the results of the three-period evaluation and ranking of the total health effects of PM2.5 pollution changes in each of Beijing's urban areas. As observed, the total quantity of beneficiaries induced by the PM2.5 decline resulting from COVID-19's epidemic control measures in the three periods are 35,968 cases [95% CI (17,238, 47,646)], 45,146 cases [95% CI (18,621, 67,876)], and 3,752 cases [95% CI (17,64, 55,035)], respectively, and this is the total number of avoided premature death, respiratory disease hospitalization, cardiovascular disease hospitalization, internal medicine clinic, pediatrics clinic, acute bronchitis, chronic bronchitis, and asthma. In terms of different urban areas, the total number of health beneficiaries brought about by PM2.5 pollution changes is highest in Chaoyang District and lowest in Huairou, Miyun, Yanqing, and Mentougou. For example, at the beginning of the outbreak in 2020, the total health benefits of Chaoyang reached 5,598 cases [95% CI (2,657, 7,462)]. The second is Haidian with 5,213 cases [95% CI (2,508, 6,879)], followed by Daxing with 3,520 cases [95% CI (1,753, 4,530)], and Yanqing with 532 cases [95% CI (246, 723)]. The main reasons are as follows: on the one hand, the PM2.5 concentrations are higher in urban areas with more beneficiaries. On the other hand, the exposed population in these urban areas is relatively large. For example, the exposed population of Chaoyang district in 2018 is about nine times that of Huairou. The resident distribution is fairly dense and Huairou's per capita occupation area (5,128 m2) is about 39 times that of Chaoyang (131 m2).
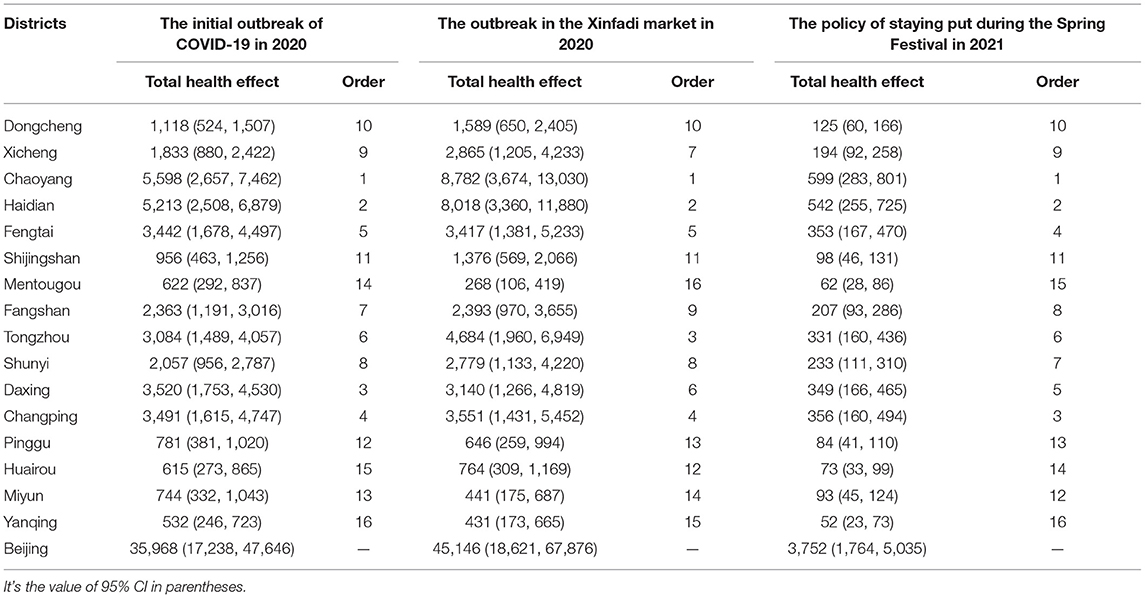
Table 11. Health effects and ranking of PM2.5 reduction caused by the COVID-19 epidemic of 16 districts of Beijing.
Avoided Economic Loss Evaluation
In this part, we assessed the health and economic benefit of various health endpoints and summarized the total health endpoint benefits of PM2.5 reduction due to the COVID-19 epidemic in various urban of Beijing.
Economic Benefits Evaluation of Health Endpoints
This section uses the methods in Section PM2.5 Reduction-Induced Health Effects and Economic Benefits to estimate the initial outbreak of COVID-19 in 2020, the outbreak of the Xinfadi market in Beijing, and the policy period of celebrating the Chinese New Year 2021 in place based on the evaluation results of health effects in Table 10 and the unit economic value of each health endpoint in Table 2. Table 12 shows the estimations of the health endpoint benefits of residents under the condition of PM2.5 reduction induced by prevention efforts. Generally, the corresponding economic benefits of health endpoints in Beijing and its 16 urban areas have the same characteristics as the number of health effects in terms of different epidemic periods. Additionally, the economic benefits of various health endpoints caused by the PM2.5 reduction are diverse due to differences in PM2.5 concentration, benchmark incidence, economic value per unit of health endpoints, and exposure population. For example, the health and economic benefit of the PM2.5 decrease in Beijing due to early death was 4,183.79 million yuan [95% CI (1,228.81, 6,278.53)]. In comparison, the health and economic benefit of hospitalization was 29.47 million yuan [95% CI (8.73, 48.38)] during the initial COVID outbreak in 2020. Furthermore, the health benefit of chronic bronchitis was the greatest, followed by early death, acute bronchitis, asthma, and hospitalization, while the health benefit of the outpatient clinic was the smallest.
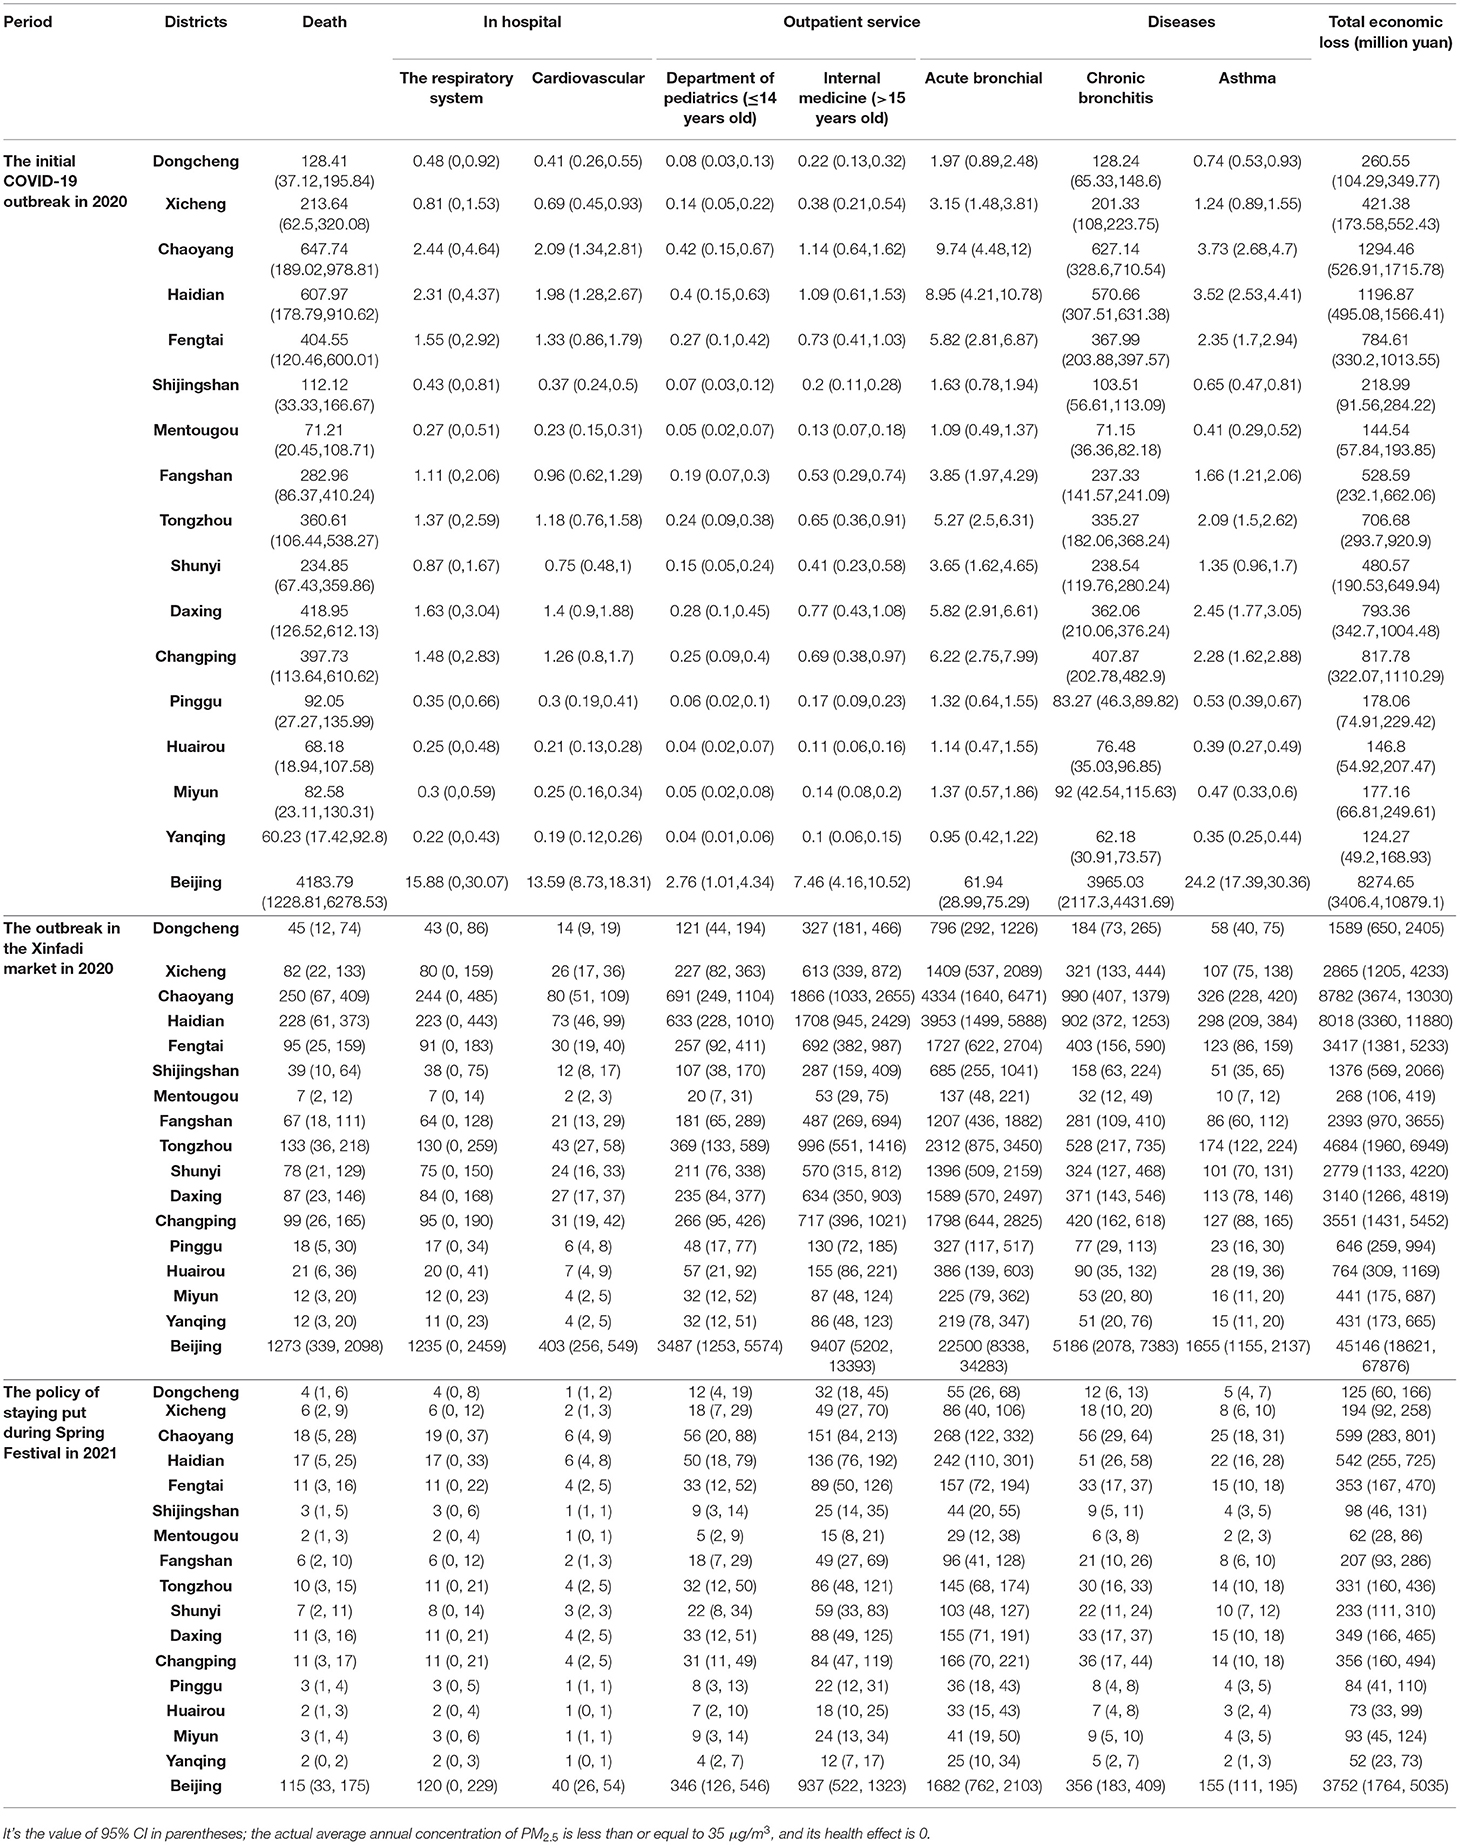
Table 12. Avoided economic loss of the health effects induced by PM2.5 reduction caused by the COVID-19 epidemic of 16 districts of Beijing in three periods (C0= 35 μg/m3, unit: million yuan).
Total Economic Benefits Evaluation
Table 13 summarizes the health and economic benefits of PM2.5 pollution changes caused by three-period epidemic prevention and control measures in Beijing and various regions. The total health and economic benefits induced by changes in PM2.5 pollution in Beijing and various districts over three periods are heterogeneous according to the assessed results in Table 13. Additionally, the per capita health economic benefits and total health benefits of various districts in Beijing are dissimilar or even quite divergent in the three periods, mainly due to divergences in resident population and PM2.5 concentration changes among Beijing's urban areas. Specifically, the avoided total health and economic loss induced by the PM2.5 reductions owing to the control measures in three epidemic periods are 82,747.65 million yuan [95% CI (3,406.4,10,879.1)], 11,143.71 million yuan [95% CI (3,826.43,16,949.1)], and 871.65 million yuan [95% CI (350.54, 1,165.95)], which accounted for 0.23% [95% CI (0.09%, 0.3%)], 0.31% [95% CI (0.11%, 0.47%),] 0.02% [95% CI (0.1%, 0.03%)] of the GDP of Beijing that year, respectively. Furthermore, Chaoyang, Haidian, Tongzhou, and Fengtai are still the areas that benefit the most from the changes in PM2.5 concentration in terms of health and economy. For instance, the health and economic benefits of the four urban areas were 2,154.15 million yuan [95% CI (751.53, 3,229.36)], 1,965.49 million yuan [95% CI (687.41, 2,942.39)], 1,148.71 million yuan [95% CI (400.8, 1,722.54)], 850.61 million yuan [95% CI (285.52, 1,319.71)], while the health and economic benefits of Yanqing, Mentougou, Huairou, and other districts are relatively low during the outbreak of the Beijing Xinfadi market.
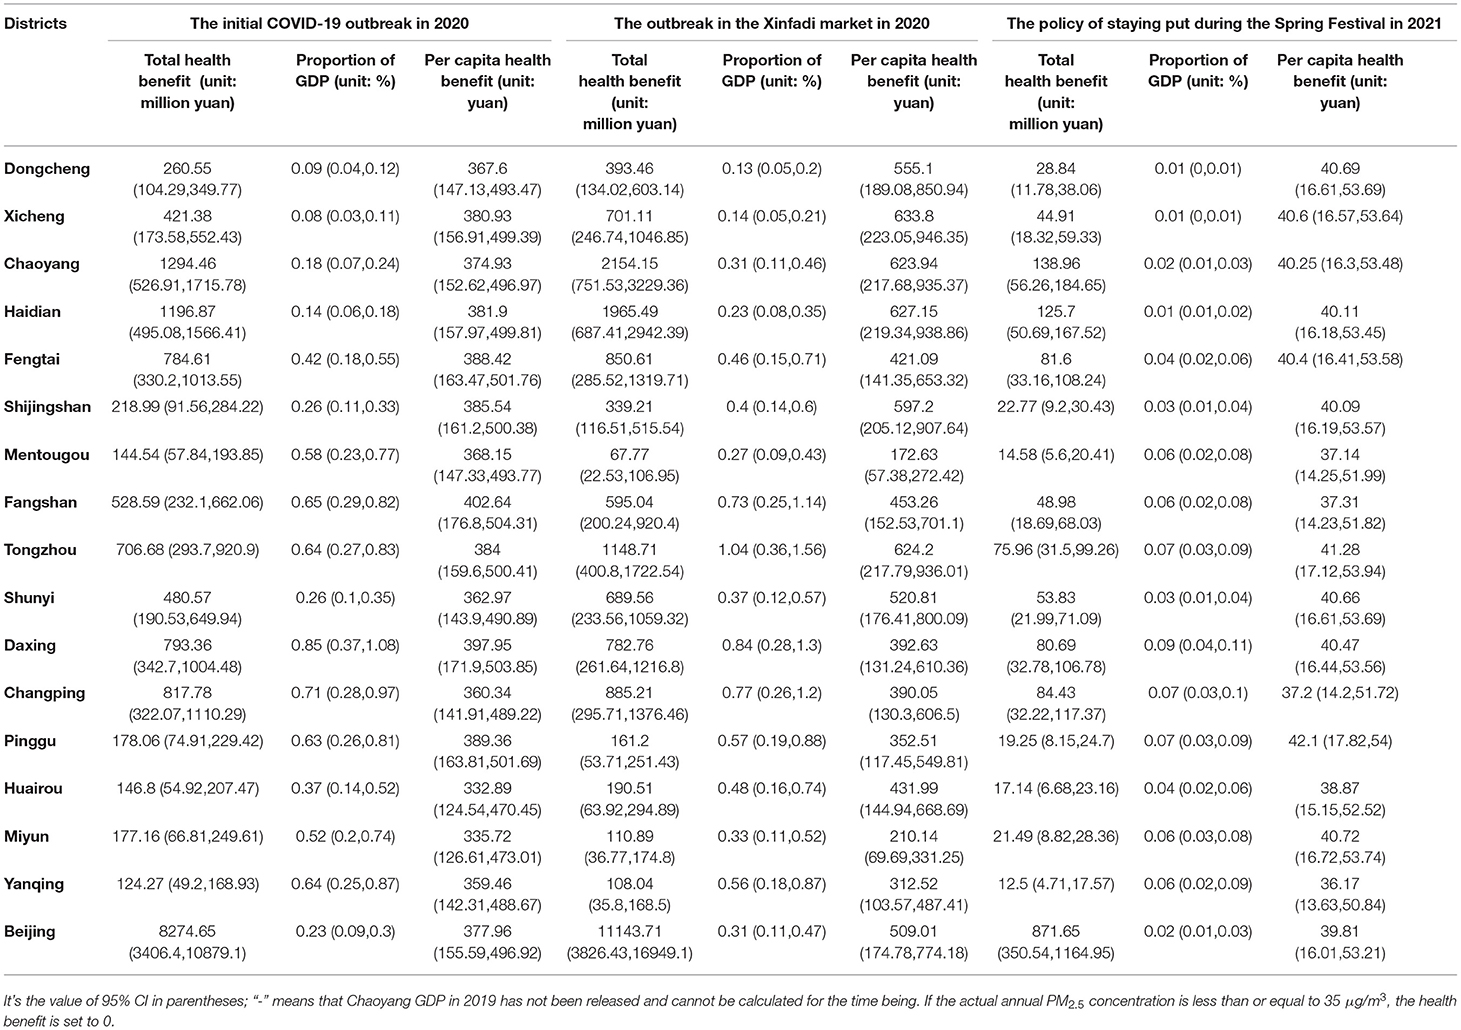
Table 13. Health benefits of PM2.5 reduction caused by the COVID-19 epidemic of 16 districts of Beijing in three periods.
Discussions on Recommendations for Meticulous Control of Air Pollution
China has enacted various stringent controls to prevent the epidemic of COVID-19 from spreading, such as closing factories and restricting traffic. However, Beijing still suffers from severe air pollution in extreme weather. People hold divergent perspectives on how to prevent and control air pollution effectively. Rigorous empirical research is required to quantify the causal impact of control actions on air pollution in the COVID-19 epidemic. Firstly, the methods and findings of this research provide a valuable natural experiment for exploring the causal effects of blockade efforts on air pollution. In our study, real-time observation data are used to demonstrate the changing air quality trend before and after the outbreak of COVID-19. Subsequently, LSDV and DID models are constructed to determine the causal impact of epidemic restriction efforts on air pollution and keep weather, holidays, and other influential factors from interfering. The execution of regulatory efforts improved air quality and provided empirical evidence for ascertaining the causal relation of blockade actions to air pollution in the COVID-19 pandemic. Furthermore, we could carry out targeted control of air pollution by comparing the influence of the pandemic on air pollutants in various periods and analyzing the causes of the distinction. What deserves our attention is that adopting lower-scale data is beneficial for the meticulous prevention, control, and governance of air pollution.
The study's two conclusions are critical for future air pollution mitigation. Firstly, traffic restrictions are crucial for controlling NO2 pollution in densely populated urban areas, which indicates an essential direction for NO2 pollution prevention. The management of traffic activities should focus on NO2 pollution control in the future. With the gradual lifting of traffic restrictions at the end of February 2020, epidemic prevention actions for public transport, such as buses and subways, continue to be strict. This may lead to an increase in the utilization of personal automobiles (Lee et al., 2020). Therefore, calling on urban daily travel to return to green safety is the government's primary concern. In this case, walking and cycling are advisable for personal travel. The infrastructure for non-motorized transportation, such as walking and cycling, is supposed to be optimized regularly, which will have dual benefits for pandemic control and air pollution mitigation in the long run. Additionally, the index system of travel intensity in the city can be established to accomplish precise management and control through the real-time observation of the big data system. Meantime, proper management, and motivations can be constituted to lower the strength of urban traffic, such as tail number restrictions, rising oil prices, public transportation subsidies, and others.
Secondly, the health and economic benefits of changes in PM2.5 concentrations are quantified in this study. The health effects were related to the exposure population, the change in PM2.5 concentration, the standard concentration threshold, the exposure-response relationship coefficient, and the baseline incidence. For each urban area of Beijing, the concentration of PM2.5 in the urban areas with more health benefits is higher, and the base of exposed population in these urban areas is larger. For example, the exposed population in Chaoyang District in 2018 is about nine times that of Huairou, and the distribution of residents is relatively dense. Therefore, the control of PM2.5 pollution concentration and the health and safety protection of residents in these urban areas will undoubtedly have great potential for health effects in the future. The health effects and health economic benefits owing to the PM2.5 decrease, along with the corresponding 95% confidence interval, provide a reference value for Beijing to meet the air quality standards, control severe ambient air pollution, and implement health early warning system.
Finally, the experimental importance of control efforts in reducing severe air pollution is also discussed in our study. The COVID-19 pandemic is a special public health event as it is particular and uncertain, providing an exceedingly unusual natural experiment for controlling the social and economic activities that impact air quality. Large-scale pollution outbreaks, such as haze pollution in the winter, have occurred in northern China, particularly in the Beijing area. Extreme air pollution is harmful to people's health and affects the regular operation of the social economy, particularly in regions with high population density and developed economies (Archer-Nicholls et al., 2016; Vu et al., 2019). Consequently, high-intensity limitations on population, transportation, and economic activities should be adopted to lower their damage and cope with serious urban pollution. For instance, in the event of an extreme air pollution incident, the remote work and online teaching system emerging during COVID-19's blockade will be immediately employed. This study provides significant evidence for the development of contingency designs for comprehensive socio-economic governance strategies in cases of severe pollution.
Conclusions
The COVID-19 epidemic has been around for a long time. However, it is not yet over and is entering the normalization stage. Outbreaks still occur in different regions. Therefore, it is still worthy of further study and remains an important issue to determine the causal impact of restriction efforts on air quality in the ecological environment. Here, by establishing LSDV and DID models, we quantitatively determine and compare the causal impact of control and blockade measures on air quality across three significant periods in China. We find that restriction measures have a significant positive influence on improving the air pollution in the ecological environment, and the effects of the three periods are different. As expected, during the initial outbreak in 2020, except for the increase in O3 concentration, the execution of control actions decreased the AQI by 7.8% and NO2, and SO2 by 46.76% and 37.32%. At the same time, the level of PM2.5, PM10, and CO had different degrees of decline, which fell by 34.07, 53.22, and 19.97%, respectively. Additionally, during the outbreak of the Xinfadi market in Beijing, the air pollutant concentrations, including O3, decreased significantly, of which O3 decreased by 7.26% and AQI and PM2.5 dropped by 22.61 and 45.12%, respectively, compared with the first period. During the policy period of staying in place for the Lunar New Year of 2021, except for slight decline in AQI and O3 levels, other pollutants decreased compared with the same period in 2019, among which NO2 decreased most obviously.
PM2.5 concentrations in the ecological environment beyond a particular threshold will raise the risk of cardiovascular and respiratory disorders, pose a potential threat to human life, and impose a significant economic cost on society. To this end, we also studied the health benefits of PM2.5 reductions due to control measures in three periods. Firstly, we discovered that the health effects of the same area are various in distinct epidemic periods, and that the number of health beneficiaries in different regions is also heterogeneous. Chaoyang, Haidian, Tongzhou, and Fengtai are the urban areas that have benefited most from the PM2.5 reduction, as evidenced by the COVID-19 outbreak in Beijing's Xinfadi market. Secondly, acute bronchitis, internal medicine clinics, and chronic bronchitis are the top three health endpoints for health benefits owing to the PM2.5 decrease, accounting for about 80% of the total health effects. Meanwhile, the decline in PM2.5 caused by control measures in the three epidemic periods probably avoided premature deaths of 1,117 cases [95% CI (328, 1,676)], 1,273 cases [95% CI (339, 2,098)], and 115 cases [95% CI (33, 175)], respectively. Furthermore, the total health and economic benefits owing to the PM2.5 reduction affected by the restriction actions in three pandemic periods were 82,747.65 million yuan [95% CI (3,406.4, 10,879.1)], 11,143.71 million yuan [95% CI (3,826.43, 16,949.1)], and 871.65 million yuan [95% CI (350.54, 1,165.95)], respectively.
It is necessary to indicate two fields that require further study. Although these control measures have led to unprecedented improvements in air quality, air pollution in the ecological environment remained high during the blockade. Other factors contributing to air pollution, such as coal-fired winter heating systems and unfavorable weather conditions, might be responsible for air pollutant concentrations (Chen et al., 2013; Ebenstein et al., 2017). Second, the positive impact on air quality is transient since the study noticed that restriction efforts in the COVID-19 pandemic only reduced China's air pollutant concentrations in the short term. Nevertheless, in the long run, when COVID-19 control measures are lifted, large amounts of energy consumption and industrial activities may bring about more severe air pollution (Wang and Su, 2020). Maintaining this improvement in air quality remains a major challenge. Finally, as air pollution is consistent with human life and economic activities, the improvement of air quality belongs to a prolonged fight. Despite the strong restriction actions on dealing with public health crises, such as the COVID-19 epidemic, which have alleviated air pollution in the ecological environment, they have led to great impairment on society and the economy. Consequently, an essential task for improving the air quality in Beijing is the establishment of sustainable development strategies that consider the economic, social, and ecological environment factors (Wang and Watanabe, 2019; Lee et al., 2020).
Data Availability Statement
The original contributions presented in the study are included in the article/supplementary material, further inquiries can be directed to the corresponding author/s.
Author Contributions
All authors listed have made a substantial, direct, and intellectual contribution to the work and approved it for publication.
Funding
This work was supported by the Major Program of the National Social Science Foundation of China (Grant No. 14ZDB151) and Jiangxi Provincial Natural Science Foundation (Grant No. 20212ACB211003).
Conflict of Interest
The authors declare that the research was conducted in the absence of any commercial or financial relationships that could be construed as a potential conflict of interest.
Publisher's Note
All claims expressed in this article are solely those of the authors and do not necessarily represent those of their affiliated organizations, or those of the publisher, the editors and the reviewers. Any product that may be evaluated in this article, or claim that may be made by its manufacturer, is not guaranteed or endorsed by the publisher.
Footnotes
1. ^Reference to the China national emergency broadcasting: http://www.cneb.gov.cn/2022/03/16/ARTI1647384446343556.shtml.
2. ^Reference to the report on China's practices in combating COVID-19: http://cn.chinadaily.com.cn/a/202004/21/WS5e9e45afa310c00b73c786ed.html.
3. ^The data comes from Zhaopin recruitment: https://www.zhaopin.com/.
4. ^Beijing Municipal Bureau of Statistics: Statistical Bulletin of National Economic and Social Development in Beijing (2019). Available online at: http://tjj.beijing.gov.cn/tjsj_31433/sjjd_31444/202003/t20200302_1673395.html (accessed August 18, 2020).
5. ^Statistical Information Center of National Health and Family Planning Commission. (2015). 2013 Report on the Fifth National Health Service Survey and Analysis. Beijing: China Union Medical University Press.
6. ^The Qingyue Open Environment Data Center. Available online at: http://dataold.epmap.org/.
7. ^Huiju Data. Available online at: http://hz.hjhj-e.com/home/.
8. ^The National Meteorological Information Center. Available online at: http://www.nmic.cn/.
9. ^The National Bureau of Statistics. Available online at: http://www.stats.gov.cn/.
10. ^Beijing Municipal Bureau of Statistics. Statistical Bulletin on National Economic and Social Development of Beijing in 2020. Available online at: http://www.beijing.gov.cn/zhengce/gfxwj/sj/202103/t20210312_2305538.html.
11. ^The Statistical Information Center of National Health and Family Planning Commission. (2020). China Health and Family Planning Statistical Yearbook. Beijing: China Union Medical University Press.
References
Ali, I., and Alharbi, O. M. L. (2020). COVID-19: disease, management, treatment, and social impact. Sci. Total Environ. 728, 138861. doi: 10.1016/j.scitotenv.2020.138861
Anderson, R. M., Heesterbeek, H., Klinkenberg, D., and Hollingsworth, T. D. (2020). How will country-based mitigation measures influence the course of the COVID-19 epidemic? Lancet 395, 931–934. doi: 10.1016/S0140-6736(20)30567-5
Archer-Nicholls, S., Carter, E., Kumar, R., Xiao, Q., Liu, Y., Frostad, J., et al. (2016). The regional impacts of cooking and heating emissions on ambient air quality and disease burden in China. Environ. Sci. Technol. 50, 9416–9423. doi: 10.1021/acs.est.6b02533
Bai, H., Gao, W., Zhang, Y., and Wang, L. (2022). Assessment of health benefit of PM2.5 reduction during COVID-19 lockdown in China and separating contributions from anthropogenic emissions and meteorology. J. Environ. Sci. 115, 422–431. doi: 10.1016/j.jes.2021.01.022
Bel, G., and Holst, M. (2018). Evaluation of the impact of Bus Rapid Transit on air pollution in Mexico City. Transp. Policy 63, 209–220. doi: 10.1016/j.tranpol.2018.01.001
Berkowitz, S. A., and Basu, S. (2021). Unmet social needs and worse mental health after expiration of COVID-19 federal pandemic unemployment compensation. Health Aff. 40, 426–434. doi: 10.1377/hlthaff.2020.01990
Briz-Redón, Á., Belenguer-Sapiña, C., and Serrano-Aroca, Á. (2021). Changes in air pollution during COVID-19 lockdown in Spain: a multi-city study. J. Environ. Sci. 101, 16–26. doi: 10.1016/j.jes.2020.07.029
Brodeur, A., Gray, D., Islam, A., and Bhuiyan, S. (2021). A literature review of the economics of COVID-19. J. Econ. Surv. 35, 1007–1044. doi: 10.1111/joes.12423
Chen, R., Chen, B., and Kan, H. (2010). A health-based economic assessment of particulate air pollution in 113 Chinese cities. China Environ. Sci. 30, 410–415.
Chen, Y., Ebenstein, A., Greenstone, M., and Li, H. (2013). Evidence on the impact of sustained exposure to air pollution on life expectancy from China's Huai River policy. Proc. Natl Acad. Sci. U.S.A. 110, 12936–12941. doi: 10.1073/pnas.1300018110
Chiaramonti, D., and Maniatis, K. (2020). Security of supply, strategic storage and Covid19: Which lessons learnt for renewable and recycled carbon fuels, and their future role in decarbonizing transport? Appl. Energy 271, 115216. doi: 10.1016/j.apenergy.2020.115216
Dang, H. H., and Trinh, T. A. (2021). Does the COVID-19 lockdown improve global air quality? New cross-national evidence on its unintended consequences. J. Environ. Econ. Manag. 105, 102401. doi: 10.1016/j.jeem.2020.102401
Dutheil, F., Baker, J. S., and Navel, V. (2020). COVID-19 as a factor influencing air pollution? Environ. Pollut. 263, 114466. doi: 10.1016/j.envpol.2020.114466
Ebenstein, A., Fan, M., Greenstone, M., He, G., and Zhou, M. (2017). New evidence on the impact of sustained exposure to air pollution on life expectancy from China's Huai River Policy. Proc. Natl Acad. Sci. U.S.A. 114, 10384–10389. doi: 10.1073/pnas.1616784114
Filonchyk, M., Hurynovich, V., Yan, H., Gusev, A., and Shpilevskaya, N. (2020). Impact assessment of COVID-19 on variations of SO2, NO2, CO and AOD over East China. Aerosol Air Qual. Res. 20, 1530–1540. doi: 10.4209/aaqr.2020.05.0226
Fu, S., and Gu, Y. (2017). Highway toll and air pollution: evidence from Chinese cities. J. Environ. Econ. Manag. 83, 32–49. doi: 10.1016/j.jeem.2016.11.007
Giannadaki, D., Giannakis, E., Pozzer, A., and Lelieveld, J. (2018). Estimating health and economic benefits of reductions in air pollution from agriculture. Sci. Total Environ. 622–623, 1304–1316. doi: 10.1016/j.scitotenv.2017.12.064
Guo, X., Xiao, B., and Song, L. (2020). Emission reduction and energy-intensity enhancement: the expected and unexpected consequences of China's coal consumption constraint policy. J. Clean. Prod. 271, 122691. doi: 10.1016/j.jclepro.2020.122691
Gupta, A., Bherwani, H., Gautam, S., Anjum, S., Musugu, K., Kumar, N., et al. (2021). Air pollution aggravating COVID-19 lethality? Exploration in Asian cities using statistical models. Environ. Dev. Sustain. 23, 6408–6417. doi: 10.1007/s10668-020-00878-9
Hammitt, J. K., and Robinson, L. A. (2011). The income elasticity of the value per statistical life: transferring estimates between high and low income populations. J. Benefit Cost Anal. 2, 1–29. doi: 10.2202/2152-2812.1009
Han, S. J., Wang, J., Yan, Q. S., Yang, L. M., Zhao, Q. Y., Wang, S. B., et al. (2019). Health benefit evaluation for PM10 and PM2.5 pollution control in Zhengzhou, China, 2014–2016. Environmental Science. 40, 2565–2571. doi: 10.13227/j.hjkx.201810255
Hao, Y., Niu, X., and Wang, J. (2021). Impacts of haze pollution on China's tourism industry: a system of economic loss analysis. J. Environ. Manage. 295, 113051. doi: 10.1016/j.jenvman.2021.113051
He, G., Pan, Y., and Tanaka, T. (2020). The short-term impacts of COVID-19 lockdown on urban air pollution in China. Nat. Sustain. 3, 1005–1011. doi: 10.1038/s41893-020-0581-y
Huang, C., Wang, Y., Li, X., Ren, L., Zhao, J., Hu, Y., et al. (2020). Clinical features of patients infected with 2019 novel coronavirus in Wuhan, China. Lancet 395, 497–506. doi: 10.1016/S0140-6736(20)30183-5
Huang, D., Xu, J., and Zhang, S. (2012). Valuing the health risks of particulate air pollution in the Pearl River Delta, China. Environ. Sci. Policy. 15, 38–47. doi: 10.1016/j.envsci.2011.09.007
Huang, D., and Zhang, S. Q. (2013). Health benefit evaluation for PM2.5 pollution control in Beijing-Tianjin-Hebei region of China. China Environ. Sci. 33, 166–174. doi: 10.3969/j.issn.1000-6923.2013.01.024
Hwang, H., and Lee, J. Y. (2022). Impacts of COVID-19 on air quality through traffic reduction. Int. J. Environ. Res. Public Health. 19, 1718. doi: 10.3390/ijerph19031718
Jiang, P., Fu, X., Van Fan, Y. V., Kleme,š, J. J., Chen, P., Ma, S., et al. (2021). Spatial-temporal potential exposure risk analytics and urban sustainability impacts related to COVID-19 mitigation: a perspective from car mobility behaviour. J. Clean. Prod. 279. 123673. doi: 10.1016/j.jclepro.2020.123673
Jiménez, J. L., and Perdiguero, J. (2017). Difference-Indifference. New York, NY: Springer. doi: 10.1007/978-1-4614-7883-6_664-1
Jones, E (2020). COVID-19 and the EU economy: try again, fail better. Survival 62, 81–100. doi: 10.1080/00396338.2020.1792124
Ju, M. J., Oh, J., and Choi, Y. H. (2021). Changes in air pollution levels after COVID-19 outbreak in Korea. Sci. Total Environ. 750, 141521. doi: 10.1016/j.scitotenv.2020.141521
Kan, H., and Chen, B. (1989). Analysis of exposure–response relationships of air particulate matter and adverse health outcomes in China. J. Environ. Health 19, 422–424.
Kan, H. D., Chen, B. H., and Wang, H. (2004). Economic assessment of health impact due to particulate air pollution in urban areas of shanghai. Chin. Health Econ. 23, 8–11. doi: 10.3969/j.issn.1003-0743.2004.02.003
Kassa, M. D., and Grace, J. M. (2020). Race against death or starvation? COVID-19 and its impact on African populations. Public Health Rev. 41, 30. doi: 10.1186/s40985-020-00139-0
Kim, E., Kim, B. U., Kim, H. C., and Kim, S. (2017). The variability of ozone sensitivity to anthropogenic emissions with biogenic emissions modeled by MEGAN and BEIS3. Atmosphere 8, 187. doi: 10.3390/atmos8100187
Kip Viscusi, W. K., Magat, W. A., and Huber, J. (1991). Pricing environmental health risks: survey assessments of risk-risk and risk-dollar trade-offs for chronic bronchitis. J. Environ. Econ. Manag. 21, 32–51. doi: 10.1016/0095-0696(91)90003-2
Kraemer, M. U. G., Yang, C. H., Gutierrez, B., Wu, C. H., Klein, B., Pigott, D. M., et al. (2020). The effect of human mobility and control measures on the COVID-19 epidemic in China. Science 368, 493–497. doi: 10.1126/science.abb4218
Lam, Y. F., Chang, J. M., Loo, B. P., Zhang, H. S., Leung, K. K., and Axhausen, K. W. (2022). Screening approach for short-term PM2.5. Atmosphere (CO: health communications)-benefits: a case study from 15 metropolitan cities around the world during the COVID-19 pandemic. Atmosphere 13, 18. doi: 10.3390/atmos13010018
Lanzi, E., Dellink, R., Chateau, J., Holland, M., and Klimont, Z. (2016). The Economic Consequences of Outdoor Air Pollution. Paris: OECD.
Lee, H., Park, S. J., Lee, G. R., Kim, J. E., Lee, J. H., Jung, Y., et al. (2020). The relationship between trends in COVID-19 prevalence and traffic levels in South Korea. Int. J. Infect. Dis. 96, 399–407. doi: 10.1016/j.ijid.2020.05.031
Li, J., and Lin, B. (2017). Environmental impact of electricity relocation: a quasi-natural experiment from interregional electricity transmission. Environ. Impact Assess. Rev. 66, 151–161. doi: 10.1016/j.eiar.2017.07.002
Li, L., Lei, Y., Wu, S., Chen, J., and Yan, D. (2017a). The health economic loss of fine particulate matter (PM2.5) in Beijing. J. Cleaner Prod. 161, 1153–1161. doi: 10.1016/j.jclepro.2017.05.029
Li, X., Qiao, Y., Zhu, J., Shi, L., and Wang, Y. (2017b). The “APEC blue” endeavor: causal effects of air pollution regulation on air quality in China. J. Cleaner Prod. 168, 1381–1388. doi: 10.1016/j.jclepro.2017.08.164
Lin, B., and Zhu, J. (2019). Impact of energy saving and emission reduction policy on urban sustainable development: empirical evidence from China. Appl. Energy 239, 12–22. doi: 10.1016/j.apenergy.2019.01.166
Liu, F., Page, A., Strode, S. A., Yoshida, Y., Choi, S., Zheng, B., et al. (2020). Abrupt decline in tropospheric nitrogen dioxide over China after the outbreak of COVID-19. Sci. Adv. 6, eabc2992. doi: 10.1126/sciadv.abc2992
Liu, F., Wang, M., and Zheng, M. (2021). Effects of COVID-19 lockdown on global air quality and health. Sci. Total Environ. 755, 142533. doi: 10.1016/j.scitotenv.2020.142533
Liu, X., Xie, P., Liu, Z., Li, T., Zhong, L., and Xiang, Y. (2010). Economic assessment of acute health impact due to inhalable particulate air pollution in the Pearl River Delta. Acta Sci. Nat. 46, 829–834. doi: 10.13209/j.0479-8023.2010.118
Lu, D., Zhang, J., Xue, C., Zuo, P., Chen, Z., Zhang, L., et al. (2021). COVID-19-induced lockdowns indicate the short-term control effect of air pollutant emission in 174 cities in China. Environ. Sci. Technol. 55, 4094–4102. doi: 10.1021/acs.est.0c07170
Lu, X., Lin, C., Li, Y., Yao, T., Fung, J. C., and Lau, A. K. (2017). Assessment of health burden caused by particulate matter in southern China using high-resolution satellite observation. Environ. Int. 98, 160–170. doi: 10.1016/j.envint.2016.11.002
Lv, L. Y., and Li, H. Y. (2016). Health economic evaluation of PM10 and PM2.5 pollution in Beijing-Tianjin-Hebei region of China. Acta Sci. Nat. Univ. Nankaiensis 49, 69–77.
Mahato, S., and Pal, S. (2022). Revisiting air quality during lockdown persuaded by second surge of COVID-19 of mega city Delhi, India. Urban Clim. 41. 101082. doi: 10.1016/j.uclim.2021.101082
Maji, K. J., Ye, W. F., Arora, M., and Shiva Nagendra, S. M. (2018). PM2. 5-related health and economic loss assessment for 338 Chinese cities. Environ. Int. 121, 392–403. doi: 10.1016/j.envint.2018.09.024
Matus, K., Nam, K. M., Selin, N. E., Lamsal, L. N., Reilly, J. M., and Paltsev, S. (2012). Health damages from air pollution in China. Glob. Environ. Change 22, 55–66. doi: 10.1016/j.gloenvcha.2011.08.006
Meo, S. A., Al-Khlaiwi, T., Usmani, A. M., Meo, A. S., Klonoff, D. C., and Hoang, T. D. (2020). Biological and epidemiological trends in the prevalence and mortality due to outbreaks of novel coronavirus COVID-19. J. King Saud Univ. Sci. 32, 2495–2499. doi: 10.1016/j.jksus.2020.04.004
Muhammad, S., Long, X., and Salman, M. (2020). COVID-19 pandemic and environmental pollution: a blessing in disguise? Sci. Total Environ. 728, 138820. doi: 10.1016/j.scitotenv.2020.138820
Nicola, M., Alsafi, Z., Sohrabi, C., Kerwan, A., Al-Jabir, A., Iosifidis, C., et al. (2020). The socio-economic implications of the coronavirus pandemic (COVID-19): a review. Int. J. Surg. 78, 185–193. doi: 10.1016/j.ijsu.2020.04.018
Querol, X., Massagu,é, J., Alastuey, A., Moreno, T., Gangoiti, G., Mantilla, E., et al. (2021). Lessons from the COVID-19 air pollution decrease in Spain: Now what? Sci. Total Environ. 779, 146380. doi: 10.1016/j.scitotenv.2021.146380
Rasul, G., Nepal, A. K., Hussain, A., Maharjan, A., Joshi, S., Lama, A., et al. (2021). Socio-economic implications of COVID-19 pandemic in South Asia: emerging risks and growing challenges. Front. Sociol. 6, 629693. doi: 10.3389/fsoc.2021.629693
Ren, J., Ma, Y., Panteha, F., and Sana, U. (2022). Managing transitions for sustainable economic development in post-COVID world: do fiscal and monetary support matter? Econ. Res. Ekon. IstraŽivanja 1–14. doi: 10.1080/1331677X.2022.2028176
Seo, J. H., Kim, J. S., Yang, J., Yun, H., Roh, M., Kim, J. W., et al. (2020). Changes in air quality during the COVID-19 pandemic and associated health benefits in Korea. Appl. Sci. 10, 8720. doi: 10.3390/app10238720
Shi, W., Bi, J., Liu, R., Liu, M., and Ma, Z. (2021). Decrease in the chronic health effects from PM2. 5 during the 13th five-year plan in China: impacts of air pollution control policies. J. Clean. Prod. 317, 128433. doi: 10.1016/j.jclepro.2021.128433
Vu, T. V., Shi, Z., Cheng, J., Zhang, Q., He, K., Wang, S., et al. (2019). Assessing the impact of clean air action on air quality trends in Beijing using a machine learning technique. Atmos. Chem. Phys. 19, 11303–11314. doi: 10.5194/acp-19-11303-2019
Wan, Z., Zhou, X., Zhang, Q., and Chen, J. (2019). Do ship emission control areas in China reduce sulfur dioxide concentrations in local air? A study on causal effect using the difference-in-difference model. Mar. Pollut. Bull. 149, 110506. doi: 10.1016/j.marpolbul.2019.110506
Wang, C., Horby, P. W., Hayden, F. G., and Gao, G. F. (2020a). A novel coronavirus outbreak of global health concern. Lancet 395, 470–473. doi: 10.1016/S0140-6736(20)30185-9
Wang, L., and Watanabe, T. (2019). Effects of environmental policy on public risk perceptions of haze in Tianjin city: a difference-in-differences analysis. Renew. Sustain. Energy Rev. 109, 199–212. doi: 10.1016/j.rser.2019.04.017
Wang, M., Liu, F., and Zheng, M. (2021). Air quality improvement from COVID-19 lockdown: evidence from China. Air Qual. Atmos. Health. 14, 591–604. doi: 10.1007/s11869-020-00963-y
Wang, P., Chen, K., Zhu, S., Wang, P., and Zhang, H. (2020b). Severe air pollution events not avoided by reduced anthropogenic activities during COVID-19 outbreak. Resour. Conserv. Recy. 158, 104814. doi: 10.1016/j.resconrec.2020.104814
Wang, Q., and Su, M. (2020). A preliminary assessment of the impact of COVID-19 on environment - a case study of China. Sci. Total Environ. 728, 138915. doi: 10.1016/j.scitotenv.2020.138915
Wang, S., Zhao, M., Xing, J., Wu, Y., Zhou, Y., Lei, Y., et al. (2010). Quantifying the air pollutants emission reduction during the 2008 Olympic Games in Beijing. Environ. Sci. Technol. 44, 2490–2496. doi: 10.1021/es9028167
Wang, Y., Liu, H., Mao, G., Zuo, J., and Ma, J. (2017). Inter-regional and sectoral linkage analysis of air pollution in Beijing–Tianjin–Hebei (Jing-Jin-Ji) urban agglomeration of China. J. Clean. Prod. 165, 1436–1444. doi: 10.1016/j.jclepro.2017.07.210
Wei, G. R., and Shi, X. M. (2018). Evaluation the extent of health damage caused by PM2.5 particulate in Xi'an city. Environmental Science. 39, 3014–3021. doi: 10.13227/j.hjkx.201710174
Xie, H., Zhu, T. Y., Liu, M. C., Song, D., Liu, J., and Zhang, J. L. (2015). Investigation and analysis of hospitalized patients of ACOS with asthma and COPD at the same time. Prog. Mod. Biomed. 15, 6279–6282. doi: 10.13241/j.cnki.pmb.2015.32.021
Xie, P., Liu, X., Liu, Z., Li, T., and Bai, Y. (2009). Exposure–response functions for health effects of ambient participate matter pollution applicable for China. China Environ. Sci. 29, 1034–1040. doi: 10.3321/j.issn:1000-6923.2009.10.006
Xie, X. X (2011). The Value of Health: Environmental Benefit Assessment Method and Control Strategy of Urban Air Pollution. Beijing: Peking University.
Xie, Y. B., Chen, J., and Li, W. (2014). An assessment of PM2. 5 related health risks and impaired values of Beijing residents in a consecutive high-level exposure during heavy haze days. Environmental Science. 35, 1–8. doi: 10.13227/j.hjkx.2014.01.057
Yang, Y., Liu, X., Zheng, J., Tan, Q., Feng, M., Qu, Y., et al. (2019). Characteristics of one-year observation of VOCs, NOx, and O3 at an urban site in Wuhan, China. J. Environ. Sci. 79, 297–310. doi: 10.1016/j.jes.2018.12.002
Yin, H., Pizzol, M., and Xu, L. (2017). External costs of PM2.5 pollution in Beijing, China: uncertainty analysis of multiple health impacts and costs. Environ. Pollut. 226, 356–369. doi: 10.1016/j.envpol.2017.02.029
Zeng, J., and Wang, C. (2022). Temporal characteristics and spatial heterogeneity of air quality changes due to the COVID-19 lockdown in China. Resour. Conserv. Recy. 181, 106223. doi: 10.1016/j.resconrec.2022.106223
Zhang, F., Xu, J., Zhang, Z., Meng, H., Wang, L., Lu, J., et al. (2015). Ambient air quality and the effects of air pollutants on otolaryngology in Beijing. Environ. Monit. Assess. 187, 495. doi: 10.1007/s10661-015-4711-3
Zhang, J., Li, H., Lei, M., and Zhang, L. (2021). The impact of the COVID-19 outbreak on the air quality in China: evidence from a quasi-natural experiment. J. Clean. Prod. 296, 126475. doi: 10.1016/j.jclepro.2021.126475
Zhang, M., Song, Y., and Cai, X. (2007). A health-based assessment of particulate air pollution in urban areas of Beijing in 2000–2004. Sci. Total Environ. 376, 100–108. doi: 10.1016/j.scitotenv.2007.01.085
Zhang, Y., Li, W., and Wu, F. (2020). Does energy transition improve air quality? Evidence derived from China's winter clean heating pilot (WCHP) project. Energy 206, 118130. doi: 10.1016/j.energy.2020.118130
Keywords: COVID-19, control measures, air quality, PM2.5 reduction, health benefit
Citation: Cai F, Yin K and Hao M (2022) COVID-19 Pandemic, Air Quality, and PM2.5 Reduction-Induced Health Benefits: A Comparative Study for Three Significant Periods in Beijing. Front. Ecol. Evol. 10:885955. doi: 10.3389/fevo.2022.885955
Received: 28 February 2022; Accepted: 04 April 2022;
Published: 26 May 2022.
Edited by:
Pei Du, Xi'an Jiaotong University, ChinaCopyright © 2022 Cai, Yin and Hao. This is an open-access article distributed under the terms of the Creative Commons Attribution License (CC BY). The use, distribution or reproduction in other forums is permitted, provided the original author(s) and the copyright owner(s) are credited and that the original publication in this journal is cited, in accordance with accepted academic practice. No use, distribution or reproduction is permitted which does not comply with these terms.
*Correspondence: Mengying Hao, bWVuZ3lpbmcuaGFvQGhvdG1haWwuY29t
 Fangfang Cai1,2
 Mengying Hao