 Clara H. Ferreira
 Mirjam Heinemans†
 Marta A. Moita
95% of researchers rate our articles as excellent or good
Learn more about the work of our research integrity team to safeguard the quality of each article we publish.
Find out more
ORIGINAL RESEARCH article
Front. Ecol. Evol. , 24 June 2022
Sec. Evolutionary Ecology of Social Behaviour
Volume 10 - 2022 | https://doi.org/10.3389/fevo.2022.885795
This article is part of the Research Topic Neuroethology of the Colonial Mind: Ecological and Evolutionary Context of Social Brains View all 14 articles
Animals in groups integrate social with directly gathered information about the environment to guide decisions regarding reproduction, foraging, and defence against predatory threats. In the context of predation, usage of social information has acute fitness benefits, aiding the detection of predators, the mounting of concerted defensive responses, or allowing the inference of safety, permitting other beneficial behaviors, such as foraging for food. We previously showed that Drosophila melanogaster exposed to an inescapable visual threat use freezing by surrounding flies as a cue of danger and movement resumption as a cue of safety. Moreover, group responses were primarily guided by the safety cues, resulting in a net social buffering effect, i.e., a graded decrease in freezing behavior with increasing group sizes, similar to other animals. Whether and how different threat levels affect the use of social cues to guide defense responses remains elusive. Here, we investigated this issue by exposing flies individually and in groups to two threat imminences using looms of different speeds. We showed that freezing responses are stronger to the faster looms regardless of social condition. However, social buffering was stronger for groups exposed to the fast looms, such that the increase in freezing caused by the higher threat was less prominent in flies tested in groups than those tested individually. Through artificial control of movement, we created groups composed of moving and freezing flies and by varying group composition, we titrated the motion cues that surrounding flies produce, which were held constant across threat levels. We found that the same level of safety motion cues had a bigger weight on the flies’ decisions when these were exposed to the higher threat, thus overriding differences in perceived threat levels. These findings shed light on the “safety in numbers” effect, revealing the modulation of the saliency of social safety cues across threat intensities, a possible mechanism to regulate costly defensive responses.
A major benefit of being in a group is the possibility of adding social information to directly perceived information about the environment to guide behavior. Across the animal kingdom, this social information can not only be actively transmitted via signals evolved specifically for communication (Hollén and Radford, 2009; Leonhardt et al., 2016), but also acquired through information-bearing cues of different sensory natures, which animals produce as they engage in their daily activities. Vertebrates use such social cues to procure food (Galef and Giraldeau, 2001), for example, using vision to assess where and how much others are eating (Coolen et al., 2005), to choose mates by copying the decisions of others (Kavaliers et al., 2017) based, for example, on olfactory cues (Galef and Laland, 2005), and to infer predation threat levels (Griffin, 2004), for instance, by auditory detection of escape (Murray et al., 2017) or freezing (active immobility response aimed at becoming inconspicuous) (Pereira et al., 2012). These types of social cue usage are also reported in invertebrates, including Drosophila melanogaster (Ferreira and Moita, 2019; Couzin-Fuchs and Ayali, 2021), guiding aggregation on food (Tinette et al., 2004; Dombrovski et al., 2017, 2019; Shultzaberger et al., 2018), reproduction-related decisions in mating (Mery et al., 2009; Danchin et al., 2018) and oviposition (Sarin and Dukas, 2009; Battesti et al., 2012; Bailly et al., 2021), as well as defensive responses (Ferreira and Moita, 2020), many of which rely at least partially on vision.
The acquisition and exploitation of the information provided by social cues can confer fitness benefits (Kendal et al., 2005), particularly in the context of a response to a potential threat: failure to detect a predator can lead to an animal’s immediate demise, whereas needless engagement in metabolically costly defense responses (Barrios et al., 2021) can negatively impact survival. That individual defense responses to predatory threats can vary in modality and vigor depending on the perceived threat level is well known (De Franceschi et al., 2016). Surprisingly, however, detailed studies of how different threat levels impact group behavior are still scarce. There are reports of modulation of group responses with threat, showing that prey species from higher-predation habitats form larger and more cohesive groups than those from lower predation environments (Seghers, 1974; Hager and Helfman, 1991; Magurran et al., 1992; Beauchamp, 2004). At the interplay of foraging and predation, there are further examples of modulation by threat level of reliance on social cues (Kendal et al., 2005). For example, bumblebees use the presence of conspecifics as a cue of safety, joining others at foraging sites only in potentially hazardous situations, when those sites were previously predator-infested (Dawson and Chittka, 2014). Minnows also use socially derived information and copy feeding location to a higher extent when exposed to a higher predation risk (Webster and Laland, 2008), an example of the “copy-when-asocial-learning-is-costly” hypothesis regarding social learning. These examples point to the fact that group foraging behaviors are modulated by threat level, and that reliance on social cues also varies with predation risk. Although it has been reported that the angle of approach of a threat can trigger different degrees of uniformity in escape formations (Marras et al., 2011), little is known regarding how different threat levels affect group defensive responses and reliance on social cues, which we addressed here.
To study responses to threat, we used visual looming stimuli mimicking an approaching predator, which have been reported to elicit defensive behaviors in all visual animals tested so far, from invertebrates, such as crabs (Oliva et al., 2007) and flies (Card and Dickinson, 2008; Zacarias et al., 2018), to vertebrates like mice (Yilmaz and Meister, 2013) and humans (Ball and Tronick, 1970). Using visual threats, whose properties can easily be manipulated in the lab, permits a detailed understanding of how different aspects of a threat affect the crucial deployment of defense responses. For example, a black disk sweeping overhead, mimicking a cruising predator, elicits freezing, while the same black disk expanding on the screen, as if looming toward the mouse, induces escapes (De Franceschi et al., 2016). Similarly, fruit flies have been shown to respond both with escapes and with freezing to repeated, inescapable, sweeping, and looming stimuli, where escapes predominate in response to sweeps (Gibson et al., 2015) and freezing in response to looms (Zacarias et al., 2018). In addition, in both zebrafish larvae (Bhattacharyya et al., 2017) and flies (Card, 2012; von Reyn et al., 2017), looming stimuli with lower approach rates evoke slower escapes, while higher approach rates evoke faster responses.
We had previously shown that flies exposed to looming stimuli in groups use social motion cues as both a cue of threat and safety (Ferreira and Moita, 2020). On the one hand, freezing in others leads to freezing in a focal fly. On the other hand, in line with buffering effects in other animals (Kiyokawa et al., 2004, 2014; Faustino et al., 2017), movement of others leads to movement resumption after freezing. In this study, we addressed how different threat levels affect group freezing behavior and usage of social motion cues. We used two loom speeds as different degrees of threat and analyzed freezing responses in individual and group tested flies to uncover the effect of threat imminence on group-mediated freezing responses. We then manipulated the social environment, controlling the numbers of moving and freezing flies surrounding a focal fly to clearly disentangle the effect of looming speed on the usage of social motion cues in regulating freezing responses.
Flies were kept at 25°C and 70% humidity in a 12:12 h dark:light cycle. Experimental animals were mated females, tested only once when 4–6 days old. For optogenetic manipulations, flies were transferred for 48 h before the experiments to food with 0.4 mmol/L retinal, a required co-factor for the function of the opsin CsChrimson. In experiments with mixed genotypes, focal flies were marked on the thorax using a white marker pen.
Wild-type flies used were Canton-S. LC6-splitGAL4 line w[1118]; P{y[ + t7.7] w[ + mC] = R92B02-p65.AD}attP40; P{y[ + t7.7] w[ + mC] = R41C07-GAL4.DBD}attP2 (Wu et al., 2016) and w[*] norpA[36] (blind flies) were obtained from the Bloomington stock center. The UAS-CsChrimson line used was w1118; P{20XUAS-IVS-CsChrimson.mVenus}attP2 (Klapoetke et al., 2014). LC6-splitGal4 driver-line flies were crossed with UAS-CsChrimson effector flies, to create LC6 > CsChrimson flies used for optogenetic induction of freezing (freezing flies).
Behavioral experiments were performed as described in (Ferreira and Moita, 2020), with minor modification. Briefly, we imaged unrestrained flies in 11° slanted polyethylene terephthalate (PETG) arenas with 68 mm diameter (central flat portion diameter 32 mm). A screen (Asus monitor running at 240 Hz, tilted 45° over the stage, Figure 1A) was used as a source of light and the delivery of looming stimuli. The experiments ran for 10 mins comprising a 5-min baseline where the screen was kept white, followed by a 5-min stimulation period where twenty 500 ms looming stimuli were delivered at random intervals ranging from 10 to 20 s [black circles in a white background, with a virtual object length of 1 cm (Zacarias et al., 2018), exponentially expanding at a speed of 25 or 50 cm/s; half length to speed ratios, l/v, values of 40 and 20 ms, respectively, corresponding to biologically relevant threats, which mimic damselfly attacks (von Reyn et al., 2014)]. The stage contained two arenas, and under it, a custom-built LED board that provided invisible backlight for video imaging (infrared, 940 nm) and red-light (627 nm) for optogenetic stimulation. Videos were acquired through Bonsai (Lopes et al., 2015) at 60 Hz and 1,280 width × 960 height resolution using two USB3 cameras (PointGrey Flea3). We tested wild-type flies alone and in groups of five, as well as one focal wild type (marked with white paint) surrounded by different proportions of blind, moving flies, and optogenetically manipulated, freezing flies.
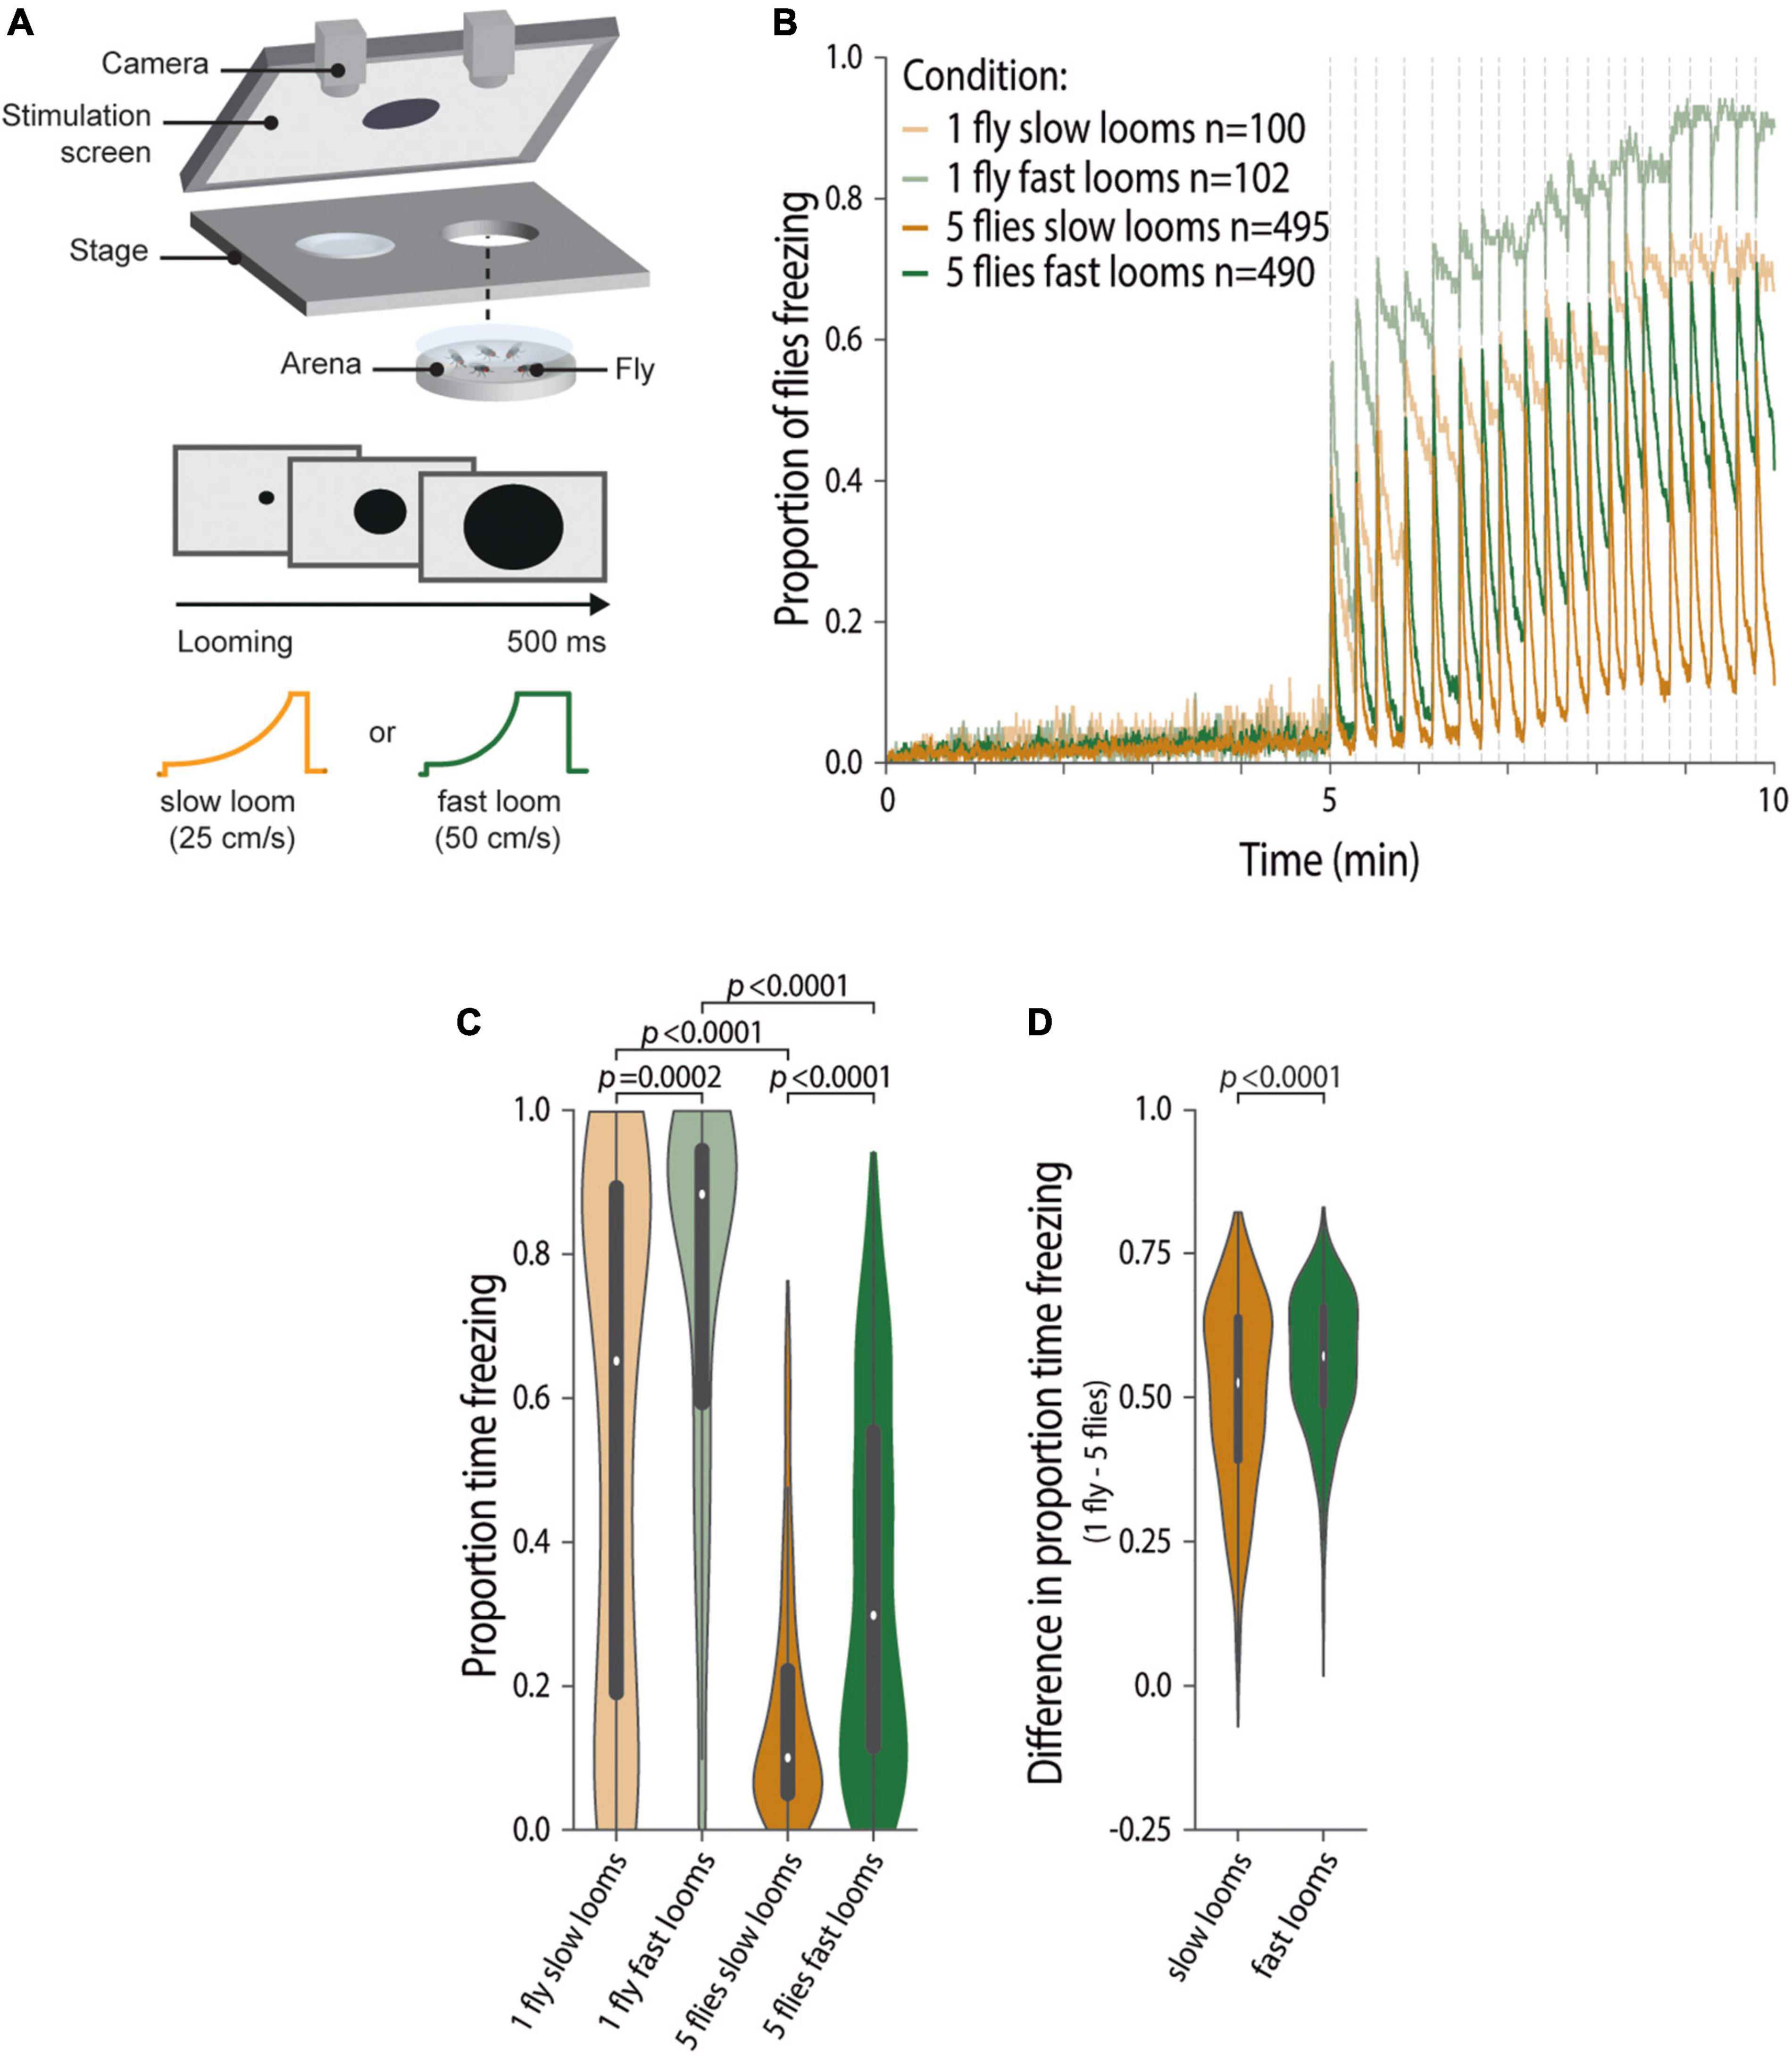
Figure 1. Group freezing responses scale with threat imminence. (A) Experimental setup and conditions: we tested individuals and groups of five flies in backlit arenas imaged from above; after a 5-min baseline, flies were exposed to twenty 500 ms looming presentations, every 10–20 s; we provided either slow (25 cm/s, purple) or fast looms (50 cm/s, green). (B,C) Data for flies tested individually (lighter shades) and in groups (darker shades). (B) Fraction of flies freezing throughout the experiment; dashed lines represent looming stimuli presentations; n represents the numbers of flies tested for each condition. (C,D) Violin plots representing the probability density distribution of individual fly data bound to the range of possible values, with boxplots elements: [central white dot, median; box limits, upper (75) and lower (25) quartiles; whiskers, 1.5 × interquartile range]. (C) Proportion of time spent freezing in the stimulation period. P-values result from Kruskal–Wallis statistical analysis followed by Dunn’s multiple comparisons test. (D) Difference in the proportion of time spent freezing between individually tested flies and flies tested in groups for slow and fast looms (refer to the section “Materials and Methods”). P-value results from the two-tailed Mann–Whitney test.
Optogenetic stimulation followed two protocols and all LC6 > CsChrimson flies within the same protocol received the same stimulation: (1) stimulation without concurrent loom presentations–after a 5-min baseline period, 20 stimuli of pulsed red light at 50 Hz, 50% duty cycle (DC), 7.5 mw/cm2 normalized intensity were delivered over the course of another 5 min and (2) optogenetic manipulations with simultaneous looming stimuli–again after a 5-min baseline period, coinciding with the initiation of the presentation of the looms stimulation occurred over 2 min, at 50 Hz, 50% DC, 10 mW/cm2 normalized intensity.
Data were analyzed using custom scripts in spyder (python 3.8). Statistical testing was done in GraphPad Prism 7.03, and non-parametric, Kruskal–Wallis test followed by Dunn’s multiple comparison test or two-tailed Mann–Whitney test were chosen, as data were not normally distributed (Shapiro–Wilk test).
As reported in our previous study (Ferreira and Moita, 2020), we used IdTracker (Pérez-Escudero et al., 2014) to obtain the position of each individual fly throughout the video, and hence acquire x, y coordinates, and then used a costume Bonsai (Lopes et al., 2015) script to analyze motion and hence pixel change a 4 mm × 4 mm square around the center of mass of the fly. With these metrics, as described previously (Zacarias et al., 2018; Ferreira and Moita, 2020), we were able to classify different behaviors, taking into account pixel change and speed, namely, freezing and jumps.
Freezing bouts were classified as zero-pixel change detected around the fly for at least 500 ms (30 frames). Noise in the images can create pixel changes even when the fly is still visibly immobile. Therefore, to decrease the incidence of false freezing breaks (where the fly is still freezing but noise in the image creates pixel changes), within a bout of freezing, pixel changes occurring for less than 50 ms (3 frames) were allowed, that is only pixel changes detected for more than this period were considered true breaks in freezing.
Freezing in response to looms was determined using a time window starting 30 frames before each loom until 150 frames after the loom. The probability of freezing entries (or freezing onset) was calculated by determining the likelihood a fly that was not freezing 30 frames before a loom, started freezing during, or until 150 frames after it. Latency to freeze corresponds to the time from loom onset to the initiation of freezing (depicted in Supplementary Figures 1A,B). The probability of freezing exits (or freezing offset) between looms was calculated by determining the fraction of instances that flies were freezing within the 2 s after the loom and were not freezing in the last 0.5 s before the next loom (meaning they broke freezing in between looms).
The proportion of time spent freezing was quantified by taking the sum of the frames in which freezing occurred during the stimulation period (5 min, corresponding × frames) and dividing that by the total number of frames of this period. Flies typically freeze in bouts, initiating freezing around the end of the looming stimulus and remaining immobile for different lengths of time. The length of each freezing bout varies across looming stimuli and across flies, such that the same proportion of time freezing may result from different freezing patterns. Therefore, we also analyzed the distribution of freezing bout lengths, by measuring the time elapsed from freezing onset to offset or until the experiment ended (when flies once freezing remain immobile for the rest of the test session).
To determine when a jump occurred, we identified when a fly’s speed exceeded 75 mm/s for at least one frame, and applied a time constraint of 3 frames between two consecutive jumps (Zacarias et al., 2018; Ferreira and Moita, 2020).
To compare the effect size of a manipulation across conditions, for example, to compare the effect of manipulating social environment (individually vs. group tested flies) across threat level (slow vs. fast looms), we used the following strategy, as the use of common effect size statistics in non-parametric data is controversial: first, we took the median value of the proportion of time spent freezing by flies tested individually (from a sample of 20 flies exposed to slow looms) and subtracted the median value of time spent freezing by flies tested in groups (again a sample of 20 flies exposed to slow looms was used). We repeated this procedure 1,000 times (each time a random sample, with replacement, of 20 individuals was used), creating a distribution of difference values in the proportion of time spent freezing between flies tested individually and in groups, when exposed to slow looms. In this manner, we simulated 1,000 replicates of this experiment, allowing for an estimation of the effect size of manipulating the social environment of flies exposed to one threat level, i.e., slow looms. Next, we performed the same for flies exposed to fast looms, and a distribution of the difference between social conditions in the proportion of time spent freezing by flies tested under a higher threat level was generated. Finally, we compared the distributions thus generated, allowing for a comparison of the effect size of manipulating social condition across loom speeds. A similar procedure was performed to compare the effect size of manipulating threat level across social conditions. The same approach was used when analyzing freezing exits.
As previously described (Ferreira and Moita, 2020), we calculated motion cues for a focal as the summed product of speed and angle on the retina of a focal fly that each of the surrounding flies produces ∑speed = angleontheretina(θ) where .
We modeled the decision to stay frozen or resume movement using the scikit-learn logistic regression model, as previously described (Ferreira and Moita, 2020). Briefly, we modeled the probability of exiting freezing in between looming stimuli as a function of the looming speed and the average of the sum of the motion cue generated by neighboring flies during that freezing bout. We used 100,000 times bootstrapped data with replacement. To determine the explanatory power of each predictor, we determined the associated fraction of variance.
To study how different threat imminences affect social defensive responses of the flies, we first assessed whether the speed with which a looming dark disk approaches modulates freezing responses of individual flies. To this end, we compared freezing behavior of individually tested flies exposed to one of two looming speeds, 25 and 50 cm/s (Figure 1A). A pilot experiment suggested that individual freezing responses varied with looming speed and, indeed, we found that the fraction of flies freezing throughout the experiment when exposed to twenty renditions of the slower loom (25 cm/s) is inferior to that observed when flies are exposed to the same number of renditions at a faster speed (50 cm/s) (Figure 1B). This is further corroborated by the increased time spent freezing by flies exposed to the faster looms compared with flies exposed to the slower looms (Proportion of flies Freezing, PropF25 = 0.65 IQR 0.18–0.89, PropF50 = 0.88 IQR 0.58–0.94, Kruskal–Wallis, KW, followed by Dunn’s multiple comparisons test, D, p = 0.0002, Z = 4.12; Figure 1C). Exposure to faster looms also led to more rapid freezing responses, as revealed by the shorter latencies to freeze in response to the fast looms relative to slow looms (Supplementary Figure 1A). Having established that increasing looming speed increases freezing responses in flies tested individually, we will henceforth use looming speed to study how different levels of threat affect defensive behaviors in groups.
As flies show social buffering of defensive responses, that is, when exposed to a threat while surrounded by others they freeze less (Ferreira and Moita, 2020) and groups of animals can behave differently depending on the level of threat (Seghers, 1974; Hager and Helfman, 1991; Magurran et al., 1992; Beauchamp, 2004; Marras et al., 2011), we hypothesized that experiencing looms of different speeds impacts group behavior and the weights given to the available social information. We thus compared freezing responses of flies, tested in groups of five, exposed to the fast and slow looms (Figures 1B,C) and found that, just as individually tested flies, groups of five flies exposed to the faster looms freeze more than groups exposed to slower looms (PropF25 = 0.10 IQR 0.50–0.22, PropF50 = 0.30 IQR 0.11–0.55, KWD p < 0.0001, Z = 10.35; Figure 1C). In addition, flies exposed to fast looms in groups show shorter latencies to start freezing that are similar to those observed for flies tested individually (Supplementary Figure 1B). Although both flies tested individually and flies tested in groups responded with more sustained freezing to the faster loom, it is still possible that the impact of the social environment, that is, the degree of social buffering, varied with threat level. To test this possibility, we compared the decrease in freezing of flies tested in groups relative to freezing levels of individually tested flies for both loom speeds (refer to the section “Materials and Methods,” Figure 1D). We found that the decrease in freezing, caused by social buffering, was slightly but reliably bigger for flies exposed to fast looms (two-tailed Mann-Whitney, MW, p < 0.0001). In summary, the time flies spend freezing scales with perceived threat imminence, but the social environment seems to have a higher weight, albeit to a small extent, in guiding freezing responses when flies are exposed to faster looms.
When in a group, the movement generated by the neighboring flies leads to an increase in freezing exits resulting in faster resumption of activity and less sustained freezing in between loom presentations (Ferreira and Moita, 2020). Hence, we analyzed the effect of looming speed on the probability of exiting freezing (Figure 2). Consistent with our previous results, flies tested individually display low probability of exiting freezing [Prob(Fexit) 25 = 0.21, IQR 0.06–0.67, Prob(Fexit) 50 = 0.08 IQR 0.05–0.17; Figure 2A], and flies tested in groups are more likely to stop freezing in between looming stimuli [Prob(Fexit) 25 = 0.94 IQR 0.82–1.00, KWD p < 0.0001, Z = 11.78, Prob(Fexit) 50 = 0.79 IQR 0.44–0.94, KWD p < 0.0001, Z = 11.55; Figure 2A]. In line with the results for the proportion of time spent freezing (Figure 1), perceived threat imminence significantly affects the probability of exiting freezing in flies tested individually (KWD p = 0.0004; Figure 2A) and in groups (KWD p < 0.0001, Z = 3.92; Figure 2A).
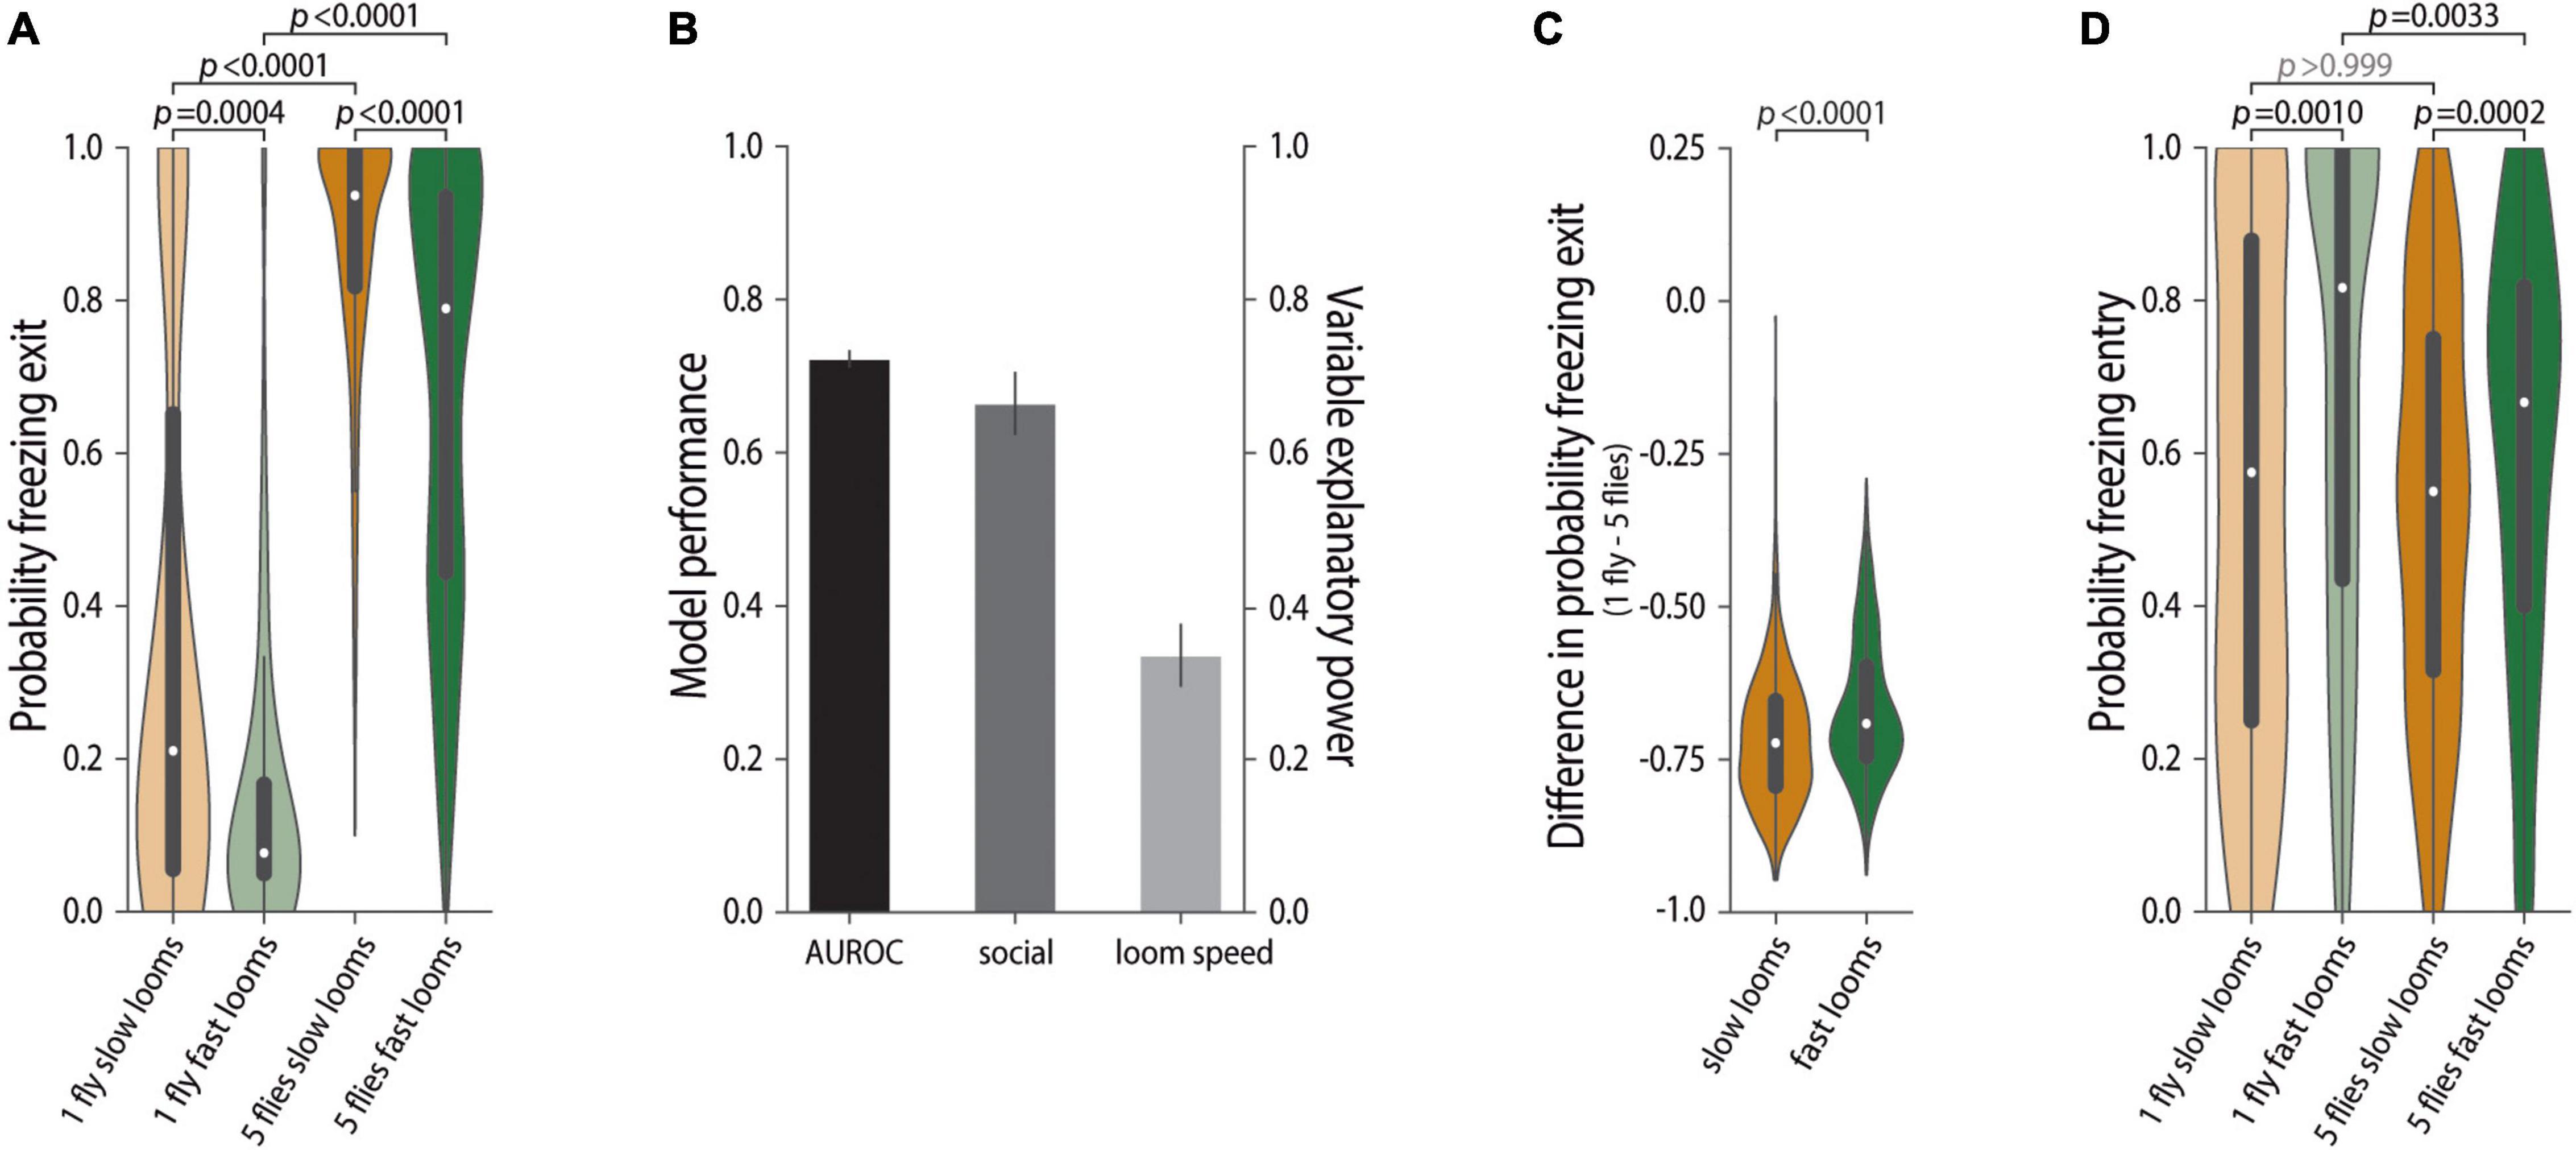
Figure 2. Probability of freezing exit in groups scales with threat imminence. (A,C,D) Violin plots representing the probability density distribution of individual fly data bound to the range of possible values, with boxplots elements: central white dot, median; [box limits, upper (75) and lower (25) quartiles; whiskers, 1.5 × interquartile range]. (A) Probability of freezing exit before the following looming stimulus. P-values result from Kruskal–Wallis statistical analysis followed by Dunn’s multiple comparisons test. (B) Logistic regression model of the decision to stop or continue freezing as a function of social motion cues and looming speed (10,000 bootstrapping events). Mean and standard deviation of model performance (AUROC–area under the receiver operating characteristic curve, black) and explanatory power of the social environment (dark gray) and looming speed (light gray). (C) Difference in the probability of freezing exit between individually tested flies and flies tested in groups for slow and fast looms (refer to the section “Materials and Methods”). P-value results from the two-tailed Mann–Whitney test. (D) Probability of freezing entry upon looming stimulus. P-values result from Kruskal–Wallis statistical analysis followed by Dunn’s multiple comparisons test.
To further explore the impact of threat level on the decision to stop freezing, we used a logistic regression model. In our prior study (Ferreira and Moita, 2020) such a model revealed that the motion cue generated by surrounding flies was the strongest predictor of the decision to stop freezing, explaining close to 90% of the variance in the data. Therefore, in this study, we modeled freezing exits using the motion cue of others and looming speed as predictors (refer to the section “Materials and Methods,” Figure 2B). This model accurately describes our data, as seen by the area under the receiver operating characteristic (AUROC), a measurement of model accuracy (0.72 ± 0.011), and shows that although the social motion cue explains most of the variance in the data (0.66 ± 0.041), looming speed also explains a significant part (0.33 ± 0.041). This model does not, however, allow us to look at the interaction between looming speed and the impact of social environment on the decision to stop freezing and resume activity. To address this issue, we compared the impact of the social environment on freezing exits observed for flies exposed to fast and slow looms, that is, we computed the difference P(Fexit)individual–P(Fexit)social, for flies exposed to both loom speeds, where a negative value means that there are more freezing exits in flies tested in groups. We found a small but reliable difference across loom speeds, as seen by the less negative values for flies exposed to the faster rather than to the slower looms (refer to the section “Materials and Methods,” MW p < 0.0001, Figure 2C). Thus, the social environment had a stronger impact on freezing exits of flies exposed to slow looms, albeit to a small degree. As in our experimental conditions (in this and our prior study (Ferreira and Moita, 2020)) being surrounding by others leads to a buffering of freezing, it might be no surprise that this buffering effect is stronger under lower threat levels, which is in line with the finding that both for flies tested individually and for flies in groups, freezing bouts are shorter when exposed to slow looms than when exposed to fast looms (Supplementary Figures 1C,D). However, it stands in contrast with the stronger social impact on total time spent freezing for flies exposed to the fast loom. As the proportion of time spent freezing depends on both the probability of entering freezing upon a loom and the probability of breaking from freezing before the next loom, it is possible that while the social impact on freezing exits is bigger when flies are exposed to slow looms, the probability of entering freezing upon a loom may be decreased in groups to a larger extent during exposure to faster looms. Indeed, we found that flies exposed to slow looms individually or in groups are equally likely to enter freezing, whereas for flies exposed to fast looms, being in a group decreases the probability of freezing entry (KWD p < 0.0033, Z = 3.456, Figure 2D). This finding could result from a shift in balance of the weights given to social danger and safety cues as a function of threat level. In conclusion, looming speed affects both freezing entries and exits, an effect that may interact, even if weakly, with the impact of the social environment on freezing behavior.
Our results so far establish that both threat imminence and the social environment affect freezing responses. However, in these experiments, the social environment, i.e., the behavior of flies in the group, varies with threat level, as reflected in the increased average motion cue generated by groups of flies exposed to the slow looms relative to the motion cues produced by groups exposed to fast looms (Supplementary Figure 2). Therefore, to test the impact of threat imminence on the use of social cues, it is crucial to have experimental control over the social cues, namely, the motion of others, such that for different threat levels, the motion cues surrounding a focal test fly remain similar. To manipulate the social environment, we controlled the proportion of moving and freezing flies around a focal fly, from all four flies moving to all freezing and the various proportions in between. The same group compositions were exposed to the fast and slow looms (Figure 3). We used blind, NorpA mutant flies, which do not perceive the looming stimulus and walk the entirety of the experimental time, as the moving neighboring flies. This produces the highest surrounding motion cues, a manipulation we had previously shown to lower freezing by focal flies (Ferreira and Moita, 2020). To create freezing flies, we artificially induced freezing by optogenetically activating lobula columnar neurons 6 (LC6) using the channelrhodopsin CsChrimson (Klapoetke et al., 2014), LC6 > CsChrimson (Supplementary Figure 3A). Making use of these freezing and moving fly lines to create different proportions of moving and freezing flies (Supplementary Figures 3B,C), we were able to produce graded motion cues in groups for both looming speeds (Figures 3A,B). Crucially, these motion cues were similar across threat imminences (Figure 3C). However, optogenetically activating LC6 neurons, in addition to driving freezing, also triggers jumps coupled to the loom presentations, especially during the first 2 s of stimulation (Supplementary Figures 3D,E). This means that stable graded motion cues were present about 2 s after the first loom, being briefly interrupted upon loom onset subsequently (Figures 3A,B). It was therefore not possible with this manipulation to examine freezing as a social cue of threat, which mostly modulates freezing onset (Ferreira and Moita, 2020). However, the stable motion cues in between looming stimuli allowed the study of the use of safety cues, which modulate the resumption of activity by a fly that froze after the loom (Ferreira and Moita, 2020).
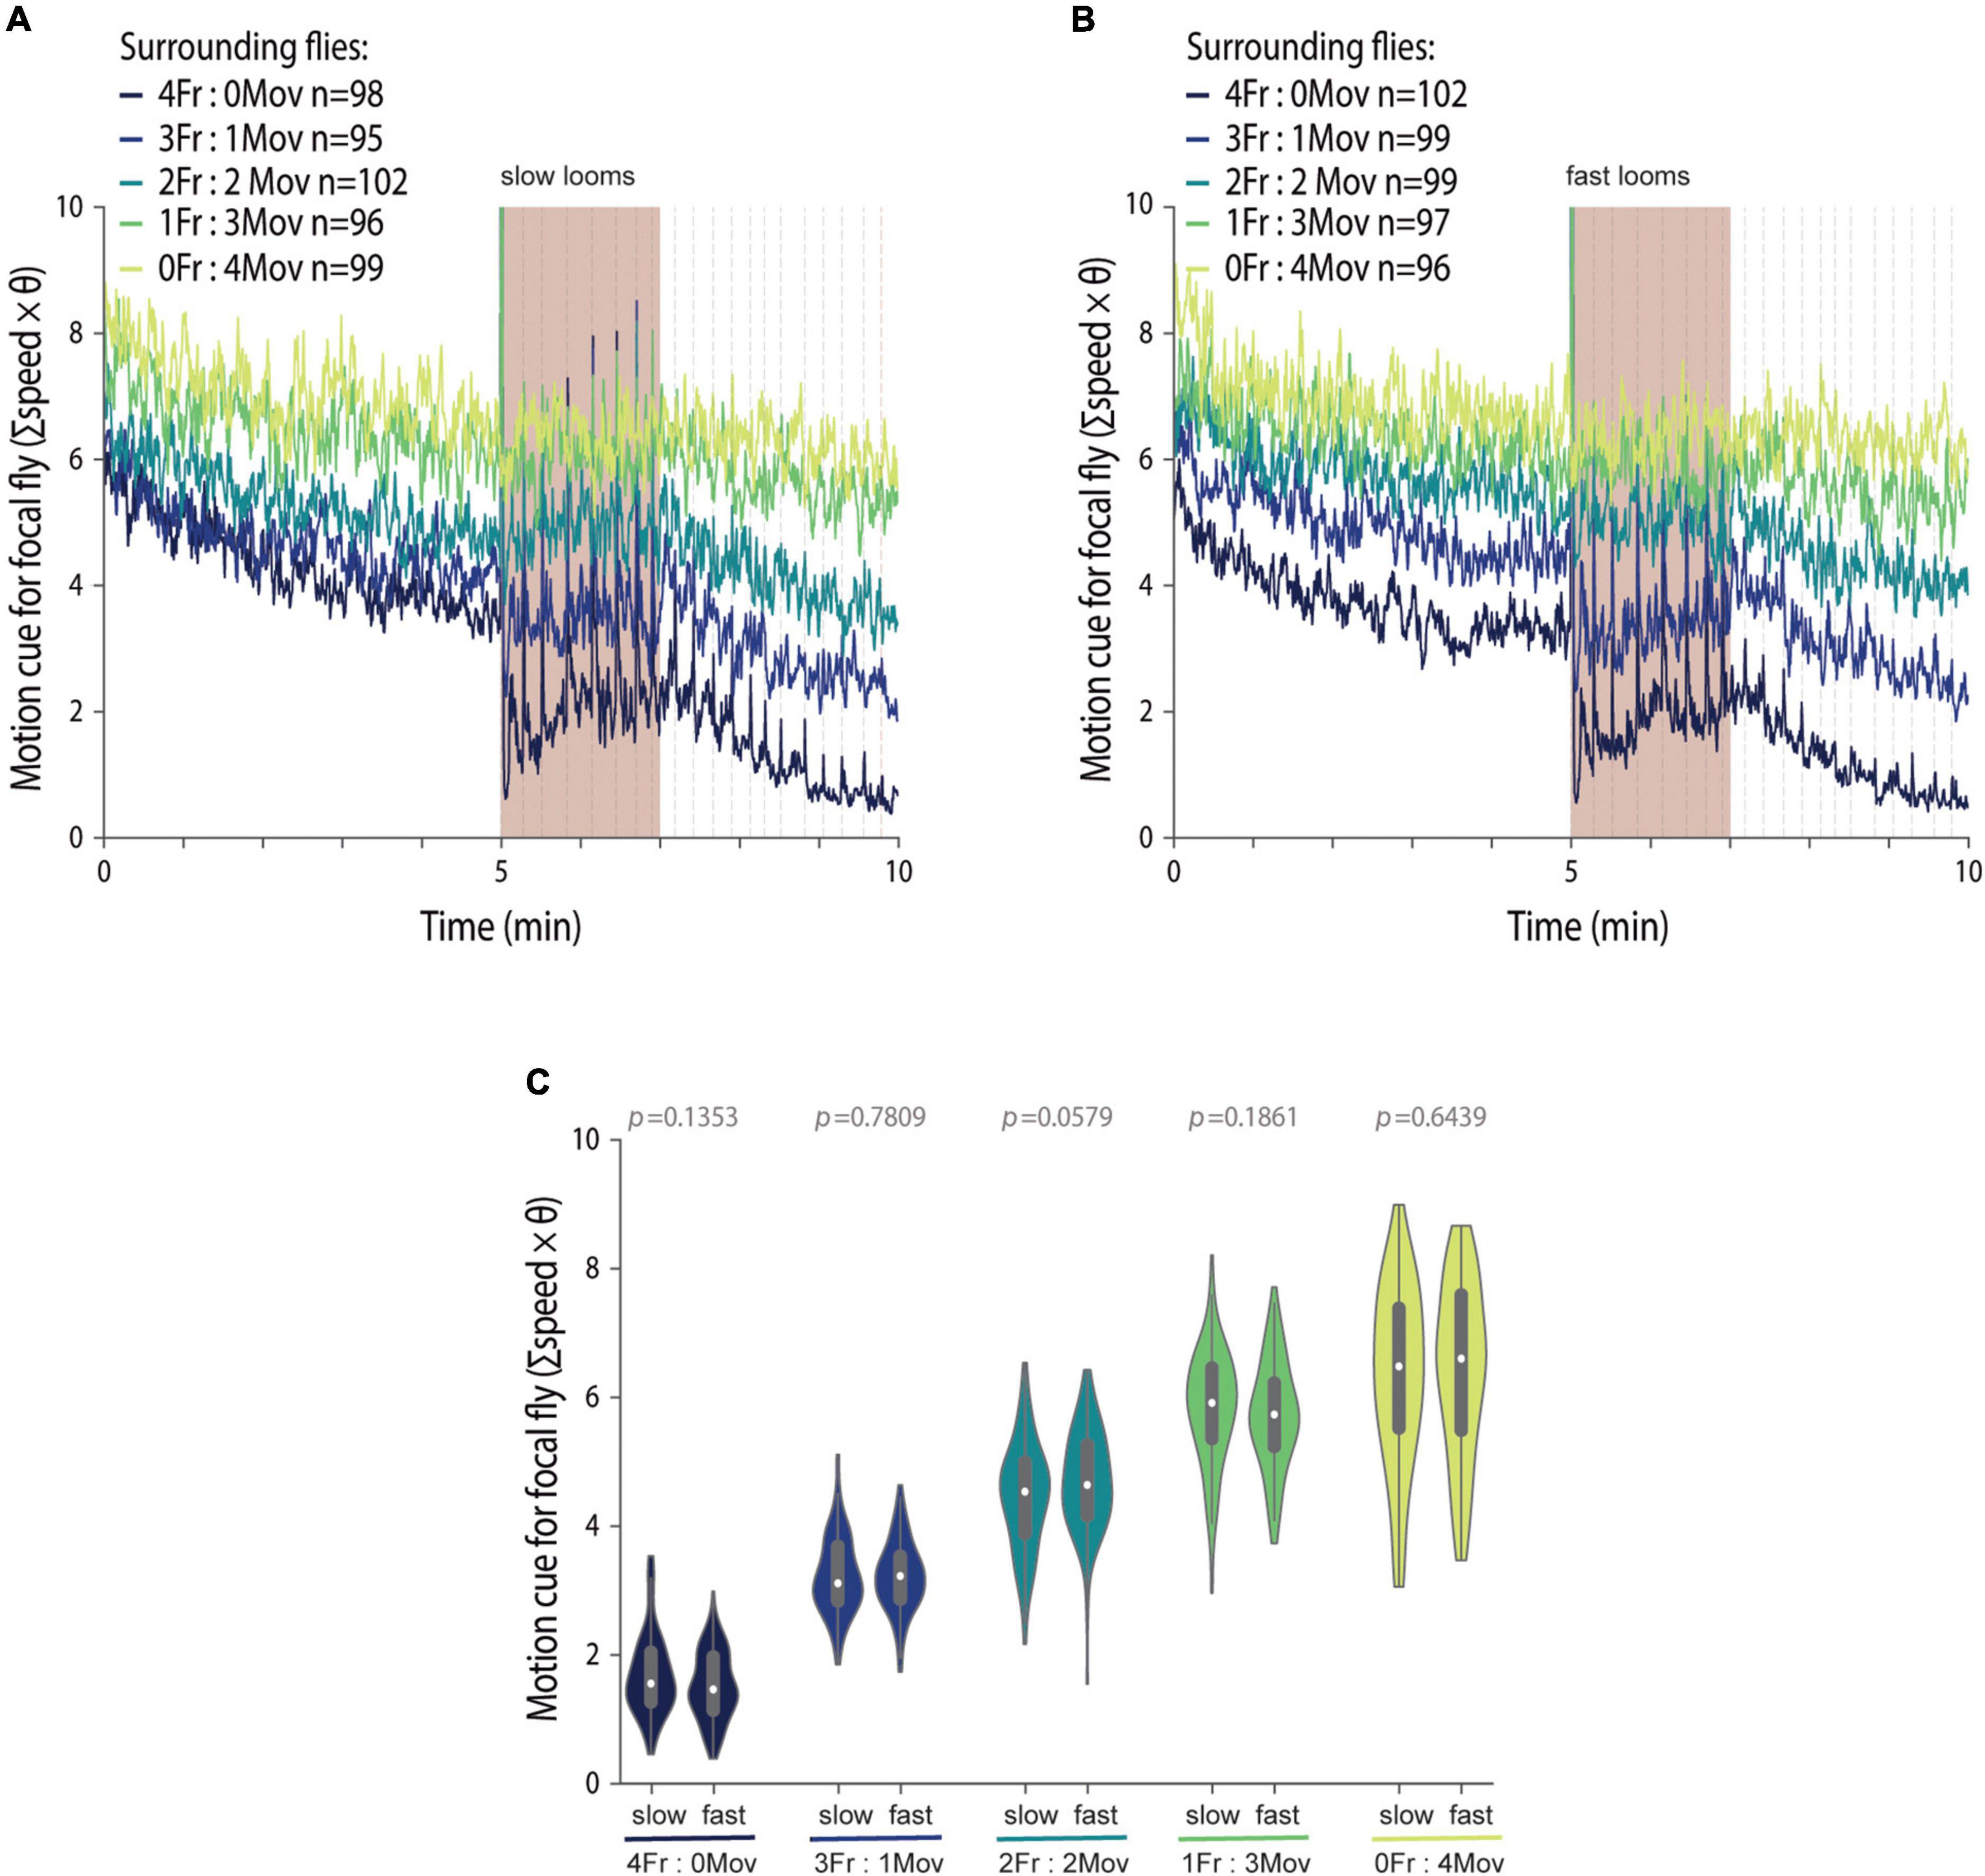
Figure 3. Manipulating the social environment produces similar motion cues across threat imminences. (A–C) We manipulated four out of the five flies in a group, to surround focal flies with groups with different proportions of flies that always move (blind flies, NorpA) and flies that are optogenetically made to freeze (LC6 > CsChrimson). The color code for the groups is presented in (A,B). Motion cues (refer to the section “Materials and Methods”) produced by the manipulated surrounding flies throughout the experiment when exposed to slow (A) or fast looming stimuli (B); dashed lines represent looming stimuli presentations; n represents the numbers of groups tested for each condition. (C) Violin plot representing the probability density distribution of individual fly data bound to the range of possible values, with boxplots elements: [central white dot, median; box limits, upper (75) and lower (25) quartiles; whiskers, 1.5 × interquartile range]. Average motion cues produced by the manipulated surrounding flies during the stimulation period. P-values result from the two-tailed Mann–Whitney test; significance is determined via Bonferroni correction.
Having a handle on the social environment allowed us to analyze the behavior of focal wild-type flies exposed to similar social motion cues while being presented with looming stimuli of different speeds (Figure 4) and assess how different threat levels affect social cue usage. In both cases, we found that a graded manipulation of the social motion cues leads to graded freezing responses of focal flies, as seen in the proportion of flies freezing throughout the experiment (Figures 4A,B) and in the proportion of time each fly spends freezing (KW p < 0.0001, statistic = 127.5, Figure 4C; KW p < 0.0001, statistic = 196.8, Figure 4D). In addition, overall, flies exposed to faster looms freeze more than flies exposed to slower looms (Figure 4C). In opposition to our previous findings (Ferreira and Moita, 2020), flies surrounded by all freezing flies froze less than flies alone; we believe this is due to the induction of jumps, which affects freezing entries as mentioned above.
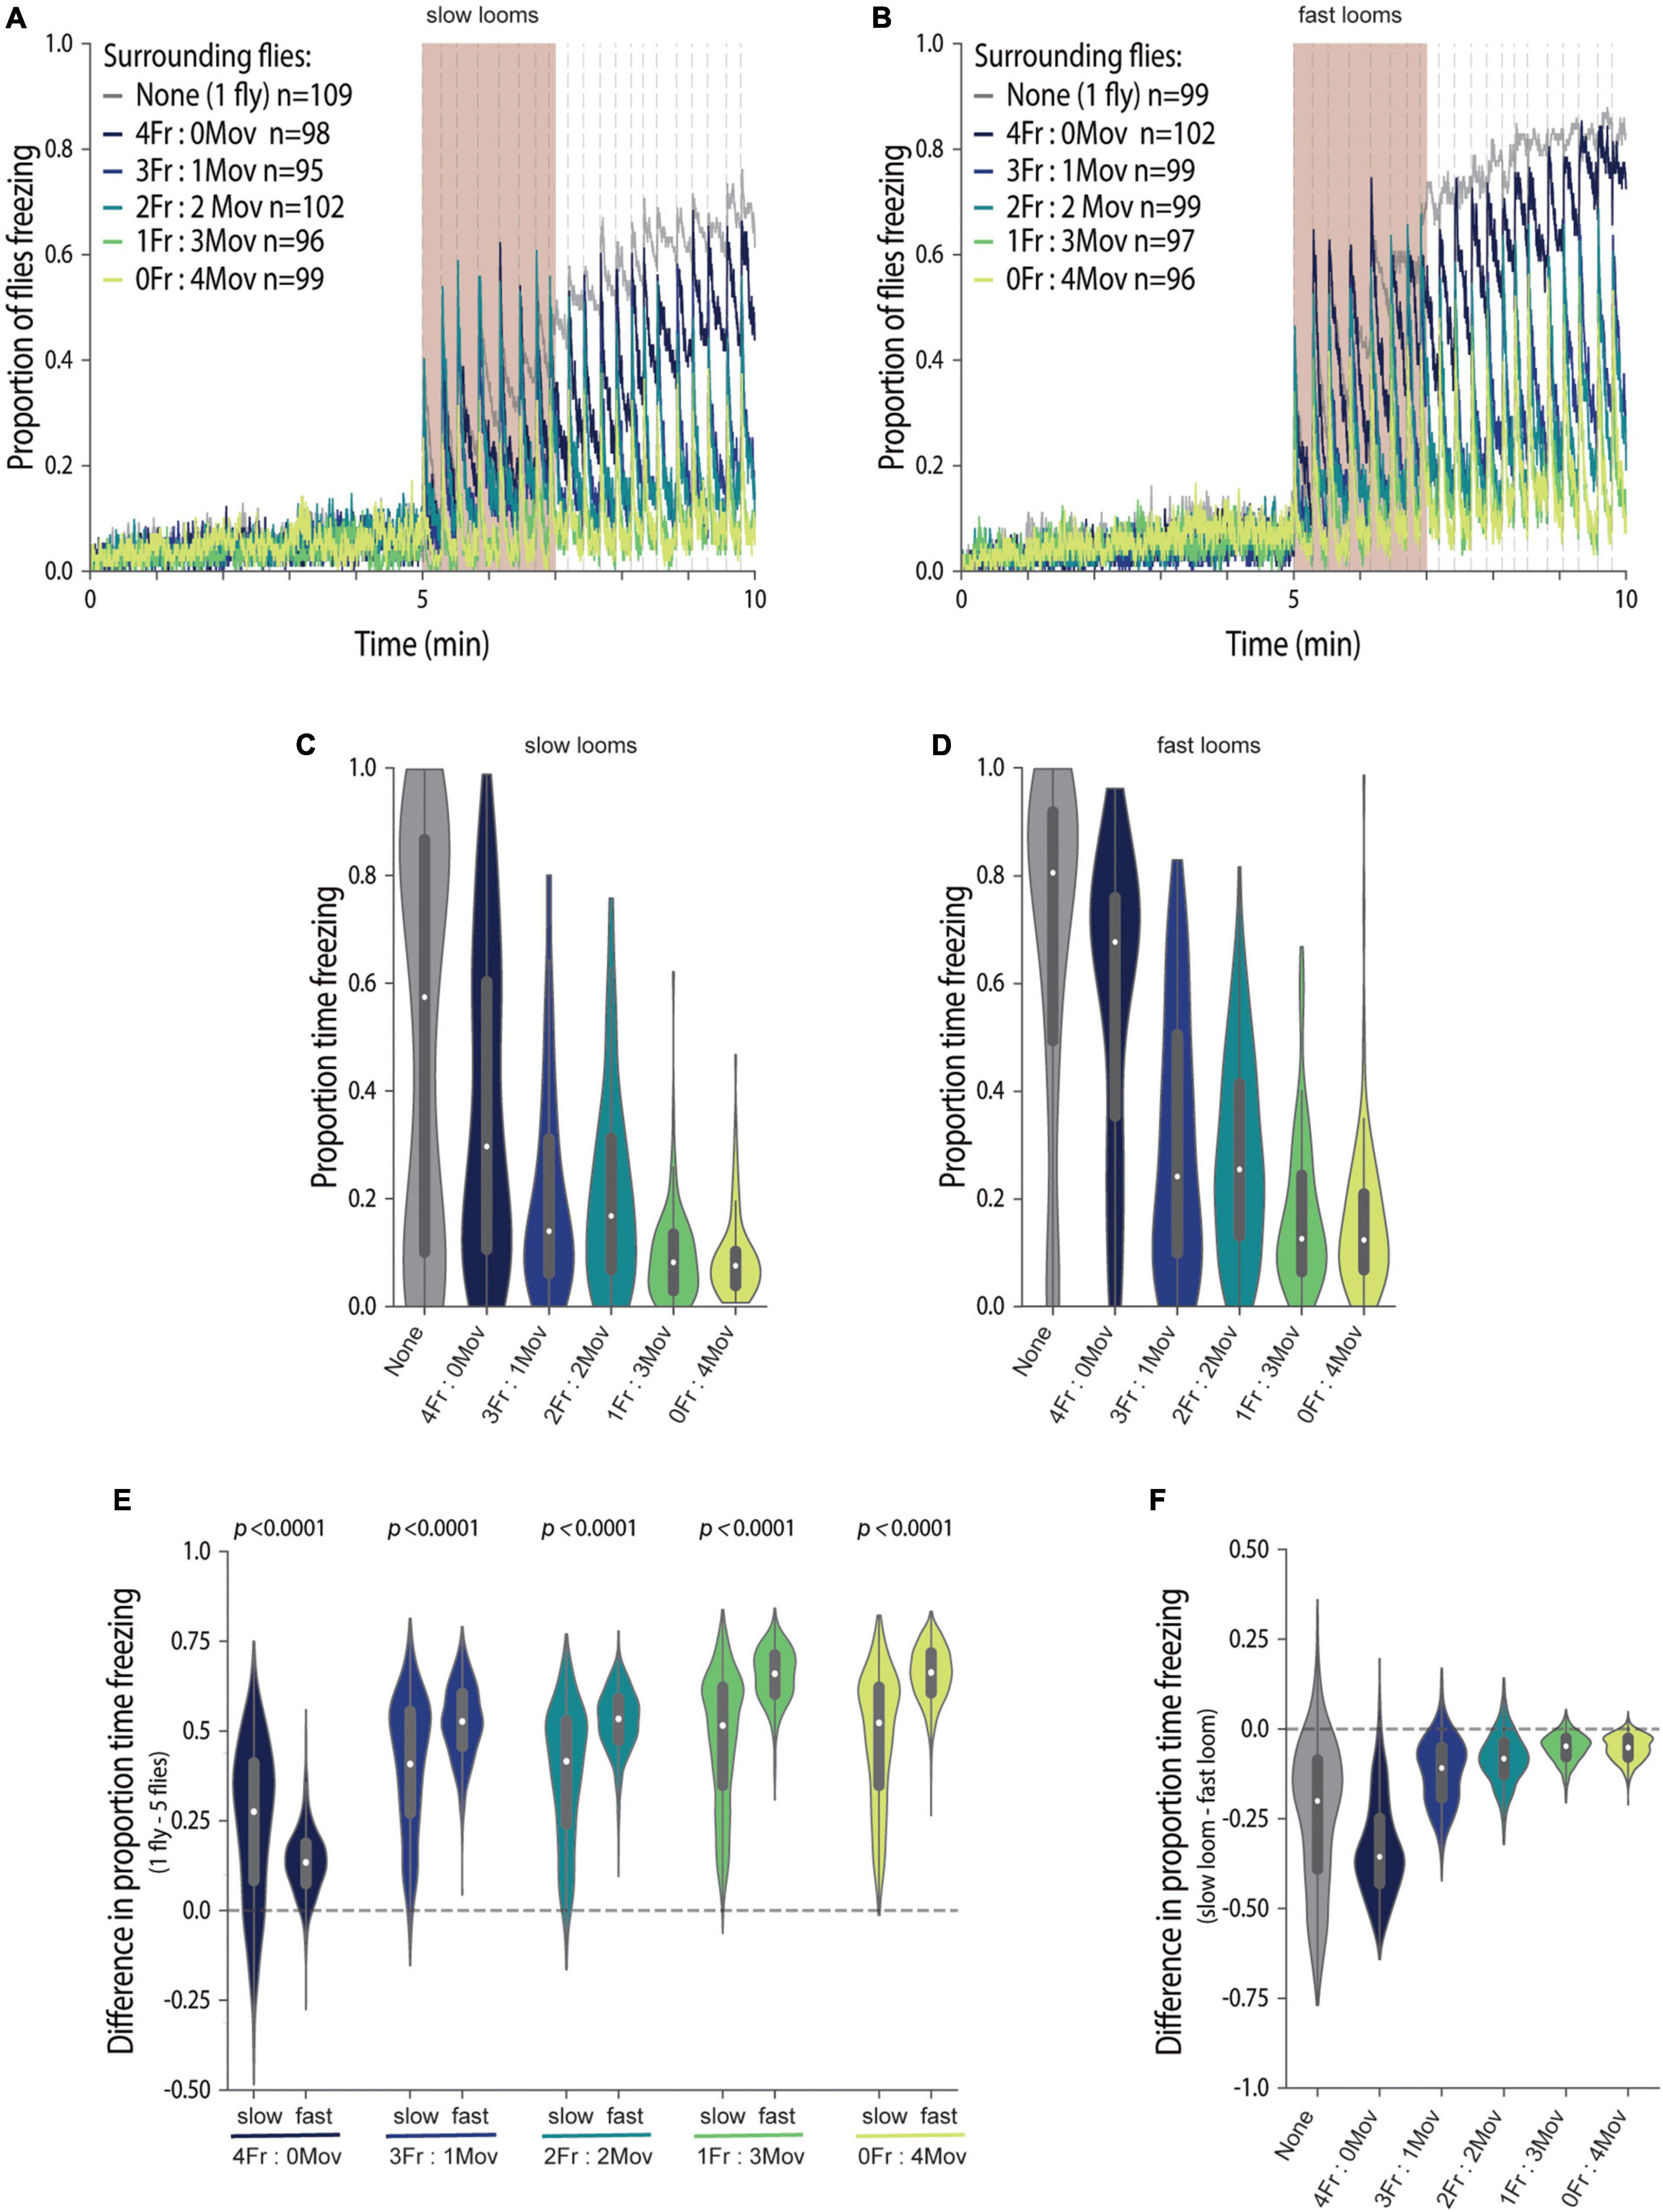
Figure 4. Social environment overrides the perceived imminence of a threat in guiding freezing responses. (A–F) We manipulated focal flies to surround with four flies creating groups with different proportions of flies that always move (blind flies, NorpA) and flies that are optogenetically made to freeze (LC6 > CsChrimson). The colours codes for group composition are presented in (A,B). Fraction of focal flies freezing throughout the experiment when exposed to slow (A) or fast looming stimuli (B); dashed lines represent looming stimuli presentations; n represents the numbers of flies tested for each condition. (C–F) Violin plots representing the probability density distribution of individual fly data bound to the range of possible values, with boxplots elements: central white dot, median; [box limits, upper (75) and lower (25) quartiles; whiskers, 1.5 × interquartile range]. Proportion of time spent freezing in the stimulation period when exposed to slow (C) and fast (D) looms. (E) Difference in the proportion of time spent freezing between individually tested flies and flies tested in groups for slow and fast looms (refer to the section “Materials and Methods.” P-values result from the two-tailed Mann–Whitney test. (F) Difference in the proportion of time spent freezing between focal flies exposed to the two looming speeds, for each group composition (refer to the section “Materials and Methods”). Statistical comparisons between conditions are presented in Supplementary Table 1.
Importantly, we could now compare the impact of similar social cues across different threat levels, by plotting the difference between freezing by focal flies tested individually and in each social condition, for both fast and slow looms (refer to the section “Materials and Methods”; Figure 4E). We found that the impact of the social environment was stronger when flies were exposed to the faster loom in the presence of moving flies, which provide social cues of safety, as the differences relative to individually tested flies were bigger for flies exposed to fast than for flies exposed to slow looms (MW p < 0.0001; Figure 4E).
As mentioned above, freezing responses scale with threat imminence, but the social environment seems to have a bigger weight in the presence of a higher threat level, which may result from stronger impact of the social safety cues. Indeed, when comparing the difference in freezing responses between looming speeds, across the graded social motion cues, it is evident that there is an effect of looming speed on the time spent freezing (refer to the section “Materials and Methods”; KW p < 0.0001, statistic = 2,419; Figure 4F and Supplementary Table 1), but that this effect decreases and flattens out with the addition of moving flies to the social environment [Prob(Fexit) = 0.11–0.079 IQR −0.19 to 0.26, Figure 4F and Supplementary Table 1]. To summarize, adding moving flies, hence adding motion cues, levels out differences in freezing responses across looming speeds.
To further understand the effect of these tightly controlled social cues on freezing responses in groups, we once again focused on freezing exits in between loom presentations (Figure 5). Overall, for both looming speeds, increasingly adding motion cues, by adding moving flies, leads to an increase in the probability of freezing exit (KW p < 0.0001, statistic = 140.4, Figure 5A; KW p < 0.0001, statistic = 306.1, Figure 5B). The stronger impact of social cues of safety on the responses to faster looms is again evident comparing the magnitude of the difference between freezing exits by focal flies tested individually and in the presence of moving flies for both fast and slow looms (MW p < 0.0001; Figure 5C). In addition, although there are differences in the probability of freezing exit across looming speeds for all group compositions, with slower looms inducing higher freezing exit probabilities, these differences once again become very small as soon as one moving fly is added [Prob(Fexit) = 0.12–0.033 IQR −0.012 to 0.17, Figure 5D and Supplementary Table 2].
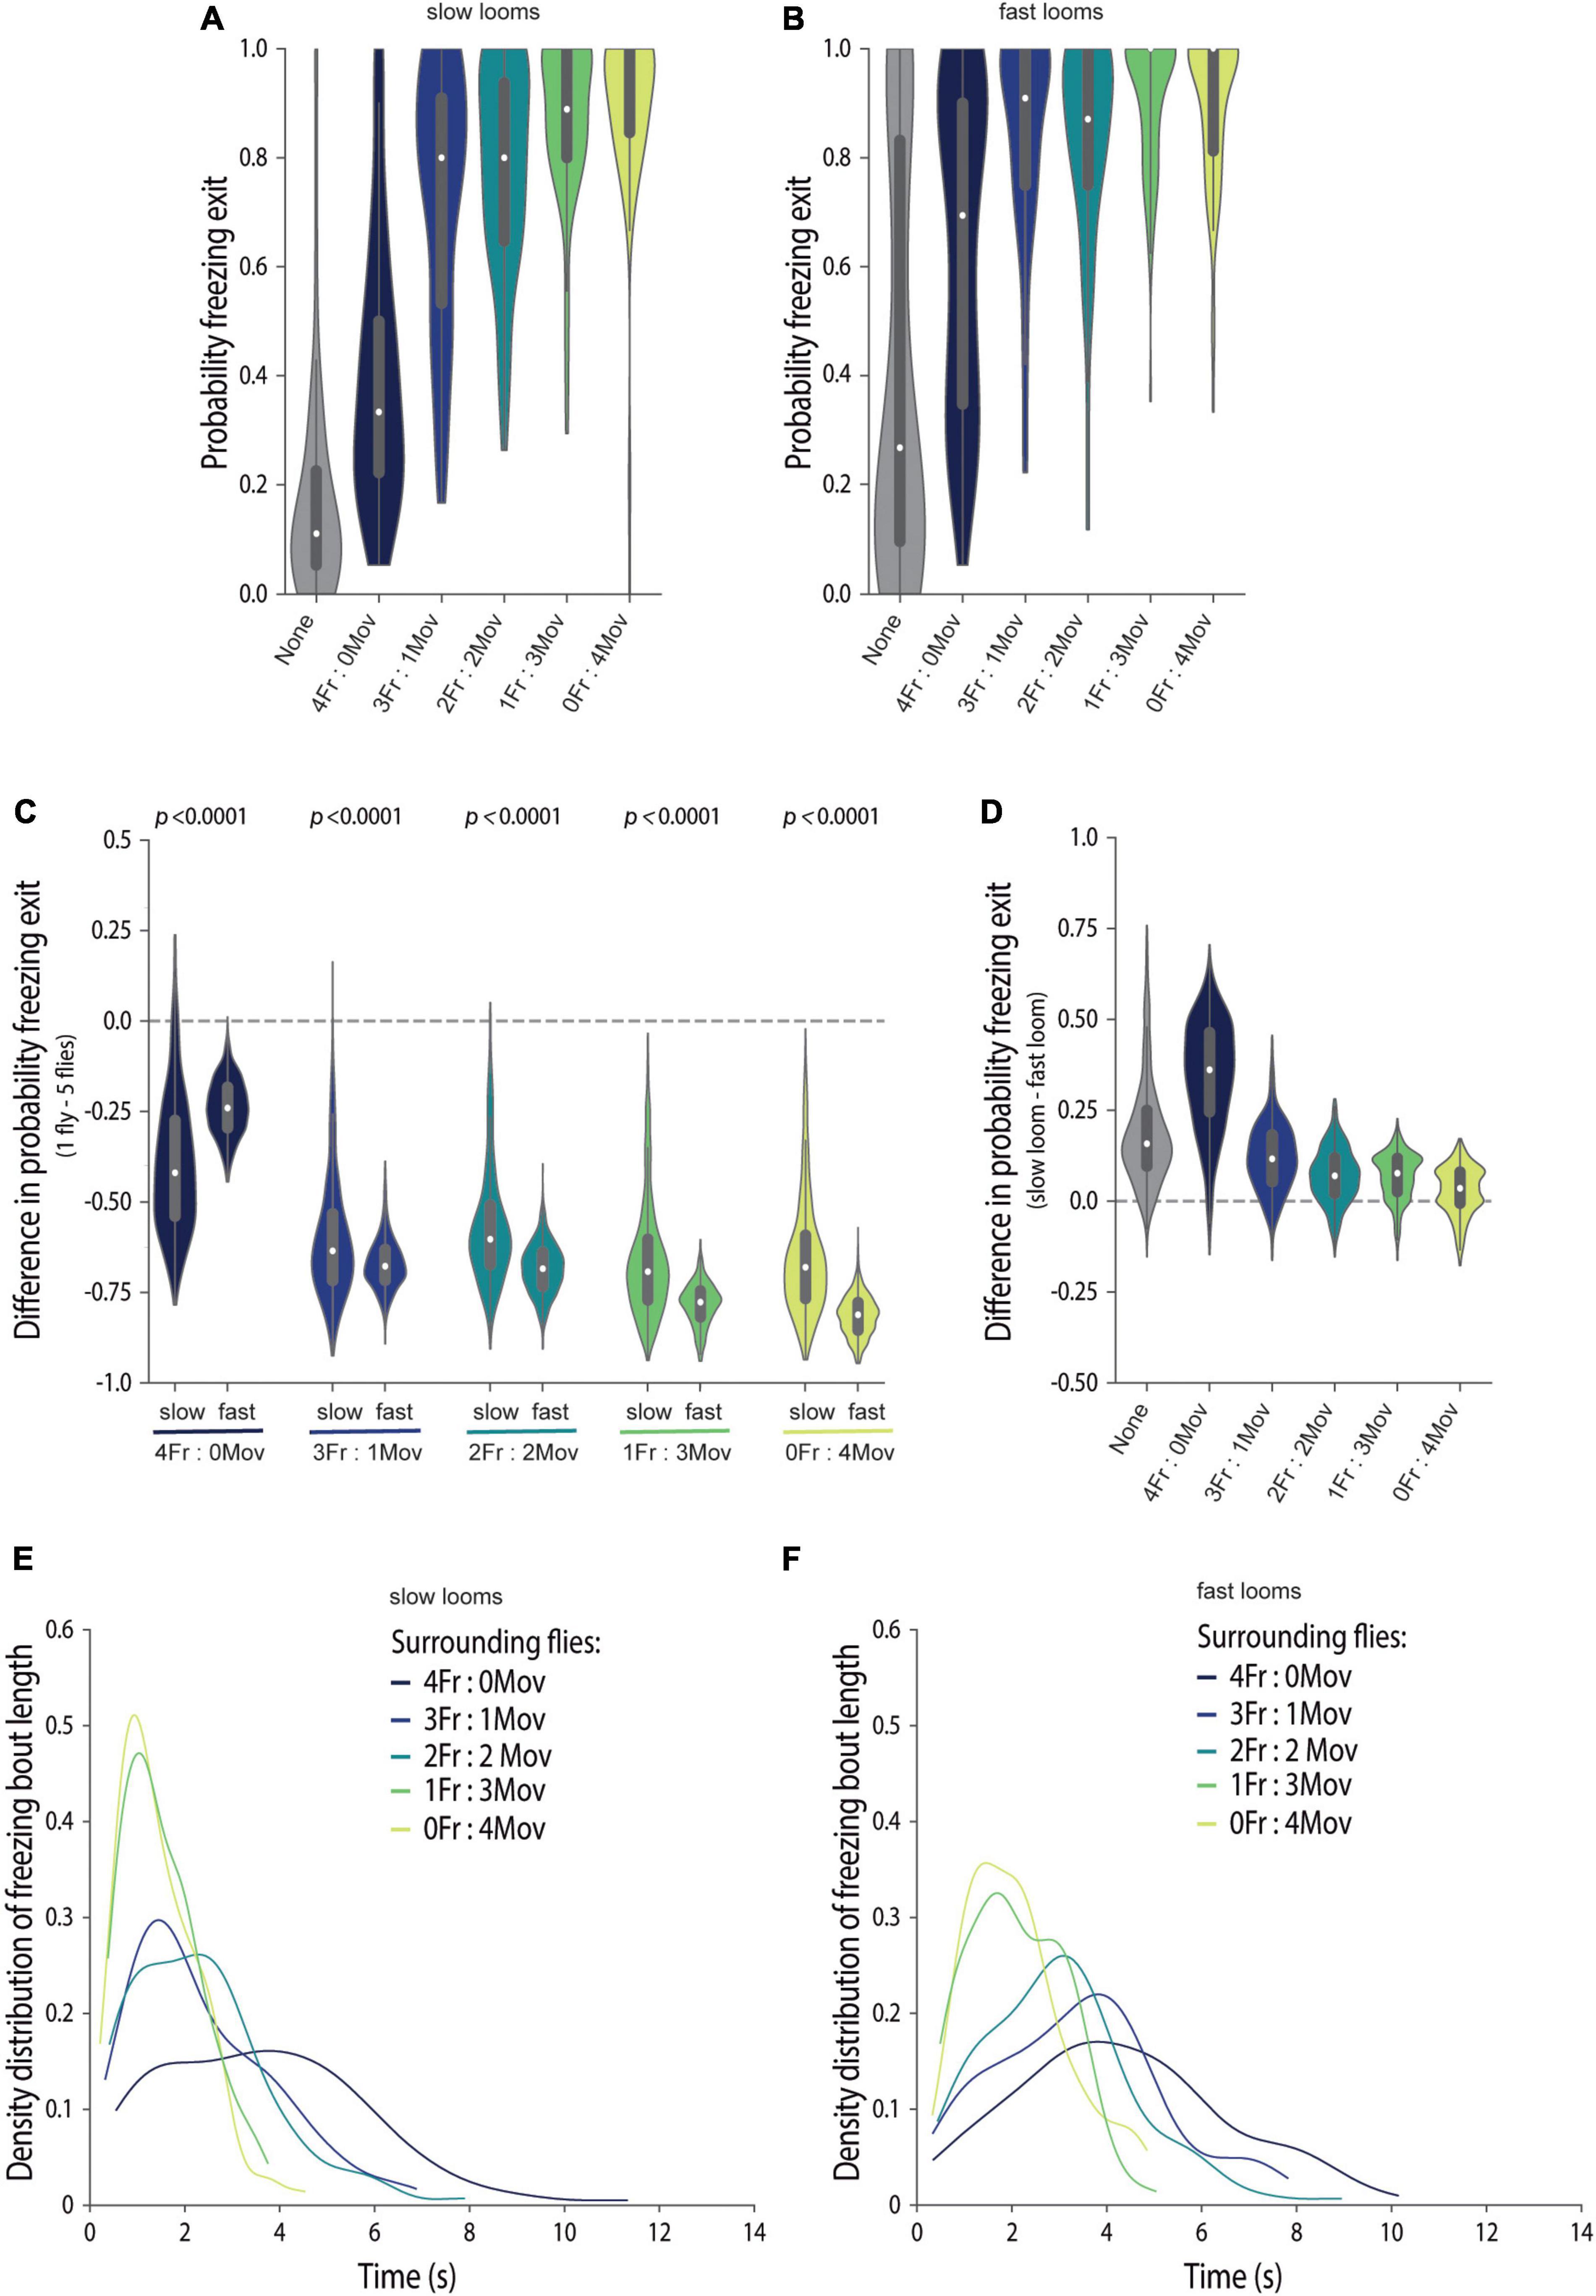
Figure 5. Social cues of safety lead to freezing breaks, which underlie freezing response similarities across threat imminences. (A–F) We manipulated focal flies to surround with four flies creating groups with different proportions of flies that always move (blind flies, NorpA) and flies that are optogenetically made to freeze (LC6 > CsChrimson). The color code for the groups is presented in (E,F); gray shadings represent an individually tested wild-type fly. (A–D) Violin plots representing the probability density distribution of individual fly data bound to the range of possible values, with boxplots elements: central white dot, median; [box limits, upper (75) and lower (25) quartiles; whiskers, 1.5 × interquartile range]. Probability of freezing exit before the following looming stimulus when exposed to slow (A) or fast looming stimuli (B). (C) Difference in the probability of freezing exit between individually tested flies and flies tested in groups for slow and fast looms (refer to the section “Materials and Methods”). P-values result from the two-tailed Mann–Whitney test. (D) Difference in the probability of freezing exit between focal flies exposed to the two looming speeds, for each group composition (refer to the section “Materials and Methods”). Statistical comparisons between conditions are presented in Supplementary Table 2. Kernel density estimate plots of the distribution of freezing bout lengths for flies exposed to slow (E) and fast (F) looms.
The finding that flies exposed to strong motion safety cues show decreased total time spent freezing and increased probability of freezing exits, for both loom speeds, indicates that the length of individual freezing bouts is decreased. Indeed, for all social conditions, freezing bouts that end in a freezing break between looms are shorter when more moving flies are around (Figures 5E,F), and hence, the bout length depends on stimulus strength, i.e., the level of surrounding motion cues. This suggests that flies gather information about safety for longer periods of time, when this information is sparser. Interestingly, at all stimulus (motion cue) strength levels, the distribution of these freezing bout lengths exhibited positive skew, a characteristic of information accumulation over time until the animal makes a decision (Luce, 1986; Ratcliff and Smith, 2004; Gold and Shadlen, 2007; Carandini and Churchland, 2013). Interestingly, social cues of danger provided by four freezing flies seem to be more salient for flies exposed to faster looms (Figures 5C,D); however, an appropriate analysis of this effect warrants a different experimental design in which jumps do not confound the analysis. In conclusion, social cues of safety lead to similar probabilities of exiting freezing across looming speeds and hence override differences in threat level.
In this study, we have addressed how threat imminence impacts defensive behaviors in groups and reliance on social cues. We showed that flies respond with different freezing levels to looming stimuli approaching at different speeds, whether tested individually or in groups, with faster looms triggering faster and more sustained freezing responses. Interestingly, we identified a non-linear scaling effect of looming speed, that is, the increase in freezing caused by exposure to a higher threat is not similar across social conditions. This increase in freezing was more pronounced for flies tested individually than flies tested in groups, indicating that the groups of flies exposed to faster looms showed a stronger social buffering effect than the groups exposed to slower looms. Moreover, controlling the social cues surrounding a fly through the manipulation of group composition under both looming conditions revealed that social cues of safety override differences in freezing responses to the two threat levels.
With the manipulation of looming speeds, we observed that faster looms lead to a faster engagement in freezing responses, which are then maintained for more prolonged periods of time, whether flies are tested individually or in groups. These findings are consistent with a perceived higher threat level for faster looms leading to a more vigorous response whose intended outcome is undetectability by a potential predator until safety is established. On the one hand, the differences between the latencies to start freezing are in line with differences in latencies to escape in fish (Bhattacharyya et al., 2017). On the other hand, freezing duration increases with faster looming speeds at an apparent contrast with the reported shorter escape duration for fast looms. However, a closer examination of the flies’ behavior suggests that at a functional level, the change is in the direction of increased protection. Flies exposed to an escapable fast loom cut short their sequence of preparatory behaviors that ensures a controlled take-off flight away from the predator, resulting in a faster take-off, albeit less controlled. The small difference in take-off duration may grant precious time to flies to survive the chase (von Reyn et al., 2014). When exposed to an inescapable fast loom, flies freeze for a longer period of time, which may allow them to remain undetected in case the predator looms again in a second chase attempt.
Crucially, we identified that a graded manipulation of the social environment, providing graded levels of motion cues, induces graded freezing responses. Furthermore, underlying the graded amount of total time spent freezing is the modulation of the probability of freezing exit, resulting in graded freezing bout durations. These freezing bout durations uncover progressively faster freezing disengagement, that is, decreasing reaction times to increasing safety motion cues, for both threat imminences. With these findings, we uncovered a different strategy to that observed in social copying in the context of reproduction-related decisions in flies (Danchin et al., 2018), where animals adopt a conformity strategy, following the decision of the majority of others. If flies in our experiments were conforming to the majority, one would expect higher freezing levels for groups with 3 and 4 freezing flies, which was not the case. The finding that flies in our experimental conditions do not conform to the group majority and show stronger social buffering when exposed to a higher threat level may seem surprising. It is possible, however, that very sustained freezing responses, several minutes at a time, may become too expensive (Barrios et al., 2021) and that responding to the social environment may reduce the cost without significantly reducing the flies’ defenses. The behavioral pattern we observed is consistent with such a strategy, as flies responded to the looming stimulus with freezing even in groups with moving flies; however, each incremental addition of social safety cues lead them to disengage from freezing after increasingly shorter times. This pattern is reminiscent of a process of evidence integration, of safety cues, to decision bound–resumption of activity. A finer grained investigation of how freezing responses of individuals and flies in groups vary with threat level, with careful control and monitoring of motion cues, will permit determining whether freezing responses in flies follow an integrate to threshold model of decision making, analogously to that observed for escape decisions in mice (Evans et al., 2018) and two-alternative forced choices visual and olfactory tasks in primates, rodents, and flies (Luce, 1986; Ratcliff and Smith, 2004; Gold and Shadlen, 2007; Carandini and Churchland, 2013; DasGupta et al., 2014).
Importantly, we uncovered a hitherto unknown, non-linear scaling effect of defense responses in groups with threat imminence. The enhanced social buffering effect upon fast looms seems to result from the perception of the approach speed of the threat in interaction with the perception of surrounding social cues, raising the question of whether this effect is generalizable across different features of threat that convey different degrees of danger, such as contrast of the threatening stimulus relative to the background, or rather specific to approach speed. To address this issue, it will be interesting to analyze freezing responses tampering with various features of predation threat.
Interestingly, social cues of danger produced by surrounding freezing flies seem to exacerbate freezing responses to the faster loom compared with the slower loom, as the former are a lot less likely to exit freezing. However, our experiments do not allow addressing the social effect on freezing onset appropriately as the optogenetic manipulations used also produce strong jumping responses. Future experiments inducing freezing without jumps will allow studying the interplay between threat levels and social cues of danger.
We believe that this study opens up a path to understand the dynamics of the usage of individually percieved data about threat and danger cues in different predation settings, which will provide valuable insight into how crucial threat response decisions are made.
The raw data supporting the conclusions of this article are available at doi: 10.6084/m9.figshare.19609782.
CF and MM conceived the project and designed the experiments with input from MH. CF and MH performed all experiments except for optogenetic activation in the absence of looming, which was done by MF. RG made fly crosses and prepared flies for the experiments. MF updated behavioral setups and video acquisition codes. MF and MH wrote tracking and behavior classification codes. CF, MH, and MF wrote the analysis code. CF and MH analyzed the data. CF, MH, and MM discussed the results. CF and MM wrote the manuscript. All authors commented on the manuscript.
This study was supported by Fundação Champalimaud, by Fundação para a Ciência e a Tecnologia (FCT) project UIDB/04443/2020 and ERCCoG819630-A-Fro, as well as by the research infrastructure CONGENTO LISBOA-01-0145-FEDER-022170. MH and MF were supported by fellowships from FCT, respectively, SFRH/BD/143423/2019 and SFRH/BD/130320/2017.
The authors declare that the research was conducted in the absence of any commercial or financial relationships that could be construed as a potential conflict of interest.
All claims expressed in this article are solely those of the authors and do not necessarily represent those of their affiliated organizations, or those of the publisher, the editors and the reviewers. Any product that may be evaluated in this article, or claim that may be made by its manufacturer, is not guaranteed or endorsed by the publisher.
We thank the Fly Platform at the Champalimaud Centre for the Unknown for providing fly work related infrastructure, expertise, and support; the Moita lab for helpful discussions and Anna Hobbiss in particular for pilot experiments with looms of different speeds; João Frazão for expertise and support developing acquisition and tracking codes in Bonsai.
The Supplementary Material for this article can be found online at: https://www.frontiersin.org/articles/10.3389/fevo.2022.885795/full#supplementary-material
Supplementary Figure 1 | Effect of looming speed on latency to freezing onset and freezing bout length. Distribution of the time points of freezing onset after looming for flies tested individually (A) and in groups (B). Dashed gray lines represent looming onset and offset. Cumulative distributions of freezing bout lengths for flies tested individually (C) and in groups (D). Orange denotes flies exposed to slow looms and green denotes flies exposed to fast looms.
Supplementary Figure 2 | Motion cues in groups scale with threat intensity. Violin plots representing the probability density distribution of individual fly data bound to the range of possible values, with boxplots elements: [central white dot, median; box limits, upper (75) and lower (25) quartiles; whiskers, 1.5 × interquartile range]. Average motion cues a focal fly is exposed to the stimulation period. P-value results from the two-tailed Mann–Whitney test.
Supplementary Figure 3 | Freezing and jumping responses of optogenetically activated LC6 > CsChrimson. (A) Fraction of flies freezing throughout the experiment while providing pulsed red light at the timestamps normally used to provide looming stimuli (dashed lines); LC6 > CsChrimson flies supplemented with retinal (blue) and control without (gray). (B–D) We manipulated four out of the five flies in group, to surround focal flies with groups with different proportions of flies that always move (blind flies, NorpA) and flies that are optogenetically made to freeze (LC6 > CsChrimson), while presenting looming stimuli. The color code for the groups is presented in (B–D). Fraction of surrounding, manipulated, flies freezing throughout the experiment when exposed to slow (B) or fast looming stimuli (C); dashed lines represent looming stimuli presentations. (D,E) Data from flies exposed to slow looms. (D) Number of jumps throughout the experiment by the surrounding manipulated flies. (E) Number of jumps at the first loom presentation for LC6 > CsChrimson flies in groups of four surrounding optogenetically manipulated flies.
Bailly, T. P. M., Kohlmeier, P., Etienne, R. S., Wertheim, B., and Billeter, J.-C. (2021). Social modulation of oogenesis and egg-laying in Drosophila melanogaster. bioRxiv 2021:460109.
Ball, W., and Tronick, E. (1970). Infant responses to impending collision: optical and real. Science 171, 818–820. doi: 10.1126/science.171.3973.818
Barrios, N., Farias, M., and Moita, M. A. (2021). Threat induces cardiac and metabolic changes that negatively impact survival in flies. Curr. Biol. 31, 5462–5472. doi: 10.1016/j.cub.2021.10.013
Battesti, M., Moreno, C., Joly, D., and Mery, F. (2012). Spread of social information and dynamics of social transmission within Drosophila groups. Curr. Biol. 22, 309–313. doi: 10.1016/j.cub.2011.12.050
Beauchamp, G. (2004). Reduced flocking by birds on islands with relaxed predation. Proc. R. Soc. B 271, 1039–1042. doi: 10.1098/rspb.2004.2703
Bhattacharyya, K., McLean, D. L., and MacIver, M. A. (2017). Visual threat assessment and reticulospinal encoding of calibrated responses in larval zebrafish. Curr. Biol. 27, 2751–2762. doi: 10.1016/j.cub.2017.08.012
Carandini, M., and Churchland, A. K. (2013). Probing perceptual decisions in rodents. Nat. Neurosci. 16, 824–831. doi: 10.1038/nn.3410
Card, G., and Dickinson, M. H. (2008). Visually mediated motor planning in the escape response of Drosophila. Curr. Biol. 18, 1300–1307. doi: 10.1016/j.cub.2008.07.094
Card, G. M. (2012). Escape behaviors in insects. Curr. Opin. Neurobiol. 22, 180–186. doi: 10.1016/j.conb.2011.12.009
Coolen, I., Ward, A. J. W., Hart, P. J. B., and Laland, K. N. (2005). Foraging nine-spined sticklebacks prefer to rely on public information over simpler social cues. Behav. Ecol. 2005, 865–870.
Couzin-Fuchs, E., and Ayali, A. (2021). The social brain of ‘non-eusocial’ insects. Curr. Opin. Insect Sci. 48, 1–7. doi: 10.1016/j.cois.2021.04.006
Danchin, E., Nöbel, S., Pocheville, A., Dagaeff, A. C., Demay, L., Alphand, M., et al. (2018). Cultural flies: conformist social learning in fruitflies predicts long-lasting mate-choice traditions. Science 362, 1025–1030.
DasGupta, S., and Ferreira, C. H.Miesenböck, G. (2014). FoxP influences the speed and accuracy of a perceptual decision in Drosophila. Science 344, 901–904. doi: 10.1126/science.1252114
Dawson, E. H., and Chittka, L. (2014). Bumblebees (Bombus terrestris) use social information as an indicator of safety in dangerous environments. Proc. R. Soc. B 2013:317. doi: 10.1098/rspb.2013.3174
De Franceschi, G., Vivattanasarn, T., Saleem, A. B., and Solomon, S. G. (2016). Vision guides selection of freeze or flight defense strategies in mice. Curr. Biol. 26, 2150–2154. doi: 10.1016/j.cub.2016.06.006
Dombrovski, M., Kim, A., Poussard, L., Vaccari, A., Acton, S., Spillman, E., et al. (2019). A plastic visual pathway regulates cooperative behavior in Drosophila larvae. Curr. Biol. 29, 1–11. doi: 10.1016/j.cub.2019.04.060
Dombrovski, M., Poussard, L., Moalem, K., Kmecova, L., and Schott, E. (2017). Cooperative behavior emerges among Drosophila. Curr. Biol. 27, 2821–2826.
Evans, D. A., Stempel, A. V., Vale, R., Ruehle, S., Lefler, Y., Branco, T., et al. (2018). A synaptic threshold mechanism for computing escape decisions. Nature 558, 590–594. doi: 10.1038/s41586-018-0244-6
Faustino, A. I., Tacão-Monteiro, A., and Oliveira, R. F. (2017). Mechanisms of social buffering of fear in zebrafish. Sci. Rep. 7, 1–10. doi: 10.1038/srep44329
Ferreira, C. H., and Moita, M. A. (2019). What can a non-eusocial insect tell us about the neural basis of group behaviour? Curr. Opin. Insect Sci. 36, 118–124. doi: 10.1016/j.cois.2019.09.001
Ferreira, C. H., and Moita, M. A. (2020). Behavioral and neuronal underpinnings of safety in numbers in fruit flies. Nat. Commun. 11:4182. doi: 10.1038/s41467-020-17856-4
Galef, B. G., and Giraldeau, L. (2001). Social influences on foraging in vertebrates: causal mechanisms and adaptive functions. Anim. Behav. 2001, 3–15. doi: 10.1006/anbe.2000.1557
Galef, B. G. Jr., and Laland, K. (2005). Social learning in animals: empirical studies and theoretical models. Bioscience 55, 489–499.
Gibson, W. T., Gonzalez, C. R., Fernandez, C., Ramasamy, L., Tabachnik, T., Du, R. R., et al. (2015). Behavioral responses to a repetitive visual threat stimulus express a persistent state of defensive arousal in Drosophila. Curr. Biol. 25, 1401–1415. doi: 10.1016/j.cub.2015.03.058
Gold, J. I., and Shadlen, M. N. (2007). The neural basis of decision making. Annu. Rev. Neurosci. 30, 535–574.
Griffin, A. S. (2004). Social learning about predators: a review and prospectus. Learn. Behav. 32, 131–140. doi: 10.3758/bf03196014
Hager, M. C., and Helfman, G. S. (1991). Safety in numbers: shoal size choice by minnows under predatory threat. Behav. Ecol. Sociobiol. 29, 271–276.
Hollén, L. I., and Radford, A. N. (2009). The development of alarm call behaviour in mammals and birds. Anim. Behav. 78, 791–800.
Kavaliers, M., Matta, R., and Choleris, E. (2017). Mate-choice copying, social information processing, and the roles of oxytocin. Neurosci. Biobehav. Rev. 72, 232–242. doi: 10.1016/j.neubiorev.2016.12.003
Kendal, R. L., Coolen, I., Bergen, Y., and Laland, K. N. (2005). Trade-offs in the adaptive use of social and asocial learning. Adv. Study Behav. 35, 333–379.
Kiyokawa, Y., Hiroshima, S., Takeuchi, Y., and Mori, Y. (2014). Social buffering reduces male rats’ behavioral and corticosterone responses to a conditioned stimulus. Horm. Behav. 65, 114–118. doi: 10.1016/j.yhbeh.2013.12.005
Kiyokawa, Y., Kikusui, T., Takeuchi, Y., and Mori, Y. (2004). Partner’s stress status influences social buffering effects in rats. Behav. Neurosci. 118, 798–804. doi: 10.1037/0735-7044.118.4.798
Klapoetke, N. C., Murata, Y., Kim, S. S., Pulver, S. R., Birdsey-Benson, A., Cho, Y. K., et al. (2014). Independent optical excitation of distinct neural populations. Nat. Methods 11, 338–346.
Leonhardt, S. D., Menzel, F., Nehring, V., and Schmitt, T. (2016). Ecology and evolution of communication in social insects. Cell 164, 1277–1287. doi: 10.1016/j.cell.2016.01.035
Lopes, G., Bonacchi, N., Frazão, J., Neto, J. P., Atallah, B. V., Soares, S., et al. (2015). Bonsai: an event-based framework for processing and controlling data streams. Front. Neuroinform. 9:1–14. doi: 10.3389/fninf.2015.00007
Luce, R. (1986). Response times: their role in inferring elementary mental organization. Oxford: Oxford University Press.
Magurran, A. E., Seghers, B. H., Carvalho, G. R., and Shaw, P. W. (1992). Behavioural consequences of an artificial introduction of guppies (Poecilia reticulata) in N. Trinidad: evidence for the evolution of antipredator behaviour in the wild. Proc. R. Soc. B 248, 117–122.
Marras, S., Batty, R. S., and Domenici, P. (2011). Information transfer and antipredator maneuvers in schooling herring. Adapt. Behav. 20, 44–56.
Mery, F., Varela, S. A., Danchin, E., Blanchet, S., Parejo, D., Coolen, I., et al. (2009). Public versus personal information for mate copying in an invertebrate. Curr. Biol. 19, 730–734. doi: 10.1016/j.cub.2009.02.064
Murray, T. G., Zeil, J., and Magrath, R. D. (2017). Sounds of modified flight feathers reliably signal danger in a pigeon. Curr. Biol. 27, 3520–3525. doi: 10.1016/j.cub.2017.09.068
Oliva, D., Medan, V., and Tomsic, D. (2007). Escape behavior and neuronal responses to looming stimuli in the crab Chasmagnathus granulatus (Decapoda: Grapsidae). J. Exp. Biol. 210, 865–880. doi: 10.1242/jeb.02707
Pereira, A. G., Cruz, A., Lima, S. Q., and Moita, M. A. (2012). Silence resulting from the cessation of movement signals danger. Curr. Biol. 22, 627–628. doi: 10.1016/j.cub.2012.06.015
Pérez-Escudero, A., Vicente-Page, J., Hinz, R. C., Arganda, S., and de Polavieja, G. G. (2014). idTracker: tracking individuals in a group by automatic identification of unmarked animals. Nat. Methods 2014:11. doi: 10.1038/nmeth.2994
Ratcliff, R., and Smith, P. L. A. (2004). comparison of sequential sampling models for two-choice reaction time. Psychol. Rev. 111, 333–367. doi: 10.1037/0033-295X.111.2.333
Sarin, S., and Dukas, R. (2009). Social learning about egg-laying substrates in fruitflies. Proc. R. Soc. B 276, 4323–4328. doi: 10.1098/rspb.2009.1294
Seghers, B. H. (1974). Schooling behavior in the Guppy (Poecilia reticulata): an evolutionary response to predation. Evolution 28, 486–489. doi: 10.1111/j.1558-5646.1974.tb00774.x
Shultzaberger, R. K., Johnson, S. J., Wagner, J., Ha, K., Markow, T. A., and Greenspan, R. J. (2018). Conservation of the behavioral and transcriptional response to social experience among Drosophilids. Genes, Brain Behav. 18:e12487. doi: 10.1111/gbb.12487
Tinette, S., Zhang, L., and Robichon, A. (2004). Cooperation between Drosophila flies in searching behavior. Genes, Brain Behav. 2004, 39–50. doi: 10.1046/j.1601-183x.2003.0046.x
von Reyn, C. R., Breads, P., Peek, M. Y., Zheng, G. Z., Williamson, W. R., Yee, A. L., et al. (2014). A spike-timing mechanism for action selection. Nat. Neurosci. 17, 962–970. doi: 10.1038/nn.3741
von Reyn, C. R., Nern, A., Williamson, W. R., Breads, P., Wu, M., Namiki, S., et al. (2017). Feature integration drives probabilistic behavior in the Drosophila escape response. Neuron 94, 1190–1204. doi: 10.1016/j.neuron.2017.05.036
Webster, M. M., and Laland, K. N. (2008). Social learning strategies and predation risk?: minnows copy only when using private information would be costly. Proc. R. Soc. B 275, 2869–2876. doi: 10.1098/rspb.2008.0817
Wu, M., Nern, A., Williamson, W. R., Morimoto, M. M., Reiser, M. B., Card, G. M., et al. (2016). Visual projection neurons in the Drosophila lobula link feature detection to distinct behavioral programs. Elife 5, 1–43. doi: 10.7554/eLife.21022
Yilmaz, M., and Meister, M. (2013). Rapid innate defensive responses of mice to looming visual stimuli. Curr. Biol. 23, 2011–2015. doi: 10.1016/j.cub.2013.08.015
Keywords: defensive behavior, freezing, social buffering, Drosophila melanogaster, motion cues, safety in numbers, fear, looming stimulus
Citation: Ferreira CH, Heinemans M, Farias M, Gonçalves R and Moita MA (2022) Social Cues of Safety Can Override Differences in Threat Level. Front. Ecol. Evol. 10:885795. doi: 10.3389/fevo.2022.885795
Received: 28 February 2022; Accepted: 20 May 2022;
Published: 24 June 2022.
Edited by:
Mathieu Lihoreau, Centre National de la Recherche Scientifique (CNRS), FranceReviewed by:
Richard Bon, Université Toulouse III Paul Sabatier, FranceCopyright © 2022 Ferreira, Heinemans, Farias, Gonçalves and Moita. This is an open-access article distributed under the terms of the Creative Commons Attribution License (CC BY). The use, distribution or reproduction in other forums is permitted, provided the original author(s) and the copyright owner(s) are credited and that the original publication in this journal is cited, in accordance with accepted academic practice. No use, distribution or reproduction is permitted which does not comply with these terms.
*Correspondence: Clara H. Ferreira, Y2xhcmEuZmVycmVpcmFAbmV1cm8uZmNoYW1wYWxpbWF1ZC5vcmc=, Y2xhcmEuZmVycmVpcmFAbmV1cm8uZmNoYW1wYWxpbWF1ZC5vcmc=
†These authors share first authorship
Disclaimer: All claims expressed in this article are solely those of the authors and do not necessarily represent those of their affiliated organizations, or those of the publisher, the editors and the reviewers. Any product that may be evaluated in this article or claim that may be made by its manufacturer is not guaranteed or endorsed by the publisher.
Research integrity at Frontiers
Learn more about the work of our research integrity team to safeguard the quality of each article we publish.