 Mark L. Taper
 José M. Ponciano
 Yukihiko Toquenaga
- 1Department of Ecology, Montana State University, Bozeman, MT, United States
- 2Department of Biology, University of Florida, Gainesville, FL, United States
- 3Faculty of Life and Environmental Sciences, University of Tsukuba, Tsukuba, Japan
Editorial on the Research Topic
Evidential Statistics, Model Identification, and Science
Why This Research Topic
We have undertaken this Research Topic for several reasons: First to promote and disseminate the ideas and techniques of evidential statistics to ecologists and evolutionary biologists so that their research might benefit from the increased clarity that evidential thinking engenders. And, second to encourage statisticians to think how their own work relates to this emerging approach to the fundamental problems of statistics.
How to Read This Volume
Selecting an optimal order to read the papers of this Research Topic requires decisions on the part of the reader. The papers are not ordered in any developmental fashion, but simply by the order that they were first published. Another difficulty is that there are two target audiences for this Research Topic: First, quantitative scientists, primarily ecologists, and evolutionary biologists, who might wish to apply evidential thinking to their own research; and second, statisticians who might be interested in furthering the technical development of evidential statistics.
Table 1 lays out the primary themes considered in each paper and identifies authorship abbreviations. Those readers who would like to begin with statistical principles, then move to applications, and conclude with more philosophical considerations might read the topic in the order of Dennis et al., Ponciano and Taper, Lele b, Taper et al., Shimodaira and Terada, Markatou and Sofikitou, Ferguson et al., Claeskens et al., Toquenaga and Gagné, Stewart and Blume, Jerde et al., Lele a, Brittan and Bandyopadhyay, Scheiner and Holt. For readers who might prefer to begin with philosophy, then move to application, and finish with technical details, a reasonable order might be: (Brittan and Bandyopadhyay, Scheiner and Holt, Jerde et al., Toquenaga and Gagné, Lele a, Stewart and Blume, Ferguson et al., Claeskens et al., Dennis et al., Ponciano and Taper, Lele b, Taper et al., Markatou and Sofikitou, Shimodaira and Terada).
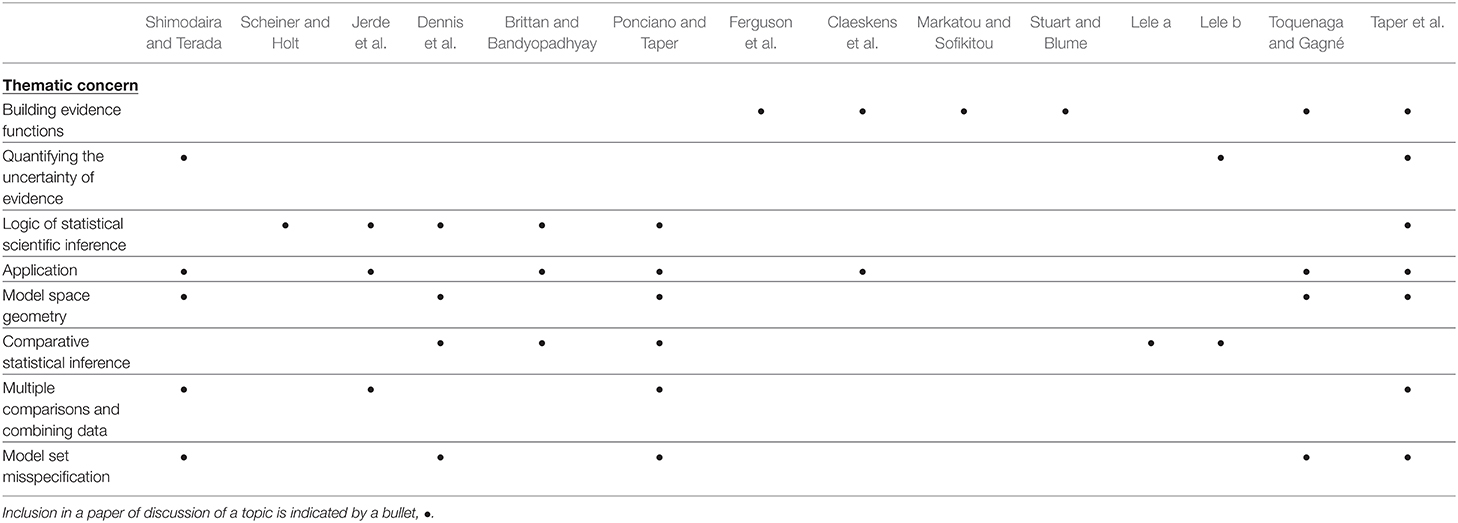
Table 1. Articles are listed left to right in publication order.
What Is Evidential Statistics
Statistics is arguably the most powerful of all scientific instruments. For the last century, statistics has been dominated by two alternative approaches: Error statistics1 and Bayesian statistics. Unfortunately, both approaches suffer from technical and philosophical problems (see Taper and Ponciano, 2016 for discussion). These problems make the instrument of statistics like the Hubble telescope before its optics were corrected in 1993: A fantastic tool not living up to its full potential.
We believe that the evidential approach can provide a similar technical correction to statistics. Evidential statistics is a cluster of statistical methods and approaches being developed to meet a set of desiderata or meta-criteria that were selected so as to impose desirable inferential properties on those methods (see Jerde et al., for a list of desiderata).
The central question for evidence is simple: Which of two models of reality is better supported by the data? More technically, evidence is a data-based estimate of the difference of the divergences of each of the distributions implicit in two models to the data distribution resulting from an unknown true generating process (see Lele, 2004; Taper et al.). Several salient features of the evidentialist perspective are immediately obvious: First, evidence is comparative, second, neither model is given a favored status, and third, that a “true” model is not assumed to be in the model set.
These guiding principles allows evidential statistics to draw on and refine elements from error statistics, likelihoodism, Bayesian statistics, information criteria, and robust methods to create an approach that smoothly incorporates model identification, model uncertainty, model comparison, parameter estimation, parameter uncertainty, pre-data control of error, post-data assessment of uncertainty, and post-data strength of evidence into a single coherent framework.
Some Implications of Evidential Statistics for Science
The implications of evidential statistics for science are manifold. For brevity, we focus here on the impact an evidential approach could have on the replication crisis (Pashler and Wagenmakers, 2012). The replication crisis presents a profound challenge to both statistics and science. As more replication of scientific studies is attempted, it is being found that studies tend not to replicate at their nominal rates. This is undermining both trust in statistics by scientists and trust in science by the general population.
Virtually all models are to some degree misspecified (see Taper et al., for a technical definition of “misspecified”). Misspecification in itself is not a bad thing. A true model would be enormously complex and would be neither comprehensible nor estimable. What is dangerous is inference that doesn't acknowledge misspecification. With Neyman-Person Hypothesis testing (NPHT), error rates become distorted when both models are misspecified. Error rates can be less than, equal to, or greater than their nominal rates (Dennis et al.) making nominal rate replication extremely unlikely. Furthermore, under some reasonable model space geometries, a NPHT will select the wrong model with probabilities that go to 1 as sample size increases (Dennis et al.). In contrast, evidential model selection reliability seems in simulation to be estimated unbiasedly (Taper et al., 2019) and all evidential error rates go to 0 as sample size increases (Dennis et al.).
None of Fisherian significance (FS), null hypothesis significance tests (NHST), or NPHT can produce evidence for the null model (Dennis et al.). This is problematic because often it is the null which of scientific interest. Statisticians teach that “absence of evidence is not evidence of absence,” but the need of scientists to say something about the null model forces this warning to be often ignored. In evidential statistics reference and alternative models are always correctly treated symmetrically (Dennis et al., Taper et al., Jerde et al.) for inference, although this does not imply that decision thresholds need to be symmetric.
When scientists, reviewers, and journals recognize that FS, NHST, and NPHT do not produce evidence for the null, a common response is publication bias, the tendency not to publish studies with attained P < 0.05 (Franco et al., 2014). This “file drawer problem” creates several biases in the literature. First, of course, is the lack of studies showing evidence for the null. More insidiously, because all tests are stochastic, a number of studies are published falsely showing significant evidence for the alternative (Type I errors). These are not balanced in the literature by the many studies in the file drawer.
The immense pressure on scientists to publish leads many, intentionally or unintentionally, into questionable research practices to avoid the file drawer problem. One of these is “cherry picking,” the retroactive selection of data and/or statistics so as to achieve significance (Ioannidis, 2019). Another is HARKing, Hypothesizing After Results are Known (Kerr, 1998). Both have drastic effects on the replication crisis.
Evidential analysis gives scientists statistically correct language (Taper et al.) to speak about strong evidence for the null vs. the alternative, strong evidence for the alternative vs. the null, and evidence that doesn't clearly distinguish between the two models. All of which are of scientific interest. Even results that can't distinguish between models tell us where more data is needed. The results of any well-designed scientific study now have meaning and could potentially be publishable—regardless of significance.
Undertaken in an evidential statistics context, HARKing is a legitimate and even beneficial practice (Taper and Gogan, 2002). The evidence in HARKing has always been clear, although estimation of the uncertainty remained a problem (Taper and Lele, 2004). Bootstrapping of evidential comparisons now improves the understanding of the uncertainty of even HARKed results (Taper and Lele, 2011; Taper et al., 2019, Taper et al.).
Comments on the Articles
Shimodaira and Terada
At the heart of ecology is a search to better understand and characterize the relationship between species as well as that of a group of species and their environmental variables. On the other hand, a central topic in evolutionary studies is inferring the ancestral relationships of a set of extant species. In both cases, graph theory has become the theoretical foundation upon which the biological edifices in these two fields are constructed. In ecology, species are thought as nodes in a diagram and the relationships between species are represented as edges uniting any two nodes. In evolution, a phylogenetic binary tree is a diagram representing the evolutionary relationships among a set of extant species, which are shown as the tips (leaves) of the tree. Each interior node in the tree connects with three other nodes: two descendants and one ancestor.
The binary phylogenetic trees are called bifurcating trees because there are two branches leading out from each interior node. Proceeding from the present-day species of interest backwards in time under this binary framework eventually leads to a common ancestor, the root of the tree. In that context, one particular “tree topology” is one specific construction of the possible set of relationships among the species of interest and represents a single hypothesis about the ancestral relationships between these species, all the way back to their most recent common ancestor. How many such hypotheses can one posit with n species? With two species the answer is one, with three species the answer is three, with four it's fifteen, with five it's one hundred and five and in general, with n species it's (2n − 3)!/(2n−2(n − 2)!). For example, for six species, the number considered by Shimodaira and Terada one could posit 945 such trees.
In such setting, it quickly becomes obvious that good treatments of the statistical problems of multi-model selection and multiple hypotheses testing are key to making any progress in this area. Previously, the leading approach to deal with the problem of selecting among these models (hypotheses) the best representation of reality used NHST. This body of work was started by Kishino and Hasegawa (1989), and continued by Shimodaira (1998, 2002) and Shimodaira and Hasegawa (1999). Shimodaira and Terada now goes one step further and provides a novel methodology of shifting the phylogenetics question away from: “is a newly estimated tree topology significantly similar to the unknown, true species topology?” and instead ask: “from this set of models, which tree topology and group of models are significantly closer, in a KL distance spatial configuration sense, to the unknown, true topology?” To do so, Shimodaira and Terada estimate a spatial configuration of models in a three-dimensional model space, a geometrical construction very much like that of Ponciano and Taper. However, these two approaches differ in that while Shimodaira and Terada rely on a shifting combination of NHSTs and NPHTs for inference, Ponciano and Taper use a non-parametric self-entropy estimation to construct a model projection in a model space that can be used as the point to do a science-based examination of critical model attributes that allow a model to get closer to the generating process. The methodology of Ponciano and Taper is geared toward being coupled with uncertainty estimation and examining the strength of the evidence for a given model using the approach suggested by Taper et al. One should note that although (Shimodaira and Terada) are testing alternative hypotheses (H0:μ ∈ R versus H1:μ ∈ Rc), the tests are not standard NP tests. Truth does not lie in either hypothesis, but instead is being projected onto the manifold R∪Rc. Further, the pseudo data being used to generate the distribution of the test statistic does not come from H0, but is generated by a non-parametric bootstrap. Thus, the difference between the inference in Shimodaira and Terada and Taper et al. may be little more than the statistics they choose to present.
Scheiner and Holt
This paper takes the readers out of the weeds and forces them to look simultaneously at the trees and the forest. Deeply informed by both the history and the philosophy of science, the manuscript points out that evidential statistics formally only deals with the relationships among models and data; Scheiner and Holt then ask how evidential statistics can inform either the generation or the support for general and constitutive theories. Clearly it can because Peirce's abduction (Peirce, 1974) can be thought of as a conceptual adequacy measure for models, hypotheses, or theories, while modern abduction, i.e., inference to the best explanation (Haig, 2009) can be thought of as conceptual evidence for the same.
In an analogy to biological evolutionary theory, Scheiner and Holt discuss how model selection, an evidential process, can act as a selective force to winnow the models included in constitutive theories. Scheiner and Holt further suggest that pattern matching as well as Whewell's consilience and coherence (Forster and Wolfe, 1999) might possibly be utilized in formal procedures for quantifying the evidence supporting one theory over another.
Despite the excellence of this article, Scheiner and Holt do sin against science in suggesting that sometimes statistics is not necessary2. They claim for instance that if something never occurs then no statistics is necessary. To which a statistician would query, “never occurs in how many trials?” The evidential impact of something never occurring is very different in experiments of 1 trial, 4 trials, or 8 trials (see Jerde et al.). Because they are writing as theoreticians, Scheiner and Holt's sin is only venal. For theoreticians, statistics and even data, are always optional. The job of theoretical science is to construct alternative internally consistent possible worlds. The job of empirical science is to determine which of those possible worlds best describes the real world—and for that, statistics is always needed.
Jerde, Kraskura, Eliason, Csik, Stier, and Taper
Jerde et al. describe the motivation for, and the logic of, scientific inference using evidential statistics and demonstrate the utility of the evidential approach by tackling a long-standing controversial question in ecological physiology: How does standard metabolic rate (SMR) scale (intra-specifically) with individual body mass, and is this scaling similar among species? For fish, theoretical scaling rates of 0.67, 0.75, and 1.00 have been proposed. Empirical estimates of scaling coefficients vary tremendously among studies and generally all have large uncertainties leaving the theoretical question unprobed. Jerde et al. curate a large data set composed of a total of 1,456 observations in 55 separate trials on 12 species, all using current state of the art techniques for measuring SMR. The use of linear mixed effect models allowed (Jerde et al.) to combine all of these trials for inference.
Four suites of four models using random and fixed effects carefully explore the impacts of species, trial (within species), and temperature on the scaling of SMR with body mass. Model families were evaluated using the Schwarz information criterion (SIC, also known as the BIC). The SIC is a consistent criterion and the comparison of SIC values is an evidential procedure. Within and between model suites, evidence for specific values of the scaling coefficient were compared using profile ΔSIC curves. A ΔSIC value comparing two models >7 indicates strong evidence for the model with lower SIC.
Two model suites with a free parameter estimate of the metabolic scaling, separated themselves only by a ΔSIC of 1.5, were strongly differentiated from all others. Both had fixed effects for temperature and random effects (intercepts) for species. The best model had the log(weight) slope vary randomly across species (with modest variation), while the second-best model had a common slope over all species. In the best model the ML estimate for the mean scaling coefficient is 0.89 with a strong evidence profile ΔSIC interval spanning 0.82–0.99.
The evidence strongly indicates that none of the a priori theoretical scaling coefficients describe the scaling behavior in real fish.
Dennis, Ponciano, Taper, and Lele
Mathematics, and in particular probability, have long been intertwined with biology. The theoretician J. E. Cohen adroitly summarized the transcendence of the synergy between these fields with his essay “Mathematics is biology's next microscope, only better; biology is mathematics' next physics, only better” (Cohen, 2004). Key to the success of this interaction between these fields is the recognition that fundamental hypotheses in biology can be translated using the languages of mathematics, probability, and statistics into propositions than can be clearly probed. The increase in possibilities with such synergism is so dramatic that in some cases, it's as if a new portal to a field of scientific inquiry becomes available. Yet, becoming enamored with model construction and the phrasing of novel explanations of biological phenomena can sometimes obscure the analyst's vision and the realization that by its very human nature, mathematical models are limited constructs of biological processes. Mathematical models are indeed misspecifications of natural processes. Understanding the effects of model misspecification in our scientific inquiry should be paramount. This is the focus of Dennis et al. These authors assess analytically and numerically the performance of Neyman-Person Hypothesis testing (NPHT), Fisher significance testing (NHST), information criteria, and evidential statistics under model misspecification.
As mentioned above, evidential statistics seeks to quantify the strength of the evidence in the data for a reference model relative to another model. This goal is achieved through an evidence function, which is simply a statistic for comparing two models. Dennis et al.'s evidence function of choice was Schwarz Information Criterion, or SIC (Schwarz, 1978). The salient property of this and all evidence functions is that their associated probabilities of making a wrong model choice approach 0 as sample size increases. These probabilities, analogous to Type I and II errors in the Neyman-Pearson Hypothesis Testing (NPHT) framework are in fact pre-data error rates. Royall (2000) showed that these probabilities measure the chances of obtaining weak misleading-evidence as well as strong misleading-evidence. Dennis et al. shows that in a context where both models are in fact mathematical misspecifications of reality, making the wrong model choice refers to deeming as best a model that is not the closest to the true generating process model. By the same token, misleading-evidence simply corresponds to obtaining observations that either weakly or strongly support a model other than the one that is the closest to the data-generating process.
Unlike the classic NPHT and Bayesian approaches, the Evidential Statistics paradigm provides sound guidelines to evaluate inferential errors when none of the proposed statistical models are a perfect representation of the natural, data-generating process. The NPHT framework depends critically on either the Null or the Alternative hypotheses being a perfect representation of the data generating mechanism and then fixes the Type I error probability irrespectively of sample size and thus problematically assesses the evidence against the null hypothesis and remains silent with respect to the evidence for the null hypothesis. The asymmetry of the NPHT error structure leads to difficulties in interpretation of hypotheses tests. The decision to pick an alternative model over a null hypothesis in and of itself is not controversial as it has some intuitively desirable statistical properties: for example, the probability to reject the null hypothesis given that the alternative is true converges to 0 as sample size increases. However, the probability of erroneously choosing the alternative when the null is true remains stuck at the chosen level alpha regardless of how large a sample size is collected. Matters get more complicated when it is considered that the original Neyman-Pearson theorem assumes that the data was generated under one of the two models but provides no guidance whatsoever in the event of model misspecification, a scenario commonly encountered in science. The fact that in scientific practice model comparison rarely stops at two models further muddying the interpretation of experimental results using the NPHT. To be fair, overconfidence in model selection procedures also results when the model misspecification is ignored in Bayesian Statistics (Yang and Zhu, 2018).
The evidential approach proposes fixing cutoff values for the evidence statistic, not the error probabilities. Under this concept of evidence, the value of a statistic like the likelihood ratio is evidence, not an error rate that is pre-set. Then, the evidential error probabilities both converge to 0 as sample size grows large. Finally, under this evidential statistics approach, the conclusion structure of say, a comparison between two models H1 and H2 has a trichotomy of outcomes: (i) strong evidence for H1, (ii) weak or inconclusive evidence, and (iii) strong evidence for H2.
Some, not all, information criteria commonly used for model selection are evidence functions. While the AIC only penalizes the likelihood function using the number of parameters, the SIC is also scaled by the sample size. As a result, as sample size increases, the error in deeming a model as “best” using the SIC statistics becomes vanishingly small. Dennis et al. show that this desirable property, called “Information consistency” is lacking in the AIC. Inconsistent criteria, such as the AIC, tend to overfit at all sample sizes. Hence, the AIC is not an evidence function because it is not information consistent.
Although all paradigms of statistical science (NPHT, Bayesian statistics, Evidential Statistics) have flaws (reviewed in Lele a, b), the Evidential Statistics paradigm possesses more desirable characteristics for the quantification of uncertainty and ultimately, for the design of inferential statements about the models' proximity to the true, generating process.
Brittan and Bandyopadhyay
Written by a pair of philosophers of science, Brittan and Bandyopadhyay provides a good entry into the Research Topic. Despite maintaining a high level of intellectual rigor, Brittan and Bandyopadhyay avoids getting bogged down in technical statistical detail. The authors review the logical structures for scientific evidence: Hypothetico-deductive testing, Popperian falsification and corroboration, Fisherian significance, Neyman-Pearson hypothesis testing, the severe testing of Mayo, Bayesian confirmation, and statistical evidence.
The authors are equal opportunity balloon poppers pointing out the limitation of all methodological approaches. Brittan and Bandyopadhyay focus on the strengths, weaknesses, and complementarity of statistical evidence and Bayesian confirmation. Contra the prevailing scientific mythos, Brittan and Bandyopadhyay demonstrate that Bayesian inference is “irreducibly personal.” Bayesian methods do a good job of quantifying personal beliefs, and thus of informing personal decisions. Echoing Lele a; Brittan and Bandyopadhyay contend that non-informative priors are not objective and suffer from a variety of other problems. In contrast, statistical evidence does objectively quantify the relative support in data for specified pairs of models even though the models put forth for comparison may be generated subjectively.
Science is plagued by a suite of cognitive biases. Being aware of them can mitigate their impact. The authors note that each methodology works best to answer fairly narrow but different questions. Greater methodological self-consciousness on the part of scientists to match their choice of statistical approaches to match their scientific questions would promote scientific progress.
Brittan and Bandyopadhyay close on the same hopeful note and metaphor as do Scheiner and Holt. Despite the undeniable subjectivity of individual scientists, Science itself may achieve a “Darwinian Objectivity” when the mutational force of subjective scientific creativity is filtered by objective evidential model selection.
Ponciano and Taper
Information criteria have had a profound impact on modern science because they allow researchers to overcome the inadequacies of NPHT and tackle the multi-model selection process. Although model selection via information criteria gives the analyst an estimate of which probabilistic approximating models are closest to the generating process, information criterion comparison does not solve the problem of knowing how good the best model is. Indeed, the absolute distance to the generating process is not estimated through this process.
This caveat is all the more important when it is considered that in science, models are commonly misspecified. In this work, the authors resolve this shortcoming by designing a methodology to estimate a geometric representation of all the models under consideration along with the generating process. Such representation is a projection of all the models at hand into a two or three-dimensional space. As well, the location of the generating process in this representation is fully estimated. To estimate this model projection, the authors examined five key insights from Hirotsugu Akaike's original work. These insights reveal the deep, yet easy to grasp, geometrical nature of Akaike's formulation of the AIC. Ponciano and Taper extend Akaike's geometrical interpretation and propose visualizing all models at hand into a reduced space. This reduced space representation applies ordination techniques to the models themselves so that the analyst may see and estimate the divergence between each model and every other model including the generating process itself.
Ponciano and Taper's solution starts from the observation that while standard information criterion analysis considers only the divergences of each model from the generating process, the divergences amongst all approximating models, typically ignored, are indeed estimable. As a test bed for their ideas, the authors consider two ecological scenarios, one of them involving an individual-based model simulation framework that generates data to which different abundance models can be fitted and the second one involving structural equation models.
The authors also compare their approach to model averaging and show that model projection is not as sensitive as model averaging to the composition of the set of candidate models being investigated. Model averaging artificially favors redundance of model specification because the more models are developed in any given region of model space, the more heavily this particular region gets weighted. Furthermore, examining the resulting model space configuration can lead to an in-depth analysis of what are the model attributes that change from one model to the next that make it so that a model will get closer and closer to the generating process. This examination is the first step to explore models outside the bounds of the available model set, whereas by using model averaging, by definition, the analyst cannot do so.
Uncertainties around the estimation of model space estimation are yet not fully worked, but Taper et al. offers a first, non-parametric bootstrap approach to begin examining such question. Model projection methodology should be the starting point to do a science-based examination of critical model attributes that allow a model to get closer to the generating process (see also Toquenaga and Gagné). Finally, although Ponciano and Taper use the Kullback-Leibler, KL, divergence as the fundamental distance measure, the model projections methodology could be extended or adapted to any other metric.
Ferguson, Taper, Zenil-Ferguson, Jasieniuk, and Maxwell
There are a vast number of information criteria. Academic arguments about which is best are intense and often vitriolic. Ferguson et al. indicates that these arguments may be a tempest in teapot.
Seeking to improve model identification techniques for complex models with inter-dependent parameters, the authors modify Bozdogan's Information Complexity Criteria, ICC, to make them consistent and invariant to more kinds of transformations. To validate their suggested new criteria, Ferguson et al. perform a vast array of performance comparisons. Twenty-five information criteria are investigated: Two classical efficient criteria (AIC and AICc), two classical consistent criteria (BIC and BIC*), three forms of Bozdogan's ICC, and 18 new modifications of the ICC. All of these criteria were compared for their ability in attaining three different model selection goals: Selecting models with minimum prediction error, identifying the form of the generating model, and estimating the KL divergence to the generating process. All of this is done under 3 different classes of generating and approximating models, 3 different sample sizes, 3 different levels of process error, and 3 different levels of collinearity.
Ferguson et al. recommend one of their combined forms [BIC+2CvE(Ψ)] as achieving all measures of quality well under a broad range of modeling frameworks and having the theoretical advantage of being both scale invariant and consistent. However, it is important to note that No IC was best for any goal over all conditions and that All IC performed generally well for all goals.
Two important lessons should be taken from Ferguson et al.: First, much more attention needs to be paid to the uncertainty of model identification. And second, for these goals to be achieved sample sizes need to be larger in all model classes than is generally the case in ecology.
Claeskens, Cunen, and Hjort
Perhaps the most used statistical tools by ecologists are abundance count models. Simply counting the number of individuals of every species observed in a particular community is the point of entry to deeper studies aiming at understanding the generation and maintenance of organisms' diversity. Profound questions examining the processes driving ecological stability, resilience, resistance, invasion, and persistence all begin with being able to accurately ascertain organisms' abundances. In our joint decades of teaching and mentoring, time and again count models keep coming back as some of the main instruments of statistical inference sustaining masters' theses and PhD dissertations in biology, wildlife ecology and conservation. Ecologists are typically not only interested in estimating one or the other model parameters leading to particular predictions, but often see parameter estimation as the by-product of what they are typically after, which is understanding which hypothesized model components better represent the underlying natural processes generating the count data at hand.
Claeskens et al. propose and further elaborate on a methodology that may revolutionize the reaches of an ecology-driven statistical analyses and in particular, multi-model selection for models of count data. The main idea of the Focused Information Criterion (FIC) approach is to provide a model selection framework where the comparison and the ranking is formally defined according to the scientific quest at hand. Recognizing that different scientific teams might ask different focused questions of the same data and list of candidate models, Claeskens et al. design a methodology to focus the model selection process using different functions of the parameters of interest. When mainstream model selection tools are used in ecology and in a given scenario a model is chosen as the best model, practitioners are often left wondering why, in a specific scientific sense, such model is indeed the best model. FIC offers a theoretically sound methodology to obtain better, more precise estimates of a quantity of interest. For count models, such quantity is often the probability of a rare event occurring. As arbitrary or stale as it may sound at first, understanding and estimating accurately rare events in ecology has always been at the center of key explanations of diversity. Rarity, or “rare counts,” have been for a long time (e.g., Patil and Taillie, 1982) hypothesized to be a critical component of explanations of how hyper-diverse communities can be maintained. Such was also the conclusion of one of the most recent and cited explanations of the maintenance of diversity in tropical forests published by Levi et al. (2019). As it turns out, the Focused Information Criterion of Claeskens et al., which seeks to minimize the bias and the variance of a quantity of interest, works particularly well for estimating the probability of rare events. In line with the rarity comments above, Claeskens et al. show as examples a situation where the focus of the inference is estimation of the probability of observing counts of a species above an arbitrary number. Importantly, the authors show how other information criteria like the BIC, although they may address the problem of determining which model is the closest to the true data generating mechanism, may not point toward the models that do the best job at estimating for instance, the tail of a distribution of counts. By allowing for a flexible specification of different foci of interest, Claeskens et al. provide a welcome addition to the toolbox of the evidentialist. This tool is not only conceptual but is crystallized in a practical, easy to use library for R users, the “fic” library.
Markatou and Sofiktou
Most of the papers summarized so far share a key point: a reliance on the Kullback-Leibler divergence as the main instrument to develop and exemplify the theory and practice of Evidential Statistics. A natural reaction of any statistician to such heavy reliance on a single metric should be to ponder what would happen if different metrics or distances are used. Can the desiderata of evidential statistics be kept under different measures of divergence between the generating process and any approximating model, or amongst models themselves? Would the theoretical and asymptotic warrants of evidential statistics hold under different distance measures? How can statisticians visualize the strength of evidence under different measures? How does a measure of strong evidence using the KL divergence translates to other scales of divergence? These and other questions are approached using philosophical and rigorous statistical techniques in the contribution by Markatou and Sofikitou. Importantly, Markatou and Sofikitou's contribution builds upon the pioneering concepts of model adequacy by Lindsay (2004) and evidence functions by Lele (2004). Notably, the authors propose an explanatory analysis tool called a standardized distance ratio plot that can be used to visualize the strength of evidence provided for or against hypotheses of interest using different divergence measures. Hence, this paper represents itself growth in the field and marks a clear path for future research. Indeed, of all the contributions in this special issue, this one is perhaps the one topic that is most ripe for further research and study. An open direction that seems promising is shining light on the behavior of different statistical divergence measures under model misspecification. Whenever we give seminars in statistics departments about evidential statistics, the question of usage of other divergence measures invariably comes up. We therefore encourage both, a close reading of this paper and thinking about building extensions to these results using Markatou and Sofikitou's work as the foundation.
Stuart and Blume
New statistical approaches often face resistance from empirical scientists. It can help acceptance if a new technique seems familiar. Stuart and Blume cleverly disguise an evidential procedure with the face of a p-value, something that virtually every working scientist is familiar with. It does look like a p-value in that the statistic can take on values of 0, 1, and everything in between. Stuart and Blume even strengthen the familiarity by calling it a SGPV or second-generation p-value.
Of course, a SGPV is not a p-value, it is not even a probability. The SGPV is better than a p-value. The question of interest is whether an unknown, but estimated, parameter is in an interval null or is outside of the interval null. A p-value or a null hypothesis significance test (NHST) can indicate that the parameter is likely outside the null, but neither can give you support that it is inside the null. Conversely, an equivalence test can give you support for the parameter being inside the interval but not for being outside the interval.
Evidence like, the procedure divides the range of possible value for the SGPV into 3 regions: The point SGPV = 0, which indicates strong evidence the parameter is in the interval null. The point SGPV = 1, which indicates strong evidence the parameter is not in the null. And, the region of all values in between, which indicate that the data are consistent with both hypotheses and which way the evidence is tipping.
Stuart and Blume also demonstrate another important evidential property. The SGPV is consistent; the probability of misleading evidence goes to 0 as sample size increases.
The SGPV is very flexible and can be applied retroactively to any scientific literature in which a statistical interval is published. Stuart and Blume claim that SGPV is applicable to any type of interval confidence, support, or credible. The authors spend the bulk of the paper demonstrating good statistical properties for the SGPV under a wide range of circumstances.
Lele a
It is undeniably true that State-Space Models (SMMs) or more generally, hierarchical statistical models, nowadays occupy a central role in ecology and evolution. SMMs are used to study the population dynamics of animals with complex life histories, to estimate abundances under detection limitations and heterogeneity (among individuals, across space, and in time). Entire statistical ecology books for graduate students and researchers alike with titles around “hierarchical models in ecology” now fill the electronic and physical bookshelves of modern ecologists and academicians. As well, social media with short instructionals, blogposts and even tweets by the authors of these books are consumed voraciously by graduate students needing to solve complex problems in the face of non-standard datasets. Software authors in turn, face the challenge of putting out for consumption accessible programs that can weather usage by anybody interested in applying a given hierarchical model. Over recent years, this high demand for accessible solutions to complex problems has facilitated the establishment of uncritical use of modern statistical machinery.
Lele a approaches the consequences of such uncritical use head-on by clearly illustrating with real-life examples the predicaments brought about by using non-informative Bayesian analysis. Indeed, non-informative Bayesian analysis tends to be nowadays the default setting under which complex statistical models in ecology are fitted. In the name of pragmatism, it is often argued that in modern, extensive big data sets the sample size is so large that the likelihood information “swamps” any prior effect and that effectively, the data will “speak for itself.”
Lele a carefully delineates the flaws in such reasoning and vividly details how and why wildlife management decisions can vastly suffer from such uncritical use of Bayesian techniques. In particular, he shows that because of the lack of parameterization invariance of non-informative Bayesian Analysis, all subjective Bayesian inferences can be disguised as “objective,” non-informative Bayesian inferences. Furthermore, cryptic biases can be introduced in the resulting analyses because the induced priors on functions of parameters are not non-informative.
Three other serious flaws are then discussed besides these two. However, even if the author had presented only these two problems, practitioners, ecologists and wildlife managers should take note, because if the results of an uncritical non-informative Bayesian analysis is subject to unstated and unqualified biases, it may be easily challenged in the legislature and in the court of law. For completeness, professor Lele emphasizes that hierarchical models can be and are analyzed using the likelihood and frequentist methods. That is, any Bayesian analysis can be transformed to a likelihood analysis by data cloning.
Lele b
Uncertainty is a fundamental part of any inference, but the depth of its complexity is often not adequately appreciated. This paper, Lele b, gives a surprisingly readable review of many of the issues involved with statistical uncertainty. Lele b begins with a short list, culled from the literature, of desirable features for uncertainty quantification procedures: (1) transformation invariance, (2) uncertainty measure reflect data informativeness, (3) ascertainability, and (4) diagnostic potential.
The first, transformation invariance, implies that the probability of an event occurring or not occurring is a reasonable measure of uncertainty. This of course requires understanding what probability is and the paper next discusses the two major definitions of probability used by statisticians and scientists alike: aleatory or frequency-based probability and epistemic or belief-based probability.
For adherents of frequentist statistics, data (i.e., data sets) are random realizations from a stochastic generating process. Consequently, estimates of parameters inherit stochasticity from the generating process through the stochasticity of data sets. The distribution of parameter estimates over an infinite number of random data sets is called the true sampling distribution of the parameter. One can estimate a parameters sampling distribution by bootstrap or analytic approximation. The estimated sampling distribution contains a great deal of information about the uncertainty of the procedure. Much of this uncertainty is captured by confidence intervals. While arguing for the utility of confidence intervals, Lele b points out they are often misinterpreted.
Lele b points out that the target of a confidence interval is to cover the true parameter, not to cover the parameter estimated in another experiment. Another common way that confidence intervals are misinterpreted is by failing to distinguish between unconditional/pre-data and conditional/post-data intervals. Both kinds of intervals are commonly used in the scientific literature. In separate sections Lele b returns to the questions of interval construction and interpretation from Bayesian and evidentialist perspectives.
As pointed out by Brittan and Bandyopadhyay “any adequate (‘reliable') hypothesis must be both explanatory and predictive.” It is only through the verification of predictions that the ascertainment of models or hypotheses is possible. Lele b takes this very seriously reviewing the representation of prediction uncertainty in all three inferential paradigms. Further, a new flexible approach to the calculation of an evidential predictive density is suggested and its advantages, both demonstrated and potential, are discussed.
The paper concludes by rehearsing the key features, strengths, and weaknesses of the characterization of uncertainty in the three paradigms in the light of the four desiderata. None is perfect, but overall, the evidentialist most closely conforms. All three paradigms require scientists to specify their models and whether inference should conditional or unconditional. Bayesian inference further requires the specification of priors, while evidence requires the specification of an evidence function. The last thing any reader wants to hear is that the quality of their scientific inference depends critically on the active choices they make—regardless of their statistical paradigm. Nevertheless, this is precisely the last thing that Lele b says.
Toquenaga and Gagné
Genetic sequencing is becoming an increasingly important tool in ecological and evolutionary studies. This trend has been accelerated by the new techniques of “next-generation sequencing,” NGS. These sequencing procedures work by digesting a genetic sequence into many small fragments (called reads), sequencing the fragments, and then inferring the original sequence computationally. This is like the spy novel trope of pasting a shredded letter back together.
With the scientific opportunities, come many statistical challenges. There are many programs that make these calculations. Unfortunately, they don't agree—with each other and because many of the programs involve stochastic searches, even between multiple runs of the same program. Toquenaga and Gagné, use evidential principles to develop methods to choose among the many putative sequences offered by an array of sequencing software, to assess how good the proposed sequences are, and even to improve them.
The thinking in Toquenaga and Gagné is as follows: If multiple algorithms produce multiple sequences, each must be a model of the true sequence. If an appropriate function for measuring the divergence between these sequence models can be found, then the model projections in model space methods of Ponciano and Taper can be used to understand the relationships among the proposed models and even to a true sequence. The Levenshtein edit distance (Levenshtein, 1966), as a measure of the minimum number of changes needed to equate two sequences from finite alphabets, offers itself as an appropriate divergence.
Toquenaga and Gagné test this proposition by taking a known genetic sequence and randomly breaking it into a number of fragments (with potential overlap). The number and distribution of fragment sizes are set to mimic typical digestion results. In their test case, Toquenaga and Gagné are able to construct, using non-metric dimensional scaling, a two-dimensional map of the sequence estimates produced by the various sequencing programs compared by the authors. Their map correctly identifies the best-proposed sequence.
In this test case, one of the programs is able to correctly reconstruct the true sequence. However, such a felicitous occurrence may not be general. Usefully, Toquenaga and Gagné propose an approach that can suggest sequences likely to improve on the set of mistaken sequences. They do this by proposing new sequence models which are consensus sequences of existing models and seeing where they fit into the map.
Toquenaga and Gagné confirm their method with a parametric bootstrap based on a specified true sequence. Implicit in this is the potential to use similar bootstrapping to assess the uncertainty in sequence construction.
Taper, Lele, Ponciano, Dennis, and Jerde
Taper et al. develops themes from two other papers in this Research Topic. Dennis et al. show that in the presence of model misspecification Royall's universal bound on the strength of misleading evidence does not hold. Lele b reminds us that statical uncertainty comes in two forms: global/unconditional and local/conditional.
To Royall's regions of weak and strong evidence (Royall, 2000) the authors intersperse a third category, that of prognostic evidence. This is evidence not so weak as to be dismissed nor so strong as to be considered overwhelming. Thus, while evidence is itself continuous, useful descriptive categories for considering evidence are constructed.
Taper et al. show that even in the presence of model misspecification the uncertainty in model identification can be quantified in the form of non-parametric bootstrap confidence intervals on evidence. This decouples evidence and its uncertainty and allows scientists to consider both. The authors consider evidence (either prognostic or strong) for one model over another to be “secure” if the lower 5% confidence limit on the evidence is above the preset prognostic boundary, kp.
To demonstrate the utility of this approach, Taper et al. make a detailed reanalysis of model selection in Grace and Keeley's (2006) classic structural equation modeling of post-fire diversity recovery in California shrublands. The use of evidence confidence intervals develops a much more nuanced understanding of which model components are likely to be robust and which are equivocal.
Technically, Taper et al. use an improved version of the EIC (see Kitagawa and Konishi, 2010). The improvements include: (1) bootstrapping of the ΔSIC rather than individual likelihoods to incorporate the effects of misspecification geometry. And (2) identification of components of EIC that correspond to global and local inference.
The paper finishes with an extended discussion of the interpretation of global and local inference in science.
Author Contributions
All authors contributed to the conception and writing of this editorial. All authors contributed to the article and approved the submitted version.
Funding
JP was partially supported by two grants from the US National Institute of Health grant number to University of Florida NIH R01 GM103604 to JP and NIH 1R01GM117617 to Profs. Jason K. Blackburn and JP. JP was also partially supported by NSF Award Number 2052372 to University of Florida (PI: JP, Project title: Collaborative Research: Scaling Properties of Ecological Variation in Complex Dynamical Systems). YT was partly supported by JSPS KAKENHI Grant Numbers 17H04612 and 18K06410.
Conflict of Interest
The authors declare that the research was conducted in the absence of any commercial or financial relationships that could be construed as a potential conflict of interest.
Publisher's Note
All claims expressed in this article are solely those of the authors and do not necessarily represent those of their affiliated organizations, or those of the publisher, the editors and the reviewers. Any product that may be evaluated in this article, or claim that may be made by its manufacturer, is not guaranteed or endorsed by the publisher.
Acknowledgments
We thank Brian Dennis and Subhash R. Lele for critically reading a draft of this editorial. We are grateful to all of the authors who contributed to this Research Topic and to the editors and reviewers who worked hard to clarify the presentations. Our understanding of evidence has been sharpened by years of discussions with Prasanta S. Bandyopadhyay, Gordon Brittan Jr., Brian Dennis, Jake M. Ferguson, Christopher L. Jerde, Subhash R. Lele, and Kenichiro Shimatani.
Footnotes
1. ^By error statistics we mean that subcategory of frequentist statistics that uses error probabilities as the primary inferential quantity including Fisherian significance, null hypothesis significance testing, Neyman-Pearson hypothesis testing, and severe testing. The term classical statistics is sometimes applied to this grouping, but this can be considered a misnomer as Bayesian statistics predates these methods considerably.
2. ^In prepublication conversations on this point, we told the authors that they could say whatever they wanted in their paper, but that the final word would belong to the editors.
References
Cohen, J. E. (2004). Mathematics is biology's next microscope, only better; biology is mathematics' next physics, only better. PLoS Biol. 2, 2017–2023. doi: 10.1371/journal.pbio.0020439
Forster, M. R., and Wolfe, A. (1999). Conceptual Innovation and the Relational Nature of Evidence: The Whewell-Mill Debate. Электронный ресур1. Режим доступа. Available online at: https://www.academia.edu/39209519/Conceptual_Innovation_and_the_Relational_Nature_of_Evidence_The_Whewell_Mill_Debate
Franco, A., Malhotra, N., and Simonovits, G. (2014). Publication bias in the social sciences: unlocking the file drawer. Science 345, 1502–1505. doi: 10.1126/science.1255484
Grace, J. B., and Keeley, J. E. (2006). A structural equation model analysis of postfire plant diversity in California shrublands. Ecol. Appl. 16, 503–514. doi: 10.1890/1051-0761(2006)016[0503:ASEMAO]2.0.CO;2
Haig, B. D. (2009). Inference to the best explanation: a neglected approach to theory appraisal in psychology. Am. J. Psychol. 122, 219–234.
Ioannidis, J. P. A. (2019). What have we (Not) learnt from millions of scientific papers with p values? Am. Stat. 73, 20–25. doi: 10.1080/00031305.2018.1447512
Kerr, N. L. (1998). HARKing: hypothesizing after the results are known. Personal. Soc. Psychol. Rev. 2, 196–217. doi: 10.1207/s15327957pspr0203_4
Kishino, H., and Hasegawa, M. (1989). Evaluation of the maximum-likelihood estimate of the evolutionary tree topologies from dna-sequence data, and the branching order in Hominoidea. J. Mole. Evolut. 29, 170–179. doi: 10.1007/BF02100115
Kitagawa, G., and Konishi, S. (2010). Bias and variance reduction techniques for bootstrap information criteria. Ann. Inst. Stat. Math. 62, 209–234. doi: 10.1007/s10463-009-0237-1
Lele, S. R. (2004). “Evidence functions and the optimality of the law of likelihood,” in The Nature of Scientific Evidence: Statistical, Philosophical and Empirical Considerations, eds M. L. Taper, and S. R. Lele (Chicago, IL: The University of Chicago Press), 191–216.
Levenshtein, V. I. (1966). Binary codes capable of correcting deletions, insertions, and reversals. Soviet Phys. Doklady. 10, 707–710.
Levi, T., Barfield, M., Barrantes, S., Sullivan, C., Holt, R. D., and Terborgh, J. (2019). Tropical forests can maintain hyperdiversity because of enemies. Proc. Natl. Acad. Sci. U.S.A. 116, 581–586. doi: 10.1073/pnas.1813211116
Lindsay, B. G. (2004). “Statistical distances as loss functions in assessing model adequacy,” in The Nature of Scientific Evidence: Statistical, Philosophical and Empirical Considerations eds M. L. Taper, and S. R. Lele (Chicago, IL: The University of Chicago Press), 439–488. doi: 10.7208/chicago/9780226789583.003.0014
Pashler, H., and Wagenmakers, E. J. (2012). Editors' introduction to the special section on replicability in psychological science: a crisis of confidence? Perspect. Psychol. Sci. 7, 528–530. doi: 10.1177/1745691612465253
Patil, G. P., and Taillie, C. (1982). Diversity as a concept and its measurement. J. Am. Stat. Assoc. 77, 548–561. doi: 10.1080/01621459.1982.10477845
Peirce, C. S. (1974). “Harvard lectures on pragmatism 1903,” in The Collected Papers of Charles Sanders Peirce, Vol. 5, eds C. Hartshorne, and P. Weiss (Cambridge: Harvard University Press), 188–189.
Royall, R. M. (2000). On the probability of observing misleading statistical evidence. J. Am. Stat. Assoc. 95, 760–780. doi: 10.1080/01621459.2000.10474264
Schwarz, G. (1978). Estimating the dimension of a model. Ann. Stat. 6, 461–464. doi: 10.1214/aos/1176344136
Shimodaira, H. (1998). An application of multiple comparison techniques to model selection. Ann. Inst. Statist. Math. 50, 1–13. Available online at: https://www.ism.ac.jp/editsec/aism/pdf/050_1_0001.pdf
Shimodaira, H. (2002). An approximately unbiased test of phylogenetic tree selection. Syst. Biol. 51, 492–508. doi: 10.1080/10635150290069913
Shimodaira, H., and Hasegawa, M. (1999). Multiple comparisons of log-likelihoods with applications to phylogenetic inference. Mol. Biol. Evol. 16, 1114–1116. doi: 10.1093/oxfordjournals.molbev.a026201
Taper, M. L., and Gogan, P. J. P. (2002). The Northern Yellowstone elk: density dependence and climatic conditions. J. Wildlife Manage. 66, 106–122. doi: 10.2307/3802877
Taper, M. L., Lele, S. R., Ponciano, J.-M., and Dennis, B. (2019). Assessing the uncertainty in statistical evidence with the possibility of model misspecification using a non-parametric bootstrap. Available online at: https://arxiv.org/abs/1911.06421v1
Taper, M. L., and Lele, S. R. (2004). “The nature of scientific evidence: A forward-looking synthesis,” in The Nature of Scientific Evidence: Statistical, Philosophical and Empirical Considerations, eds M. L. Taper and S. R. Lele (Chicago, IL: The University of Chicago Press), 527–551.
Taper, M. L., and Lele, S. R. (2011). “Evidence, evidence functions, and error probabilities,” in Philosophy of Statistics, eds P. S. Bandyopadhyay and M. Forster (Elsevier), 513–532.
Taper, M. L., and Ponciano, J. M. (2016). Evidential statistics as a statistical modern synthesis to support 21st century science. Popul. Ecol. 58, 9–29. doi: 10.1007/s10144-015-0533-y
Keywords: replication crisis, scientific inference, model misspecification, inference bias reduction, statistical foundations
Citation: Taper ML, Ponciano JM and Toquenaga Y (2022) Editorial: Evidential Statistics, Model Identification, and Science. Front. Ecol. Evol. 10:883456. doi: 10.3389/fevo.2022.883456
Received: 25 February 2022; Accepted: 11 March 2022;
Published: 25 April 2022.
Edited and reviewed by: Juergen Pilz, University of Klagenfurt, Austria
Copyright © 2022 Taper, Ponciano and Toquenaga. This is an open-access article distributed under the terms of the Creative Commons Attribution License (CC BY). The use, distribution or reproduction in other forums is permitted, provided the original author(s) and the copyright owner(s) are credited and that the original publication in this journal is cited, in accordance with accepted academic practice. No use, distribution or reproduction is permitted which does not comply with these terms.
*Correspondence: Mark L. Taper, bWFya2x0YXBlckBnbWFpbC5jb20=