 Yuan Lin
 Jun Li2
 Zhenhua Wang
94% of researchers rate our articles as excellent or good
Learn more about the work of our research integrity team to safeguard the quality of each article we publish.
Find out more
ORIGINAL RESEARCH article
Front. Ecol. Evol., 14 April 2022
Sec. Population, Community, and Ecosystem Dynamics
Volume 10 - 2022 | https://doi.org/10.3389/fevo.2022.874558
This article is part of the Research TopicEffects of Non-Random Sources of Alteration on Biodiversity and Ecosystem FunctioningView all 19 articles
This study was undertaken in order to explore the practical effectiveness of the environmental DNA (eDNA) metabarcoding approach in evaluating fish composition and diversity in a high heterogeneous rocky reef habitat. We assessed the fish composition and diversity characteristics of the rocky reef habitat at Dachen Islands, Taizhou and the Zhejiang Province in China in November 2020 by comparing two methods: multi-mesh gillnets and eDNA. A comparative analysis was carried out on the fish composition and diversity characteristics gained under the two methods by using taxonomy, ecotypes and diversity indices. The results showed that there were 28 species of fish collected through gillnets, distributed under 24 genera, 19 families, 6 orders and one class. Among them, 4, 18, and 6 species of near-surface, near groundfish and groundfish were found, respectively, with Thryssa mystax, Johnius belangerii, and Sebastiscus marmoratus being the dominant species in each water layer. A total of 81 species of fish detected by eDNA metabarcoding belonging to 67 genera, 46 families, 15 orders and 2 classes. The near-surface, near groundfish and groundfish species were 17, 42, and 22, with Thryssa vitrirostris, Benthosema pterotum, Harpadon nehereus, and Dasyatis akajei being the dominant species in each water layer. Twenty species (71.4%) and 41 species (50.6%) of reef fish were counted by gillnets and eDNA, respectively. The results showed that multi-mesh gillnets can accurately obtain information on fish composition in rocky reef habitats, but with some selectivity. The eDNA technology can detect species not collected by gillnets, but the number of species detected in areas with fast water velocity is significantly less than other eDNA stations where the water velocity is slow. In summary, the combination of traditional nets and eDNA will provide more information on taxonomic diversity and population biomass, transforming natural resource management and ecological studies of fish communities on a larger spatial and temporal scale.
Rocky reef habitats host numerous fisheries with their limited space and are one of the natural habitats that uphold high fish diversity (Darling et al., 2017). High heterogeneity within rocky reefs and the complex hydrodynamic effects around them create habitat for coastal fishes, especially reef fishes, while the combined hydrodynamic forces such as tides and upwellings in shallow seas provide abundant bait organisms in rocky reef waters. As a result, rocky reef habitats naturally become binding sites for fish and other nekton to breed, develop, spawn, feed and avoid predators. Typically, a dynamic pattern of fish assemblage in these areas become essential parts of coastal communities, which are dominated by ground reef-dwelling fishes. Other migratory fish select this habitat periodically to complete their specific life histories. Due to the high spatial heterogeneity and temporal variability of some reef habitats, it is often difficult to conduct a comprehensive and systematic survey of fish communities. Hence, a better understanding of fish assemblage patterns and their diversity in rocky reef habitats is essential to reveal anthropogenic disturbance in a large spatiotemporal scale, which may play key roles in regional fisheries management. Undoubtedly, it is needed to build a more rational and efficient assessment type to fulfill this scientific aim.
The diversity of fish species in rocky reef habitats has been investigated in a very long history and in various ways, especially since the 1990s in coastal countries such as Italy, Spain, the United Kingdom and Australia (Underwood and Chapman, 1996; Azzurro et al., 2010). For the past decade, several reports on fish diversity in rocky reef waters in China called upon scholars’ attention to this topic (Wang et al., 2012, 2013; Liang et al., 2014; Li et al., 2020). In general, these studies on fish diversity assessment were mainly based on destructive sampling tools such as bottom trawling, gillnetting, longlining and crab traps (Juza et al., 2018). Among these conventional assessment methods, gillnets are widely used for fish monitoring in complex habitats such as rocky reefs, but the probability of fish contacting and being trapped in the net increases with swimming distance, speed and discontinuity in body contour, and is therefore passive and selective (Silvano et al., 2017; Grimaldo et al., 2019). The size distribution of the fish is also asymmetrical and, when nets are encountered, catching is less efficient due to the slower speed of the smaller nets and their less flexible nature. However, its disadvantage of high selectivity can be significantly reduced by a changed triple gillnet with multiple mesh combinations, which is more representative for evaluating fish diversity in rocky reef habitats (Olsen et al., 2019). When tidal currents and estuary water meet and mix in coastal area of the East China Sea, the rocky reef habitat shows rather poor visibility, low transparency and strong currents, making underwater observation, such as scuba diving, ineffective and impossible. The sampling methods such as multi-mesh trammel nets can take full advantage of their high flexibility and low selectivity. However, fishes belonging to order Anguilliformes, family Sparidae and Serranidae, can hardly be trapped by sampling gillnets, due to their slender and smooth body, strong swimming power and strong sight, such as whitespotted conger, snappers and groupers. Given this, a relatively new effective method, eDNA metabarcoding, can be introduced besides multi-mesh trammel nets, in order to do a comprehensive survey on fish diversity in rocky reef habitats.
Environmental DNA is the small amount of DNA that an organism releases into its surroundings, leaving a genetic footprint of skin, scales, waste and other tissues (Pawlowski et al., 2020). eDNA metabarcoding is a sensitive, effective, non-invasive biodiversity monitoring method for detecting rare, enigmatic, invasive and endangered species with high certainty, low cost and minimal stress on the aquatic organisms. It also estimates biodiversity in terrestrial, aquatic and marine environments and acts as a proxy signal for the biomass of fish species and populations (Takahara et al., 2012). It has been successfully used in amphibians (Tews et al., 2010; Malekian et al., 2018; Bailey et al., 2019; Ficetola et al., 2019; Brys et al., 2020; Fediajevaite et al., 2021), fish (Pont et al., 2018; Jo et al., 2019; Stoeckle et al., 2020), insect larvae, crustaceans and mammals (Pont et al., 2018) and has proven to be an effective genetic monitoring tool for the presence of species in ecosystems. At present, the eDNA metabarcoding approach is gradually becoming popular in the study of fish in China. Fish eDNA has been detected in various aquatic environments, including ponds (Fujiwara et al., 2016; Harper et al., 2019a,b), streams and rivers (Doi et al., 2017; Rice et al., 2018; Pont et al., 2019; Shogren et al., 2019) and marine waters (Thomsen et al., 2012; Port et al., 2016), very rare studies have reported combining traditional netting and eDNA techniques for fish diversity investigations in rather complex habitats such as rocky reefs. Few researchers have focused on rocky reef habitats, and, to our knowledge, no one has compared the efficiency of eDNA vs. multi-mesh gillnets to measure fish diversity.
During the investigation of fish diversity in the reef habitat of Dachen Islands in the East China Sea in October 2020, we made a serendipitous observation that the DNA of Dasyatis akajei and Harpadon nehereus were detected in the water sample but were not captured by gillnets. Given this observation, we wondered if eDNA metabarcoding detection could be more abundant than the results collected by gillnets in the reef habitat. If so, diversity analysis of reef habitat fish using eDNA metabarcoding could provide more accurate information on important reef-dwelling fish with strong swimming abilities and superior underwater perceptions. To test the concept and compare the effects of eDNA metabarcoding and multi-mesh gillnets on fish diversity assessment, we aimed to firstly compare the differences and similarities of the composition of fish species and their ecological groups, and the influencing factors of diversity between the two methods, and, secondly, analyze the advantages and disadvantages of the two methods to provide optimization strategies for fish biodiversity investigation in complex habitats.
Data for this study was obtained from a background survey of fisheries in rocky reef habitats in November 2020. The study area is located in the sea area of Dachen Islands, near the upper and lower islands, in the eastern part of the Jiaojiang District, Taizhou City and the Zhejiang Province in China. The sea area is located between 27 and 29° degrees off the East China Sea near the coast, located in the mid-latitude zone. It belongs to the subtropical monsoon climate. Affected by the intersection of three major water systems, such as Taiwan warm current, Zhejiang coastal current and mainland runoff, the annual average temperature is 16.7°C, the perennial water temperature is between 10.5 and 27.9°C, the water depth is 18–20 meters, the water quality is fertile, the temperature and salt are suitable, and the bait is rich. Its location advantages and geographical conditions provide an ideal habitat and breeding place for many fish.
Due to the large amount of sediment in the north side of Shang Dachen Island and the need to ensure that the extraction of water DNA can be completed within the effective time, the stations were located in the south of Shang Dachen Island and around Xia Dachen Island. Eleven stations (S1–S11) were set up, of which stations S7 and S8 were near the cage aquaculture area and stations S9 and S11 were near the mussel culture area. The specific survey sites were set up as shown in Figure 1. Fish and water samples were collected in the following order: S11, S6, S7, S10, S4, S9, S2, S5, S3, S8. The details of the latitude and longitude coordinates of each sampling site and the time of the water sample collection is shown in Supplementary Table 1.
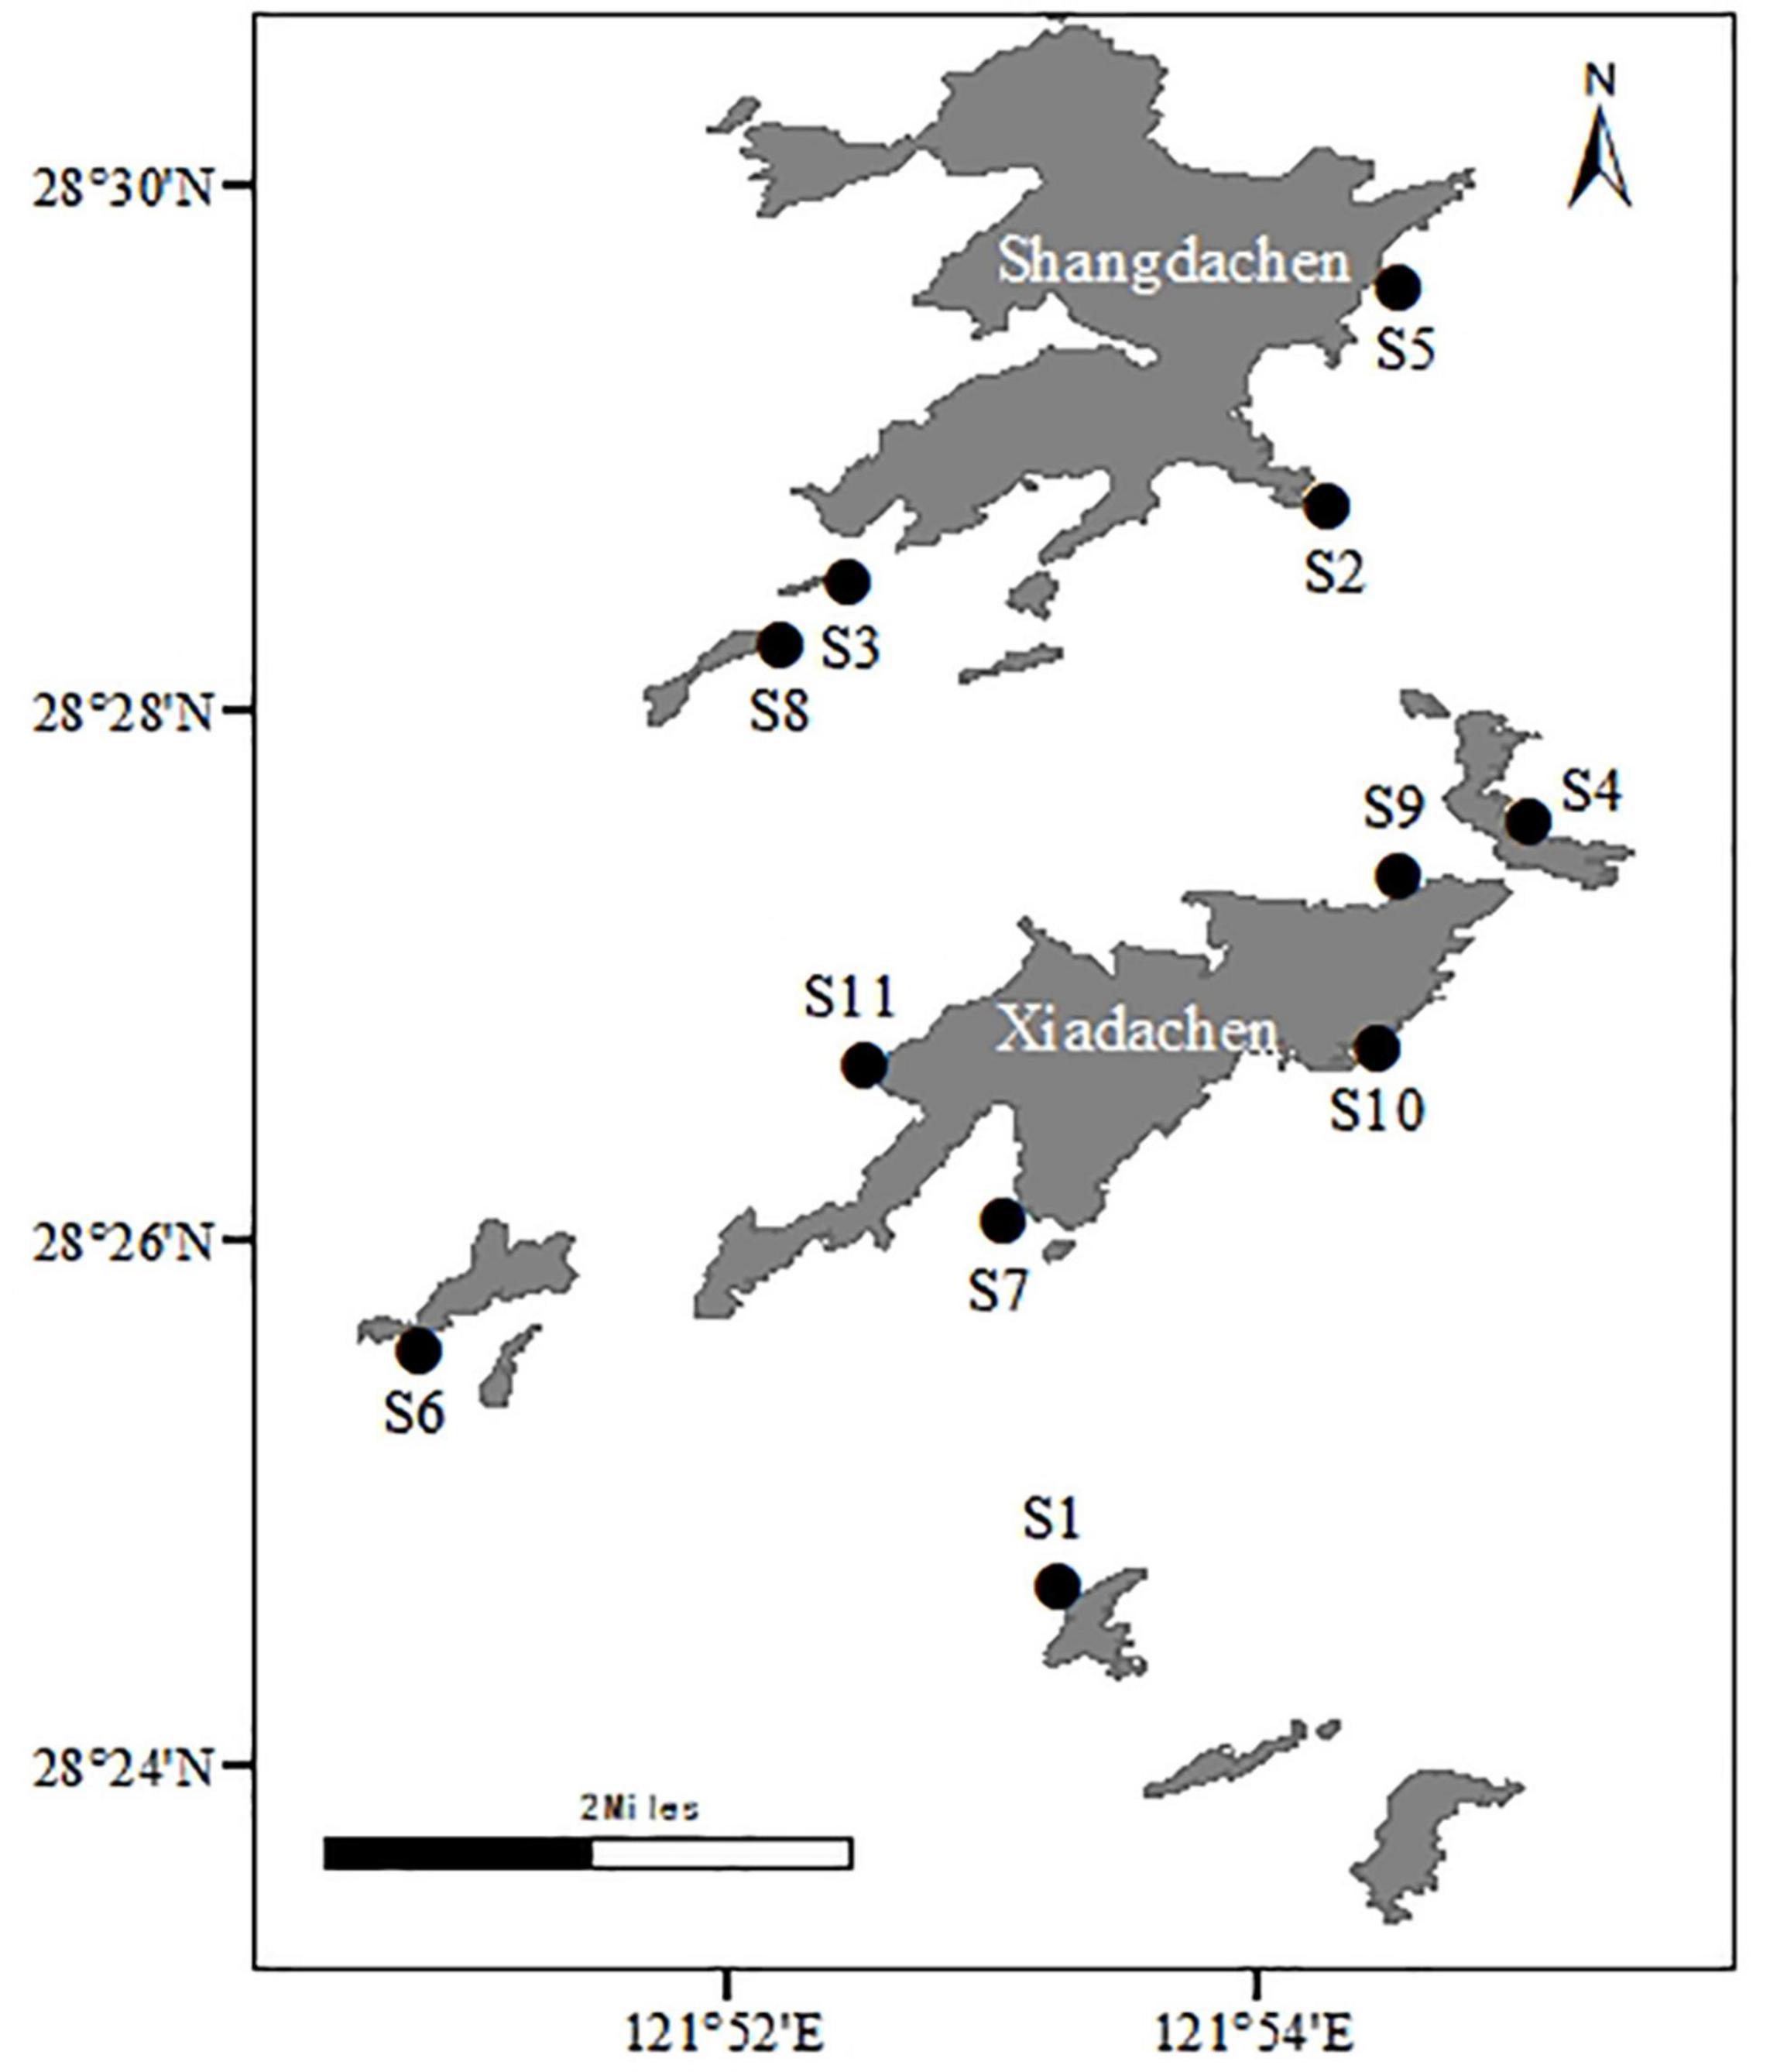
Figure 1. Distribution of rocky reef habitat survey sites on Dachen Islands.
Gillnets were placed at 11 sites between 8:00 a.m. and 12:00 p.m. on the 24th of November 2020. The height of the gillnets is 1.5 m, the outer mesh coat is 26 cm, and the inner mesh coat consists of four spliced sections with the mesh of 25, 35, 50, 60, and 70 mm, ensuring a sample strip length of approximately 120 m per site and a release time of about 18 ± 6 h per release. All stations were then closed before low tide on the 25th—the low tide was at 13:12. The fish were returned to the laboratory within 2 h of collection and species identification was carried out within 6 h. Identification was based on the Nelson system (Nelson, 1976). At the same time, biological measurements were made, including length, body weight, feeding intensity and gonadal maturity. All standards were based on the Marine Survey Code (GB12763-2007) (China State Bureau of Quality and Technical Supervision, 2007a) and the Marine Monitoring Code (GB17378-2007) (China State Bureau of Quality and Technical Supervision, 2007b) and the species of the fish were identified according to the Zhejiang Marine Fish Journal.
Twenty-two samples were collected from the surface and bottom layers of the seawater at each of the 11 stations before each net release. All samples were collected before low tide and then placed in sterile sealable wide-mouth bottles. In particular, surface water samples were taken approximately 3–5 m from the surface and 3–5 m from the bottom, and the sampling locations were synchronized with the gillnet fish sampling stations to collect water samples before each retrieval. The water samples were filtered immediately after collected. A mixed fiber membrane of 47 mm in diameter and 0.45 μm pore size was used for filtration and negative control was set up for each sample per filtration. All filtered material was rinsed once with a 10% bleach solution and washed three times with distilled water (Shu et al., 2020). After filtration, the membranes were sealed in sterilized 10 ml lyophilisation tubes and stored at –20°C until DNA extraction. The extraction of the eDNA was achieved using the E.Z.N.A™ Mag-Bind Soil DNA Kit (Omega Bio-Tek). The extraction procedure was based on the kit’s instructions and was repeated three times for each sample. All steps were taken to avoid contamination at each stage of the experimental process. CTD thermohalimeter was used to measure water depth, flow velocity, temperature, pH levels, turbidity, salinity, dissolved and oxygen at each survey station. At the same time, two 500 ml parallel water samples were collected at each sampling point to determine the following nutrient indexes: nitrate, nitrite, ammonia nitrogen, silicate and phosphate.
The MiFish-U-F:(5′-GTCGGTAAAACTCGTGCCAGC-3′) and MiFish-U-R:(5′-CATAGTGGGGTATCTAATCCCAGTTTG-3′), which target the 12S rDNA region of the mitochondria gene, were used to amplify 170 bp fragments of the extracted eDNA samples (Miya et al., 2015). The 30 μL reaction system includes 15 μL of 2 × PCR Buffer, 1 μL of dNTP (10 mmol/L), 1 μL of forwarding primer (10 pmol/μL), 1 μL of reverse primer (10 pmol/μL), 5 μL of DNA template and 36.5 μL of sterilized double-distilled water. Reaction conditions were: 95°C pre-denaturation 3 min; 94°C denaturation 20 s, 55°C annealing 20 s, 72°C extension 30 s (5 cycles), and 72°C extension 75 min, 10°C.
Illumina Miseq™ was used for DNA sequencing library construction. Library quality was evaluated using a Qubit 3.0 fluorometer (Thermo Fisher Scientific, Waltham, United States) and Agilent Bioanalyzer 2100 (Agilent Technologies Inc., California, United States). The library was then sequenced on the Illumina Miseq platform (Shanghai Bioengineering Co. Ltd.).
The data obtained by off-line sequencing is double-ended sequence data, and the sequencing sequence contains barcode sequence, primer and linker sequence added during sequencing. Firstly, the primer splice sequence needs to be removed, and then the paired reads are spliced into a sequence according to the overlapping relationship between PE reads, and then the samples are identified and distinguished according to the barcode tag sequence to obtain each sample data. Finally, the quality of each sample data is filtered by quality control to obtain the effective data of each sample.
OTU clustering and annotation are carried out according to sequence similarity ≥ 97%. After that, the OTU representative sequence is compared with Mito fish1 and NCBI.2 The database is compared, classified and annotated, and the corresponding OTU abundance table is obtained. In the parallel samples of each sampling point, the unmatched species sequences are eliminated, and the number of matched species sequences is processed according to the mean value. The raw data were deposited in the NCBI BioProject database3 with the accession number of PRJNA808626.
After removing the data information compared to non-fish (such as bacteria, birds, amphibians and mammals), screen out OTUs compared to fish with identity value ≥ 97% and E-value ≤ 10–5, and then merge OTUs compared to the same species. If there are OTUs that cannot be compared to the species level, statistics shall be made up to the next higher level, such as genus, family, etc. Count the proportion of effective sequence number of each kind of fish in each sample in Excel, and refer to FishBase database, notes of inland fish species and distribution in China and marine fish records of Zhejiang to improve fish taxonomy information.
According to their dependence on the reef, fish are classified as reef-touching, reef-trending, reef-attracting and pelagic fish species. Reef-touching fish are sedentary fish that depend on rocky reefs for their entire life history and can only be collected in reef habitats such as Sebastiscus marmoratus. Reef-touching fish such as Hapaloyenys mucronatus are stage-dependent on reefs for breeding, feeding or larval shelter. Reef-attracting fish prefer to stay around the reef but are not directly dependent on it, such as Engraulidae and Clupeidae. Pelagic fish are those that do not depend on the reef at all for their survival. All fish are classified into three ecological types based on their water layers: near-surface fish, near groundfish and groundfish (Wang et al., 2012).
The Shannon-Wiener diversity index (Tikadar et al., 2021), the Simpson diversity index (Duijndam et al., 2020), the Margalef richness index (Van Loon et al., 2018) and the Pielou evenness index (Tikadar et al., 2021) were used to analyze the diversity of gillnet fish species based on the ecological characteristics of the coastal waters of Dachen and the fishery resources data obtained. Based on the eDNA high-throughput sequencing results, the Shannon and Simpson indices were used to assess the diversity of fish community distribution. The Chao1 and ACE indices were used to calculate the abundance of fish community distribution. Shannon and Simpson diversity indices are commonly used to reflect alpha diversity indices. The greater the Shannon value, the higher the community diversity. Simpson is used to estimate one of the microbial diversity indexes in samples, which is often used to quantitatively describe the biodiversity of a region in ecology. The greater the Simpson index value, the lower the community diversity. The Pielou index reflects the evenness of the distribution of different species in the community. The Margalef index reflects the richness of species in the community. A species diversity index is a comprehensive index of richness and uniformity. The specific equations are set out below.
(a) H = ∑(Pi*Log2Pi)Pi is the probability of drawing the ith individual from among the N individuals.
(b) D = 1−∑P2i,
(c) is the number of species in the ecosystem, and N is the total number of individuals.
(d) H is the measured diversity, and Hmax is the maximum diversity.
(e) Sobs denotes the number of OTUs observed. ni represents the number of sequences contained in the ith OTU and N denotes the total number of sequences
(f) .
(g) hao1 indicates the estimated number of OTUs.
(h)
denotes the number of OTUs containing i sequences. Srare indicates the number of OTUs containing “abund” entries or less than “abund.” Sabund = number of OTUs with more than “abund” entries. abund indicates the threshold value of the “dominant” OTU, the default is 10.
SPSS 22.0 data analysis software was used for analysis, and Prism was used to make box charts.
A total of 186 fish were collected through gillnets, with a total biomass of 10,809.83 g, belonging to 6 orders, 19 families and 24 genera, with 28 species (Table 1), all of which are in the order of the Clupeiformes, which were the most numerically dominant at the order level, with 43.5% of the total catch in 2 families, 3 genera and 4 species (indicating percentages of numbers, the same as that below). The next largest group was the Perciformes, with 11 families, 15 genera and 18 species, accounting for 36% of the caught species. Once again, the Scorpaeniformes were divided into 1 family, 1 genus and 1 species, accounting for 15.1%. At the bottom was the Anguilliformes at 2.6%, the Tetraodontiformes at 1.6% and the Siluriformes at 1.0%, respectively. The Engraulidae accounted for 39.2% of the total catch at the family level, followed by the Sciaenidae (20.4%) and Sebastidae (15.0%), with the rest of the families accounting for less than 5%.
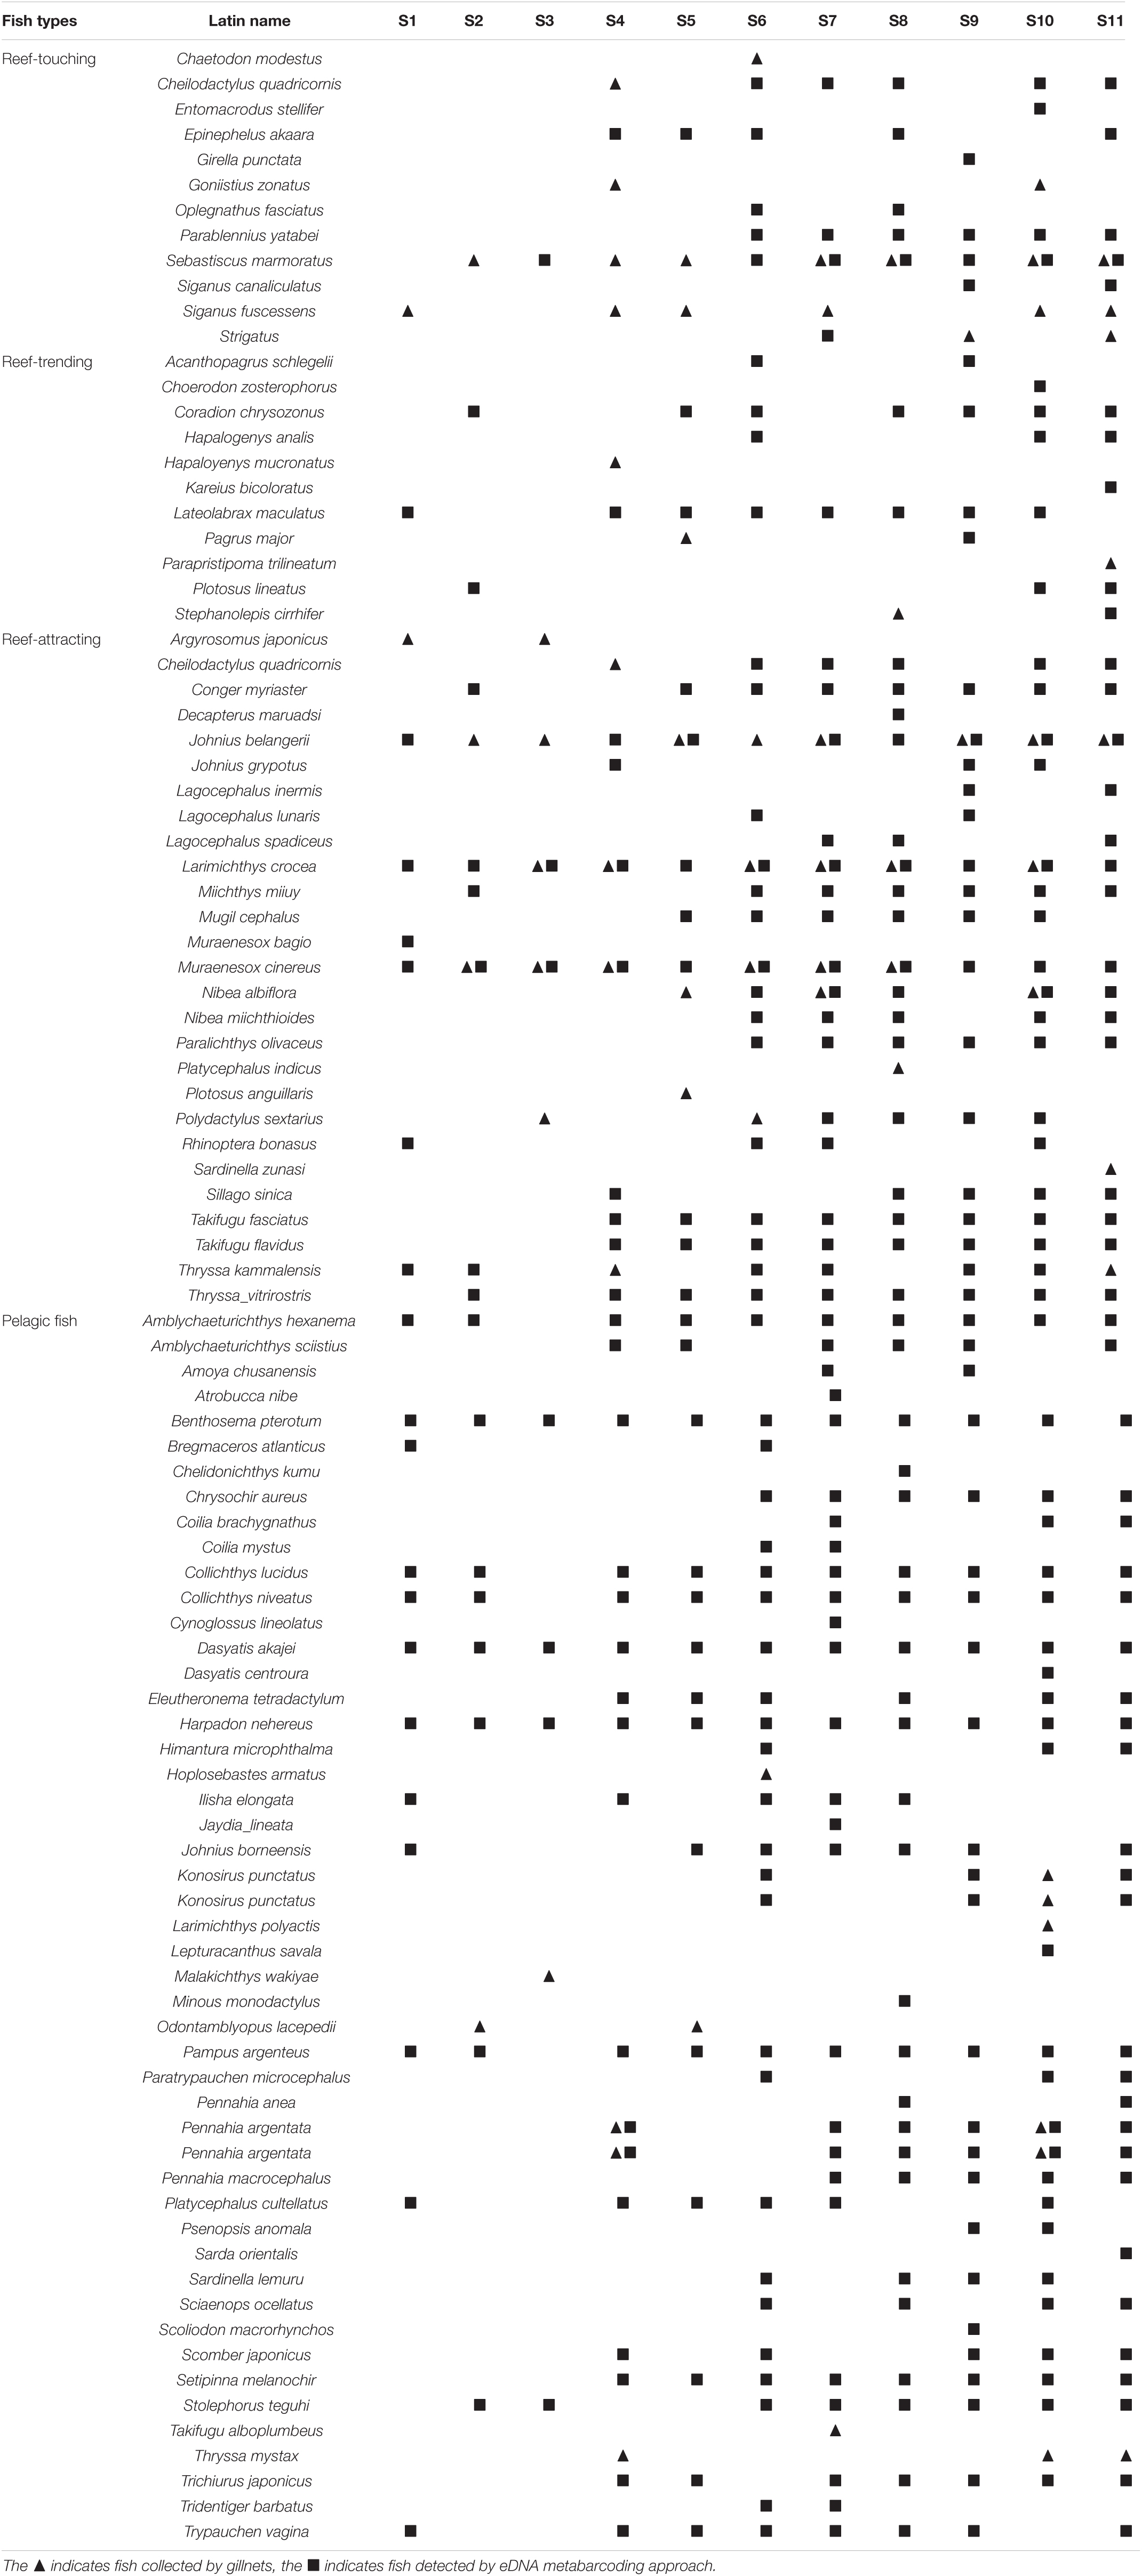
Table 1. Fish species statistics of the study sites.
A total of 81 species of fish were detected by eDNA, of which 76 species of the Spoked Finiformes belonged to 12 orders, 43 families and 64 genera, accounting for 93.8% of the total number of species, which is overwhelmingly dominant in the taxonomy (Table 1). At the order level, similar to the gillnet statistics, the Perciformes accounted for 56.7% of the total number of species, with 45 species in 40 genera and 23 families, the Clupeiformes accounted for 11.1%, with 9 species in 7 genera and 3 families, and the Tetraodontiformes accounted for 7.4%, with 6 species in 3 families and 3 genera. The Pleuronectiforme, Scorpaeniformes and Anguilliformes all accounted for 3.7%, with the former two belonging to 3 families, 3 genera and 3 species, and the latter to 2 families, 2 genera and 3 species. At the family level, the Sciaenidae, as the dominant family, accounted for 18.5% of all species, followed by the Engraulidae at 7.4%, the Gobiidae at 6.1%, the Tetraodontidae at 4.9% and the Dasyatidae at 3.7%. The Trichiuridae, Sparidae, Kyphosidae, Clupeidae, Muraenesocidae, Polynemidae, and Blenniidae were tied in sixth place, accounting for 2.4% of all species. There are 5 cartilaginous fishes in 3 orders, 3 families and 3 genera, accounting for 6.1%. The Myliobatiformes accounted for 40% of the total number of chondrichthyans and the Myliobatiformes and Carcharhiniformes accounted for 20%.
A total of 96 species of fish were counted by both gillnets and eDNA, with the number of points by station shown in Figure 2. The minimum number of species collected in the gillnet was 2 for sites S1 and S9, and the maximum number of species was 10 for site S4. The highest number of fish species detected by eDNA was 55 species each at sites S10 and S11, and the lowest was 11 species at site S3, with more than half of the total number of species at sites S6–S11. The statistics showed that 12 of the same species were counted both ways, with Johnius belangerii and Muraenesox cinereus being detected at 6 locations. In addition to the species commonly found in local waters, five species of fish that have not been recorded in China were also detected (Table 2).
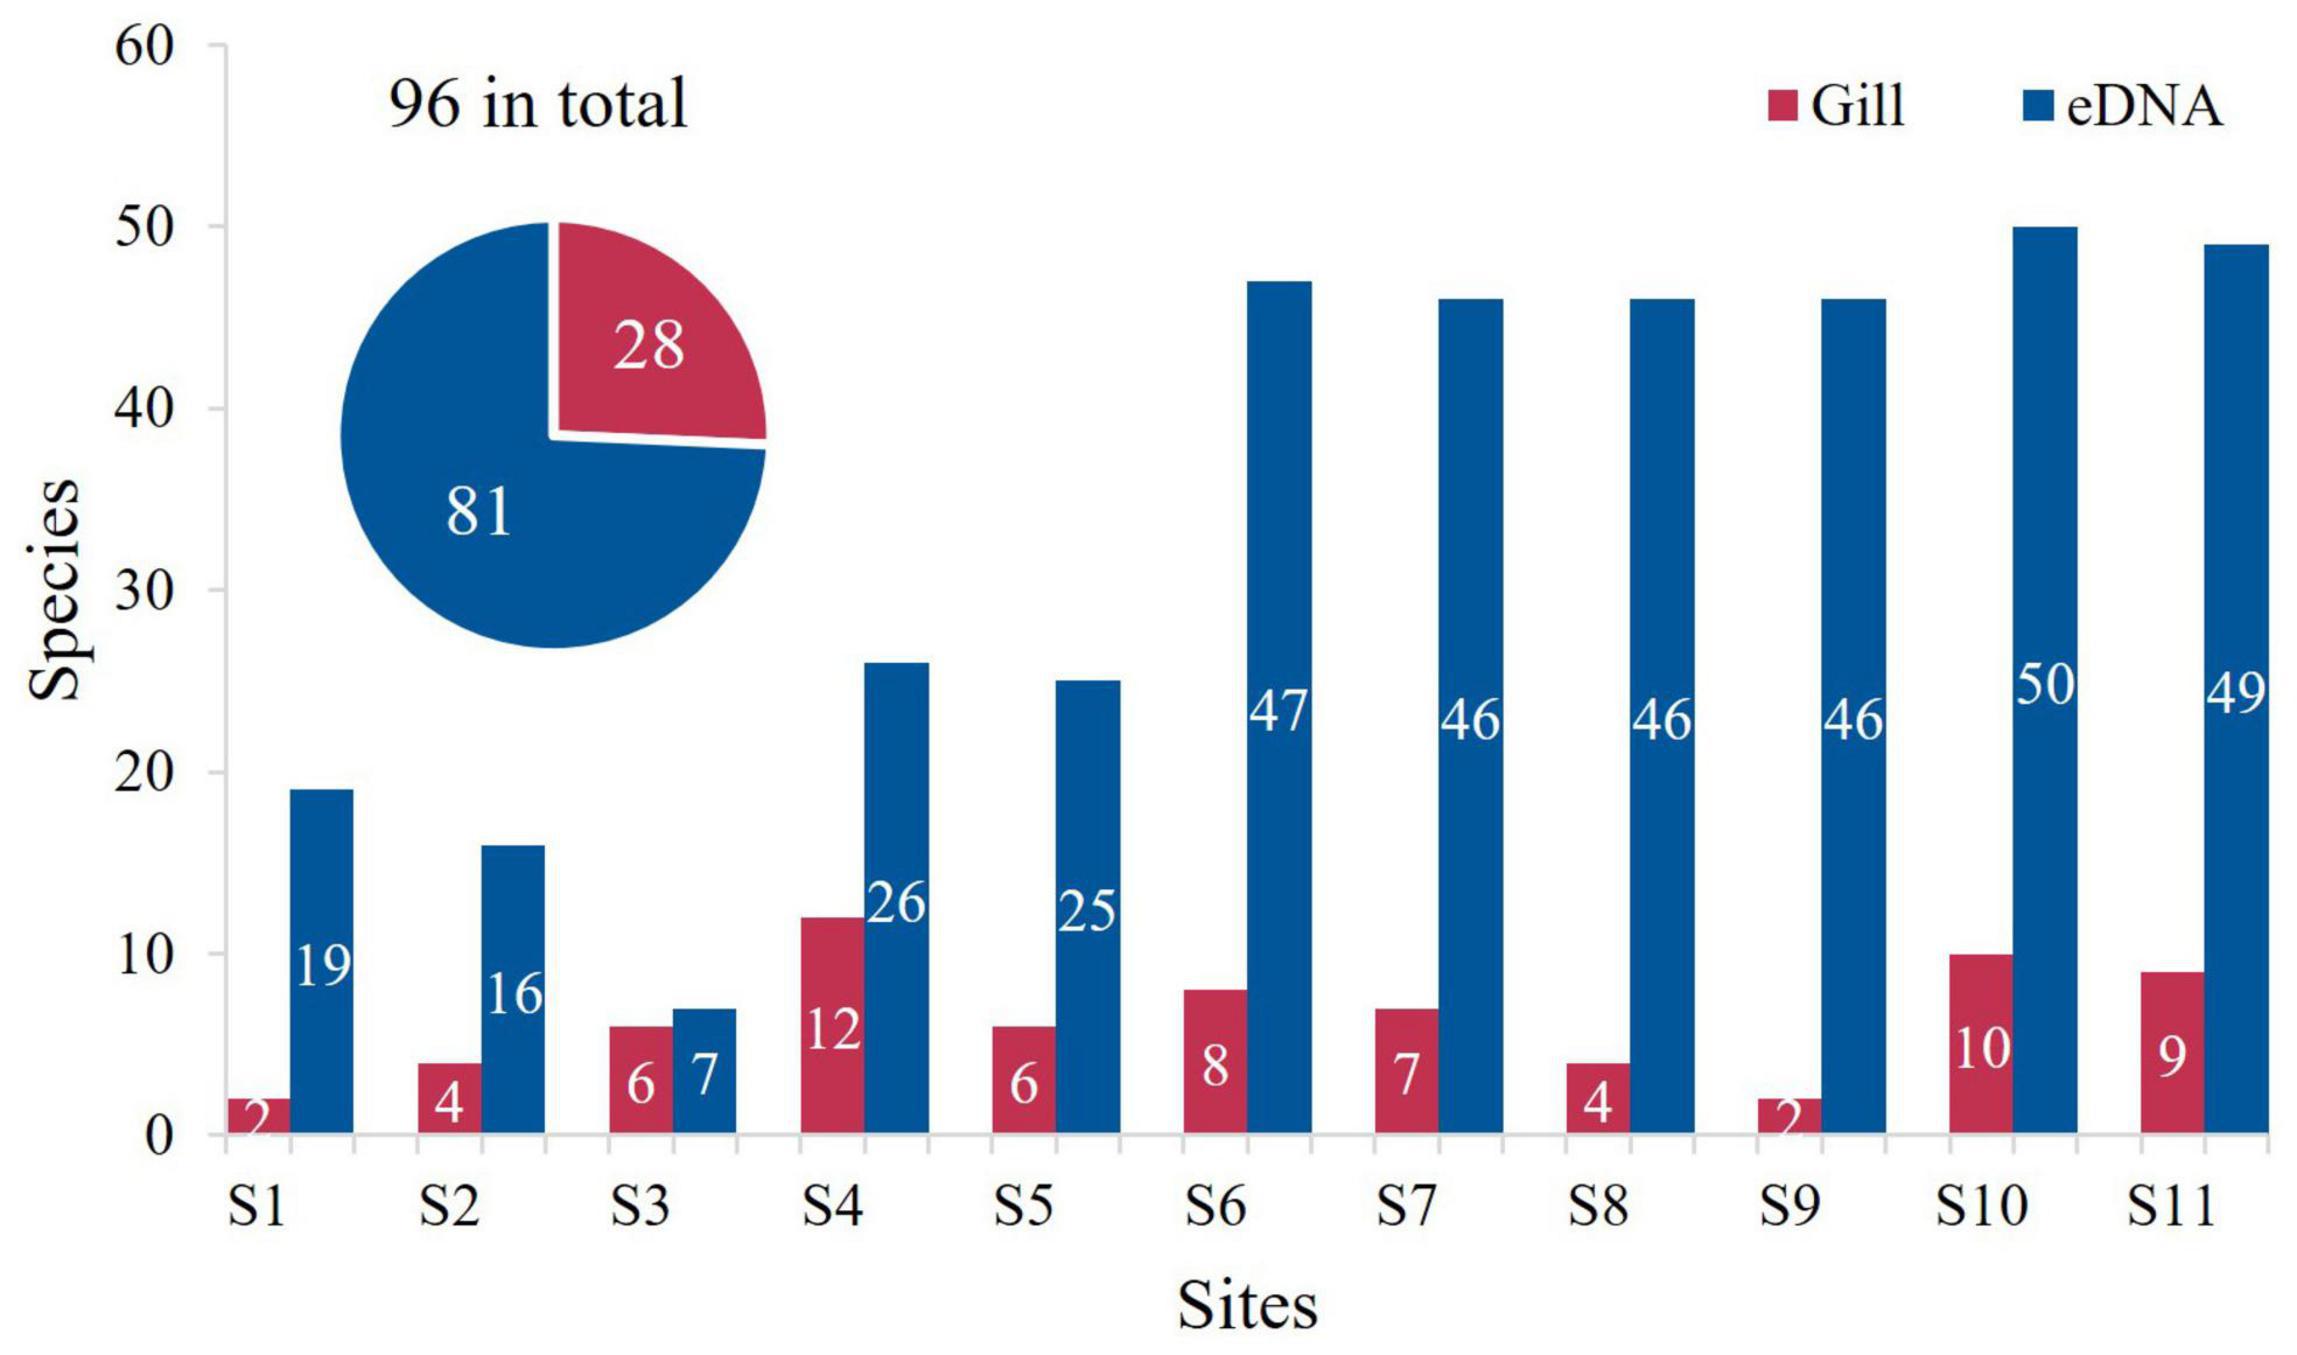
Figure 2. The number of fish species at each site. The pie chart shows the number of fish species counted in two ways.
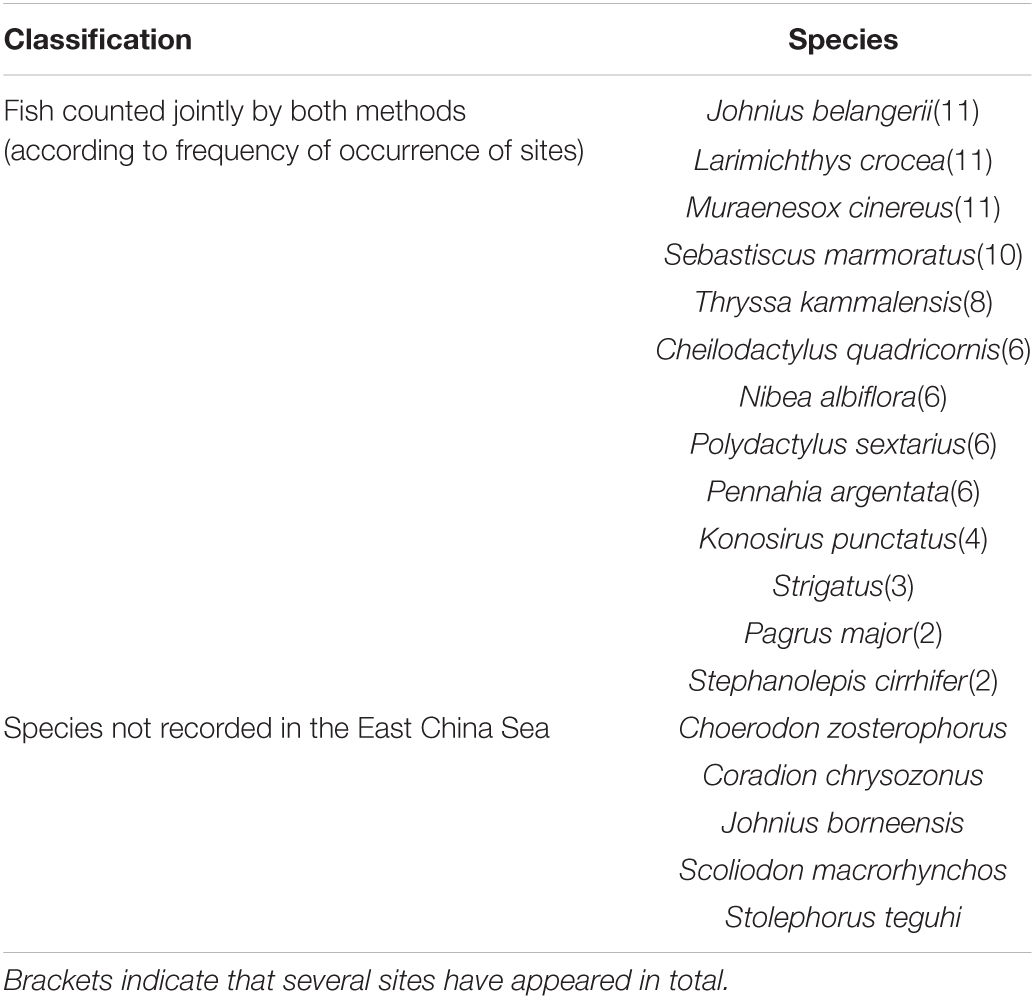
Table 2. Common fishes counted by gillnets and eDNA, and species that have not appeared in the East China Sea detected by eDNA.
Of the 96 fish species, 12 were reef-touching, 6 were collected by gillnetting, 9 were detected by eDNA and 3 were counted by both methods, with Sebastiscus marmoratus being the most frequently occurring species (Table 1). There were 9 reef-trending species, 2 species collected in gillnets and 7 species detected by eDNA, with Lateolabrax maculatus being the most frequently detected species by eDNA. There were 27 reef-attracting species, with 11 collected by gillnet and 23 detected by eDNA, the Johnius belangerii, Larimichthys crocea, and Muraenesox cinereus being the most frequently occurring species counted in both ways (Table 1). There were 49 distant reef species, 10 species collected by gillnets and 43 species detected by eDNA. The Benthosema pterotum, Dasyatis akajei and Harpadon nehereus were the most frequently occurring species detected. The results from each site showed that 8 sites had more reef-touching species than reef-trending species, but all had fewer reef-attracting and pelagic fish species (Table 1). Overall, reef-attracting species were the most species collected through gillnets, followed by pelagic fish species, then reef-touching species, and finally reef-loving species. The pelagic fish species were the most species collected by eDNA, followed by the reef-attracting species, then the equally diverse reef-attracting and reef-loving species. In terms of the substrate characteristics of their habitats, the number of fish species preferring sandy and muddy habitats reached half, both by gillnetting and eDNA testing.
According to the fish inhabiting water layer, we made statistics based on the fish collected by gillnets and eDNA technology (Figure 3). The results showed that there was more groundfish than near groundfish and near-surface fish at S2 and S8 stations among fish collected by gillnets. No groundfish was collected at sites S1 and S9. The number of groundfish and near groundfish is equal at S3, S5, S6 and S7 stations. Near groundfish fish dominated at S4 and S10 stations, while near-surface fish dominated at S11 stations.
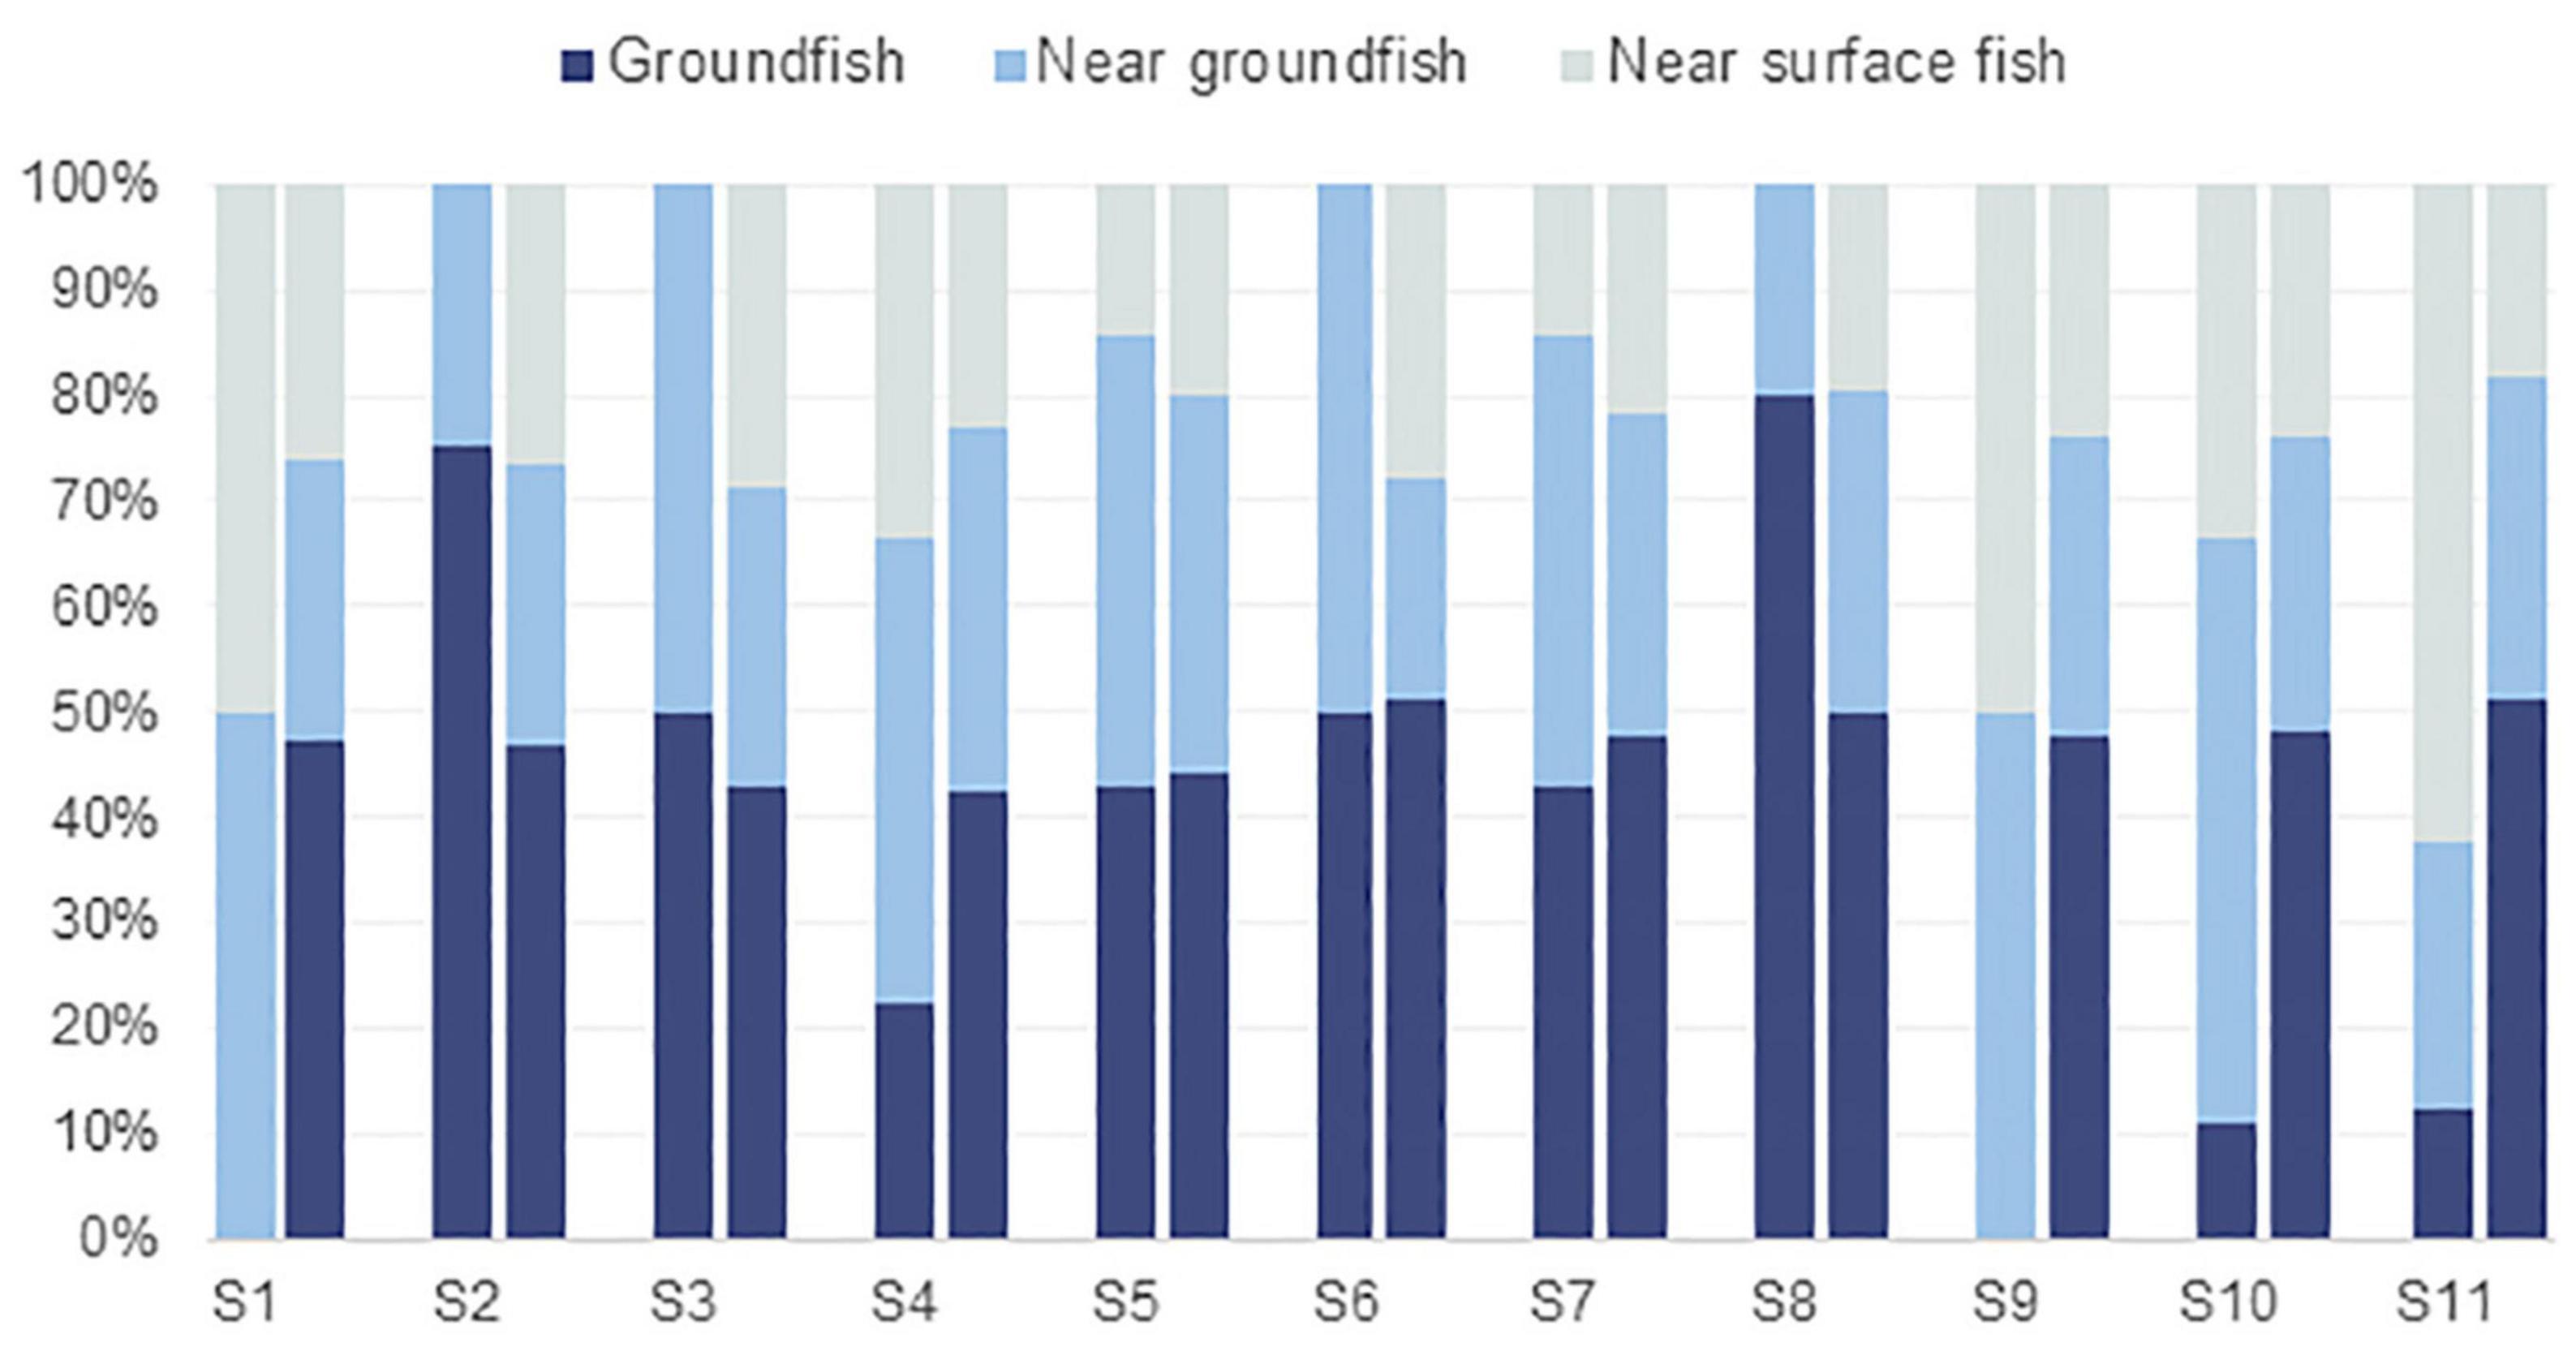
Figure 3. Percentage of fish populations in different water layers at each site. Among the two columns at each site, the left represents fish counted by gillnets, and the right represents fish detected by eDNA.
A total of 28 species were collected through the gillnets, with 4 near-surface species, 18 near groundfish and 6 groundfish. Eighty-one fish species were detected by eDNA, with 17 near-surface species, 42 near groundfish and 22 groundfish. In the process of ranking the frequency of the occurrence of the dominant fish species in each stratum counted, the Thryssa mystax, Johnius belangerii and Sebastiscus marmoratus were found to be the near-surface fish, near-groundfish and groundfish in the gillnet collection, occurring at stations 3, 8, and 7, respectively. The Thryssa vitrirostris, Benthosema pterotum, Harpadon nehereus and Dasyatis akajei were the near-surface fish, near groundfish and groundfish detected by eDNA at 9 sites, 11 sites and 11 sites, respectively. In addition to this, the gillnets statistics showed that Siganus fuscessens and Larimichthys crocea tended to be more abundant near the ground and the Muraenesox cinereus was more abundant at the bottom. The results of the eDNA metabarcoding showed that the Stolephorus teguhi, Coradion chrysozonus and Lateolabrax maculatus were more abundant in the near-surface layer, with the Collichthys lucidus, Collichthys niveatus, Larimichthys crocea and Pampus argenteus being more abundant near the ground and the Amblychaeturichthys hexanema and Muraenesox cinereus more abundant at the ground.
Diversity indices for gillnet statistics are expressed as Shannon’s diversity index, Simpson’s diversity index, Margalef’s richness index and Pielou’s evenness index. The eDNA statistics are expressed as Shannon’s diversity index, Simpson’s diversity index, Chao1’s, and Ace’s. The Shannon diversity index combines the evenness and richness of the population with higher values corresponding to higher diversity in the community, and the Simpson diversity index is the opposite. The higher the Chao1 index the more species are present in the community (Figure 4).
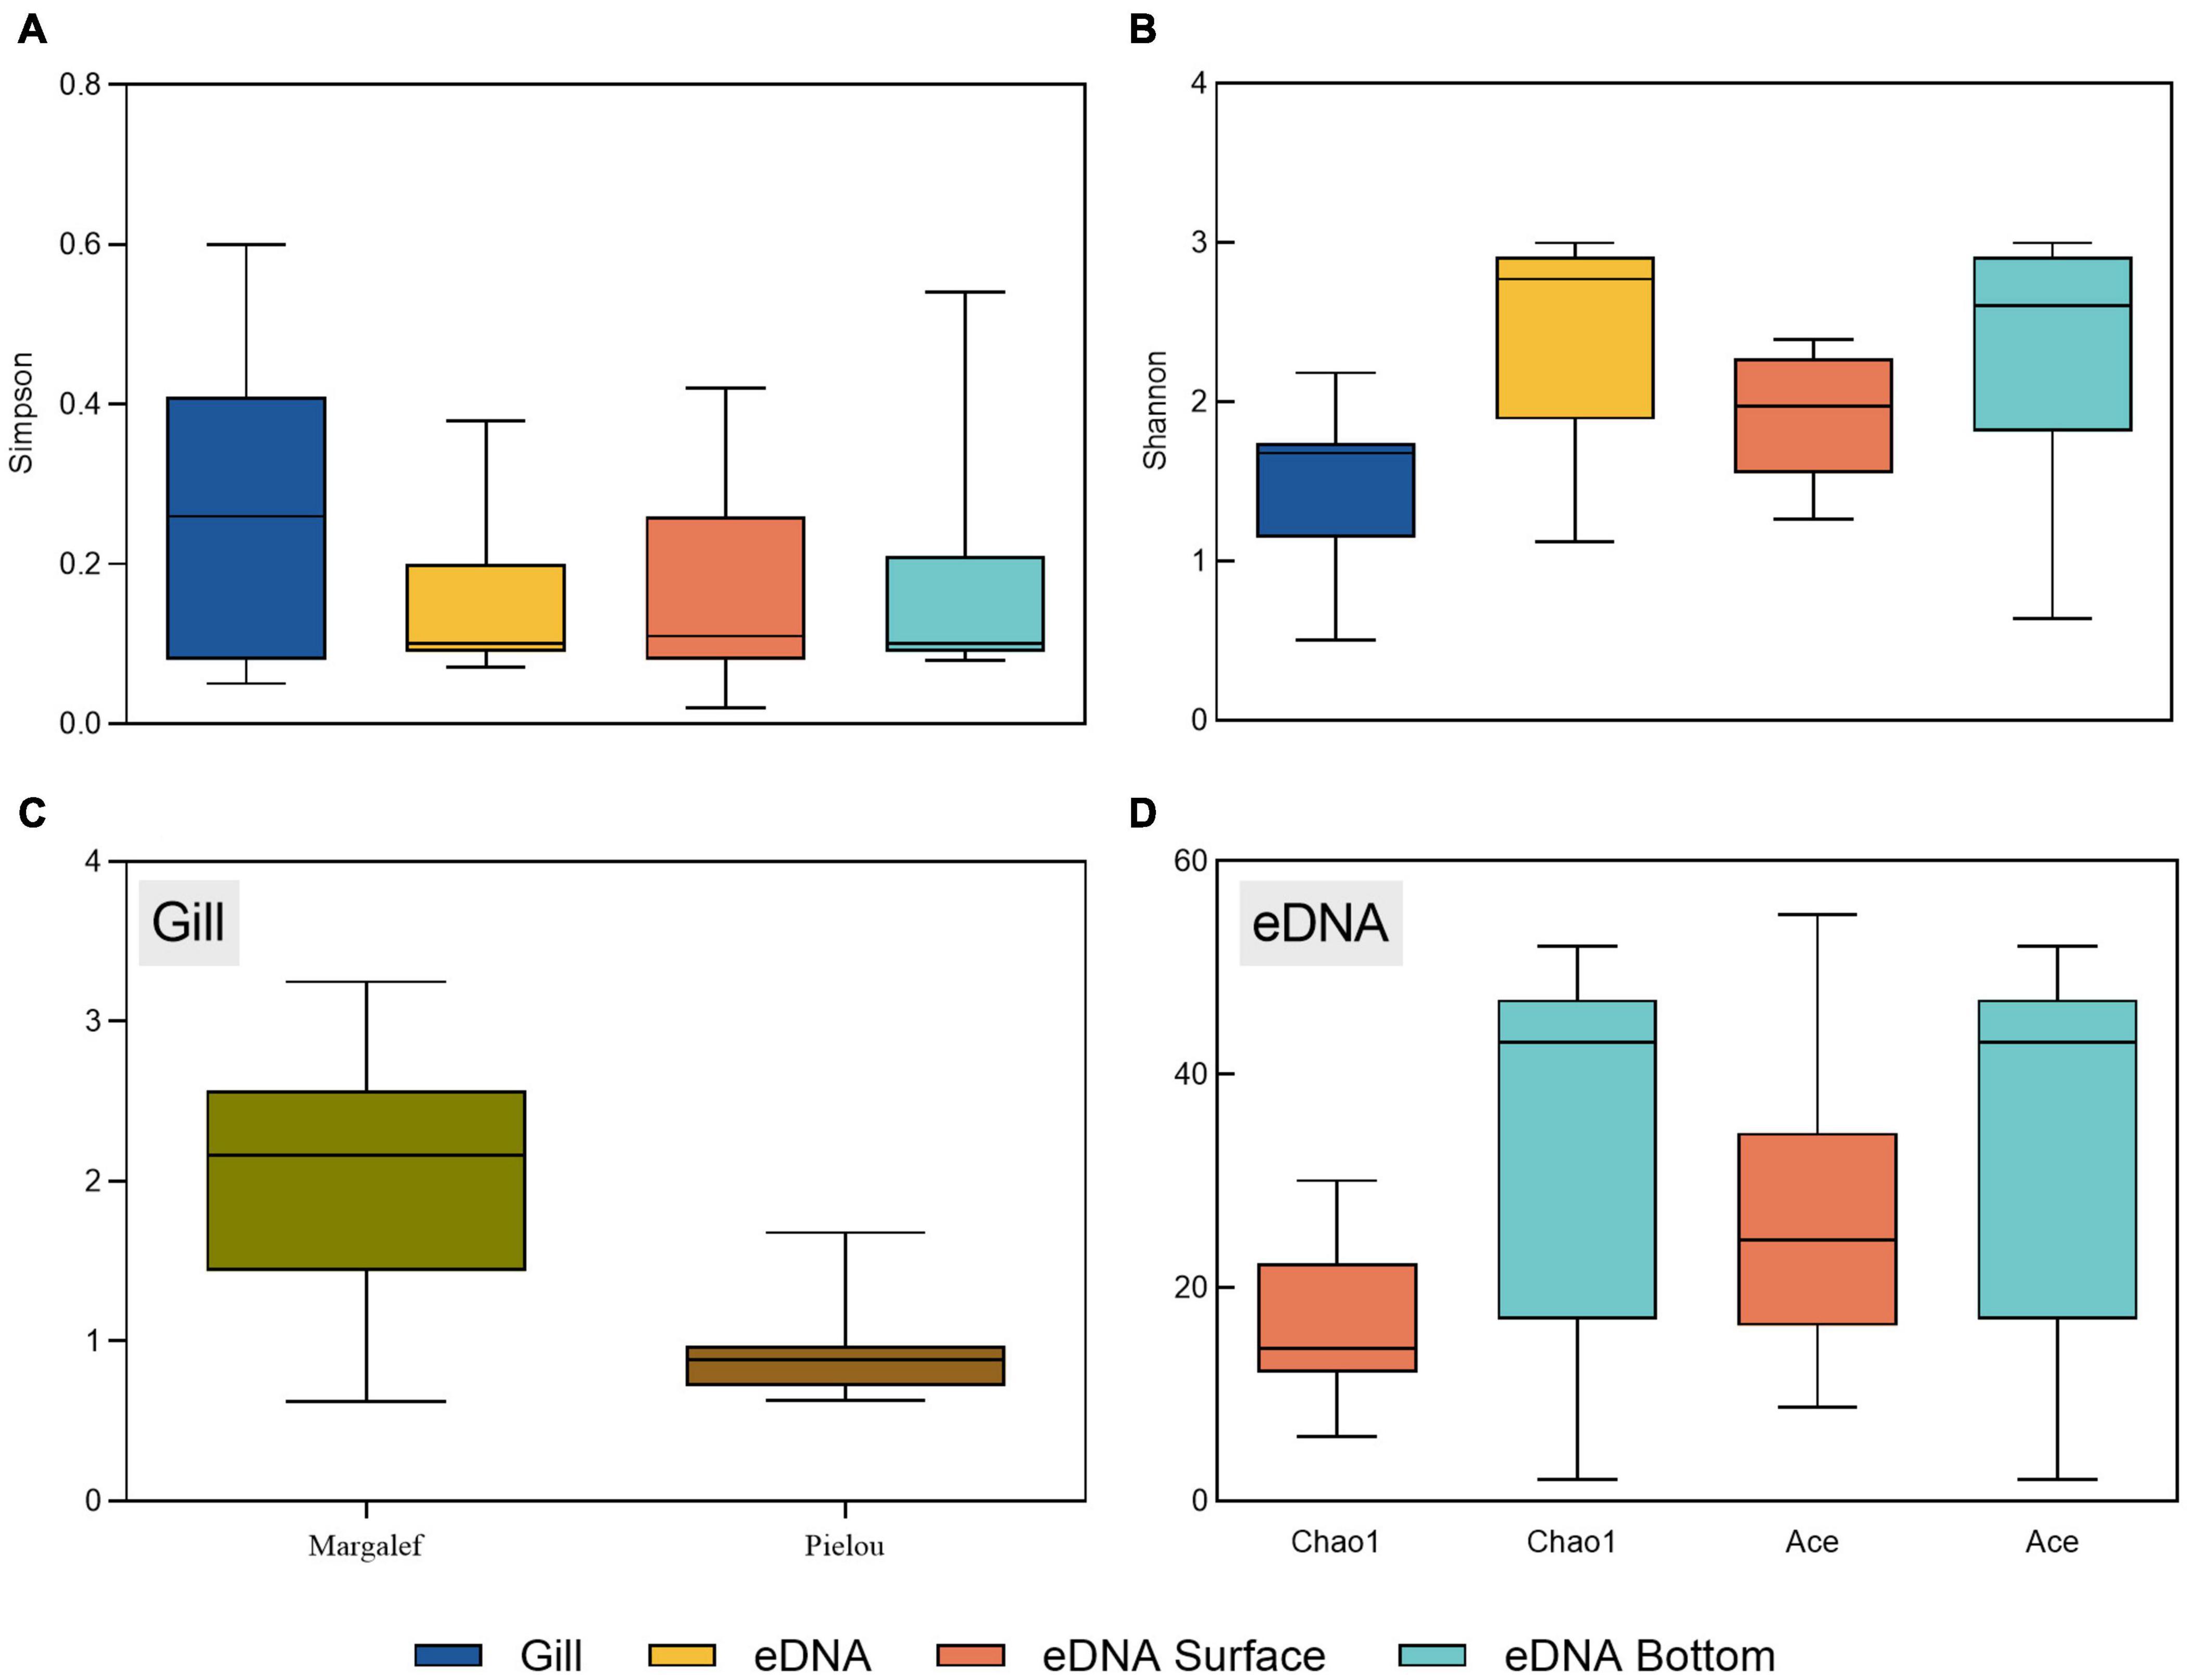
Figure 4. Box plots of diversity indices for each site using gillnets and eDNA metabarcoding—(A,B) shows the Shannon diversity index and Simpson diversity index which includes surface and bottom water layers detected by eDNA, (C) shows the Margalef diversity index and Pielou diversity index calculated by gillnets and (D) shows the Chao1 diversity index and the Ace diversity index calculated by eDNA metabarcoding.
The distribution trends of the Shannon diversity index and the Simpson diversity index obtained in both ways were generally consistent. The spiny web statistics showed that the Shannon diversity index ranged from 0.50 to 2.18. The highest index site was S10, the lowest was S1 and S9, and 6 sites had above-average diversity indices. The Simpson’s diversity index ranged from 0.05 to 0.60, with sites S1 and S9 having the highest indices, site S5 having the lowest and 5 sites were above the mean. The Margalef richness index ranged from 0.62 to 3.25, with site S10 having the highest index, sites S1 and S9 having the lowest index and 6 sites were above the mean. The Pielou evenness index ranged from 0.63 to 0.98, with site S5 having the highest index, site S6 having the lowest index and 4 sites were above the mean.
In contrast, the alpha diversity index shown by eDNA high-throughput sequencing results showed a range of 1.12–3.00 for the overall Shannon diversity index at each site. The S7 site had the highest index, S3 had the lowest index and 6 sites were above the mean. The surface range is 1.26–2.39, with the highest index at site S10 and the lowest index at site S8. The bottom range is 0.64–3.00, with site S7 having the highest index and site S3 having the lowest index. The overall Simpson diversity index for each site ranged from 0.07 to 0.38, with site S3 having the highest index, site S5 having the lowest index and 4 sites having indices above the mean. The surface range is 0.02–0.42, with site S8 the highest and site S7 the lowest. The bottom layer ranged from 0.08 to 0.54, with site S3 the highest and sites S5 and S7 the lowest. High throughput sequencing of all samples showed that Chao1 indices ranged from 2 to 52, with the highest S9 site index of 30 and the lowest S1 site index of 6 in the surface samples, and the highest S10 site index of 52 and the lowest S3 site index of 2 in the bottom samples. Ace indices ranged from 2 to 55, with the highest S7 site index of 55 and the lowest S1 site index of 8.75 in the surface samples, and the highest S10 site index of 52 and the lowest S3 site index of 2 in the bottom pieces, with the two indices following the same trend.
The analysis of environmental factors showed that factors other than the water flow had little effect on the method (Figure 5). Therefore, we deeply analyzed the relationship between the flow rate of water bodies and the monitoring results (Table 3). The data showed that the bottom values of the Shannon diversity index were higher than the surface values at all sites except sites S2 and S3. The number of fish species detected in the bottom samples at several sites S5–S10 exceeded 40 species and sites S1 and S2 were below 10. Of the surface samples, site S9 yielded the highest number of species detected at 18, with S1, S2, S8, S10, and S11 all under 10 species.
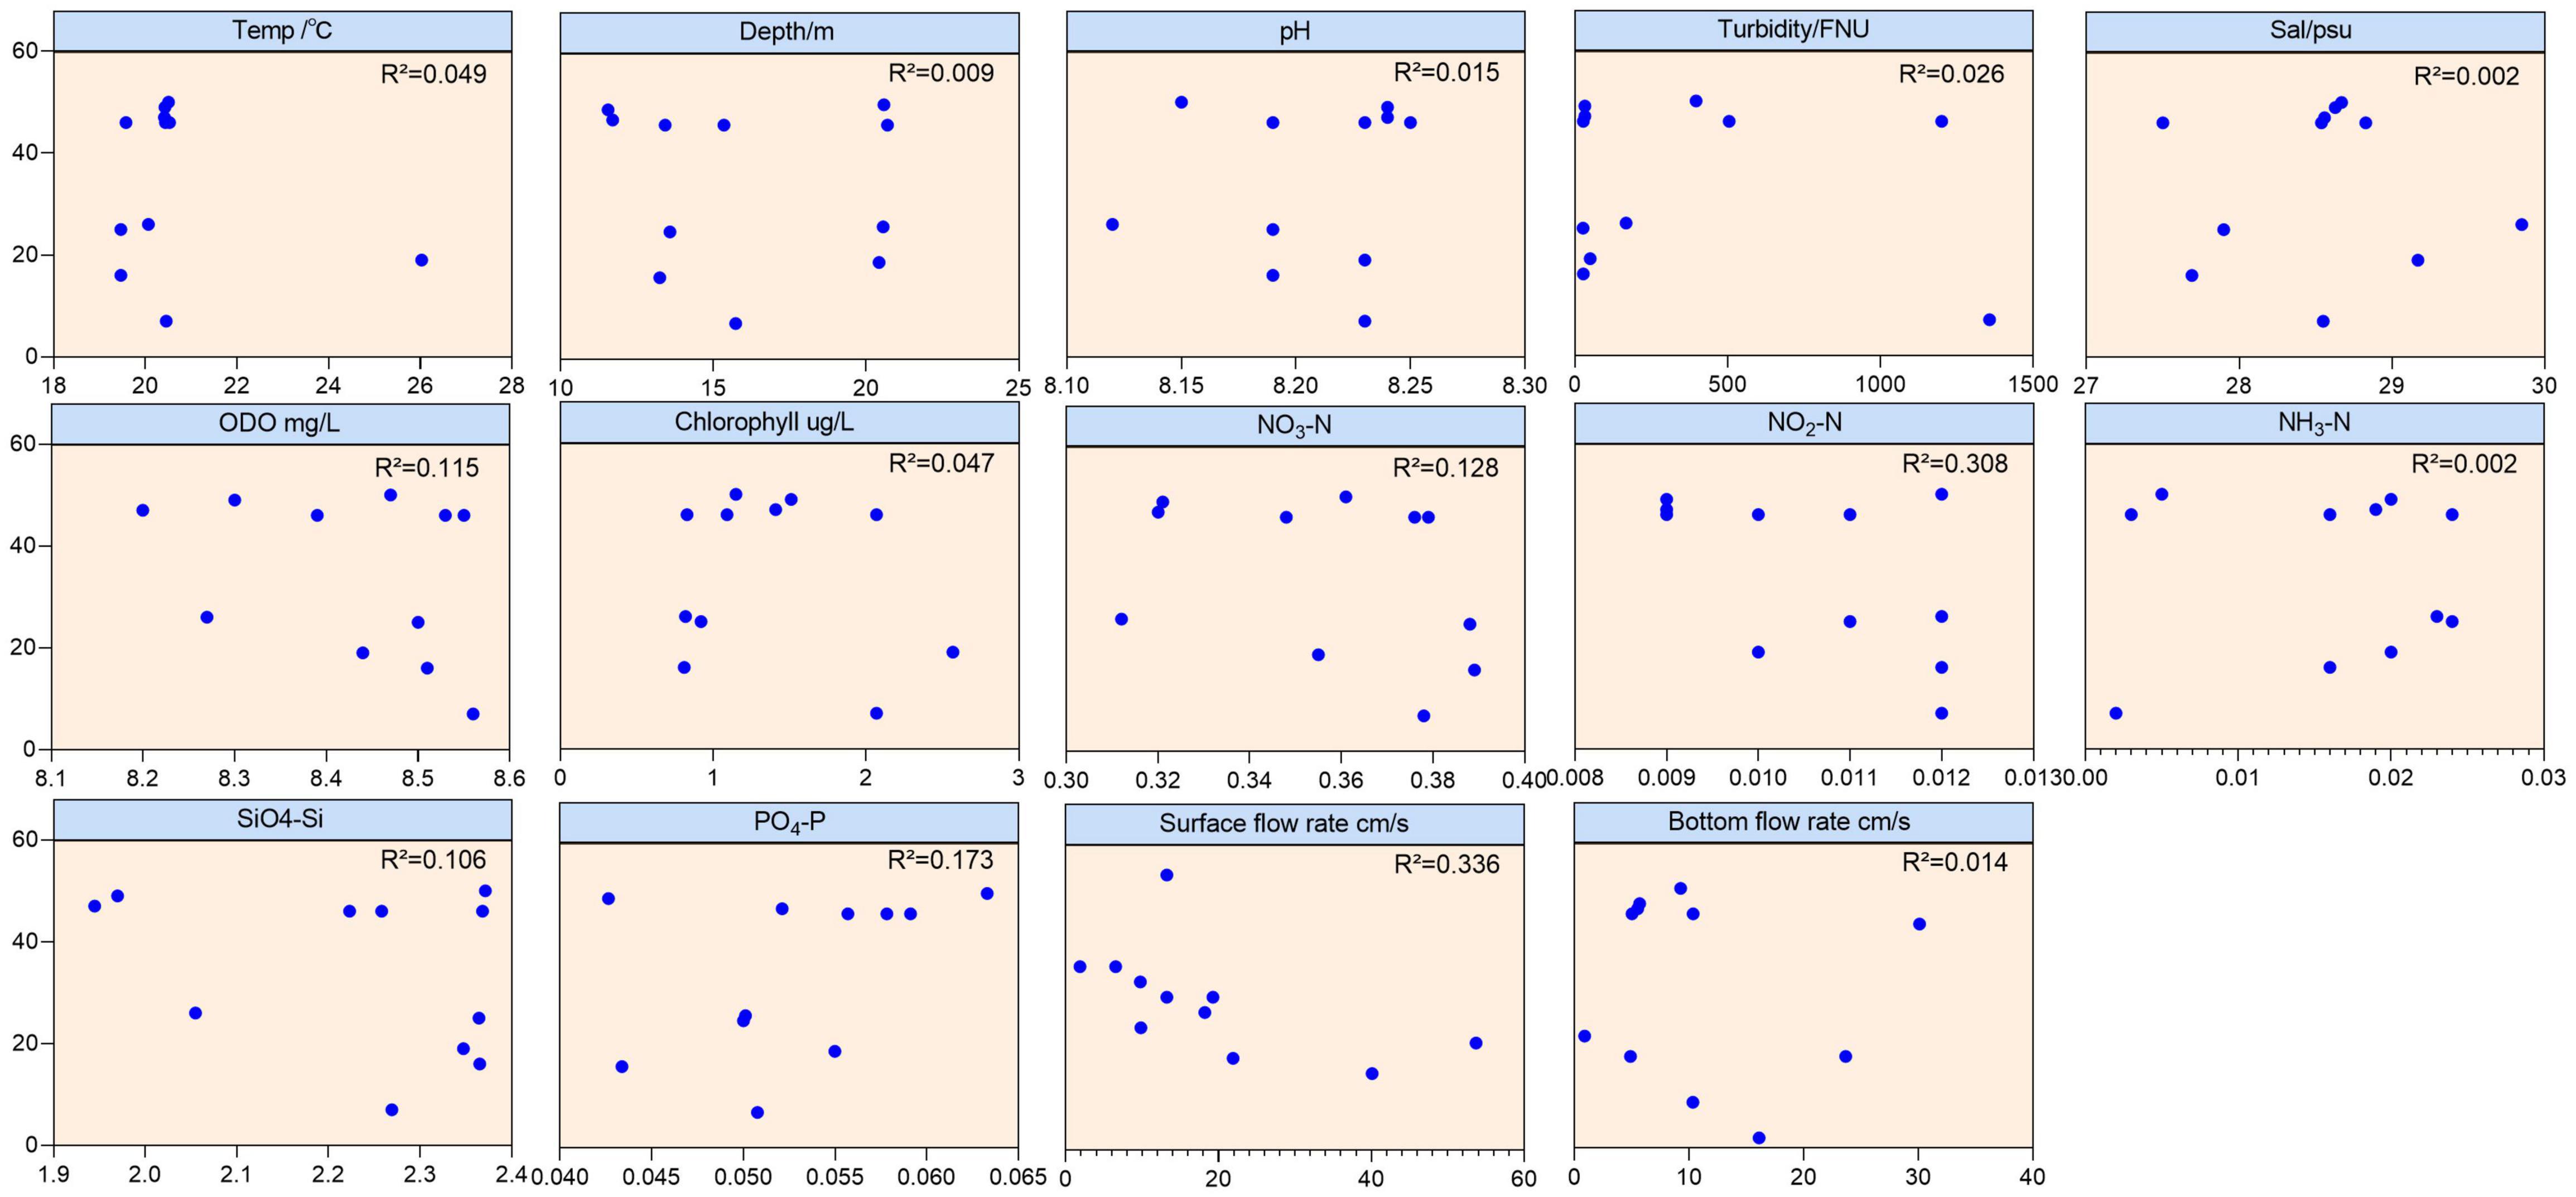
Figure 5. Correlation graph between each environmental factor and the number of fish species detected by eDNA.
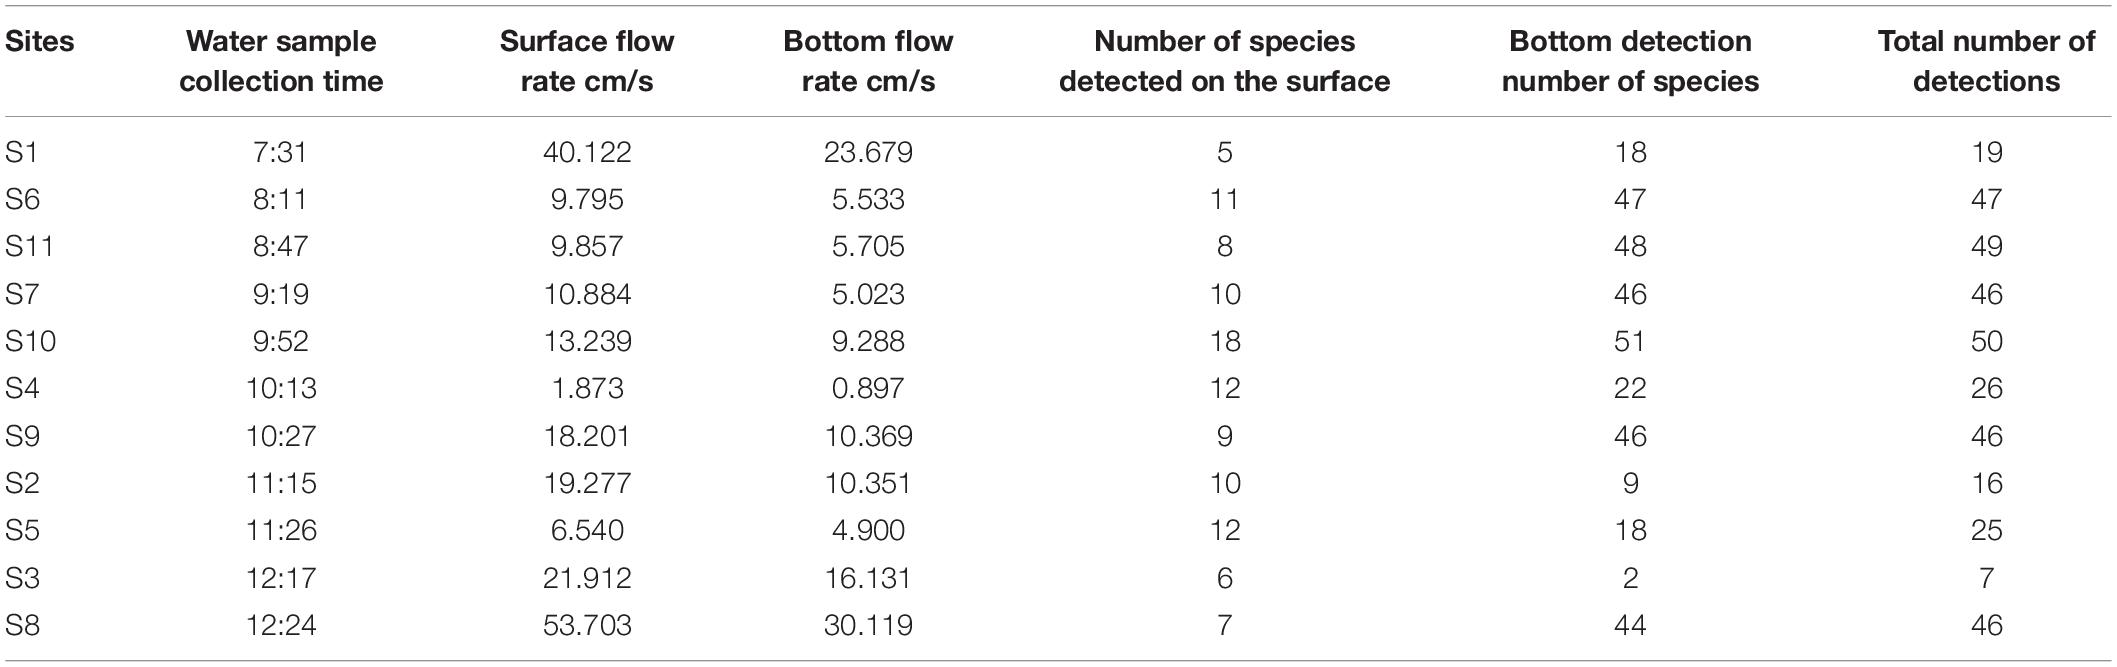
Table 3. Surface and bottom flow rates and fish species detected by eDNA at the time of water harvesting at each site.
The two methods, gillnetting and eDNA high-throughput sequencing, yielded significantly different results in fish species composition. According to the survey data of Liang et al. (2019) and Han et al. (2020), the gillnets collected in this study were indeed species found in the local waters in that season. In addition, dominant species not collected such as Chrysochir aureus, Harpodon nehereus, and Collichthys lucidus were also recorded to be active in the area, which was confirmed by the results of our survey of open waters away from the islands and reefs using crab cages and trawls in the same period—see Supplementary Table 2 for the results. The results of the eDNA test showed that 68 species were not collected by gillnets, including the above species that were active in the sea but not collected by gillnets. We also conducted fish collection experiments in November 2019 by gillnetting, ground cages, and longline fishing, where 16, 2, and 8 species of fish were collected by the 3 gears, for a total of 20 species. Thirteen of these species were consistent with the 2020 gillnet collection and 11 were consistent with the eDNA test results. This experiment collected the leader fish by gillnets, which verified the accuracy of the eDNA. Meanwhile, 5 fish species were detected that have not been recorded in the East China Sea: Choerodon zosterophorus (Wang et al., 2015), Coradion chrysozonus (Zuo, 2011), Johnius borneensis (Kar et al., 2017), Scoliodon macrorhynchos (Liu et al., 2020), and Stolephorus teguhi (Kimura et al., 2009). The above results may be due to three reasons: firstly, the essential differences between the two sampling methods lead to different results. The actual operation of multi-mesh gillnets can obtain visual information on fish species but, due to the selectivity of the nets themselves, the spatial constraints of sampling, environmental factors (e.g., water depth, transparency and season) and the size, behavior and physiological characteristics of the fish, means that other species inhabiting the local area are inevitably missed. In contrast, eDNA is detected only through the collection of seawater. The seawater’s horizontal and upward flow characteristics lead to eDNA migration, which may bring fish DNA information from distant open waters (Takahara et al., 2012; Mauvisseau et al., 2017). After upwelling, mixing surface and bottom layers are also more likely to enrich fish DNA from different water layers. It has been shown that flowing water may lead to concentrations of eDNA within hundreds of meters independent of the presence of local species, but further identification by additional means is also needed in practical studies (Tillotson et al., 2018). Secondly is the influence of the fish organism’s factors and environmental factors. As fish are swimmers, they can swim freely in the water overcoming the resistance of the current and there are also the seasonal and reproductive migrations; individuals vary in size so the probability of being trapped by the mesh of a gillnet will vary. In contrast, DNA information from certain migratory fish shed in the water may happen to be collected during the collection of water samples but the fish may not actually be in the vicinity for long periods and therefore not collected by the gillnets. Thirdly, the influence of primers used during eDNA detection causes differences in comparison databases. For example, species from the South China Sea and the Indian and Pacific Oceans were detected in this study. The first reason for this is presumed to be inaccurate identification results due to insufficient primer precision or PCR amplification preferences (Liu et al., 2016). The second reason may be due to the existence of closely related homologues or species taxonomic redundancy in the region. The third reason may be related to warming currents in Taiwan or global warming. Previous surveys of fish diversity in rocky reef habitats on the Saddleback Islands also identified several unlisted fish species (Wang et al., 2013).
In terms of numbers and ecotypes of fish, 186 fish were collected by gillnets, mostly reef-attracting species inhabiting sandy mud substrate habitats. The number of fish OTUs detected by eDNA high-throughput sequencing was generally below 50, with low overall abundance and mostly pelagic fish species preferring sandy mud substrates. Both methods yielded more than half of the total number of fish species counted near the ground, followed by groundfish and the fewest near-surface fish. Analytically, as gillnetting is an actual physical operation and eDNA testing is a biological tool, the two are bound to result in differences in the exact number of fish visualized, but the generally low number of fish OTUs obtained from eDNA testing may be due to several reasons. Firstly, the biomass of the fish population and the amount of DNA it releases through excretion processes can significantly affect detection abundance. The eDNA concentration has been shown to be positively correlated with actual biomass by Takahara et al. (2012) and Mauvisseau et al. (2017). Secondly, environmental factors such as currents, tides, wind and salinity can affect the degradation rate and persistence of eDNA in seawater (Thomsen et al., 2012; Barnes et al., 2014), which can lead to variations in DNA concentrations in the collected water samples and thus affect quantitative analysis results. Thirdly, the actual location of sampling and different sampling times may also cause fluctuations in eDNA. Due to the random nature of fish movement and human sampling, areas rich in fish DNA may be missed. Sampling at different times of the year can also affect eDNA concentrations due to fish swimming times and factors such as waves and currents. The overall trend in the number of fish counted in different habitat layers was consistent between the two approaches. This is probably because the multi-mesh gillnets are used to capture fish by fits, stinging and entanglement (Wang et al., 2013) combined with the location of the drop underwater, and therefore are more likely to collect near-bottom fish. In contrast, the water samples tested by eDNA may be mixed up and down by wave impact, so species from other water layers can also be detected at different collection locations. In the present study, Thrissa kammlensis, which prefer to inhabit the pelagic zone, were detected in bottom water samples from sites S1, S2, S6, S7, S9, and S10. The groundfish Dasyatis akajei were also detected in surface water samples from sites other than S6 and S8. Therefore, further refinement and full consideration of environmental influences are needed to detect species in different water layers using eDNA.
In addition to the apparent differences between the results of the two approaches in terms of fish species composition, the box plot shows that the diversity of fish species obtained by eDNA detection is generally higher than that collected by gillnets, as can be seen by comparing the diversity index values for all of the sites. The Shannon diversity index, for example, was 2.48 for the whole study area obtained by gillnet sampling, with the highest index of 2.18 for site S10 and the lowest index of 0.5 for sites S1 and S9. Several sites were near reefs, but the opening of an ecotourism area near site S10 and many of the reefs has led to a gradual increase in fish abundance. Six reef-touching species, 5 reef-trending species and 18 reef-attracting species were counted using two sampling methods. Among the 11 stations, the diversity indices of S3, S4, S5, S7, S10 and S11 were above the overall mean value, and several stations were mainly distributed around the lower Dachen Islands, probably due to the more transparent water quality in this area compared to the northern Jiaojiang estuary area. The overall diversity of the 8 sites was consistent with the bottom value. Three sites were not significantly different, so it can be assumed that the variety of fish in the bottom waters of the area largely determined the diversity of fish at the same vertical spatial scale. The Shannon diversity index value for the whole study area obtained by the eDNA technique was 3.03, with the highest overall diversity of 3.00 for site S7 and the lowest overall diversity of 1.12 for site S3, which was higher than the lowest index obtained with the gillnet statistics, but the overall diversity of sites S5, S6, S7, S9, S10 and S11 were all higher than that of the whole study area by the gillnet statistics. The majority of these sites were also centered on the Xia Dachen Islands, with nearly 67% of the sites agreeing with the gillnet statistics. The amount of OTU abundance of fish species can be represented by the Chao1 and Ace indices. The two characteristic index trends of 2–52 and 2–55 in the results are generally consistent, but there are considerable differences between individual samples. This may be due to the effect of individual samples (S3 surface layer) on the whole, presumably related to the quality of eDNA and sampling site differences in the marine samples.
As can be seen, the overall effect of the eDNA technique in detecting species diversity in rocky reef habitats was significantly higher than that of the multi-mesh gillnets, but there were also instances where the indices from the same site varied considerably. For example, the number of fish species collected by gillnetting at site S3 was 6, which is in the middle range of fish counts for all sites but was the lowest diversity index detected by the eDNA technique, most likely due to the effect of water velocity and is discussed below. Although there were site-specific differences, the overall range of diversity indices obtained by the two methods converged in terms of overall extent, suggesting the applicability of both sampling methods to the assessment of fish diversity in rocky reef habitats.
In addition to the differences in the number and composition of fish caused by the choice of survey methods, the physical characteristics of the reef habitat itself and the external environmental factors are important reasons for the richness of fish species diversity. Firstly, in terms of the physical parts of the reef itself, island rocks can provide suitable substrates for fish to attach to and serve as important habitats for them to roost, grow, breed and avoid enemies. This has attracted some reef-tending fishes such as Sebastiscus marmoratus to become sedentary species in rocky reef habitats and migratory fish like Siganus fuscessens and Muraenesox cinereus have made seasonal use of the rocky reef waters (Wang and Wu, 2015; Zeng et al., 2016). Secondly, in terms of external environmental factors, the sea where the study area was located is subject to the actions of the coastal waters of Jiangsu and Zhejiang, the surface water and deep water of the warm Taiwan current, the mixed water of the Yellow Sea (Zhang and Wang, 2004) and the spatial and temporal variations of the hydrological elements are dramatic. The deepwater of the warm Taiwan current with its low temperatures and high salinity characteristics, when superimposed on the surface water of the current, will allow the mixing of sediment deposits and the transport of nutrient salts. It will promote the growth of phytoplankton or intertidal macroalgae, leading to an increase in phytoplankton or macroalgae feeding consumers, thus attracting more secondary consumers of fish (Guidetti, 2000; Zhang et al., 2019).
In general, the water samples collected from the bottom had higher community richness. This may be due to three factors; the first being that environmental factors such as substrate type, nutrition and the fish’s physiological habits have led to a greater preference for rocky and muddy habitats. Secondly, DNA sedimentation due to factors such as water exchange or DNA migration cannot be collected because the water flows too fast. Thirdly, the upward pulling process of the bottom water samples after collection may have mixed in the upper water column and may have collected DNA information from fish active in the upper water column. To address this phenomenon, this study used FVCOM to simulate the flow velocity of the water column at the time of sampling at each site and compared it with the high-throughput sequencing results (Supplementary Table 3), and found that the surface flow velocity reached 0.4 m/s at S1 and 0.5 m/s at S8 at the time of sampling, while the actual abundance of fish detected in the surface layer at these two sites was low, with 5 and 7 species, respectively.
Similarly, bottom water flow velocities in S1 reached 0.23 m/s and only 18 fish species were detected. Therefore, this study speculates that the number and abundance of fish species detected by eDNA may be related to the flow rate of the water column. Of course, as fish are migratory species, their DNA imprinting in the water column changes position as the water moves. When the water is flowing too fast, it may accelerate the rate of dilution of the DNA in the water, thus preventing the collection of water samples containing high levels of fish DNA.
This study also collected water samples at a randomly selected station in the open sea, far from the reef with a high-water flow rate. The eDNA high-throughput sequencing results showed no fish species. Of course, it cannot be ruled out whether this was due to the fish’s swimming range or other factors. We also conducted a simultaneous trawl and eDNA survey in this area and will further investigate the relationship between eDNA detection results and water flow rates.
The eDNA technology allows exploration of fish diversity in complex habitats, such as areas where trawling is inconvenient, which complements methods that have previously been used with traditional nets. However, some limitations should be borne in mind when interpreting these findings. Firstly, when conducting research, it is more robust to conduct repeat experiments at different dates and seasons. This study verified the usability of the method and continued to combine traditional means with eDNA technology in the later trawl fishery resource surveys. The influence of the complexity of the environment on the detection results of eDNA technology is also fully considered, to provide information to support the conservation of fish diversity. Secondly, eDNA technology may not be able to monitor the species living in the study area in sea areas with fast currents. However, at the same time, the transmission of currents also brings information on the DNA of species living in the oceans, which needs to be discussed in relation to the local historical accumulated fish data in a targeted manner. However, this also emphasizes the validation of the effect of water flow on eDNA in this paper. We will use this study as a basis to consider more biotic and abiotic effects in future experiments to better improve them.
The datasets presented in this study can be found in the NCBI BioProject database with the accession number of PRJNA808626.
YL: conceptualization, formal analysis, writing—original draft, and writing—review and editing. JL: funding acquisition. ZW: conceptualization, investigation, and writing—review and editing. SZ: conceptualization, writing—review and editing, and funding acquisition. KW: investigation. XL: software. All authors contributed to the article and approved the submitted version.
The study was supported by the National Key R&D Program of China (2019YFD0901303) and the Key Laboratory of Marine Ecological Monitoring and Restoration Technologies, MNR (MEMRT202114).
The authors declare that the research was conducted in the absence of any commercial or financial relationships that could be construed as a potential conflict of interest.
All claims expressed in this article are solely those of the authors and do not necessarily represent those of their affiliated organizations, or those of the publisher, the editors and the reviewers. Any product that may be evaluated in this article, or claim that may be made by its manufacturer, is not guaranteed or endorsed by the publisher.
We thank Hui Shen, Bin Jia, Wei Yang, and Guanlin Yang for helping with the graphics processing. We also thank Sangon Biotech (Shanghai) Co., Ltd. for experiment support.
The Supplementary Material for this article can be found online at: https://www.frontiersin.org/articles/10.3389/fevo.2022.874558/full#supplementary-material
Azzurro, E., Matiddi, M., Fanelli, E., Guidetti, P., La Mesa, G., Scarpato, A., et al. (2010). Sewage pollution impact on Mediterranean rocky-reef fish assemblages. Mar. Environ. Res. 69, 390–397. doi: 10.1016/j.marenvres.2010.01.006
Bailey, L. L., Jones, P., Thompson, K. G., Foutz, H. P., Logan, J. M., Wright, F. B., et al. (2019). Determining presence of rare amphibian species: testing and combining novel survey methods. J. Herpetol. 53, 115–124. doi: 10.1670/18-122
Barnes, M. A., Turner, C. R., Jerde, C. L., Renshaw, M. A., Chadderton, W. L., and Lodge, D. M. (2014). Environmental Conditions Influence eDNA Persistence in Aquatic Systems. Environ. Sci. Technol. 48, 1819–1827. doi: 10.1021/es404734p
Brys, R., Haegeman, A., Halfmaerten, D., Neyrinck, S., Staelens, A., Auwerx, J., et al. (2020). Monitoring of spatio-temporal occupancy patterns of fish and amphibian species in a lentic aquatic system using environmental DNA. Mol. Ecol. 30, 3097–3110. doi: 10.1111/mec.15742
China State Bureau of Quality and Technical Supervision (2007a). National Standards of the People’s Republic of China, Specifications for Oceanographic Survey. GB 12763-2007 (in Chinese). Beijing: Standards Press of China.
China State Bureau of Quality and Technical Supervision (2007b). National Standards of the People’s Republic of China, Specification for Marine Monitoring Part2: Data Processing and Analysis Quality Control. GB17378.2-2007 (in Chinese). Beijing: Standards Press of China.
Darling, E. S., Graham, N. A. J., Januchowski-Hartley, F. A., Nash, K. L., Pratchett, M. S., and Wilson, S. K. (2017). Relationships between structural complexity, coral traits, and reef fish assemblages. Coral Reefs 36, 561–575. doi: 10.1007/s00338-017-1539-z
Doi, H., Inui, R., Akamatsu, Y., Kanno, K., Yamanaka, H., Takahara, T., et al. (2017). Environmental DNA analysis for estimating the abundance and biomass of stream fish. Freshw. Biol. 62, 30–39. doi: 10.1111/fwb.12846
Duijndam, S., Beukering, P. V., Fralikhina, H., Molenaar, A., and Koetse, M. (2020). Valuing a caribbean coastal lagoon using the choice experiment method: the case of the simpson bay lagoon, saint martin. J. Nat. Conserv. 56:125845. doi: 10.1016/j.jnc.2020.125845
Fediajevaite, J., Priestley, V., Arnold, R., and Savolainen, V. (2021). Meta-analysis shows that environmental DNA outperforms traditional surveys, but warrants better reporting standards. Ecol. Evol. 11, 4803–4815. doi: 10.1002/ece3.7382
Ficetola, G. F., Manenti, R., and Taberlet, P. (2019). Environmental DNA and metabarcoding for the study of amphibians and reptiles: species distribution, the microbiome, and much more. Amphib.-Reptil. 40, 129–148. doi: 10.1163/15685381-20191194
Fujiwara, A., Matsuhashi, S., Doi, H., Yamamoto, S., and Minamoto, T. (2016). Use of environmental DNA to survey the distribution of an invasive submerged plant in ponds. Freshw. Sci. 35, 748–754. doi: 10.1086/685882
Grimaldo, E., Herrmann, B., Su, B., Fore, H. M., Vollstad, J., Olsen, L., et al. (2019). Comparison of fishing efficiency between biodegradable gillnets and conventional nylon gillnets. Fish. Res. 213, 67–74. doi: 10.1016/j.fishres.2019.01.003
Guidetti, P. (2000). Differences Among Fish Assemblages Associated with Nearshore Posidonia oceanic Seagrass Beds, Rocky–algal Reefs and Unvegetated Sand Habitats in the Adriatic Sea. Estuar. Coast. Shelf Sci. 50, 515–529. doi: 10.1006/ecss.1999.0584
Han, X. F., Wang, Y. X., Qiu, J. J., Zhang, M. M., Yu, S. L., Liang, H., et al. (2020). Niche and interspecific associations of dominant fishes in southern coastal waters in Taizhou, China. J. Fish. China 44, 621–631. doi: 10.11964/jfc.20190411721
Harper, L. R., Buxton, A. S., Rees, H. C., Bruce, K., Brys, R., Halfmaerten, D., et al. (2019a). Prospects and challenges of environmental DNA (eDNA) monitoring in freshwater ponds. Hydrobiologia 826, 25–41. doi: 10.1007/s10750-018-3750-5
Harper, L. R., Handley, L. L., Carpenter, A. I., Ghazali, M., Di Muri, C., Macgregor, C. J., et al. (2019b). Environmental DNA (eDNA) metabarcoding of pond water as a tool to survey conservation and management priority mammals. Biol. Conserv. 238:108225. doi: 10.1016/j.biocon.2019.108225
Jo, T., Arimoto, M., Murakami, H., Masuda, R., and Minamoto, T. (2019). Particle Size Distribution of Environmental DNA from the Nuclei of Marine Fish. Environ. Sci. Technol. 53, 9947–9956. doi: 10.1021/acs.est.9b02833
Juza, T., Blabolil, P., Baran, R., Drastik, V., Holubova, M., Kocvara, L., et al. (2018). Comparison of two passive methods for sampling invasive round goby (Neogobius melanostomus) populations at different depths in artificial lakes. Fish. Res. 207, 175–181. doi: 10.1016/j.fishres.2018.06.002
Kar, A., Raut, S. K., Bhattacharya, M., Patra, S., Das, B. K., and Patra, B. C. (2017). Marine fishes of West Bengal coast, India: diversity and conservation preclusion. Reg. Stud. Mar. Sci. 16, 56–66. doi: 10.1016/j.rsma.2017.08.009
Kimura, S., Hori, K., and Shibukawa, K. (2009). A new anchovy, Stolephorus teguhi (Clupeiformes: engraulidae), from North Sulawesi, Indonesia. Ichthyol. Res. 56, 292–295. doi: 10.1007/s10228-009-0103-4
Li, Y. J., Zhang, J., Chen, Z. Z., Gong, Y. Y., Cai, Y. C., et al. (2020). Study on taxonomic diversity of fish in Zhubi Reef of Nansha Islands. South China Fish. Sci. 16, 36–41. doi: 10.12131/20190159
Liang, H., Wang, Y. X., Shui, B. N., Qiu, J. J., Zhang, M. M., Yu, S. L., et al. (2019). Community Structure and Biodiversity of Nekton in the Taizhou South Near Sea. J. Zhejiang Ocean Univ. 38, 495–501.
Liang, J., Wang, W. D., Yu, B. C., and Zhang, H. L. (2014). Seasonal variations of fish resources and community diversity of free habitat in marine protected area of Zhongjieshan Islands. Oceanol. Limnol. Sin. 45, 979–989.
Liu, H. Z., Liu, S. W., Gao, X., Zhang, C. G., et al. (2016). Theory and methods on fish diversity monitoring with an introduction to the inland water fish diversity observation in China. Biodivers. Sci. 24, 1227–1233. doi: 10.17520/biods.2016031
Liu, Y., Shan, B. B., Yang, C. P., Zhao, Y., Liu, M. T., Xie, Q. J., et al. (2020). The complete mitochondrial genome of milk shark, Rhizoprionodon acutus (Ruppell 1837). Mitochondrial DNA Part B 5, 310–311. doi: 10.1080/23802359.2019.1703578
Malekian, M., Sadeghi, P., and Goudarzi, F. (2018). Assessment of environmental DNA for detection of an imperiled Amphibian, the luristan newt (Neurergus kaiseri, Schmidt 1952). Herpetol. Conserv. Biol. 13, 175–182.
Mauvisseau, Q., Parrondo, M., Fernandez, M. P., Garcia, L., Martinez, J. L., Garcia-Vazquez, E., et al. (2017). On the way for detecting and quantifying elusive species in the sea: the Octopus vulgaris case study. Fish. Res. 191, 41–48. doi: 10.1016/j.fishres.2017.02.023
Miya, M., Sato, Y., Fukunaga, T., Sado, T., Poulsen, J. Y., Sato, K., et al. (2015). MiFish, a set of universal PCR primers for metabarcoding environmental DNA from fishes: detection of more than 230 subtropical marine species. R. Soc. Open Sci. 2:150088. doi: 10.1098/rsos.150088
Olsen, E., Axelsen, B. E., Utne-Palm, A. C., Elamin, E. M., Mukhtar, M. A., Saleh, A. M., et al. (2019). Distribution and diversity of fish species exposed to artisanal fishery along the Sudanese Red Sea coast. J. Fish. Aquat. Sci. 2, 1–16. doi: 10.3923/jfas.2007.1.16
Pawlowski, J., Apotheloz-Perret-Gentil, L., and Altermatt, F. (2020). Environmental (e)DNA: what’s behind the term? Clarifying the terminology and recommendations for its future use in biomonitoring. Mol. Ecol. 29, 4258–4264. doi: 10.1111/mec.15643
Pont, D., Rocle, M., Valentini, A., Civade, R., Jean, P., Maire, A., et al. (2018). Environmental DNA reveals quantitative patterns of fish biodiversity in large rivers despite its downstream transportation. Sci. Rep. 8:10361. doi: 10.1038/s41598-018-28424-8
Pont, D., Valentini, A., Rocle, M., Maire, A., Delaigue, O., Jean, P., et al. (2019). The future of fish-based ecological assessment of European rivers: from traditional EU Water Framework Directive compliant methods to eDNA metabarcoding-based approaches. J. Fish Biol. 98, 354–366. doi: 10.1111/jfb.14176
Port, J. A., O’Donnell, J. L., Romero-Maraccini, O. C., Leary, P. R., Litvin, S. Y., Nickols, K. J., et al. (2016). Assessing vertebrate biodiversity in a kelp forest ecosystem using environmental DNA. Mol. Ecol. 25, 527–541. doi: 10.1111/mec.13481
Rice, C. J., Larson, E. R., and Taylor, C. A. (2018). Environmental DNA detects a rare large river crayfish but with little relation to local abundance. Freshw. Biol. 63, 443–455. doi: 10.1111/fwb.13081
Shogren, A. J., Tank, J. L., Egan, S. P., Bolster, D., and Riis, T. (2019). Riverine distribution of mussel environmental DNA reflects a balance among density, transport, and removal processes. Freshw. Biol. 64, 1467–1479. doi: 10.1111/fwb.13319
Shu, L., Ludwig, A., and Peng, Z. (2020). Standards for Methods Utilizing Environmental DNA for Detection of Fish Species. Genes 11:296. doi: 10.3390/genes11030296
Silvano, R. A. M., Hallwass, G., Juras, A. A., and Lopes, P. F. M. (2017). Assessment of efficiency and impacts of gillnets on fish conservation in a tropical freshwater fishery. Aquat. Conserv. Mar. Freshw. Ecosyst. 27, 521–533. doi: 10.1002/aqc.2687
Stoeckle, M. Y., Adolf, J., Charlop-Powers, Z., Dunton, K. J., Hinks, G., and VanMorter, S. M. (2020). Trawl and eDNA assessment of marine fish diversity, seasonality, and relative abundance in coastal New Jersey, USA. ICES J. Mar. Sci. 78, 293–304. doi: 10.1093/icesjms/fsaa225
Takahara, T., Minamoto, T., Yamanaka, H., Doi, H., and Kawabata, Z. (2012). Estimation of Fish Biomass Using Environmental DNA. PLoS One 7:e35868. doi: 10.1371/journal.pone.0035868
Tews, J., Brose, U., Grimm, V., Tielborger, K., Wichmann, M. C., Schwager, M., et al. (2010). Animal species diversity driven by habitat heterogeneity/diversity: the importance of keystone structures. J. Biogeogr. 31, 79–92. doi: 10.1046/j.0305-0270.2003.00994.x
Thomsen, P. F., Kielgast, J., Iversen, L. L., Moller, P. R., Rasmussen, M., and Willerslev, E. (2012). Detection of a Diverse Marine Fish Fauna Using Environmental DNA from Seawater Samples. PLoS One 7:e41732. doi: 10.1371/journal.pone.0041732
Tikadar, K. K., Kunda, M., and Mazumder, S. K. (2021). Diversity of fishery resources and catch efficiency of fishing gears in Gorai River, Bangladesh. Heliyon 7:e08478. doi: 10.1016/j.heliyon.2021.e08478
Tillotson, M. D., Kelly, R. P., Duda, J. J., Hoy, M., Kralj, J., and Quinn, T. P. (2018). Concentrations of environmental DNA (eDNA) reflect spawning salmon abundance at fine spatial and temporal scales. Biol. Conserv. 220, 1–11. doi: 10.1016/j.biocon.2018.01.030
Underwood, A. J., and Chapman, M. G. (1996). Subtidal assemblages on rocky reefs at a cliff-face sewage outfall (north head, sydney, australia): what happened when the outfall was turned off? Mar. Pollut. Bull. 33, 293–302. doi: 10.1016/S0025-326X(96)00125-7
Van Loon, W. M. G. M., Walvoort, D. J. J., van Hoey, G., Vina-Herbon, C., Blandon, A., Pesch, R., et al. (2018). A regional benthic fauna assessment method for the southern north sea using margalef diversity and reference value modelling. Ecol. Indic. 89, 667–679. doi: 10.1016/j.ecolind.2017.09.029
Wang, X. H., Du, F. Y., Liu, W. D., and Gu, Y. G. (2015). Zoster Wrasse Choerodon zosterophorus (Perciformes, Labridae) — A New Record in China Seas. Chin. J. Zool. 50, 277–281. doi: 10.13859/j.cjz.201502014
Wang, Y., and Wu, C. W. (2015). Fish community diversity in reef waters of Zhongjieshan Islands. Oceanol. Limnol. Sin. 46, 776–785. doi: 10.11693/hyhz20150100003
Wang, Z. H., Zhang, S. Y., Chen, Q. M., Xu, Q., and Wang, K. (2012). Fish community ecology in rocky reef habitat of Ma’an Archipelago. I. Species composition and diversity. Biodivers. Sci. 20, 41–50. doi: 10.3724/SP.J.1003.2012.10168
Wang, Z. H., Zhao, J., Wang, K., and Zhang, S. Y. (2013). Fish community ecology in rocky reef habitat of Ma’an Archipelago II. Spatiotemporal patterns of community structure. J. Ecol. 33, 6218–6226. doi: 10.5846/stxb201306081445
Zeng, X., Zhang, S. Y., Wang, Z. H., Lin, J., and Wang, K. (2016). Habitat suitability assessment of sebasticus marmoratus in the rocky reef region of the ma’an archipelago. Acta Ecol. Sin. J. Ecol. 36, 3765–3774. doi: 10.5846/stxb201506011097
Zhang, Q. L., and Wang, F. (2004). Climatological analysis of water masses in Zhoushan fishing ground and adjacent region. Oceanol. Limnol. Sin. 35, 48–54.
Zhang, S. Y., Liu, S. Y., Zhou, X. J., Wang, Z. H., and Wang, K. (2019). Ecological function of seaweed-formed habitat and discussion of its application to sea ranching. J. Fish. China 43, 2004–2014. doi: 10.11964/jfc.20190711873
Keywords: eDNA, multi-mesh gillnets, rocky reef habitat, fish diversity, evaluation
Citation: Lin Y, Li J, Wang Z, Zhang S, Wang K and Li X (2022) A Comparison of Fish Diversity in Rocky Reef Habitats by Multi-Mesh Gillnets and Environmental DNA Metabarcoding. Front. Ecol. Evol. 10:874558. doi: 10.3389/fevo.2022.874558
Received: 12 February 2022; Accepted: 28 February 2022;
Published: 14 April 2022.
Edited by:
Chao Wang, Pearl River Fisheries Research Institute, Chinese Academy of Fishery Sciences (CAFS), ChinaReviewed by:
Xiujuan Shan, Yellow Sea Fisheries Research Institute, Chinese Academy of Fishery Sciences (CAFS), ChinaCopyright © 2022 Lin, Li, Wang, Zhang, Wang and Li. This is an open-access article distributed under the terms of the Creative Commons Attribution License (CC BY). The use, distribution or reproduction in other forums is permitted, provided the original author(s) and the copyright owner(s) are credited and that the original publication in this journal is cited, in accordance with accepted academic practice. No use, distribution or reproduction is permitted which does not comply with these terms.
*Correspondence: Zhenhua Wang, emhfd2FuZ0BzaG91LmVkdS5jbg==; Shouyu Zhang, c3l6aGFuZ0BzaG91LmVkdS5jbg==
Disclaimer: All claims expressed in this article are solely those of the authors and do not necessarily represent those of their affiliated organizations, or those of the publisher, the editors and the reviewers. Any product that may be evaluated in this article or claim that may be made by its manufacturer is not guaranteed or endorsed by the publisher.
Research integrity at Frontiers
Learn more about the work of our research integrity team to safeguard the quality of each article we publish.