
94% of researchers rate our articles as excellent or good
Learn more about the work of our research integrity team to safeguard the quality of each article we publish.
Find out more
ORIGINAL RESEARCH article
Front. Ecol. Evol., 12 May 2022
Sec. Evolutionary and Population Genetics
Volume 10 - 2022 | https://doi.org/10.3389/fevo.2022.868826
This article is part of the Research TopicEpigenomic Polymorphisms: the Drivers of Diversity and HeterogeneityView all 11 articles
 Jeannie M. Mounger1
 Isolde van Riemsdijk2
 M. Teresa Boquete1,3
 Cornelis A. M. Wagemaker4
 Samar Fatma5
 Marta H. Robertson1
 Sandy A. Voors1
 Jenna Oberstaller6
 Fleur Gawehns7Torrance C. Hanley8
 Ivo Grosse5,9
 Koen J. F. Verhoeven7
 Erik E. Sotka10
 Catherine A. Gehring11
 A. Randall Hughes8
 David B. Lewis1
 Marc W. Schmid12
 Christina L. Richards1,2*
Ecological genomics approaches have informed us about the structure of genetic diversity in natural populations that might underlie patterns in trait variation. However, we still know surprisingly little about the mechanisms that permit organisms to adapt to variable environmental conditions. The salt marsh foundation plant Spartina alterniflora exhibits a dramatic range in phenotype that is associated with a pronounced intertidal environmental gradient across a narrow spatial scale. Both genetic and non-genetic molecular mechanisms might underlie this phenotypic variation. To investigate both, we used epigenotyping-by-sequencing (epiGBS) to evaluate the make-up of natural populations across the intertidal environmental gradient. Based on recent findings, we expected that both DNA sequence and DNA methylation diversity would be explained by source population and habitat within populations. However, we predicted that epigenetic variation might be more strongly associated with habitat since similar epigenetic modifications could be rapidly elicited across different genetic backgrounds by similar environmental conditions. Overall, with PERMANOVA we found that population of origin explained a significant amount of the genetic (8.6%) and epigenetic (3.2%) variance. In addition, we found that a small but significant amount of genetic and epigenetic variance (<1%) was explained by habitat within populations. The interaction of population and habitat explained an additional 2.9% of the genetic variance and 1.4% of the epigenetic variance. By examining genetic and epigenetic variation within the same fragments (variation in close-cis), we found that population explained epigenetic variation in 9.2% of 8,960 tested loci, even after accounting for differences in the DNA sequence of the fragment. Habitat alone explained very little (<0.1%) of the variation in these close-cis comparisons, but the interaction of population and habitat explained 2.1% of the epigenetic variation in these loci. Using multiple matrix regression with randomization (MMRR) we found that phenotypic differences in natural populations were correlated with epigenetic and environmental differences even when accounting for genetic differences. Our results support the contention that sequence variation explains most of the variation in DNA methylation, but we have provided evidence that DNA methylation distinctly contributes to plant responses in natural populations.
The importance of genetically based variation within species has been well accepted in the field of evolutionary biology, but further analyses are required to understand the mechanisms that enable organisms to adapt to conditions in novel or challenging environments. In addition to patterns of genetic variation that have been associated with different environmental challenges (Bock et al., 2015; Hodgins et al., 2015; Neinavaie et al., 2021), increasing evidence suggests that epigenetic variation (e.g., alterations to DNA methylation, small RNAs, and chromatin remodeling) plays a role in ecology, and that this variation can be both environmentally induced and contribute to phenotypic plasticity (Cortijo et al., 2014; Medrano et al., 2014; Robertson and Richards, 2015; Banta and Richards, 2018; Ashe et al., 2021; Mounger et al., 2021a; Stajic and Jansen, 2021). This additional source of variation may be particularly important for sessile organisms such as plants, given that individuals are unable to migrate away from stressors (Dodd and Douhovnikoff, 2016; Balao et al., 2018). Many plant species persist across broad ranges in environmental conditions, and phenotypes are known to vary in response (Schlichting, 1986; Des Marais et al., 2013; Gratani, 2014). The association of phenotypic variation with environmental variation is particularly evident in coastal ecosystems, where plant species are exposed to substantial fluctuations in inundation, salinity, and soil conditions (Pennings and Bertness, 2001; Richards et al., 2005; Lewis et al., 2021). As plants increasingly face habitat loss, competition from invasive species, and extreme weather conditions resulting from anthropogenic global change, rapid phenotypic modifications moderated by epigenetic mechanisms may be an important component of response (Nicotra et al., 2010). This source of variation could be especially important in ecosystems impacted by the most dramatic intensifications or shifts in climatic and habitat conditions (Nicotra et al., 2015; Burggren, 2016; Jueterbock et al., 2020; Mounger et al., 2021b).
Our understanding of the role of epigenetic regulatory mechanisms in plant trait response is primarily based on research with model organisms or from agriculture (Niederhuth and Schmitz, 2017; Balao et al., 2018; Miryeganeh and Saze, 2020). In these contexts, epigenetic mechanisms such as DNA methylation and histone modifications have been shown to play a role in stress response to salinity, drought, temperature, fluctuating nutrient levels and UV radiation (reviewed in Miryeganeh (2021)). However, the examination of these relationships in more natural settings is expanding (Richards et al., 2017; Jueterbock et al., 2020; Sarma et al., 2020, 2021; Mounger et al., 2021a,b; Boquete et al., 2022). For instance, several population epigenetics studies have demonstrated that DNA methylation varies with population structure and habitat (Lira-Medeiros et al., 2010; Paun et al., 2010; Schulz et al., 2014; Xie et al., 2015; Foust et al., 2016; Herrera et al., 2017; Gao et al., 2019; Gáspár et al., 2019; Mounger et al., 2021b). Studies of non-model plant species have also shown changes in DNA methylation that are associated with community composition (van Moorsel et al., 2019), abiotic stress response (Verhoeven et al., 2010; Nicotra et al., 2015; Li et al., 2020; Boquete et al., 2022), biotic interactions such as herbivory (Herrera and Bazaga, 2011; Alonso et al., 2019), and transgenerational plasticity (Herman and Sultan, 2016; Puy et al., 2021a,b). Despite this body of work, few studies have simultaneously analyzed genetic, epigenetic, and environmental factors to establish if and how much they each contribute to functional variation (e.g., Herrera et al., 2017; Wang et al., 2017).
Spartina alterniflora L. (Poaceae) populations provide a unique opportunity to explore the mechanisms that underlie phenotypic response to environmental challenges. Throughout the native range of S. alterniflora, a predictable change in phenotype is associated with repeated instances of the intertidal environmental gradient (Figure 1). On the leading edge of the shoreline, plants grow tall, sometimes exceeding 2 m in height. As elevation climbs away from the water, plants decrease in height and may not reach 0.25 m at the highest elevations (Pennings and Bertness, 2001; Richards et al., 2005; Voors, 2018). Plants along this gradient are exposed to tides at varying frequency, with plants in the low marsh (closest to tidal creeks and bays) experiencing regular tidal inundation and plants in the high marsh receiving less frequent exposure to flooding. Salt deposits accumulate to a greater degree in the high marsh soil as a combined result of evapotranspiration and diminished tidal flushing (Bertness and Ellison, 1987; Pennings et al., 2005). In addition, differences in competition, edaphic conditions, water content, elevation, and herbivory can drive phenotypic variation in this species (Richards et al., 2005; Wiêski and Pennings, 2014; Zerebecki et al., 2017; Voors, 2018). Previous studies on whether the phenotypic differences in so called short-form versus tall-form S. alterniflora are genetically based have been equivocal (Stalter and Batson, 1969; Shea et al., 1975; Valiela et al., 1978; Gallagher et al., 1988). However, a recent reciprocal transplant study demonstrated that plants from the high and low marsh habitats were differentiated genetically and in several plant traits, which translated into fitness differences, supporting the hypothesis of local adaptation (Zerebecki et al., 2021).
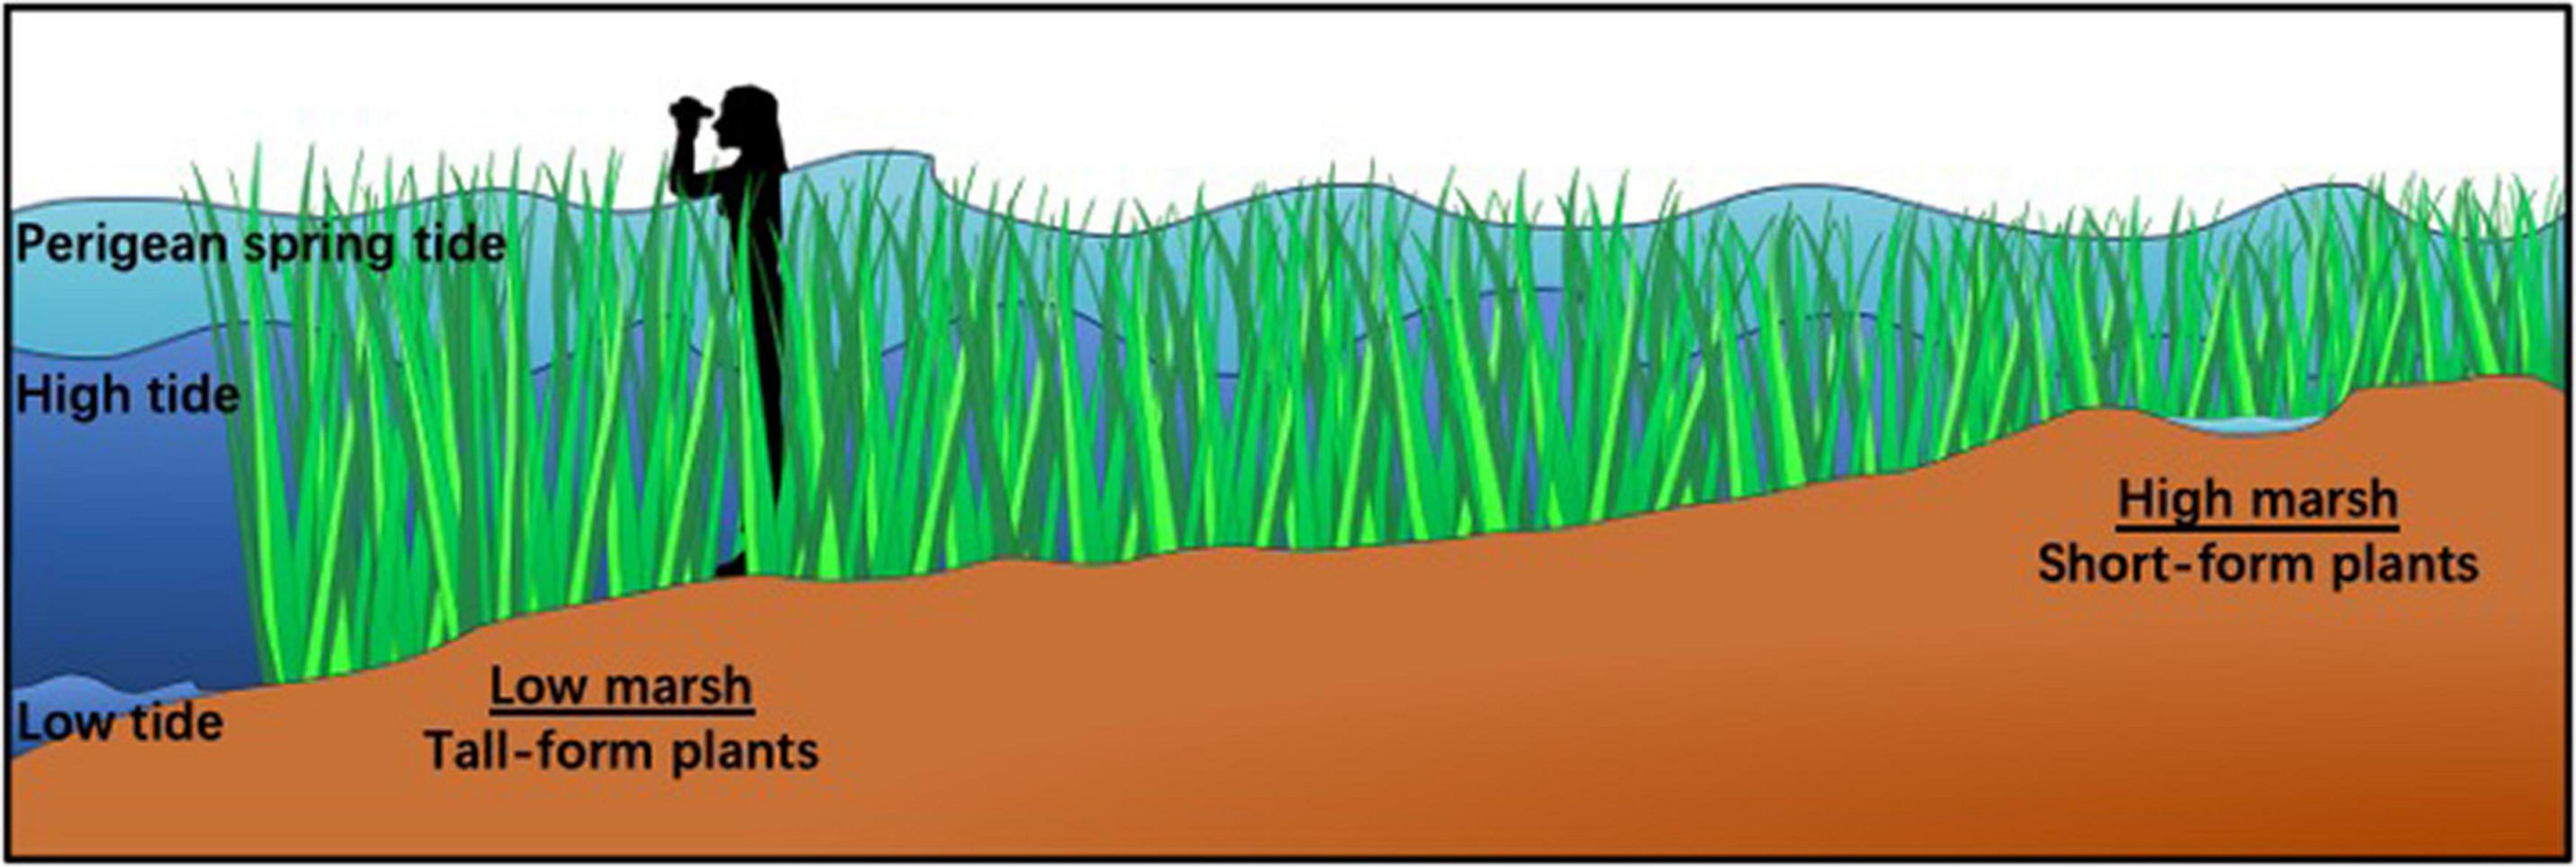
Figure 1. Trait variation in Spartina alterniflora is correlated with tidal inundation across the marsh. Tall-form plants (>2 m) grow adjacent to tidal creeks in the low marsh where they are inundated daily. Plants decrease in height across increasing elevation such that short-form plants (<0.25 m) are found in the high marsh where exposure to tidal flooding is less often and for less duration. Perigean spring tides are extremely high tides often referred to as “King Tides” which reach the highest elevation in the marsh. They happen 6–8 times a year and inundate the entire salt marsh community (see: https://oceanservice.noaa.gov/facts/perigean-spring-tide.html).
In addition to well-documented differences in plant traits that are associated with environmental variation, native populations of S. alterniflora harbor high genetic diversity within natural populations (Richards et al., 2004; Travis et al., 2004; Hughes and Lotterhos, 2014; Foust et al., 2016; Zerebecki et al., 2021). This high genetic diversity could allow for fine-scale differentiation across the landscape considering the persistent differences in habitats. This species is known to be resilient to both natural (Pennings and Bertness, 2001; Edwards et al., 2005; Pennings et al., 2005) and anthropogenic stressors (Lin and Mendelssohn, 2012; Lin et al., 2016; Robertson et al., 2017; Alvarez et al., 2018). Response to these environmental conditions may be attributable to both genetic and non-genetic variation. For instance, recent work in S. alterniflora has shown that differences in DNA methylation were associated with different natural habitats (Foust et al., 2016), exposure to crude oil (Robertson et al., 2017) and with hybridization and allopolyploidization events that occurred during the process of invasion (Salmon et al., 2005). However, linking molecular mechanisms to trait variation and fine-scale environmental variation remains a daunting task.
Strategic application of multivariate statistics allows us to gain some insight into the relationships between genetic, epigenetic, environmental and phenotypic variation (Herrera et al., 2017; Wang et al., 2020). In this study, we used epigenotyping-by-sequencing (epiGBS) combined with measures of environmental factors and plant phenotypic variation to associate patterns of genomic and epigenomic diversity with environmental and phenotypic variation in natural S. alterniflora populations. We expected that DNA sequence variation would be explained by source population and habitat type (low and high marsh) within populations. We also predicted that DNA methylation patterns would be explained by both source population and habitat type, but more strongly associated with habitat type, since across genetic backgrounds similar epigenetic modifications could be elicited in response to similar environmental conditions. Finally, we used multiple matrix regression analysis with randomization (MMRR) to evaluate associations of a phenotypic distance matrix with matrices of genetic, epigenetic, and environmental distances. We predicted that the epigenetic differences and environmental differences would associate with differences in traits, even when accounting for genetic distances.
Spartina alterniflora is a coastal salt marsh foundation species (sensu Ellison, 2019) that alters environmental conditions, builds land through the accumulation of sediments and organic matter, provides nursery grounds for numerous fish species, regulates trophic interactions, and serves as a crucial primary producer within subtropical and temperate estuarine environments (Pennings and Bertness, 2001; Lewis and Eby, 2002; Hughes and Lotterhos, 2014; Bertness, 2020; Hays et al., 2021). This species reproduces clonally by rhizomes (Pennings and Callaway, 2000), and sexually through completely outcrossed seeds (Somers and Grant, 1981). The relative contribution of each type of reproduction is unknown, but these populations have average levels of genetic diversity compared to non-clonal outcrossing species with otherwise similar life history characteristics (sensu Hamrick and Godt, 1996; Zerebecki et al., 2021).
We collected S. alterniflora individuals in two habitat types (low, or seaward, and high, or landward, parts of the salt marsh) at three sites near Charleston, South Carolina: Fort Johnson (N 32.74910; W 79.89822), Folly Beach (N 32.64436; W 79.96564), and Bowens Island (N 32.68027; W 79.95389; Figure 2). Mean tidal range at these sites is between 1.59 and 1.65 m (U.S. NOAA National Ocean Service, Charleston, Cooper River Entrance, SC – Station ID: 8665530; Highway 171 Bridge, Folly Creek, SC – Station ID: 8665424; Folly River Bridge, Folly River, SC – Station ID: 8666652). The salt marshes within each site were typical of those in the southeastern United States, with S. alterniflora as the dominant plant species occurring across a wide range of salinity and soil conditions (Pennings and Bertness, 2001; Richards et al., 2005; Voors, 2018). We defined each site as a distinct population of potentially interbreeding individuals based on previous work in these locations (Zerebecki et al., 2021). The low marsh habitat occurred near tidal creek banks, was tidally inundated daily, and was characterized by the so-called tall-form of S. alterniflora (average height of 131 cm; Voors, 2018). The high marsh habitat was flooded less frequently, had higher soil salinity, and supported the short-form of S. alterniflora (average height of 53 cm; Voors, 2018).
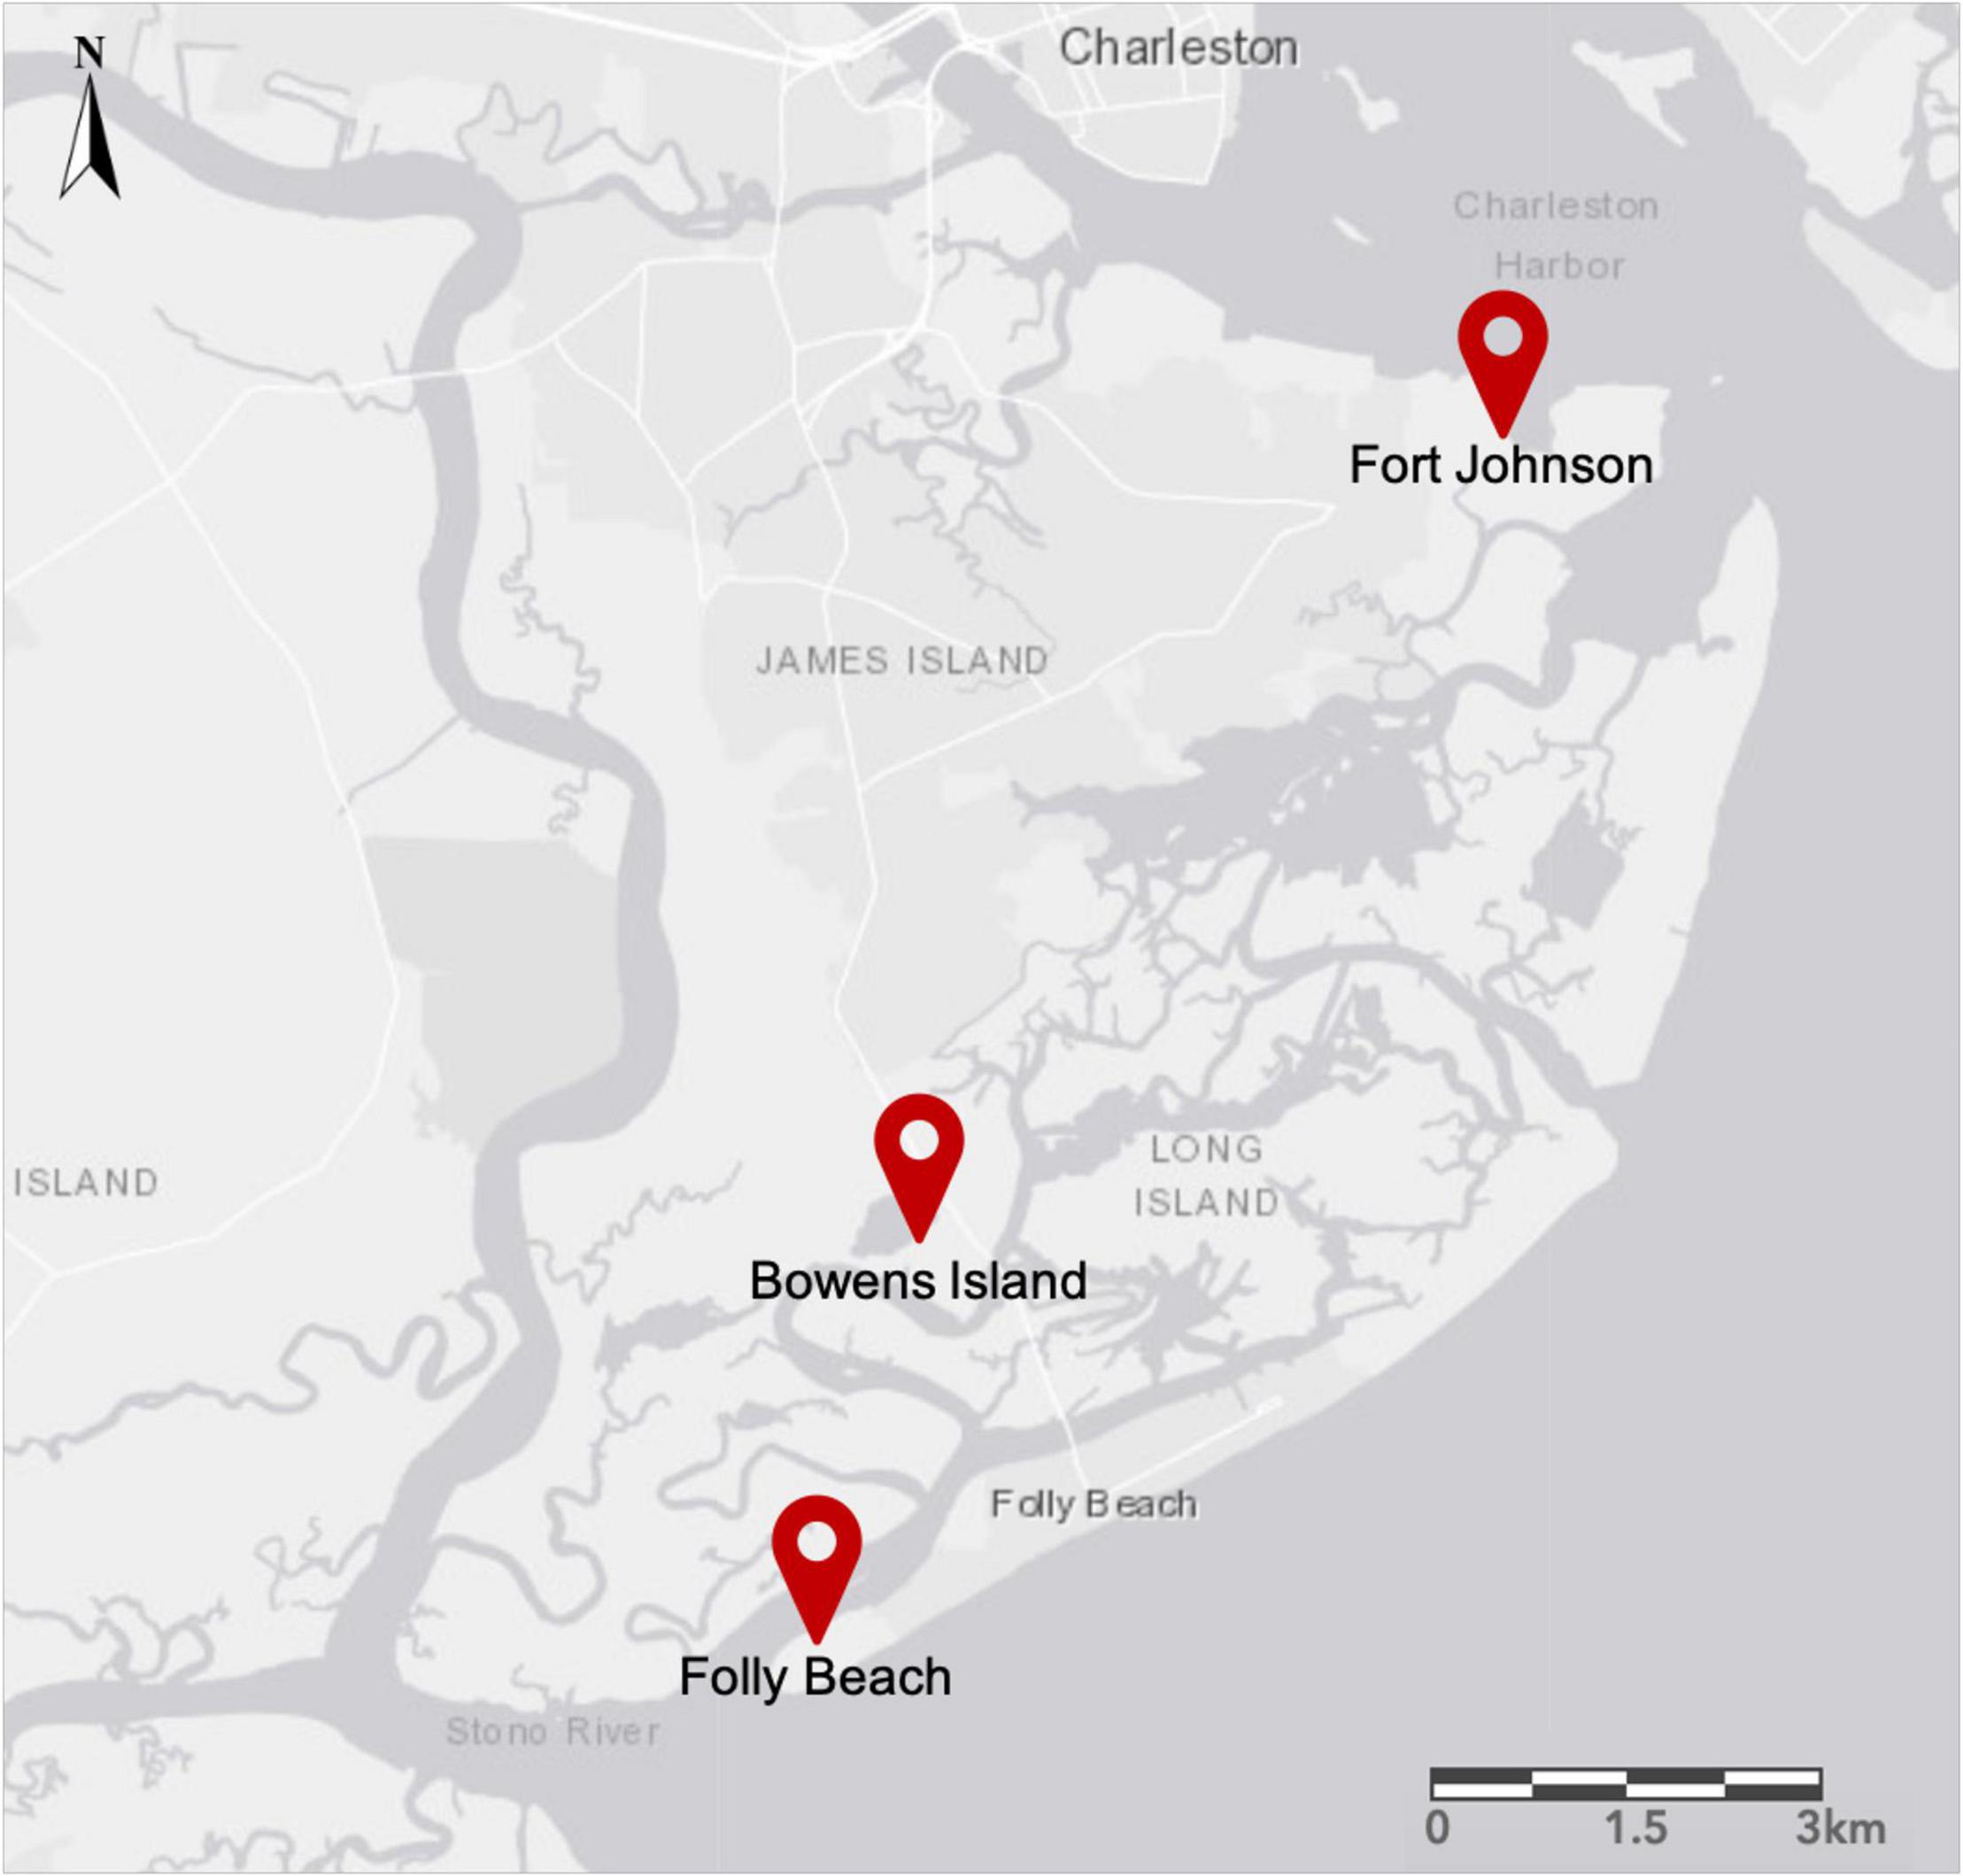
Figure 2. Map of the James Island region near Charleston, South Carolina, United States. We sampled from two habitats (low and high marsh) in three populations: Fort Johnson (FJ), Bowens Island (BI), and Folly Beach (FB).
During a 3-day period in August 2016, we established low- and high-marsh transects that ran parallel to the marsh-open water interface, and were separated by a minimum distance of 20 m. We ran a 50 m transect in each habitat at each site and laid down flags at randomly selected positions along each transect to establish ten 0.5 m × 0.5 m plots. The low marsh transects were within 2 m of tidal creeks. In a 0.25 m × 0.25 m quadrat in the center of each plot, we recorded densities of live and dead S. alterniflora stems. We then haphazardly flagged five stems in each plot and measured the stem height and the number of live leaves on each flagged stem. We collected a leaf sample from each flagged stem (i.e., 3 populations × 2 habitats × 10 plots × 5 stems = 300 individual plant samples) for (epi)genomic analyses and flash froze them in the field in liquid nitrogen before storing them long-term in −80°C. We collected an additional leaf tissue sample from each of the same 300 individuals for stable isotope analysis and kept them on ice in the field before freezing them in the lab. We measured redox, temperature, and salinity in a subset (min = 3) of plots along each transect. We also counted the number of snails present, measured porewater salinity and sediment respiration, and collected sediment samples from each plot. From the sediment samples obtained in the field, we recorded percent soil moisture, percent organic matter by loss-on-ignition, soil extractable ammonium (NH4+), soil extractable nitrate (NO3–), porewater NH4+, porewater NO3–, microbial biomass carbon (C), and microbial biomass nitrogen (N) in the lab as described in Voors (2018).
We extracted genomic DNA from the 300 samples using the Qiagen DNeasy plant mini kit according to the manufacturer’s protocol with some modifications (sensu Foust et al., 2016). We prepared epiGBS libraries for 288 samples using three sets of 96 barcodes to be sequenced on three lanes of the Illumina Hi-Seq platform following methods outlined in van Gurp et al. (2016) and modified in Boquete et al. (2020). We digested 400 ng of genomic DNA from each sample with the enzymes NsiI and AseI. We ligated methylated, non-phosphorylated, barcoded adapters with variable barcodes of lengths from four to six base pairs to either end of the resulting fragments. The barcoded adaptors were designed so that we could identify forward (“Watson”) and reverse (“Crick”) strands for each fragment within each individual. Having the strand information allows for differentiating between C/T polymorphisms and methylation polymorphisms because we can recreate when unmethylated cytosines were present in either strand before bisulfite treatment without sequencing untreated samples (for details see van Gurp et al. (2016)).
For each group of 96 samples, we allocated the samples across eight pools and cleaned and size-selected genomic DNA fragments greater than 200 bp using 0.8 × SPRI beads (Agencourt AMPure XP; Beckman Coulter). We repaired nicks between the 3′ fragment overhangs and the 5′ non-phosphorylated adaptor nucleotides using a mix of dNTPs and DNA polymerase I. We used the Zymo EZ Lightning methylation kit to bisulfite-treat the DNA. We amplified libraries with the KAPA Uracil Hotstart Ready Mix with the following PCR conditions: an initial denaturation step at 95°C for 3 min followed by 18 cycles of 98°C for 10s, 65°C for 15s, and 72°C for 15s, with a final extension of 72°C for 5 min. The University of Florida Interdisciplinary Center for Biotechnology Research (UF ICBR) sequenced paired-end reads of the libraries on three lanes of the Illumina Platform HiSeq3000 (2 × 150 bp) in March 2017. Many of the libraries resulted in poor sequencing quality and depth, so we repeated library preparations. This time, we meta-pooled samples following ligation to reduce heterogeneity during the remaining library preparation process. Then, we sequenced 293 samples on four lanes of the Illumina Platform HiSeq X Ten System (2 × 150 bp) at the Novogene facility in Hong Kong in January 2019. We found that there were significantly fewer average reads per lane in the first set of libraries than the second set (P < 10–16), but we could not detect significant differences in the overall read count between populations, habitats or their interaction between the two library preparations (Supplementary Figure 1). We combined the sequencing from all seven lanes of data for analysis.
We used the epiGBS2 pipeline (Gawehns et al., 2022) based on the original epiGBS pipeline (van Gurp et al., 2016) to process the raw sequence data. We demultiplexed, quality trimmed sequencing reads, and removed the barcode sequences with the original scripts as previously described (van Moorsel et al., 2019; Mounger et al., 2021b). Then, we used the processed reads for de novo reference construction using a minimal sequencing depth of 100 and an identity threshold of 95% during clustering. We used the default parameters of the epiGBS2 pipeline to call single nucleotide polymorphisms (SNPs) and single methylation polymorphisms (SMPs). We annotated de novo reference sequences with DIAMOND (protein coding genes; NCBI non-redundant proteins as reference; version 0.8.22; Buchfink et al., 2015) and RepeatMasker (transposons and repeats; Embryophyta as reference species collection; version 4.0.6; Smit et al., 2013–2015). We used this annotation to identify de novo reference contigs mapping to genes, transposons, repeats, or none of these classes (Supplementary Table 1).
We filtered SNPs and SMPs to keep only loci with a minimum coverage of five (i.e., five sequencing reads mapping to each locus in the de novo reference) and a maximum coverage of 1,000 within each individual. This filtering eliminated regions that did not have enough coverage for SNP or SMP identification and ruled out artifacts that could result from repetitive regions that were collapsed into a single contig (Schmid et al., 2018b). We then removed individuals that were missing coverage for more than 50% of the SNPs or SMPs found in the entire data set. This filtering resulted in a final number of 211 samples for analysis. With these 211 samples, we removed SNPs and SMPs that were not present in at least 20 individuals per subpopulation. We also applied an additional filter removing loci with a minor allele frequency of 1% or less. We considered that these loci were probably actually monomorphic given the inaccuracies of sequencing technology (Yoder and Tiley, 2021).
We characterized genetic variation with three approaches. First, we estimated the proportion of polymorphic loci as the number of fragments that contained SNPs and the average number of SNPs/kb of sequence. We then calculated allelic richness (defined as the rarefied mean number of alleles per locus within each population and habitat within populations as in Mounger et al. (2021b) using the function allelic.richness from hierfstat package (Goudet, 2005). Finally, we determined the mean and standard deviation of observed gene diversity, and heterozygosity per locus, with the function basic.stats within hierfstat, which is based on Nei (1987). We also estimated overall observed heterozygosity, total genetic diversity, total among-population genetic diversity, mean within-population genetic diversity, and overall population differentiation with the function basic.stats. For these analyses, we used 8,767 SNPs with no missing values.
We tested for genetic differentiation within and among S. alterniflora populations using three different approaches. First, we used a multivariate ANOVA (or PERMANOVA) with genetic distances between individuals (DIST) as a dependent variable. We modeled the contribution of populations, habitats, and the interaction between populations and habitats as explanatory variables for genetic distance with 9,999 permutations (package vegan, version 2.5-7, function adonis; Oksanen et al., 2020). To do so, we used the formula DIST ∼ population + habitat + population:habitat. Note, whereas the “habitat” term tests for differences between habitats (high vs. low marsh) that are common across populations, the interaction tests for additional differences between habitats that are not shared among populations.
Second, we used distance-based redundancy analysis (dbRDA) to quantify the relationship between genome-wide genetic variation and population, habitat and their interaction. This time we used the function capscale implemented within the vegan package (Oksanen et al., 2020). RDA is an ordination technique that summarizes the main patterns of variation in the response matrix, i.e., the scaled allele frequency matrix created from the SNP data [obtained using the function scaleGen from adegenet v. 2.1.3 (Jombart, 2008; Jombart and Ahmed, 2011) with NA.method set to “mean”], which can be explained by our explanatory variables. We fit the following models:
1) Genetic distance ∼ population
2) Genetic distance ∼ population + habitat
3) Genetic distance ∼ population + habitat + population × habitat
We tested the significance of the variation explained by our explanatory variables using a Monte Carlo permutation test with 999 permutations and obtained adjusted R2 using the function RsquareAdj from the vegan package. We corrected p-values for multiple testing with false discovery rate (FDR; Benjamini and Hochberg, 1995) using the “fdr” method implemented with the p.adjust function in the base package of R.
Third, we obtained overall FST and pairwise FST values using the functions wc and genet.dist, respectively, from the package hierfstat. We calculated the confidence intervals of the pairwise FST values using the function boot.ppfst from the same package, with 999 permutations to determine whether FST values were significantly different from zero; that is, to find evidence of significant population differentiation. To identify candidate SNPs under selection, we used BayeScan v. 2.1 (Foll and Gaggiotti, 2008; Fischer et al., 2011). We corrected p-values for multiple testing with a significance threshold set to an FDR of 0.01.
Finally, we used a phylogenetic tree to assess the separation of populations and habitats based on genetic data. For this analysis, we used the same filtering process, but increased the MAF filter to include only MAF > 10% and excluded loci with any missing values. We concatenated the resulting 20,121 SNPs that survived this filtering and performed a maximum likelihood phylogenetic tree construction with IQ-tree (v 1.6.11) (Nguyen et al., 2015; Trifinopoulos et al., 2016; Hoang et al., 2018). We used the “general time reversible model with unequal rates and unequal base frequency,” and optimized base frequencies by maximum likelihood (GTR + FO; Tavaré, 1986). We used the codon model for DNA, which is an ultrafast bootstrap of 1,000 on 3 CPU cores. Other settings were left as default. We visualized the maximum likelihood tree with the R packages ape v. 5.5 (Paradis and Schliep, 2019) and scales v.1.1.1.9000 (Wickham and Seidel, 2020).
We calculated the DNA methylation level at each SMP within each individual sample (N = 211) as the number of reads mapping to one position that showed evidence of methylation (i.e., the bisulfite treatment did not convert the cytosine at that position) divided by the total number of reads mapping to that position. Then, we calculated the average level of DNA methylation for each sequence context (CG, CHG, and CHH) and across all contexts for plants grouped by habitat within each population (i.e., subpopulations) as well as the proportion of loci fixed for no methylation (i.e., methylation level ≤5% across ≥95% of the samples) and for full methylation (i.e., methylation level ≥95% across ≥95% of the samples).
We used a multivariate test for homogeneity of dispersions to estimate epigenetic diversity, i.e., variation in DNA methylation levels, following the approach of Anderson et al. (2006). This approach measures the average distance from each individual to their group centroid in a multivariate space using a dissimilarity measure. We argued previously that the distance from each individual sample to its population centroid in a multivariate space generated using an epigenetic distance matrix provides an estimate of the extent of the variation in DNA methylation, i.e., epigenetic variation (Mounger et al., 2021b). Then, the average distance of each population can be compared to test for significant differences in the amount of epigenetic variation among populations. Here, we applied the same logic to evaluate epigenetic variation within subpopulations. To do so, we generated pairwise epigenetic distance matrices by calculating the average difference in DNA methylation level across all cytosines between each pair of samples. Then, we used this matrix to calculate the distance between each individual sample and its subpopulation centroid using the function betadisper from the vegan package version 2.4-4 (Oksanen et al., 2020). We tested for differences in dispersion among subpopulations using a permutation-based test of multivariate homogeneity of group dispersions on the output of betadisper with 9,999 permutations. When this test was significant, we used the Tukey’s Honest Significant Difference test to check which subpopulations differed in their average distance to the centroid, i.e., in their levels of epigenetic variation. Finally, to compare genetic and epigenetic diversity levels, we used this approach to calculate the distance from each sample to its population centroid using genetic distance matrices. Genetic distances were calculated as the average distance of all per−SNP differences between two individuals. For each SNP, the distance was set to 0 if both alleles were identical, 0.5 if one allele was different, and 1 if both alleles were different (sensu Mounger et al., 2021b).
We tested for epigenetic differentiation within and among S. alterniflora populations using similar approaches as for genetic differentiation: (1) PERMANOVA, (2) dbRDA, and (3) a close cis analysis for each cytosine. To assess the effect of population and habitat on genome-wide epigenetic variation across all sequence contexts, or each separate sequence context (i.e., CG, CHG, and CHH), we used the same PERMANOVA model and dbRDA. We also evaluated overall epigenetic variation with and without accounting for genetic structure, using partial constrained dbRDA. Partial constrained dbRDA allows for “conditioning” the analysis of epigenetic variation with genetic data which we summarized with principal component analysis (PCA).
For the dbRDA, we used only SMPs with complete data, i.e., no missing values across samples. First, we summarized the genetic data into principal components (PCs) based on 68,317 SNPs with alleles with a minor allele frequency (MAF) > 1%. We used the first four PCs which combined explained ∼14% of the genetic variation across all sequence contexts. Then, we ran the following models to predict DNA methylation in S. alterniflora:
1) Epigenetic distance ∼ population
2) Epigenetic distance ∼ habitat
3) Epigenetic distance ∼ population + habitat + population × habitat
4) Epigenetic distance ∼ population + habitat + population x habitat + Condition (PCs)
5) Epigenetic distance ∼ Condition (PCs)
Just as for the genetic data, we tested the significance of the variation explained by our explanatory variables using a Monte Carlo permutation test and obtained adjusted R2, and adjusted p-values for multiple testing to reflect FDR.
We further evaluated how much of the variation in methylation is associated with populations and habitat before and after controlling for the underlying genetic variation in cis by comparing two models. We took advantage of the function “anova” in R (version 3.5.1) which uses type I (i.e., sequential) tests. We used the base functions lm and anova to calculate the model terms. We collected the terms for each reference sequence and adjusted P-values for each term for multiple testing to reflect FDR as above. First, we modeled the average DNA methylation level of individual reference sequences (i.e., ∼270 bp long contigs, n = 8,960) in response to the sequence context (CTXT), the population of origin (POP), the habitat (HAB), the interaction between the sequence context and the population (CTXT:POP) and habitat (CTXT:HAB), the interaction between population and habitat (POP:HAB) and the genotype of the reference sequence (GENO) and its interaction with sequence context (CTXT:GENO). We fit the terms first in this order, then compared this result to an alternative model in which POP and HAB were fitted after GENO.
1) percent methylation ∼ CTXT + POP + HAB + CTXT: POP + CTXT:HAB + POP:HAB + GENO + (CTXT:GENO).
2) percent methylation ∼ CTXT + GENO + CTXT:GENO + POP + HAB + CTXT:POP + CTXT:HAB + POP:HAB.
With this approach, the first model tested for epigenetic differentiation between populations of origin and habitats without first accounting for the sequence differences. The second model tested whether there was epigenetic differentiation between populations of origin or habitats that could not be explained by the underlying sequence differences since the effects of sequence differences were removed before evaluation of population and habitat. Results from this model cannot be directly compared with the results from our other models used to test for differential DNA methylation at individual cytosines, because this model uses an average level of DNA methylation across several cytosines within a reference contig. However, this model detects the dependency of epigenetic variation on genetic variation at the location of the DNA methylation (i.e., it only considers the variation within the ∼ 270 bp of a reference sequence). Such cis associations usually decay at relatively short distances (i.e., 200 bp in Arabidopsis thaliana or 1 kb in Arabidopsis lyrata; Hollister et al., 2011), and the model thus captures a good proportion of cis interactions. However, far-cis associations (for example an insertion variant which is close to, but not represented in the reference sequence) or trans dependencies (effects from loci anywhere else in the genome) will remain undetected (sensu van Moorsel et al., 2019; Mounger et al., 2021b). As a result, this model might overestimate the proportion of epigenetic variation which is unlinked to genetic variation.
We also analyzed variation in methylation at each individual cytosine with a linear model in R with the package DSS version 2.24.0 (Park and Wu, 2016) with a single factor summarizing population and habitat as separate levels (i.e., subpopulations) and using contrasts to compare levels of interest following the method for RNA-Seq in Schmid (2017) and the testing procedure in Schmid et al. (2018a). We compared groups using linear contrasts. We adjusted p-values for each contrast for multiple testing to reflect FDR. A cytosine was defined as differentially methylated (“DMC”) if the FDR was below 0.01 for any of the contrasts [see also Schmid et al. (2018b)].
We compared phenotypic distance to genetic, epigenetic, and environmental distances using multiple MMRR adapted from Herrera et al. (2017). We created pairwise distance matrices for phenotypic [stem height (cm), number of leaves per stem, number of live and dead stems per quadrat] and environmental (soil salinity, temperature, oxygen, number of snails present, percent soil moisture, percent organic matter, respiration rate, soil extractable NH4+, soil extractable NO3–, porewater NH4+, porewater NO3–, microbial biomass C, and microbial biomass N) distances between subpopulations (population × habitat combinations) with function as.matrix in the R environment (R Core Team, 2020). We scaled and centered the phenotypic and environmental matrices using Euclidean distance (Herrera et al., 2017). We assessed the correlation between phenotypic and environmental distances using a Mantel test conducted in R with the package vegan as above (Oksanen et al., 2020). We regressed standardized genetic, epigenetic, and environmental distance matrices on the phenotypic distance matrix using the MMRR function in R as described in Wang and Bradburd (2014) and Herrera et al. (2017). We standardized each matrix to mean = 0 and SD = 1 to compare relative magnitude of effects of the predictor matrices. We ran this analysis on the full data set, subsetted by habitat, subsetted by population and subsetted by subpopulation to explore the patterns in more detail. For each subset, we restandardized the data.
Our de novo reference creation resulted in 183,319 fragments with a total length of 33,193,750 bp. About 10% of the fragments overlapped with functional proteins, while nearly 24% overlapped with repeats (1.94%) and transposons (21.72%; Supplementary Table 1). After filtering poorly covered loci and samples, we retained data for 211 out of 293 sequenced samples. We found 12,187 of the 183,319 fragments contained 414,449 SNPs before filtering for MAF <1%. After removing loci with MAF <1%, 9,429 fragments remained with 68,317 SNPs. For DNA methylation, we found 15,463 fragments with 512,559 cytosines with sufficient coverage.
We estimated the proportion of polymorphic loci in this collection of plants to be 6.6% based on the number of fragments that contained SNPs before the MAF filter. This dropped to 5.1% after we removed the loci with MAF <1%. With this filter, the number of SNPs/kb of sequence dropped from 5.5 to 2.1. Mean allelic richness averaged 1.37 for subpopulations (population × habitat combinations; Table 1). We observed gene diversity with values per locus ranging between 0.050 and 0.054 and heterozygosity between 0.062 and 0.072 (Table 1). Overall genetic diversity (Ht) across subpopulations was very similar, i.e., 0.0521 (Supplementary Table 2).
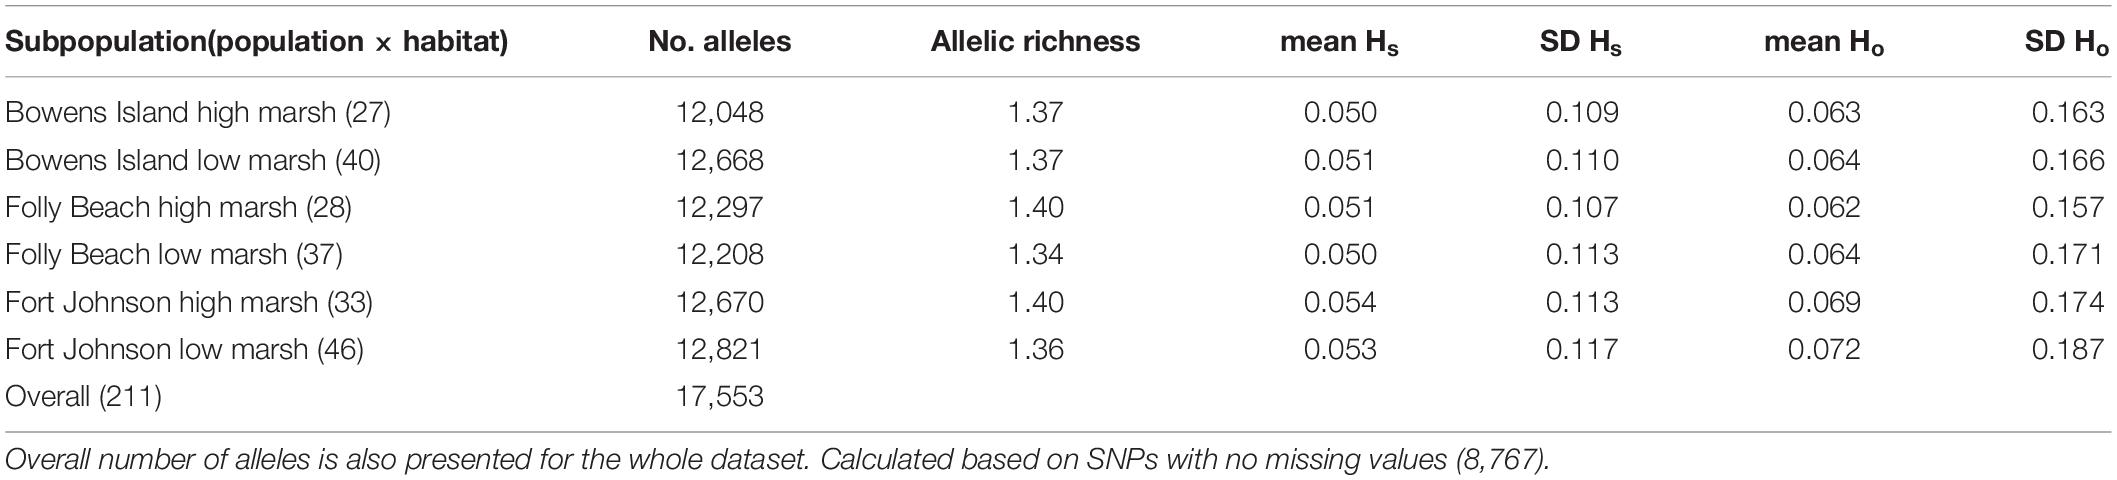
Table 1. Number of alleles, allelic richness (i.e., average number of alleles per locus) and mean and standard deviation (SD) of observed gene diversity (Hs) and observed heterozygosity (Ho) per locus for each population.
Each of our three methods to examine genetic structure provided evidence of significant genetic differentiation within and among populations of S. alterniflora. With PERMANOVA, we found that all effects in the model explained a significant (at FDR < 0.01) proportion of the genetic variation: population of origin explained 8.6%, habitat explained 0.9% and the interaction of population and habitat explained an additional 2.9%. Similarly, the RDA (Table 2) showed that population alone explained 6.4% of the genetic variation, while the addition of habitat and the interaction term added an additional 2.1% explanatory power (R2 = 8.5; FDR = 0.0001).
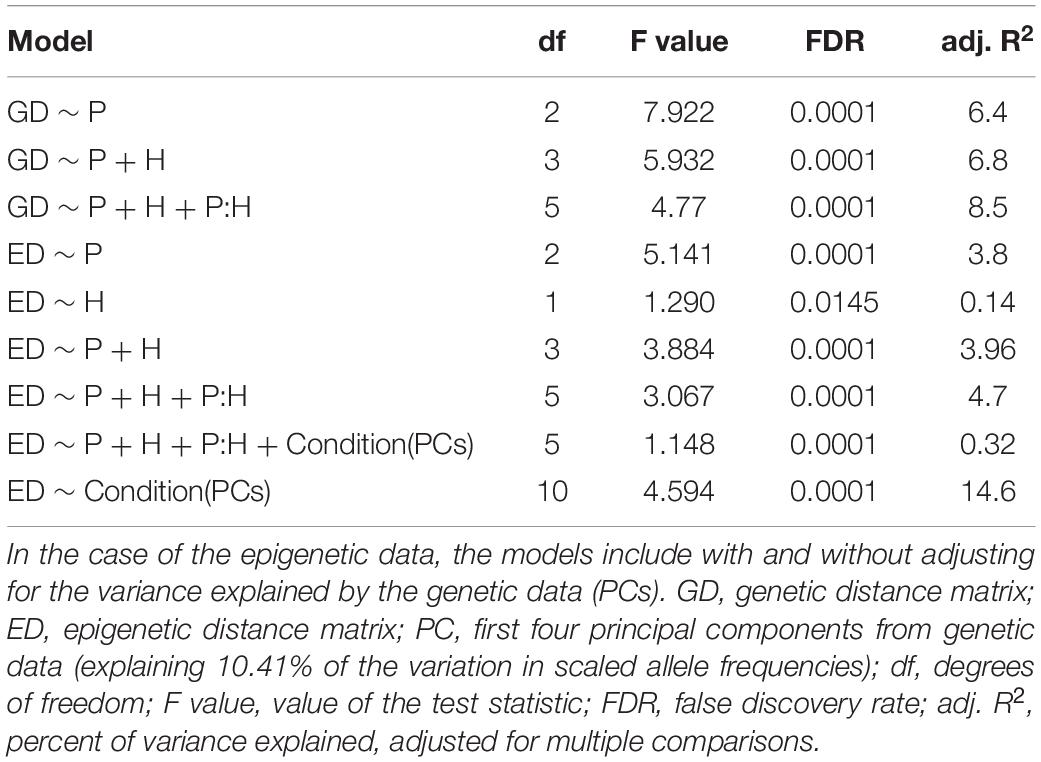
Table 2. Results of the distance-based redundancy analysis (dbRDA) showing the percentage of genetic and epigenetic variance explained by population (P), habitat (H), and/or their interaction (P:H).
Overall FST was low (0.026 across the 3 populations or 0.030 across the 6 subpopulations). Pairwise comparisons of the three populations ranged from (FST = 0.0187–0.0301; Figure 3A). Pairwise comparisons of the six subpopulations ranged from (FST = 0.0035–0.0565). Comparisons across subpopulations within the high marsh habitats revealed comparatively low FST ranging from 0.0035 between Bowens Island and Folly Beach and 0.0209 between Fort Johnson and Bowens Island (Figure 3B). On the other hand, comparisons among the low marsh habitats revealed on average more differentiation (FST = 0.0455–0.0565), particularly between Folly Beach and Fort Johnson (FST = 0.0565; Figure 3B).
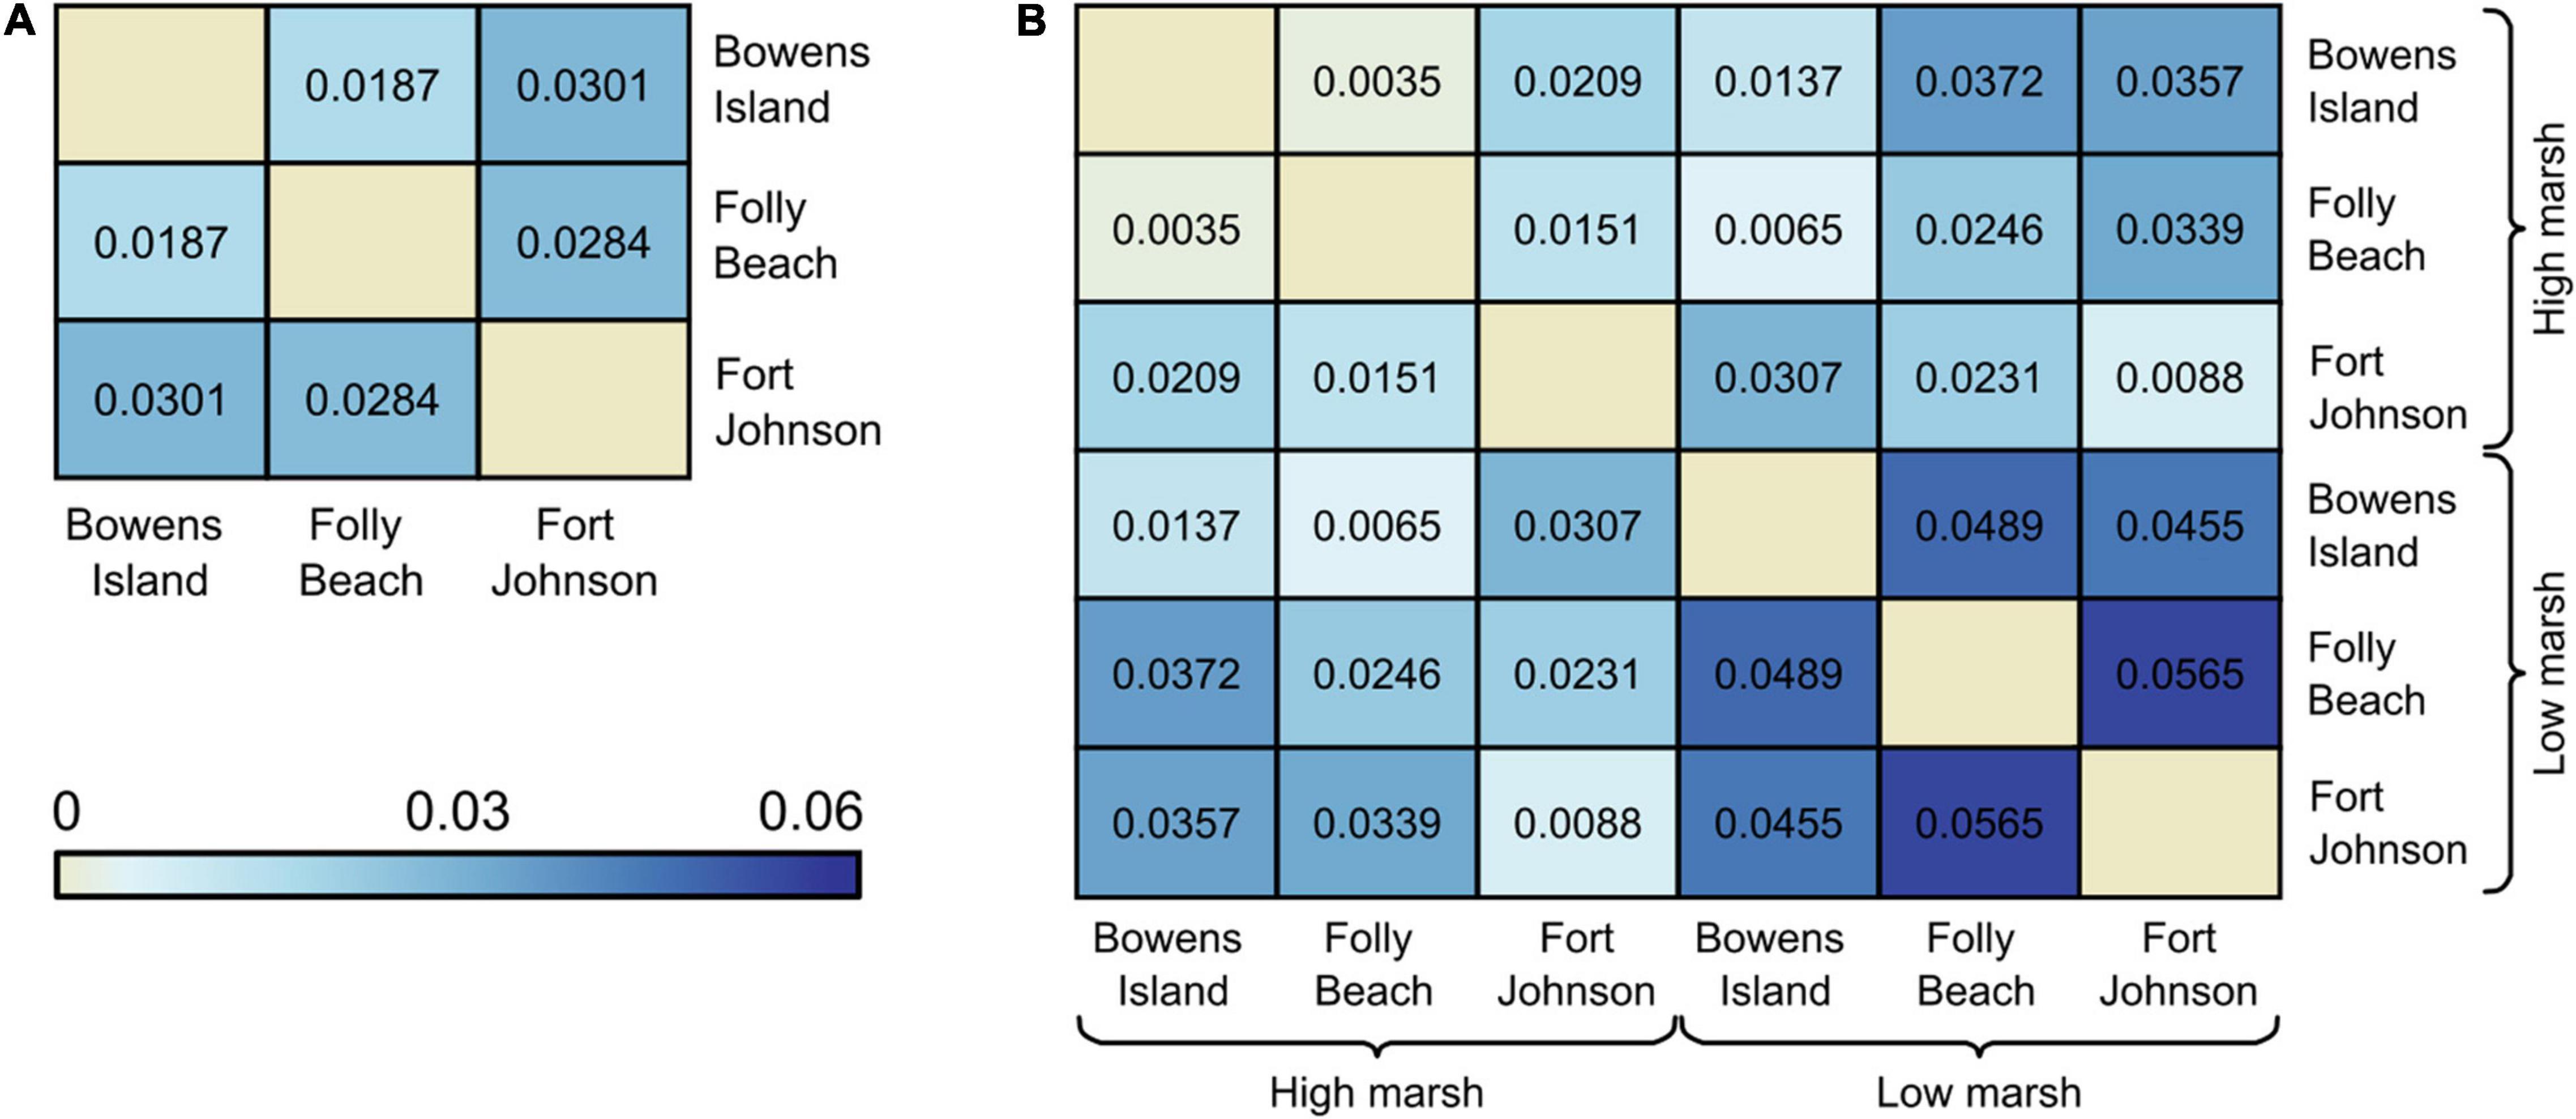
Figure 3. Pairwise FST values (A) among field populations of Spartina alterniflora, and (B) between habitats (low marsh and high marsh) within populations. All values were significantly genetically differentiated pairs based on 95% CI.
We visualized the genetic data by means of PCA using the complete SNP dataset as well as the 5% most differentiated SNPs. This visualization suggested that there was a separation among populations, and partial separation of habitat within populations with the 5% most differentiated loci (Figure 4).
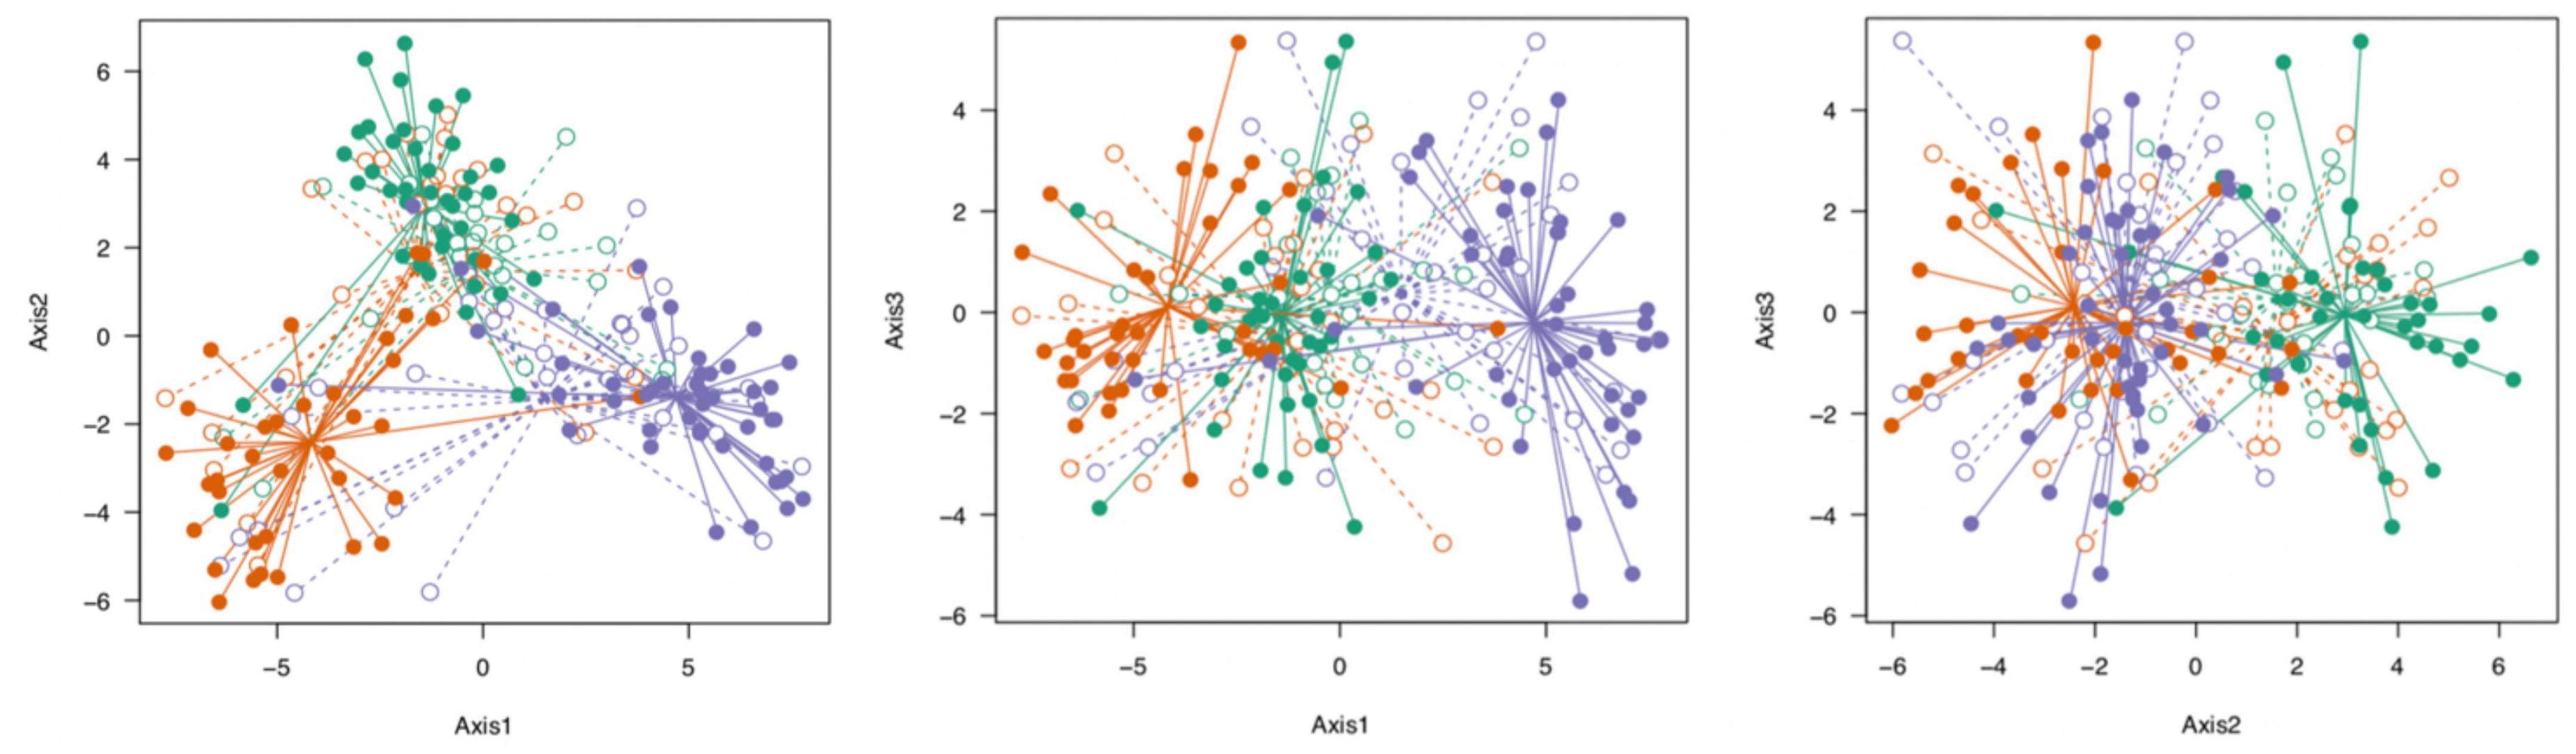
Figure 4. Visualization of the genetic structure of S. alterniflora populations by PCA (PC1 explains 16.5% of the variation, PC2 explains 8%, and PC3 explains 4.6%). We used only the top 5% most differentiated SNPs based on Jost’s D (Jost, 2008), and only SNPs without missing values (N = 80). Each dot represents one stem; populations are indicated by color (Green = Bowens Island, Red = Folly Beach, Blue = Fort Johnson) and habitats are filled (low marsh plants) or open (high marsh plants). See also Supplementary Figure 2 for similar depiction of epigenetic structure of populations.
The maximum likelihood phylogeny generally showed three major genotype clusters that roughly correspond to each of the three sites (Folly Beach, Fort Johnson, and Bowens Island; Figure 5). These genotype clusters were not reciprocally monophyletic clades, indicating that sites have a mixture of the three clusters. It also appeared that genotypes were well mixed between habitats within sites.
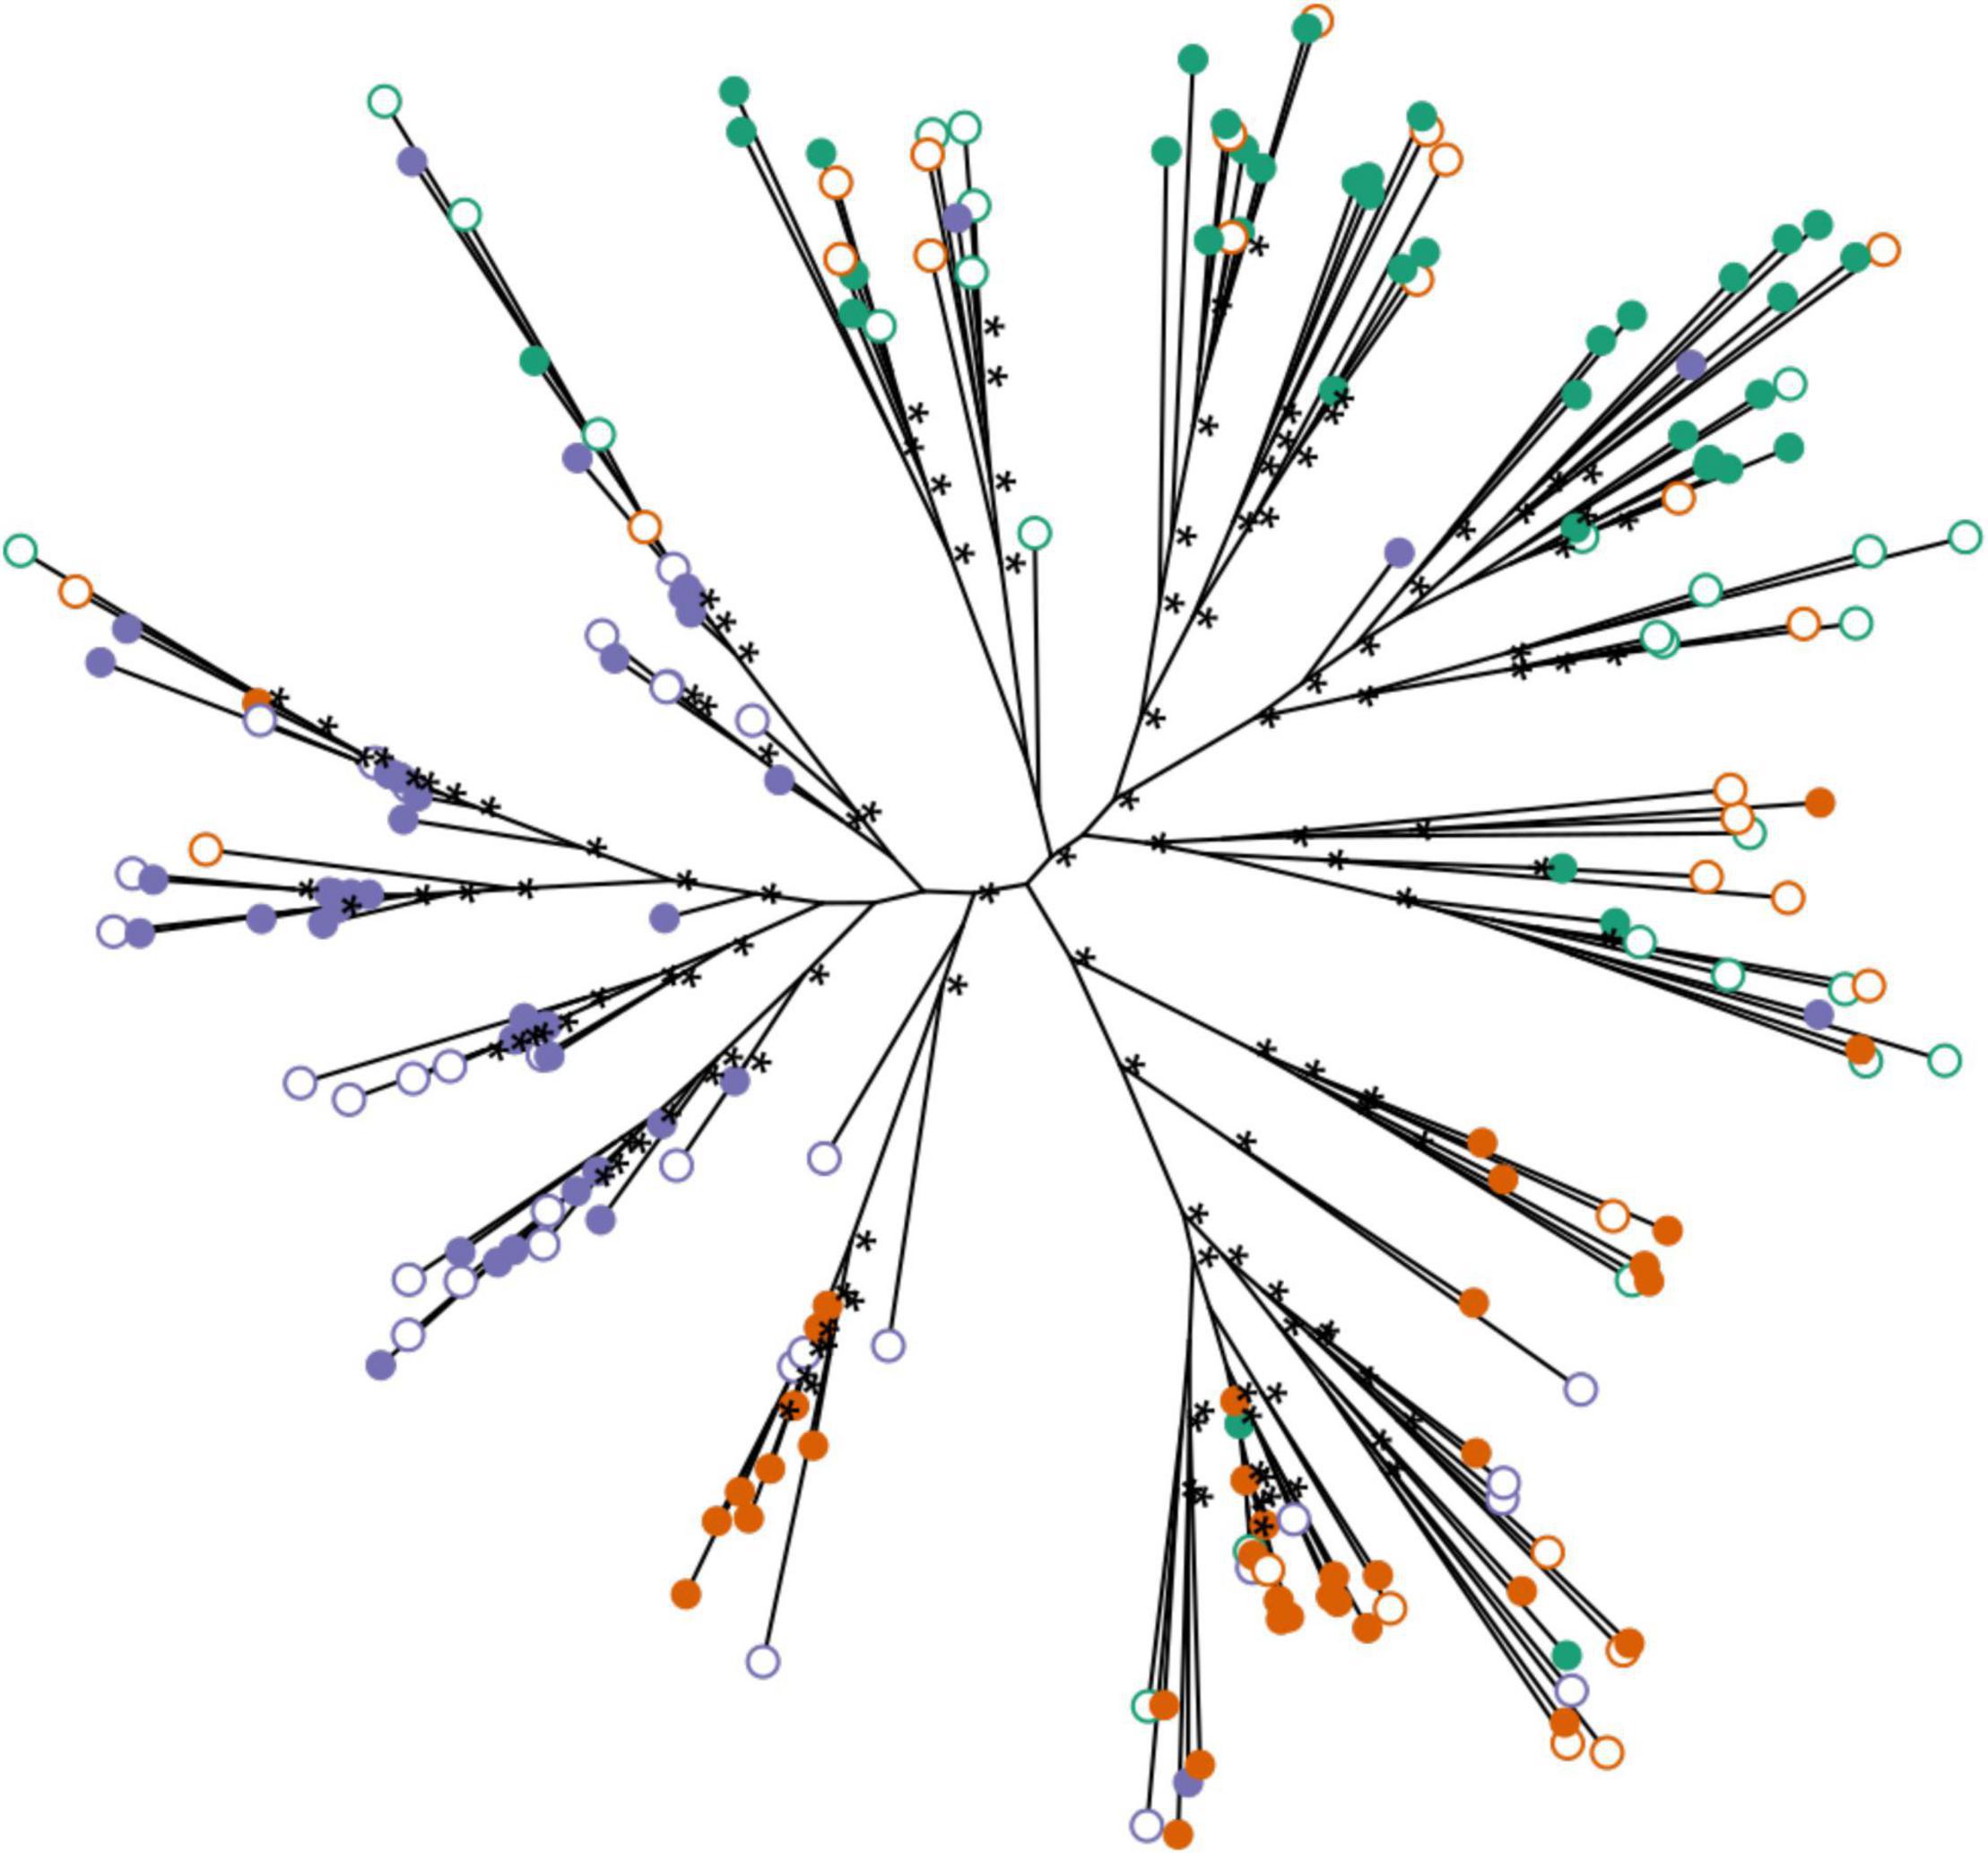
Figure 5. Unrooted phylogenetic tree of S. alterniflora populations by maximum likelihood based on all SNPs filtered for MAF > 10% and no missing data. Each dot represents one stem; populations are indicated by color (Green = Bowens Island, Red = Folly Beach, Blue = Fort Johnson) and habitats are filled (low marsh plants) or open (high marsh plants). Asterisks indicate maximum likelihood support with bootstrap values greater than 95%.
We found that DNA methylation across all contexts averaged 11.8% for all subpopulations, while DNA methylation levels in CG, CHG and CHH contexts averaged 53.3, 28.7, and 4.4%, respectively, for all subpopulations in the dataset (Table 3). We also found that about half of the cytosines were fixed for no methylation (50.1% across all contexts for all subpopulations, ranging between 36.8 and 60.6% within subpopulations; Table 3). A substantially smaller proportion of cytosines were fixed for full methylation (1.4% across all contexts for all subpopulations, with a range of 0.5–2% within subpopulations; Table 3).
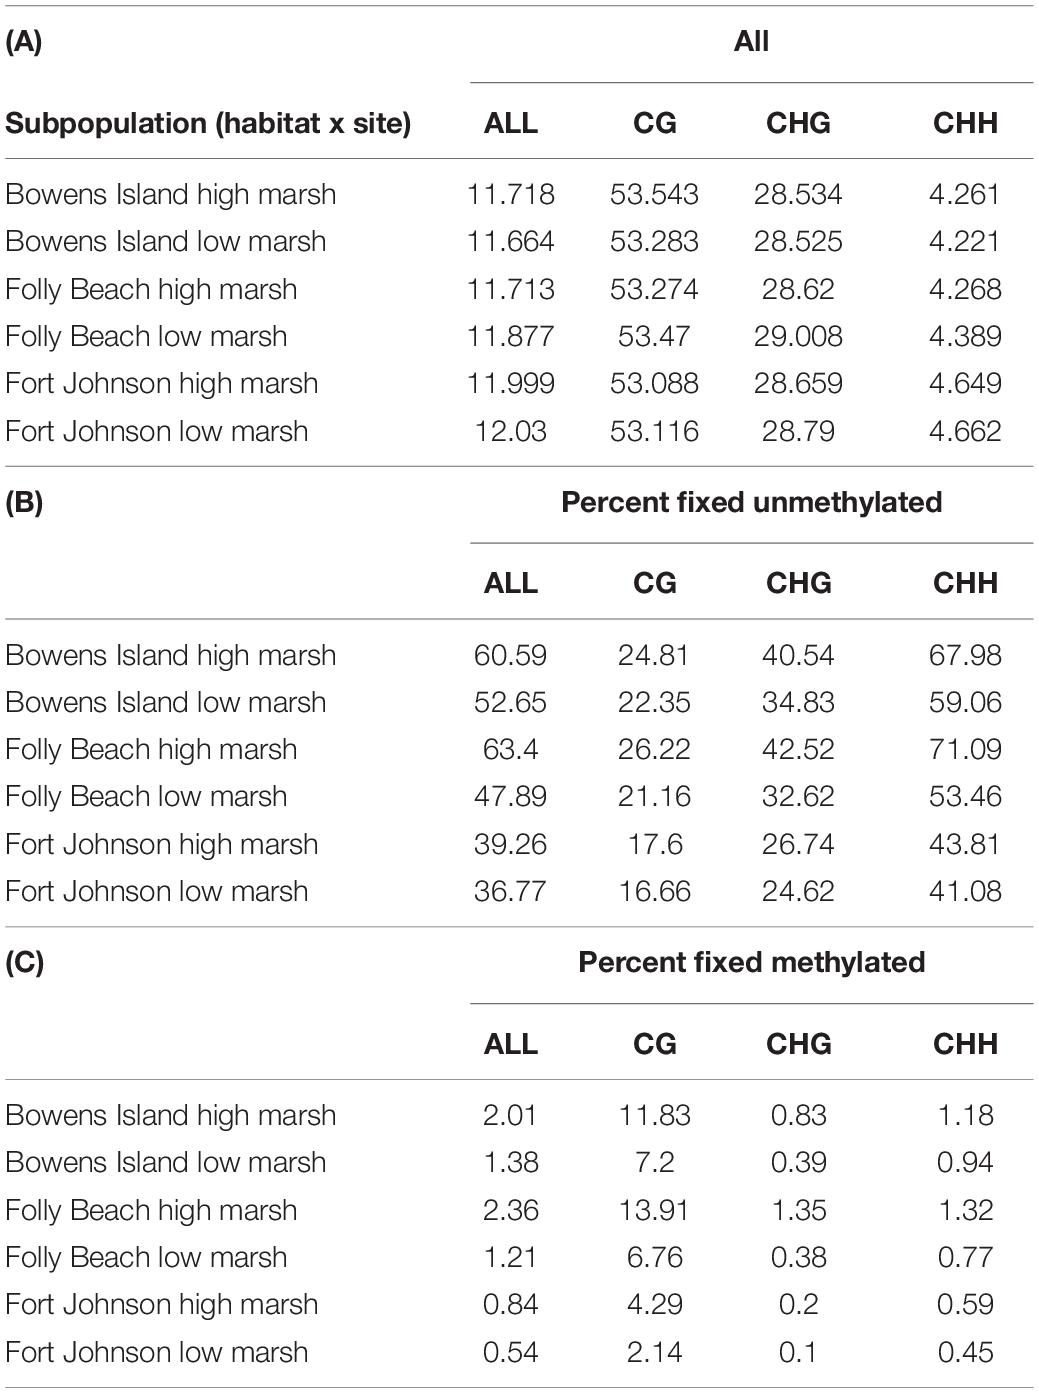
Table 3. Proportions of (A) methylated cytosines per context and for all contexts, (B) fixed cytosine positions for no methylation, and (C) fixed cytosine positions for methylation.
Using average distances from each sample to its subpopulation centroid, we estimated that epigenetic variation ranged between 0.08 and 0.10 (Figure 6). For comparison, the average distances to centroid estimated with the genetic data were between 0.015 and 0.020. The test for homogeneity of multivariate dispersions was highly significant (F = 9.04, p < 0.001), suggesting differences in epigenetic diversity among subpopulations.
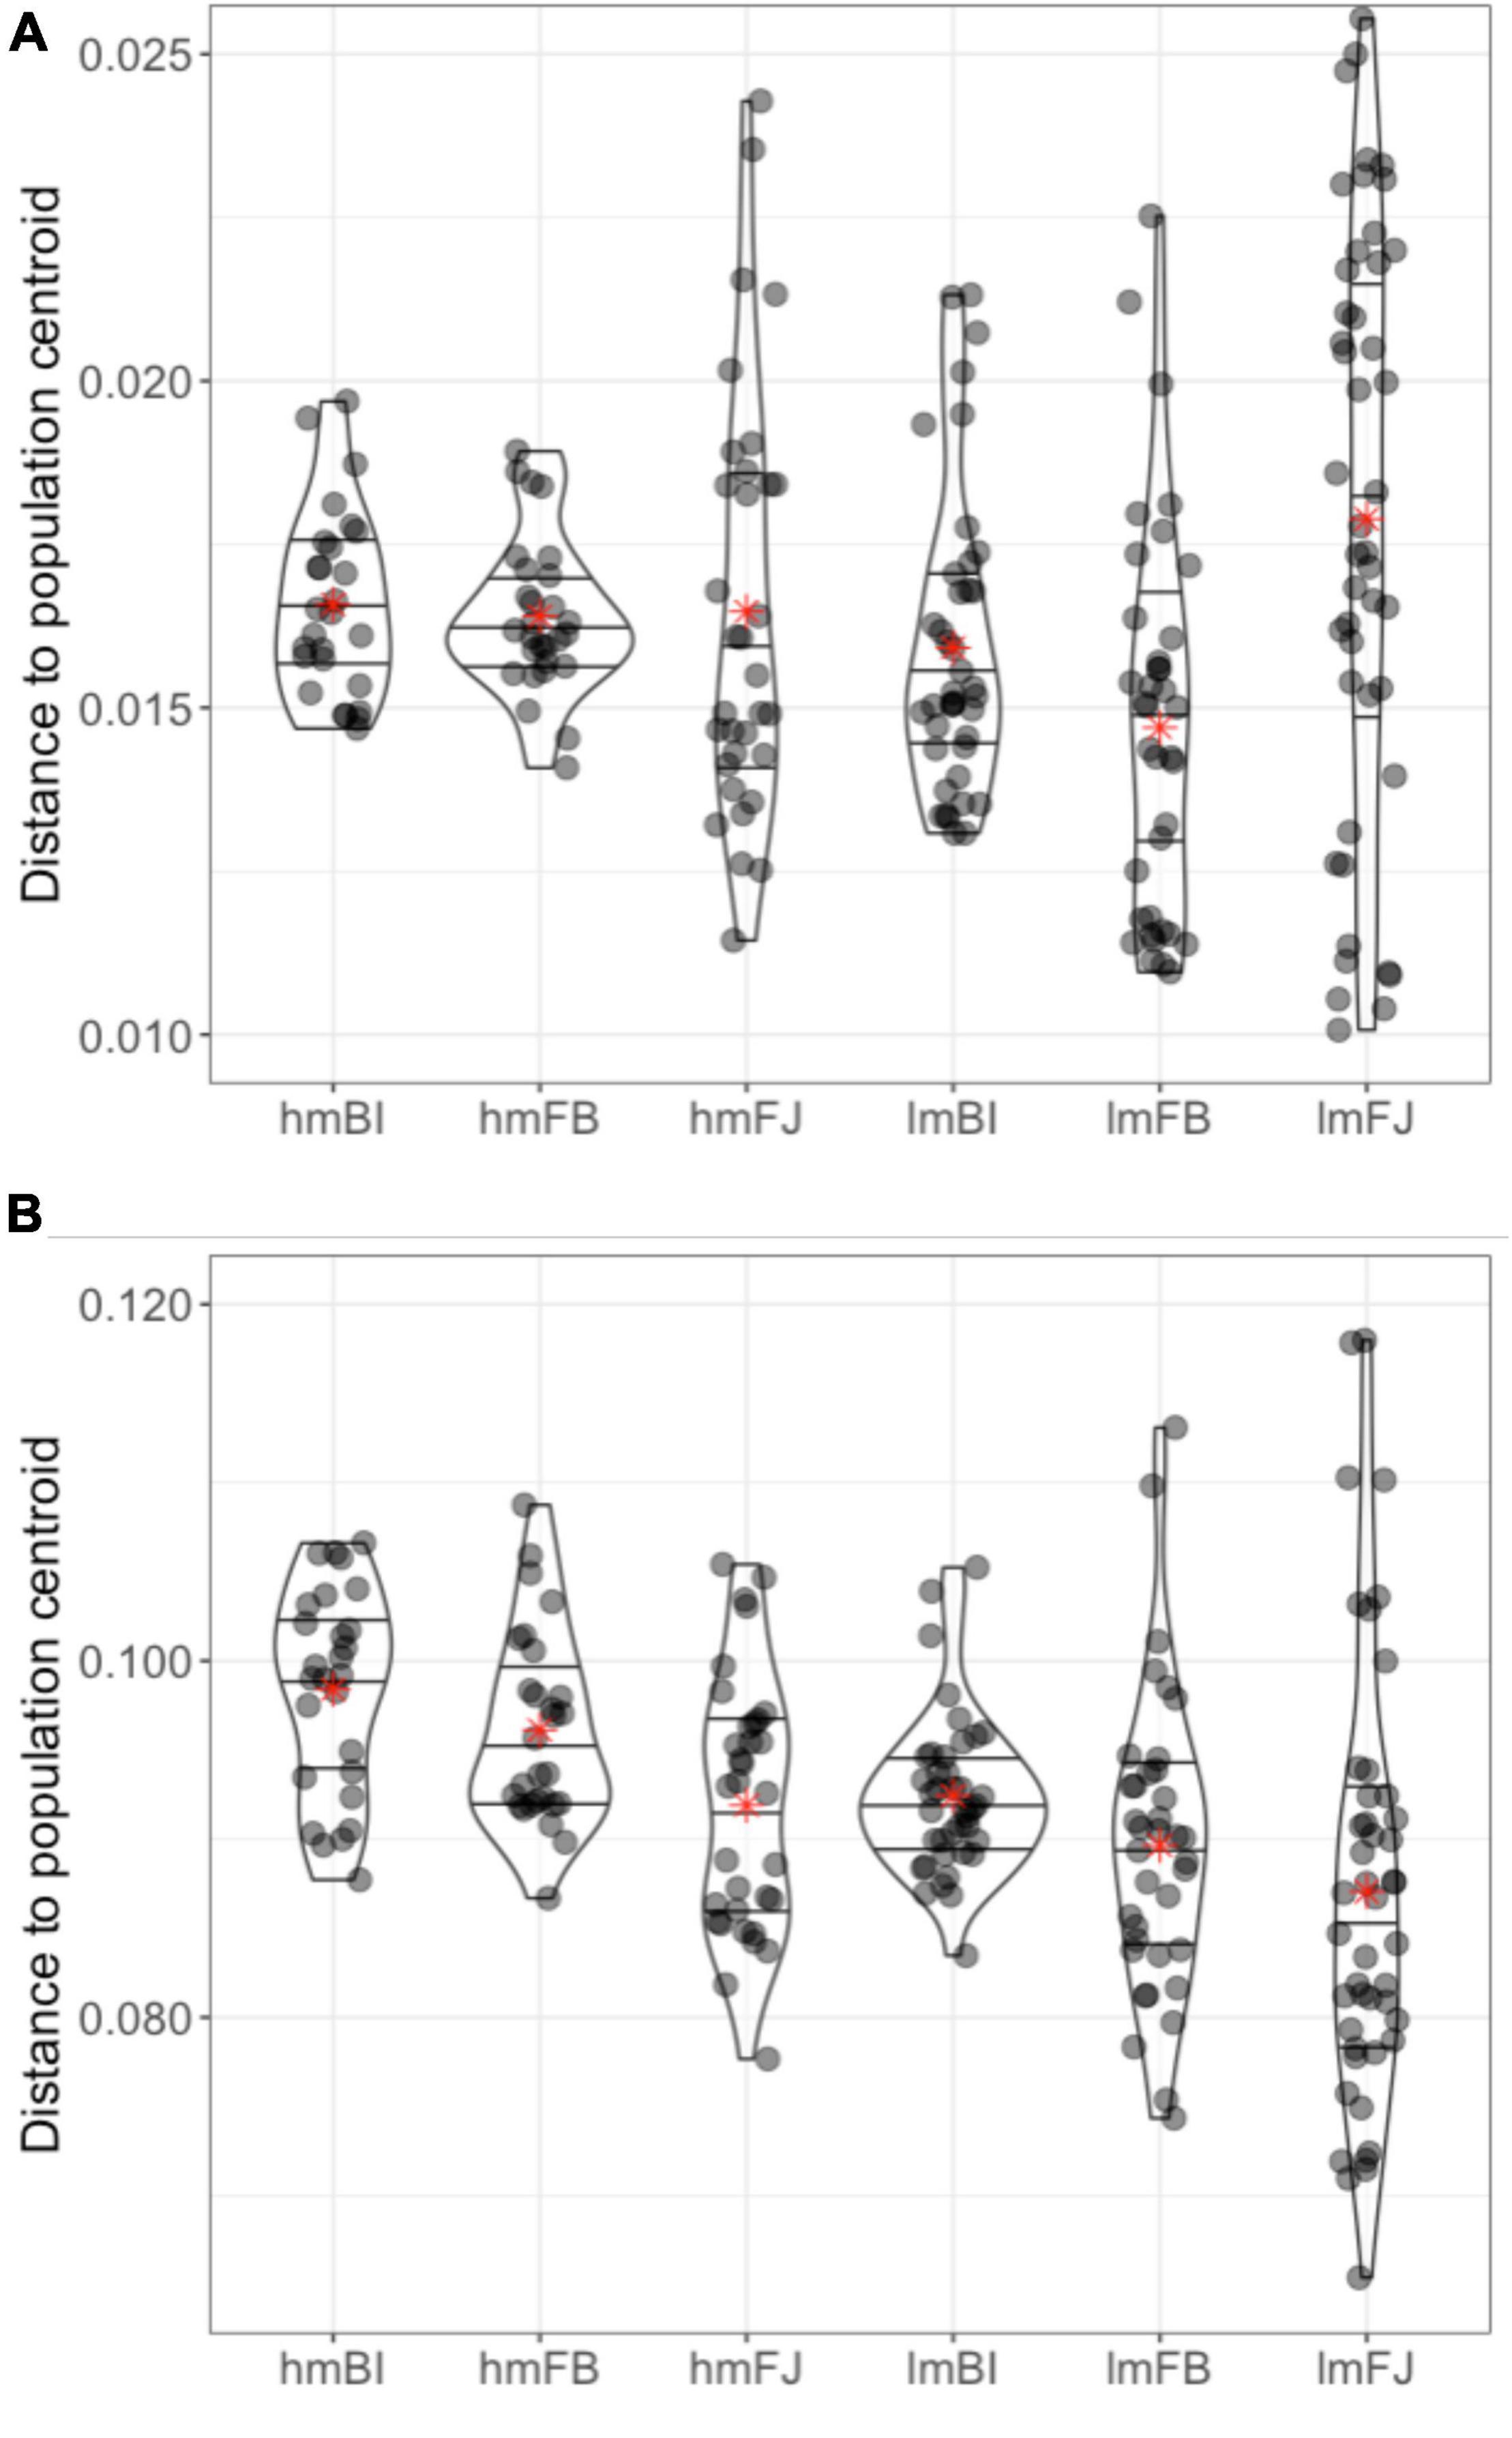
Figure 6. Distance from each individual sample to its corresponding subpopulation centroid calculated using (A) genetic distance matrices and (B) epigenetic distance matrices for subpopulations (site × habitat). Lines within the violin plots represent the 25, 50, and 75% quartiles of the distribution and red asterisks denote the average distance to centroid for each subpopulation. Subpopulations are as follows: high and low marsh Bowens Island (hmBI, lmBI), Folly Beach (hmFB, lmFB), and Fort Johnson (hmFJ, lmFJ).
With PERMANOVA, we found that population of origin explained a significant component of the overall epigenetic variance (3.2%; FDR < 0.0001). In addition, we found that a small but significant amount of epigenetic variance (0.6%; FDR = 0.006) was explained by habitat. The interaction of population and habitat explained an additional 1.4% (FDR = 0.0001) of the epigenetic variance. We found similar results in each of the cytosine contexts. Population explained 2.6–4.6% of the epigenetic variation within each of the CG, CHG and CHH contexts (FDR < 0.0001 for all). Habitat explained 0.6–0.7% for each context (FDR < 0.01). The interaction explained 1–2% for each context (FDR < 0.01). The RDA results were similar (Table 2): population alone explains 3.8% (FDR = 0.0001) of the epigenetic variation while the addition of habitat and the interaction term explains an additional 0.9% (R2 = 4.7; FDR = 0.0001).
Using dbRDA we discovered that PCs of genetic data alone explained more of the variation in epigenetic distances than any other model (Table 2). In addition, we found that when conditioned on PCs of the genetic data, the partial constrained dbRDA only explained less than 1% of the variation (Table 2).
The genotype of the reference sequence explained much of the epigenetic diversity in close-cis even when fitted last (i.e., 28.5% for genotype and 23.5% for genotype x context; Table 4). However, among populations we found that epigenetic variation was different in around 9.2% of 8,960 tested fragments (of the 9,429 only 8,960 intersect with those that have methylation data), even after accounting for differences in DNA sequence of the underlying loci. Habitat only explained variation in < 1% of the cytosines when evaluated across populations, however, the interaction between populations and habitats explained variation in 2% of the cytosines when fitted last, but nearly 7% of the cytosines when fitted before genotype.
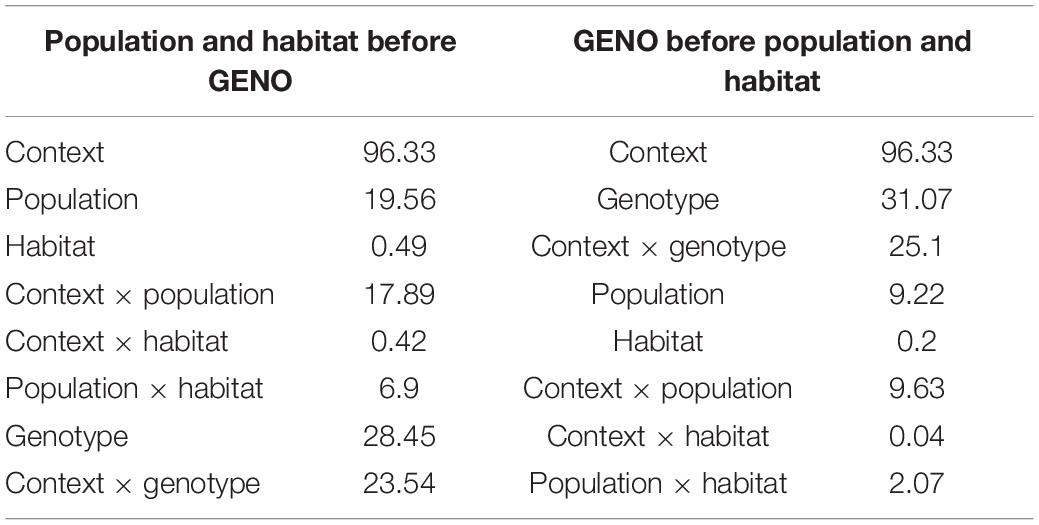
Table 4. Anova (type I) models of amount (%) of variation in methylation explained by population, habitat, and sequence context before (left) and after (right) accounting for genotype effects on methylation using MAF-filtered data only (8,960 contigs).
The pairwise comparison of differential methylation at individual cytosines yielded between 0.02 and 6.1% significantly differentially methylated cytosines (Table 5). We found that the most pronounced differences were between Bowens Island vs. Fort Johnson (6.1% significant Cs) and in the comparison of low marsh plants in these two populations (3.99%) which contrasted with the comparison of the high marsh plants (0.95%). We found little support for differences between habitats at any level (≤0.5% significant Cs). Most of the SMPs were located in unannotated portions of the genome (63.0% on average among pairwise comparisons) or in TEs (24.1%). A few SMPs were located in genes and other repeats (on average, 16.6 and 2.9% respectively). Although most cytosines in our libraries were in the CHH context (78% in CHH compared to 8% in CG and 14% in CHG), the number of SMPs tended to be higher in the CG context (22, 17, and 60% in CG, CHG, and CHH, respectively).
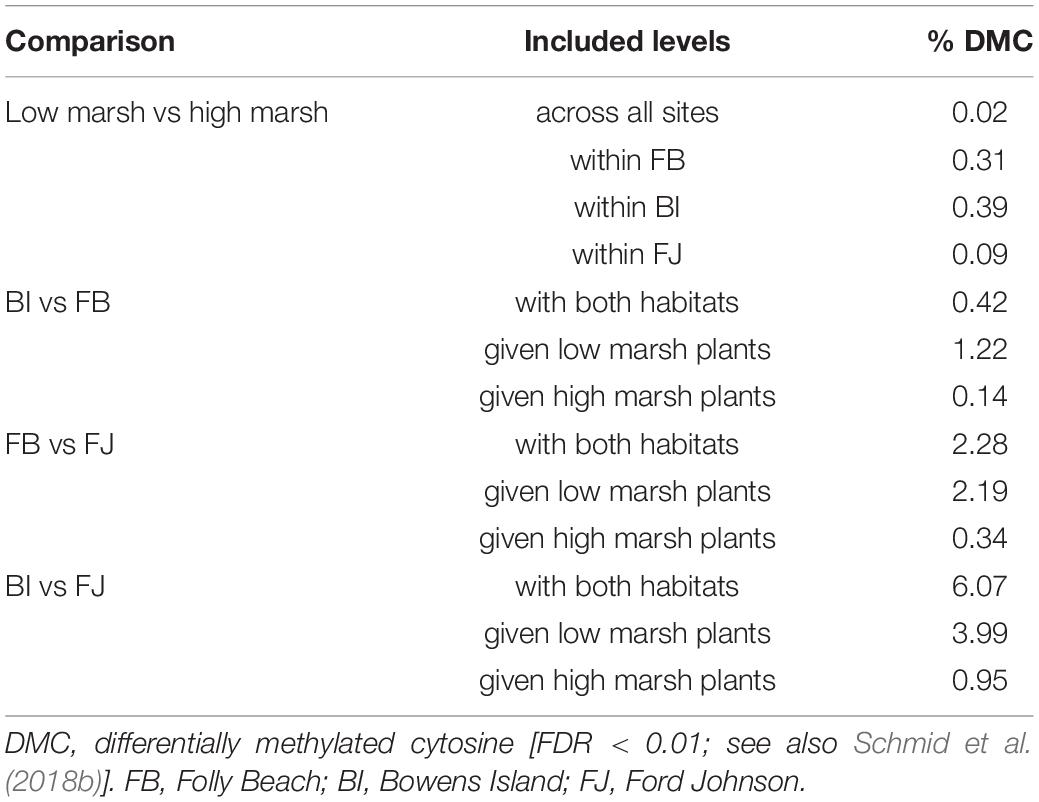
Table 5. Summary of results of linear contrasts to evaluate variation in methylation at each individual cytosine with the package DSS (version 2.24.0; Park and Wu, 2016).
In the MMRR analysis, the overall regression explained about 8.4% of the variation in phenotypic distance (p-value = 0.001; Table 6A). Genetic, epigenetic and environmental distances each explained a significant proportion of the variance in phenotypic distances (p-values ranged between 0.001 and 0.036). The standardized regression coefficients suggested that epigenetic and environmental distance matrices were stronger predictors of the variation in the phenotypic matrix than the genetic matrix. Subsetting the plants by habitat revealed similar, slightly stronger patterns in the high marsh plants, but none of the relationships held in the low marsh plants alone (Table 6B). By population, we found divergent patterns from no significant relationship for the overall model in Folly Beach plants, to the model that explained the most variation (R2 = 0.312) in Fort Johnson plants (Table 6C. In this population, genetic distance explained more of the variation than environmental variation did, while epigenetic distance did not explain variation in phenotypic distance. Looking at each of the subpopulations separately, genetic, epigenetic and environmental distance were often not significantly associated with phenotypic distance (Table 6D).
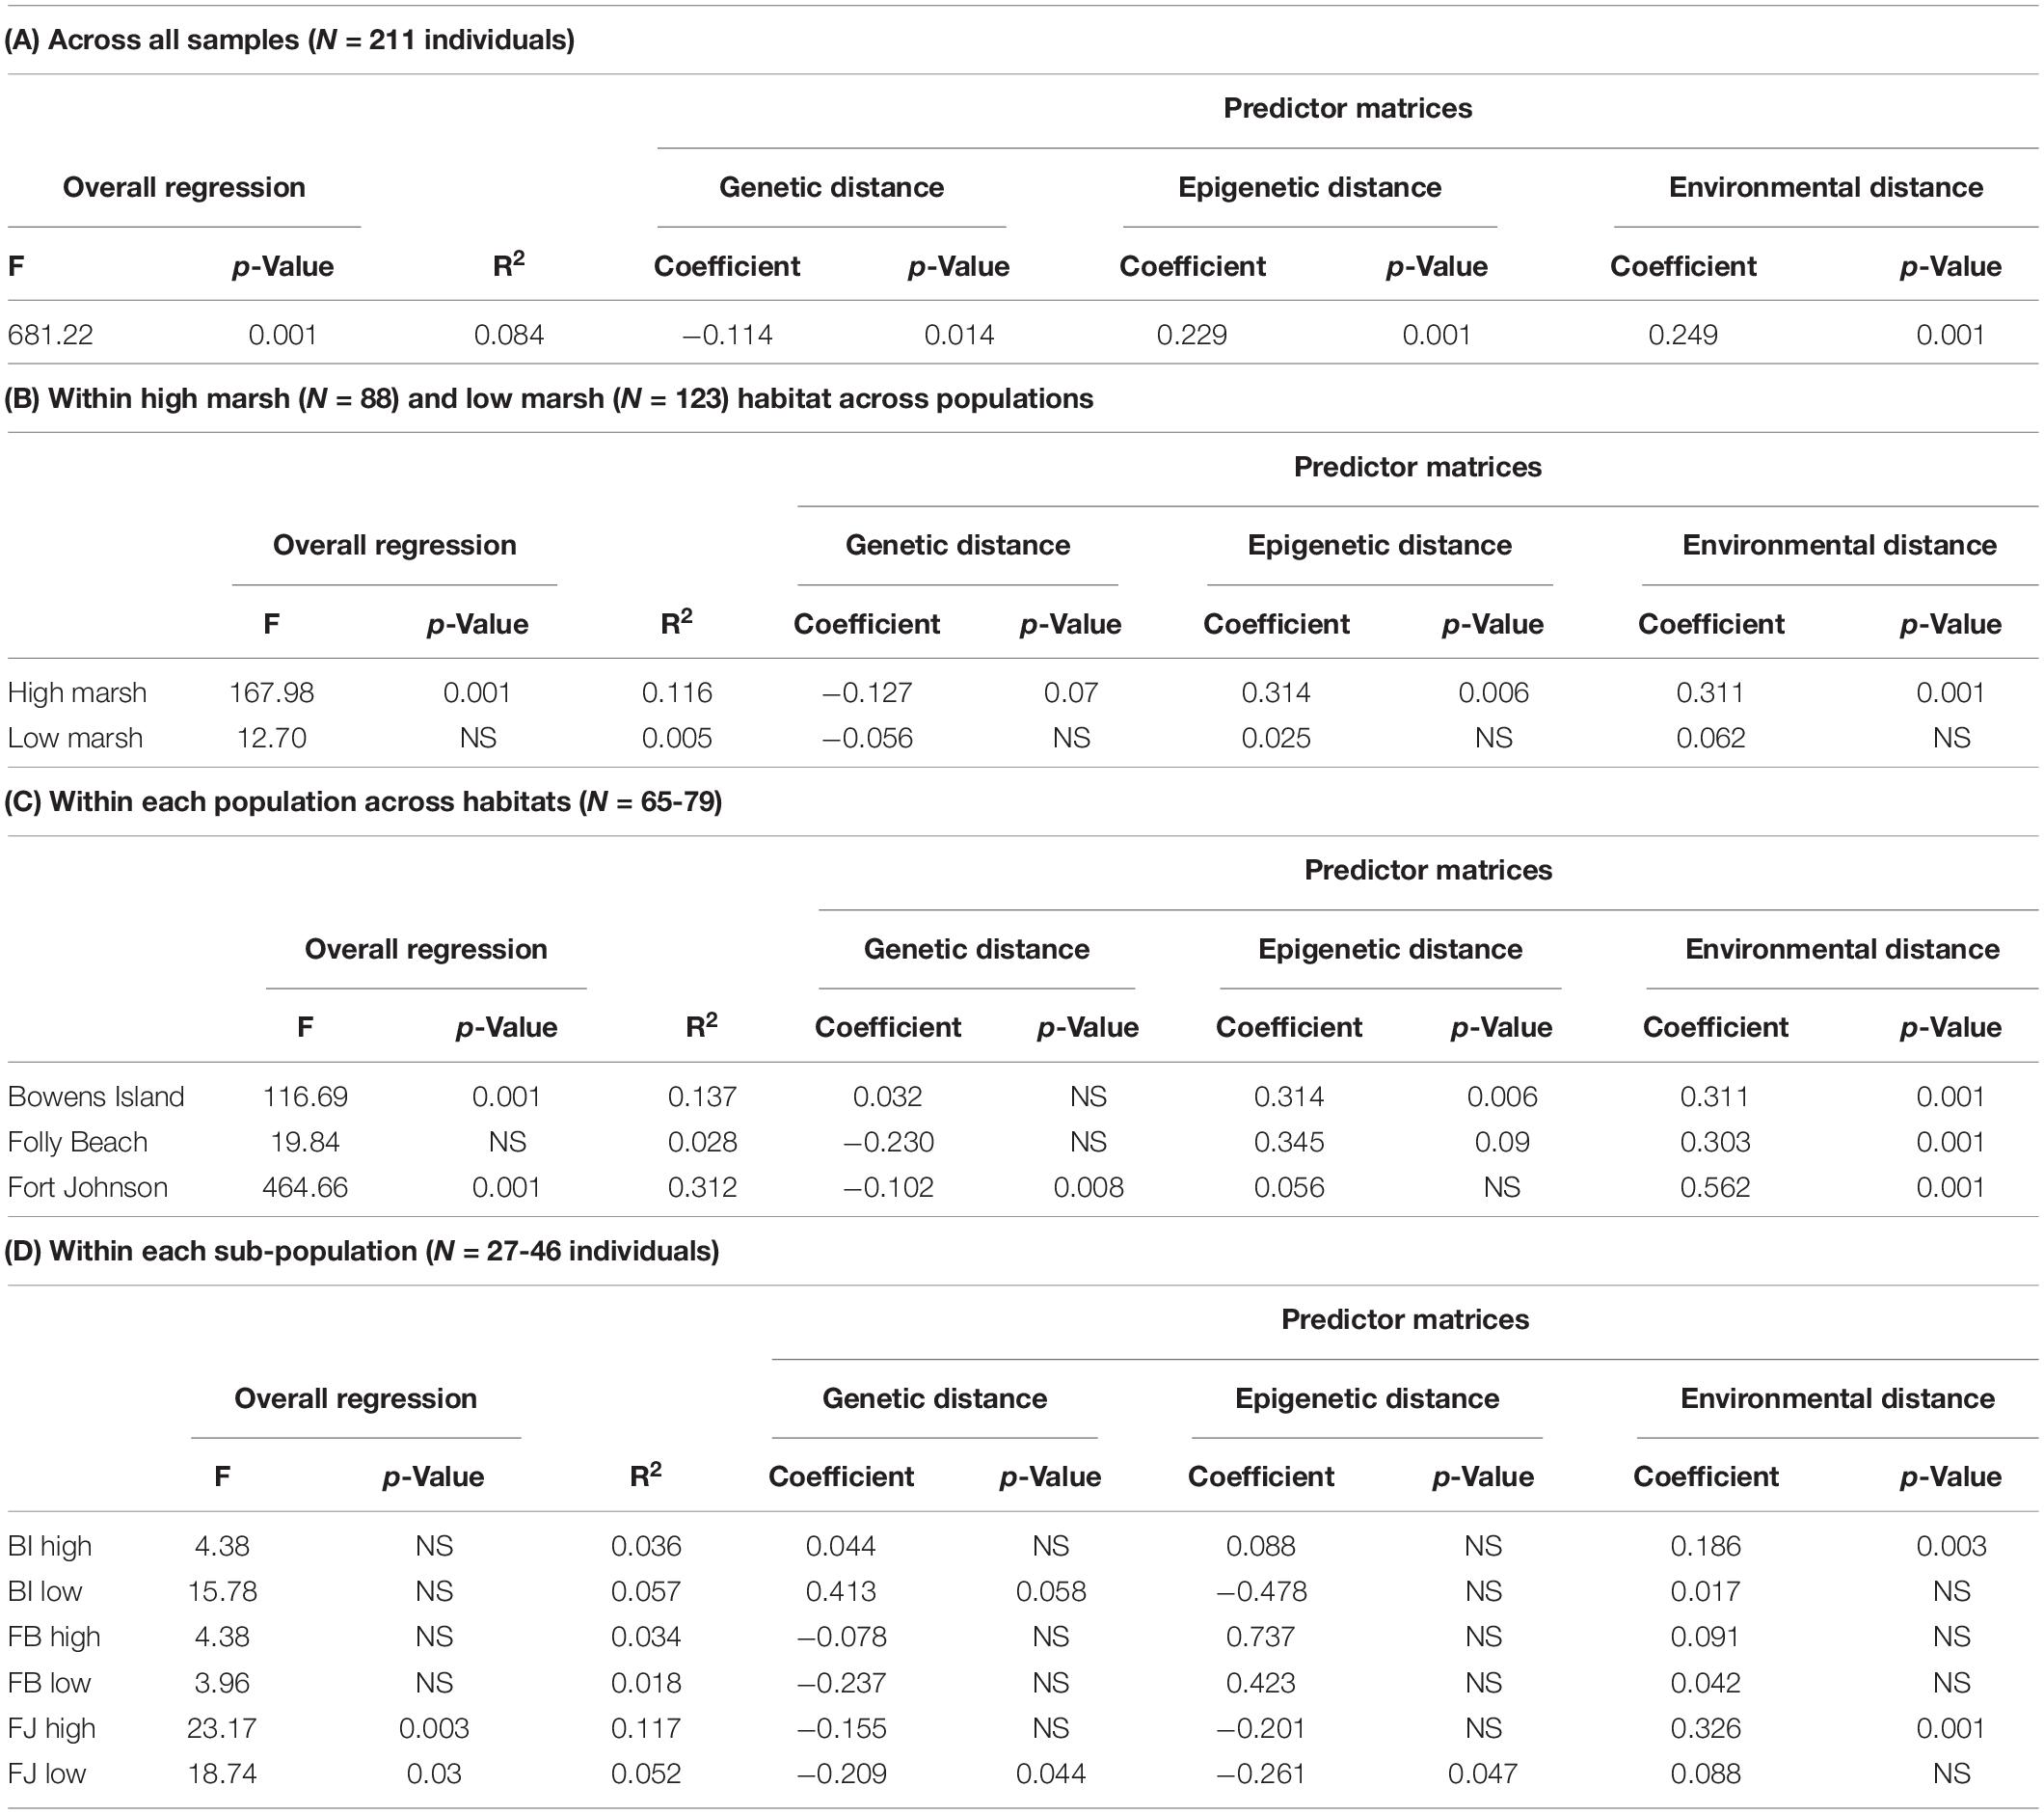
Table 6. Results of multiple matrix regression with randomization (MMRR) analysis relating the combined phenotypic distance matrix across all S. alterniflora samples with the matrices of genetic (SNP), epigenetic (SMPs), and environmental distances for (A) across all samples, (B) within each habitat type across populations, (C) within each population across habitats and (D) for each subpopulation. NS indicates p value > 0.10.
Several studies have shown that epigenetic changes can be induced by environmental variation and can be partially independent of underlying genetic variation, but very few have linked these patterns with phenotypic variation (Herrera et al., 2017; Wang et al., 2020). We addressed these questions with natural populations of S. alterniflora, a species known to have high genetic diversity and to vary dramatically in traits along a steep environmental gradient. We predicted that DNA sequence variation and epigenetic variation would be explained by source population and habitat (low and high marsh). Moreover, we expected that DNA methylation patterns would be more strongly associated with habitat since the same epigenetic modifications might be induced across genetic backgrounds in response to environmental conditions. Accordingly, we predicted that epigenetic and environmental differences would associate with variation in phenotypic traits, even after accounting for genetic differences. We found that populations, habitats and the interaction of populations and habitats explained variation in both genetic and epigenetic variation. However, these models, and the habitat effect, were better able to explain variation in DNA sequence than they were variation in DNA methylation. Several lines of evidence support the contention that sequence variation explains most of the variation in DNA methylation genome wide and in close-cis. However, a small percentage of epigenetic variation was explained by habitat or the interaction of population and habitat even after correcting for genetic variation in close-cis. Lastly, we show that epigenetic variation in this system contributes to phenotypic variation even when genetic and environmental distances are accounted for.
Previous work on native populations of S. alterniflora has reported high levels of genetic diversity (Richards et al., 2004; Hughes and Lotterhos, 2014; Foust et al., 2016; Zerebecki et al., 2021). Richards et al. (2004) found high genetic diversity in stands on Sapelo Island, Georgia using allozymes, and these levels of diversity were later confirmed among the same populations using AFLP (Foust et al., 2016). Similarly, Hughes and Lotterhos (2014) found that high genetic diversity persisted even at small spatial scales across marshes in the Florida Panhandle (Hughes and Lotterhos, 2014). Travis et al. (2004) found that genetic diversity among populations along coastal Louisiana varied according to age, with younger populations (<16 years) supporting higher genetic diversity than older, established populations (Travis et al., 2004).
More recently, Zerebecki et al. (2021) found significant genetic differentiation among habitats within our populations of S. alterniflora near Charleston, South Carolina as well as across a much broader geographic range. They showed that the phenotypic divergence in stem height and biomass allocation observed across intertidal gradients was at least partly due to local genetic differentiation (Zerebecki et al., 2021). Further, their reciprocal transplant experiment combined with repeated patterns of molecular differentiation among habitats within individual marshes supported parallel microgeographic adaptation to intertidal gradients in natural populations of S. alterniflora (Zerebecki et al., 2021).
Estimates of heterozygosity and genetic diversity more generally are not easily compared across studies with different sample sizes, different types of molecular markers, and with different filtering approaches (Sunde et al., 2020; Schmidt et al., 2021). In this study on S. alterniflora, we found that Ho was approximately six times and Ht was five times that of Rhizophora mangle from natural populations using similar approaches (Mounger et al., 2021b), confirming previous reports of high genetic diversity in these Charleston populations of S. alterniflora (Zerebecki et al., 2021). Although habitat alone, and in interaction with population explained variation in genetic differences, population was the best predictor of genetic variation. In both RDA and PERMANOVA, habitat added very little explanatory power, except through the interaction with population. This result provides some insight into our previous work that examined the association between phenotypic variation and edaphic factors (Voors, 2018). In that study, habitat explained a large portion of the variation in plant traits, but not in soil characteristics. The patterns in genetic marker diversity could reflect that the environmental differences between high-marsh and low-marsh habitats are not consistent among populations (i.e., among sites). Thus, different environmental conditions could be driving divergent genetic patterns between the two habitats, but not necessarily in the same way at the various populations, leading to population-by-habitat interactions.
We were able to visualize a clear differentiation between populations of origin when the 5% most differentiated loci were compared in a PCA. The most obvious difference was the separation of Fort Johnson. This differentiation was also supported by the pairwise FST analyses where the highest values were comparisons between Fort Johnson and the other populations, particularly in the low marsh. The Fort Johnson population of S. alterniflora is situated within Charleston Harbor, while Bowens Island and Folly Beach populations are geographically closer together, connected by the Folly River and situated along less intensely developed tidal creeks to the south of the main shipping harbor. Genetic differentiation at Fort Johnson relative to the other two populations may in part be driven by geographical distance (Herrera et al., 2017; Wang et al., 2020; Mounger et al., 2021b), population age (Travis et al., 2004), cryptic environmental variation (Zerebecki et al., 2021), or by anthropogenic impacts such as long-term or historic exposure to urban effluents and industrial pollutants (Robertson et al., 2017). Additional research is required to investigate which of these factors may be driving the genetic differentiation we detected at Fort Johnson. However, we also found support for differences among populations using all SNPs in the phylogenetic tree. More specifically, the tree supported the contention made by Zerebecki et al. (2021) that the differences we found among habitats could have evolved within populations. An alternative hypothesis would be that the high marsh and low marsh habitat at each site was colonized by high marsh and low marsh genotypes that had diverged previously. Additional research is required to investigate which processes may explain the lack of genetic differentiation at Fort Johnson. Our study also supports the possibility of convergent processes particularly in the high marsh which could be contributing to less differentiation among subpopulations in the high marsh than we found among subpopulations in the low marsh.
Although epigenetic variation can be dictated by underlying genetic variation (Becker et al., 2011; Dubin et al., 2015; Sasaki et al., 2019), we found a small but statistically significant amount of epigenetic variation was associated with habitat even after accounting for genetic variation. This finding is important because it supports the theoretical understanding that epigenetic mechanisms may provide an additional source of variation that is distinct from genetic variation in natural populations. Our results suggest that the habitat differences in natural populations of S. alterniflora may correspond to both genetic and epigenetic differentiation, but more fine scale analyses are needed to dissect these relationships. This work supported our previous studies of differences in these molecular mechanisms within this species. For instance, Foust et al. (2016) found that a small percentage of epigenetic variation across sites was associated with similar habitats after accounting for genetic variation. Similarly, a study of response to crude oil exposure found both genetic and epigenetic differentiation between oiled and non-oiled populations in Southern Louisiana following the Deepwater Horizon oil spill (Robertson et al., 2017).
Herrera et al. (2017) compared the genetic, epigenetic, environmental (six habitat features) and phenotypic (20 traits) variation of ten subpopulations of the perennial herb Helleborous foetidus using MMRR. They determined that geographical distance explained genetic differentiation among subpopulations, while environmental distance explained epigenetic differentiation (Herrera et al., 2017; Wang et al., 2020). These results for H. foetidus supported earlier work that showed that epigenetic isolation by environment (IBE) can arise as a consequence of native epigenotypes having higher fitness in a given environment than epigenotypes from a different subpopulation (Wang and Bradburd, 2014; Herrera et al., 2017; Wang et al., 2020).
Following these methods, we used standardized genetic, epigenetic and environmental distance matrices to determine if these variables might explain the phenotypic variation we have observed within habitats or within populations. We found significant relationships between phenotypic distance across our S. alterniflora samples and all three predictor matrices of genetic, epigenetic, and environmental distances. Using standardized distance matrices allowed us to infer that environmental and epigenetic distances each explained more of the phenotypic distance than did genetic distance in the overall collection of plants. However, additional analyses revealed that these relationships varied within habitats and within populations. We found no relationship between these predictors and phenotypic variation in the low marsh plants, but the relationships between epigenetic and phenotypic distance and between environmental and phenotypic distance appeared to be even stronger when evaluating only the high marsh plants. Further work will be required to assess the contribution of these different components to phenotypic variation in the context of complex natural populations and habitats. These results indicate that genetic, epigenetic, and environmental variation contribute to phenotypic response in these plants even when evaluated simultaneously. Considering that we expected most of the phenotypic and environmental differences to occur largely between habitats or among populations, the lack of relationships within separate subpopulations may be the result of limited variance.
The importance of epigenetic mechanisms in ecological contexts is still an open question that is difficult to address (Boquete et al., 2021). This line of inquiry has a variety of constraints. In particular, plant populations with high levels of genetic diversity challenge our ability to clearly distinguish patterns of epigenetic variation (Foust et al., 2016). In addition, the lack of well annotated reference genomes for most plant species greatly limits our ability to make inferences about the functionality of genes or methylation patterns (Boutte et al., 2016; Richards et al., 2017; Paun et al., 2019; Mounger et al., 2021a). Reduced Representation Bisulfite Sequencing (RRBS) methods like epiGBS provide substantially more genome coverage than previous methods such as methylation-sensitive amplified fragment length polymorphism (MS-AFLP or MSAP; Schrey et al., 2013; Richards and Pigliucci, 2020). However, for large polyploid genomes like that of S. alterniflora this approach still only captures a small percentage of the genome (approximately 3%). In addition, polyploidization, or genome doubling, can provide additional sources of molecular variation which thereby contribute to plant responses to environmental conditions, but this phenomenon complicates our ability to analyze and draw conclusions about genomic mechanisms (Dufresne et al., 2014; Robertson et al., 2020; Mounger et al., 2021a). RRBS methods such as epiGBS do not yet provide adequate coverage to confidently estimate polyploid genotype likelihoods (Dufresne et al., 2014; Alvarez et al., 2020; Robertson et al., 2020). Despite these limitations, this work adds to a growing body of evidence that shows that epigenetic differences, particularly variation in DNA methylation, are associated with responses to environmental variation in natural populations. This association is not explained simply by sequence based differences and requires continued investigation.
The datasets presented in this study can be found in the following online repositories: https://zenodo.org/record/5833452, 10.5281/zenodo.5833452; https://www.ncbi.nlm.nih.gov/, PRJNA798549.
CR, AH, and CG conceived the study. CR, AH, CG, and DL designed the experiments. MS, MB, and CR designed the genomics analyses. JM, TH, CR, AH, ES, SV, and MR collected plants from the field. JM, SV, MR, and CW did the epiGBS laboratory work. MS, JM, MB, JO, FG, IG, and KV adapted the epiGBS pipeline for use. MS, JM, IR, MB, and ES analyzed the data. JM, IR, MS, and CR wrote the first draft of the manuscript. All authors provided input and revisions to the manuscript.
This work was supported by funding from the National Science Foundation (United States) DEB-1419960 and IOS-1556820 (CR), IOS-1556738 (AH), IOS-1556087 (CG); the Federal Ministry of Education and Research (BMBF; MOPGA Project ID 306055 to CR); the German Research Foundation (DFG) grant number: 431595342 (CR); the European Union’s Horizon 2020 Research and Innovation Programme under the Marie Skłodowska-Curie grant agreement No 704141-BryOmics (MB).
MS was employed by MWSchmid GmbH.
The remaining authors declare that the research was conducted in the absence of any commercial or financial relationships that could be construed as a potential conflict of interest.
All claims expressed in this article are solely those of the authors and do not necessarily represent those of their affiliated organizations, or those of the publisher, the editors and the reviewers. Any product that may be evaluated in this article, or claim that may be made by its manufacturer, is not guaranteed or endorsed by the publisher.
We thank Stephen Savage for help with the epiGBS laboratory work. We thank the Grice Marine Laboratory at the College of Charleston for providing materials and laboratory space to aid in field collections. We thank Carlos Herrera and Ian Wang for their insights and advice about the MMRR methods. We acknowledge the contribution of the University of South Florida Genomics Program and USF Omics Hub for completion of this project.
The Supplementary Material for this article can be found online at: https://www.frontiersin.org/articles/10.3389/fevo.2022.868826/full#supplementary-material
Alonso, C., Ramos-Cruz, D., and Becker, C. (2019). The role of plant epigenetics in biotic interactions. New Phytol. 221, 731–737. doi: 10.1111/nph.15408
Alvarez, M., Ferreira de Carvalho, J., Salmon, A., Ainouche, M. L., Cavé-Radet, A., et al. (2018). Transcriptome response of the foundation plant Spartina alterniflora to the Deepwater Horizon oil spill. Mole. Ecol. 27, 2986–3000. doi: 10.1111/mec.14736
Alvarez, M., Robertson, M., van Gurp, T., Wagemaker, N., Giraud, D., Ainouche, M. L., et al. (2020). Reduced representation characterization of genetic and epigenetic differentiation to oil pollution in the foundation plant Spartina alterniflora. bioRxiv doi: 10.1101/426569
Anderson, M. J., Ellingsen, K. E., and McArdle, B. H. (2006). Multivariate dispersion as a measure of beta diversity. Ecol. Lett. 9, 683–693. doi: 10.1111/j.1461-0248.2006.00926.x
Ashe, A., Colot, V., and Oldroyd, B. P. (2021). How does epigenetics influence the course of evolution? Philosoph. Trans. R. Soc. Lond. Series B, Biol. Sci. 376:20200111. doi: 10.1098/rstb.2020.0111
Balao, F., Paun, O., and Alonso, C. (2018). Uncovering the contribution of epigenetics to plant phenotypic variation in Mediterranean ecosystems. Plant Biol. 20, 38–49. doi: 10.1111/plb.12594
Banta, J. A., and Richards, C. L. (2018). Quantitative epigenetics and evolution. Heredity 121, 210–224. doi: 10.1038/s41437-018-0114-x
Becker, C., Hagmann, J., Müller, J., Koenig, D., Stegle, O., Borgwardt, K., et al. (2011). Spontaneous epigenetic variation in the Arabidopsis thaliana methylome. Nature 480, 245–249. doi: 10.1038/nature10555
Benjamini, Y., and Hochberg, Y. (1995). Controlling the false discovery rate: A practical and powerful approach to multiple testing. J. R. Stat. Soc. 57, 289–300. doi: 10.1111/j.2517-6161.1995.tb02031.x
Bertness, M. (2020). A Brief Natural History of Civilization: Why a Balance Between Cooperation and Competition Is Vital to Humanity. New Haven: Yale University Press, doi: 10.2307/j.ctvzpv6np
Bertness, M. D., and Ellison, A. M. (1987). Determinants of pattern in a New England salt marsh plant community. Ecol. Monogr. 57, 129–147. doi: 10.2307/1942621
Bock, D. G., Caseys, C., Cousens, R. D., Hahn, M. A., Heredia, S. M., Hübner, S., et al. (2015). What we still don’t know about invasion genetics. Mole. Ecol. 24, 2277–2297. doi: 10.1111/mec.13032
Boquete, M. T., Muyle, A., and Alonso, C. (2021). Plant epigenetics: phenotypic and functional diversity beyond the DNA sequence. Am. J. Bot. 108, 553–558. doi: 10.1002/ajb2.1645
Boquete, M. T., Schmid, M. W., Wagemaker, N. C. A. M., Carey, S. B., McDaniel, S. F., Richards, C., et al. (2022). Molecular basis of intraspecific differentiation for heavy metal tolerance in the copper moss Scopelophila cataractae. Authorea 2022:91599576. doi: 10.22541/au.164476549.91599576/v1
Boquete, M. T., Wagemaker, N. C. A. M., Vergeer, P., Mounger, J., and Richards, C. L. (2020). “Epigenetic Approaches in Non-Model Plants,” in Plant Epigenetics and Epigenomics: Methods and Protocols, Vol. 2093, ed. P. McKeown (New York, NY: Springer Science+Business Media, LLC), 203–215. doi: 10.1007/978-1-0716-0179-2_14
Boutte, J., Ferreira de Carvalho, J., Rousseau-Gueutin, M., Poulain, J., Da Silva, C., Wincker, P., et al. (2016). Reference Transcriptomes and Detection of Duplicated Copies in Hexaploid and Allododecaploid Spartina Species (Poaceae). Gen. Biol. Evol. 8, 3030–3044. doi: 10.1093/gbe/evw209
Buchfink, B., Xie, C., and Huson, D. H. (2015). Fast and sensitive protein alignment using DIAMOND. Nat. Methods 12, 59–60. doi: 10.1038/nmeth.3176
Burggren, W. (2016). Epigenetic inheritance and its role in evolutionary biology: Re-evaluation and new perspectives. Biology 5:24. doi: 10.3390/biology5020024
Cortijo, S., Wardenaar, R., Colomé-Tatché, M., Gilly, A., Etcheverry, M., Labadie, K., et al. (2014). Mapping the epigenetic basis of complex traits. Science 343, 1145–1148. doi: 10.1126/science.1248127
Des Marais, D. L., Hernandez, K. M., and Juenger, T. E. (2013). Genotype-by-Environment Interaction and Plasticity: exploring Genomic Responses of Plants to the Abiotic Environment. Annu. Rev. Ecol. Evol. Syst. 44, 5–29. doi: 10.1146/annurev-ecolsys-110512-135806
Dodd, R. S., and Douhovnikoff, V. (2016). Adjusting to Global Change through Clonal Growth and Epigenetic Variation. Front. Ecol. Evol. 4:86. doi: 10.3389/fevo.2016.00086
Dubin, M. J., Zhang, P., Meng, D., Remigereau, M.-S., Osborne, E. J., Paolo Casale, F., et al. (2015). DNA methylation in Arabidopsis has a genetic basis and shows evidence of local adaptation. eLife 4:e05255. doi: 10.7554/eLife.05255
Dufresne, F., Stift, M., Vergilino, R., and Mable, B. K. (2014). Recent progress and challenges in population genetics of polyploid organisms: an overview of current state-of-the-art molecular and statistical tools. Mole. Ecol. 23, 40–69. doi: 10.1111/mec.12581
Edwards, K. R., Travis, S. E., and Proffitt, C. E. (2005). Genetic effects of a large-scaleSpartina alterniflora (smooth cordgrass) dieback and recovery in the northern Gulf of Mexico. Estuaries 28, 204–214. doi: 10.1007/bf02732855
Ellison, A. M. (2019). Foundation species, non-trophic interactions, and the value of being common. iScience 13, 254–268. doi: 10.1016/j.isci.2019.02.020
Fischer, M. C., Foll, M., Excoffier, L., and Heckel, G. (2011). Enhanced AFLP genome scans detect local adaptation in high-altitude populations of a small rodent (Microtus arvalis). Mole. Ecol. 20, 1450–1462. doi: 10.1111/j.1365-294x.2011.05015.x
Foll, M., and Gaggiotti, O. (2008). A genome-scan method to identify selected loci appropriate for both dominant and codominant markers: a Bayesian perspective. Genetics 180, 977–993. doi: 10.1534/genetics.108.092221
Foust, C. M., Preite, V., Schrey, A. W., Alvarez, M., Robertson, M. H., Verhoeven, K. J. F., et al. (2016). Genetic and epigenetic differences associated with environmental gradients in replicate populations of two salt marsh perennials. Mole. Ecol. 25, 1639–1652. doi: 10.1111/mec.13522
Gallagher, J. L., Somers, G. F., Grant, D. M., and Seliskar, D. M. (1988). Persistent differences in two forms of Spartina alterniflora: a common garden experiment. Ecology 69, 1005–1008. doi: 10.2307/1941255
Gao, Z., Moorjani, P., Sasani, T. A., Pedersen, B. S., Quinlan, A. R., Jorde, L. B., et al. (2019). Overlooked roles of DNA damage and maternal age in generating human germline mutations. Proc. Natl. Acad. Sci. U S A 116, 9491–9500. doi: 10.1073/pnas.1901259116
Gáspár, B., Bossdorf, O., and Durka, W. (2019). Structure, stability and ecological significance of natural epigenetic variation: a large-scale survey in Plantago lanceolata. New Phytol. 221, 1585–1596. doi: 10.1111/nph.15487
Gawehns, F., Postuma, M., van Antro, M., Nunn, A., Sepers, B., Fatma, S., et al. (2022). epiGBS2: improvements and evaluation of highly multiplexed, epiGBS-based reduced representation bisulfite sequencing. Mole. Ecol. Resour. 2022:13597. doi: 10.1111/1755-0998.13597
Goudet, J. (2005). hierfstat, a package for r to compute and test hierarchical F-statistics. Mole. Ecol. Notes 5, 184–186. doi: 10.1111/j.1471-8286.2004.00828.x
Gratani, L. (2014). Plant phenotypic plasticity in response to environmental factors. Adv. Bot. 2014:208747.
Hamrick, J. L., and Godt, M. J. W. (1996). Effects of life history traits on genetic diversity in plant species. Philosoph. Trans. R. Soc. Lond. Ser B, Biol. Sci. 351, 1291–1298. doi: 10.1098/rstb.1996.0112
Hays, C. G., Hanley, T. C., Hughes, A. R., Truskey, S. B., Zerebecki, R. A., and Sotka, E. E. (2021). Local Adaptation in Marine Foundation Species at Microgeographic Scales. Biol. Bull. 241, 16–29. doi: 10.1086/714821
Herman, J. J., and Sultan, S. E. (2016). DNA methylation mediates genetic variation for adaptive transgenerational plasticity. Proc. R. Soc. B 283:1838. doi: 10.1098/rspb.2016.0988
Herrera, C. M., and Bazaga, P. (2011). Untangling individual variation in natural populations: ecological, genetic and epigenetic correlates of long-term inequality in herbivory. Mole. Ecol. 20, 1675–1688. doi: 10.1111/j.1365-294X.2011.05026.x
Herrera, C. M., Medrano, M., and Bazaga, P. (2017). Comparative epigenetic and genetic spatial structure of the perennial herb Helleborus foetidus: isolation by environment, isolation by distance, and functional trait divergence. Am. J. Bot. 104, 1195–1204. doi: 10.3732/ajb.1700162
Hoang, D. T., Chernomor, O., von Haeseler, A., Minh, B. Q., and Vinh, L. S. (2018). UFBoot2: Improving the Ultrafast Bootstrap Approximation. Mole. Biol. Evol. 35, 518–522. doi: 10.1093/molbev/msx281
Hodgins, K. A., Bock, D. G., Hahn, M. A., Heredia, S. M., Turner, K. G., and Rieseberg, L. H. (2015). Comparative genomics in the Asteraceae reveals little evidence for parallel evolutionary change in invasive taxa. Mole. Ecol. 24, 2226–2240. doi: 10.1111/mec.13026
Hollister, J. D., Smith, L. M., Guo, Y.-L., Ott, F., Weigel, D., and Gaut, B. S. (2011). Transposable elements and small RNAs contribute to gene expression divergence between Arabidopsis thaliana and Arabidopsis lyrata. Proc. Natl. Acad. Sci. U.S.A. 108, 2322–2327. doi: 10.1073/pnas.1018222108
Hughes, A. R., and Lotterhos, K. E. (2014). Genotypic diversity at multiple spatial scales in the foundation marsh species, Spartina alterniflora. Mar. Ecol. Prog. Ser. 497, 105–117. doi: 10.3354/meps10565
Jombart, T. (2008). adegenet: a R package for the multivariate analysis of genetic markers. Bioinform. 24, 1403–1405. doi: 10.1093/bioinformatics/btn129
Jombart, T., and Ahmed, I. (2011). adegenet 1.3-1: new tools for the analysis of genome-wide SNP data. Bioinformatics 27, 3070–3071. doi: 10.1093/bioinformatics/btr521
Jost, L. (2008). GST and its relatives do not measure differentiation. Mol. Ecol. 17, 4015–4026. doi: 10.1111/j.1365-294X.2008.03887.x
Jueterbock, A., Boström, C., Coyer, J. A., Olsen, J. L., Kopp, M., Dhanasiri, A. K. S., et al. (2020). The seagrass methylome is associated with variation in photosynthetic performance among clonal shoots. Front. Plant Sci. 11:571646. doi: 10.3389/fpls.2020.571646
Lewis, D. B., and Eby, L. A. (2002). Spatially heterogeneous refugia and predation risk in intertidal salt marshes. Oikos 96, 119–129. doi: 10.1034/j.1600-0706.2002.960113.x
Lewis, D. B., Jimenez, K. L., Abd-Elrahman, A., Andreu, M. G., Landry, S. M., Northrop, R. J., et al. (2021). Carbon and nitrogen pools and mobile fractions in surface soils across a mangrove saltmarsh ecotone. Sci. Total Env. 798:149328. doi: 10.1016/j.scitotenv.2021.149328
Lin, Q., and Mendelssohn, I. A. (2012). Impacts and Recovery of the Deepwater Horizon Oil Spill on Vegetation Structure and Function of Coastal Salt Marshes in the Northern Gulf of Mexico. Environmental Science & Technology 46, 3737–3743. doi: 10.1021/es203552p
Lin, Q., Mendelssohn, I. A., Graham, S. A., Hou, A., Fleeger, J. W., and Deis, D. R. (2016). Response of salt marshes to oiling from the Deepwater Horizon spill: Implications for plant growth, soil surface-erosion, and shoreline stability. Sci. Total Env. 557-558, 369–377. doi: 10.1016/j.scitotenv.2016.03.049
Lira-Medeiros, C. F., Parisod, C., Fernandes, R. A., Mata, C. S., Cardoso, M. A., and Ferreira, P. C. G. (2010). Epigenetic variation in mangrove plants occurring in contrasting natural environment. PLoS One 5:e10326. doi: 10.1371/journal.pone.0010326
Li, R., Hu, F., Li, B., Zhang, Y., Chen, M., Fan, T., et al. (2020). Whole genome bisulfite sequencing methylome analysis of mulberry (Morus alba) reveals epigenome modifications in response to drought stress. Sci. Rep. 10:8013. doi: 10.1038/s41598-020-64975-5
Medrano, M., Herrera, C. M., and Bazaga, P. (2014). Epigenetic variation predicts regional and local intraspecific functional diversity in a perennial herb. Mole. Ecol. 23, 4926–4938. doi: 10.1111/mec.12911
Miryeganeh, M. (2021). Plants’ Epigenetic Mechanisms and Abiotic Stress. Genes 12:8. doi: 10.3390/genes12081106
Miryeganeh, M., and Saze, H. (2020). Epigenetic inheritance and plant evolution. Populat. Ecol. 62, 17–27. doi: 10.1002/1438-390x.12018
Mounger, J., Ainouche, M. L., Bossdorf, O., Cavé-Radet, A., Li, B., Parepa, M., et al. (2021a). Epigenetics and the success of invasive plants. Philosoph. Trans. R. Soc. Lond. Ser.B Biol. Sci. 376:20200117. doi: 10.1098/rstb.2020.0117
Mounger, J., Boquete, M. T., Schmid, M. W., Granado, R., Robertson, M. H., Voors, S. A., et al. (2021b). Inheritance of DNA methylation differences in the mangrove Rhizophora mangle. Evol. Dev. 23, 351–374. doi: 10.1101/2020.10.24.353482
Nei, M. (1987). Molecular Evolutionary Genetics. New York, NY: Columbia University Press, doi: 10.7312/nei-92038
Neinavaie, F., Ibrahim Hashim, A., Kramer, A. M., Brown, J. S., and Richards, C. L. (2021). The genomic processes of biological invasions: from invasive species to cancer metastases and back again. Front. Ecol. Evol. 2021:681100.
Nguyen, L.-T., Schmidt, H. A., von Haeseler, A., and Minh, B. Q. (2015). IQ-TREE: a fast and effective stochastic algorithm for estimating maximum-likelihood phylogenies. Mole. Biol. Evol. 32, 268–274. doi: 10.1093/molbev/msu300
Nicotra, A. B., Atkin, O. K., Bonser, S. P., Davidson, A. M., Finnegan, E. J., Mathesius, U., et al. (2010). Plant phenotypic plasticity in a changing climate. Trends Plant Sci. 15, 684–692. doi: 10.1016/j.tplants.2010.09.008
Nicotra, A. B., Segal, D. L., Hoyle, G. L., Schrey, A. W., Verhoeven, K. J. F., and Richards, C. L. (2015). Adaptive plasticity and epigenetic variation in response to warming in an Alpine plant. Ecol. Evol. 5, 634–647. doi: 10.1002/ece3.1329
Niederhuth, C. E., and Schmitz, R. J. (2017). Putting DNA methylation in context: from genomes to gene expression in plants. Biochim. Biophys. Acta 1860, 149–156. doi: 10.1016/j.bbagrm.2016.08.009
Oksanen, J., Blanchet, F. G., Friendly, M., Kindt, R., Legendre, P., McGlinn, D., et al. (2020). vegan: Community Ecology R package version 2.5-7. Available online at: https://cran.r-project.org/web/packages/vegan/index.html (accessed date 2020-November-28).
Paradis, E., and Schliep, K. (2019). ape 5.0: an environment for modern phylogenetics and evolutionary analyses in R. Bioinformatics 35, 526–528. doi: 10.1093/bioinformatics/bty633
Park, Y., and Wu, H. (2016). Differential methylation analysis for BS-seq data under general experimental design. Bioinformatics 32, 1446–1453. doi: 10.1093/bioinformatics/btw026
Paun, O., Bateman, R. M., Fay, M. F., Hedrén, M., Civeyrel, L., and Chase, M. W. (2010). Stable epigenetic effects impact adaptation in allopolyploid orchids (Dactylorhiza: Orchidaceae). Mole. Biol. Evol. 27, 2465–2473. doi: 10.1093/molbev/msq150
Paun, O., Verhoeven, K. J. F., and Richards, C. L. (2019). Opportunities and limitations of reduced representation bisulfite sequencing in plant ecological epigenomics. New Phytol. 221, 738–742. doi: 10.1111/nph.15388
Pennings, S. C., and Bertness. (2001). “Salt Marsh Communities,” in Marine Community Ecology, eds S. D. Bertness and M. Hay (Sunderland,: Sinauer Associates), 289–316.
Pennings, S. C., and Callaway, R. M. (2000). The advantages of clonal integration under different ecological conditions: a community-wide test. Ecology 81, 709–716. doi: 10.1890/0012-96582000081[0709:taociu]2.0.co;2
Pennings, S. C., Grant, M.-B., and Bertness, M. D. (2005). Plant zonation in low-latitude salt marshes: disentangling the roles of flooding, salinity and competition. J. Ecol. 93, 159–167. doi: 10.1111/j.1365-2745.2004.00959.x
Puy, J., Carmona, C. P., Dvoøáková, H., Latzel, V., and de Bello, F. (2021a). Diversity of parental environments increases phenotypic variation in Arabidopsis populations more than genetic diversity but similarly affects productivity. Ann. Bot. 127, 425–436. doi: 10.1093/aob/mcaa100
Puy, J., de Bello, F., Dvoøáková, H., Medina, N. G., Latzel, V., and Carmona, C. P. (2021b). Competition-induced transgenerational plasticity influences competitive interactions and leaf decomposition of offspring. New Phytol. 229, 3497–3507. doi: 10.1111/nph.17037
R Core Team (2020). R: A Language and Environment for Statistical Computing. Vienna: R Foundation for Statistical Computing.
Richards, C. L., Alonso, C., Becker, C., Bossdorf, O., Bucher, E., Colomé-Tatché, M., et al. (2017). Ecological plant epigenetics: evidence from model and non-model species, and the way forward. Ecol. Lett. 20, 1576–1590. doi: 10.1111/ele.12858
Richards, C. L., Hamrick, J. L., and Donovan, L. A. (2004). Unexpectedly high clonal diversity of two salt marsh perennials across a severe environmental gradient. Ecology 2004:674. doi: 10.1111/j.1461-0248.2004.00674.x
Richards, C. L., Pennings, S. C., and Donovan, L. A. (2005). Habitat range and phenotypic variation in salt marsh plants. Plant Ecol. 2005:3. doi: 10.1007/s11258-004-0841-3
Richards, C. L., and Pigliucci, M. (2020). Epigenetic Inheritance. A Decade into the Extended Evolutionary Synthesis. Paradigmi 38, 463–494. doi: 10.30460/99624
Robertson, M., Alvarez, M., van Gurp, T., Wagemaker, C. A. M., Yu, F., Amador, D. M., et al. (2020). Combining epiGBS markers with long read transcriptome sequencing to assess differentiation associated with habitat in Reynoutria (aka Fallopia). bioRxiv 2020:317966. doi: 10.1101/2020.09.30.317966
Robertson, M., and Richards, C. (2015). Opportunities and challenges of next-generation sequencing applications in ecological epigenetics. Mole. Ecol. 2015:13277. doi: 10.1111/mec.13277
Robertson, M., Schrey, A., Shayter, A., Moss, C. J., and Richards, C. (2017). Genetic and epigenetic variation in Spartina alterniflora following the Deepwater Horizon oil spill. Evol. Appl. 10, 792–801. doi: 10.1111/eva.12482
Salmon, A., Ainouche, M. L., and Wendel, J. F. (2005). Genetic and epigenetic consequences of recent hybridization and polyploidy in Spartina (Poaceae). Mole. Ecol. 14, 1163–1175. doi: 10.1111/j.1365-294X.2005.02488.x
Sarma, R. R., Crossland, M. R., Eyck, H. J. F., DeVore, J. L., Edwards, R. J., Cocomazzo, M., et al. (2021). Intergenerational effects of manipulating DNA methylation in the early life of an iconic invader. Philosoph. Transac. R. Soc. Lond. Ser. B Biol. Sci. 2021:1098. yet assigned doi: 10.1098/not
Sarma, R. R., Edwards, R. J., Crino, O. L., Eyck, H. J. F., Waters, P. D., Crossland, M. R., et al. (2020). Do Epigenetic Changes Drive Corticosterone Responses to Alarm Cues in Larvae of an Invasive Amphibian? Integr. Comp. Biol. 60, 1481–1494. doi: 10.1093/icb/icaa082
Sasaki, E., Kawakatsu, T., Ecker, J. R., and Nordborg, M. (2019). Common alleles of CMT2 and NRPE1 are major determinants of CHH methylation variation in Arabidopsis thaliana. PLoS Genet. 15:e1008492. doi: 10.1371/journal.pgen.1008492
Schlichting, C. D. (1986). The evolution of phenotypic plasticity in plants. Annu. Rev. Ecol. Syst. 17, 667–693. doi: 10.1146/annurev.es.17.110186.003315
Schmid, M. W. (2017). RNA-Seq Data Analysis Protocol: combining In-House and Publicly Available Data. Methods Mole.Biol. 1669, 309–335. doi: 10.1007/978-1-4939-7286-9_24
Schmid, M. W., Heichinger, C., Coman Schmid, D., Guthörl, D., Gagliardini, V., Bruggmann, R., et al. (2018b). Contribution of epigenetic variation to adaptation in Arabidopsis. Nat. Comm. 9:4446. doi: 10.1038/s41467-018-06932-5
Schmid, M. W., Giraldo-Fonseca, A., Rövekamp, M., Smetanin, D., Bowman, J. L., and Grossniklaus, U. (2018a). Extensive epigenetic reprogramming during the life cycle of Marchantia polymorpha. Gen. Biol. 19:9. doi: 10.1186/s13059-017-1383-z
Schmidt, T. L., Jasper, M.-E., Weeks, A. R., and Hoffmann, A. A. (2021). Unbiased population heterozygosity estimates from genome-wide sequence data. Methods Ecol. Evol. 12, 1888–1898. doi: 10.1111/2041-210x.13659
Schrey, A. W., Alvarez, M., Foust, C. M., Kilvitis, H. J., Lee, J. D., Liebl, A. L., et al. (2013). Ecological Epigenetics: Beyond MS-AFLP. Integr. Comp. Biol. 53, 340–350. doi: 10.1093/icb/ict012
Schulz, B., Eckstein, R. L., and Durka, W. (2014). Epigenetic variation reflects dynamic habitat conditions in a rare floodplain herb. Mole. Ecol. 23, 3523–3537. doi: 10.1111/mec.12835
Shea, M. L., Warren, R. S., and Niering, W. A. (1975). Biochemical and transplantation studies of the growth form of Spartina alterniflora on Connecticut salt marshes. Ecology 56, 461–466. doi: 10.2307/1934977
Smit, A. F. A., Hubley, R., and Green, P. (2013–2015). RepeatMasker Open-4.0 2013–2015. Hyderabad: Indian School of Business.
Somers, G. F., and Grant, D. (1981). Influence of seed source upon phenology of flowering of Spartina alterniflora Loisel. And the likelihood of cross pollination. Am. J. Bot. 68, 6–9. doi: 10.1002/j.1537-2197.1981.tb06349.x
Stajic, D., and Jansen, L. (2021). Empirical evidence for epigenetic inheritance driving evolutionary adaptation. Philos. Trans. R. Soc. Lond. B. Biol. Sci. 376:20200121. doi: 10.1098/rstb.2020.0121
Stalter, R., and Batson, W. T. (1969). Transplantation of salt marsh vegetation, Georgetown, South Carolina. Ecology 50, 1087–1089. doi: 10.2307/1936901
Sunde, J., Yıldırım, Y., Tibblin, P., and Forsman, A. (2020). Comparing the Performance of Microsatellites and RADseq in Population Genetic Studies: analysis of Data for Pike (Esox lucius) and a Synthesis of Previous Studies. Front. Genet. 11:218. doi: 10.3389/fgene.2020.00218
Tavaré, S. (1986). Some probabilistic and statistical problems in the analysis of DNA sequences. Lect. Math. Life Sci. 17, 57–86.
Travis, S. E., Proffitt, C. E., and Ritland, K. (2004). Population structure and inbreeding vary with successional stage in created Spartina alterniflora marshes. Ecol. Applic. 14, 1189–1202. doi: 10.1890/03-5135
Trifinopoulos, J., Nguyen, L.-T., von Haeseler, A., and Minh, B. Q. (2016). W-IQ-TREE: a fast online phylogenetic tool for maximum likelihood analysis. Nucleic Acids Res. 44, W232–W235. doi: 10.1093/nar/gkw256
Valiela, I., Teal, J. M., and Deuser, W. G. (1978). The Nature of Growth Forms in the Salt Marsh Grass Spartina alterniflora. Am. Natural. 112, 461–470. doi: 10.1086/283290
van Gurp, T. P., Wagemaker, N. C. A. M., Wouters, B., Vergeer, P., Ouborg, J. N. J., and Verhoeven, K. J. F. (2016). epiGBS: reference-free reduced representation bisulfite sequencing. Nat. Methods 13, 322–324. doi: 10.1038/nmeth.3763
van Moorsel, S. J., Schmid, M. W., Wagemaker, N. C. A. M., van Gurp, T., Schmid, B., and Vergeer, P. (2019). Evidence for rapid evolution in a grassland biodiversity experiment. Mole. Ecol. 28, 4097–4117. doi: 10.1111/mec.15191
Verhoeven, K. J. F., Jansen, J. J., Van Dijk, P. J., and Biere, A. (2010). Stress-induced DNA methylation changes and their heritability in asexual dandelions. New Phytol. 185, 1108–1118. doi: 10.1111/j.1469-8137.2009.03121.x
Voors, S. E. (2018). Ecosystem Function and Phenotypic Variation in Spartina alterniflora Salt Marshes. Tampa, FL: University of South Florida.
Wang, I. J., and Bradburd, G. S. (2014). Isolation by environment. Mole. Ecol. 23, 5649–5662. doi: 10.1111/mec.12938
Wang, M.-Z., Li, H.-L., Li, J.-M., and Yu, F.-H. (2020). Correlations between genetic, epigenetic and phenotypic variation of an introduced clonal herb. Heredity 124, 146–155. doi: 10.1038/s41437-019-0261-8
Wang, Y.-J., Müller-Schärer, H., van Kleunen, M., Cai, A.-M., Zhang, P., Yan, R., et al. (2017). Invasive alien plants benefit more from clonal integration in heterogeneous environments than natives. New Phytol. 216, 1072–1078. doi: 10.1111/nph.14820
Wickham, H., and Seidel, D. (2020). Scale Functions for Visualization [R package scales version 1.1.1]. Comprehensive R Archive Network (CRAN). Available online at: https://cran.r-project.org/web/packages/scales/index.html (accessed date 2020-05-11).
Wiêski, K., and Pennings, S. C. (2014). Climate Drivers of Spartina alterniflora Saltmarsh Production in Georgia, USA. Ecosystems 17, 473–484. doi: 10.1007/s10021-013-9732-6
Xie, H. J., Li, H., Liu, D., Dai, W. M., He, J. Y., Lin, S., et al. (2015). ICE1 demethylation drives the range expansion of a plant invader through cold tolerance divergence. Mole. Ecol. 24, 835–850. doi: 10.1111/mec.13067
Yoder, A. D., and Tiley, G. P. (2021). The challenge and promise of estimating the de novo mutation rate from whole-genome comparisons among closely related individuals. Mole. Ecol. 2021:16007. doi: 10.1111/mec.16007
Zerebecki, R. A., Crutsinger, G. M., and Hughes, A. R. (2017). Spartina alterniflora genotypic identity affects plant and consumer responses in an experimental marsh community. J. Ecol. 105, 661–673. doi: 10.1111/1365-2745.12703
Keywords: epigenomic analysis, foundation plant, Spartina alterniflora, non-genetic inheritance, salt marsh ecology, ecological genomics
Citation: Mounger JM, van Riemsdijk I, Boquete MT, Wagemaker CAM, Fatma S, Robertson MH, Voors SA, Oberstaller J, Gawehns F, Hanley TC, Grosse I, Verhoeven KJF, Sotka EE, Gehring CA, Hughes AR, Lewis DB, Schmid MW and Richards CL (2022) Genetic and Epigenetic Differentiation Across Intertidal Gradients in the Foundation Plant Spartina alterniflora. Front. Ecol. Evol. 10:868826. doi: 10.3389/fevo.2022.868826
Received: 03 February 2022; Accepted: 15 March 2022;
Published: 12 May 2022.
Edited by:
Tanvir Ul Hassan Dar, Baba Ghulam Shah Badshah University, IndiaReviewed by:
Shailendra Goel, University of Delhi, IndiaCopyright © 2022 Mounger, van Riemsdijk, Boquete, Wagemaker, Fatma, Robertson, Voors, Oberstaller, Gawehns, Hanley, Grosse, Verhoeven, Sotka, Gehring, Hughes, Lewis, Schmid and Richards. This is an open-access article distributed under the terms of the Creative Commons Attribution License (CC BY). The use, distribution or reproduction in other forums is permitted, provided the original author(s) and the copyright owner(s) are credited and that the original publication in this journal is cited, in accordance with accepted academic practice. No use, distribution or reproduction is permitted which does not comply with these terms.
*Correspondence: Christina L. Richards, Y2xyQHVzZi5lZHU=
Disclaimer: All claims expressed in this article are solely those of the authors and do not necessarily represent those of their affiliated organizations, or those of the publisher, the editors and the reviewers. Any product that may be evaluated in this article or claim that may be made by its manufacturer is not guaranteed or endorsed by the publisher.
Research integrity at Frontiers
Learn more about the work of our research integrity team to safeguard the quality of each article we publish.