
94% of researchers rate our articles as excellent or good
Learn more about the work of our research integrity team to safeguard the quality of each article we publish.
Find out more
METHODS article
Front. Ecol. Evol. , 09 June 2022
Sec. Conservation and Restoration Ecology
Volume 10 - 2022 | https://doi.org/10.3389/fevo.2022.866597
This article is part of the Research Topic Theories, Methods, and Practices of Wetland Degradation and Restoration View all 17 articles
 Lingling Tong1,2
 Xufeng Mao1,2,3*Xiuhua Song4Xiaoyan Wei5*Wenjia Tang3Yanfang Deng6Hongyan Yu6Zhuo Deng7Feng Xiao8Huakun Zhou9Xinan Yin10
Wetland health assessment provides important basis for wetland restoration and management. However, it is quite tricky to select proper indicators from multiple assessment indicators that can truly reflect the health state of urban wetlands. In an attempt to address these problems, a pressure-state-response (PSR) and back propagation artificial neural network (BP) conjoined model was established for health assessment of several plateau urban wetlands in Xining City, China. The model was driven and verified through field monitoring and social questionnaire data for 4 consecutive years from 2016 to 2019. Results indicate that: (1) Eight health evaluation indexes, including population density, eutrophication level, increasing humidity, carbon dioxide absorption, air purifying, recreation, wetland management level and investment in ecological construction and protection were selected from 45 input indexes. (2) The health index of Huangshui National Wetland Park has been increasing year by year, with an average of comprehensive health score of 0.746, 0.790, 0.884, and 0.877, respectively. The indicators that contributed the most to the restoration effect were leisure and entertainment service value (2016), carbon dioxide absorption service value (2017), eutrophication (2018), and wetland management level (2019), respecially. (3) Compared with the single PSR method, the advantages of this method include; There are fewer evaluation indicators, more accurate results (excluding the interference of some highly variable indicators) and more sensitive to environmental changes. The current study proposed a novel method that may provide additional accurate and refined indicators for urban wetland health assessment.
Urban wetlands refer to wetlands distributed in cities and towns (Sun et al., 2004; Robert et al., 2021). As an important part of the urban ecological environment, urban wetlands are public open space dominated by natural landscapes (Bolund and Hunhammar, 1999; Wang et al., 2006). They present many advantages, such as controlling flood and waterlogging, providing leisure and entertainment environments, and fulfilling scientific research and education purposes with their ecosystem-managing and cultural services also playing relatively important roles (Boyer and Polasky, 2004; Ho and Richardson, 2013; McInnes, 2014; Wahlroos et al., 2015; Jonathan et al., 2019; Stefanak, 2019; Wei et al., 2020; Liu et al., 2021; Li et al., 2022). Rapid urbanization has made urban wetlands one of the fastest shrinking ecosystems (Holland et al., 1995; Cui et al., 2004; Lee et al., 2006; Asomani-Boateng, 2019; Jing et al., 2020; Wang, 2020).
People are gradually realizing the importance of wetlands in urban ecological security and ecosystem services. Different scales and types of wetland ecological restoration have been carried out (Asomani-Boateng, 2019), such as the ecological restoration of Xixi National Wetland Park (Liu and Lu, 2021) and the functional restoration of the Yellow River wetland ecosystem (Xia et al., 2006) in China. Traditional wetland health assessment methods mainly include grey clustering analysis (Zhou and Xu, 2006; Zhang et al., 2013; Zou et al., 2013; Jiao et al., 2016; Wang et al., 2018; Asare et al., 2021), comprehensive index analysis and fuzzy comprehensive evaluation analysis (Zhang et al., 2010; Zhang and Yang, 2012; Wu et al., 2015; Sutton-Grier and Sandifer, 2019; Fang et al., 2021). Due to the existence of certain supervision in the weight and weight functions of each evaluation indicator, whether such health evaluation results truly reflect the health situation needs to be further explored.
Huangshui National Wetland Park, located in a plateau city in China, consists of rivers and artificial wetlands. Since a pilot scheme was launched in 2013, a series of restoration projects have been carried out. The transformation of sponge city, that is, the combination of wetland natural ecology and green technology to form a rainwater and flood control and utilization system (Hu et al., 2017; Ahn and Schmidt, 2019), has improved the hydrological cycle and water ecosystem, and the CHI (comprehensive health index) has increased from 0.568 in 2018 to 0.620 in 2019. Bird habitat islands and wetland plant plantings have put in place to create habitats for wild birds. The species of wild birds has increased from 89 in 2017 to 116 in 2019 (an increase of 27 species) at a rate of 30.33% (Mao et al., 2019); Biological monitoring technology, isotope analysis technology, and ecological network analysis technology have been adopted to create large enclosure systems for continuous monitoring, and build a quantitative lake ecological network model. Treatment of algal blooms facilitates the improvement of water quality, and the total phosphorus in water quality has improved from class V to class II and III during the treatment period (Mao and Wei, 2015; Mao et al., 2019; Wu et al., 2021). However, because restoration projects are often carried out with a specific goal, the final restoration effect exhibit significant differences. These differences include (1) time difference: while the initial effect of the restoration project was good, the effect diminished due to a lack of maintenance and investment in the later stage; (2) spatial difference: the effect of the restoration area was superior, but with unacceptable effect of the unrestored area; (3) differences in response indicators: for example, while dredging may bring about an improvement in water quality, it may also have a negative impact on benthic organisms. Thus, eventually, the health evaluation results document significant differences and variations, and it is difficult to find indicators that truly represent the health of wetland ecosystems (Mao et al., 2019).
The BP neural network is a non-linear dynamic system built on artificial intelligence (Rheinhardt et al., 1997; Cao et al., 2006; Bian et al., 2014; Wu and Feng, 2018; Wei et al., 2021). Due to the characteristics of self-learning and self-adaptation, the weights and thresholds of the network are transformed according to the existing information in the data to reduce artificial factors and better fit the relationship between evaluation indicators and wetland health (Kuo et al., 2007; Hanbay et al., 2008; Ferreira et al., 2011; Han et al., 2021). On one hand, if pressure-state-response (PSR) with BP artificial neural networks are combined, the pressure, state, and response indicators are to the greatest extent incorporated into the health evaluation indicators; on the other hand, the self-learning and adaptive ability of the BP artificial neural network are utilized. This indicates the advantage of a stronger and better fitting ability of the relationship between evaluation indicators and wetland health. This strategy may be part of the measures to screen for indicators that truly reflect the health of urban wetland ecosystems. Taking Xining Huangshui Wetlands as the research areas, supported by field plant quadrats, environmental monitoring data, and social survey data from 2016 to 2019, this study used the Analytic Hierarchy Process (AHP) method to provide comprehensive index weight, and construct a comprehensive health evaluation model suitable for plateau city wetlands based on the PSR-BP neural network model. This is aimed at finding the evaluation factors suitable for plateau city wetland health, evaluate the health status of wetland restoration, find the synergy and trade-off relationship between wetland ecosystem evaluation factors, score the key influencing factors of national wetland health in plateau cities, and provide key methods and theoretical support for wetland improvement and protection projects in plateau cities.
The study area is located in the urban area of Xining City, Qinghai Province (Figure 1). It is located in the eastern part of Qinghai Province and the middle of Hehuang Valley, with an average altitude of around 2,261 m. The terrain is high in the northwest and low in the southeast, belonging to the plateau cold temperate semi-arid climate zone, with low air pressure, long sunshine, and large temperature difference between day and night. The annual average temperature is 5.0°C, and the average precipitation is 506.4 mm. The annual sunshine time is 2,390.1 h, and the annual average wind speed is 2.0 m/s.
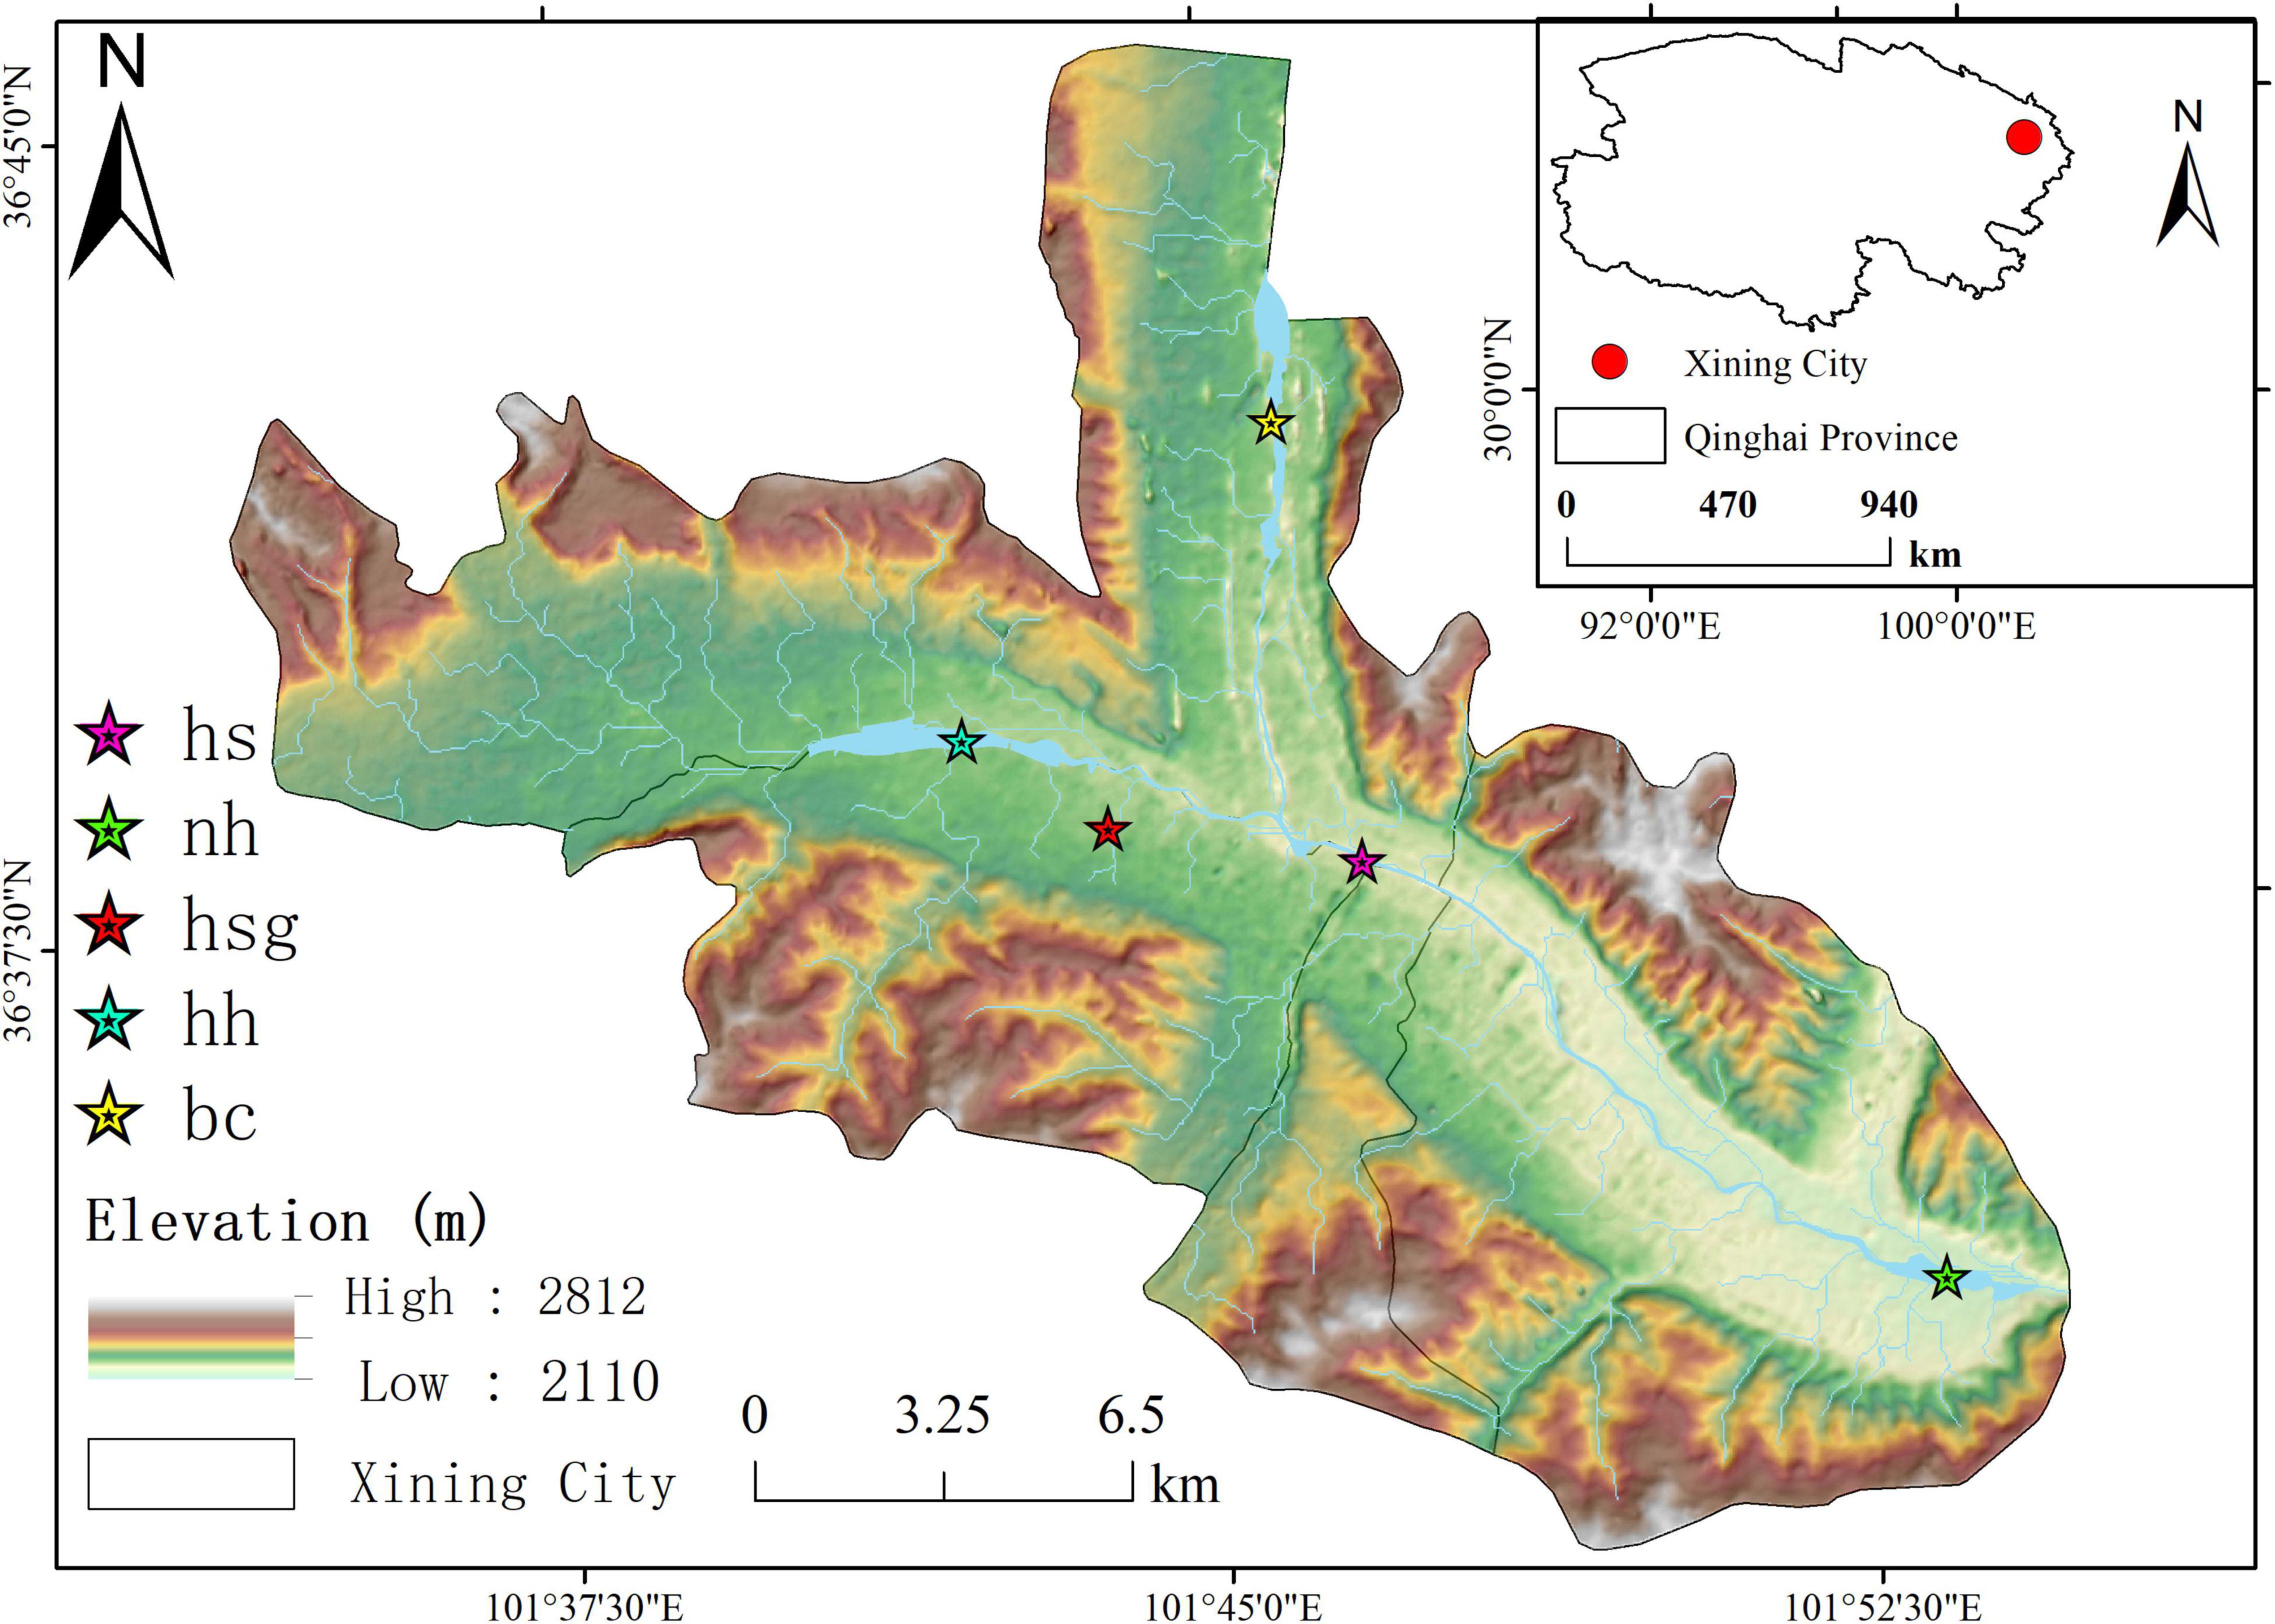
Figure 1. The location of the Huangshui National Wetland Park. Haihu wetland (36° 38′ 57″–36° 39′ 29″ N, 101° 40′ 24″–101° 43′ 24″E). Huoshaogou wetland (36° 38′ 15″–36° 39′ 01″ N, 101° 42′ 40″–101° 43′ 55″ E). Beichuan wetland (36° 40′ 40″–36° 43′ 32″ N, 101° 45′ 41″–101° 46′ 11″ E). Ninghu wetland (36° 34′ 12″–36° 33′ 48″ N, 101° 52′ 43″–101° 54′ 27″ E).
The Huangshui National Wetland Park is located in an urban area. The surrounding residential areas, commercial areas, and roads are dense, with several sources of pollution and poor water quality. Among them, the Haihu wetland and Huoshaogou were transformed into sponge cities in 2016. With purification capacity of the wetland ecological treatment system and the restoration capacity of the water ecosystem, the functioning of the bird habitat strengthened, and the functions of science popularization, publicity and education, leisure and entertainment further improved, wetland ecosystem services have gradually stabilized. Beichuan wetland has a large water area. Ninghu wetland is an artificial wetland. In 2017, wetland vegetation ecological restoration and bird habitat restoration were undertaken for the two wetlands simultaneously, so that the water quality was purified and the biodiversity was improved. However, in this process of sponge city reconstruction, wetland vegetation restoration and bird habitat restoration, along with other ecological restoration projects such as water quality restoration, there are temporal and spatial differences in the effect of ecological restoration. Further impacts of the performance of different indicators may also be good or bad, making it difficult to carry out a scientific evaluation of the effect of wetland restoration.
Pressure-state-response-BP neural network evaluation model is a model established by the combination of PSR model (Zhang et al., 2010) and BP neural network assessment model (Han et al., 2021). According to the PSR model, we selected the pressure-state-response index, a total of 45 wetland evaluation indexes, and gave the index weight according to the AHP method and Delphi method, and established the general PSR wetland health evaluation model to evaluate the wetland health status. 45 indexes selected based on PSR model were used as the input layer of BP neural network model to output the weight of 45 indexes. Finally, 8 wetland evaluation indexes with large weight were selected to establish PSR-BP neural network wetland health evaluation model.
We used the 2016-2019 field monitoring, experimental, and social survey data, as well as Qinghai Provincial Statistical Yearbook data as the basis, and converted them into the pressure, state, and response indicators (Supplementary Table 1). According to the above pressure state response index and index scoring standard, data were standardized in combination with the formula (1), so that the value was between 0 and 1.
Where m is the number of samples.
Specific evaluation methods: Based on the combination of AHP and Delphi, the judgment matrix of the relative importance of the criteria layer indicators was constructed (Table 1). After the consistency test formula passed (CR = 0.03319 < 0.1), the weight of the three-criteria-layer indicators of pressure index, state index, and response index was calculated as 0.258, 0.637, and 0.105, respectively.
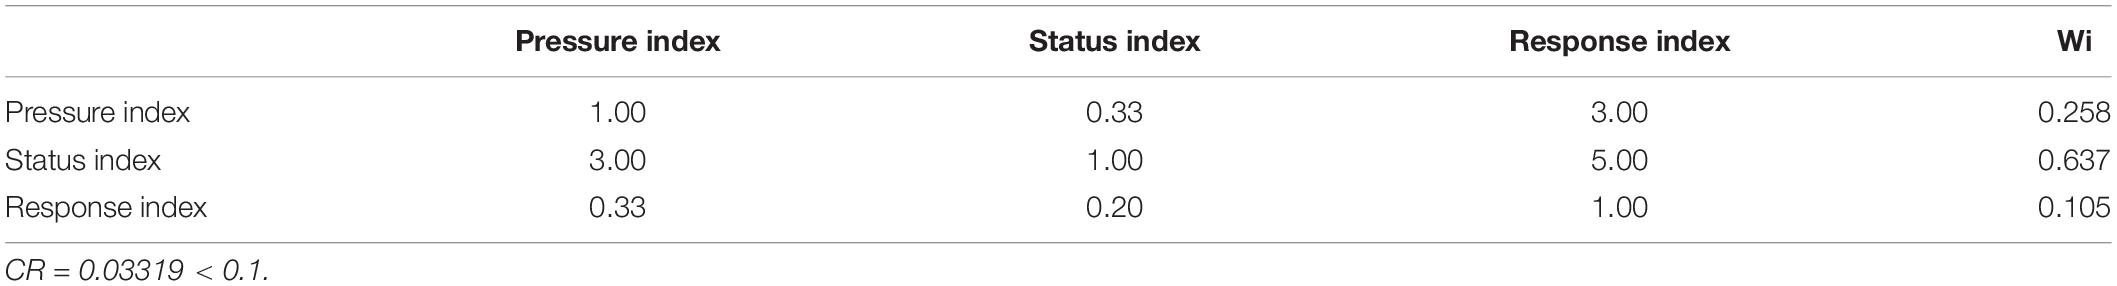
Table 1. Relative importance judgment matrix and ranking.
The Huangshui wetland health assessment network model was formed by the Levenberg Marquardt algorithm. The network used the mean square error algorithm to compute the error, and the maximum allowable number of iterations was 1,000. (1) Input layer: the health evaluation indicators of the Huangshui National Wetland Park served as the input layer of the model, and there were 45 input nodes. (2) Output layer: the comprehensive health evaluation index of the Huangshui National Wetland Park was invoked as the output layer of the model, and there was one output node. (3) Hidden layer: as the calculation method of the node number of this layer has not yet displayed a definite regularity, the empirical formula was used. (4) In the formula, the number of hidden layer nodes is n; the number of input layer nodes is m; the number of output layer nodes a; l is a random integer from 1 to 10. The calculated number of hidden layer nodes varied from 7 to 16. When the mean square error (MSE) reached the minimum, the corresponding optimal number of nodes was (Mo et al., 2009). (2) The average value and standard deviation of the eight selected evaluation indexes are presented in the Supplementary Material.
Combined with the results of wetland monitoring data from 2016 to 2019, the scoring criteria for the restoration effect of each evaluation index of wetland were probed, and Comprehensive Health Index (CHI) was used for wetland health evaluation. After the BP neural network model determined the index weight of the sub criterion layer, the expert scoring method was used to identify the pressure, state and response index weight of the criterion layer, and complete the weighting of all standardized index values. The CHI of each wetland park was obtained according to the calculation formula (4)
Where Wi is the comprehensive weight of each indicator, and Xi is the health index.
A three-layer BP neural network model was established based on the Neural Net Fitting toolbox in MATLAB, and a PSR-BP neural network-based wetland health assessment model was constructed (Figure 2).
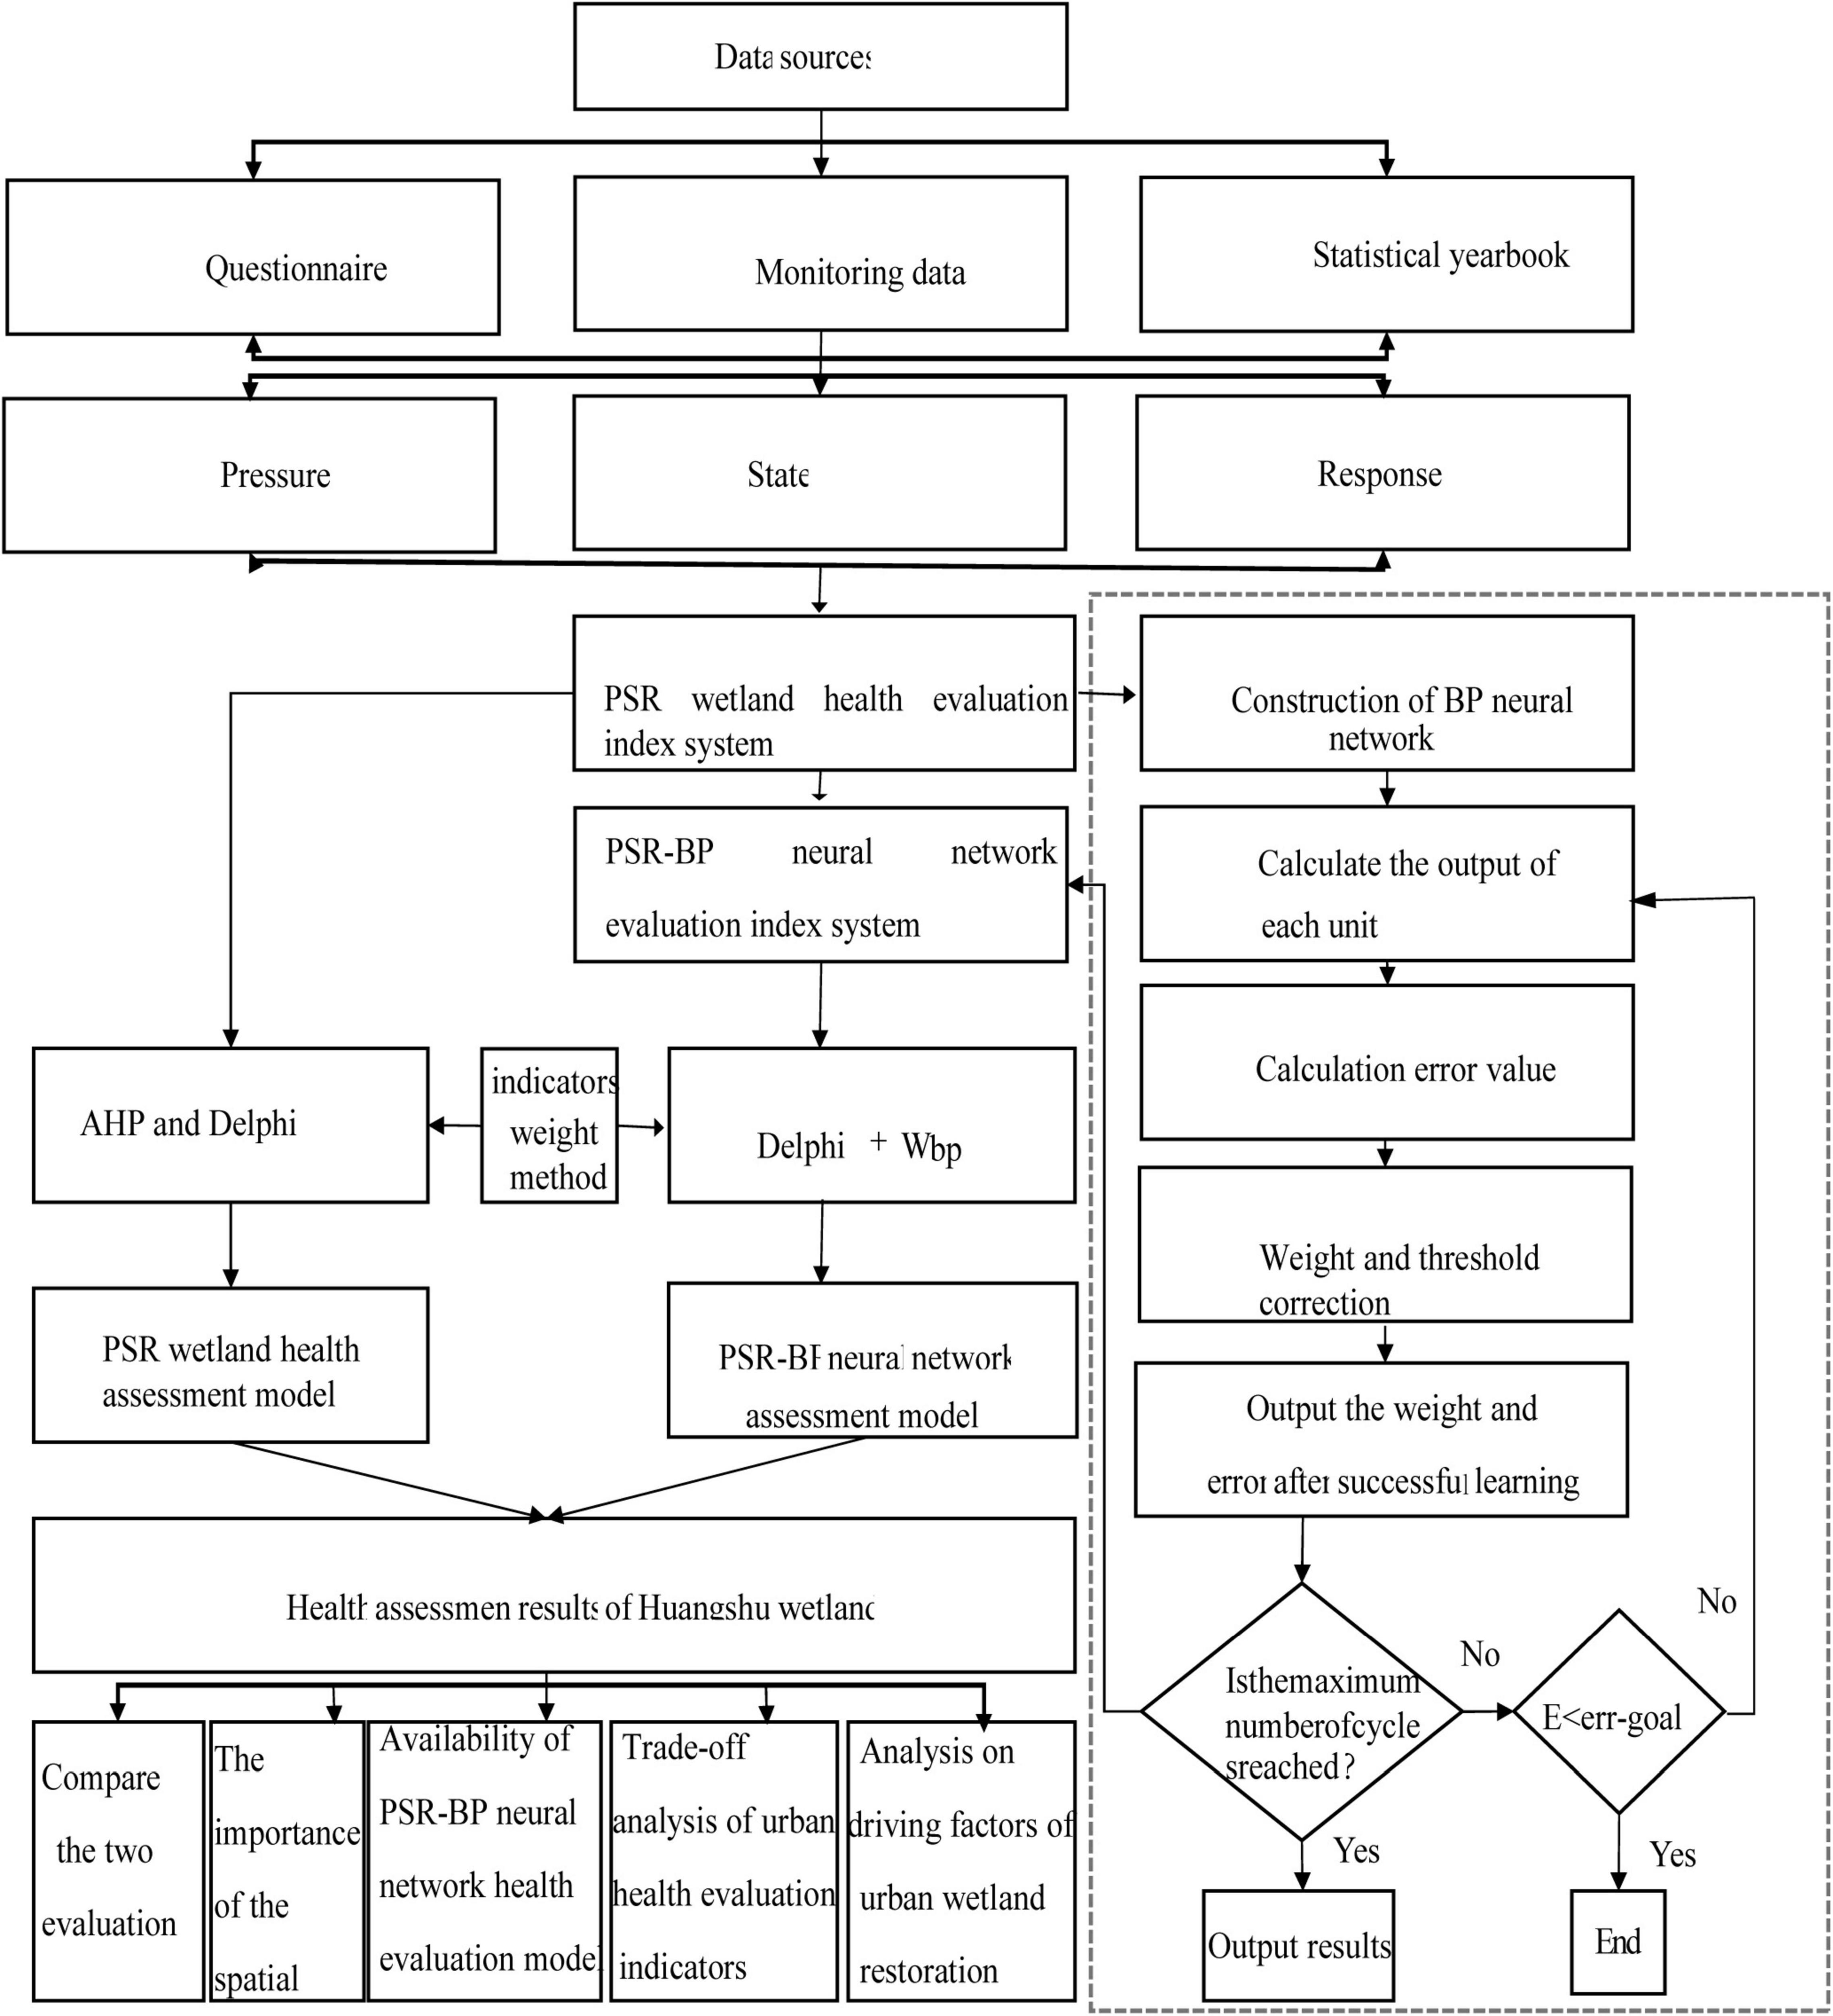
Figure 2. PSR-BP neural-network-based wetland health assessment model.
The trade-off analysis of urban health assessment indicators mainly adopted the Pearson correlations correlation analysis method. This analysis is primarily used to assess the correlation degree between multiple index factors. SPSS27 was used to analyze the correlation of the weight of Huangshui humidity health assessment index of 45 plateau cities extracted from the BP neural network model.
The monitoring data were collected from March to October every year from 2016 to 2019, and the wetland restoration area was monitored and sampled for details (Supplementary Table 1). Remote sensing data were obtained from the Geospatial Data Cloud website. After interpretation of remote sensing images in 2021, the land-use map was obtained. It was split into cultivated land, forest land, grassland, wetland, residential land, unused land and other types of land, and a general map of the study area was drawn (Figure 1). Bird data were obtained from the Huangshui National Wetland Park Management Office and their the Shannon-Wiener index and the evenness were calculated (Jiang, 2001). Wetland Park Management Office. Based on PSR wetland health evaluation system, 45 evaluation indexes were passed through MATLAB software when the error value is 2.635 × 10⁻¹¹, extracted the weight and threshold vector of the index. After Origin21, the average weight of 45 indicators is presented in the order from large to small, and the weights of pressure, state and response indicators were presented in a comparative bar graph; Based on PSR-BP neural network model, the comprehensive health score of Huangshui wetland were presented by superimposing columnar statistical chart with Origin21 software, and the scores of five wetlands were presented by broken line chart. The evaluation results of PSR model and PSR-BP model were presented by the standard variation curve function of Origin21 software.
Based on the trained PSR-BP neural network model, the weight and threshold vector when the error value is 2.635 × 10⁻¹¹ was extracted using MATLAB, and the weight mean values were presented in descending order using Origin21 (Figure 3). We observed that among the 45 Huangshui national wetland health evaluation indicators, the average weight of 21 indicators was positive, indicating that there were 21 evaluation indicators suitable for evaluating the health status of plateau urban wetlands. According to the average weight of the Huangshui national wetland health evaluation indicators from 2016 to 2019, the top eight indicators were identified as increasing humidity > wetland management level > eutrophication > absorption of carbon dioxide > leisure and entertainment > population density > investment in ecological construction and protection > air purification. (1) Pressure indicators: compared with natural pressure, anthropogenic pressure (population density, W = 0.083) had a more marked effect on the plateau wetland ecosystem. (2) Wetland state indicators: increasing humidity services (W = 0.110) played a positive role in promoting the healthy and sustainable development of the plateau urban wetland ecosystem, and this indicator acts jointly with carbon dioxide absorption (W = 0.093), purifying the air (W = 0.065), regulating services and entertainment (W = 0.088) to promote the healthy development of wetlands for cities with arid climates on the plateau. The improvement of water eutrophication (W = 0.093) greatly affected the evaluation index of the wetland. (3) Response indicators: obviously, the management level of wetlands (average weight = 0.107), ecological construction and protection investment (W = 0.071), and other response indicators are positively correlated with the health of wetland ecosystems. Therefore, to improve the management level of wetland factors, it is necessary to increase investment in wetland ecological construction and protection to improve the wetland ecosystem, and to promote sustainable development.

Figure 3. Weights of National Wetland Assessment Indicators in Plateau Cities. For the meaning of EI, please refer to the table notes.
From the health evaluation results using the PSR-BP artificial network, it can be seen that (1) the health index of the Huangshui National Wetland Park has been increasing year by year, and the comprehensive scores were 0.746 (2016), 0.790 (2017), 0.884 (2018), and 0.877 (2019); (2) the spatial variation of PSR-BP neural network health comprehensive score was Beichuan Wetland > Haihu Wetland > Huoshaogou > Huangshui River > Ninghu Wetland (Figure 4); (3) among the three PSR types of indicators, the state indicators had the best recovery, while the comprehensive score of the response indicators increased year by year, showing a gradually increasing impact on the restoration of the Huangshui (Figure 5); (4) The top indicators with a major contribution to the restoration were leisure and entertainment service value (2016), carbon dioxide absorption service (2017), eutrophication (2018), and wetland management level (2019).
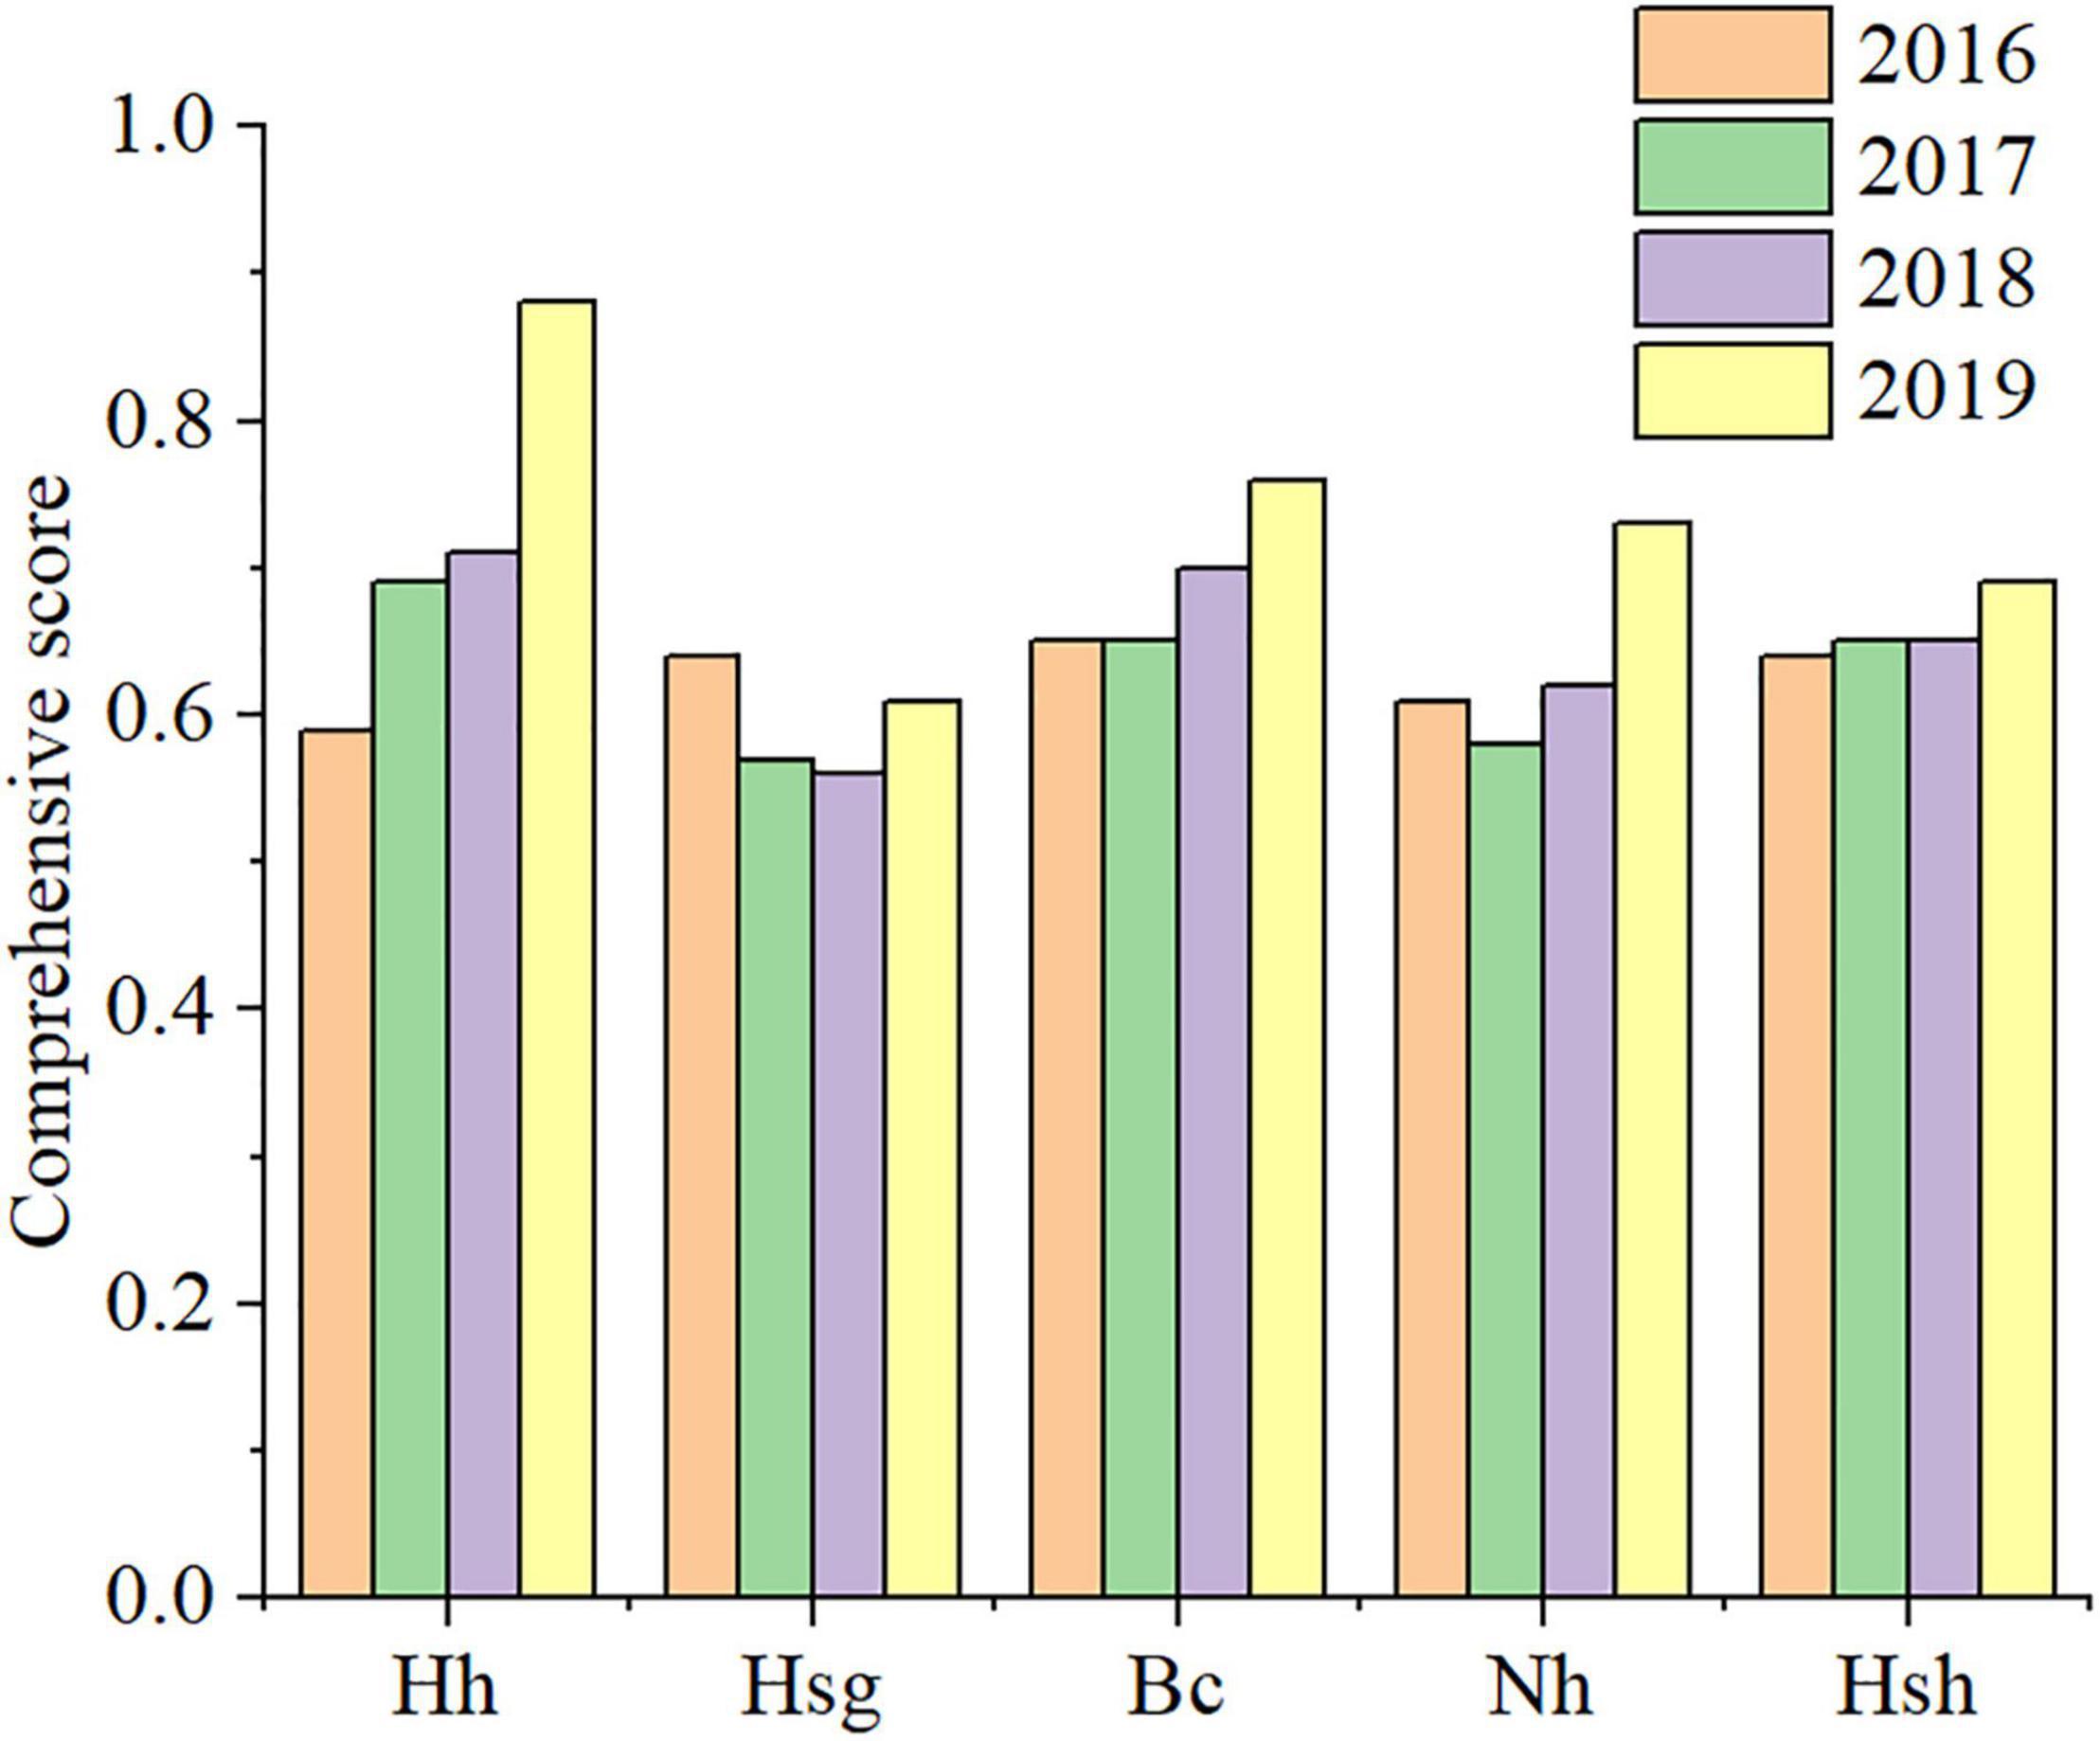
Figure 4. Spatial distribution of the comprehensive health score of the Huangshui wetland based on the PSR-BP neural network. Hh (Haihu Wetland); Hsg (Huoshaogou Wetland); Bc (Beichuan Wetland); Nh (Ninghu Wetland); Hsh (Huangshuihe Wetland). Yellow represents 2016; pink represents 2017; green represents 2018; blue represents 2019.
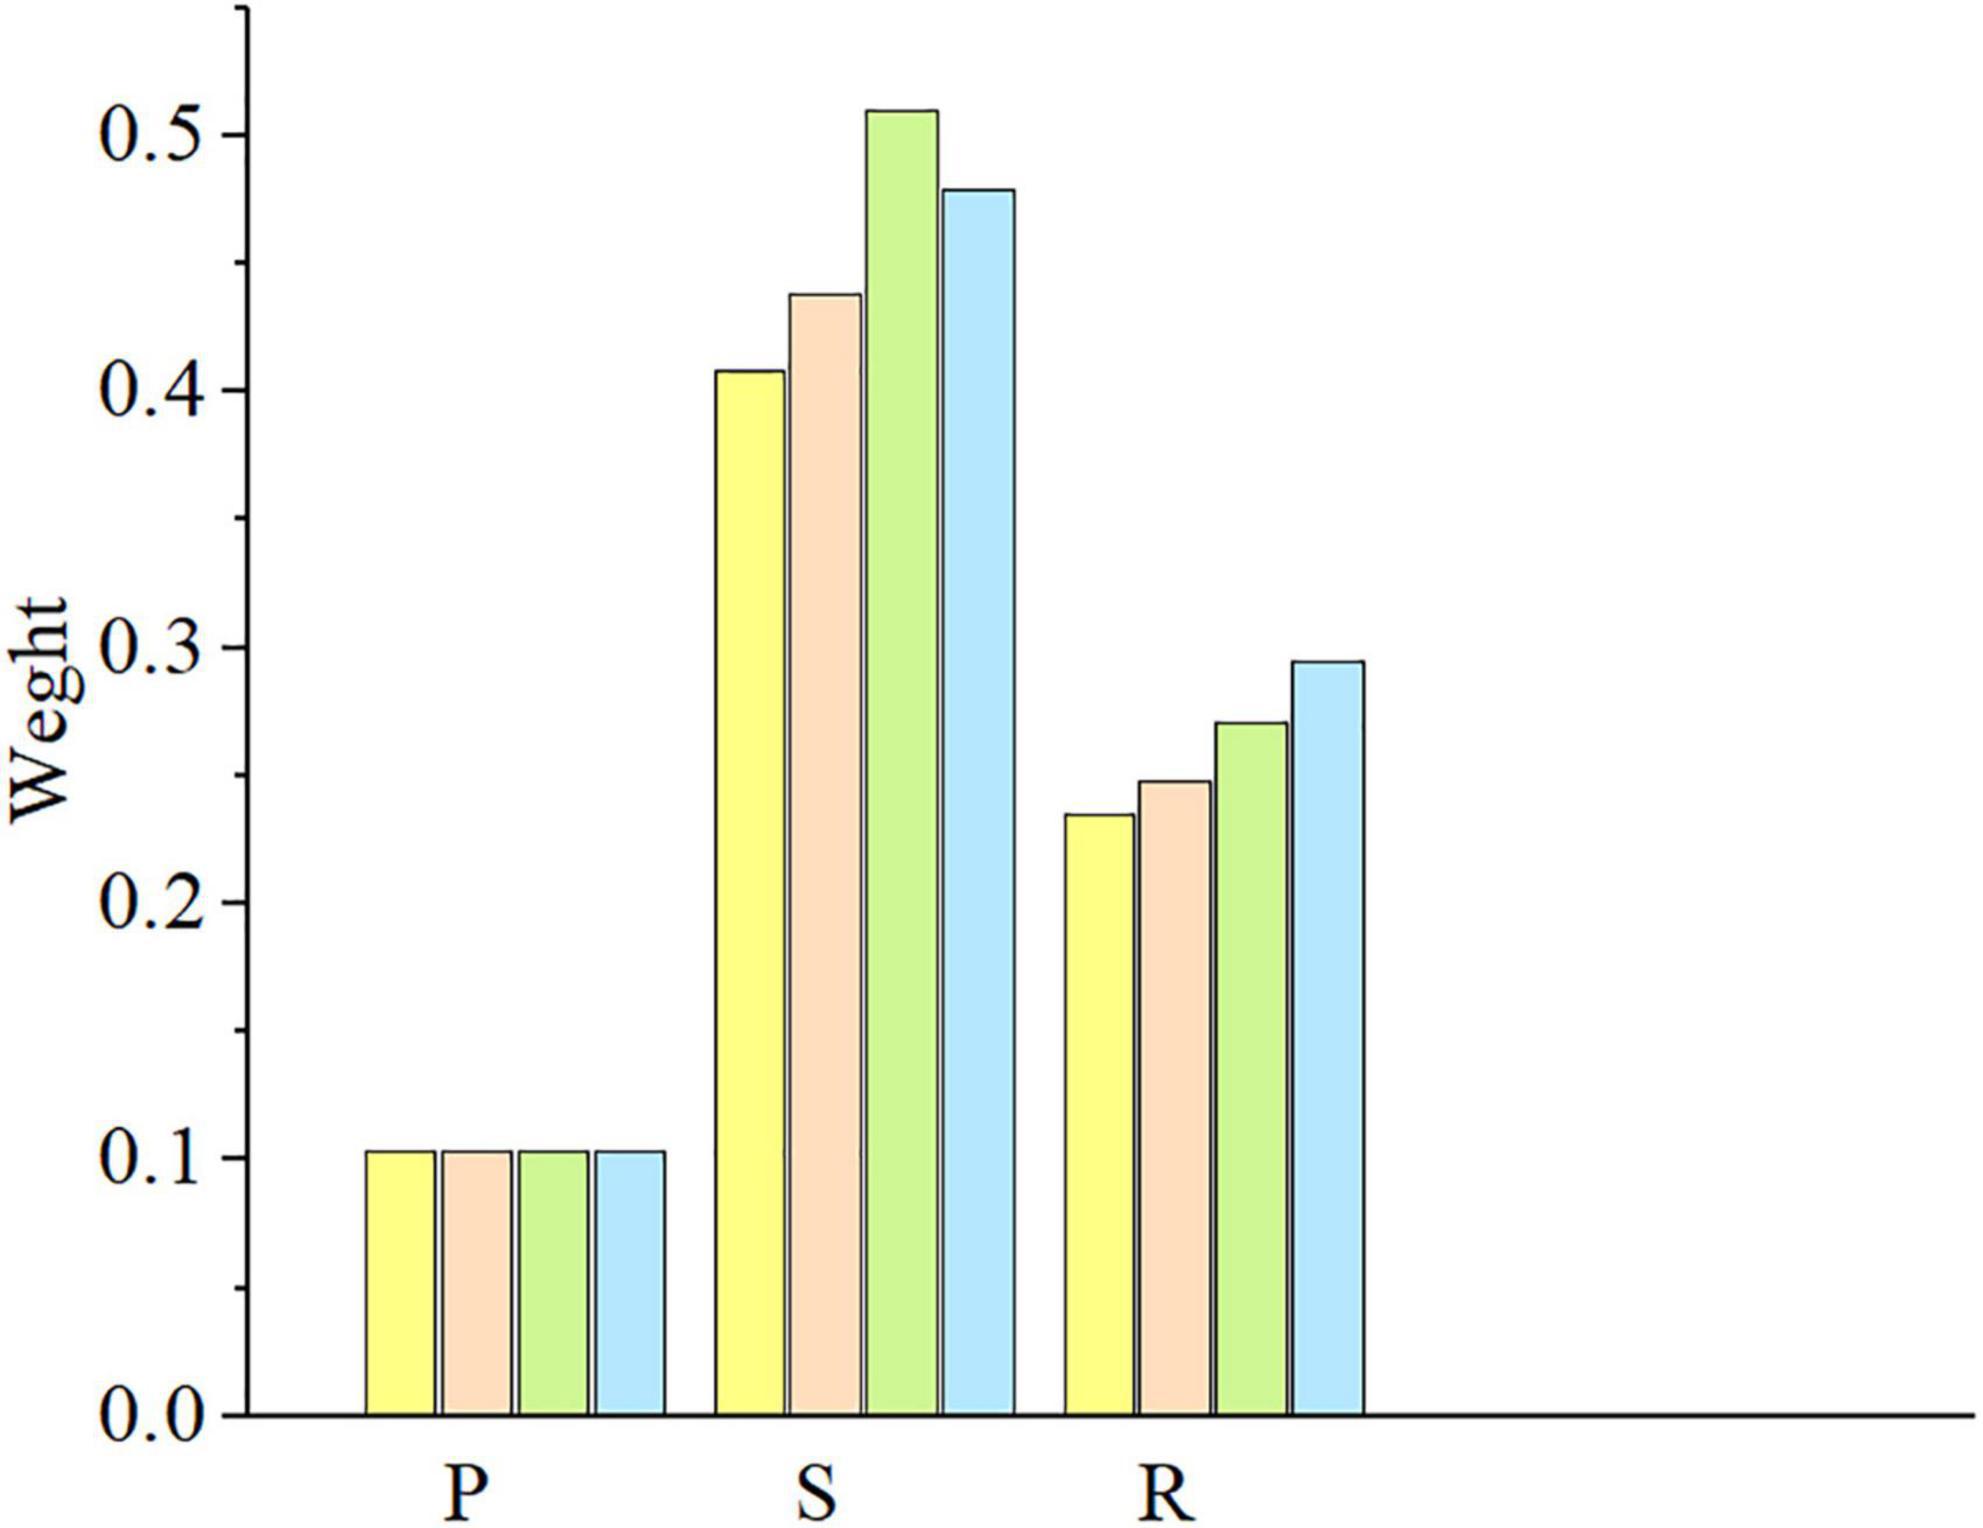
Figure 5. The comprehensive score of Huangshui wetland health based on the PSR-BP neural network. Yellow represents 2016; pink represents 2017; green represents 2018; blue represents 2019. P (Pressure); S (State); R (Response).
Compared with the general PSR evaluation results, the PSR-BP neural network evaluation results were found to be parallel. For comparing the scores of the three comprehensive indicators (Figure 6), based on the results of the general PSR health evaluation, the weight of the stress, state, and response indicators was 0.258, 0.637, and 0.105, respectively. The status indicators were the most important ones for the health restoration of the Huangshui wetlands (Figure 6). The comparison of comprehensive health scores was consistent with the evaluation outcome of the previous result documenting an increase year by year (Figure 7). For the comparison of restoration contribution indicators, in the general PSR evaluation results, the indicators that contributed the most to the restoration were leisure and entertainment service value (2016), cumulative soil erosion area, land-use intensity (2017), eutrophication (2018), and plant height (2019). In 2016 and 2018, the indicators with the largest contribution to the annual recovery were consistent.
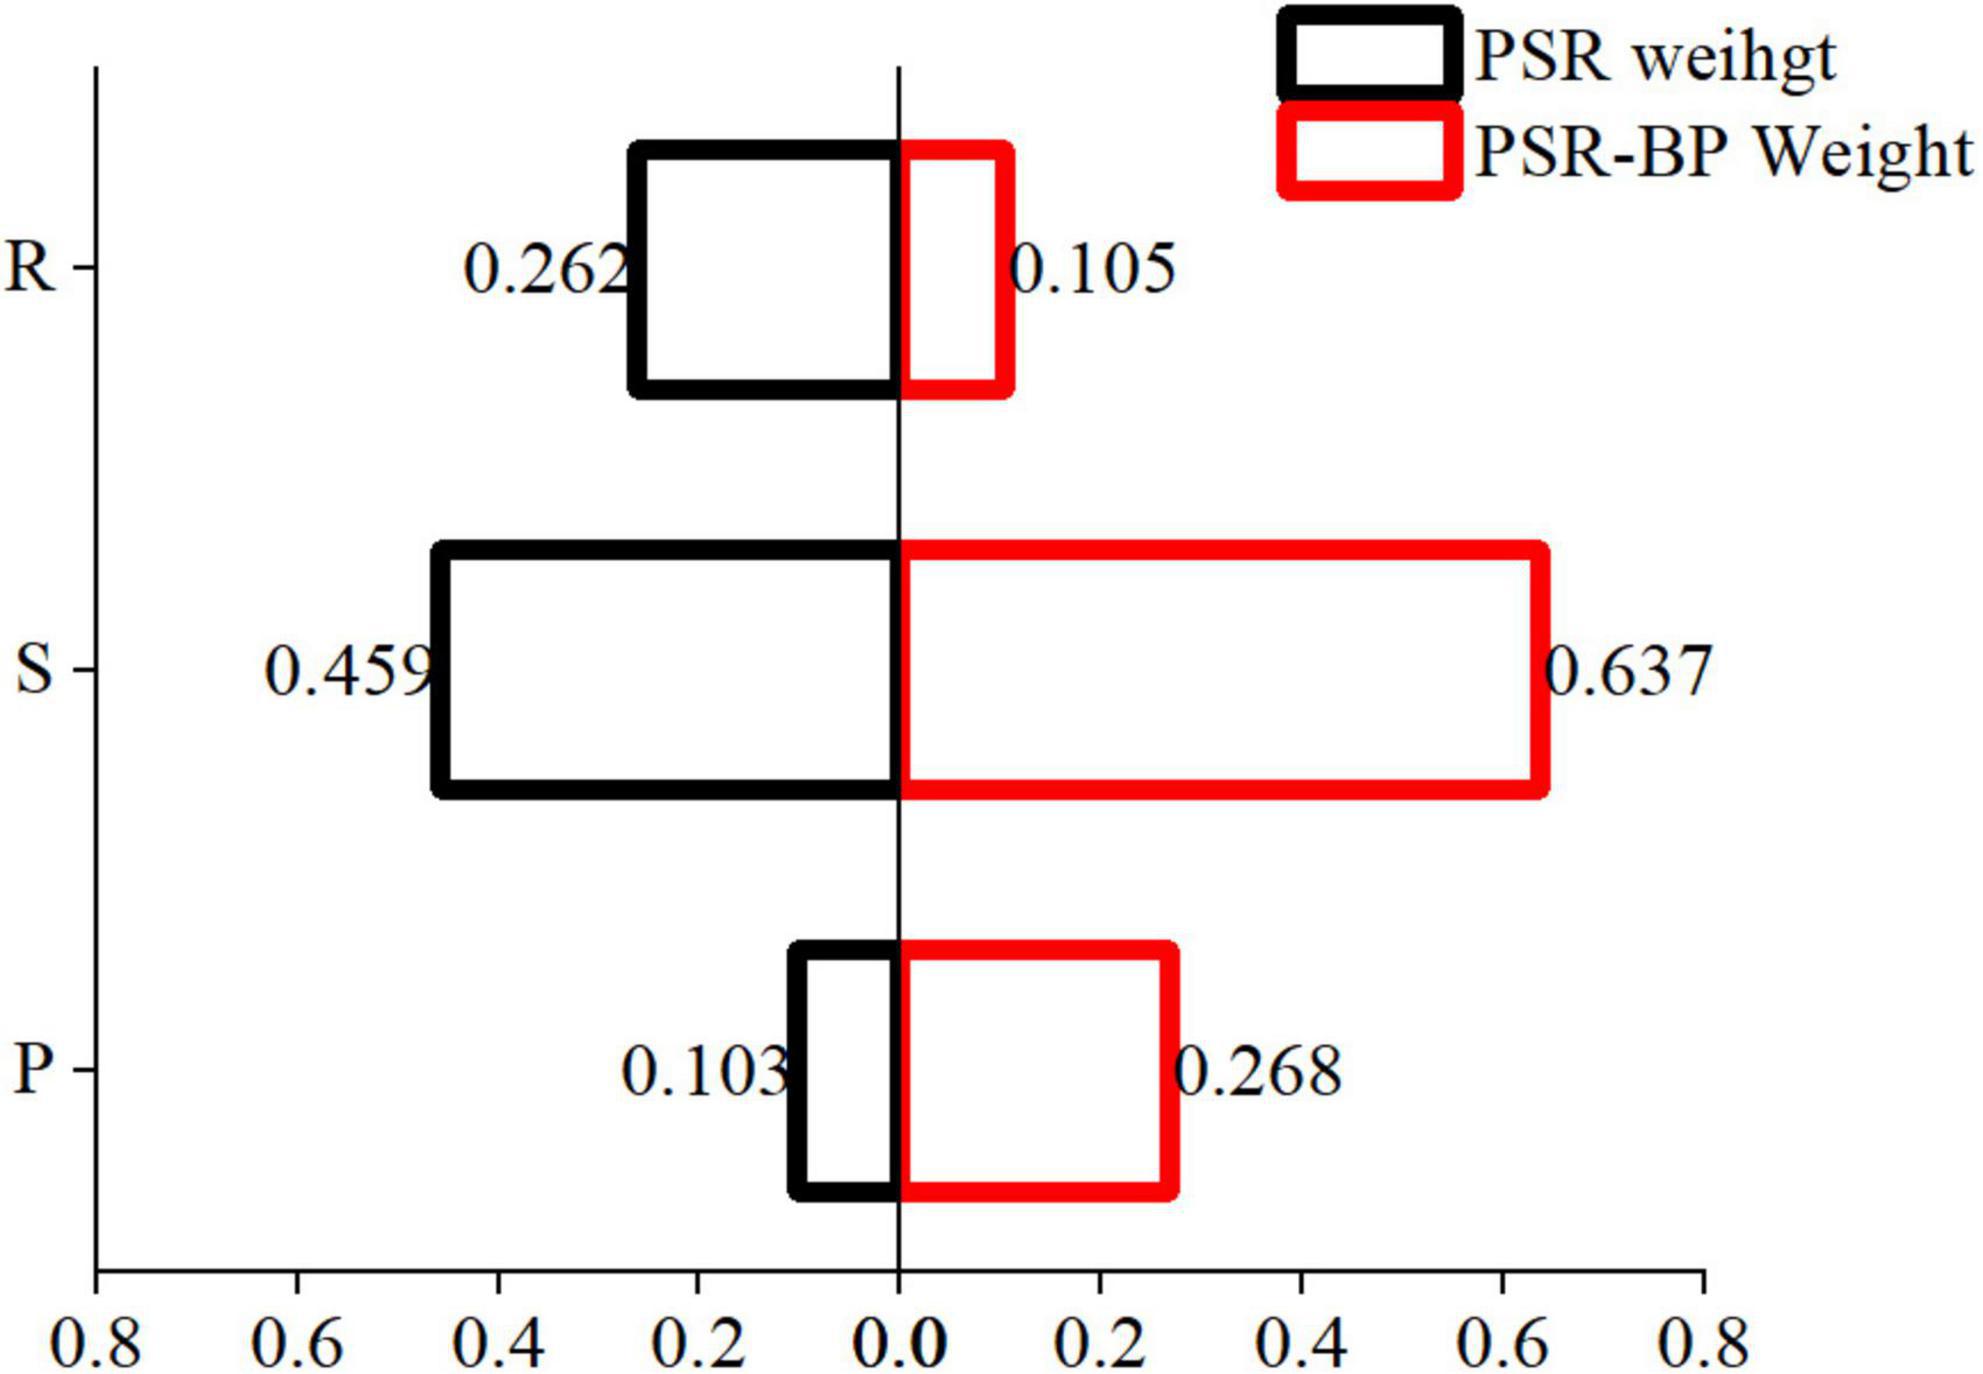
Figure 6. Comprehensive score of health evaluation index of urban wetland. The black trend line A represents the health score of the Huangshui wetland obtained from the PRS-BP neural network model. The red trend line B represents the health score of the Huangshui wetland obtained from the ordinary PRS model. P (Pressure); S (State); R (Response).
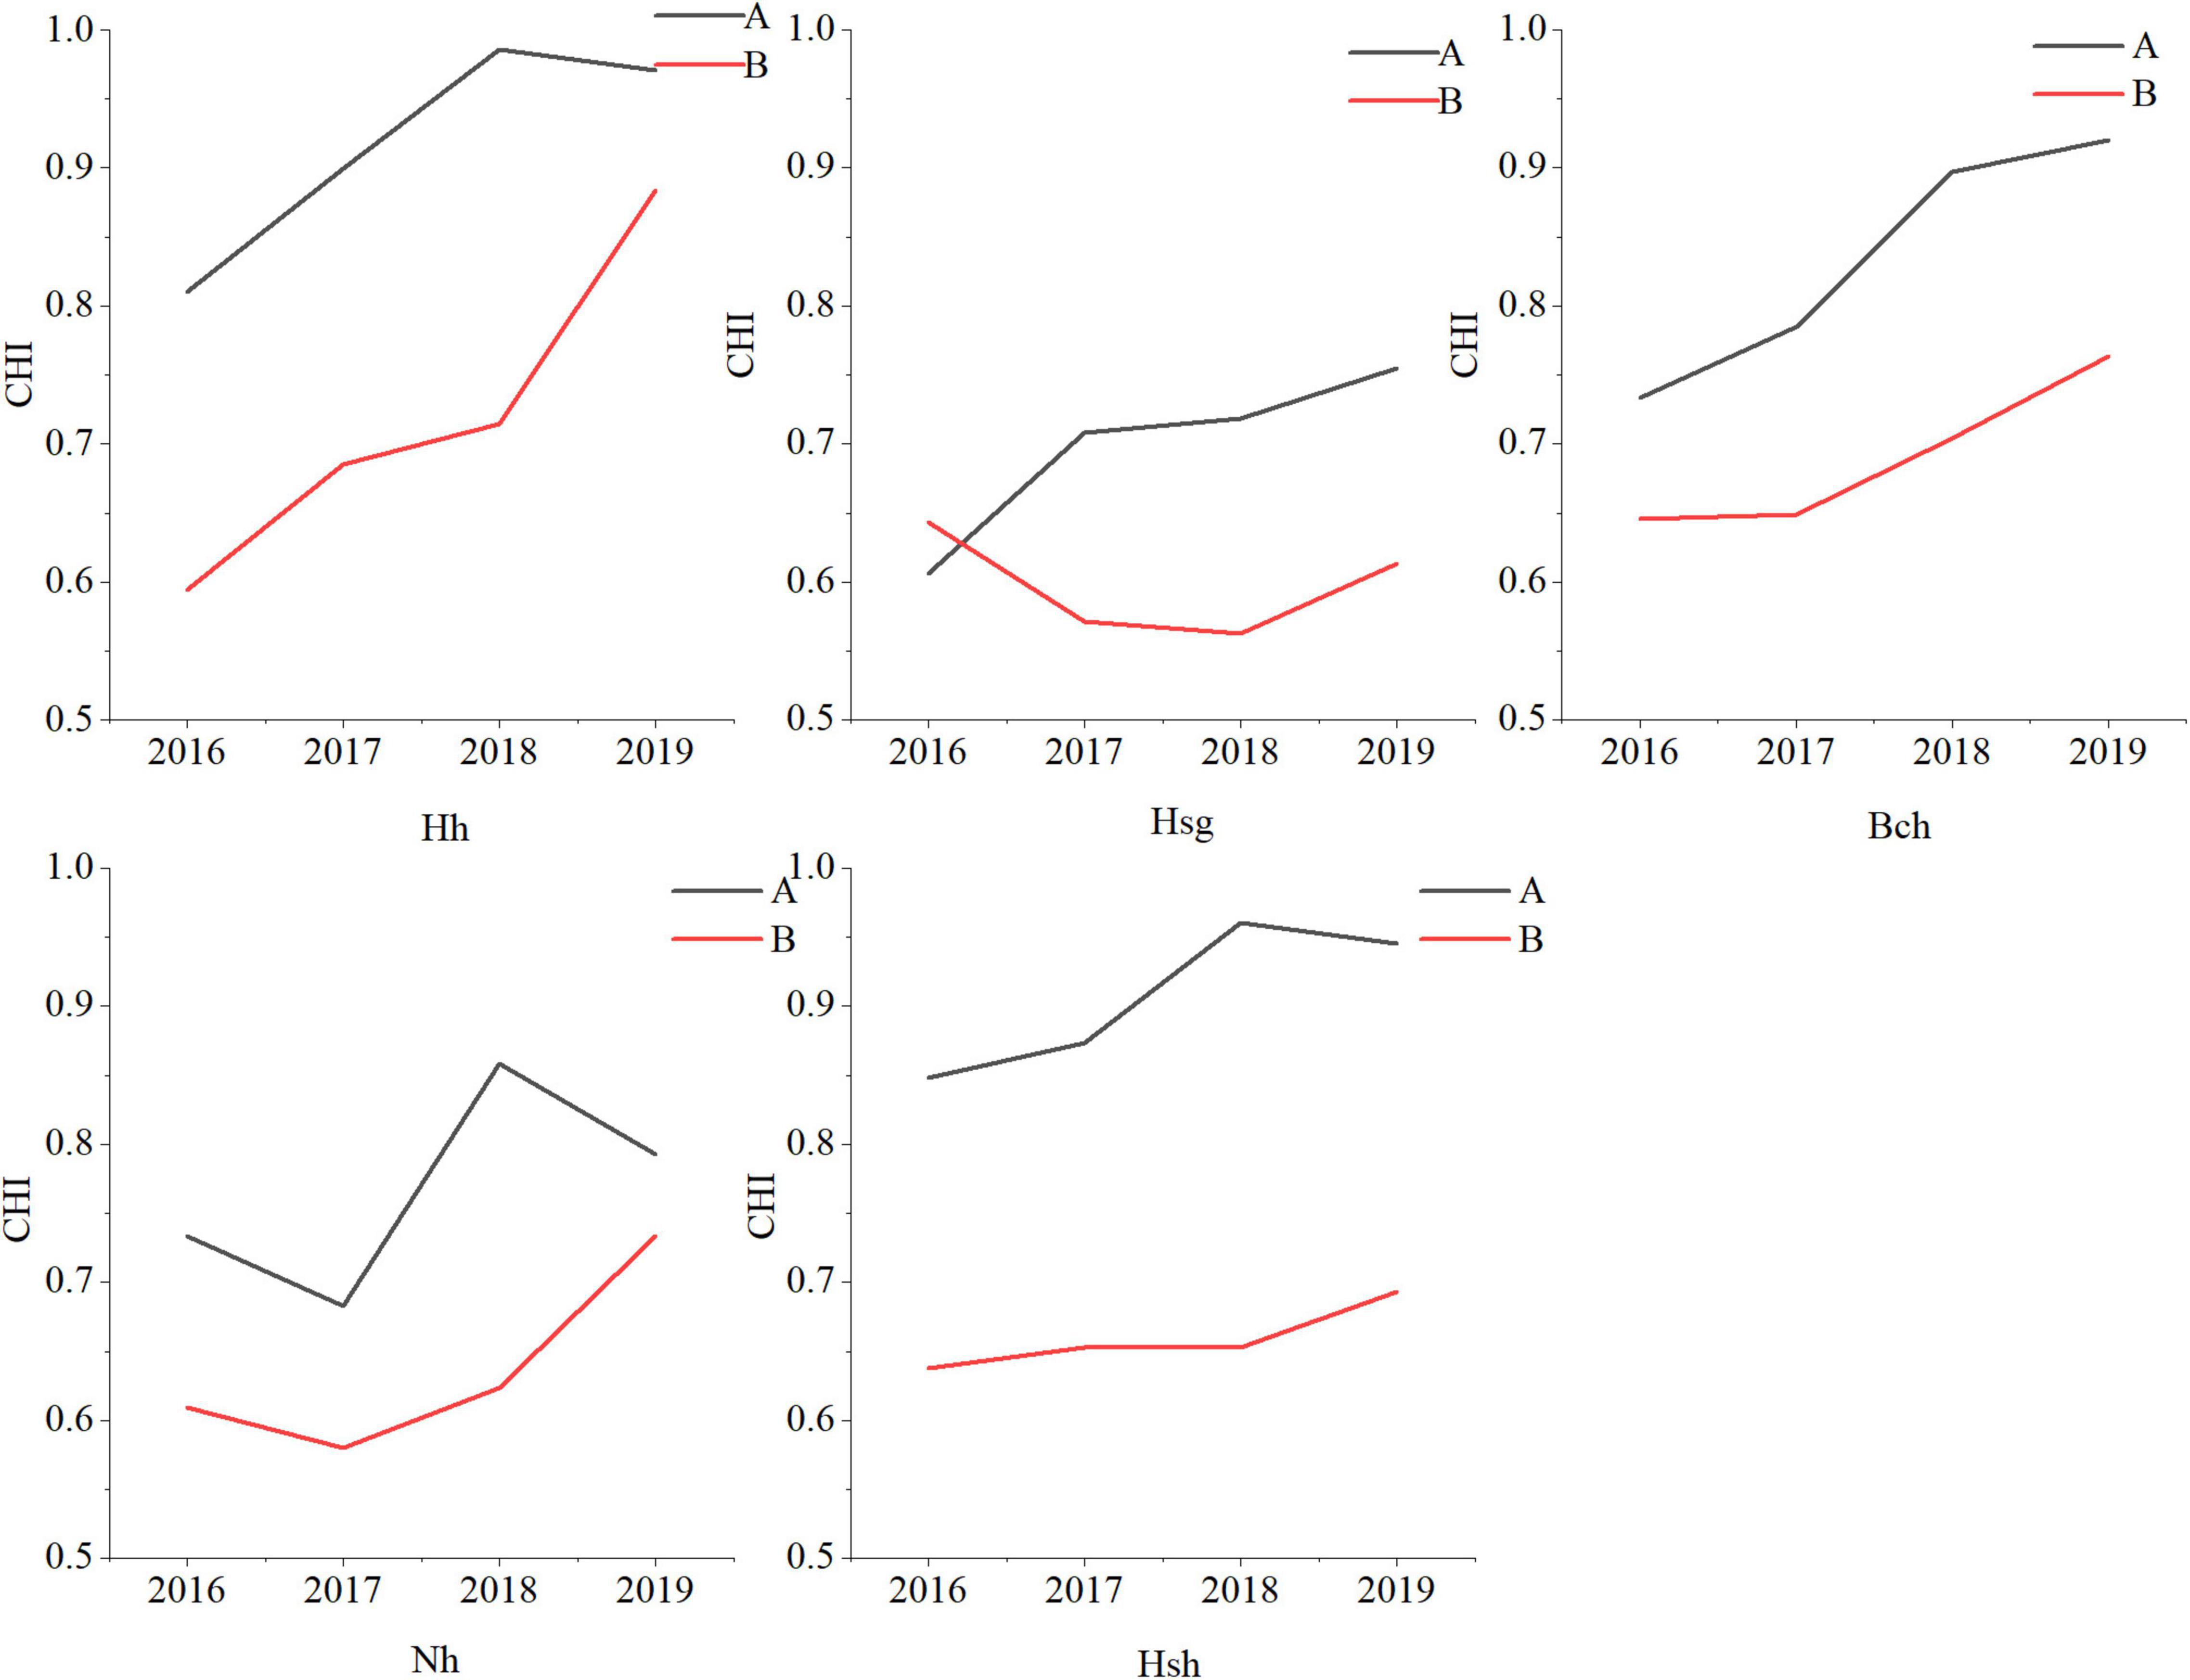
Figure 7. Interannual variations of health score of wetlands in Huangshui. A represents the health score of the Huangshui wetland obtained from the PRS-BP neural network model. B represents the health score of the Huangshui wetland obtained from the ordinary PRS model. Hh (Haihu Wetland); Hsg (Huoshaogou Wetland); Bc (Beichuan Wetland); Nh (Ninghu Wetland); Hsh (Huangshuihe Wetland).
The advantages of this research method lie in (1) giving the index weight: the PSR-BP neural network wetland health evaluation model adopted the combination of AHP method and BP artificial neural network to give the index weight. Compared with the single PSR model, the index weight reduced subjectivity and was more objective and accurate. (2) screening of indicators: This model was fitted with the indicator data for four consecutive years, so that the selected evaluation indicators were more in line with the recovery characteristics of the study area. (Figures 8, 9) show that the trend of A curve is more in line with the wetland health status, and the evaluation indicators are more targeted and representative; The representative indicators suitable for evaluating the health of plateau urban wetland ecosystem were found: population density, eutrophication level, increasing humidity, carbon dioxide absorption, air purifying, recreation, wetland management level and investment in ecological construction and protection.
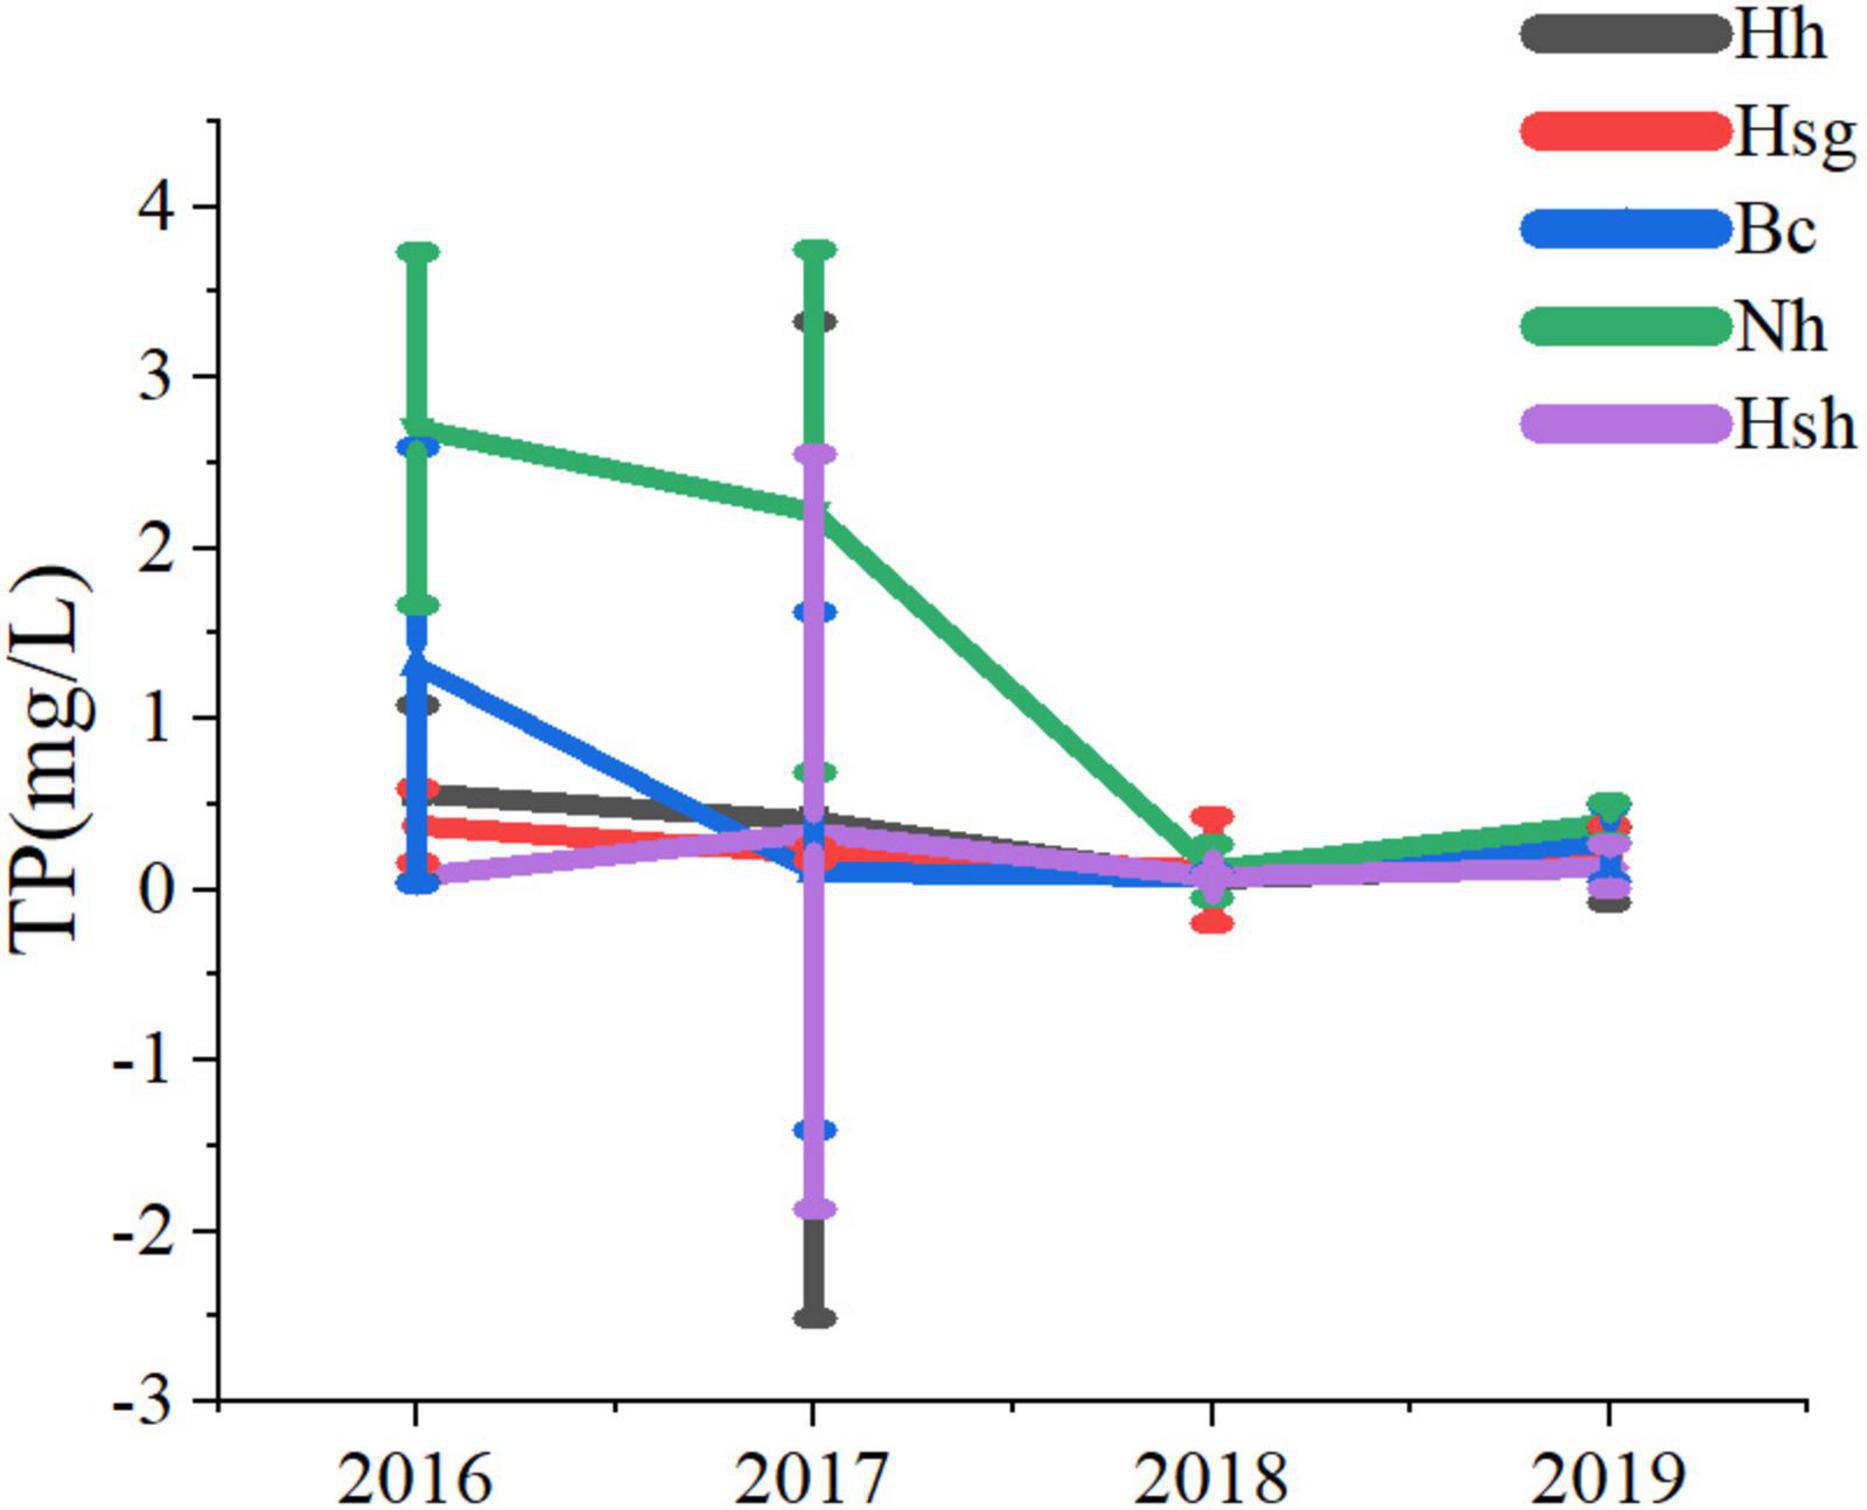
Figure 8. Annual changes of eutrophication in Huangshui wetland. TP (Total Phosphorus), The unit of concentration is mg/L; Hh (Haihu Wetland); Hsg (Huoshaogou Wetland); Bc (Beichuan Wetland); Nh (Ninghu Wetland); Hsh (Huangshuihe Wetland).
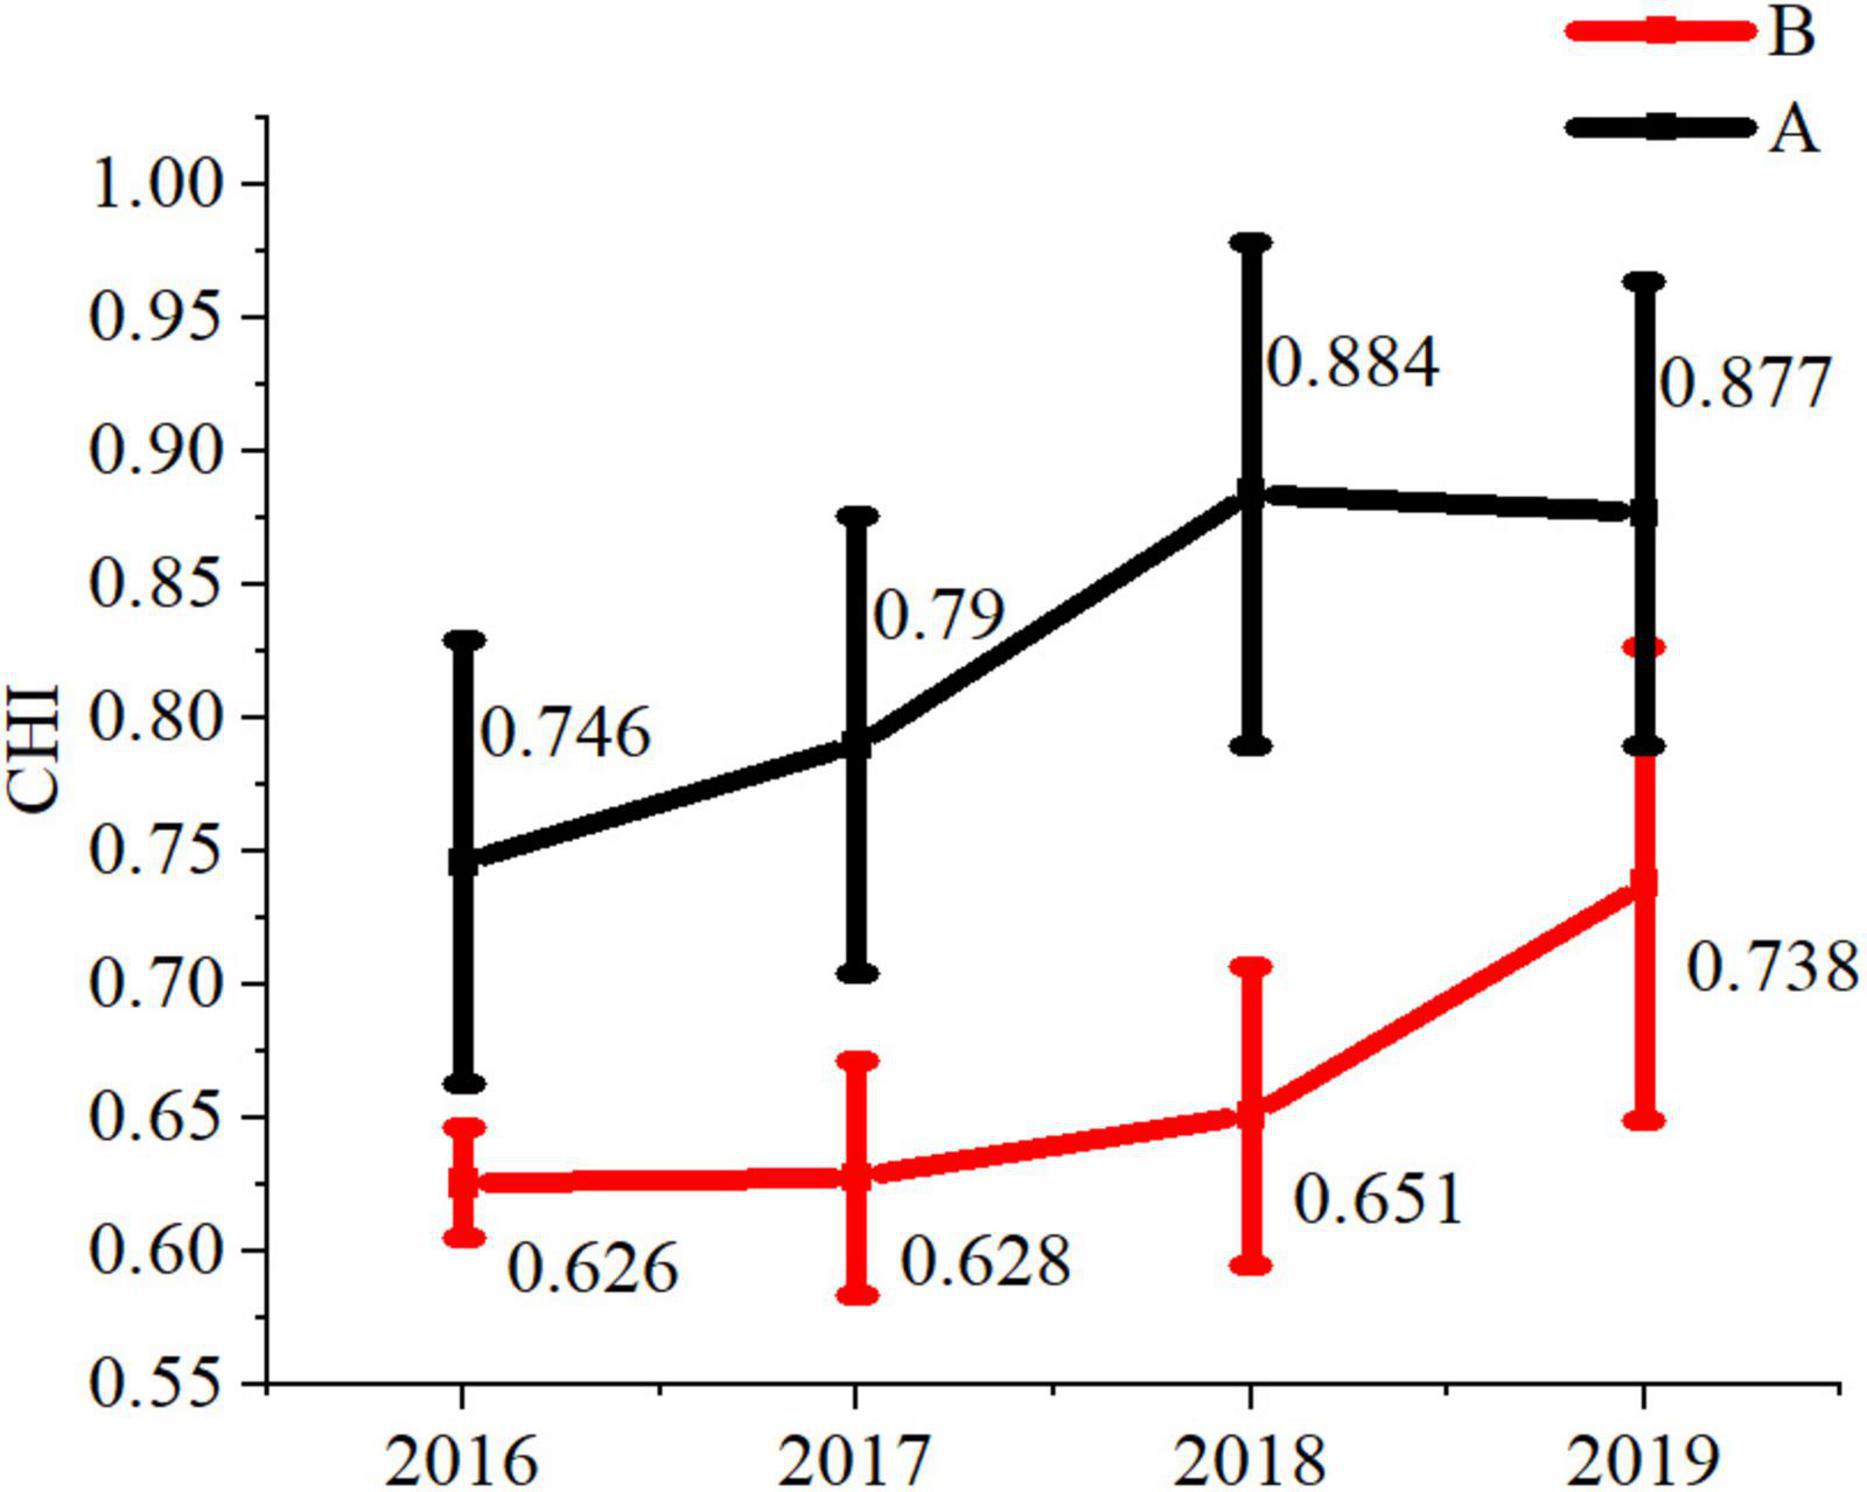
Figure 9. The red trend line indicates the health evaluation results of the ordinary PSR model. The black trend line represents the health evaluation results of the PSR-BP neural network model.
The ecological environment of the wetlands in Huangshui National Wetland Park is divers, and the objectives and effects of restoration projects are different. The bird habitats and the four wetlands vegetation were restored, and the number and diversity of wild birds in the wetland were significantly improved. Among them (Figure 10), Beichuan, with the largest water area, had the highest Shannon-Wiener index (H = 2.91). Through the construction of constructed wetland, vegetation ecological restoration combined different vegetation reasonably (merged plants, floating plants, and floating left plants). The average richness and coverage of wetland plants increased dramatically. The average coverage of the four wetlands was up to 81% (Mao et al., 2018), and the vegetation biomass of Ninghu wetland increased significantly; The restoration projects from 2016 to 2017 mainly focused on the water purification project of Haihu wetland, and carried out external pollution control, constructed wetland construction and wetland desilting. The total phosphorus pollution of water quality was decreased, the phenomenon of eutrophication was considerably improved (Figure 8), and the improvement rate of wetland score was arrived at 22.10% (Figure 4).
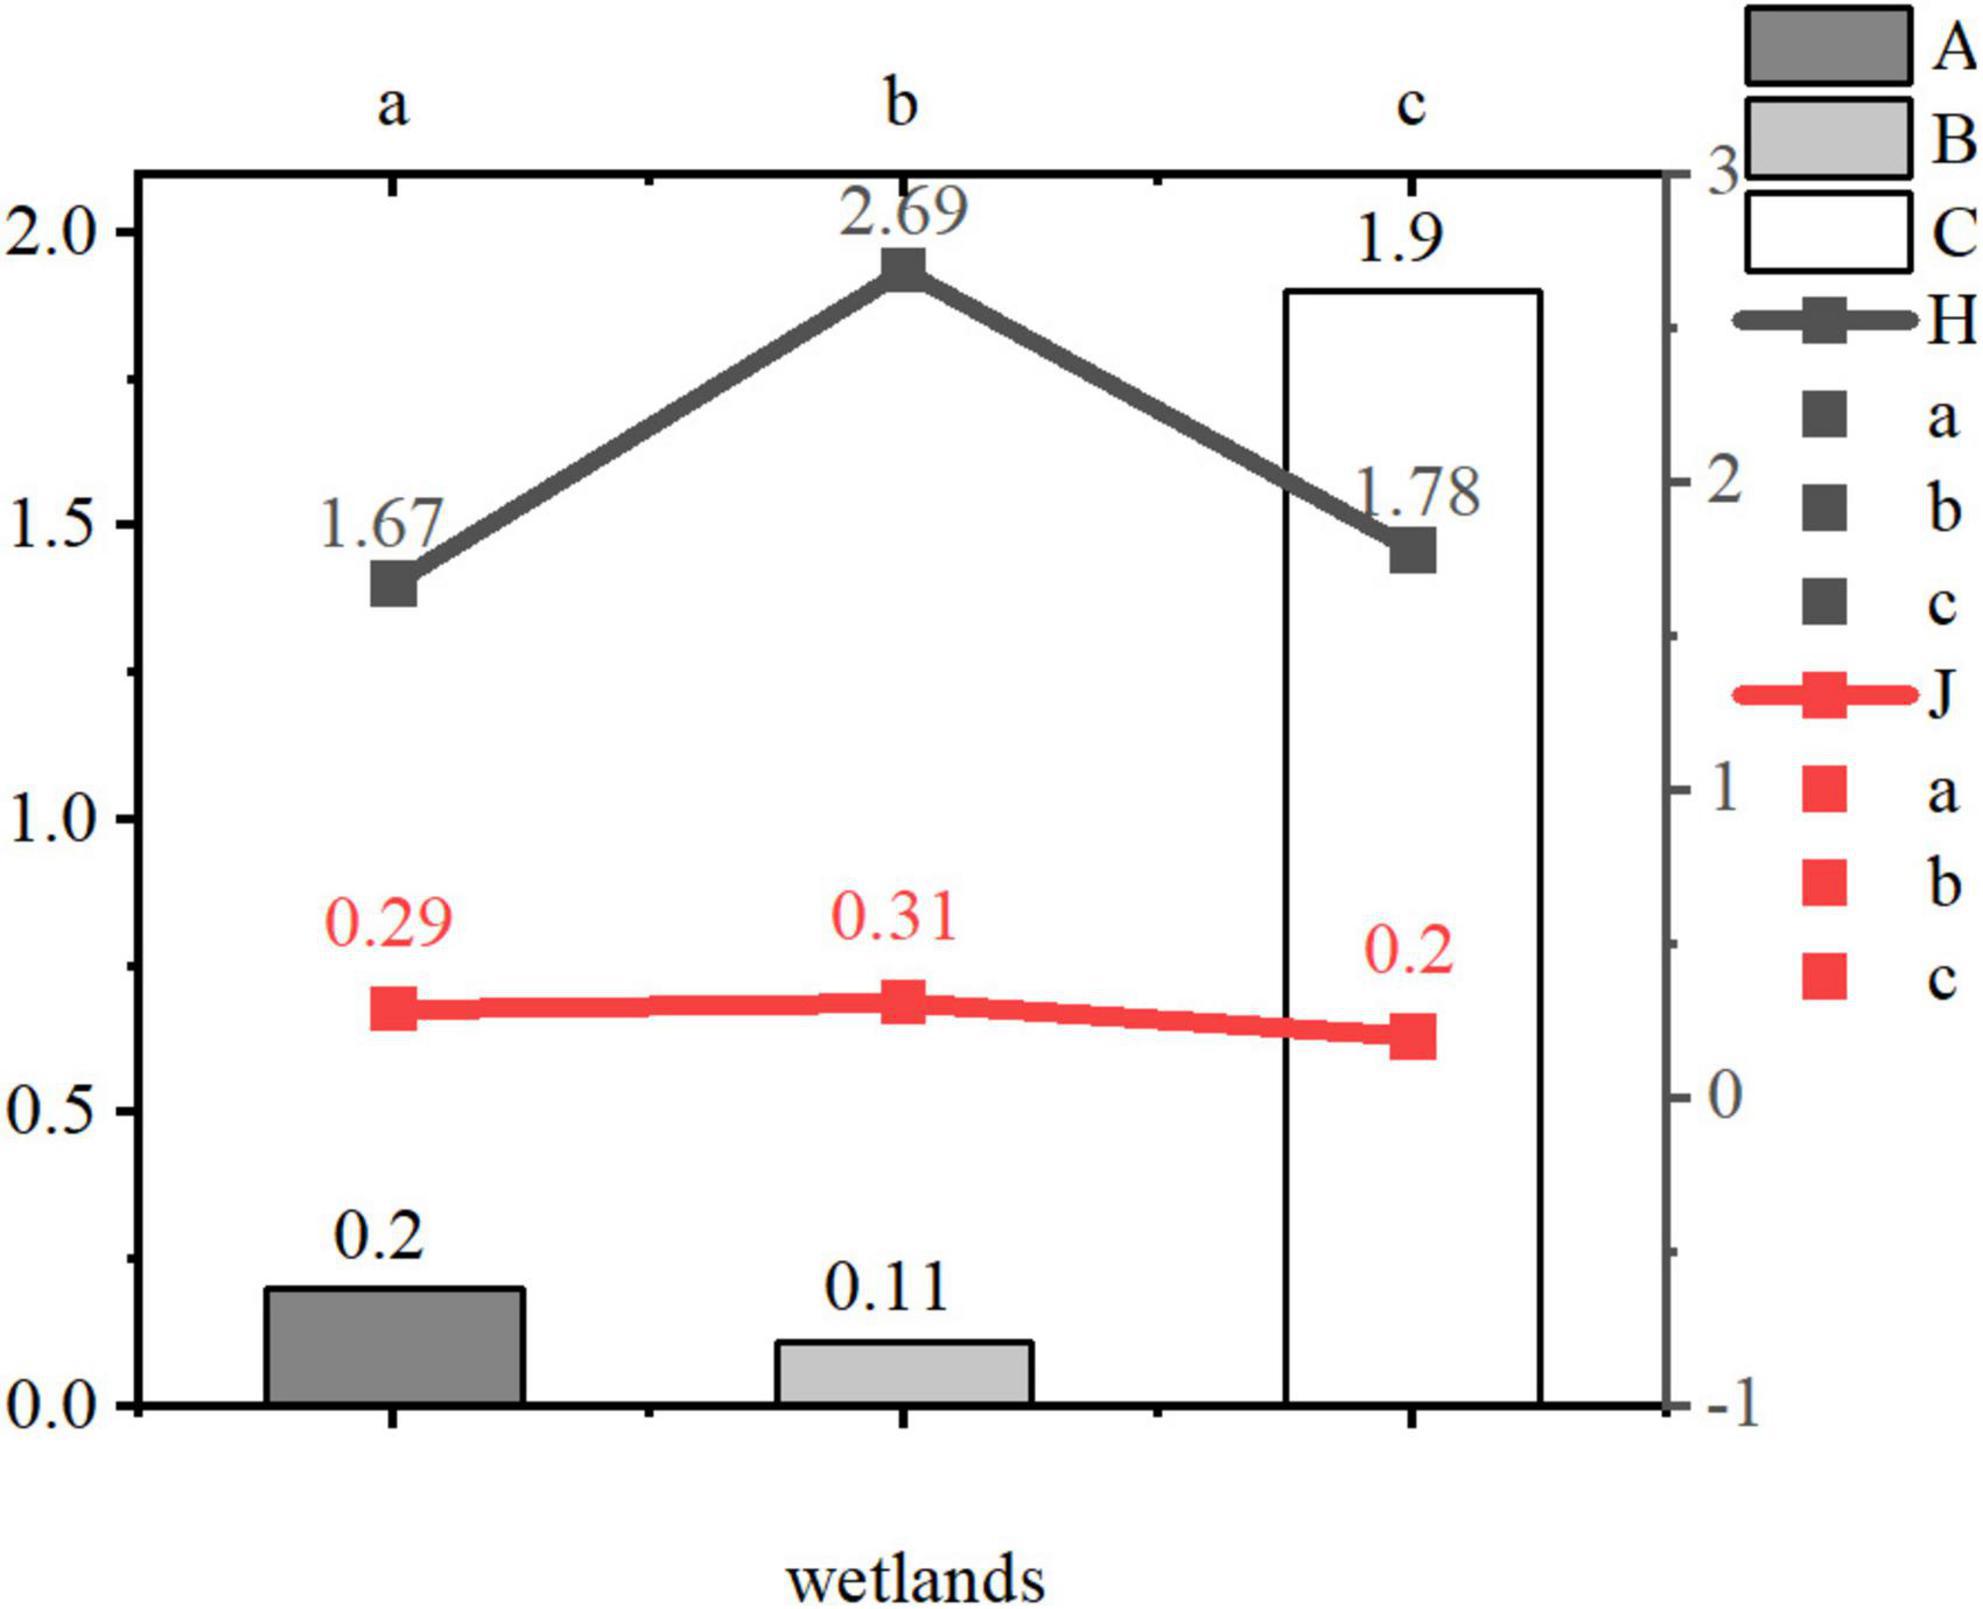
Figure 10. (a): “H” is the Shannon Wiener index of birds in 2019. “J” is the Pielou uniformity index of birds in 2019. “a”: Haihu wetland. “b”: Beichuan wetland. “c”: Ninghu wetland. “A”: Increase rate of wild bird species in 2018-2019. “B”: Increase rate of waterfowl in 2018-2019. “C”: Increase rate of waterfowl in 2018-2019.
Analyze the spatial differences of PSR-BP neural network based on artificial neural network, and draw new the implications for more accurate management, and conservation of alpine urban wetlands:
(1). There are significant differences in the spatial distribution of wetlands. The selection of evaluation indicators should consider the characteristics of wetland ecological environment, regional development status, risks and pressures faced, so as to improve the accuracy of the health evaluation results.
(2). The bird habitat restoration project is appropriate for wetlands with large water area and sufficient living space to ensure the safe distance of birds. At the same time, in order to prevent habitat destruction, it is necessary to reduce the Land use intensity (P < 0.01) and limit the water consumption for irrigated agriculture (P < 0.05, Figure 11) in the wetland, so as to improve the survival rate of birds.
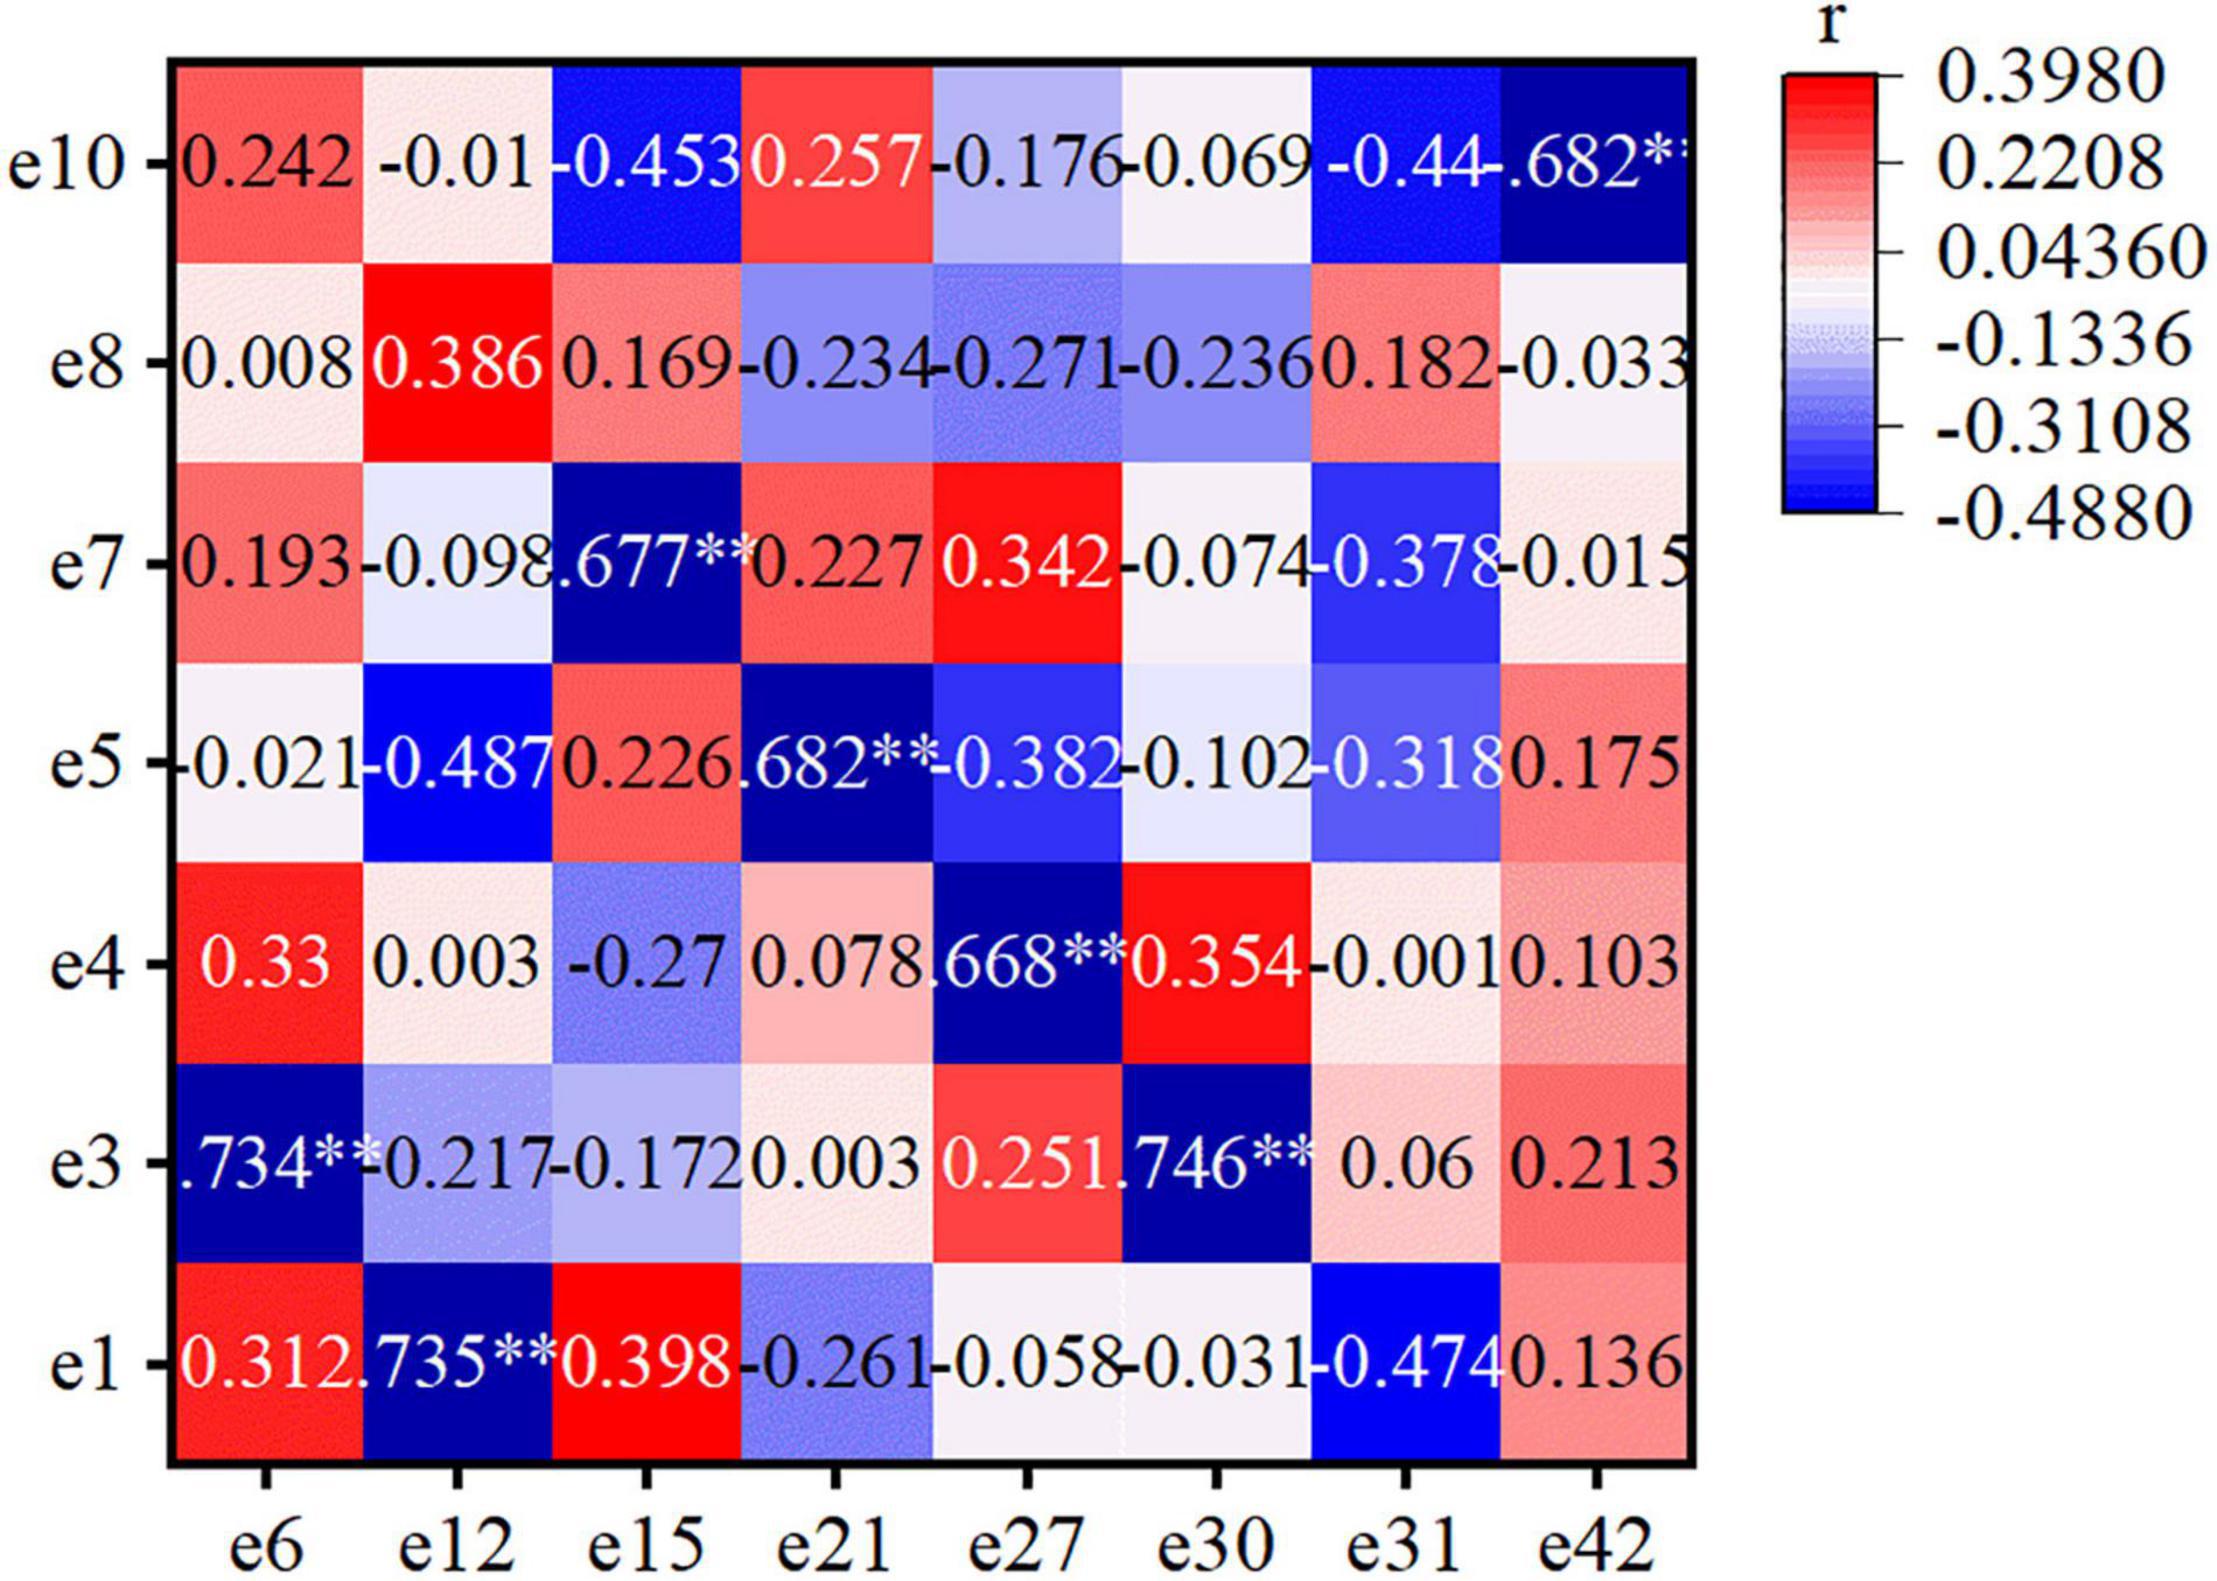
Figure 11. Correlation analysis of the evaluation indicators for the plateau urban national wetland in Huangshui. Population density e1; green coverage rate of the built-up area e3; cumulative area under soil erosion control e4; number of tourists e5; sewage treatment e6; land use intensity e7; sewage discharge e8; ecological environment hydration e10; low temperature e12; wildlife survival rates e15; dissolved oxygen e21; total nitrogen e27; absorb carbon dioxide e30; oxygen release e31; disposition of surrounding population e42.
(3). While considering the specific water pollution indicators, the water purification measures should strengthen the external pollution control (domestic sewage, urban road surface rainwater and industrial sewage) to control the source and intercept the sewage, so as to ensure the improvement and play of the ecological purification function of the wetland.
(4). Considering the characteristics of wetland environmental pollution, the vegetation reorganization of constructed wetland fully combines the purification function of wetland on the botanical characteristics of plants. Targeted plant reorganization can purify the main pollutants, improve the green space coverage and improve the carbon dioxide fixation of wetland (r = 0.746, P < 0.01).
Effective evaluation results require accurate analysis and evaluation of the sources uncertainty (Hines et al., 2018). Here we calculated the average values of three secondary level indicators (Pressure, State, and Response) and their standard deviation (± SD) to evaluate the potential uncertainty of the assessment affected by time and space (Figure 12).
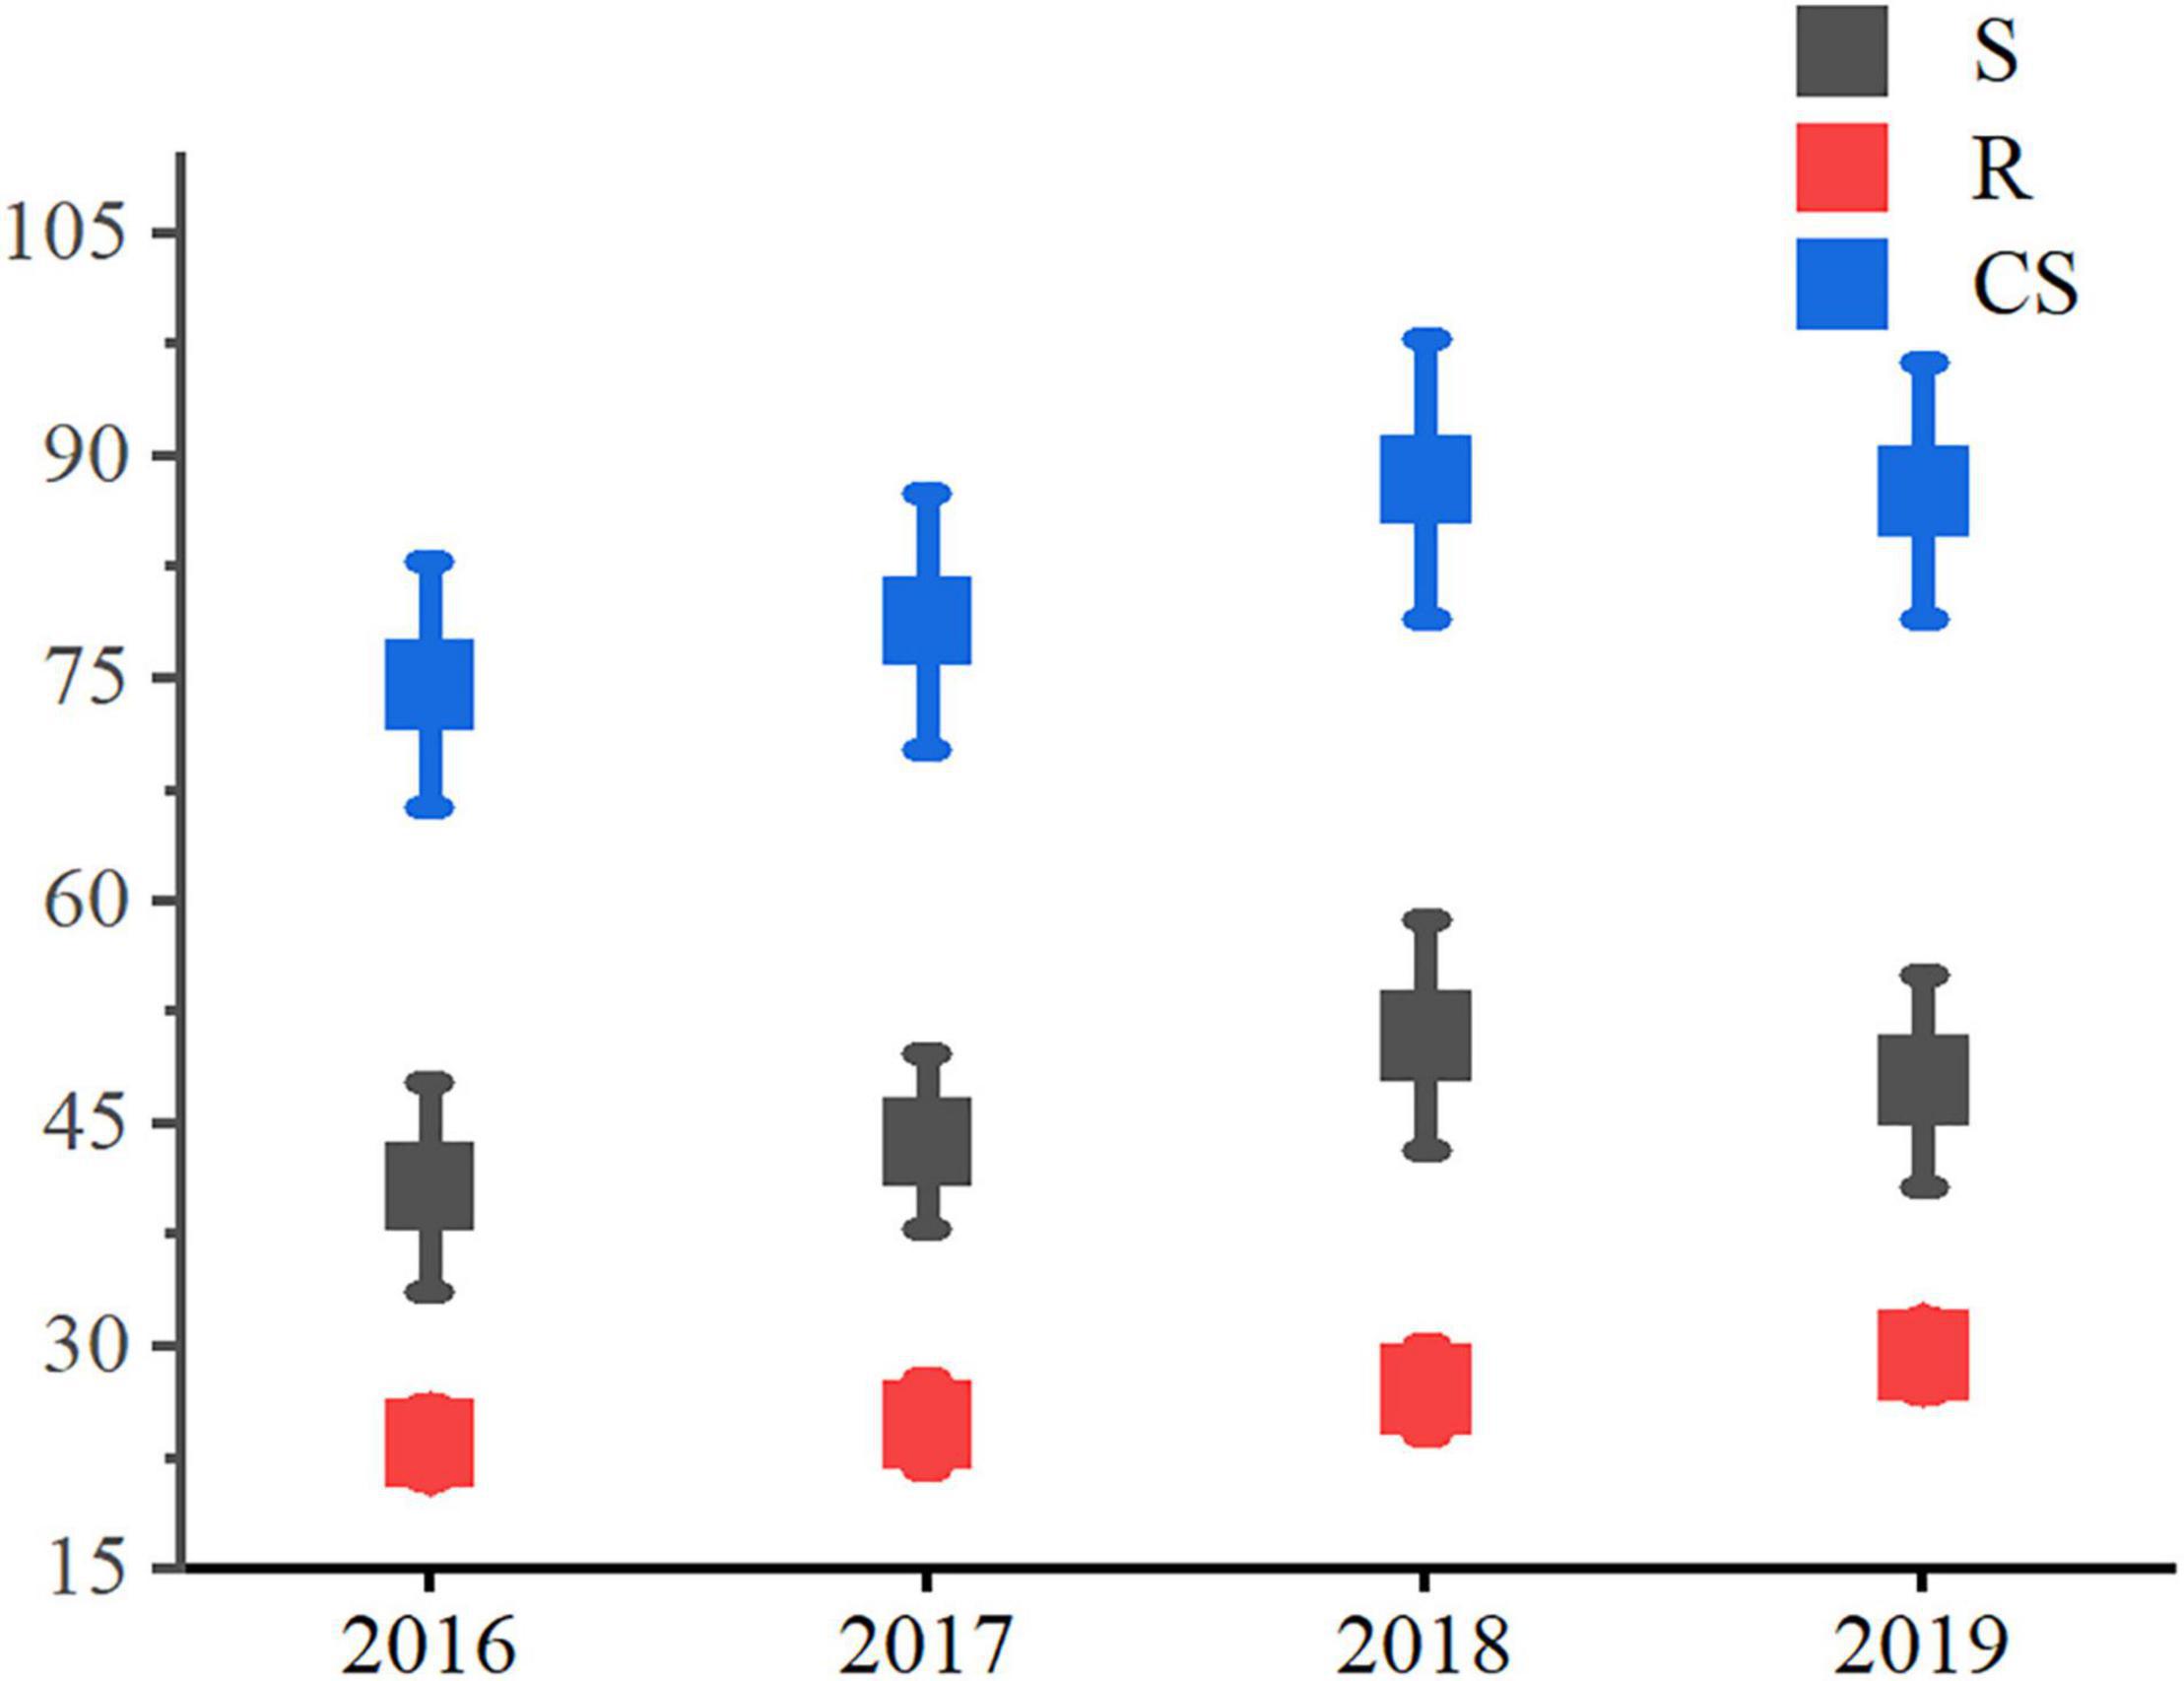
Figure 12. Uncertainty analyses of assessment of four wetlands. “a”: Haihu wetland. “b”:Huoshaogou wetland. “c”: Beichuan wetland. “d”: Ninghu wetland. “e”: Huangshuihe wetland. “S”: Average score of state indexes. “R”: Average score of response indexes. “Cs”: Average score of comprehensive health score.
Time and space lead to the uncertainty of indicators, resulting in the difference of model evaluation results. Because the average uncertainty of spatial distribution index is so 0.5, which is about 4.26% of the average comprehensive score of the study area, the average uncertainty of status index (4.48%) > the average uncertainty of response index (2.51%); Under the influence of time change, the average uncertainty is nd play of thnting for about 6% of the average comprehensive score of the wetland in the study area. The average uncertainty of state index and response index is 6.94 and 2.83% respectively; the error caused by artificial selection of neural network nodes increases the uncertainty of index weight.
Taking Beichuan as an example, its CRS ranges from 75.64 to 91.11, which is owned by a fairly good level. The pressure of traffic and population around the spatial distribution increases gradually, and the average uncertainty is 7.73%. The climate change over time has an effect on the wetland evaluation results. Owing to the uncertainty, the uncertainty of different evaluation indicators of wetlands with different temporal and spatial distribution is different. In general, the uncertainty of state indicators is the largest.
Given China’s fast urbanization and eco-desires under the latest discourse on ecological civilization, the exploration focus of researchers is to find suitable ecological evaluation methods for urban wetlands (Wang, 2020). By combining PSR and BP artificial neural network models, a health evaluation model of plateau urban wetlands was built by using AHP and other methods, and a health evaluation model of plateau urban wetlands including 3 comprehensive indices and 45 evaluation indicators was constructed. The fitting results were of high quality, revealing the weight of the evaluation indicators of plateau urban wetlands and their synergy and trade-off relationship, and finding the evaluation factors that can truly evaluate the health of plateau urban wetlands. We used model to evaluate comprehensive health of wetlands from 2016 to 2019.
(1). The proposed method selects seven effective evaluation indexes, including the pressure index in PSR model: population density. Status indicators include humidity, eutrophication, carbon dioxide absorption and entertainment. Response indicators include wetland management level, ecological construction and protection investment.
(2). The evaluation results show that from 2016 to 2019, after taking wetland ecological restoration measures, the interannual comprehensive average score increased from 0.746 (2016) to 0.877 (2019). The overall health index of urban wetlands in the plateau has increased, indicating that ecological restoration has played an active role.
(3). Compared with the single PSR method, the PRS-BP model selects 8 indicators suitable for evaluating the health of plateau wetlands. Therefore, this model only evaluates 8 evaluation indicators, which is simple and operable. The time span of BP neural network model fitting index data is large. According to the output weight of the model, interference of highly variable indexes is eliminated, and the evaluation result is more accurate and reasonable. “
The datasets presented in this article are not readily available because none. Requests to access the datasets should be directed to LT, https://data.cnki.net/area/Yearbook/Single/N2020110002?z=D29.
The sample collection in this study was approved by the Management Committee of the Huangshui National Constructed Wetland.
LT, XM, and XW wrote the manuscript and performed the statistical analysis. XS, WT, YD, HY, ZD, FX, HZ, and XY contributed to the field and laboratory experiments. All authors contributed model construction, data analysis and manuscript revision.
The study was supported in part by the National Natural Science Foundation of China (Project No. 51669028), “Western Young Scholars” project of the Chinese Academy of Sciences and Qinghai Provincial Key Laboratory of Natural Geography and Environmental Process (2020-zj-y06).
The authors declare that the research was conducted in the absence of any commercial or financial relationships that could be construed as a potential conflict of interest.
All claims expressed in this article are solely those of the authors and do not necessarily represent those of their affiliated organizations, or those of the publisher, the editors and the reviewers. Any product that may be evaluated in this article, or claim that may be made by its manufacturer, is not guaranteed or endorsed by the publisher.
We would appreciate two reviewer’s valuable comments on our manuscript. We would also appreciate Xianming Yang, Kai Du, Yanxiang Jin, Xin Jin, and Nana Zhang for their help in field work.
The Supplementary Material for this article can be found online at: https://www.frontiersin.org/articles/10.3389/fevo.2022.866597/full#supplementary-material
Ahn, C., and Schmidt, S. (2019). Designing wetlands as an essential infrastructural element for urban development in the era of climate change. Sustainability 11:1920. doi: 10.3390/su11071920
Asare, E. A., Assim, Z. B., Wahi, R. B., Tahir, R. B., and Droepenu, E. K. (2021). Application of fuzzy evaluation technique and grey clustering method for water quality assessment of the coastal and estuaries of selected rivers in Sarawak. Bull. Natl. Res. Centre 45, 156–167. doi: 10.1186/s42269-021-00616-9
Asomani-Boateng, R. (2019). Urban wetland planning and management in Ghana: a disappointing implementation. Wetlands 39, 251–261. doi: 10.1007/s13157-018-1105-7
Bian, J. M., Hu, Y. X., Li, Y. S., Ma, Y. X., and Bian, J. (2014). Study on water quality evaluation in the source area of Liaohe River based on BP neural network. Soil Water Conserv. Res. 21, 147–151. doi: 10.13869/j.cnki.rswc.2014.01.029
Bolund, P., and Hunhammar, S. (1999). Ecosystem services in urban areas. Ecol. Econ. 29, 293–301. doi: 10.1016/S0921-8009(99)00013-0
Boyer, T., and Polasky, S. (2004). Valuing urban wetlands: a review of nonmarket valuations studies. Wetlands 24, 744–745. doi: 10.1672/0277-52122004
Cao, J. F., Ping, J. H., Oumar, S., Jiang, J. Y., Shen, Y. Y., and Qin, L. J. (2006). Application of improved BP neural network in groundwater environmental quality assessment. Adv. Water Resour. Hydropower Sci. Technol. 26, 21–23.
Costanza, R. (1992). Ecological economics: the science and management of sustainability. Am. J. Agric. Econ. 7, 170–171.
Cui, B. S., Yang, Z. F., Li, Y. H., Zhang, K. G., and Zhao, X. S. (2004). Comprehensive protection and development of wetland in urban expansion. J. Nat. Resour. 19, 462–471.
Fang, X. S., Liu, S., Chen, W. Z., and Wu, R. Z. (2021). An effective method for wetland park health assessment: a case study of the Guangdong Xinhui National Wetland Park in the Pearl River Delta, China. Wetlands 41:44. doi: 10.1007/s13157-021-01418-5
Ferreira, N. C., Bonetti, C., and Seiffert, W. Q. (2011). Hydrological and water quality indices as management tools in marine shrimp culture. Aquaculture 318, 425–433. doi: 10.1016/j.aquaculture.2011.05.045
Han, Y., He, F., Chen, Y., Qin, W., Yu, H., and Xu, D. (2021). Quality assessment of protein docking models based on graph neural network. Front. Bioinform. 1:693211. doi: 10.3389/fbinf.2021.693211
Hanbay, D., Turkoglu, I., and Demir, Y. (2008). Prediction of wastewater treatment plant performance based on wavelet packet decomposition and neural networks. Expert Syst. Appl. 34, 1038–1043. doi: 10.1016/j.eswa.2006.10.030
Hines, D. E., Ray, S., and Borrett, S. R. (2018). Uncertainty analyses for ecological network únalysis enable stronger inferences. Environ. Model. Softw. 101, 117–127. doi: 10.1016/j.envsoft.2017.12.011
Ho, M., and Richardson, C. J. (2013). A five year study of floristic succession in a restored urban wetland. Ecol. Eng. 61, 511–518. doi: 10.1016/j.ecoleng.2013.05.001
Holland, C. C., Honea, J. E., Gwin, S. E., and Kentula, M. E. (1995). Wetland degradation and loss in the rapidly urbanizing area of Portland, Oregon. Wetland 15, 336–345. doi: 10.1007/BF03160888
Hu, S., Niu, Z., Chen, Y., Li, L., and Zhang, H. (2017). Global Wetlands: potential distribution, wetland loss, and status. Sci. Total Environ. 586, 319–327. doi: 10.1016/j.scitotenv.2017.02.001
Jiao, J. L., Ren, H. L., and Sun, S. Z. (2016). Assessment of surface ship environment adaptability in seaways: a fuzzy comprehensive evaluation method. Int. J. Naval Archit. Ocean Eng. 8, 344–359. doi: 10.1016/j.ijnaoe.2016.05.002
Jing, B. Z., Wu, J., and Gong, Y. Z. (2020). Valuing wetland ecosystem services based on benefit transfer: a meta-analysis of China wetland studies. J. Clean. Prod. 276:122988. doi: 10.1016/j.jclepro.2020.122988
Jonathan, P. R., Andrew, T. K., Emily, A. S., Victor, H., Chris, N., Ruth, C., et al. (2019). The application of wearable technology to quantify health and wellbeing co-benefits from urban wetlands. Front. Psychol. 10:1840. doi: 10.3389/fpsyg.2019.01840
Kuo, J. T., Hsieh, M. H., Lung, W. S., and She, N. (2007). Using artificial neural network for reservoir eutrophication prediction. Ecol. Model. 200, 171–177. doi: 10.1016/j.ecolmodel.2006.06.018
Lee, S. Y., Dunn, R. J. K., Young, R. A., Connolly, R. M., Dale, P. E. R., Dehayr, R., et al. (2006). Impact of urbanization on coastal wetland structure and function. Austral Ecol. 31, 149–163. doi: 10.1111/j.1442-9993.2006.01581.x
Li, H., Wang, X., Wei, H., Xia, T., Liu, M., and Ai, S. (2022). Geographical distribution and driving meteorological forces of facial expressions of visitors in urban wetland parks in eastern China. Front. Earth Sci. 10:781204. doi: 10.3389/feart.2022.781204
Liu, F., and Lu, J. B. (2021). Ecological engineering approaches to restoring the aquatic biological community of an urban pond ecosystem and its effects on water quality – a case study of the urban Xixi National Wetland Park in China. Knowl. Manag. Aquat. Ecosyst. 422:24. doi: 10.1051/kmae/2021024
Liu, P., Liu, M., Xia, T., Wang, Y., and Wei, H. (2021). Can urban forest settings evoke positive emotion? Evidence on facial expressions and detection of driving factors. Sustainability 13:8687. doi: 10.3390/su13168687
Mao, X. F., and Wei, X. Y. (2015). The spatial and temporal distribution of chlorophyll a and its influencing factors in an eutrophic lake. Environ. Monitor. China 31, 65–70. doi: 10.19316/j.issn.1002-6002.2015.06.012
Mao, X. F., Wei, X. Y., Jin, X., Tao, Y. Q., Zhang, Z. F., Wang, W. Y., et al. (2019). Monitoring urban wetlands restoration in Qinghai Plateau: integrated performance from ecological characters, ecological processes to ecosystem services. Ecol. Indic. 101, 623–631. doi: 10.1016/j.ecolind.2019.01.066
Mao, X. F., Wei, X. Y., Yuan, D. H., Jin, Y., and Jin, X. (2018). An ecological-network-analysis based perspective on the biological control of algal blooms in Ulansuhai Lake, China. Ecol. Model. 386, 11–19. doi: 10.1016/j.ecolmodel.2018.07.020
McInnes, R. J. (2014). Recognising wetland ecosystem services within urban case studies. Mar. Freshw. Res. 65, 575–588. doi: 10.1071/MF13006
Mo, M. H., Wang, X. L., Wu, H. J., Cai, S. M., Zhang, X. Y., and Wang, H. L. (2009). Ecosystem health assessment of Honghu Lake Wetland of China using artificial neural network approach. Chin. Geograph. Sci. 19, 349–356. doi: 10.1007/s11769-009-0349-9
Rheinhardt, R. D., Brinson, M. M., and Paul, M. F. (1997). Applying wetland reference data to functional assessment, mitigation and restoration. Wetlands 17, 195–215.
Robert, J. R., Donagh, H., and Jennifer, J. R. (2021). Integrating artificial urban wetlands into communities: a pathway to carbon zero? Front. Built Environ. 7:777383. doi: 10.3389/fbuil.2021.777383
Stefanak, A. I. (2019). The role of constructed wetlands as green infrastructure for sustainable urban water management. Sustainability 11:6981. doi: 10.3390/su11246981
Sun, W. G., Wang, H. X., and Yu, S. P. (2004). The advance of urban wetland study. Prog. Geogr. 23, 94–100.
Sutton-Grier, A. E., and Sandifer, P. A. (2019). Conservation of wetlands and other coastal ecosystems: a commentary on their value to protect biodiversity, reduce disaster impacts, and promote human health and well-being. Wetlands 39, 1295–1302. doi: 10.1007/s13157-018-1039-0
Wahlroos, O., Valkama, P., Mäkinen, E., Ojala, A., Vasander, H., Väänänen, V. M., et al. (2015). Urban wetland parks in Finland: improving water quality and creating endangered habitats. Int. J. Biodivers. Sci. Ecosyst. Serv. Manag. 11, 46–60. doi: 10.1080/21513732.2015.1006681
Wang, H. X., Sun, G. Y., Gong, H. L., and Yu, S. P. (2006). Characteristics of urban wetland and its construction policies upon the sustainable development strategy in Beijing. J. Arid Land Resour. Environ. 20, 94–100.
Wang, J., Wang, X., Zhang, X. H., Li, H. C., Lei, X. H., Wang, H., et al. (2018). Application of grey clustering method based on improved analytic hierarchy process in water quality evaluation. MATEC Web Conf. 246:02004. doi: 10.1051/matecconf/201824602004
Wang, T. (2020). Wetland governance: contested aspirations and reflexive roles of local professionals toward Worlding cities in tai lake basin. Front. Environ. Sci. 8:577357. doi: 10.3389/fenvs.2020.577357
Wei, H., Ma, B., Hauer, R. J., Liu, C., Chen, X., and He, X. (2020). Relationship between environmental factors and facial expressions of visitors during the urban forest experience. Urban For. Urban Green. 53:126699. doi: 10.1016/j.ufug.2020.12669
Wei, M., Zheng, Z., Bai, X., Lin, J., and Taghizadeh-Hesary, F. (2021). Application of rough set and neural network in water energy utilization. Front. Energy Res. 9:604660. doi: 10.3389/fenrg.2021.604660
Wu, J. M., Xu, D., He, F., He, J., and Wu, Z. B. (2015). Comprehensive evaluation of substrates in vertical-flow constructed wetlands for domestic wastewater treatment. Water Pract. Technol. 10, 625–632. doi: 10.2166/wpt.2015.077
Wu, Y., Mao, X. F., Zhang, Z. F., Tang, W. J., Cao, G. C., Zhou, H. K., et al. (2021). Temporal and spatial characteristics of CO2 flux in plateau urban wetlands and their influencing factors based on eddy covariance technique. Water 13:1176. doi: 10.3390/w13091176
Wu, Y. C., and Feng, J. W. (2018). Development and application of artificial neural network. Wirel. Pers. Commun. 102, 1645–1656. doi: 10.1007/s11277-017-5224-x
Xia, H. J., Liu, L. S., Bai, J. H., Kong, W. J., Lin, K. X., and Guo, F. (2006). Wetland ecosystem service dynamics in the yellow river estuary under natural and anthropogenic stress in the past 35 years. Ecol. Eng. 26, 27–39. doi: 10.1007/s13157-020-01368-4
Zhang, H. Y., Sun, Y. D., Zhang, W. X., Song, Z. Y., Ding, Z. L., and Zhang, X. Q. (2021). Comprehensive evaluation of the eco-environmental vulnerability in the Yellow River Delta wetland. Ecol. Indic. 125:107514. doi: 10.1016/j.ecolind.2021.107514
Zhang, L. N., Wu, F. P., and Jia, P. (2013). Grey evaluation model based on reformative triangular whitenization weight function and its application in water rights allocation system. Open Cybernet. Syst. J. 7, 1–10. doi: 10.2174/1874110X20130521001
Zhang, M. L., and Yang, W. P. (2012). Fuzzy comprehensive evaluation method applied in the real estate investment risks research. Phys. Procedia 24, 1815–1821. doi: 10.1016/j.phpro.2012.02.267
Zhang, M. W., Jin, H. J., Cai, D. S., and Jiang, C. B. (2010). The comparative study on the ecological sensitivity analysis in Huixian karst wetland, China. Procedia Environ. Sci. 2, 386–398. doi: 10.1016/j.proenv.2010.10.043
Zhou, L. F., and Xu, S. G. (2006). Application of grey clustering method in eutrophication assessment of wetland. J. Am. Sci. 2, 53–58.
Keywords: BP neural network, plateau urban wetland, health evaluation, evaluation index, pressure-state-response (PSR) model
Citation: Tong L, Mao X, Song X, Wei X, Tang W, Deng Y, Yu H, Deng Z, Xiao F, Zhou H and Yin X (2022) PSR-BP Neural Network-Based Health Assessment of the Huangshui Plateau Urban Wetlands in China. Front. Ecol. Evol. 10:866597. doi: 10.3389/fevo.2022.866597
Received: 31 January 2022; Accepted: 20 May 2022;
Published: 09 June 2022.
Edited by:
Haitao Wu, Northeast Institute of Geography and Agroecology (CAS), ChinaReviewed by:
Junhong Bai, Beijing Normal University, ChinaCopyright © 2022 Tong, Mao, Song, Wei, Tang, Deng, Yu, Deng, Xiao, Zhou and Yin. This is an open-access article distributed under the terms of the Creative Commons Attribution License (CC BY). The use, distribution or reproduction in other forums is permitted, provided the original author(s) and the copyright owner(s) are credited and that the original publication in this journal is cited, in accordance with accepted academic practice. No use, distribution or reproduction is permitted which does not comply with these terms.
*Correspondence: Xufeng Mao, bWFveHVmZW5nQHllYWgubmV0; Xiaoyan Wei, d2VpeGlhb3lhbjQ0NzdAMTYzLmNvbQ==
Disclaimer: All claims expressed in this article are solely those of the authors and do not necessarily represent those of their affiliated organizations, or those of the publisher, the editors and the reviewers. Any product that may be evaluated in this article or claim that may be made by its manufacturer is not guaranteed or endorsed by the publisher.
Research integrity at Frontiers
Learn more about the work of our research integrity team to safeguard the quality of each article we publish.