 Jana Škvareninová
 Ivan Mrekaj
94% of researchers rate our articles as excellent or good
Learn more about the work of our research integrity team to safeguard the quality of each article we publish.
Find out more
ORIGINAL RESEARCH article
Front. Ecol. Evol., 04 May 2022
Sec. Interdisciplinary Climate Studies
Volume 10 - 2022 | https://doi.org/10.3389/fevo.2022.865471
This article is part of the Research TopicVegetation Phenology and Response to Climate ChangeView all 8 articles
This work presents the impact of climate change on full flowering (BBCH 65) in Norway spruce [Picea abies (L.) Karst.] at 54 phenological stations over two 30-year-long periods, from 1961 to 1990 and from 1991 to 2020. The stations were located in 10 protected areas (protected landscape area, national park) at elevations from 390 to 1,400 m a.s.l. We analyzed the changes in average onset of full flowering, trends of the phase, phenological altitudinal gradient, and correlations of flowering to monthly climatological standard normals of air temperature and sum of precipitation. The impact of climate change was observed in the second period, when flowering started 4–8 days earlier. The phenophase was shortened by 4 days in comparison to the first period, and the shift of the significant trend occurred 7 days earlier. The phenological altitudinal gradient did not substantially change. The analysis of the temperature impact on flowering showed an effect of the cold period preceding the onset of the phenological phase on its delayed onset. The change in January temperatures between periods indicated warming by 1.24–1.34°C. The change also occurred in the evaluation of the 3-month period when the spring air temperature increased. The mean 3-month air temperature (January–March) increased by 0.82–1.1°C in the second period. It was more substantial at lower elevations. The most significant changes in precipitation conditions were observed by the increase in precipitation in March and by the decrease in precipitation between the observed periods in April. The results of all indicators for Norway spruce flowering in the second period indicated changes in climatic conditions in the region.
Ongoing climate change affects temperature and precipitation conditions and causes frequent extreme weather events in mountain areas in the temperate climate zone (Lapin et al., 2008; Lukasová et al., 2021). The changing climate of this climatic zone gradually changes vegetation, composition, and production of future communities (Ďurský et al., 2006). Several studies (Menzel et al., 2006; Bertin, 2008) indicated the impact of climate change represented by fast temperature and precipitation changes on plant phenology at the end of the twentieth century. In several regions of Europe, climate change causes ecological changes in ecosystems, including species interactions, community structures, and biodiversity conservation (Kirschbaum, 2000). Many authors (Luomajoki, 1993; Vitasse et al., 2019) have monitored ongoing climate change using phenological manifestations of plants and tree species. Additionally, the works of several authors (Chmielewski and Rötzer, 2001; Walther et al., 2002; Linderholm, 2006) have evaluated the dynamics of phenological phases as a response to changing environmental conditions. Therefore, phenological manifestations are considered important bioindicators of current ecosystem changes (Rafferty et al., 2020; Wenden et al., 2020).
Phenology reflects changes in the environment through the response of plants to meteorological elements (Babálová et al., 2018). Phenological observations contribute to explaining climate change in several ways (Schwartz, 1999). Their temporal development is very sensitive to interannual changes in meteorological elements, which indicate their dynamics. Long-term phenological records at the species level may explain biological reactions to climate change in regions of temperate climate characterized by changing seasons. Suitable phenological models derived from long-term time series can partially widen the information on biological reactions at various locations where traditional data are missing. If the successful migration of tree species, e.g., migration of spruce in a changing environment, is ensured, phenological knowledge can also be combined with systematic genetic assessment that governs the adaptive capacity of forests to climate change (Pierro et al., 2017).
The beginning of spring phenology also reflects photoperiod sensitivity. Research on photoperiodic spruce regimes in Finland has confirmed the simultaneous action of photoperiods and temperature amplitudes on spring phenological phases (Partanen et al., 1998); Saderi et al. (2019) indicated the rising effect of photoperiod in increasing altitudes, where it could be connected to air temperature. They estimated that future climate change would extend the growing season by about 5 days per 1°C. Gyllenstrand et al. (2007) documented the influence of photoperiods on phenological development through gene analysis of the growth rhythms of seedless plants. Basler and Körner (2012) selected photoperiod rather than weather as a constant and reliable indicator of the beginning of the growing season. Using contrasts in the photoperiod, they found no significant photoperiod sensitivity in the early succession species. For late succession species, the photoperiod is an important environmental signal. The photoperiod will limit responses to climate warming, as rising temperatures will shift phenology to a species-specific photoperiod threshold. In research on Norway spruce (Picea abies) on permanent research plots, the response to the photoperiod was only influenced by the altitude of the tree’s origin (Basler and Körner, 2012).
The impacts of climate change are not evenly manifested in the natural regions of tree species. The reactions of ecotypes to these changes, represented by long-term phenological manifestations, provide answers on climate development in regional conditions (Škvareninová, 2009, 2013; Lukasová et al., 2020). A long time series of phenological observations enables the identification of trends in the development of phenological phases and explains their relationships to climate change (Asse et al., 2018). Changes in phenological processes can contribute to the clarification of the distribution of natural tree species and changes in their natural regions (Suvanto et al., 2016). They can be used for modelling the phenological phases of tree species under the future impact of climate change on ecosystems, as well as for the prognosis of future tree species’ distribution and vitality (Bednářová et al., 2010; Dyderski et al., 2018). Regular and long-term observations of tree species’ phenological phases explain the climatic characteristics of the region and reveal changes in the length of growth and phenological periods, as well as the possible risks of frost damage. This knowledge can be used for forest management, as well as for nature protection.
Economically important species with a wide range of occurrences in Europe are of research interest in studying the impact of climate change on tree species. Norway spruce [P. abies (L.) Karst.], which is an important component of several natural forest ecosystems in Europe, belongs to these species. It is a dominant species in boreal forests and sub-alpine areas of the Alps and Carpathians, where it occurs in a dwarfed form up to an elevation of 2,400 m a.s.l. (Škvarenina et al., 2004; Caudullo et al., 2016). It can also be found at lower elevations outside of its natural distribution, where it is exposed to periods of extreme drought and heat due to global warming (Jansson et al., 2013; Střelcová et al., 2013). In the second half of the twentieth century, the conditions for spruce also began to deteriorate due to increased anthropogenic activity. At first, the stands were exposed to air pollution above the threshold (Mind’áš and Škvarenina, 1995; Bošel’a et al., 2014; Fazekašová et al., 2016). According to Mezei et al. (2019), Carpathian spruce forests have been affected by wind calamities and spruce bark beetle gradation (Ips typographus) in recent decades (Grodzki et al., 2006; Mezei et al., 2017). The large-scale die-back of mountainous spruce forests has subsequently caused changes in inter-seasonal water balance, forest soils, and overall changes in ecosystems (Gömöryová et al., 2013; Bartík et al., 2016, 2019; Šustek et al., 2017). Thus, Norway Spruce became a subject of interest of many detailed phenological and dendroclimatic scientific research studies in different parts of Europe (Schleip et al., 2008; Mioduszewski and Rzonca, 2015), Slovakia, and the Tatra National Park (Braun, 2020; Bošel’a et al., 2021).
The goal of this work was to analyse the impact of climate change on the onset of the flowering phenological phase of Norway spruce P. abies (L.) Karst. in protected areas of Slovakia by comparing two 30-year-long periods, from 1961 to 1990 and from 1991 to 2020. The knowledge can be used to make prognoses of changes in the distribution and share of this tree species in the natural forest ecosystems of protected areas.
The phenological research focused on the localities of the Norway spruce in the southern part of the Western Carpathians (Figure 1), located in 10 large-scale protected areas of Slovakia, where spruce occurs naturally (national park—NP, protected landscape area—PLA) (Figure 2).
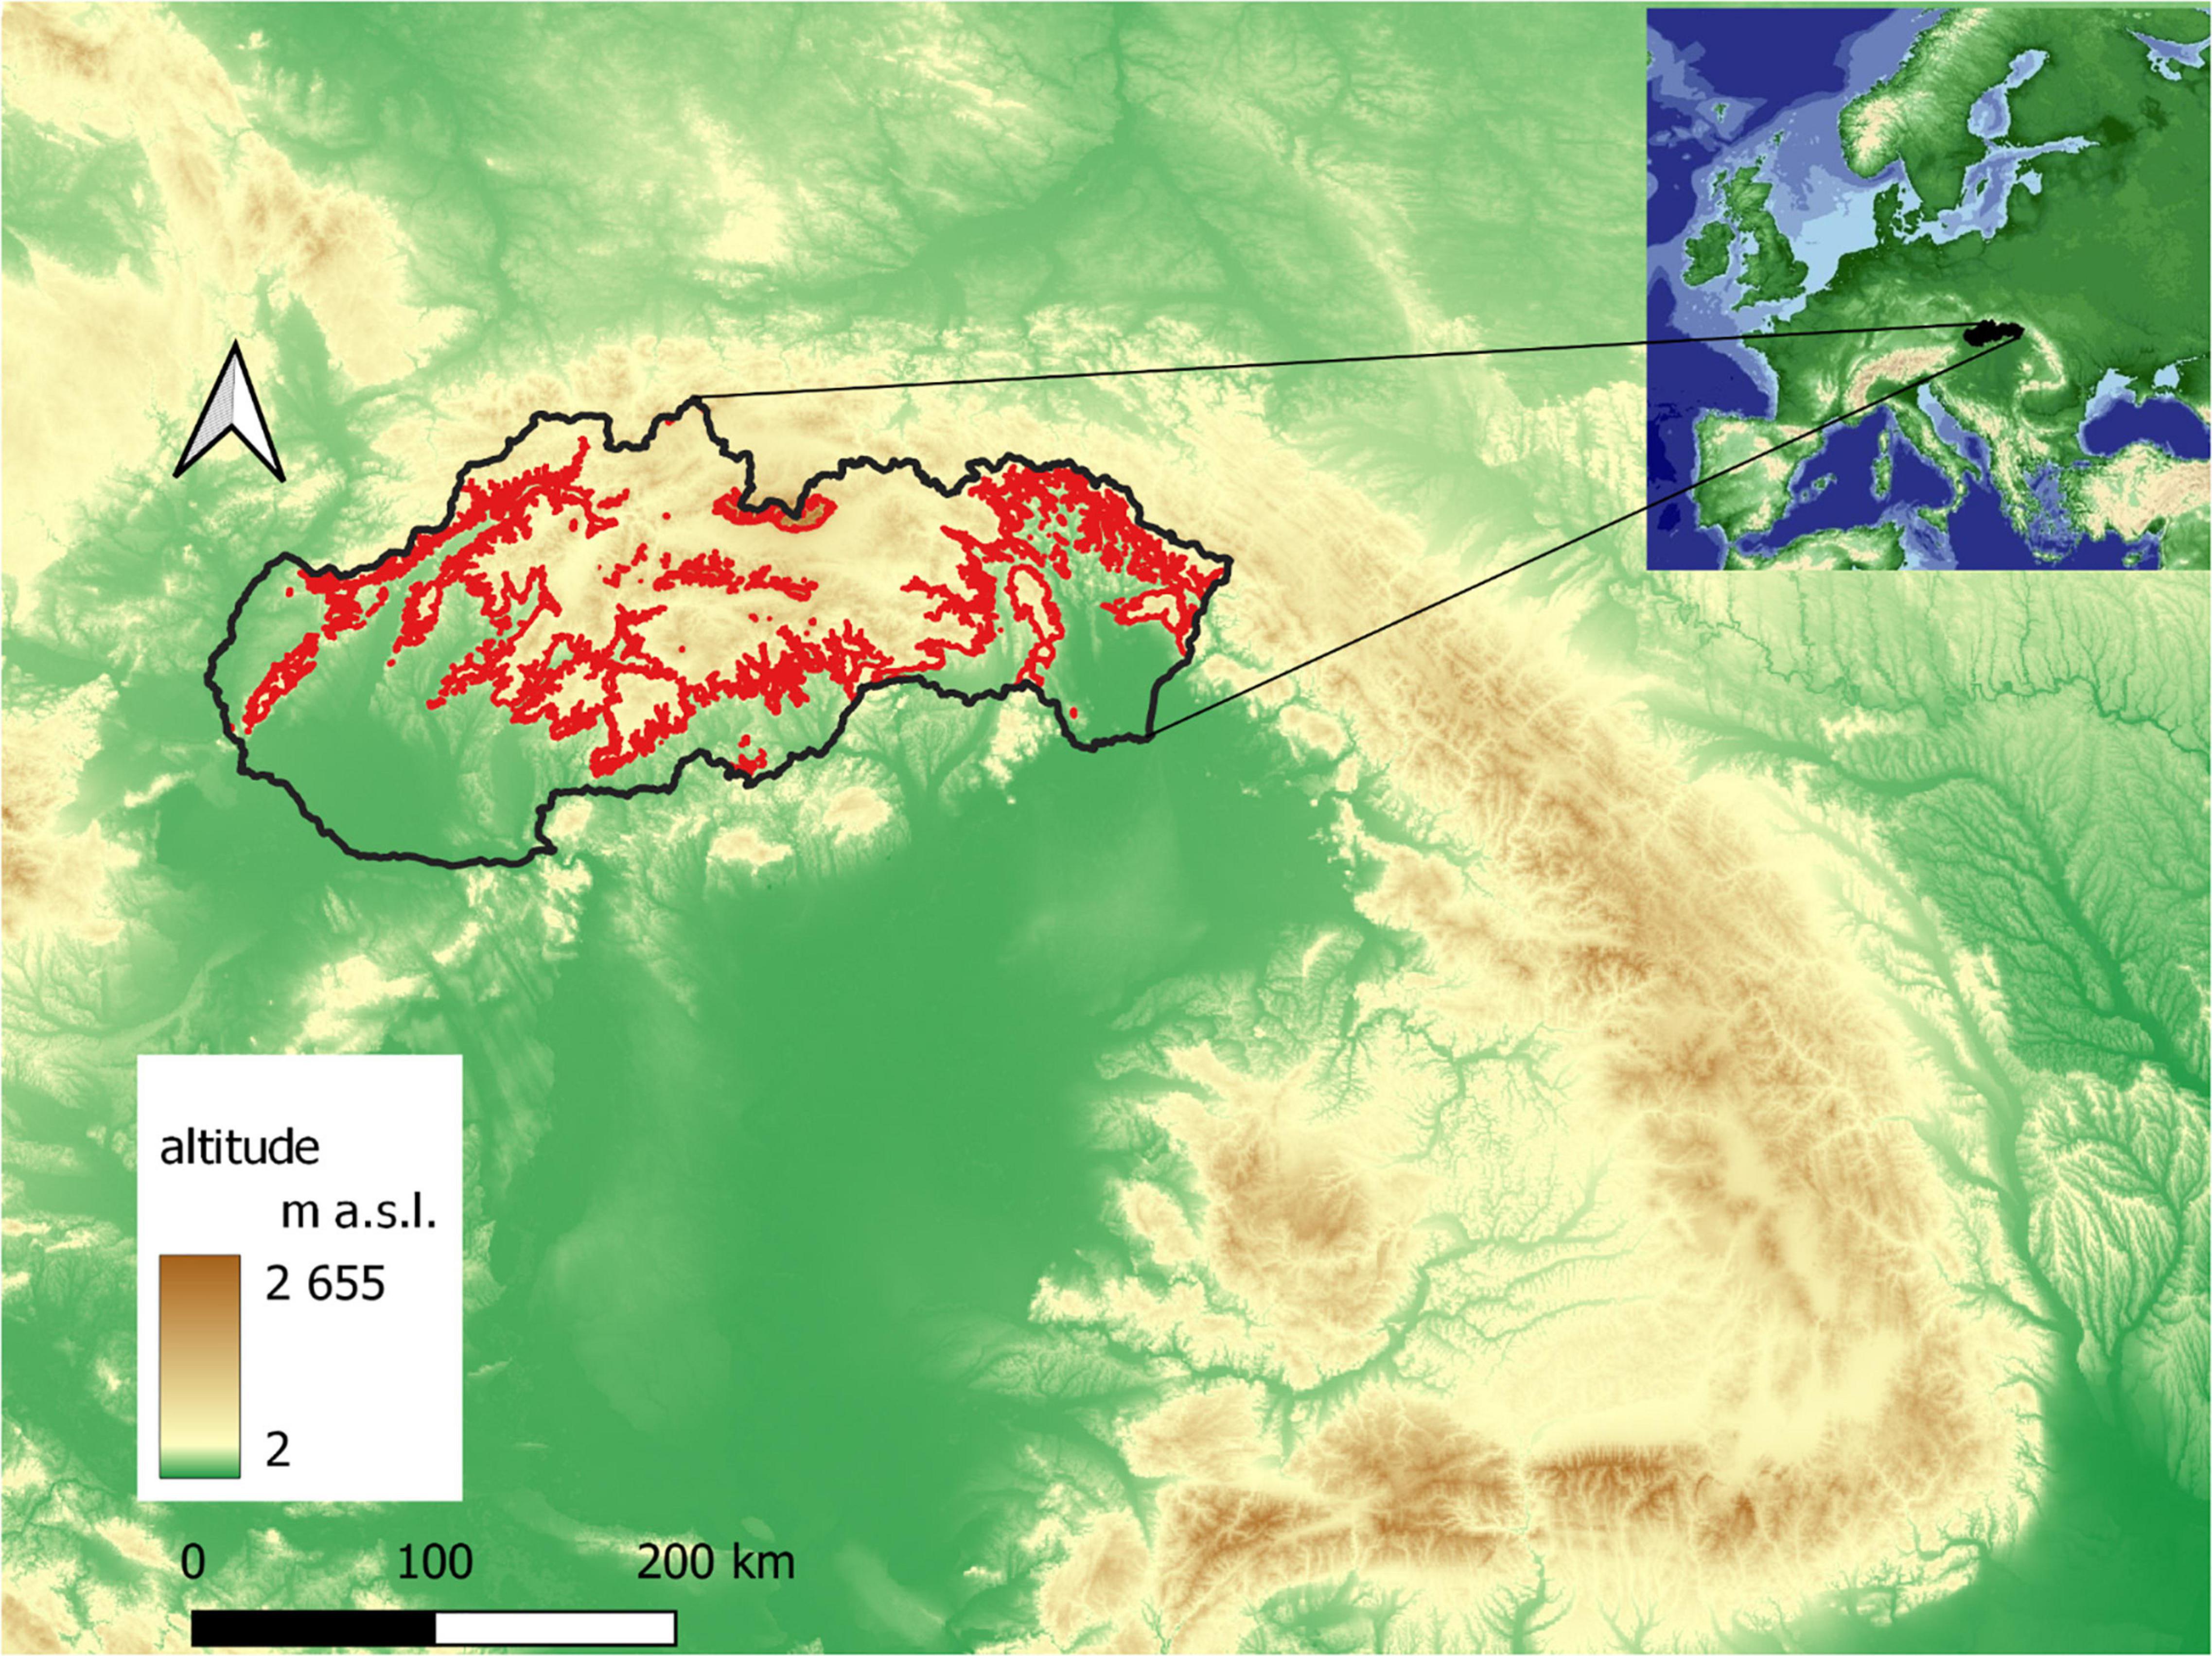
Figure 1. Norway spruce distribution in Slovakia (red line: borders of 390–1,400 m a.s.l. interval).
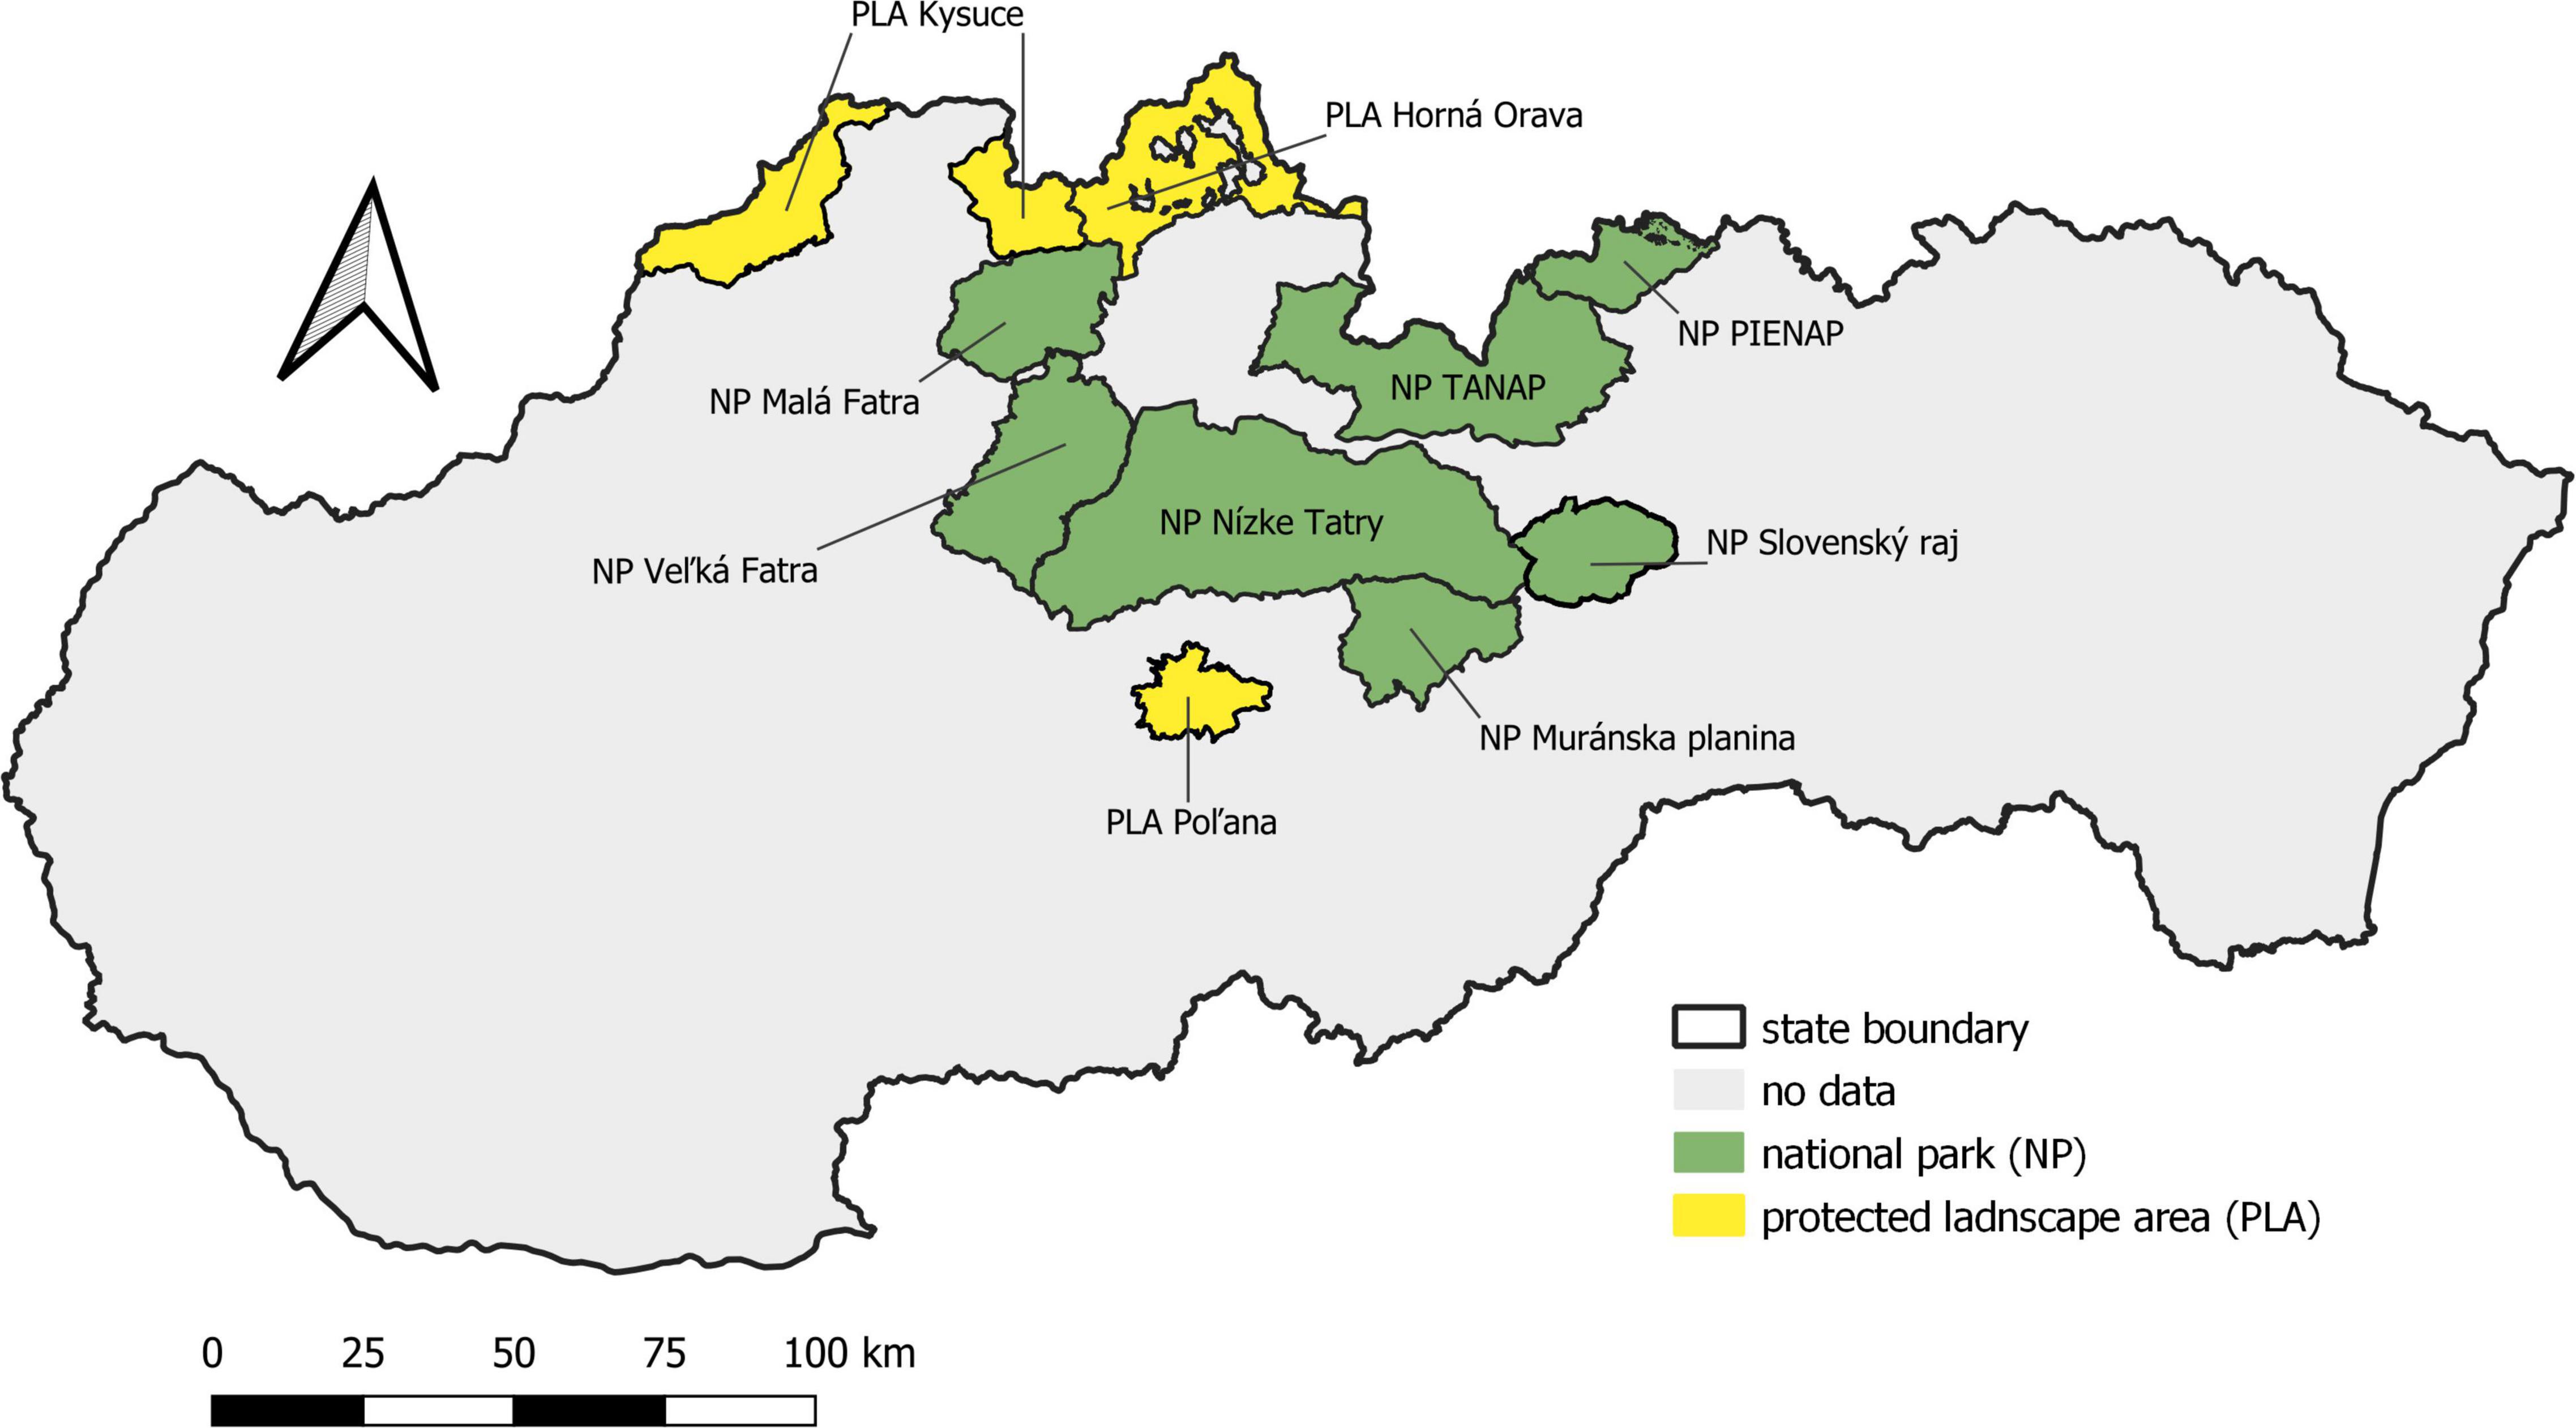
Figure 2. Large-scale protected areas with occurrence of Norway spruce in Slovakia.
We evaluated spruce reactions to climate change based on the full flowering phenological phase during two 30-year-long periods: 1961–1990 and 1991–2020. In climatology, the 30-year period represents the so-called climatological standard normal period (World Meteorological Organization [WMO], 2017). The World Meteorological Congress (WMO) has approved the definition of climate standards. The climatological standard normals refer to the last 30-year period concluding in the year ending with the number 0, which in our case was 2020. According to international coding, this phase is coded BBCH 65, which defines the developmental stage of generative organs (Meier, 1997). It occurs when the majority of male flowers of all individuals in the monitored group are fully developed and produce pollen (Braslavská et al., 1996). Phenological observations were performed on trees between the ages of 50–70 years. We recorded the onset of the phenophase using the days of the year (doy) of the Julian calendar. Phenological and climatic data were provided by the Slovak Hydrometeorological Institute. We selected only stations with continuous time series from the database. To perform the correlation analysis of flowering with elevation, we excluded incomplete data from the period 1960–1990 and modified the database for further processing using the following criteria:
- A continuous series of observations with at least 70% data at each phenological station.
- Elevation of the phenological station, exceeding 390 m a.s.l.
Based on these criteria, we obtained a set of 19 phenological stations representing the period from 1961–1990 and 35 stations representing the period from 1991–2020. The phenological stations for both periods were partly different due to some of the abolition or relocation of some of the phenological stations. The elevation intervals of protected areas and the number of plots in individual periods are presented in Table 1.
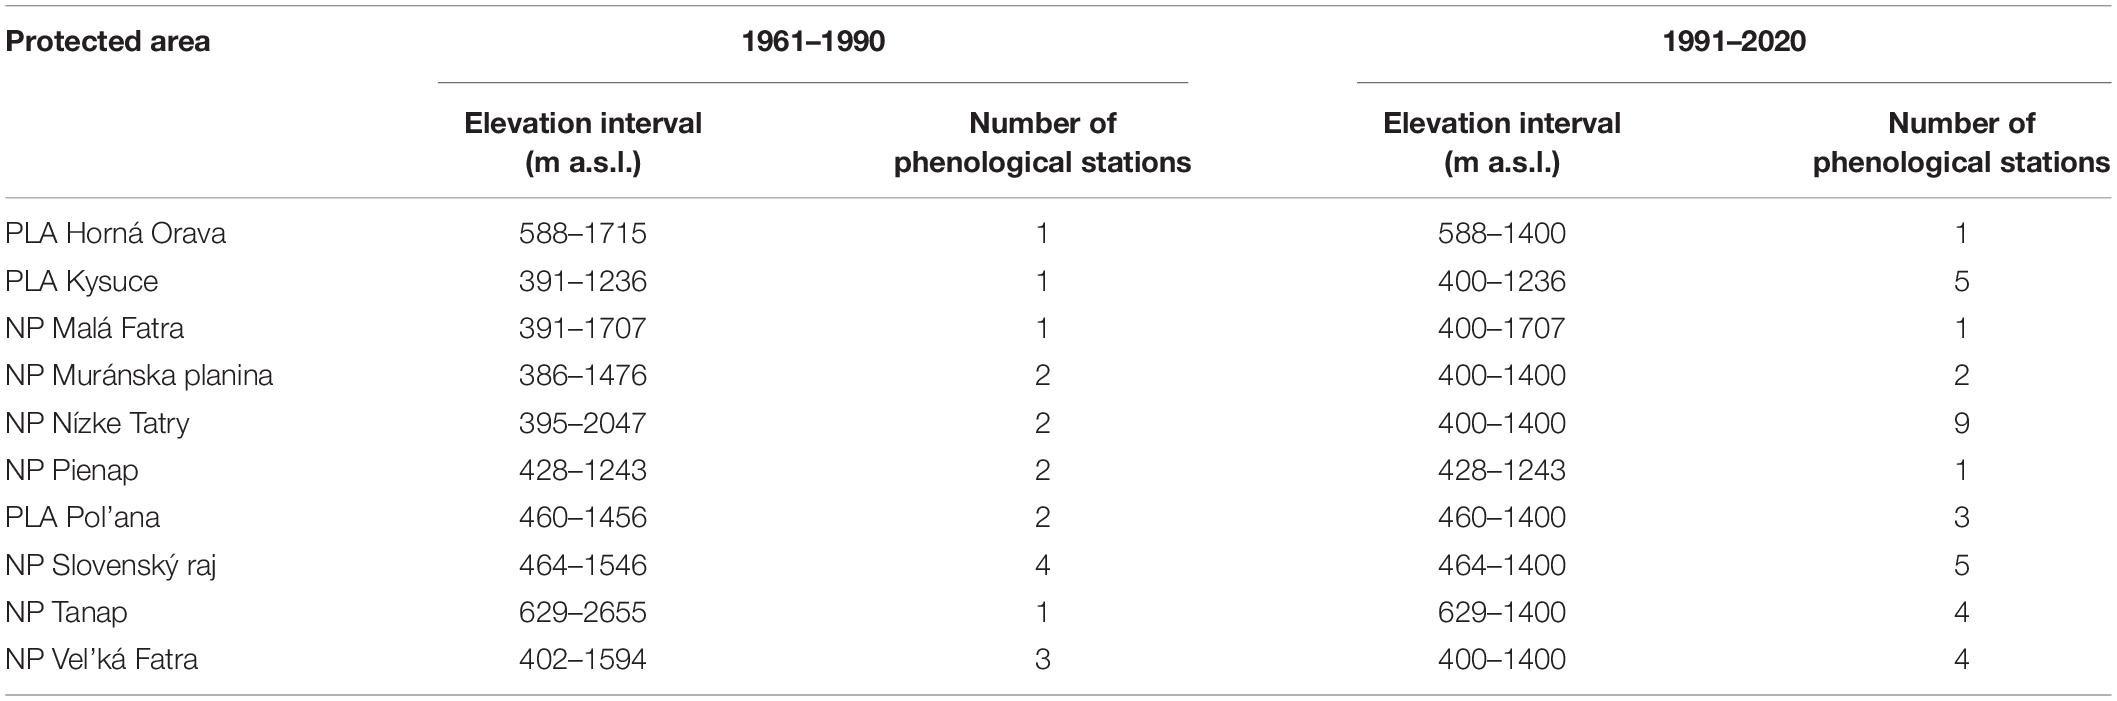
Table 1. Elevation interval of the study area with the number of phenological stations in individual protected areas.
We performed spatial interpolation with the Regression kriging method and B-spline using QGIS. To evaluate the impact of monthly mean climatological standard normals of air temperature and precipitation sum (30 years) on the onset of flowering, we used data from the nearest meteorological stations to phenological stations. The impact of climate change on spruce flowering was assessed based on the onset of full flowering, trend analyses, and a phenological elevational gradient. We also looked for the closest relationship between the long-term phenological onset of the phenological phase, the climatological standard normals for air temperature, and total precipitation using the Pearson correlation coefficient.
In the first period, from 1961 to 1990, flowering (BBCH 65) in Norway spruce occurred between May 21 and June 7 (Figure 3), and the phase lasted 18 days. In the second period, 1991–2020 (Figure 4), flowering was shifted by 4–8 days earlier (17 May–30 May), and the duration of the phenophase was shortened by 4 days. The shift of the phenophase by 5–6 days earlier in the second period was also recorded in individual protected areas (Table 2).
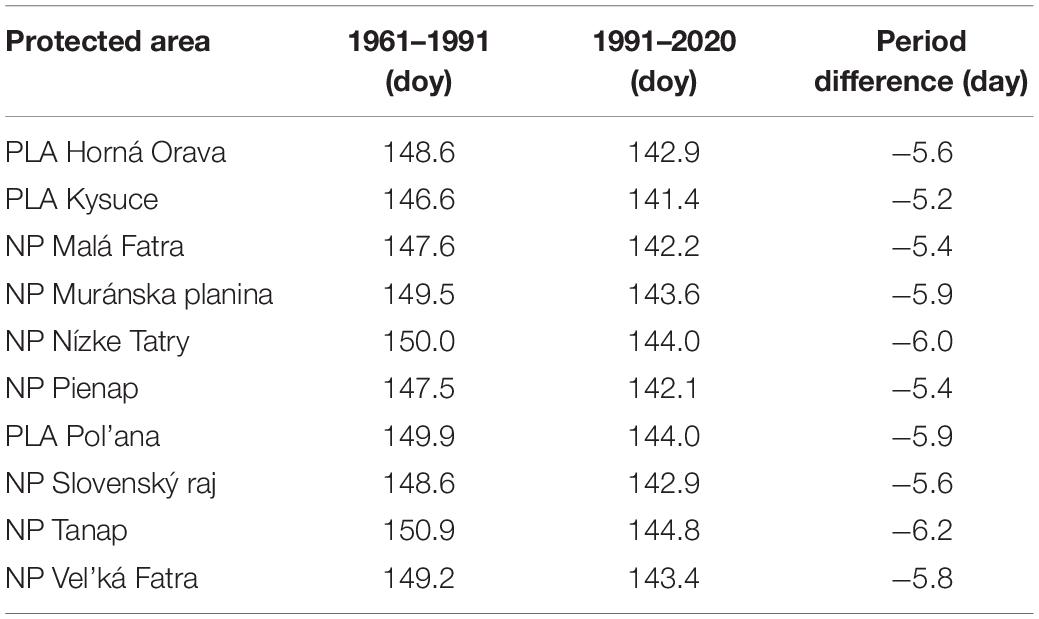
Table 2. Average onset and shift (-earlier) of Norway spruce flowering.
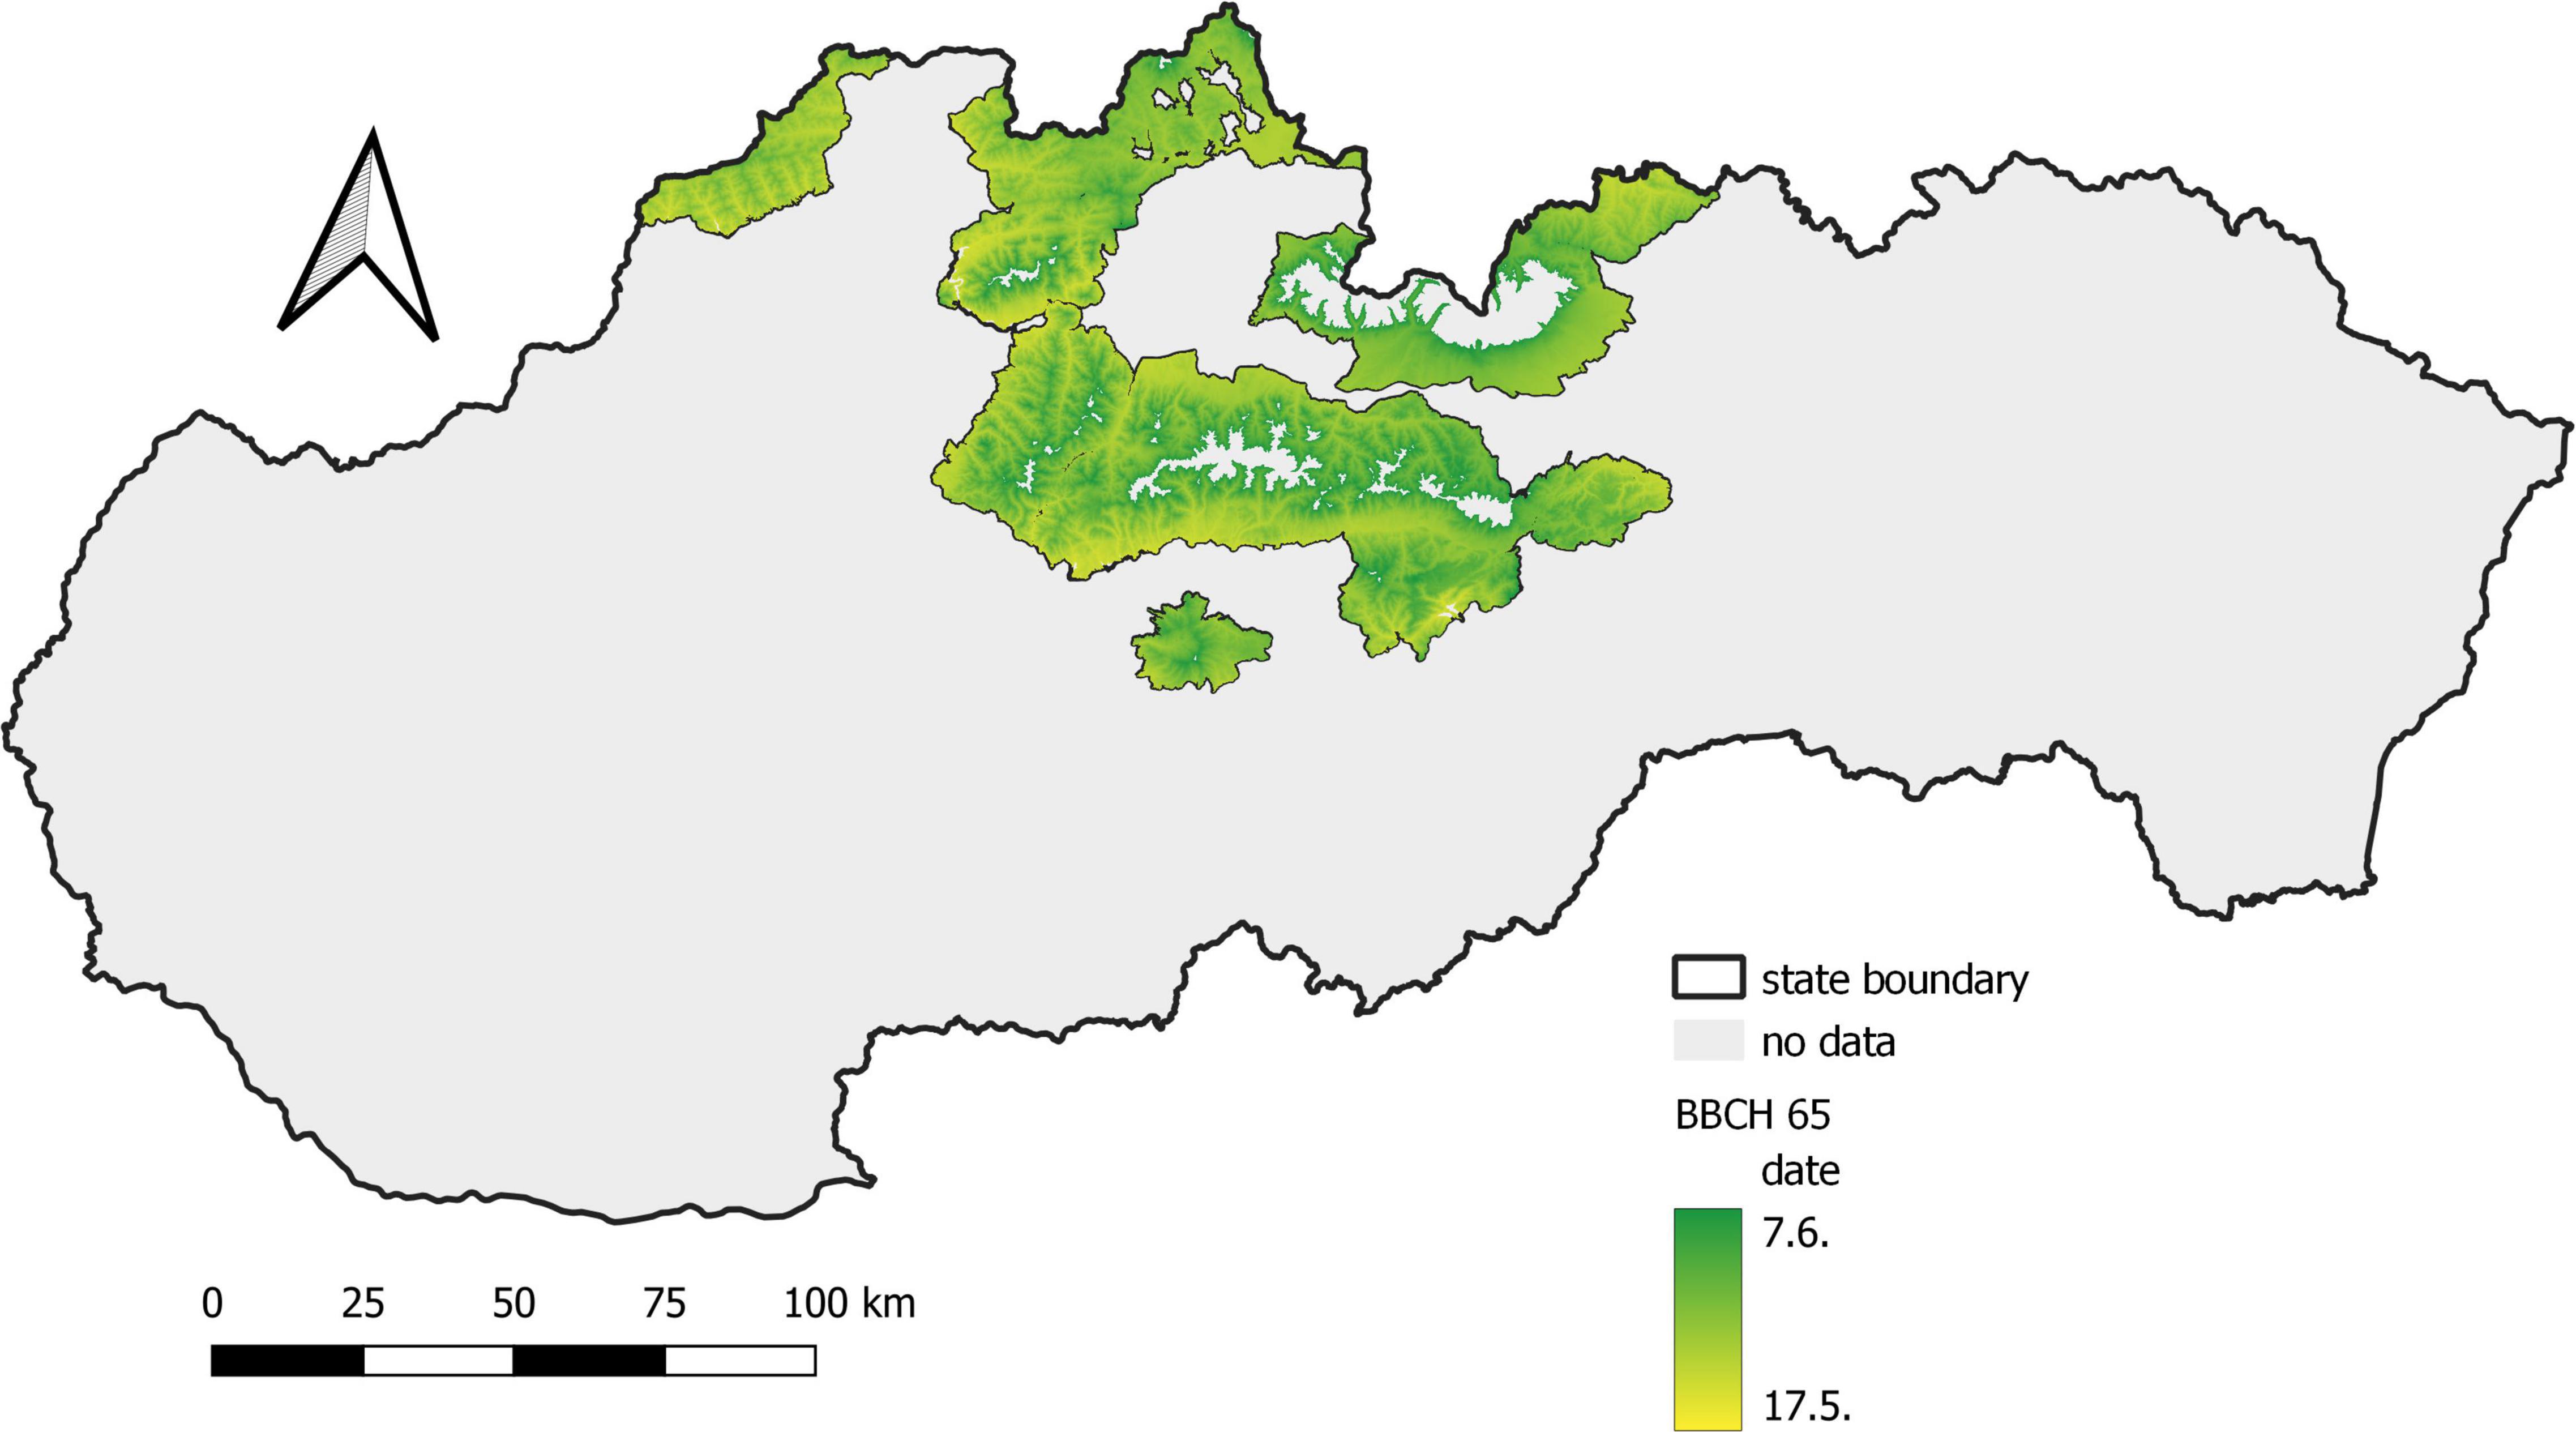
Figure 3. Average onset of full flowering of Norway spruce in the period 1961–1990.
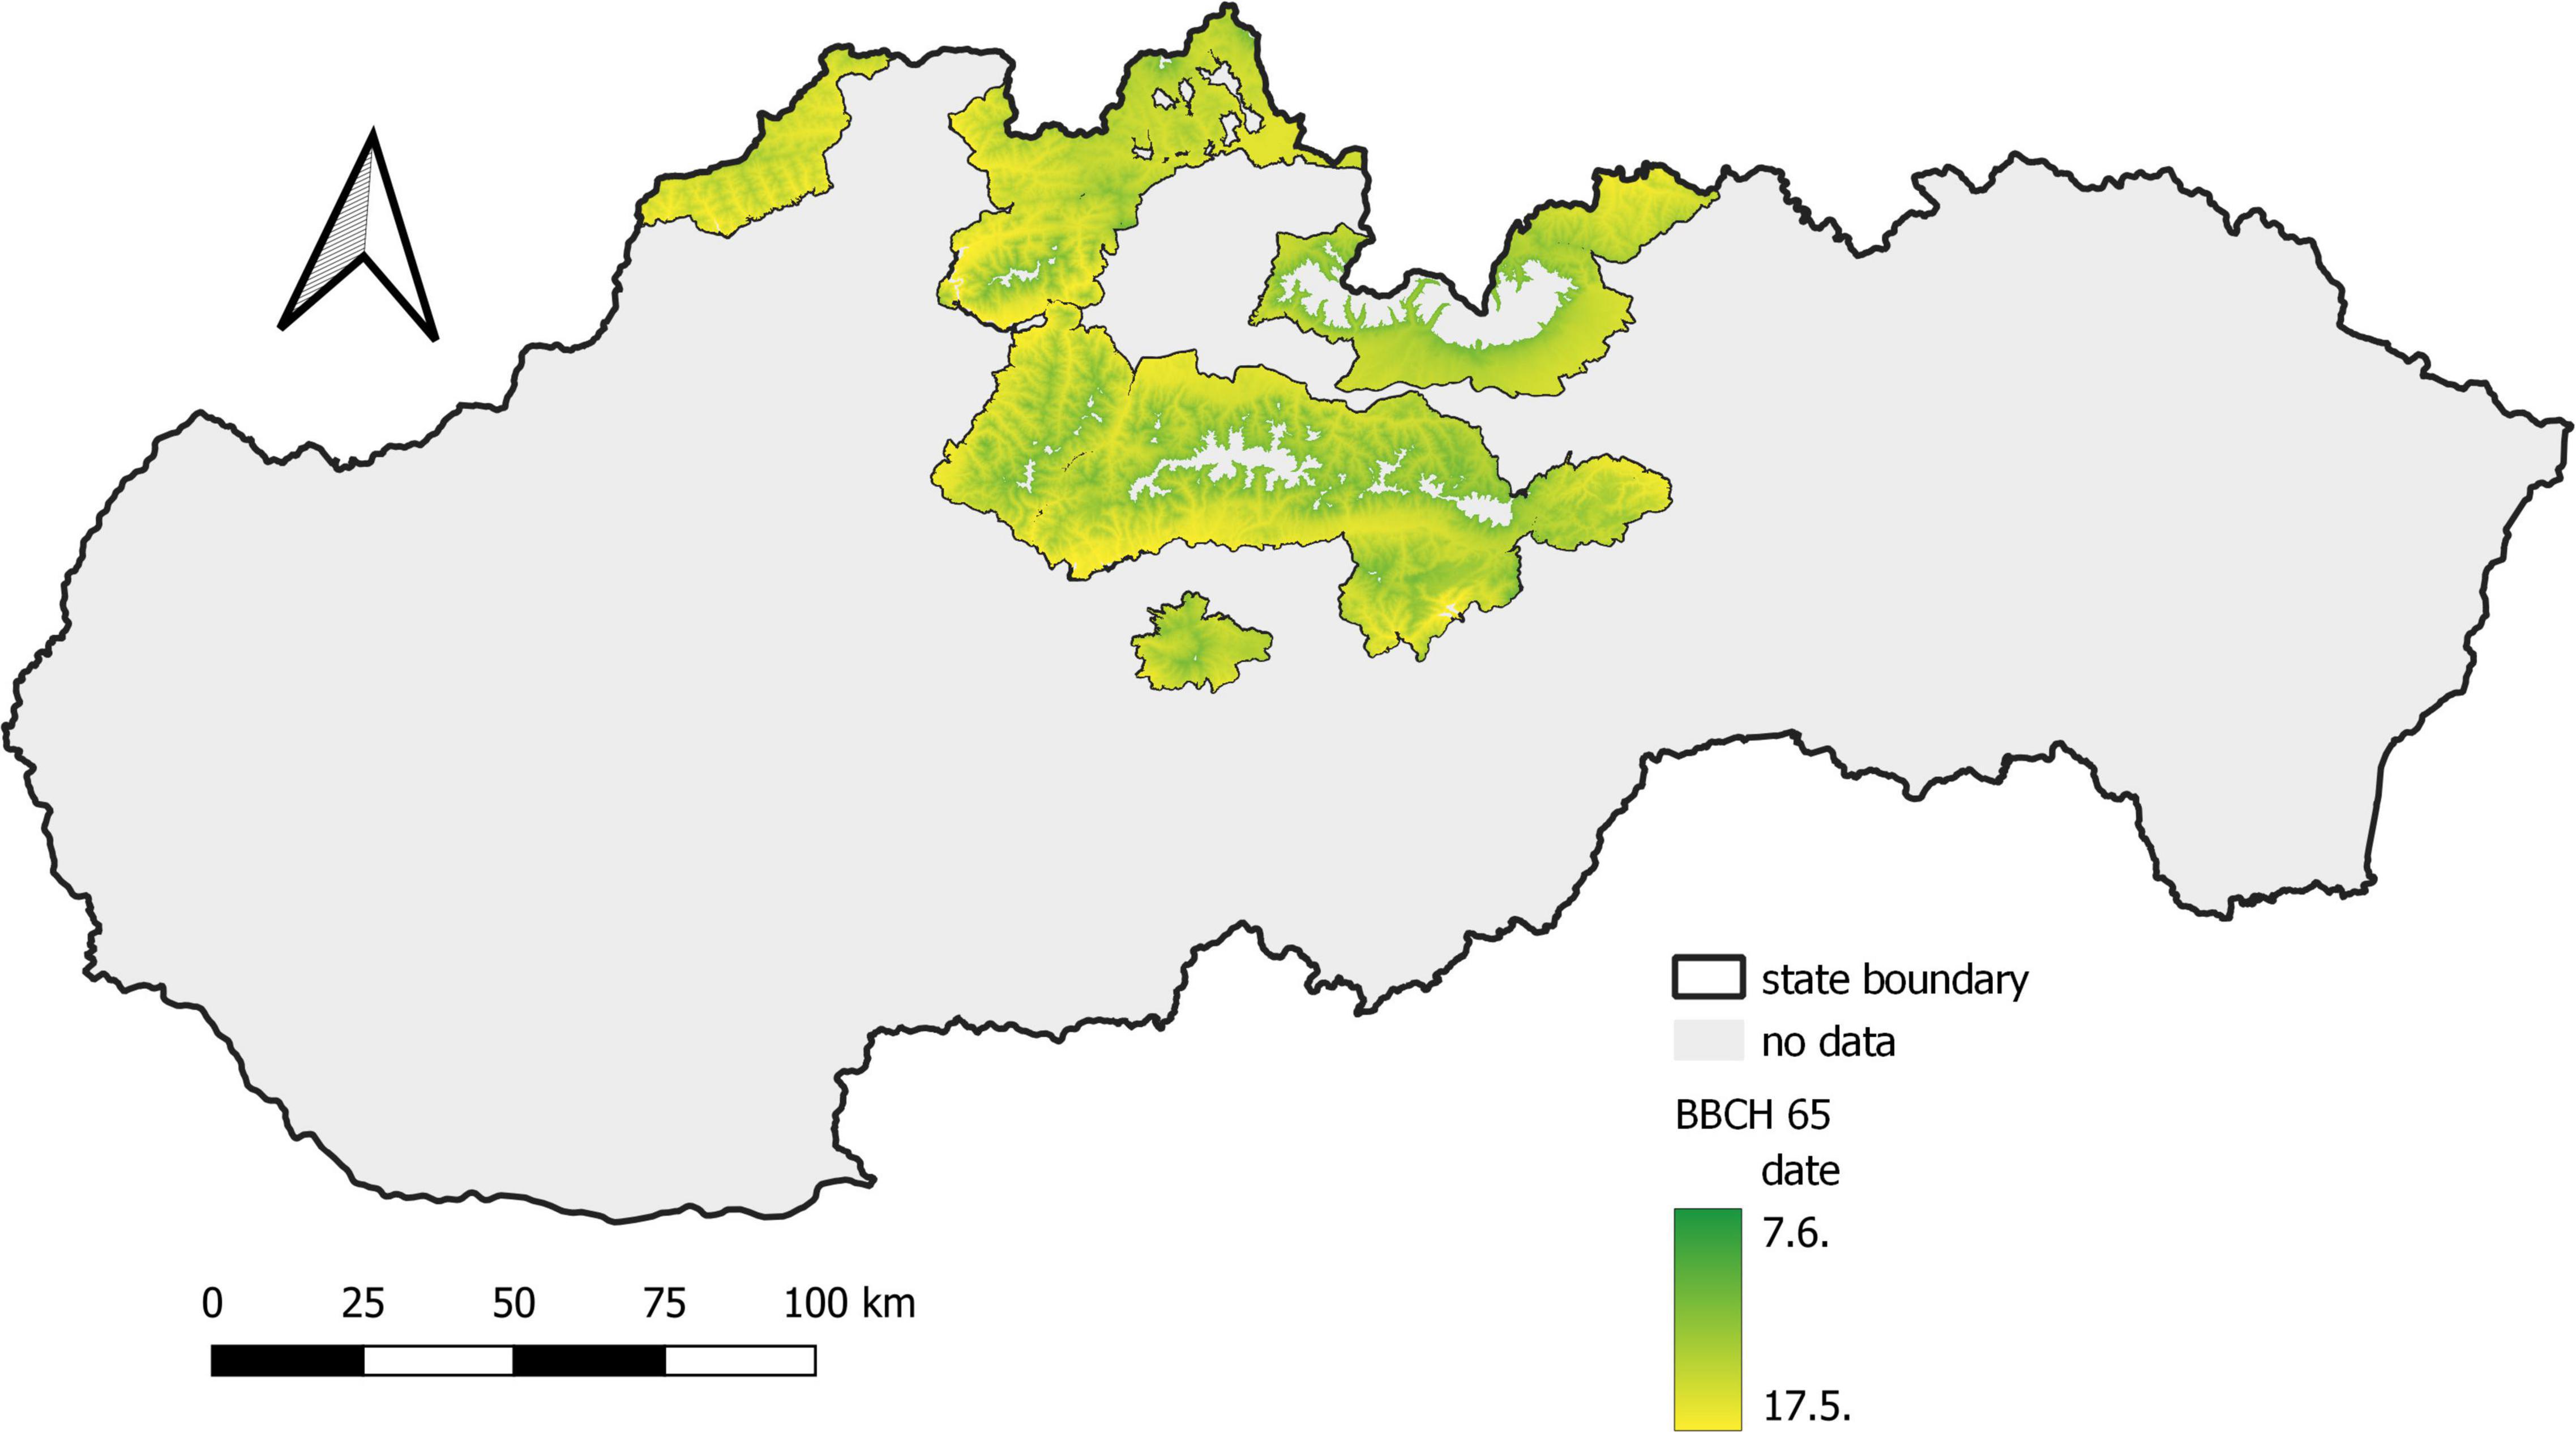
Figure 4. Average onset of full flowering of Norway spruce in a period of years 1991–2020.
Altitude affected the onset of the phenological phase. Average flowering started later as the elevation increased (Table 3). In the first period, the delay was mostly 1.7 days; in the second period, the time difference between the elevation classes decreased to 1.3 days. The differences between the elevation classes in each period had a similar time shift. The difference between the earliest and the latest average flowering in both periods varied from 1.4 to 2.1 days, while smaller differences were recorded in the second period. The difference in the earliest average onset of flowering (min Ø) between the 1st and 10th elevation classes was 15 days in the first period and 12 days in the second period. The difference in the latest average onset of flowering (max Ø) between the 1st and 10th elevation classes was 15 and 11 days in the first and second periods, respectively. These and other statistical characteristics indicate that climate change affects the phenological phase, since its onset along the elevational gradient was accelerated, and variability indicators (sx%, R) in all elevation classes were reduced in the second period.
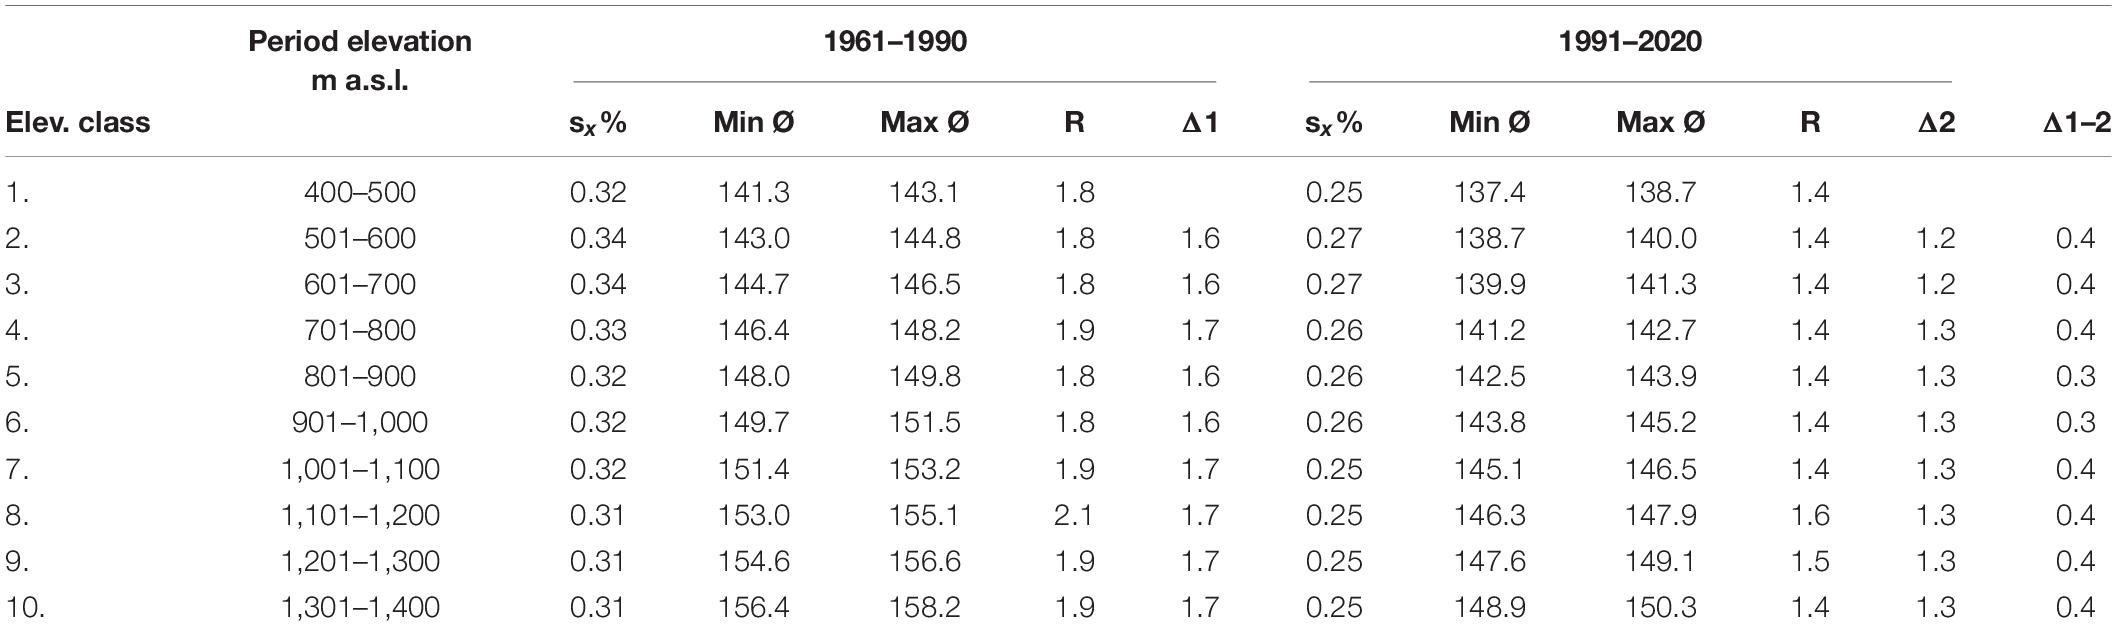
Table 3. Selected statistical characteristics of flowering of Picea abies (L.) Karst. [sx%—coefficient of variation, min—earliest average onset (doy), max—latest average onset (doy), R—variation range, Δ—difference between elevation classes (day)].
Absolute extremes occurred in both periods. In the period 1961–1990, the earliest onset of flowering (min) was observed at an elevation of 460 m a.s.l. on 3 May 1973, while the latest (max) occurred at an elevation of 620 m a.s.l. on 21 June 1965. In the second period, the absolute earliest onset of flowering was recorded at an elevation of 475 m a.s.l. on 23 April 2009, and the absolute maximum at an elevation of 485 m a.s.l. on 27 June 1996.
The phenological elevational gradient is the simplest way to express changes in environmental conditions in the vertical profile. It represents the difference in the onset of the phenological phase between the locations located at the lowest and highest elevations calculated per 100 elevation meters. In the first period, the phenological elevational gradient was 3.7 days/100 m, while in the second period, it was 3.4 days/100 m. The difference between the two periods equal to 0.3 days/100 m is negligible. It was more pronounced at higher elevations, where flowering was faster (Figure 5).
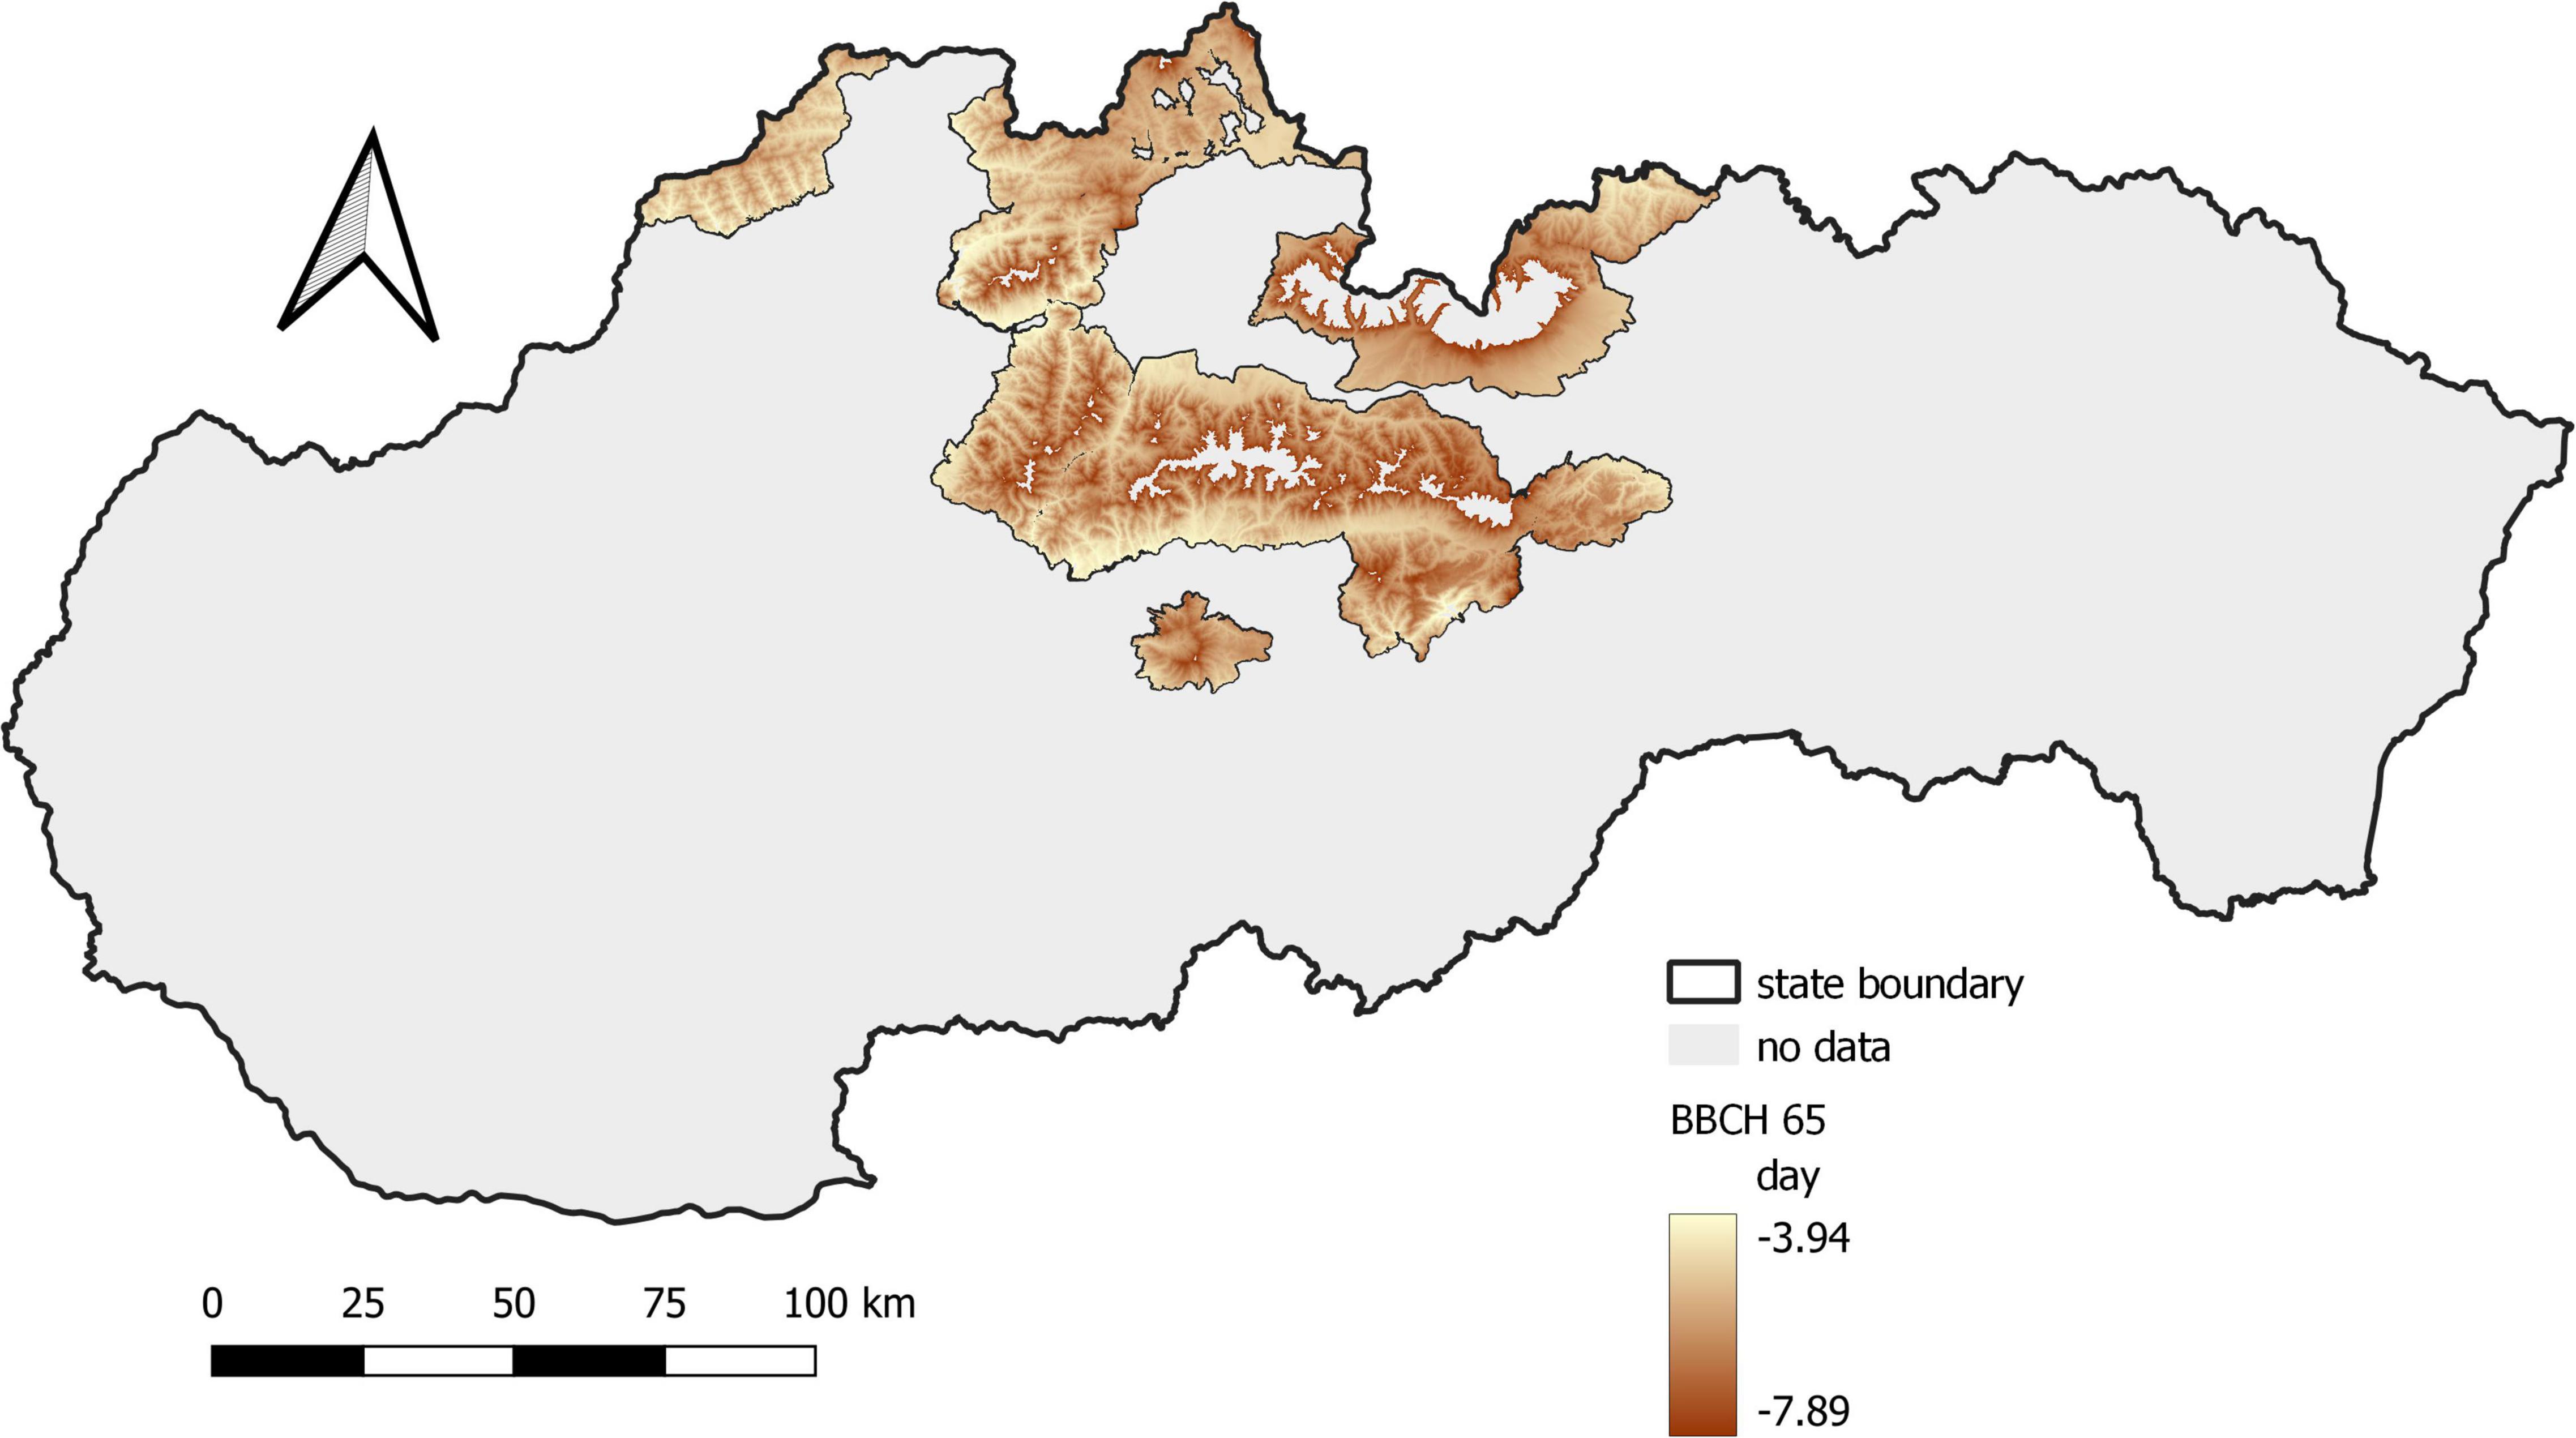
Figure 5. Shift in the average onset of full flowering in Norway spruce between the monitored periods.
Temporal changes in the onset of flowering due to changed climatic conditions between the observed periods can also be determined from trend analyses (Figure 6). In the first period, the trend was not statistically significant. In the second period, the trend shifted 7 days earlier, with statistical significance at the level of α = 0.01.
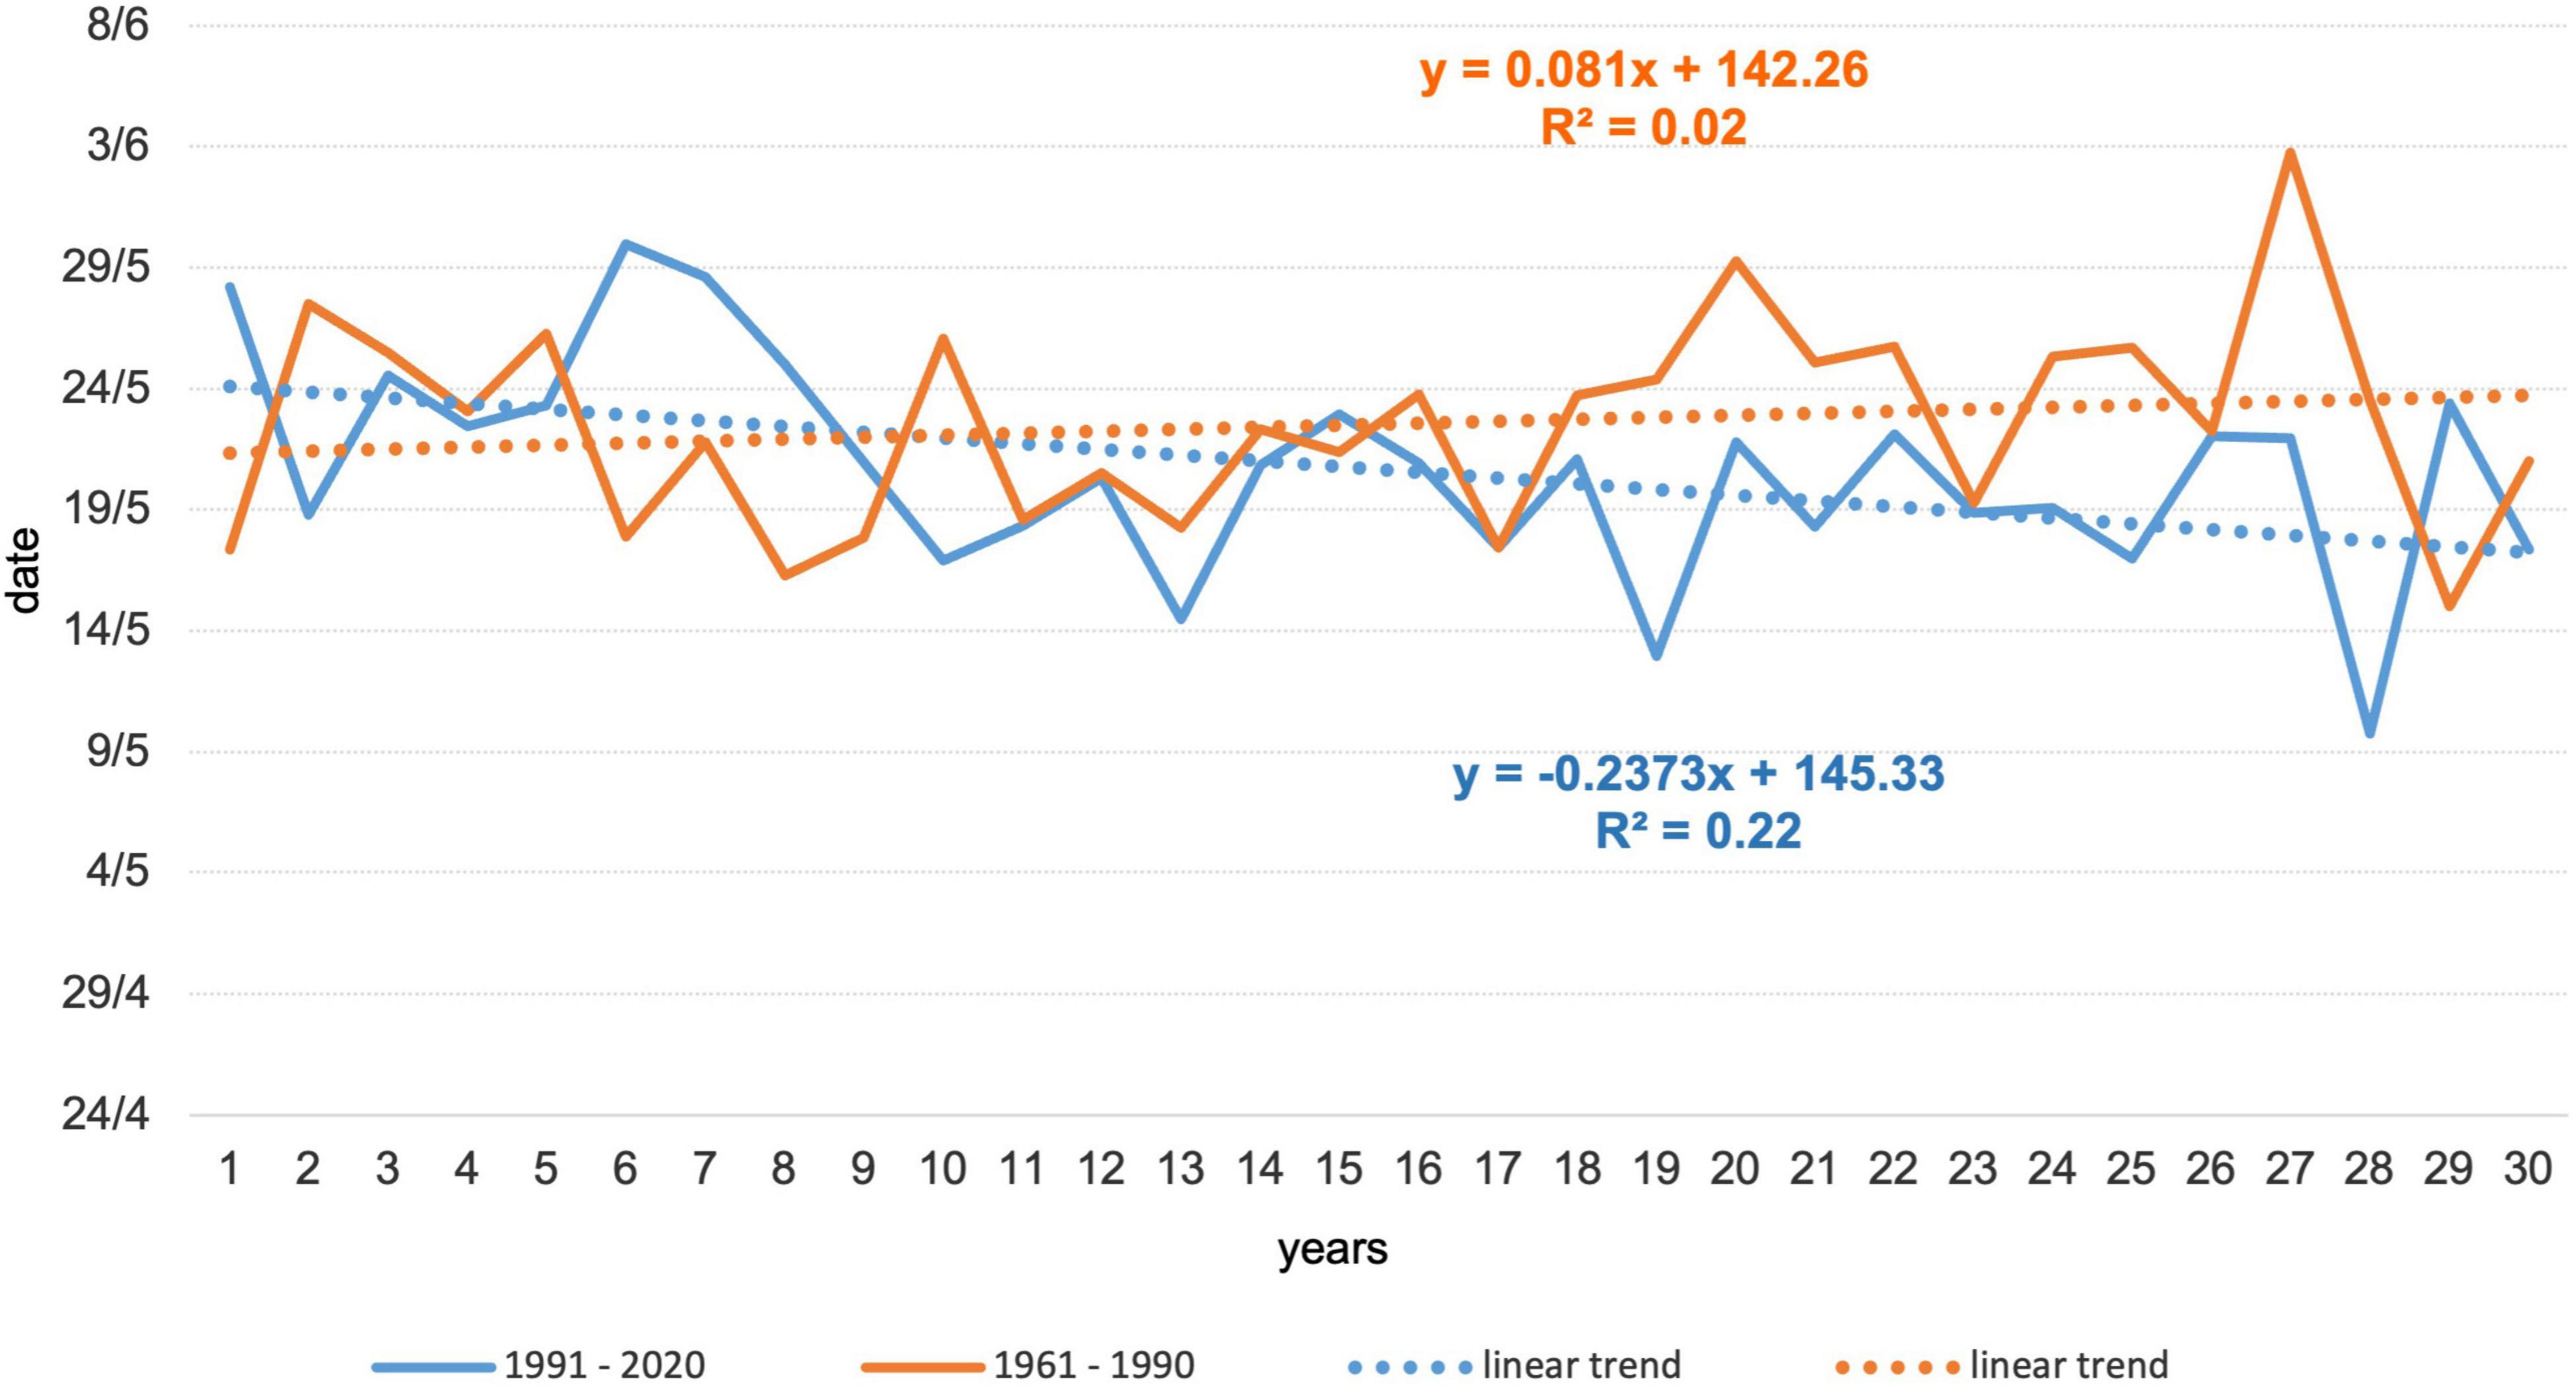
Figure 6. Development and trends of Norway spruce flowering in the two periods.
We analyzed the impact of air temperature and precipitation on the phenological phase at individual stations using monthly, bimonthly, 3-monthly, and 4-monthly climatological standard normals (30-year-long) of mean air temperature and precipitation sum prior to phase onset. For both periods, the closest correlation was between flowering onset and the monthly mean air temperature in January (Table 4). Negative values of correlation coefficients for all combinations show us that this is a negative correlation. The colder the period before the onset of the phenological phase, the later (higher number of the day) the phenological phase occurred, and the warmer the period before the onset of the phenological phase, the sooner (lower number of the day) the phenological phase occurred. The relationship between the average monthly values of air temperature and the onset of the phenological phase was stronger in the first observed period. The correlation between the sum of precipitation and the onset of the phenological phase (Table 4) was weak in the first period. In the second observed period, the correlation intensified. The statistical significance of the relationships between climatological standard normals, and the onset of the phenological phase is shown in Table 4, and statistically significant values are marked with the symbol*. Due to the strongest correlation between the January air temperature and the phenological phase in both periods, we performed a more detailed analysis of the January temperatures. Mean values of January temperatures in protected areas fluctuated between −3.5 and −6.8°C from 1961–1990 and between −2.1 and −5.7°C from 1991–2020. The change represented warming from 1.07 to 1.46°C. More distinct changes in the mean January temperature were observed at lower elevations.
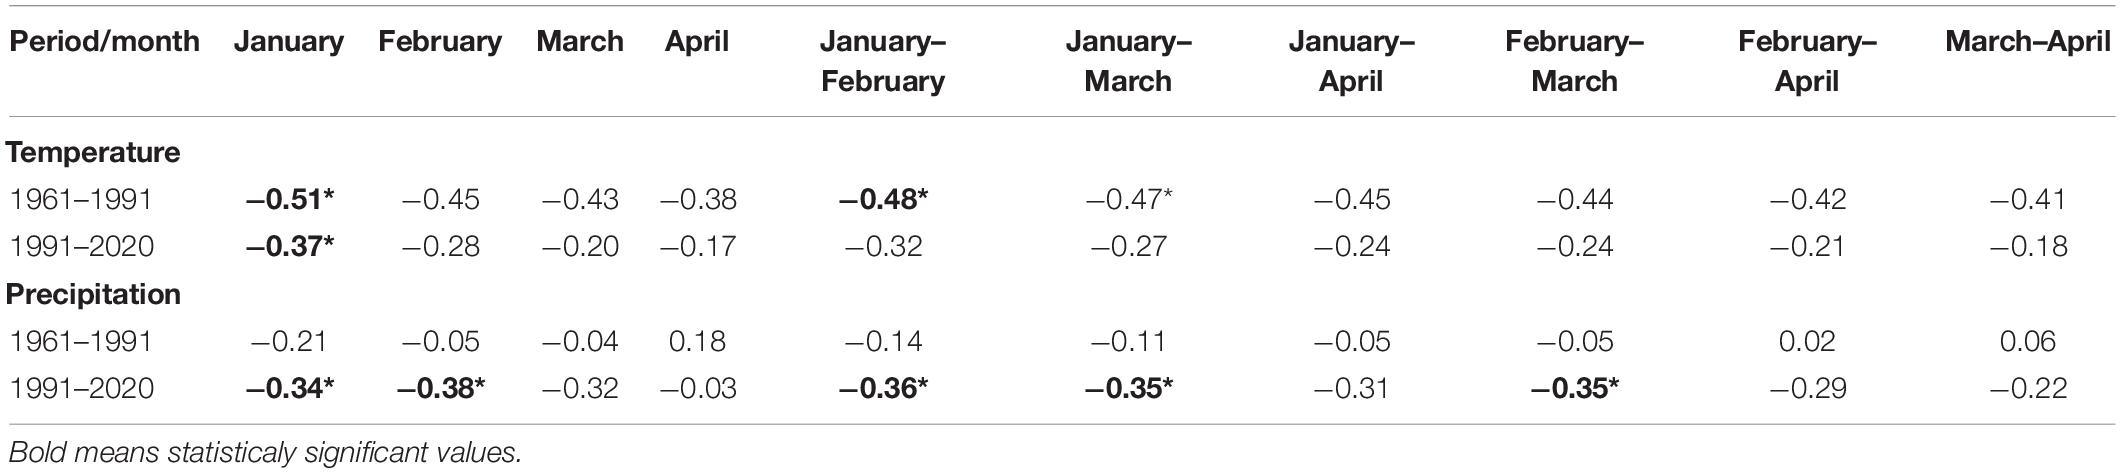
Table 4. Correlation coefficients and statistical significance (*p < 0.05) between the onset of the phenological phase and monthly climatological standard normals of air temperature and monthly sum of precipitation.
We also compared the annual deviations of the long-term phenological average to the deviations of the average monthly January air temperature (Figures 7, 8). The course of the deviations confirms the influence of the January air temperature on the delay in the onset of the phenological phase. In the years when the temperature was above climatological standard normal (warmer), the onset of the phenological phase was below the phenological normal (earlier onset).
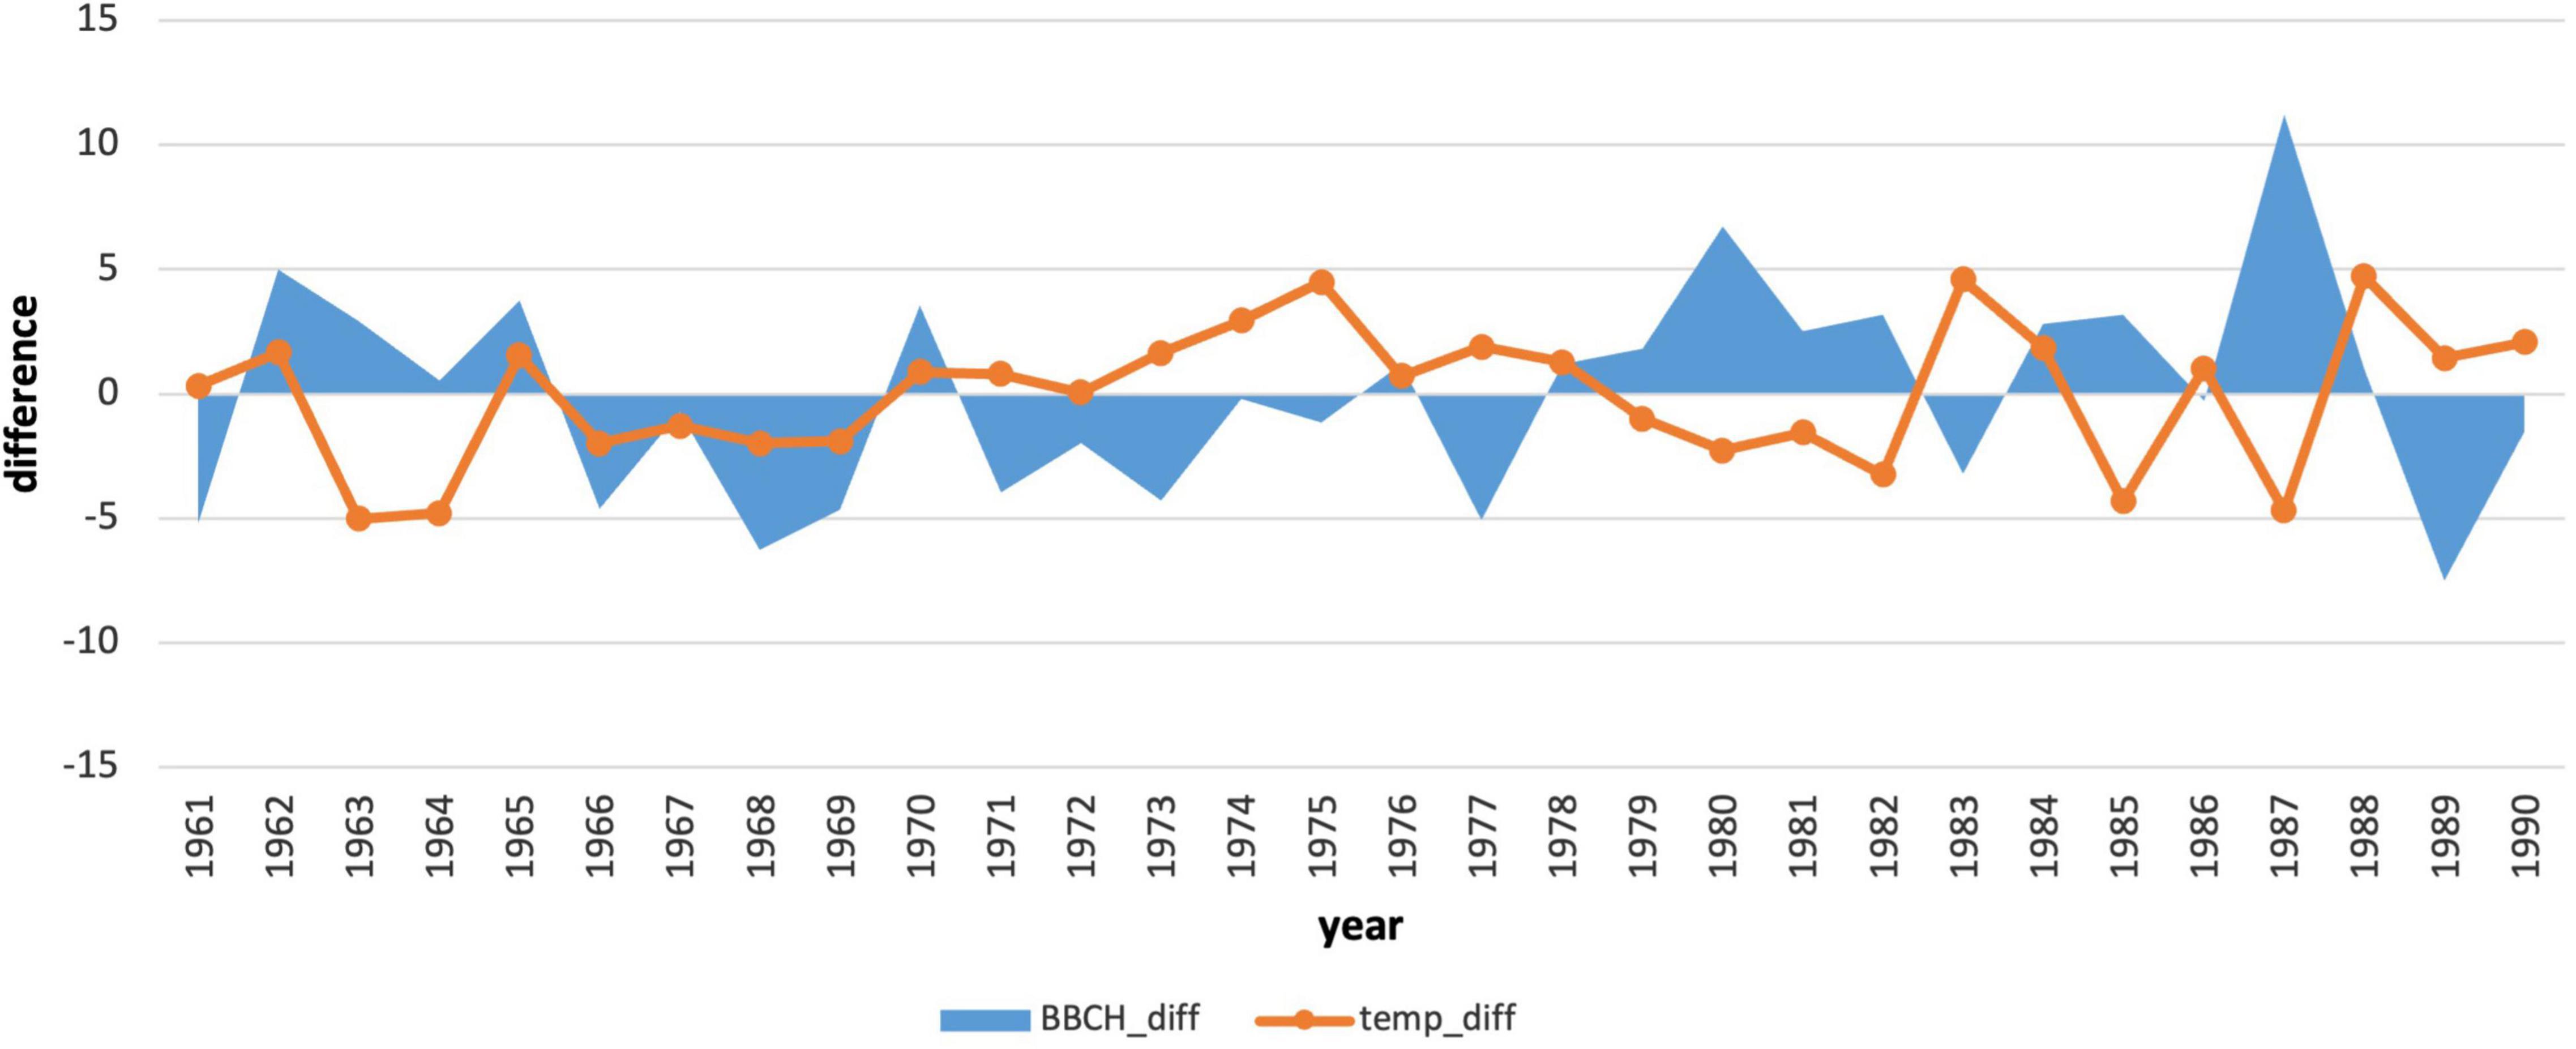
Figure 7. Comparison of deviations of the average monthly air temperatures in January with deviations of the onset of the phenological phase from the long-term average from 1961–1990.
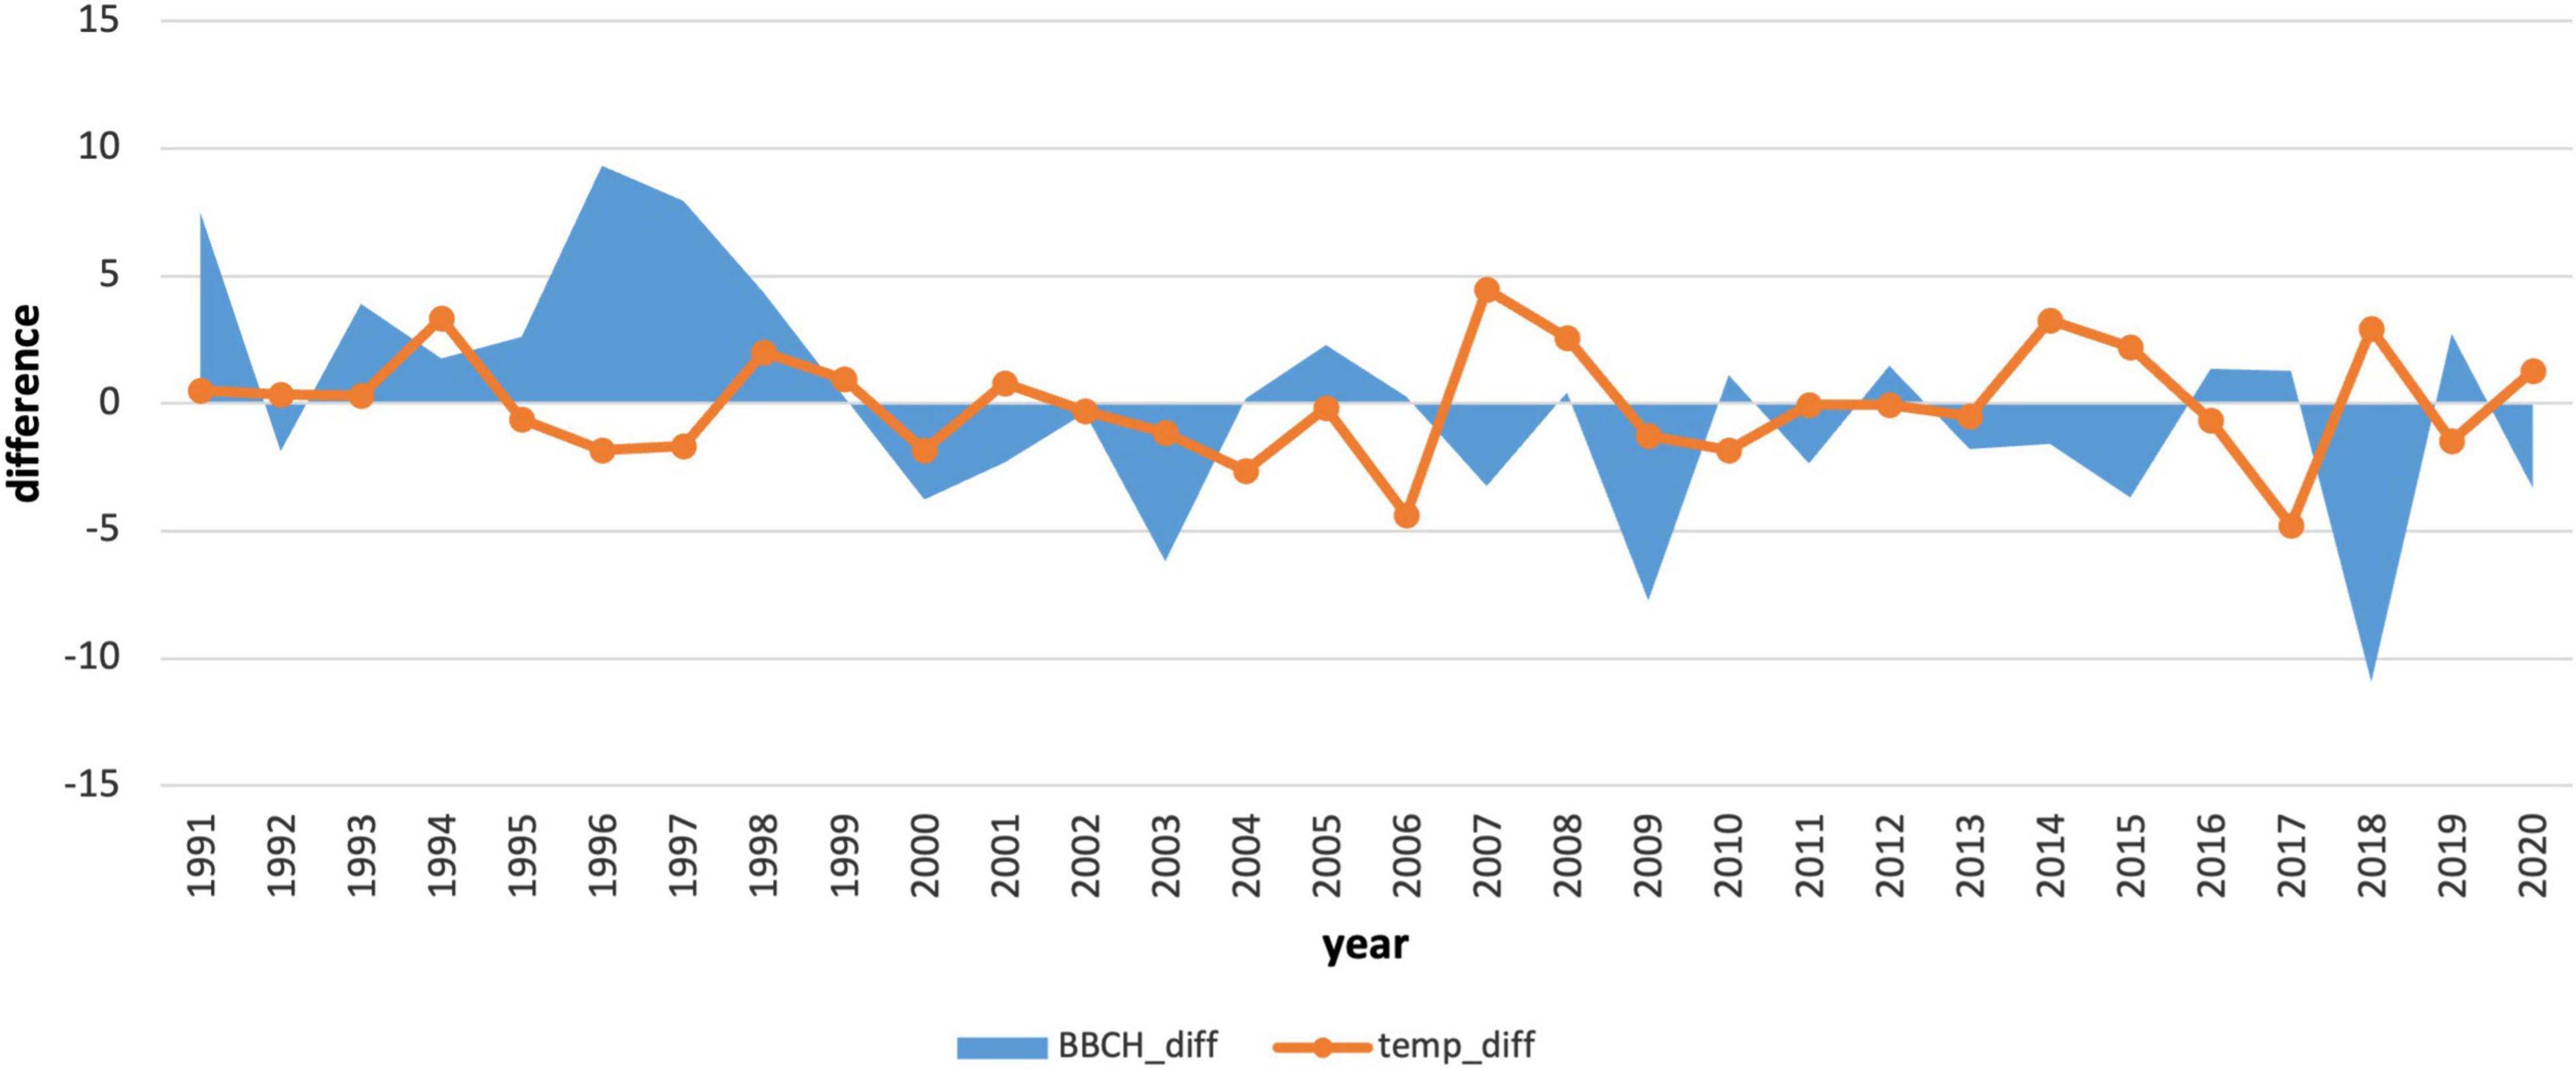
Figure 8. Comparison of deviations of the average monthly air temperature in January with deviations of the onset of the phenological phase from the long-term average for 1991–2020.
In the period 1961–1990, the coldest January was in 1963 (−8.87°C). The warmest January occurred in 1988 (0.86°C). The average January air temperature at the phenological stations (closest climatological stations to phenological stations) was −3.86°C. During this period, there were 12 years with below-average January air temperatures and 18 years with air temperatures higher than the January average. The period 1970–1978 represented the longest period of above-average January temperatures in a row. Deviations from the climatological normal ranged from 0.72 to 4.51°C.
In the period 1991–2020, the coldest January occurred in 2017 (−7.92°C). In contrast, the warmest January was recorded in 2007 (1.33°C). The average January air temperature at the phenological stations in this period reached −3.14°C. In total, there were 15 below-average and 15 above-average years. A continuous series of above-average temperatures was not observed in January, as in the previous period. January air temperatures in the second period were more variable compared to those in 1961–1990. The change in the average January temperature and its higher variability indicate the impact of climate change, which affects the onset of the phenological phase and pushes it to earlier terms.
Due to the statistical significance (−0.47), we also performed an analysis of the first 3-month period (Jan–Mar) air temperature averages (Table 4 and Figure 9). This analysis also showed the effect of spring air temperature. Deviations in the onset of the phenological phase and the air temperature showed a similar course to the analysis of January temperatures. Even the longer 3-month cold period impacts the onset of flowering, as does the month of January itself. The results in the second period (Figure 10) showed a change. The mean 3-month air temperature (January–March) increased due to warming by 0.82–1.1°C. This indicates changes in the climatic conditions of the area. Due to climate change, the deviations of the average 3-month air temperature from the first period increased in the last 10 years, which was also confirmed by an insignificant correlation (−0.27). However, the impact of the average long-term January deviations in the second period remained significant (−0.37; Figure 8).
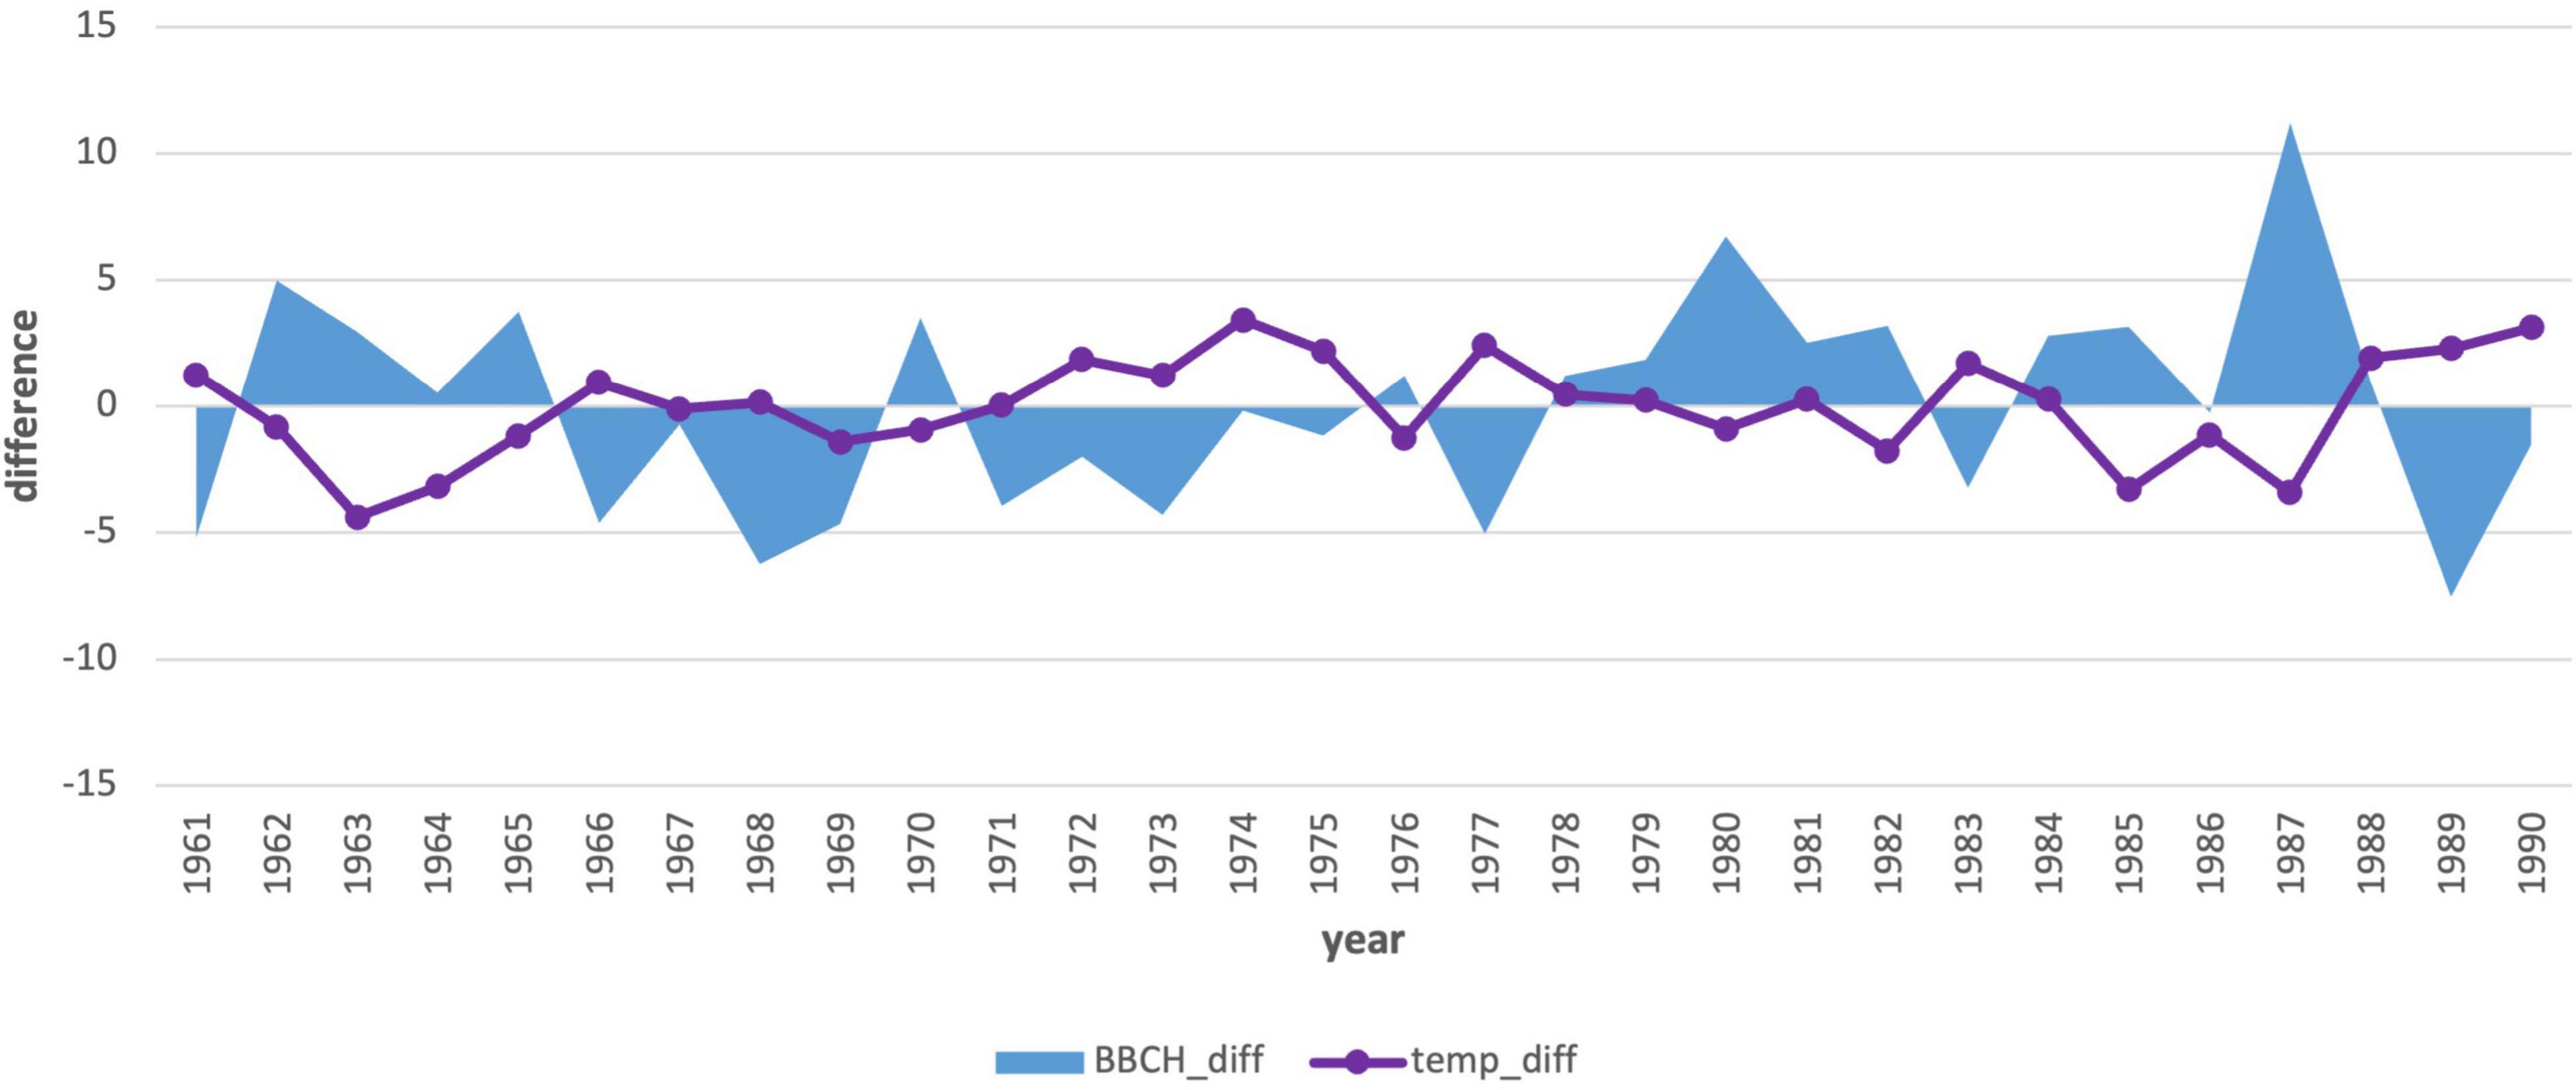
Figure 9. Comparison of the average 3-month air temperature deviations from January to March with the deviations in the onset of the phenological phase from the long-term average from 1961–1990.
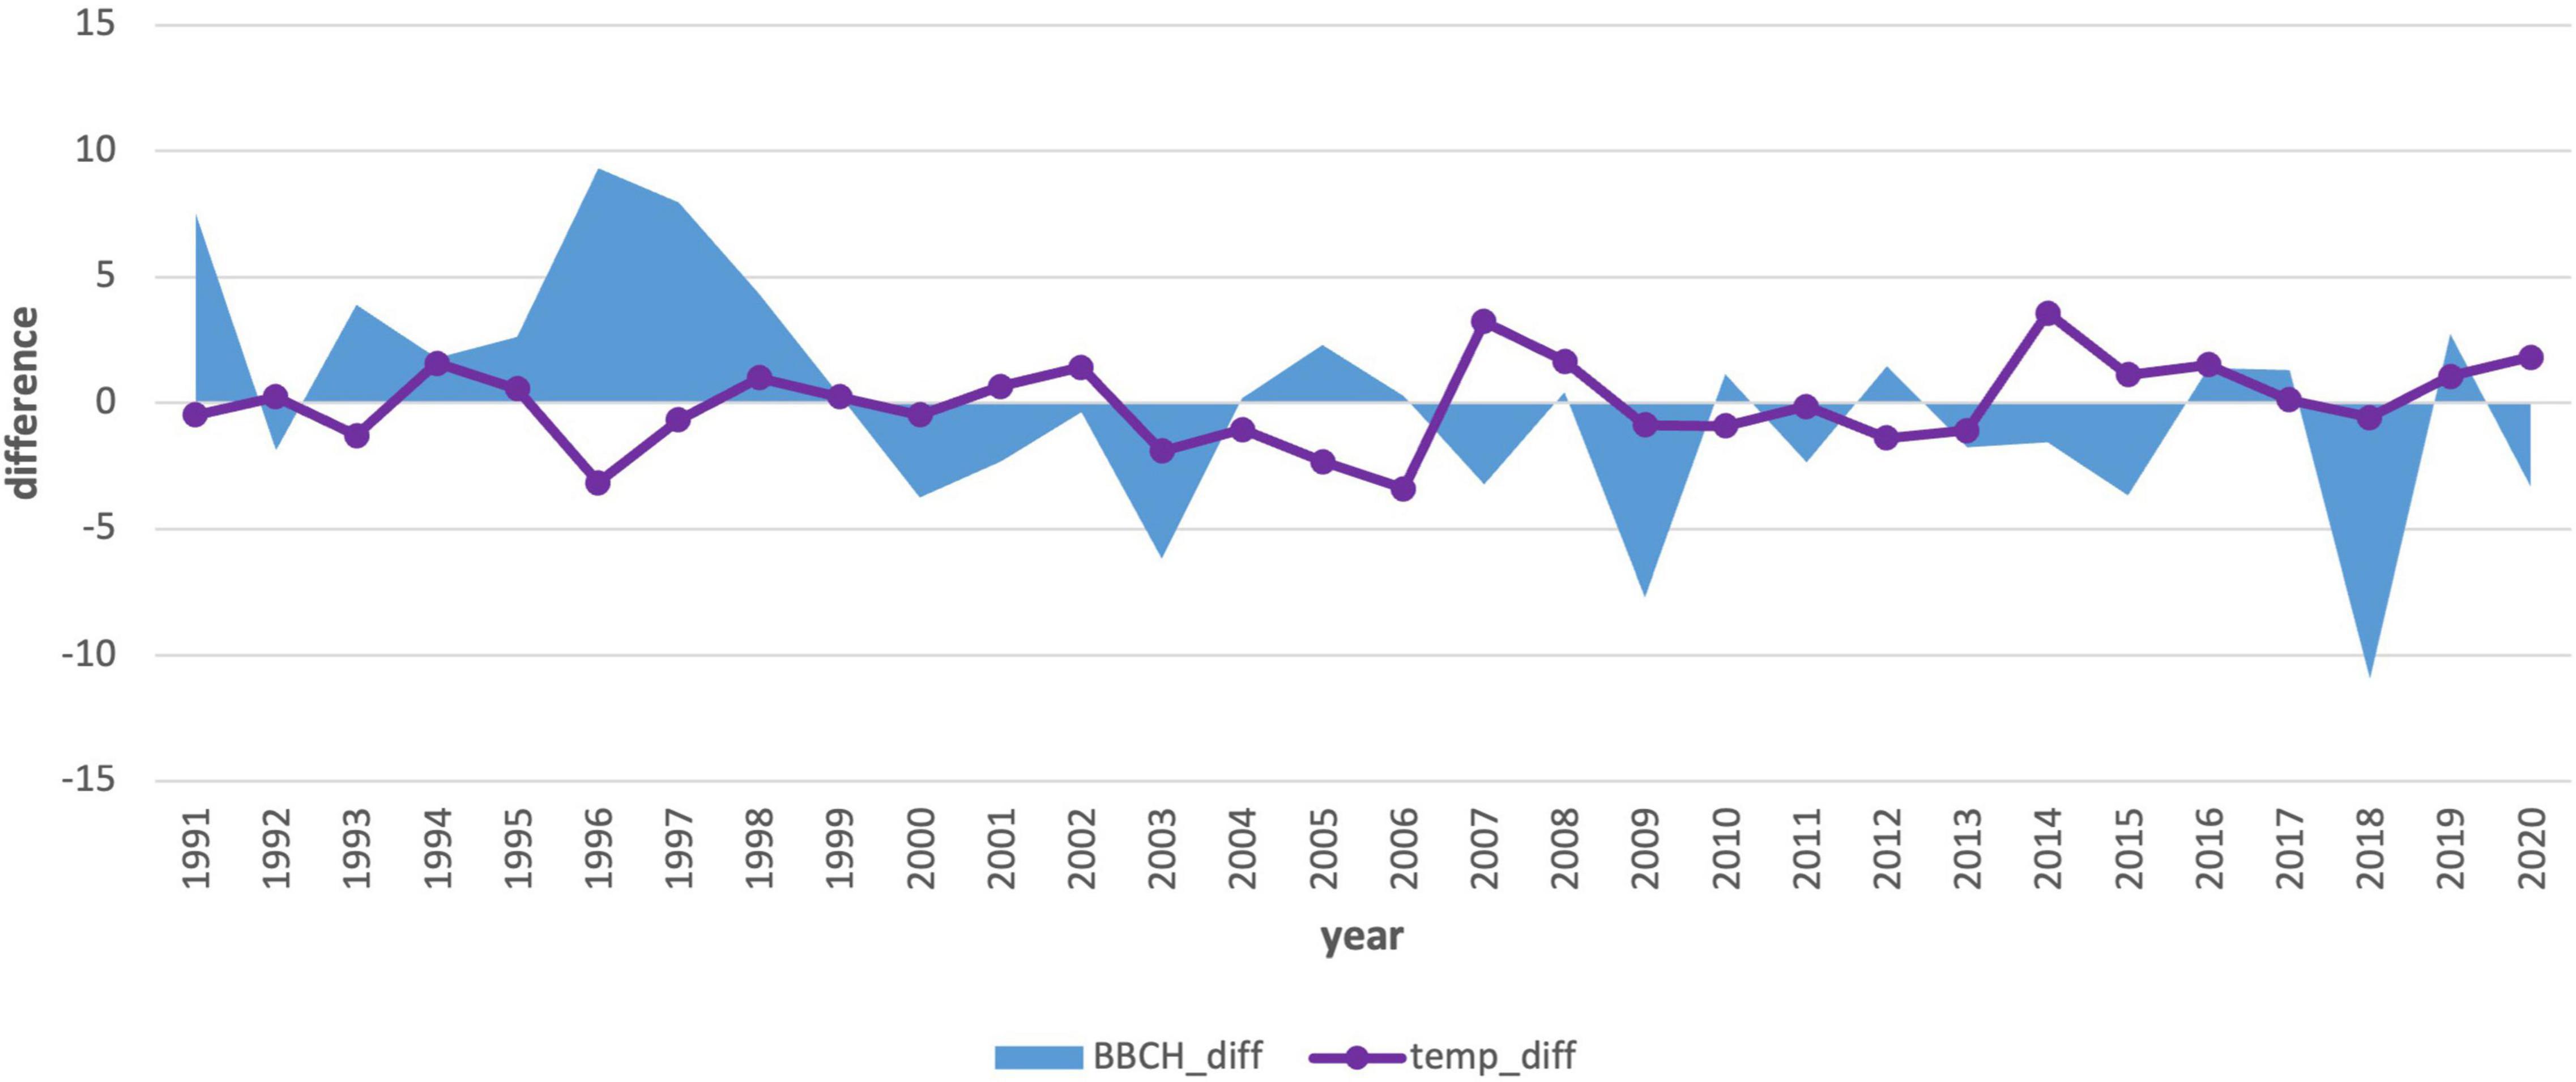
Figure 10. Comparison of the average 3-month air temperature deviations from January to March with the deviations in the onset of the phenological phase from the long-term average from 1991–2020.
Changes in mean January air temperature in individual protected areas are shown in Table 5. In both periods, the coldest area was NP Tanap, and the warmest one was PLA Kysuce. The change in mean January temperature between the periods showed warming from 1.24 to 1.34°C.
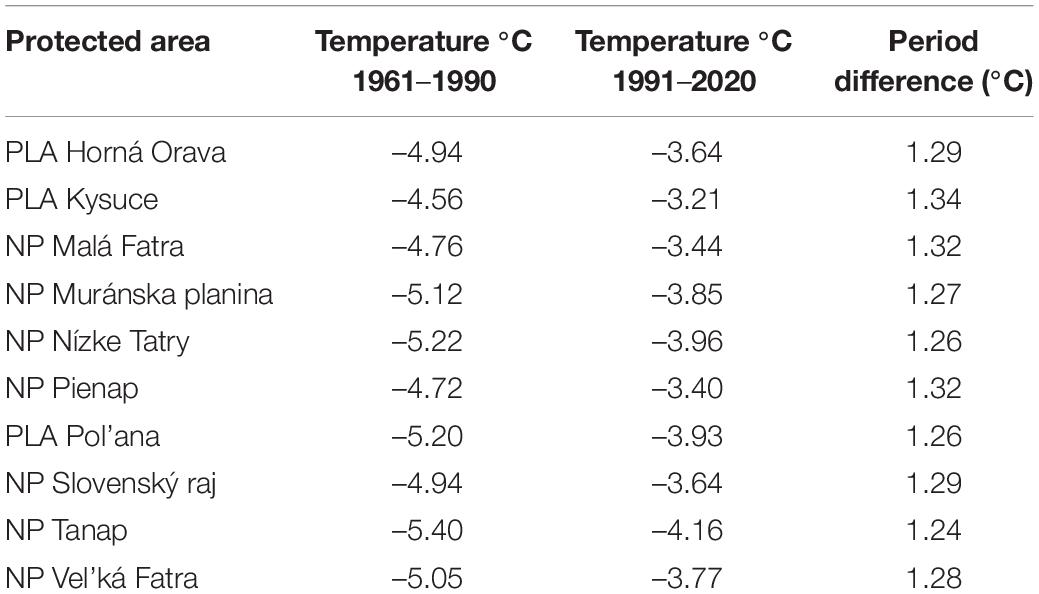
Table 5. Mean January air temperature and its change in protected areas in both periods.
Due to the low correlation between the monthly total precipitation and the onset of the phenological phase, we did not perform a more detailed analysis of precipitation. We focused only on the change (difference) in the monthly sum of precipitation between the observed periods. The differences in the total precipitation in the individual protected areas are shown in Table 6. Positive values represent the increase in total precipitation, and negative values represent the decrease in total precipitation between the observed periods.
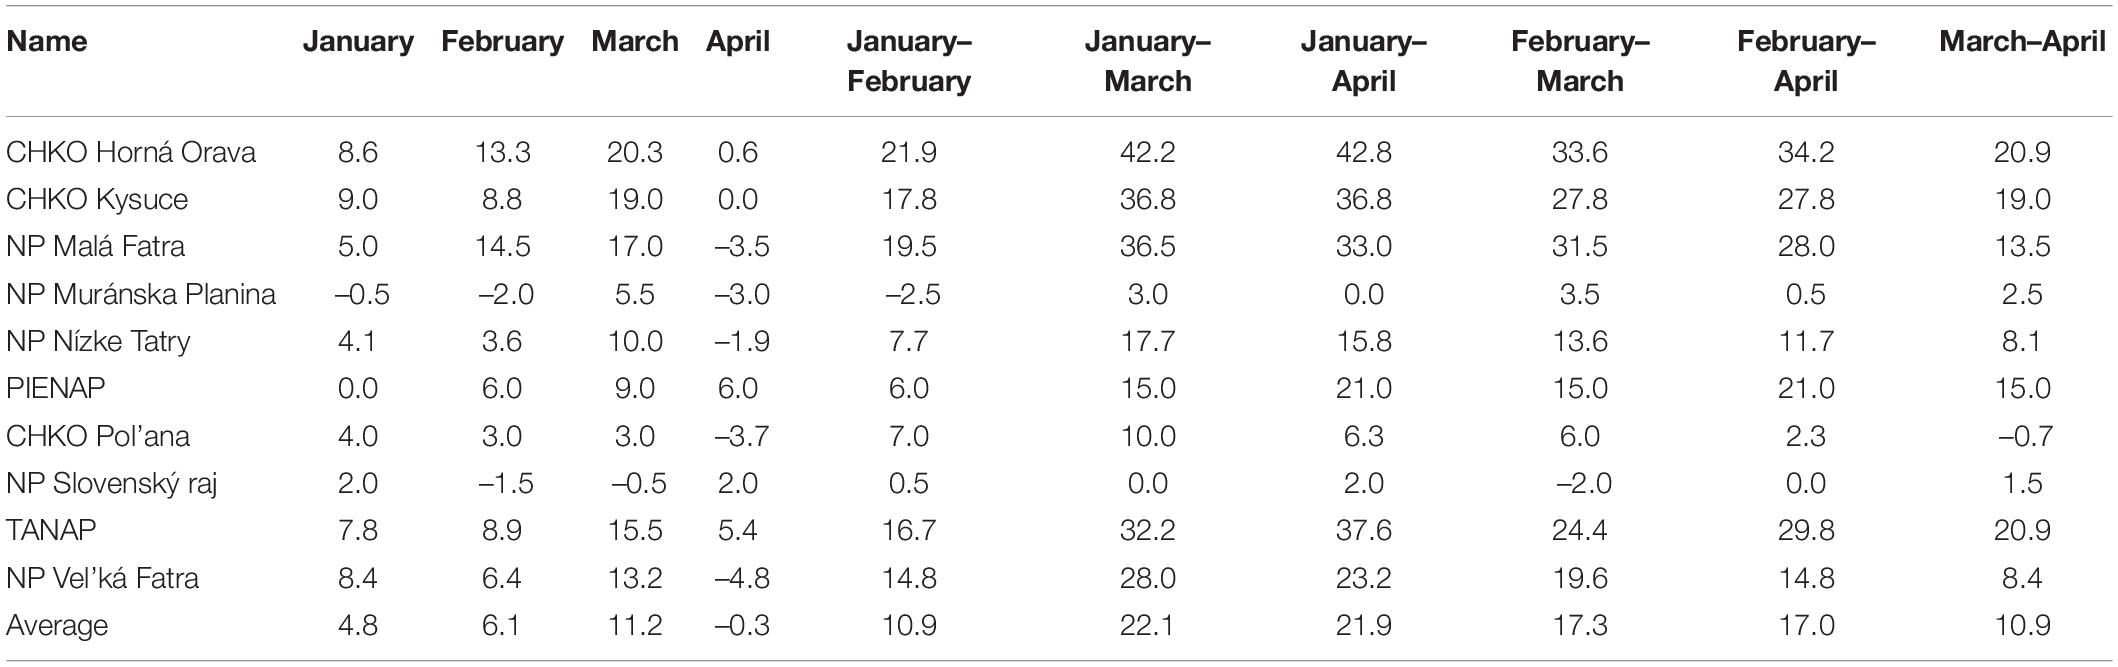
Table 6. Difference of monthly total precipitation (in mm) in protected areas between the monitored periods.
The largest increase in precipitation between the compared periods occurred in March, with the maximum increase occurring in PLA Horná Orava. We observed the largest decrease in precipitation between the individual monitored periods in the most protected areas in April, with the minimum observed in the Vel’ká Fatra National Park.
The analysis of the impact of the ongoing climate change on Norway spruce flowering based on several methods showed the shift of full flowering into an earlier period throughout Slovakia, including individual protected areas (NP, PLA). The results showed the shift in flowering in the second period, 1991–2020, by 4–8 days earlier. In the past, phenological manifestations of spruce in this region were monitored at 38 phenological stations in mountainous parts of Slovakia covering a shorter period (1996–2008) (Škvareninová and Snopková, 2010). According to this work, in locations below 940 m a.s.l., flowering lasted from May 17–24. These data are consistent with our data from the second period (May 17–30). Norway spruce flowering under similar environmental conditions in the Czech Republic was analyzed by Hájková et al. (2012). This work stated an earlier onset of flowering in the years 1991–2010 in comparison to the preceding period, and a gradual delay of flowering with the increasing elevation. In the investigated area covering elevations from 155 to 860 m a.s.l., flowering lasted, on average, from May 20 to June 2. The results partially correspond with our results because their elevation intervals were smaller than ours.
The changes in flowering in the elevation profile are also reflected in the phenological elevational gradient. The values determined in our study (3.7 and 3.4 days/100 m) coincide with the gradients of Schieber (2014) for some autochthonous tree species in the region. The values fluctuated from 3 to 4.3 days/100 m of elevation. Anther already mentioned work (Hájková et al., 2012) reported a vertical phenological gradient of Norway spruce flowering equal to 2 days/100 m of elevation. The elevation interval of their study plots was 540 m narrower, which explains the lower value compared to our results. Pellerin et al. (2012) considered altitude and topography alongside temperature to be the main variable units influencing the development of buds in their study of tree phenology, including Norway spruce in the Western Alps. The delay in the monitored tree phase ranges from 2.4 to 3.4 days/100 m in height, which also corresponds to our results in the second period.
Vitasse et al. (2018) reported a reduction in the phenological gradient in the Alps with stronger warming and higher temperatures during late spring. We also found an analysis of the effect of altitude on the beginning of flowering by elevation classes. The phenological shift between the height levels in each period had a balanced course. Compared to the first period, we recorded a slight decrease in the phenological shift of 0.4 days in the second period. Due to the small area of our research, the difference between the compared gradients was not substantial. The impact of altitude on spruce flowering in the period 1971–2000 in the Alps region was also reported by Ziello et al. (2009). The results showed a mostly insignificant, less strong dependence of phenological time trends on altitude. For spruce, the displacement represents 0.92/100 m, which is a difference of 0.4–0.8 days/100 m compared to our results (1.3–1.7 days). Phenological trends in a temperature-changing environment show a weaker dependence on altitude and suggest a faster progression of the flowering phase at higher altitudes.
One way to assess the impacts of climate change on plants is to analyse their long-term phenological data. In spring, the flowering of tree species reacts sensitively to an increase in air temperature. In the case of longer periods in 1961–2008, several authors recorded earlier flowering of tree species by almost 11–13 days because of global warming (Bauer et al., 2014). At the turn of the century, the results of Roetzer et al. (2000) reported a shift of 40-year-long trends of spring phases of forest tree species in Central Europe by 13–15 years. A significant shift of the conifer spring phenophases to an earlier period was recorded in a long-term series after the mid-1980s (1946–2020). Kolářová et al. (2014). Early statistically significant flowering is also confirmed by our results of trend analyses, where an earlier onset was manifested in the years 1991–2020 by a shift 7 days earlier. Trend studies have also been shown by Nordli et al. (2008). They revealed the importance of the cold period and its impact on dormancy and the onset of the spring phenological phases. The assumption of January and February indices of North Atlantic oscillation affects the onset of spruce spring phases in different regions of Norway. In our conditions, there was a correlation between flowering and monthly climatological standard normal of air temperatures in the winter months; the closest correlation was between January mean air temperature and flowering. Figures 7, 8 also show the time periods (1991–1994 and 1966–1970), which do not confirm our claims about the influence of the January temperature on the onset of the phenophase. For this reason, we plan to analyse the influence of temperature extremes before phenophase onset in the future and the influence of the number of cold and warm days on phenophase onset. It will also be appropriate to perform an analysis of the height and duration of snow cover at the onset of the spring phenological phase. With precipitation, we observed an increase in its influence on the onset of the phenological phase. In the future, it will therefore be necessary to focus more comprehensively on the impact of drought before the onset of the phenological phase, for example, using climate water balance or drought indices. This will also recognize the impact of snow cover in these mountainous areas.
Plant phenological observations have growing importance as indicators of climate change and variability. For 40 years, Studer et al. (2005) monitored, in the condition of climate change in the Swiss Alps, the influence of climatological variables—temperature and precipitation—on the course of the spring phases. Consistent results with ours confirmed the effect of temperature on the onset of phenological phases, while precipitation did not show a significant effect. The average overall trend of 1.5 days per decade was clearly due to changes in winter and spring temperatures. Our results are consistent, and the trend of flowering over the decades in the southern part of the Western Carpathians represents a shift of 2.3 days with statistical significance. The influence of temperature and precipitation on the biological activity of spruce was addressed by Mäkinen et al. (2002). He stated that the limiting effect of low temperatures was more pronounced in alpine localities. The impact of precipitation was manifested only at low altitudes. Studer et al. (2005) reported that temperature for the Swiss mountain area was the main climatic parameter for spring phenological development. They found a high dependence on air temperature, while precipitation did not show a significant effect. The same conclusions were reached by a research team in Finland (Kubin et al., 2014), where the spring phenological phases of spruce showed only the effect of temperature, with a significant trend of their earlier onset of 1.5 days/10 years. This finding is also confirmed by our results on the effect of temperature on spruce flowering. The impact of precipitation was insignificant, as mountain areas did not have a precipitation deficit during this period.
The work presents the results of phenological observations of Norway spruce [P. abies (L.) Karst.] in the southern part of the Western Carpathians under the conditions of ongoing climate change. We assessed the changes in the phenological phase of full flowering (BBCH 65) at elevations from 390 to 1,400 m a.s.l. inside the distribution area of the species in Slovakia. We analyzed the changes observed at 54 phenological stations in two 30-year-long periods (1961–1990, 1991–2020). The stations were located in three protected landscape areas and seven national parks. We evaluated climate change based on the average onset of flowering (BBCH 65) and its trends, phenological elevational gradient, and correlations of flowering to monthly climatological standard normals of air temperature. The impact of climate change was manifested in flowering 4–8 days earlier (May 17–30) in the second period, and the duration of phenophase shortened by 4 days. A less substantial change was observed in the phenological elevational gradient, which was reduced by 0.3 days/100 m in the second period compared to the first one, when its value was 3.7 days/100 m. It was more distinct at higher elevations due to the faster onset of the phenological phase. Due to warming, the statistically significant trend of average spruce flowering shifted by 7 days earlier in the second period. Analysis of the relationship between the onset of flowering and the monthly mean air temperature showed a negative correlation for both observed periods, with a stronger correlation in the first observed period. Negative values of correlation coefficients showed an indirect relationship between air temperature and the onset of the phenological phase. The lower the average air temperature that occurred before the onset of the phenological phase, the later the phenological phase started. Statistically significant correlations were confirmed in the case of January air temperature in both periods and in the case of multi-monthly air temperature averages for January–February and January–March for the period 1961–1990. The mean January air temperature increased from 1.07 to 1.46°C in the protected areas during the second period. The mean 3-month air temperature (January–March) increased by 0.82 to 1.1°C in protected areas during the second period. A more significant change in the January mean air temperature was observed at lower elevations. The analysis of Norway spruce flowering in the second period indicates warming and changes in the climatic conditions of the area. Warming is more pronounced at lower elevations. The changes in total precipitation were most pronounced in March as they increased. In contrast, the highest decrease in precipitation between periods was observed in April in almost all protected areas. The correlation between total precipitation and the onset of the phenological phase was low in both periods. Precipitation did not have a significant effect on the onset of the phenological phase in any of the monitored periods. Considering the ecological demands of spruce, we can expect a shift in its distribution to higher elevations of protected areas in the future.
The significance of this work lies in the use of knowledge about the impact of ongoing climate change to ensure a sufficient seed crop of spruce in mountain areas, with time changes in the onset of the phenological phase of flowering. Phenological knowledge about the development of generative organs will be a suitable tool in nature protection in the collection of seeds from mountain areas to ensure a new generation, even in “ex situ” conditions in the form of regional seed orchards. This knowledge can be used in breeding programmes to obtain resistant, later-budding individuals to localities with late frosts. Based on existing phenological and meteorological databases, it will be possible to model further development and possible changes in mountain ecosystems and altitude levels with the natural distribution of spruce in the conditions of ongoing climate change.
The raw data supporting the conclusions of this article will be made available by the authors, without undue reservation.
JŠ conceived the idea. IM prepared the data for analysis. Both authors developed and designed the methods, wrote and edited the original draft, prepared the final version, contributed to the article, and approved the submitted version.
This work was financially supported by the Grant Agency of Ministry of Education of the Slovak Republic VEGA 1/0057/22, 1/0500/19 and by the grant of the Slovak Research and Development Agency no. APVV-18-0347.
The authors declare that the research was conducted in the absence of any commercial or financial relationships that could be construed as a potential conflict of interest.
All claims expressed in this article are solely those of the authors and do not necessarily represent those of their affiliated organizations, or those of the publisher, the editors and the reviewers. Any product that may be evaluated in this article, or claim that may be made by its manufacturer, is not guaranteed or endorsed by the publisher.
Asse, D., Chuine, I., Vitasse, Y., Yocoz, N. G., Delpierre, N., Badeau, V., et al. (2018). Warmer winters reduce the advance of tree spring phenology induced by warmer springs in the Alps. Agricul. For. Meteorol. 252, 220–230. doi: 10.1016/j.agrformet.2018.01.030
Babálová, D., Škvareninová, J., Fazekaš, J., and Vyskot, I. (2018). The dynamics of the phenological development of four woody species in south-west and central Slovakia. Sustainable 10:1497. doi: 10.3390/su10051497
Bartík, M., Holko, L., Jančo, M., Škvarenina, J., Danko, M., Kostka, Z., et al. (2019). Influence of mountain spruce forest dieback on snow accumulation and melt. J. Hydrol. Hydromechanics 67, 59–69. doi: 10.2478/johh-2018-0022
Bartík, M., Jančo, M., Střelcová, K., Škvareninová, J., Škvarenina, J., Mikloš, M., et al. (2016). Rainfall interception in a disturbed montane spruce (Picea abies) stand in the West Tatra Mountains. Biology 71, 1002–1008. doi: 10.1515/biolog-2016-0119
Basler, D., and Körner, C. (2012). Photoperiod sensitivity of bud burst in 14 temperate forest tree species. Agricul. For. Meteorol. 165, 73–81. doi: 10.1016/j.agrformet.2012.06.001
Bauer, Z., Bartošová, L., Bauerová, J., Trnka, M., Štěpánek, P., Možný, M., et al. (2014). Observed Phenological Response of Ecosystems to the Climate: Part I. – Flood-Plain Forest. Brno: Mendel University.
Bednářová, E., Merkolová, L., and Truparová, S. (2010). Results of a phenological study at a young Norway spruce (Picea abies (L.) Karst). Acta Univ. Agric. Mendelianae Brun. 58, 35–42. doi: 10.11118/actaun201058050035
Bertin, R. J. (2008). Plant phenology and distribution in relation to recent climate change. J. Torrey. Bot. Soc. 135, 126–146. doi: 10.3159/07-rp-035r.1
Bošel’a, M., Sedmák, R., Sedmakova, D., Marušák, R., and Kulla, L. (2014). Temporal shifts of climate–growth relationships of Norway spruce as an indicator of health decline in the Beskids, Slovakia. For. Ecol. Manag. 325, 108–117. doi: 10.1016/j.foreco.2014.03.055
Bošel’a, M., Tumajer, J., Cienciala, E., Dobor, L., Kulla, L., Marčiš, P., et al. (2021). Climate warming induced synchronous growth decline in Norway spruce populations across biogeographical gradients since 2000. Sci. Total Environ. 752:141794. doi: 10.1016/j.scitotenv.2020.141794
Braslavská, O. Kamenský, L., Pagan, J.Goliášová, K. (1996). Phenological Observation of Forest Plants. Methodological Prescription of SHMÚ. Bratislava: SHMÚ Publishing.
Braun, K. (2020). Growth responses of Norway spruce to climate change in the Javorová valley of the High Tatra Mountains, Slovakia. Oecologia Montana 30, 11–31.
Caudullo, G., Tinner, W., and Rigo, D. (2016). “Picea abies in Europe: distribution, habitat, usage and threats,” in European Atlas of Forest Tree Species, eds J. San-Miguel-Ayanz, D. de Rigo, G. Caudullo, T. Houston Durrant, and A. Mauri (Luxembourg: Publication Office of the European Union), 114–116.
Chmielewski, F. M., and Rötzer, T. (2001). Response of tree phenology to climate change across Europe. Agric. Forest Meteorol. 108, 101–112. doi: 10.1016/s0168-1923(01)00233-7
Ďurský, J., Škvarenina, J., Mind’áš, J., and Miková, A. (2006). Regional analysis of climate change impact on Norway spruce (Picea abies L. Karst.) growth in Slovak mountain forests. J. For. Sci. 52, 306–315. doi: 10.17221/4512-jfs
Dyderski, M. K., Paž, S., Frelich, L. E., and Jagodzinski, A. M. (2018). How much does climate change threaten European forest tree species distributions? Glob. Change Biol. 24, 1150–1163. doi: 10.1111/gcb.13925
Fazekašová, D., Boguská, Z., Fazekas, J., Skvareninova, J., and Chovancová, J. (2016). Contamination of vegetation growing on soils and substrates in the unhygienic region of Central Spis (Slovakia) polluted by heavy metals. J. Environ. Biol. 37, 1335–1340.
Gömöryová, E., Střelcová, K., Škvarenina, J., and Gömöry, D. (2013). Responses of soil microorganisms and water content in forest floor horizons to environmental factors. Eur. J. Soil Biol. 55, 71–76. doi: 10.1016/j.ejsobi.2012.12.001
Grodzki, W., Jakuš, R., Lajzová, E., Sitková, Z., Maczka, T., Škvarenina, J., et al. (2006). Effects of intensive versus no management strategies during an outbreak of the bark beetle Ips typographus (L.)(Col.: Curculionidae, Scolytinae) in the Tatra Mts. in Poland and Slovakia. Ann. For. Sci. 63, 55–61. doi: 10.1051/forest:2005097
Gyllenstrand, N., Clapham, D., Kallman, T., and Lagercrantz, U. (2007). A Norway spruce FLOWERING LOCUS T homolog is implicated in control of growth rhythm in conifers. Plant Physiol. 144, 248–257. doi: 10.1104/pp.107.095802
Hájková, L., Kožnarová, V., Sulovská, S., and Richterová, D. (2012). The temporal and spatial variability of phenological phases of the Norway spruce (Picea abies (L.) Karsten) in the Czech Republic. Folia Oecologica 39, 10–20.
Jansson, G., Danusevičius, D., Grotehusman, G., Kowalczyk, J., Krajmerova, D., Skroppa, T., et al. (2013). “Norway Spruce (Picea abies (L.) H.Karst.),” in Forest Tree Breeding in Europe. Managing Forest Ecosystems, 25, ed. L. Pâques (Dordrect: Springer), doi: 10.1007/978-94-007-6146-9_3
Kirschbaum, M. U. F. (2000). Forest growth and species distribution in a changing climate. Tree Physiol. 20, 309–322. doi: 10.1093/treephys/20.5-6.309
Kolářová, E., Nekovář, J., and Adamík, P. (2014). Long-term temporal changes in central European tree phenology (1946-2010) confirm the recent extension of growing seasons. Int. J. Biometeorol. 58, 1739–1748. doi: 10.1007/s00484-013-0779-z
Kubin, E., Poikolainen, J., Karhu, J., and Tolvanen, A. (2014). “The spring and autumn phenophases of the broadleaves trees indicate the extension of growing season in the boreal forest environment,”in EGU General Assembly Conference Abstracts (Vienna: Geospots Vienna), 4882.
Lapin, M., Damborská, I., Drinka, R., Faško, P., Gaál, L., and Melo, M. (2008). Introduction to extreme weather scenarios and selected processing results. Natl. Clim. Programme Slovak Republic 12, 9–30.
Linderholm, H. (2006). Growing season changes in the last century. Agricul. For. Meteorol. 137, 1–14. doi: 10.1016/j.agrformet.2006.03.006
Lukasová, V., Škvareninová, J., Bičárová, S., Sitárová, Z., Hlavatá, H., Borsányi, P., et al. (2021). Regional and altitudinal aspects in summer heatwave intensification in the Western Carpathians. Theor. Appl. Climatol. 146, 1111–1125. doi: 10.1007/s00704-021-03789-5
Lukasová, V., Vido, J., Škvareninová, J., Bičárová, S., Hlavatá, H., Borsányi, P., et al. (2020). Autumn phenological response of European beech to summer drought and heat. Water 12:2610. doi: 10.3390/w12092610
Luomajoki, A. (1993). Climatic adaptation of Norway spruce (Picea abies (L.) Karsten) in Finland based on male flowering phenology. Acta For. Fenn. 242, 1–28.
Mäkinen, H., Nöjd, P., Kahle, H. P., Neumann, U., Tveite, B., Mielikäinen, K., et al. (2002). Radial growth variation of Norway spruce (Picea abies (L.) Karst.) across latitudinal and altitudinal gradients in central and northern Europe. For. Ecol. Manag. 171, 243–259. doi: 10.1016/s0378-1127(01)00786-1
Meier, U. (1997). Growth Stages of Mono- and Dicotyledonous Plants: BBCH-Monograph. Berlin: Blackwell Wissenschaftsverlag.
Menzel, A., Sparks, T. H., Estrella, N., and Roy, D. B. (2006). Altered geographic and temporal variability in phenology in response to climate change. Glob. Ecol. Biogeogr. 15, 498–504. doi: 10.1111/j.1469-8137.2004.01003.x
Mezei, P., Jakuš, R., Pennerstorfer, J., Havašová, M., Škvarenina, J., Ferenčík, J., et al. (2017). Storms, temperature maxima and the Eurasian spruce bark beetle Ips typographus—An infernal trio in Norway spruce forests of the Central European High Tatra Mountains. Agricul. For. Meteorol. 242, 85–95. doi: 10.1016/j.agrformet.2017.04.004
Mezei, P., Potterf, M., Škvarenina, J., Rasmussen, J. G., and Jakuš, R. (2019). Potential solar radiation as a driver for bark beetle infestation on a landscape scale. Forests 10:604. doi: 10.3390/f10070604
Mind’áš, J., and Škvarenina, J. (1995). Chemical composition of fog cloud and rain snow water in Biosphere Reserve Polana. Ekológia Bratislava 14, 125–137.
Mioduszewski, S., and Rzonca, M. (2015). Variability of morphological features, bud burst and flowering of Norway spruce (Picea abies [L.] Karst.) in the seed orchard of the Bielsk Forest District. For. Res. Papers 76, 388–400. doi: 10.1515/frp-2015-0038
Nordli, Ø, Wielgolasi, F. E., Bakken, A. K., Hjeltnes, S. H., Mage, F., Sivle, A., et al. (2008). Regional trends for bud burst and flowering of woody plants in Norway as related to climate change. Int. J. Biometeorol. 52, 625–639. doi: 10.1007/s00484-008-0156-5
Partanen, J., Koski, V., and Hänninen, H. (1998). Effects of photoperiod and temperature on the timing of bud burst in Norway spruce (Picea abies). Tree Physiol. 18, 811–816. doi: 10.1093/treephys/18.12.811
Pellerin, M., Delestrade, A., Mathieu, G., Rigault, O., and Yoccoz, N. G. (2012). Spring tree phenology in the Alps: effects of air temperature, altitude and local topography. Eur. J. For. Res. 131, 1957–1965. doi: 10.1007/s10342-012-0646-1
Pierro, E. A., Mosca, E., Gonzáles-Martínez, S. C., Binneli, G., Neale, D. B., Porta, N., et al. (2017). Adaptive variation in natural Alpine populations of Norway spruce (Picea abies [L.] Karst) at regional scale: Landscape features and altitudinal gradient effects. For. Ecol. Manag. 405, 350–359. doi: 10.1016/j.foreco.2017.09.045
Rafferty, N. E., Diez, J. M., and Bertelsen, C. D. (2020). Changing climate drives divergent and nonlinear shifts in flowering phenology across elevations. Curr. Biol. 30, 432–441. doi: 10.1016/j.cub.2019.11.071
Roetzer, T., Wittenzeller, M., Haeckel, H., and Nekovař, J. (2000). Phenology in central Europe – differences and trends of spring phenophases in urban and rural areas. Int. J. Biometeorol. 44, 60–66. doi: 10.1007/s004840000062
Saderi, S., Rathgeber, C. B., Rozenberg, P., and Fournier, M. (2019). Phenology of wood formation in larch (Larix decidua Mill.) trees growing along a 1000-m elevation gradient in the French Southern Alps. Ann. For. Sci. 76, 1–17.
Schieber, B. (2014). Effect of altitude on phenology of selected forest plant species in Slovakia (Western Carpathians). Folia Oecologica 41, 75–81.
Schleip, C., Menzel, A., and Dose, V. (2008). Norway spruce (Picea abies): Bayesian analysis of the relationship between temperature and bud burst. Agricul. For. Meteorol. 148, 631–643. doi: 10.1016/j.agrformet.2007.11.008
Schwartz, M. D. (1999). Advancing to full bloom: planning phenological research for the 21st century. Int. J. Biometeorol. 42, 113–118. doi: 10.1007/s004840050093
Škvarenina, J., Križová, E., and Tomlain, J. (2004). Impact of the climate change on the water balance of altitudinal vegetation stages in Slovakia. Ekológia Bratislava 23, 13–29.
Škvareninová, J. (2009). The dynamics of vegetative phenophases observed at the autochton population of Norway spruce (Picea abies [L.] Karst.) in Slovakia. Central Eur. For. J. 55, 13–27.
Škvareninová, J. (2013). The Impact of Climate Change on the Phenological Responses of Ecosystems. Scientific Monograph. Zvolen: Technical University, 132.
Škvareninová, J., and Snopková, Z. (2010). The temporal variability of phenological stages of Norway spruce (Picea abies (L.) Karst.) in Slovakia. Folia Oecologica 37, 212–221.
Střelcová, K., Kurjak, D., Leštianska, A., Kovalčíková, D., Ditmarová, L’, Škvarenina, J., et al. (2013). Differences in transpiration of Norway spruce drought stressed trees and trees well supplied with water. Biologia 68, 1118–1122. doi: 10.1016/j.envres.2021.111798
Studer, S., Appenzeller, C., and Defila, C. (2005). Inter-annual variability and decadal trends in alpine spring phenology: a multivariate analysis approach. Clim. Chang. 73, 395–414. doi: 10.1007/s10584-005-6886-z
Šustek, Z., Vido, J., Škvareninová, J., Škvarenina, J., and Šurda, P. (2017). Drought impact on ground beetle assemblages (Coleoptera. J. Hydrol. Hydromech. 65, 333–342. doi: 10.1515/johh-2017-0048
Suvanto, S., Nöjd, P., Henttonen, H. M., Beuker, E., and Mäkinen, H. (2016). Geographical patterns in the radial growth response of Norway spruce provenances to climatic variation. Agricul. For. Meteorol. 222, 10–20. doi: 10.1016/j.agrformet.2016.03.003
Vitasse, Y., Bottero, A., Cailleret, M., Bigler, C., Fonti, P., Gessler, A., et al. (2019). Contrasting resistance and resilience to extreme drought and late spring frost in five major European tree species. Glob. Chang. Biol. 25, 3781–3792. doi: 10.1111/gcb.14803
Vitasse, Y., Signarbieux, C., and Fu, Y. H. (2018). Global warming leads to more uniform spring phenology across elevations. Proc. Natl. Acad. Sci. U S A. 115, 1004–1008. doi: 10.1073/pnas.1717342115
Walther, G. R., Post, E., Convey, P., Menzel, A., Parmesan, C., Beebee, T. J. C., et al. (2002). Ecological responses to recent climate change. Nature 416, 389–395.
Wenden, B., Mariadassou, M., Chmielewski, F. M., and Vitasse, Y. (2020). Shifts in the temperature-sensitive periods for spring phenology in European beech and pedunculate oak clones across latitudes and over recent decades. Glob. Chang. Biol. 26, 1808–1819. doi: 10.1111/gcb.14918
World Meteorological Organization [WMO] (2017). WMO Guidelines on the Calculation of Climate Normals. WMO-No. 1203, ISBN 978-92-63-11203-3. Geneva: Publications Board World Meteorological Organization, 18.
Keywords: climate change, phenology, Norway spruce [Picea abies (L.) Karst.], protected areas, Slovakia
Citation: Škvareninová J and Mrekaj I (2022) Impact of Climate Change on Norway Spruce Flowering in the Southern Part of the Western Carpathians. Front. Ecol. Evol. 10:865471. doi: 10.3389/fevo.2022.865471
Received: 29 January 2022; Accepted: 20 April 2022;
Published: 04 May 2022.
Edited by:
Yeqiao Wang, University of Rhode Island, United StatesReviewed by:
Ettore D’Andrea, Institute for Agricultural and Forestry Systems in the Mediterranean (CNR), ItalyCopyright © 2022 Škvareninová and Mrekaj. This is an open-access article distributed under the terms of the Creative Commons Attribution License (CC BY). The use, distribution or reproduction in other forums is permitted, provided the original author(s) and the copyright owner(s) are credited and that the original publication in this journal is cited, in accordance with accepted academic practice. No use, distribution or reproduction is permitted which does not comply with these terms.
*Correspondence: Ivan Mrekaj, aXZhbi5tcmVrYWpAc2htdS5zaw==
Disclaimer: All claims expressed in this article are solely those of the authors and do not necessarily represent those of their affiliated organizations, or those of the publisher, the editors and the reviewers. Any product that may be evaluated in this article or claim that may be made by its manufacturer is not guaranteed or endorsed by the publisher.
Research integrity at Frontiers
Learn more about the work of our research integrity team to safeguard the quality of each article we publish.