 Hanxiao Xu
 Xinxiang Tan2
94% of researchers rate our articles as excellent or good
Learn more about the work of our research integrity team to safeguard the quality of each article we publish.
Find out more
ORIGINAL RESEARCH article
Front. Ecol. Evol., 25 April 2022
Sec. Models in Ecology and Evolution
Volume 10 - 2022 | https://doi.org/10.3389/fevo.2022.858822
Identifying the effect of agricultural non-point source pollutants on water quality is very important for water pollution management. This study used NH3N as an indicator to empirically study the influence of fertilizer application on river water quality based on panel data of 46 prefecture-level cities and 18 state-controlled water quality monitoring points through which the main streams of Yangtze River and Yellow River flow from 2004 to 2019. It is found that: (1) An increase in agricultural fertilizer application amount will exacerbate water pollution, and the worsening water quality in the upper watershed and the influence of precipitation will lead to transboundary water pollution in the lower watershed. (2) The amount of fertilizer application and fertilizer application intensity had a threshold effect on river water quality pollution. When the former exceeded the threshold value of 11.496 tons, and the latter exceeded the threshold value of 7.991 ton/km2, the positive effect of fertilizer application on pollutants in rivers was further enhanced. (3) The amount of fertilizer applied had a long-term effect on water quality through a lagged effect, and as the number of lags increased, the accumulative effect of the negative influence gradually rose. Based on the findings of the empirical study, it is proposed that the inter-basin and inter-regional synergy should be formed in the prevention and control of agricultural non-point source pollution, and the overall top-level design of agricultural subsidies and agricultural environmental policies in the areas along the basin should be considered.
Constant improvement of the ambient water quality, water ecosystem quality, and stability constitutes an important part of efforts to promote green development and high-quality development. After the promulgation of the “11th Five-Year Plan”, the reduction of the total discharge of two water pollutants, ammonia nitrogen and chemical oxygen demand (COD), has been listed as a target of China's national economy and social development planning. The implementation of the package plan for the treatment of industrial pollution and urban household pollution has also, to some extent, curb the discharge of industrial and urban pollutants. Nevertheless, the ambient water quality in China has not yet been radically improved. The “Report on China's Eco-environmental Status in 2020” pointed out that some rivers in China were still seriously polluted; around 16.6% of the fault surface water was suffering from different degrees of pollution; 0.7% was judged as Type-V Poor-Quality Water;and part of fault surfaces was found with heavy metal pollution. The serious ambient water pollution is not only attributed to a high occurrence of malignant diseases among nationals and a reduction of social welfares but also has a negative impact on the sustainable development of the national economy (Hasan et al., 2019). Meanwhile, evidence has been popping up to suggest that non-point pollution is the main contributor to eutrophication, massive reproduction of algae, and other issues of water quality (Boesch et al., 2001; Rabotyagov et al., 2010).
Nevertheless, flaws can still be found in China's current agricultural ambient monitoring network, such as the lack of information about agricultural pollution sources, the inflow of agricultural pollutants into rivers. The impact of agricultural non-point pollution on the ambient water quality remains unclear. In response to the challenges brought about by the constant worsening of the ambient water quality, the correlation between agricultural fertilizer applications and water quality should be scientifically assessed to identify the influence of agricultural non-point pollutants on the ambient water quality. All these efforts are of vital theoretical significance for directing water pollution governance, and the systematic and accurate design of a water pollution governance policy framework for the local government.
Since the 1980s, the problem of water environment degradation has become increasingly prominent in various countries, which has attracted widespread attention from scholars at home and abroad (Gogoi et al., 2018). A large number of previous studies have focused on the impact of point source pollution discharges on water quality (Yao et al., 2015). Point source pollution mainly includes municipal sewage discharges (from urban or highly residential areas) and industrial wastewater loads (from a variety of manufacturers). Taking China as an example, pollution from industrial production accounts for more than 35% of the total pollutant discharge in China's rivers. Concentrated and highly toxic industrial pollutants overwhelm the self-purification capacity of rivers and exacerbate the deterioration of water quality (Zhang and Jørgensen, 2005).
With intensive agricultural development, excessive utilization of commercial inorganic fertilizers to boost crop yields has become a major issue and has resulted in increased nutrient additions. The subsequent loss of nutrients to stream waters and estuaries has caused the eutrophication of many coastal and freshwater ecosystems around the world (Darradi et al., 2012). Wu and Chen (2013) found non-point source pollution contributed substantially to min-N, org-N, and org-P. Some scholars point out that the absorption rate of chemical fertilizers by the plant is relatively low, generally about 30 to 40%. The fertilizer that has not been absorbed flows to the surrounding water bodies through precipitation (e.g., rainfall, snowfall) and underground infiltration, which has an impact on the water quality of rivers and lakes (Paudel and Crago, 2021).
A review of previous research findings suggests that although the factors that can influence drainage basin water quality and agricultural non-point pollution have been much investigated, there is still room for improvement: (1) The water pollution models in previous findings have been excessively simplified or simply considered the discharge of point pollution (industrial pollution discharge and urban pollution discharge). Research findings of non-point pollution are lacking. Consequently, objective settings for water quality and major factors influencing the policy design of water quality governance are usually ignored. (2) Though some scholars have observed the impact of non-point pollution on water quality, they have mostly resorted to pre-simulated models or structural tools, such as soil and water assessment tools, to simulate the complex correlation between agricultural land use and water quality. However, the complexity of simulated relations among variables might impede the analysis of the potential mechanism behind analysis results. (3) Different from point pollution discharge, the generation of non-point pollution and the randomness of cross-regional transport have made it impossible for non-point pollution to be measured by the conventional measurement tools used for the single point pollution discharge. A majority of current research findings tend to regard the water quality of the drainage basin as static and isolated. The dynamic and cross-regional flow characteristics of water pollution are not considered. This can lead to potential biases of estimated results.
This article intends to take the negative externalities of agricultural non-point source pollution as the starting point of the study, taking the Yangtze River and Yellow River basins in China as the main study area, and using the panel data for 46 prefecture-level cities and 18 state-controlled water quality monitoring points through which the Yangtze River and Yellow River main streams flow to conduct a quantitative analysis. The reasons for choosing the Yangtze River and Yellow River basins in China as examples for this study are: the Yangtze River and Yellow River are the first and second largest rivers in China, and they are the areas with active agricultural production that have received much attention in recent years for river pollution. Therefore, the Yangtze and Yellow River basins in China are typical for the study area. Since the water quality data of the Yangtze and Yellow River basins are relatively complete, this article tries to deduce the possible sources of water pollution through the relatively abundant data on pollutant concentrations in the Yangtze and Yellow River basins, which can provide support for analyzing the impact of agricultural non-point source pollution on water environment quality. Compared with previous literature, the probable contributions of this article are:
(1) Using the agricultural non-point source pollution as the object of this study, and NH3N as an indicator for the impact of agricultural non-point source pollution, in both the direction and degree, on river water quality. On this basis, the long-term effect and threshold effect of agricultural non-point source pollution on water quality are examined in greater detail, thus refining its interpretation, and expanding research horizon in the field of river water quality pollution.
(2) Constructing a conceptual analysis model of non-point source pollution of river water quality to model the relationship between fertilizer application and the condition of agricultural pollutants in rivers in a relatively straightforward way, contributing to the research on identifying the long-term relationship between agriculture and water quality.
(3) Using the SPARROW (SPAtially Referenced Regressions On Watershed attributes) model and reduced form and structural estimation methods, the transboundary effects of water quality pollution are explored, which can correct the potential bias that may have been caused by ignoring substantial spatial spillover in previous literature.
Non-point source pollution occurs when rainfall, snowmelt water, or irrigation water runs over land, carrying and depositing pollutants into rivers, lakes, and coastal waters. Non-point source pollution from agriculture is regarded as the major cause of surface water quality degradation and has attracted growing public concern (Ongley et al., 2010). Compared with point pollution, non-point pollution has a random influence on the river water quality. Besides, the formation and transport of pollutants are driven by various weather factors, such as precipitation. Since the measurement of the runoff water quality in non-point pollution of the drainage basin is too complex, this study refers to the theoretical framework proposed by Shortle et al. (2012) to build the conceptual model for drainage basin water quality non-point pollution. This model is used to simulate the generation of the i non-point pollution runoff in the basin w.
where the runoff r is defined as the number of pollutants moving on a specifically defined region (such as nutrients or other chemical materials or sediments); f represents the agricultural production input (such as the fertilizer and pesticide input); c denotes the input for pollution control; q indicates the geological feature (such as the soil type and landform); v is the random environmental variable (such as precipitation and temperature) affecting the runoff.
The water quality of the drainage basin pollution can reflect not only the regional pollution level, but also depends on the cumulative impact of all polluting activities of areas where the basin flows by Cai et al. (2016). The function relation of the ambient pollution load, a, of the drainage basin,w, is defined as below:
where r stands for the non-point pollution runoff from l to n in the drainage basin w; e represents the point pollution discharge from l to n in the drainage basin w; aw−1 denotes the pre-stage water quality status of the drainage basin w; ζ represents the random natural factor affecting the water quality (including infrequent natural events such as volcanoes, forest fire disasters and sandstorms); ψ represents a geographical feature of the drainage basin w, such as the transport parameter; ϕ denotes the feature of the water body (such as the physical, chemical and biological attribute); δ represents random environmental variables (such as the temperature, wind velocity, and solar radiation).
The above model assumes ∂aw/∂rnw ≥ 0∀n, w, ∂aw/∂ekw ≥ 0∀k, w, ∂aw/∂aw−1 ≥ 0. The correlation aw(·) describes the migration and transport of pollutants from a single source to the drainage basin. The partial derivative for the ambient pollution load to the non-point pollutants can be written as below:
Based on the above theoretical analysis, this study builds the following regression model to identify the impact of agricultural fertilizer application on water quality.
where LnNH3Nit is the NH3N concentration of the sub-basin i in year t; LnFertit denotes the fertilizer application amount of the sub-basin i in year t; represents the control variable, including the annual temperature, annual precipitation level, industrial and animal husbandry pollution; μi indicates the regional fixed effect, which is used to control the impact of factors that are not observed and are not changing with time; δt is the time fixed effect, which is used to control the impact of factors that are not observed and are not changing with regional changes; εit denotes the random error, including other factors deciding the water quality.
Considering the water quality difference between the upstream and downstream basins, the spatial spillover effect of the upstream pollutants flowing toward the downstream pollutants, and flowing through multiple regions can be examined. In this study, the upstream NH3N concentration, upstream precipitation, and the interaction between the two are introduced to Equation 4 to quantify the influence of the upstream pollutants after precipitation on the downstream water quality. Besides, since the historical pollution level of the sub-basin might affect the current sub-basin water quality, this study introduces the lagged variable of water quality to Equation 4 to explore the influence of the previous pollution level on the water quality.
where UpNH3Nit denotes the NH3N concentration of the sub-basin i in year t; UpPrecit represents the upstream precipitation of the sub-basin i in year t;UpNH3Nit × UpPrecit is the interaction between the upstream NH3N concentration and the upstream precipitation. Other variable settings are consistent with those of Equation 4.
In light of the potential nonlinear changes of the influence of the fertilizer application amount and water quality, this study makes use of the panel threshold regression model developed by Hansen (1999) to further examine whether the “threshold effect” exists in the influence of fertilizer application on water quality, or whether the marginal constraint of fertilizer application on river water quality changes significantly along with the increase of the fertilizer application amount. Combining the measurement model adopted in this study, the following panel threshold regression model is constructed:
where LnFertit is the fertilizer application amount of the sub-basin i in year t; γ is the threshold value; I(•) is an indicator function, which takes the value of 1 when the expression in parentheses is true and 0, otherwise. Settings of other variables are consistent with those of Equation 4.
The threshold model verification consists of the threshold effect significance test. The “bootstrap” method is used to construct a progressive distribution and the likelihood ratio statistic likelihood ratio (LR) (Hansen, 1999). It is expected that the threshold effects are supposed to be tested first, and the number of thresholds and the corresponding threshold values can then be determined. LnFert and LnFert − intensity are set as the threshold variables. The research of Hansen (1999) pointed out that the model should be verified based on different hypotheses: (1) the model has no threshold; (2) the model has a single threshold; (3) the model has double thresholds; and (4) the model has triple thresholds.The “bootstrap” method was used to derive the F-statistic and the P-value, and the BS frequency was set as 300.
Water quality (LnNH3N). This study adopts NH3N concentration rather than other water quality indexes as an index for recognizing agricultural non-point pollution. The main reason for this is that the planting industry dominates the agricultural development of provinces and cities along the Yangtze River and Yellow River. The main pollutants generated by fertilizer nutrient loss are NH3N, as reported by the Ministry of Environmental Protection, and the discharges of PH and COD are negligible. For example, the First National Pollution Source General Survey Report released by the Ministry of Environmental Protection, National Bureau of Statistics, and Ministry of Agriculture in 2010 showed that 96% of the agriculture-caused COD discharge was contributed by the livestock breeding industry. The remaining COD discharge contributed by the aquaculture and planting industry can be ignored. Therefore, this study chooses the average annual NH3N concentration obtained by the water quality monitoring site located at the key fracture surfaces of the Yangtze River and Yellow River basins as the dependent variable.
Fertilizer application (LnFert). Extensive application of fertilizer elements has been acknowledged as one main driving force of agricultural economic growth in China. However, unreasonable application of fertilizers can result in compacted soil and heavy metal accumulation. The excess nutrients, including nitrogen and phosphorus, can enter the water body through soil denudation, direct surface runoff, and leaching loss. This can aggravate the eutrophication of surface water bodies, causing nitrate pollution of underground water, and seriously threaten the health of the water body. In accordance with Atafar's study (Atafar et al., 2010), this study adopts the logarithm of the arithmetic mean value of the fertilizer application amount (ton) of cities which various subsidiary basins flow by as the core independent variable.
(1) Precipitation (LnPrec). Atmospheric precipitation is the main source of surface water resources. It can not only decide the recharge, discharge, and runoff within the basin but also influence the water flow and quality of the river (Hatfield and Prueger, 2004). For example, heavy precipitation can scour the nutritive salt, pollutants, and even poisonous agricultural pesticide from the land into the water to change the water salinity and exacerbate pollution. Consequently, the aquatic environment might be made unsuitable for the survival, migration, and reproduction of biological organisms. The occurrence of extreme weather might even lead to the death of biological creatures (Matthews and Marsh-Matthews, 2003). The precipitation (cm) of the cities through which each sub-basin flows is selected as a control variable in this study.
(2) Temperature (LnTemp). Temperature changes can influence the dissolved oxygen (DO) level in the water (Morrill et al., 2005). At the same time, excessive global warming can also significantly speed up the release of sediments. Therefore, this study chooses the temperature (°C) of cities through which various subsidiary basins flow to control the basin temperature conditions.
(3) Industrial wastewater discharge (LnIndu). As the main pollution source of runoff water, industrial wastewater is characterized by a large amount, extensive coverage, complexity of components, high toxicity, and difficulty of purification and handling (Scavia et al., 2014). It is indicated by the arithmetic mean value of the industrial wastewater discharge (ton) of cities through which various subsidiary basins flow.
(4) Residents' domestic wastewater discharge (Lndome). Urban wastewater discharge is believed to be the main source of emerging pollutants. Residents' domestic wastewater discharge can influence the COD and NH3+ content in the basin water quality (Ternes et al., 2004). Due to restrictions of data acquisition, it is relatively hard to obtain statistics of residents' wastewater discharge. At the same time, the generation of urban domestic wastewater has a close bearing on residents' domestic water consumption (Cheng et al., 2021). Therefore, this study refers to the processing approach proposed by Ajiboye et al. (2021). The arithmetic mean value logarithm of residents' domestic water consumption (ton) is adopted as the surrogate marker of residents' domestic wastewater discharge.
This study adopted data from 46 prefecture-level cities and 18 national control water quality monitoring sites at the prefecture-level water quality monitoring sites from 2004 to 2019. Among them, the water quality data were obtained from the publicly accessible reports, including the Weekly Report on Automatic Water Quality Monitoring at Key Cross Sections of Major National River Basins (http://www.cnemc.cn/sssj/szzdjczb/) as well as various monitoring reports, such as the China Ecological Environment Status Bulletin (https://www.mee.gov.cn/hjzl/sthjzk/zghjzkgb/) and China Environmental Statistics Annual Report (http://www.cnemc.cn/jcbg/zghjtjnb/) issued in previous years.Data on variables, including the fertilizer application amount, temperature, precipitation, industrial pollution discharge, and mean output of different cities were from government materials that are open to the public, such as China Urban Statistical Yearbook and statistical yearbooks at the provincial and municipal level.
In addition, considering different lengths of the direct surface runoff of the basins flowing by different cities, this study adopted the percentage of the river length flowing by the city in the total basin length for a weighted averaging of core explaining variables and control variables. Meanwhile, the difference in the sewage treatment capacity of different cities was taken into account. Thereby, the concentrated nontreatment rate of the sewage treatment plant was used to process indexes, including the industrial wastewater discharge and residents' domestic water consumption. This was for the purpose of eliminating bias in results caused by differences in sewage treatment capacity of different cities. Missing data were supplemented by an interpolation method. Descriptive statistics of all variables needed in this study are shown in Table 1.
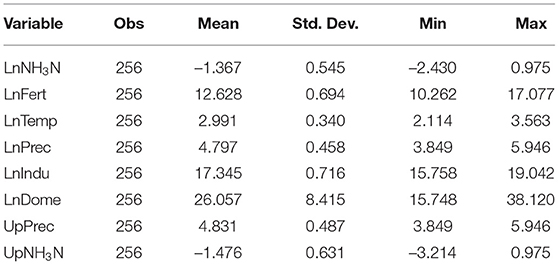
Table 1. Descriptive analysis results.
Table 2 presents the regression results of the influence of the agricultural fertilizer application amounts on water quality. Column (1) and Column (2) conduct a simple regression of water quality based on the agricultural fertilizer application amount. Column (3) and Column (4) increase variables, such as precipitation, temperature, industrial waste discharge and pollution of the breeding industry, to control the influence of climate factors, industrial pollution sources, and breeding industrial pollution sources on water quality. Results of different models suggest that the regression coefficient of the agricultural fertilizer application amounts is significantly positive, which means that an increase of the agricultural fertilizer application amounts can lead to a rise in the river's NH3N concentration, which can further exacerbate water pollution. Excess nitrogen can first be buffered by the soil, and then enter the water bodies through the direct surface runoff or rainwater leaching. Basin water pollution is, thus, ultimately caused by fertilizer application, notably the excess application of nitrogen fertilizer (Ruffatti et al., 2019; Zhang et al., 2021). If no control variables are introduced, the fertilizer application amount coefficient will reach the maximum. This probably resulted from an overestimation by the model of the influence of agricultural fertilizers on water quality (Phiri et al., 2005; Wang and Yang, 2016). As known to all, industrial wastewater and domestic wastewater are also accountable for water pollution, which is consistent with the public intuition.
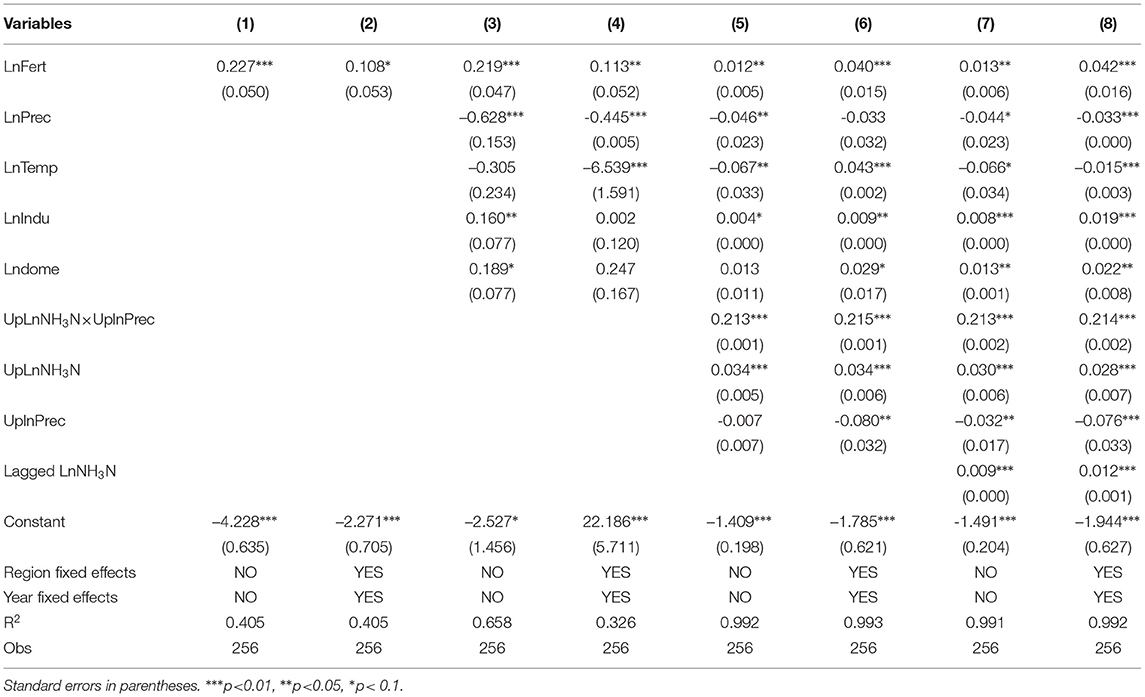
Table 2. Estimation results of the impact of different pollution sources on water quality.
Besides, in order to further study the spatial overflow effect of upstream pollutants, Column (5) and Column (6) introduces the interaction between the upstream precipitation and the upstream water quality. Column (6) shows that the interaction coefficient between the upstream precipitation and the upstream water quality is significantly positive. This means that the runoff pollution of the upstream basin is transferred to the downstream basin as a result of precipitation. This can also explain its significant spatial spillover effect on the water quality of the downstream basin. In other words, the upstream basin water pollution and the downstream basin water pollution are significantly and positively correlated. Column (7) and Column (8) introduce Lagged LnNH3N 1. One can observe that the Lagged LnNH3N coefficient is significantly positive. This means that the increase of the pre-stage pollutant concentration in the previous stage can bring about a pronounced rise in the current river pollutant concentration. In other words, a river's historical water pollution can influence its current water pollution level. The possible reason is that although the river has a self-purifying effect, some pollutants will still be retained in the water body and have an impact on the current water quality (Burton et al., 2003).
To alleviate the impact of estimation error caused by index selection, this study changed the core variables in a robustness test of the baseline regression to verify the accuracy and reliability of research findings. The total fertilizer application amount (ton) cannot reflect the intensity of fertilization applied to arable land on a per unit area basis to improve the productivity (output) and farmers' income in a specific year. In view of this, the study chose fertilizer application intensity (ton/km2) as the explanatory variable for further discussions about the influence of fertilizer application on water quality 2. Regression results in Table 3 show that estimation results were consistent with the baseline regression results stated above, concerning the core variables, including the interaction between the fertilizer application intensity and the upstream water quality, between the upstream precipitation and the upstream water quality. This provided solid evidence for the robustness of baseline regression results in this study.
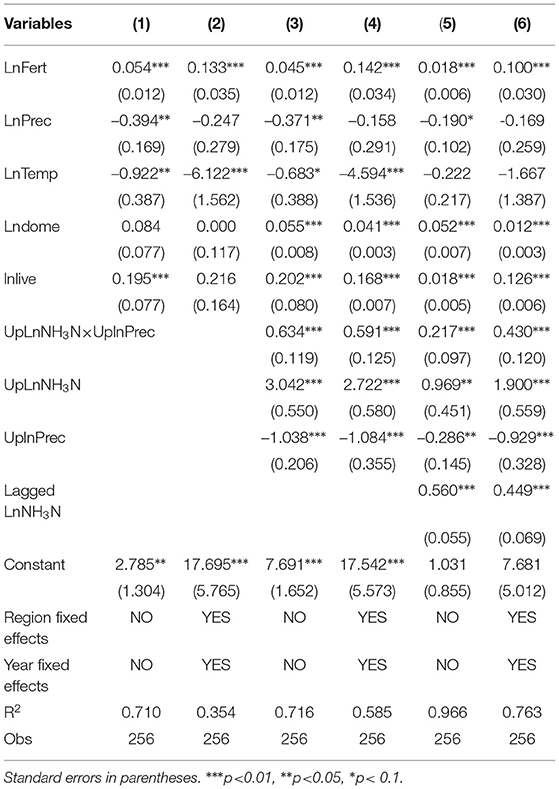
Table 3. Robustness test.
Table 4 lists the verification results of the single threshold hypothesis, the dual threshold hypothesis, and the triple threshold hypothesis. As one observes in Table 4, verification results with LnFert and LnFert − intensity as core variables deny the hypothesis about the model having two or more than two threshold values. Based on the P-value, it can be judged that the hypothesis of dual thresholds and triple thresholds is rejected at the confidence level of 10%. The single threshold value of LnFert and LnFert − intensity is 11.496 ton and 7.991 ton/km2, respectively, which are both significant at the confidence level of 1% or 5%. This means that the single threshold model alone can realize favorable fitting of Equation 6. Thus, the single threshold model is adopted for the estimation of Equation 6.
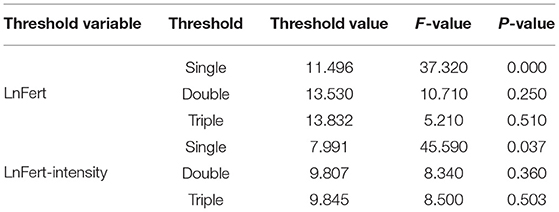
Table 4. Test of the threshold effect.
In order to further display the verification results, Figures 1, 2 show the likelihood ratio statistics estimated by different threshold values. This allows the author to more directly verify the significance of the threshold value. Figures 1, 2 show the threshold value estimation results of the fertilizer application amount and the fertilizer application intensity. From left to right, verification results of the first threshold value, second threshold value, and third threshold value are shown. The dotted line identifies the confidence section at the threshold of 95% in the LR verification. The combination of Figures 1, 2 allows one to observe that the performance of the single threshold model is the best, whose fertilizer application amount and intensity have a significant impact on the single threshold effect of the river water quality.
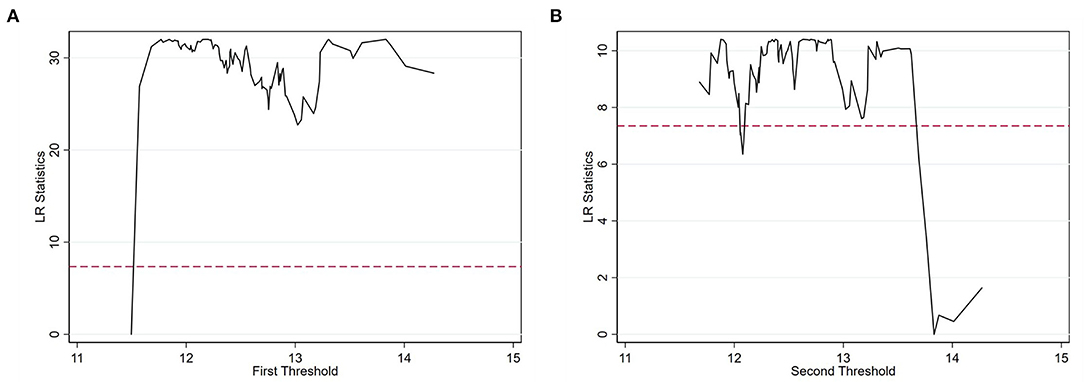
Figure 1. LR Diagram with the threshold variable LnFert.
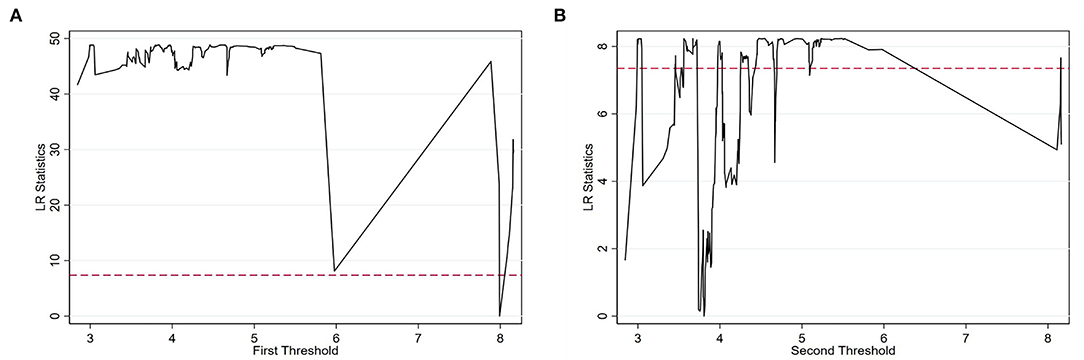
Figure 2. LR Diagram with the threshold variable LnFert − intensity.
Columns (1) and (2) of Table 5 display regression results of the panel threshold model concerning the fertilizer application amount and the fertilizer application intensity. As one notices in Table 5, when the fertilizer application amount is small (LnFert ≤ 11.496 ton), its estimation coefficient is 0.216, which can pass the significance test at the confidence level of 1%. This suggests that the increase of the fertilizer application amount by one percent can lead to an increase of the pollutant concentration in the river by 0.216%. Moreover, this effect can be intensified with an increase in the fertilizer application amount. When the fertilizer application amount exceeds 11.496 tons, the positive effect will be intensified to around 0.367%, which is significant with a confidence level of 1%. In terms of the fertilizer application intensity, when it is relatively low (LnFert − intensity ≤ 7.991 ton/km2), the estimation coefficient is 0.233. When the fertilizer application intensity exceeds the threshold value, its estimation coefficient can be increased to 0.416.
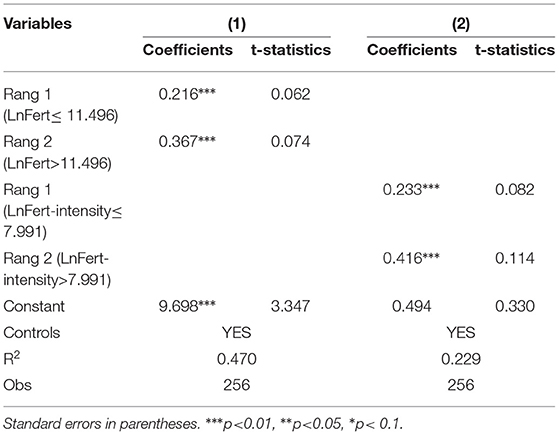
Table 5. Threshold regression results.
The aforesaid results mean that fertilizer application within the investigation period has a threshold effect on the river water quality. In other words, fertilizer application has a positive impact on river pollutants. As the fertilizer application amount or intensity keeps on increasing, the amount of river pollutants increases. This further proves the robustness of the estimation results. As to the reason behind the phenomenon, when the fertilizer application amount is small, nutrients in fertilizers are mostly absorbed by crops, which is why fewer pollutants enter the water (Van der Molen et al., 1998). However, as the fertilizer application amount increases, excessive fertilizer application will lead to a growing surplus of farmland soil nutrients (Stackpoole et al., 2019). For example, the surplus nutrients of crops with a high nitrogen application amount remain in the soil (Easton and Petrovic, 2004). Finally, these residual nutrients can enter rivers and other waters along with the heavy rainfall to pollute waters like rivers.
Based on the baseline regression model stated above, this section introduces the fertilizer application amount with the highest number of lag phases, 7, to better understand and assess the influence of fertilizer application on water quality. Before estimation, all model hypotheses should be verified. Referring to the approach promoted by Blundell and Bond (1998), the first-order and second-order sequence correlation tests, i.e., AR (1) and AR (2), are conducted on the random error, respectively, and the overidentifying test (Sargan test) on the instrumental variable under different model settings. As shown in Table 6, all results pass the sequence correlation verification, i.e., the residual error after difference is found with the second-order sequence correlation. The Sargan test results suggest that the externality of the instrumental variable should not be denied. Additionally, the current pollutant concentration is subject to the influence of the basin's historical pollutant concentration. Therefore, the correlation of pollutant concentration at different periods of time is first verified, and the NH3N concentration variable of lag phase 1 is included in the regression model.

Table 6. Long-term effects of fertilizer application on water quality.
Table 6 lists regression results without the lagged variable, and with lagged phases ranging from 1 to 5. When the fertilizer application amount is introduced as a lagged variable, the positive influence of fertilizer application on the NH3N concentration of the river remains significant, as shown in Table 6. But when the lagged variable is not introduced, an increase of the unit fertilizer application amount can increase the NH3N concentration of the river by 0.257 units. When the fertilizer application amount with the lag phase 1 is introduced, the positive accumulative effect weakened. After more lagged variables are introduced, the positive accumulative effect of fertilizer application on the NH3N concentration is strengthened. Specifically, a unit increase of the fertilizer application amount can increase the NH3N concentration by 0.129 to 0.196 units. This means that the fertilizer application amount will not only influence the current water quality but also exerts a long-term impact on water quality through a lagged effect. This is probably because it takes time for nitrogen in the fertilizer to flow into the water. The current fertilizer applications are more likely to influence later water quality observations (Bu et al., 2011; Metson et al., 2020).
In order to further examine the long-term impact of the fertilizer application amount on water quality, this study introduces the fertilizer application amount with 7 lagged phases. Figure 3 shows that, if the lagged phase is extended to 7, the estimation coefficient is still positive. Additionally, as the number of lag phases increases in the regression equation, the accumulative effect of the fertilizer application amount gradually increases. The above research findings once again provide solid evidence for the robustness of the benchmark regression results above.
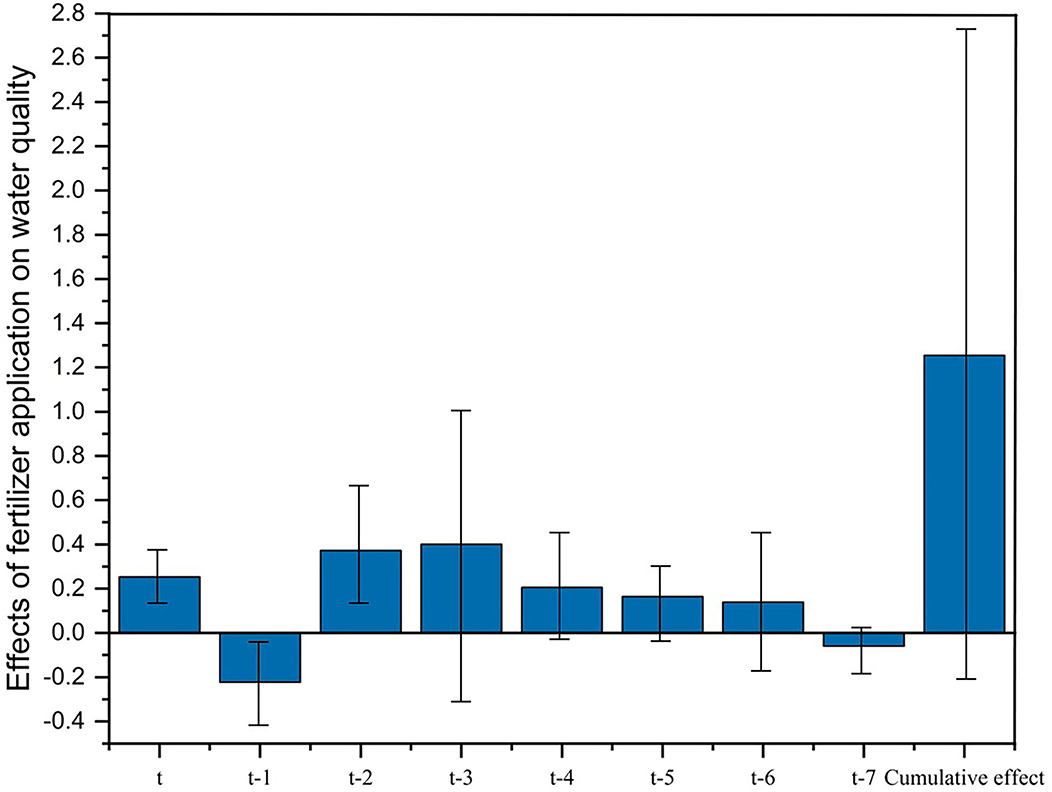
Figure 3. Long-term effects of fertilizer application on water quality with 7 lagged phases.
This study carried out an empirical study on the effect of agricultural fertilizer application amount on river water quality based on panel data for 46 prefecture-level cities and 18 state-controlled water quality monitoring points through which the main streams of Yangtze River and Yellow River flow from 2004 to 2019, using NH3N as an indicator. The findings of the study are as follows:
(1) The amount of agricultural fertilizer application is positively correlated with the concentration of NH3N, i.e., the amount of agricultural fertilizer applied will deteriorate water quality. This conclusion is further confirmed by a robustness test.
(2) Water quality pollution in the upper watershed and water quality pollution in the lower watershed show a significant positive correlation, i.e., with precipitation, water quality pollution in the upper watershed will lead to transboundary pollution of the water quality in the lower watershed.
(3) The effect of agricultural fertilizer application on river water quality pollutants shows an obvious positive increasing marginal effect which is non-linear, i.e., the positive impact of fertilizer application on river pollutants increases as the fertilizer application amount or fertilizer application intensity increases. When the fertilizer application amount exceeds the threshold value of 11.496 tons, and the fertilizer application intensity exceeds the threshold value of 7.991 ton/km2, the positive effect of fertilizer application on river pollutants is greater than when values are below the threshold.
(4) Fertilizer application amount affects water quality not only currently, but also in the long-term through a lagged effect, and as the number of lagged periods in the regression equation increases, the accumulative effect of the negative effect of fertilizer application amount tends to rise gradually.
In light of the above research conclusions, this study provides the following policy suggestions for China's current and future ambient water protection:
(1) Strongly promoting zero-fertilizer-growth actions and properly reducing fertilizer application amounts. This research suggests that increasing fertilizer application amounts and intensity both contribute to worsening water pollution. Therefore, more reasonable fertilization technologies should be adopted. Environmentally-friendly organic fertilizers should be preferred. Meanwhile, formula fertilization by soil testing3 can be leveraged to improve the fertilizer allocation efficiency, increase soil fertility and realize the sustainable development of agriculture.
(2) Enhancing technical guidance for agricultural households' fertilizing behaviors. In China, agricultural households are major microcosmic subjects of agricultural production, since they are long-standing, small in the operation scale, yet large in number. This necessitates a full understanding of the role of agricultural technology promotion and agricultural social services. Technological guidance can contribute to reasonable fertilizer use among agricultural households. Additionally, fertilizer applications before or during large precipitation events should be avoided. This can mitigate a reduction in the fertilizer's effectiveness, loss of nutrients, and downstream pollution.
(3) Reinforcing coordinated governance among different basins. This research reveals the spatial spillover effect of upstream water pollution on downstream water quality. Therefore, it is imperative to transform static and isolated environmental governance into dynamic, comprehensive, and coordinated regulation. An overall consideration of a top-level regional design for the basin, including agricultural subsidization and agricultural environmental pollution, can reduce the unexpected environmental consequences caused by agricultural production and competition among local governments.
The original contributions presented in the study are included in the article/supplementary material, further inquiries can be directed to the corresponding authors.
Conception and design were performed by HX and QG. Material preparation, data collection, and analysis were performed by HX, XT, JL, and YC. The first draft of the manuscript was written by HX. All authors commented on previous versions of the manuscript, read, and approved the final manuscript.
This study was supported in part by grants from Qingdao social science planning and research project (QDSKL2101031), the Ministry of Education of Humanities and Social Science project (grant no. 21YJC790149), the key project of plan in research and development of Shandong Research on the protection and utilization of marine fishery germplasm resources in Shandong Province (grant no. 2020RZE29007), and the Fundamental Research Funds for the Central Universities (grant no. 202161043).
XT was employed by State Nuclear Power Demonstration Plant Co., Ltd.
The remaining authors declare that the research was conducted in the absence of any commercial or financial relationships that could be construed as a potential conflict of interest.
All claims expressed in this article are solely those of the authors and do not necessarily represent those of their affiliated organizations, or those of the publisher, the editors and the reviewers. Any product that may be evaluated in this article, or claim that may be made by its manufacturer, is not guaranteed or endorsed by the publisher.
1. ^On the basis of Column (1) (3) (5) (7), Column (2) (4) (6) (8) control the time fixed effect and region fixed effect.
2. ^This study defines the agricultural fertilizer application intensity as the total fertilizer application divided by the total sowing area of crops, namely the fertilizer application amount per sowing area.
3. ^The formula fertilization by soil testing is based on crop fertilizer requirements, soil fertilizer supply and fertilizer application effect to determine the amount of nitrogen, phosphorus, potassium and medium and trace elements to be applied, the fertilizer application period and the application method based on practical application of organic fertilizer.
Ajiboye, T. O., Oyewo, O. A., and Onwudiwe, D. C. (2021). Simultaneous removal of organics and heavy metals from industrial wastewater: a review. Chemosphere 262, 128379. doi: 10.1016/j.chemosphere.2020.128379
Atafar, Z., Mesdaghinia, A., Nouri, J., Homaee, M., Yunesian, M., Ahmadimoghaddam, M., et al. (2010). Effect of fertilizer application on soil heavy metal concentration. Environ. Monit. Assess. 160, 83–89. doi: 10.1007/s10661-008-0659-x
Blundell, R., and Bond, S. (1998). Initial conditions and moment restrictions in dynamic panel data models. J Econom. 87, 115–143. doi: 10.1016/S0304-4076(98)00009-8
Boesch, D. F., Brinsfield, R. B., and Magnien, R. E. (2001). Chesapeake bay eutrophication: Scientific understanding, ecosystem restoration, and challenges for agriculture. J. Environ. Qual. 30, 303–320. doi: 10.2134/jeq2001.302303x
Bu, H., Meng, W., and Zhang, Y. (2011). Nitrogen pollution and source identification in the haicheng river basin in northeast china. Sci. Total Environ. 409, 3394–3402. doi: 10.1016/j.scitotenv.2011.05.030
Burton, L., Howard, A., and Goodall, B. (2003). Construction of a historical water pollution index for the mersey basin. Area 35, 438–448. doi: 10.1111/j.0004-0894.2003.00193.x
Cai, H., Chen, Y., and Gong, Q. (2016). Polluting thy neighbor: Unintended consequences of china's pollution reduction mandates. J. Environ. Econ. Manag. 76, 86–104. doi: 10.1016/j.jeem.2015.01.002
Cheng, F., Dai, Z., Shen, S., Wang, S., and Lu, X. (2021). Characteristics of rural domestic wastewater with source separation. Water Sci. Technol. 83, 233–246. doi: 10.2166/wst.2020.557
Darradi, Y., Saur, E., Laplana, R., Lescot, J.-M., Kuentz, V., and Meyer, B. C. (2012). Optimizing the environmental performance of agricultural activities: a case study in la boulouze watershed. Ecol. Indic. 22, 27–37. doi: 10.1016/j.ecolind.2011.10.011
Easton, Z. M., and Petrovic, A. M. (2004). Fertilizer source effect on ground and surface water quality in drainage from turfgrass. J. Environ. Qual. 33, 645–655. doi: 10.2134/jeq2004.6450
Gogoi, A., Mazumder, P., Tyagi, V. K., Chaminda, G. T., An, A. K., and Kumar, M. (2018). Occurrence and fate of emerging contaminants in water environment: a review. Groundwater Sustain. Dev. 6, 169–180. doi: 10.1016/j.gsd.2017.12.009
Hansen, B. E. (1999). Threshold effects in non-dynamic panels: Estimation, testing, and inference. J. Econom. 93, 345–368. doi: 10.1016/S0304-4076(99)00025-1
Hasan, M. K., Shahriar, A., and Jim, K. U. (2019). Water pollution in bangladesh and its impact on public health. Heliyon 5, e02145. doi: 10.1016/j.heliyon.2019.e02145
Hatfield, J., and Prueger, J. (2004). Impacts of changing precipitation patterns on water quality. J. Soil Water Conservat. 59, 51–58.
Matthews, W. J., and Marsh-Matthews, E. (2003). Effects of drought on fish across axes of space, time and ecological complexity. Freshw. Biol. 48, 1232–1253. doi: 10.1046/j.1365-2427.2003.01087.x
Metson, G. S., Lin, J., Harrison, J. A., and Compton, J. E. (2020). Where have all the nutrients gone? long-term decoupling of inputs and outputs in the willamette river watershed, oregon, united states. J. Geophys. Res. Biogeosci. 125, e2020JG005792. doi: 10.1029/2020JG005792
Morrill, J. C., Bales, R. C., and Conklin, M. H. (2005). Estimating stream temperature from air temperature: implications for future water quality. J. Environ. Eng. 131, 139–146. doi: 10.1061/(ASCE)0733-9372(2005)131:1(139)
Ongley, E. D., Xiaolan, Z., and Tao, Y. (2010). Current status of agricultural and rural non-point source pollution assessment in china. Environ. Pollut. 158, 1159–1168. doi: 10.1016/j.envpol.2009.10.047
Paudel, J., and Crago, C. L. (2021). Environmental externalities from agriculture: evidence from water quality in the united states. Am. J. Agric. Econ. 103, 185–210. doi: 10.1111/ajae.12130
Phiri, O., Mumba, P., Moyo, B., and Kadewa, W. (2005). Assessment of the impact of industrial effluents on water quality of receiving rivers in urban areas of malawi. Int. J. Environ. Sci. Technol. 2, 237–244. doi: 10.1007/BF03325882
Rabotyagov, S., Campbell, T., Jha, M., Gassman, P. W., Arnold, J., Kurkalova, L., et al. (2010). Least-cost control of agricultural nutrient contributions to the gulf of mexico hypoxic zone. Ecol. Appl. 20, 1542–1555. doi: 10.1890/08-0680.1
Ruffatti, M. D., Roth, R. T., Lacey, C. G., and Armstrong, S. D. (2019). Impacts of nitrogen application timing and cover crop inclusion on subsurface drainage water quality. Agric. Water Manag. 211, 81–88. doi: 10.1016/j.agwat.2018.09.016
Scavia, D., Allan, J. D., Arend, K. K., Bartell, S., Beletsky, D., Bosch, N. S., et al. (2014). Assessing and addressing the re-eutrophication of lake erie: central basin hypoxia. J. Great Lakes Res. 40, 226–246. doi: 10.1016/j.jglr.2014.02.004
Shortle, J. S., Ribaudo, M., Horan, R. D., and Blandford, D. (2012). Reforming agricultural nonpoint pollution policy in an increasingly budget-constrained environment. Environ. Sci. Technol. 46, 1316–1325. doi: 10.1021/es2020499
Stackpoole, S. M., Stets, E. G., and Sprague, L. A. (2019). Variable impacts of contemporary versus legacy agricultural phosphorus on us river water quality. Proc. Natl. Acad. Sci. U.S.A. 116, 20562–20567. doi: 10.1073/pnas.1903226116
Ternes, T. A., Herrmann, N., Bonerz, M., Knacker, T., Siegrist, H., and Joss, A. (2004). A rapid method to measure the solid-water distribution coefficient (kd) for pharmaceuticals and musk fragrances in sewage sludge. Water Res. 38, 4075–4084. doi: 10.1016/j.watres.2004.07.015
Van der Molen, D. T., Breeuwsma, A., and Boers, P. C. (1998). Agricultural nutrient losses to surface water in the netherlands: impact, strategies, and perspectives. J. Environ. Qual. 27, 4–11. doi: 10.2134/jeq1998.00472425002700010002x
Wang, Q., and Yang, Z. (2016). Industrial water pollution, water environment treatment, and health risks in china. Environ. Pollut. 218, 358–365. doi: 10.1016/j.envpol.2016.07.011
Wu, Y., and Chen, J. (2013). Investigating the effects of point source and nonpoint source pollution on the water quality of the east river (dongjiang) in south china. Ecol. Indic. 32, 294–304. doi: 10.1016/j.ecolind.2013.04.002
Yao, H., Qian, X., Yin, H., Gao, H., and Wang, Y. (2015). Regional risk assessment for point source pollution based on a water quality model of the taipu river, china. Risk Analysis 35, 265–277. doi: 10.1111/risa.12259
Zhang, J., and Jørgensen, S. E. (2005). Modelling of point and non-point nutrient loadings from a watershed. Environ. Model. Software 20, 561–574. doi: 10.1016/j.envsoft.2004.03.003
Keywords: agricultural non-point pollution, application amount of fertilizers, NH3N concentration, cross-regional pollution, water quality
Citation: Xu H, Tan X, Liang J, Cui Y and Gao Q (2022) Impact of Agricultural Non-Point Source Pollution on River Water Quality: Evidence From China. Front. Ecol. Evol. 10:858822. doi: 10.3389/fevo.2022.858822
Received: 20 January 2022; Accepted: 21 March 2022;
Published: 25 April 2022.
Edited by:
Ruscena P. Wiederholt, Everglades Foundation, United StatesReviewed by:
Rakesh Bhutiani, Gurukul Kangri Vishwavidyalaya, IndiaCopyright © 2022 Xu, Tan, Liang, Cui and Gao. This is an open-access article distributed under the terms of the Creative Commons Attribution License (CC BY). The use, distribution or reproduction in other forums is permitted, provided the original author(s) and the copyright owner(s) are credited and that the original publication in this journal is cited, in accordance with accepted academic practice. No use, distribution or reproduction is permitted which does not comply with these terms.
*Correspondence: Qiang Gao, Z2FvMTIyMTFAMTI2LmNvbQ==
Disclaimer: All claims expressed in this article are solely those of the authors and do not necessarily represent those of their affiliated organizations, or those of the publisher, the editors and the reviewers. Any product that may be evaluated in this article or claim that may be made by its manufacturer is not guaranteed or endorsed by the publisher.
Research integrity at Frontiers
Learn more about the work of our research integrity team to safeguard the quality of each article we publish.