 Jon Hess
 Stan Braude
 Colleen Ingram
 Alan Templeton
- 1Fishery Science Department, Columbia River Inter-Tribal Fish Commission, Portland, OR, United States
- 2Department of Biology, Washington University in St. Louis, St. Louis, MO, United States
- 3Department of Biology, San Francisco State University, San Francisco, CA, United States
We used nested clade phylogeographic analysis (NCPA) of mitochondrial DNA sequence data to examine the processes contributing to population structure in naked mole-rats. We examined sequence variation in the (1097 bp) control region D-loop of the mitochondrial genome in 303 individuals from 174 colonies of naked mole-rats (Heterocephalus glaber) located mainly within an 870 km2 area in Meru National Park, Kenya. Four rivers were found to be correlated to a significant fragmentation inference in the NCPA. The largest pairwise divergence between haplotypes from populations separated by rivers was 2.74%, which was well over half of the divergence reported between the extremes of the distribution from southern Ethiopia to southern Kenya (4.6%). However, the size of the river (measured in current discharge) was not a good predictor of the amount of sequence divergence between populations separated by a river. It appears that a large-scale historical fragmentation event may have conflated fragmentation patterns on a smaller scale, when recent colonization and range expansion brought two old lineages together at a location with a relatively small river separating them.
Introduction
Like other members of the Bathyergidae, naked mole-rats (Heterocephalus glaber) spend most of their lives underground foraging on roots and tubers. Because of their fossorial adaptations, it has been assumed that naked mole-rats are fairly limited in their dispersal ability (Brett, 1991; Steinberg and Patton, 2000). Large group sociality has been hypothesized to contribute to the already limited dispersal because animals were hypothesized to use cooperative breeding and care of siblings to maximize inclusive fitness. New colonies were assumed to result from fissioning of existing colonies and subsequent matings between close relatives were hypothesized to be typical. Combined with the isolation resulting from the limited dispersal of fossorial rodents, this population dynamic was expected to result in an extremely fragmented population genetic structure with high within-colony relatedness (Reeve et al., 1990).
However, dispersal and outbreeding appear to be occurring more frequently. This is based on the discovery of a disperser morph (Oriain et al., 1996), above-ground dispersal (Braude, 2000), nascent colony formation involving unrelated breeders (Braude, 2000), and preference to outbreed in the lab settings when unrelated mates are available (Ciszek, 2000). In light of these findings, we have examined the patterns of distribution of population genetic structure, in order to understand how common these processes may be in wild populations. Processes thought to have an effect on population structure include mate choice, the interaction of dispersal capability with the environment, and historical events such as fragmentation, extinction/recolonization, and range expansion. In this study, we concentrate on the latter two.
Both Darwin and Wallace recognized the role of rivers in dividing populations and isolating them for periods of time sufficient to accumulate morphological differences between the populations they separate (Wallace, 1849; Darwin, 1872). Studies in many taxa, including frogs, birds, rodents, and primates, have elaborated on the river barrier hypothesis (Sick, 1967; Capparella, 1988; Ayres and Cluttonbrock, 1992; Patton et al., 1994; Lougheed et al., 1999; Aleixo, 2004; Nicolas et al., 2011, 2019; Voelker et al., 2013; Kopuchian et al., 2020; Allen et al., 2021; de Fraga and Carvalho, 2021). In general, river size (width, flow-rate, discharge) is expected to positively correlate with indices of differentiation between populations separated by rivers.
Furthermore, rivers have already been implicated as dispersal barriers for a species of subterranean pocket gophers (Davis, 1986). There is evidence that rivers affect naked mole-rats in the same way (Ingram et al., 2015), despite a report (Hickman et al., 1983) that naked mole-rats may be able to swim if necessary. Hickman et al. (1983) actually only found that one naked mole-rat individual tested was able to tread water for 3 min before needing to be rescued from drowning.
Several studies report low variation in one population of naked mole-rats (Faulkes et al., 1990; Reeve et al., 1990; Honeycutt et al., 1991) that had been previously hypothesized to be the descendants of a small number of founders that crossed the Athi river in southern Kenya during a drought (Jarvis, 1985). Ingram et al. (2015) sampled populations of naked mole-rats north and south of the Tana and Athi Rivers and, using both mitochondrial and nuclear DNA markers, documented phylogeographic structuring associated these two river systems with serial bottleneck events with the species range expansion. Historical founder events, fragmentation, and range expansion can leave residual patterns in the population genetic structure (Templeton et al., 1995). Rivers may cause fragmentation, isolation and genetic divergence. Alternatively, isolated populations may experience local extinction and subsequent recolonization, which leaves residual genetic patterns indicative of range expansion. While Ingram et al. (2015) documented population structuring correlated with two large river systems, these populations were sampled at a broad geographic scale, and located at the extreme southern portion of the species range, with limited genetic diversity due to historical founder events. Zemlemerova et al. (2021) also identified deep divergence in populations of naked mole-rats both within Ethiopia and across the broader species distribution. In the present study, we examine the effect of rivers as barriers to dispersal at a fine scale in populations naked mole-rat located within Meru National Park, Kenya. Based on the riverine barrier hypothesis, we hypothesized that genetic divergence between colonies on each side of a river will be positively correlated with river size.
Materials and methods
Sampling
All samples were collected along a 120 km transect in Meru National Park and Kora Reserve, Kenya under authority of the Office of the President (Permit: 15C/116). We obtained the samples for this study by trapping naked mole-rat individuals during four consecutive field seasons conducted between 2001 and 2004. Individuals were trapped using Hickman tube traps (Braude and Ciszek, 1998), tissue was stored in DMSO/EDTA/NCl buffer, initially at ambient temperatures and later at –20°C. We sampled at least two individuals from each colony, with the exception of colonies from which only a single individual was captured. To avoid bias from oversampling in some areas, this analysis only includes colonies trapped at least one kilometer apart.
River flow-rate
Rivers crossing the study site vary in discharge volume. We measured the flow rate of nine rivers (Supplementary Figure 1) using a flowmeter impeller stick manufactured by Geopacks. We assumed a roughly rectangular river profile and calculated discharge (Q) by multiplying mean velocity x mean depth × width of the river. For the largest river in Kenya, the Tana, which could be crossed only via a high steel bridge, we used previously published discharge estimates. The Tana was reported to have a discharge rate of 258 cumecs at Grand Falls (based on 17 years of data) and 210 cumecs at Garissa (based on 39 years of data) on average for the month of June (Goudie et al., 1986). Grand Falls and Garissa are locations upstream and downstream of our study area, respectively. We used the month of June average of the discharge values from these two sites to have a relative sense for the scale of the Tana compared to the rivers that we measured ourselves. Although these rivers have seasonal fluctuations, June was an appropriate month for river measurements because most above-ground dispersal has been observed during mid-year.
Sequencing
We used the following primers that were developed and described in detail by Faulkes et al. (1997a) to amplify the mitochondrial control region- Primer A: 5′-GAATTCCCCGGTCTTGTAAACC-3′ and Primer D: 5′-TCTCGAGATTTTCAGTGTCTTGCTT-3′. Based on the sequences obtained in our study, we designed a new forward primer, “Control C” (5′-TATCAGGCATCTGGTTCTTAC-3′).
We extracted DNA from toes using the QIAGEN tissue extraction kit following the rodent-tail protocol. We amplified the D-loop region using primers Control A and D. PCR conditions: 200 mM Tris pH 8.4, 250 mM KCl, and 25 mM MgCl2. The PCR cycling had the following profile: 94°C 2 min, then 35 cycles of 94° denaturation for 20 s, 45° annealing temperature for 20 s, and 72° extension for 2 min, followed by a final extension at 72° for 10 min.
We purified the amplified product using a VIOGENE gel purification kit and sequenced the entire region using two overlapping forward primers Control A and C. We used Big Dye v.3 with a sequence buffer (40 mM Tris-Hcl pH 9.0 and 1 mM MgCl2) and 40–60 ng of amplified product. We cleaned the sequence reactions using a 96-well sephadex column plate. We dried the reactions in a vacuum centrifuge and added 5 ul of formamide before running them on an automated BaseStation sequencer from MJ Research.
River pairwise sequence divergence
To obtain genetic-distance measurements across the rivers of the study area, we made pairwise comparisons of colonies that were separated by one river and were within a distance less than 3 km but greater than 1.5 km. We chose this distance interval for two main reasons. First, this interval bounds the maximum distance (2.4 km) an individual has been observed to disperse (Braude, 2000). Second, choosing a small interval controls for geographical distance in these genetic measures as much as possible while minimizing the loss of statistical power in sample number. Choosing to limit the distance to less than 1.5 km would have eliminated many of the rivers from the analysis because the colonies on opposite sides of the river were more frequently greater than 1.5 km apart.
Phylogenetic analysis
We used published sequences from individuals collected in Athi, Ithumba, Lerata, Ethiopia, and Mtito Andei (Faulkes et al., 1997a) to obtain a phylogeny to help root our haplotype network before performing a nested clade phylogeographic analysis (NCPA). We obtained a phylogeny from a parsimony analysis in PAUP (Swofford, 1993) with bootstrap support from 1000 replications. We added samples from two new regions: around the town of Mutomo (labeled MutomoNS1) and on the ranchland of Lewa Downs (Lewa4013 and Lewa4026). The NatV samples were collected by Nathan Mathuku, a resident of Mutomo. The map in Figure 1 shows all these locations in relation to our study site at the scale of the entire country of Kenya.
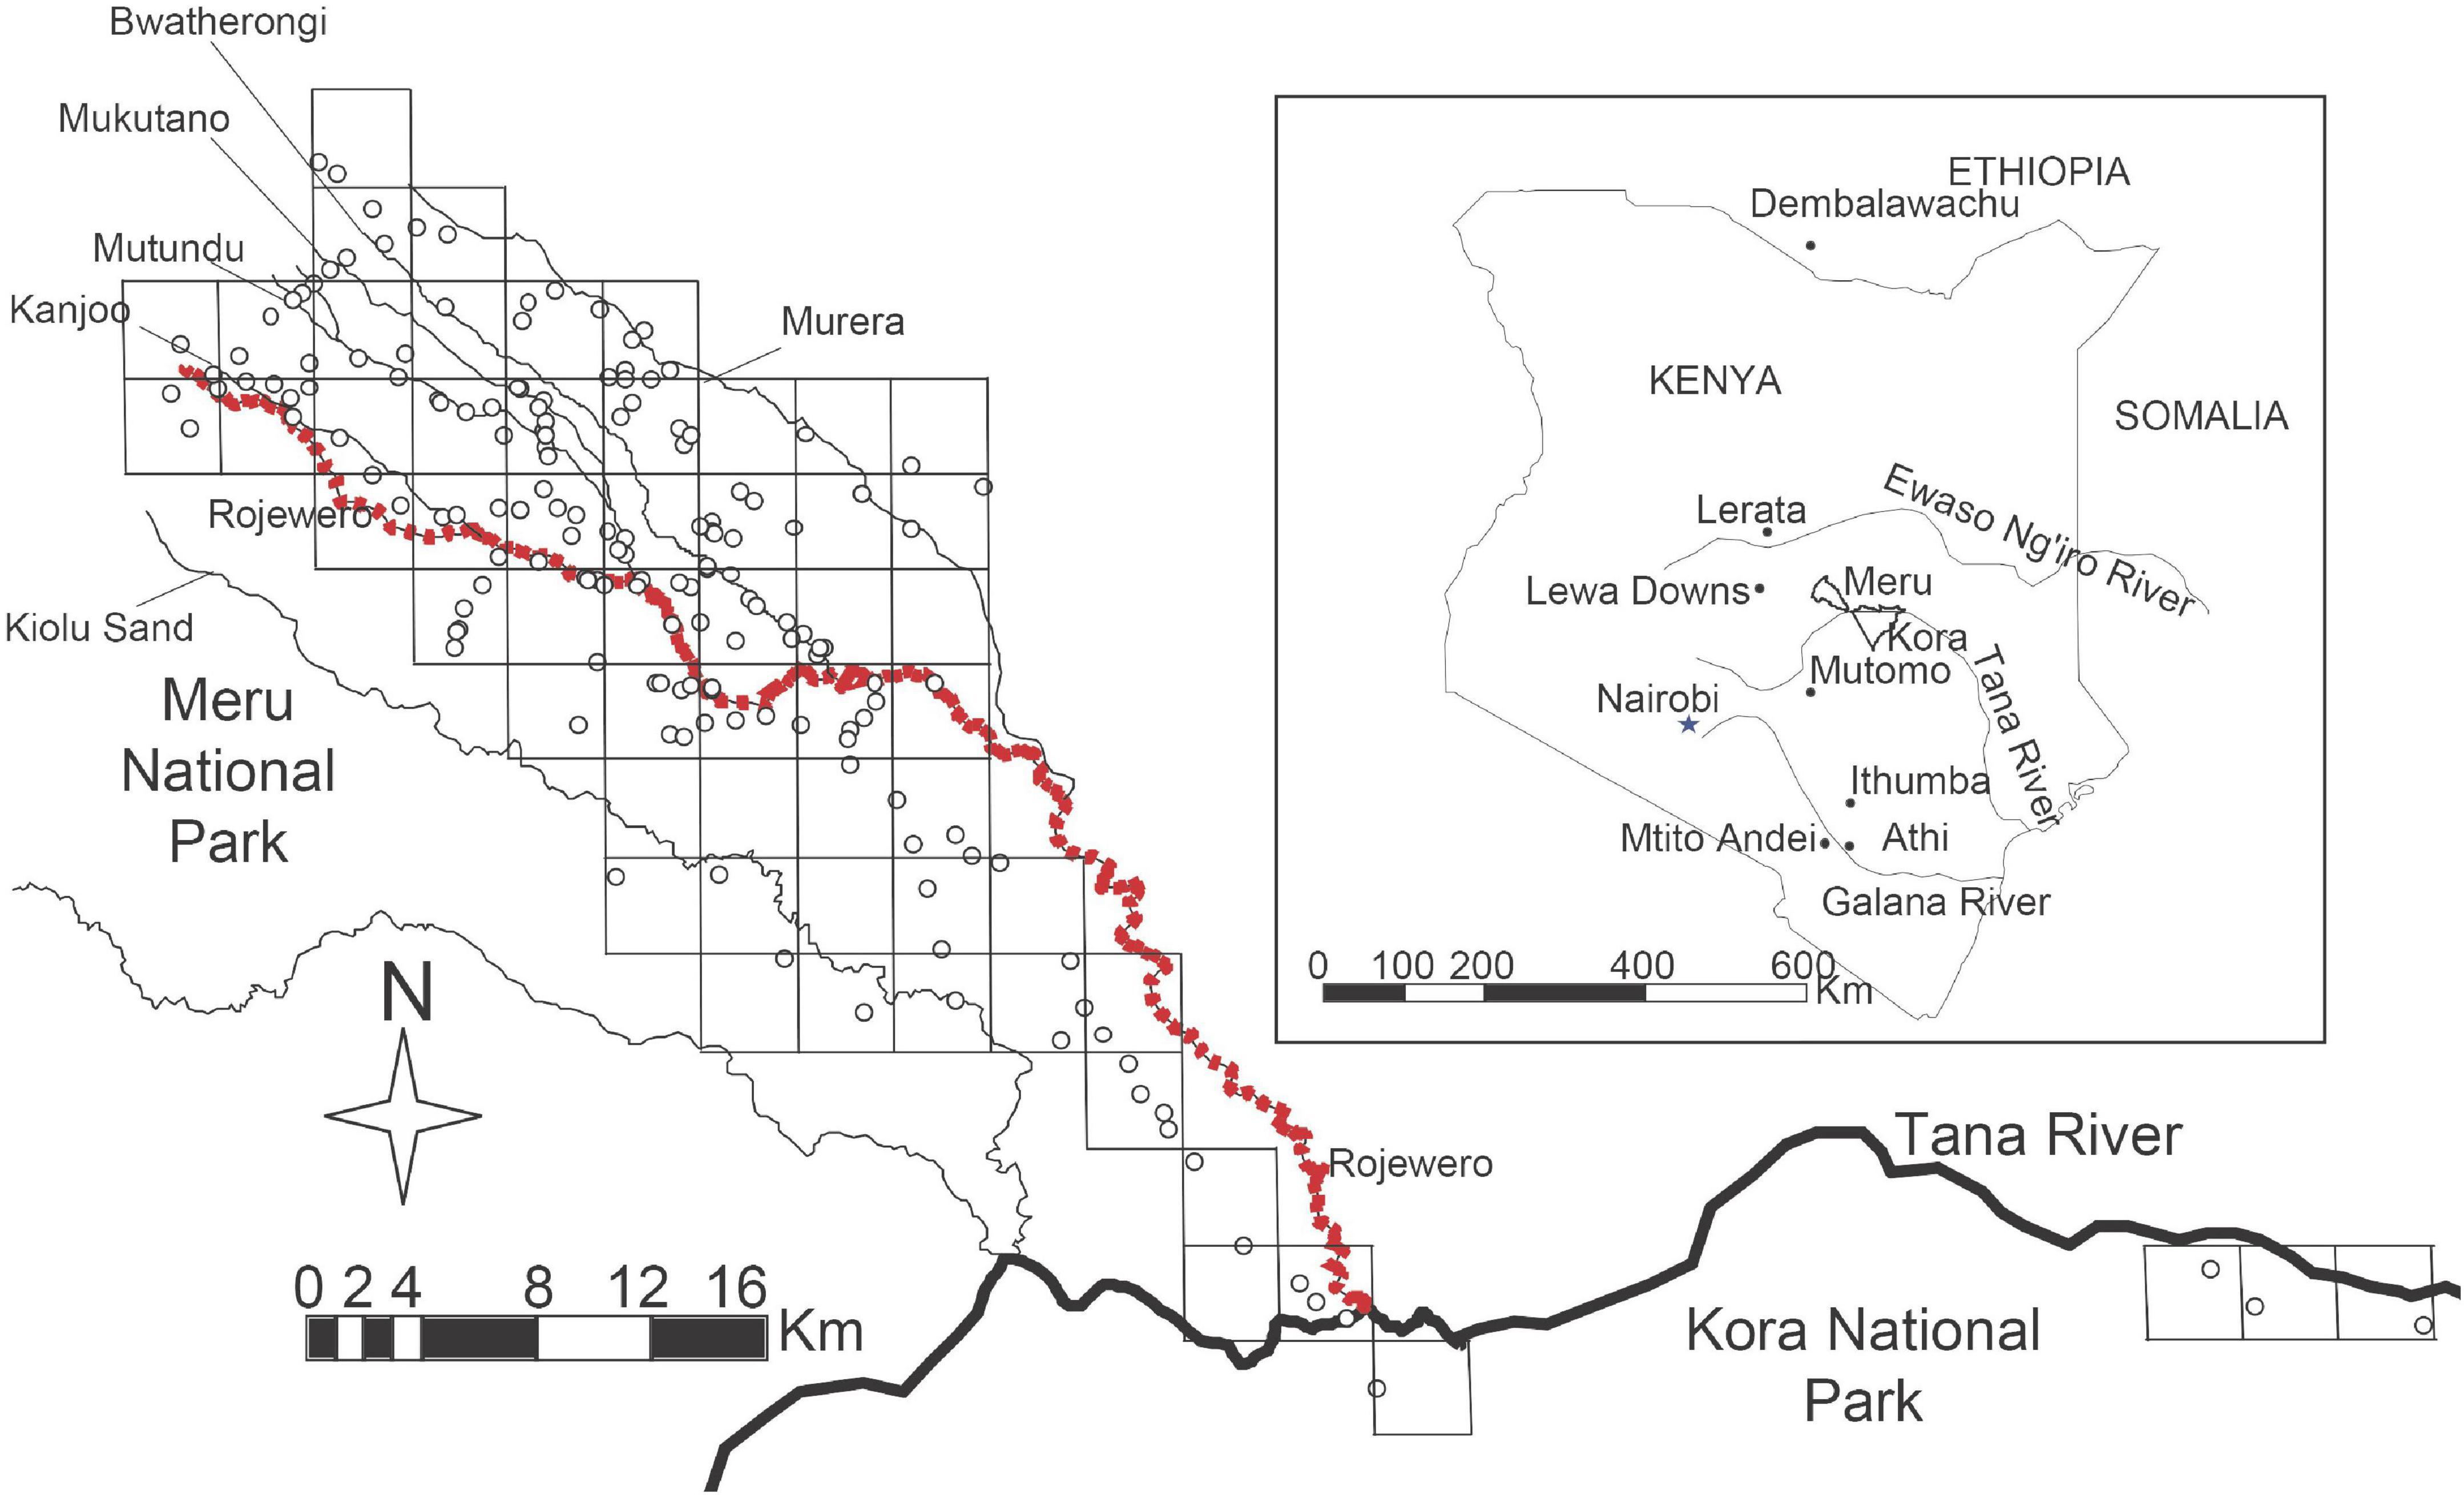
Figure 1. Map of the study site in Meru and Kora national parks. Grid cells were overlayed on the naked mole-rat colony points as a way to group colonies into cluster populations before performing a nested clade analysis. In the event a river divided a grid cell, the colonies on either side of the river were grouped separately. The red dotted-line is the Rojewero River which separates the northern clade colonies from the southern clade colonies. Inset map of Kenya indicates the study site in relation to the distribution of naked mole-rat samples from outside the study site.
Nested clade phylogeographic analysis is a phylogeographic analysis that separates historical patterns from contemporary gene flow. NCPA makes use of information about the geographic distribution and genealogy of haplotypes to make inferences concerning the role of recurrent gene flow and historical phenomena such as fragmentation events and range expansions in the formation of current population structure (Templeton et al., 1995). We estimated haplotype trees using statistical parsimony (Templeton et al., 1992) using the program TCS v. 1.13 (Clement et al., 2000). We then used the haplotype tree to construct a series of hierarchically nested clades following the nesting rules given in Templeton et al. (1987) and Templeton and Sing (1993). Finally, we used the program GeoDis 2.0 (Posada et al., 2000) to calculate the various NCPA measures and test the null hypothesis of no association of a haplotype or clade of haplotypes in a cladogram with geographical position within a nesting clade.
Nested clade phylogeographic analysis makes phylogeographic inferences from genomes or genomic regions that show little or no recombination – the very regions upon which evolutionary history is most clearly written (Templeton et al., 1995). NCPA uses haplotype trees estimated by a Bayesian procedure known as statistical parsimony (Templeton et al., 1992). This estimation procedure allows the haplotype tree to be regarded as estimated with error or uncertainty, and this uncertainty is incorporated directly into the nested clade analysis (Templeton et al., 1992; Crandall and Templeton, 1993). The haplotype trees are converted into a nested statistical design that yields independent contrasts, thereby making corrections for multiple testing straightforward. The inferences derived from these nested clades have been subjected to the most extensive validation for any phylogeographic technique using 150 positive controls from actual data for which prior data existed for phylogeographic events or processes (Templeton, 2004). These results from analyzing real data sets indicate that NCPA is a powerful method for phylogeographic inference that is not subject to a high rate of false positives. In contrast to real data, Knowles and Maddison (2002) used computer simulations purporting to show a high rate of false positives. They used an out-of-date version of NCPA that explicitly excluded the situation they simulated, thereby ensuring that false positives would be abundant. When their simulation results were re-analyzed with the 2002 version of NCPA that was freely available to them, not a single type I or type II error occurred, and the simulated scenario was inferred with 100% accuracy (Templeton, 2009). Hence, the simulations of Knowles and Maddison (2002) reveal that NCPA is a remarkably powerful tool with extremely low values of both type I and type II errors. There have since been other simulations purporting to show that NCPA has a high false positive rate, with the most recent being Panchal and Beaumont (2010). All of these are based on serious misrepresentations of NCPA, and when these misrepresentations are corrected, the type I error rate is at or below the pre-set level of 0.05 (Templeton, 2009, 2015, Allen et al., 2021). Finally, NCPA does not require a prior phylogeographic model, but rather phylogeographic inferences are built up directly from the data by retaining only statistically significant inferences. As a result, NCPA can reveal phylogeographic events that had not been anticipated. In contrast, simulation approaches to phylogeography require detailed models before-hand, and inference is strictly limited to what is simulated in a set of possible models based on prior expectations. Given that we do not have much prior information on the phylogeographic history of naked mole-rats and that actual data and simulated data indicate that NCPA is a powerful method of phylogeographic inference not subject to a high rate of false positives, NCPA is the most appropriate method for analyzing this species.
The unusual social structure of this species required us to perform an extra step that involved grouping colonies into population clusters before using NCPA. In their social structure, one female breeder bears a large number of offspring that comprise the bulk of the colony. It was necessary for us to perform this grouping because we were using the genetic perspective of a maternally inherited molecular marker and so most, if not all, of the individuals that we captured from each colony represent one individual, the female breeder who bore them.
Our initial strategy treated the colonies as population units. However, this treatment yielded ambiguous results when using the key for NCPA because some inferences require information regarding whether clades contain overlapping or non-overlapping distributions of haplotypes. Here, the term “overlapping distributions” was intended to refer to different haplotypes found in the same population. However, since most of our populations were monomorphic we would have had difficulty interpreting overlap. Therefore, we chose to group colonies together into clusters and use these clusters as our population unit. To group colonies into clusters, we overlayed a grid on our populations and grouped populations falling within the same grid cell (Figure 1). We performed the placement of this grid using a program in ArcGIS (ESRI, 2003) that uses a layer of points (in our case the colony GPS coordinates) to create a surface composed of uniform grid cells of a size specified by the user (Rathert, 2003). We automated the placement of the grid cells by allowing ArcGIS to establish a random start point to avoid introducing bias from human judgment. We chose the size of the grid cell as 3 km × 3 km loosely based on the maximum distance an individual was recorded to disperse (2.4 km) (Braude, 2000). We used the number of different mitochondrial haplotypes within a colony as individuals in these new population units. Therefore, we treated most colonies as single individuals, except for the few cases in which we captured both female and male breeders and found they had different haplotypes. Also, we treated each of the two colonies that were found to be internally heterogeneous (heteroplasmic) as 2 individuals, each individual bearing 1 of the 2 haplotypes.
Ideally population genetic structure is best characterized using a large number of markers distributed throughout the nuclear and mitochondrial genomes, however, our study was restricted to the perspective of a single DNA marker that is maternally inherited (mtDNA). Although not ideal, this genetic marker was highly informative for our particular application to characterize historical processes of a species that has a social structure that centers around dominant female breeders.
Because rivers are uninhabitable territory, we did not group colonies that were not located on the same side of a river. However, we ignored two rivers in this grouping process. The first river, Ithumbanchego, was a small seasonal stream bed that was dry. The second was the Mulika river that was also very small and ran within a kilometer distance parallel to the Bwatherongi, a similar-size stream that was included in the analysis. Only one colony would have been grouped differently (creating a new population with just one effective individual) if we were to have used the river, and it did not affect the results of our analysis. We averaged the GPS coordinates of all the colonies within each grid cell cluster to obtain one set of coordinates for each new population. Our clustering process reduced our original population count within our study area from 168 colony populations to 75 cluster populations.
In order to estimate the time of the event inferred by NCPA we used the dating method described by Templeton (2003). The equation for this estimation requires calculation of the sequence divergence of the more recent derived clade from that of the nearest older clade, as well as the sequence diversity within each clade. We used t = (Dxy–0.5*(Dx + Dy))*mutation rate, where Dxy is the average divergence between the recently derived clade from the nearest older clade, and Dx and Dy are the average diversity within the recent and older clade, respectively. In order to calculate confidence intervals for the time estimate a gamma function is used to account for genetic drift in modeling the distribution of time (Kimura, 1970). This method assumes a neutral rate of mutation and the accuracy of this mutation rate is critical for the proper dating of an event.
Results and discussion
We found 54 unique haplotypes among the 174 colonies that we sequenced. Most of the colonies were monomorphic, containing a single haplotype among the individuals sequenced. Two colonies contained heteroplasmic individuals. Heteroplasmy has been described before in naked mole-rats by Honeycutt et al. (1991). We were able to detect consistently the relative frequency of both genomes in the sequence data, as confirmation of their existence (i.e., we conducted multiple independent extractions of DNA from the tissue sample of the putative heteroplasmic individuals and confirmed the same sequence result). In both cases of heteroplasmy, the haplotypes were only different by one basepair mutation.
River pairwise sequence divergence
According to one of the predictions based on the riverine barrier hypothesis, the amount of genetic divergence between populations separated by a river should be greater that the divergence between populations on the same bank (Capparella, 1988). Further, this divergence should positively correlate with the river size which can be measured in many ways such as discharge, flow-rate, and width (Ayres and Cluttonbrock, 1992). This prediction assumes that the rivers observed today have been relatively constant over time and colonies have come from one source and been present within all the river regions from that initial moment to the present. The prediction about river size also assumes that there is no threshold effect. For example, if animals cannot disperse across a river that is greater than a particular size, all rivers above that size will have the same effect on gene flow. These assumptions may differ from reality, but these predictions serve as a useful starting point to test whether rivers have played a significant role in isolating populations based on the observed genetic patterns.
There exists a positive relationship between discharge and average pairwise sequence divergence (p-value = 0.0006, slope = 0.0049, r2 = 0.8809). The Tana and Kiolu Rivers were not included in the analysis because of insufficient sample sizes (n = 1). This significant positive correlation is largely due to the high sequence divergence across the Rojewero River.
We performed a series of one-way ANOVAs to test the effect of rivers on average pairwise sequence divergence. The Rojewero is significantly greater than the other rivers in terms of average pairwise sequence divergence between haplotypes sampled on either side of it (again excluding the Kiolu and Tana due to inadequate sample sizes) (p-value < 0.00001).
We found that not all the rivers fit a simple model that predicts that average pairwise sequence divergence is directly proportional to their discharge. Although we did not have the sample sizes to test the largest river (the Tana) in the same way as all the others, even if we ignored geographical distance and used pairwise differences of all four of the colonies on the south of the Tana compared to the total number of colonies north of the Tana (south Rojewero), the average pairwise sequence divergence was still significantly less. The values for the Rojewero and Tana average sequence divergence were 0.01991 and 0.0059, respectively (p-value < 0.00001). This was surprising because the discharges were so significantly different. The Tana is the largest river in Kenya with a discharge average (234 cumecs) that is almost two orders of magnitude greater than the second largest river in our study, the Rojewero (3.7 cumecs).
However, if we were to ignore for a moment the two largest rivers, Tana and Rojewero, and also exclude the values contributed by the presumed migrant colony discussed previously for the Ithumbanchego average sequence divergence, we were able to detect a positive correlation between river discharge and sequence divergence for the remaining rivers. This correlation is mainly due to the Murera and Mutundu, the 2 s largest rivers after the Rojewero, because they both had significantly larger sequence divergence as compared to the other smaller rivers. Therefore, we have found some correlative evidence for the isolating effect of rivers as well as the possibility that at least for the two largest rivers, a different type of historical event may have played a role in our study population. This pattern does indicate a threshold effect. The Rojewero and Tana seem to be above a threshold effect on gene flow, but the smaller rivers are not.
Phylogenetic analysis
Faulkes et al. (2004) presented evidence that naked mole-rats spread north to south and the Ethiopian haplotype was basal. Recent work by Zemlemerova et al. (2021) has shown two ancient lineages of naked mole-rats distributed in Eastern Ethiopia and Southern Ethiopia. The lineage that spread into Kenya and a sublineage in the Southern Ethiopian clade (“Borena National Park Megadu block”) are sister taxa (Zemlemerova et al., 2021). By rooting our phylogeny with the Ethiopian haplotype (Figure 2), we obtain similar results as also found by Faulkes et al. (1997a). There is a large genetic break between northern and southern haplotypes, and interestingly the Rojewero river, less than 20 m in width, appears to be the barrier separating them. Representatives of the sister haplogroups of the southern clade are located in the extreme southeastern edge of the mole-rat distribution at Ithumba and Athi. From these populations there may have been more recent colonization of areas to the north and southwest (Mtito Andei). In the north, the sister haplogroups appear in two colonies from Lerata (Lerata 2 and 3). Faulkes et al. (1997a) also detected what could be a similar contact zone between north and south lineages on a similar small scale (less than 100 m apart). Surprisingly, the Lerata1 and 4 colonies appear to have a closer phylogenetic connection with the southern haplotypes from Athi and Ithumba. The bootstrap support was quite high (96 between Lerata 1 and 4, and 99 between Ithumba to the Lerata/Athi group). Unfortunately, there was no mention of whether any geographical barriers were separating the colonies Lerata 2 and 3 from Lerata 1 and 4. These Lerata colonies are around 100 km north of Meru National Park, but also are close to a west-to-east river, the Ewaso Ng’iro. Only considering our samples from central Kenya may have led to a conclusion that there has been an ancient fragmentation event between colonies north of the Tana from those in the south. However, considering the possibility of a similar contact zone at a northern location in Lerata suggests that a west-to-east fragmentation should be considered as well. Other possibilities at Lerata may include ancient polymorphism in the Lerata population, a recent translocation, or mislabeled sample locations. Further, if the Lerata 1 and 4 colonies were found to be spurious, our results would support a relatively ancient fragmentation occurred that separated sister taxa from southern Ethiopia from a southern population in Kenya (Mtito Andei as representative; “Mtito1,” Zemlemerova et al., 2021); and over time, a more recently derived northern Kenyan clade may have fragmented from the southern Kenyan clade (Lerata 2 and 3 as representative haplotypes, Zemlemerova et al., 2021). More thorough sampling across the distribution of this species is required to resolve the nature of this fragmentation; however, our results do strongly suggest that fragmentation rather than isolation-by-distance gene flow has produced the genetic divergence exhibited between our study’s northern and southern haplotypes.
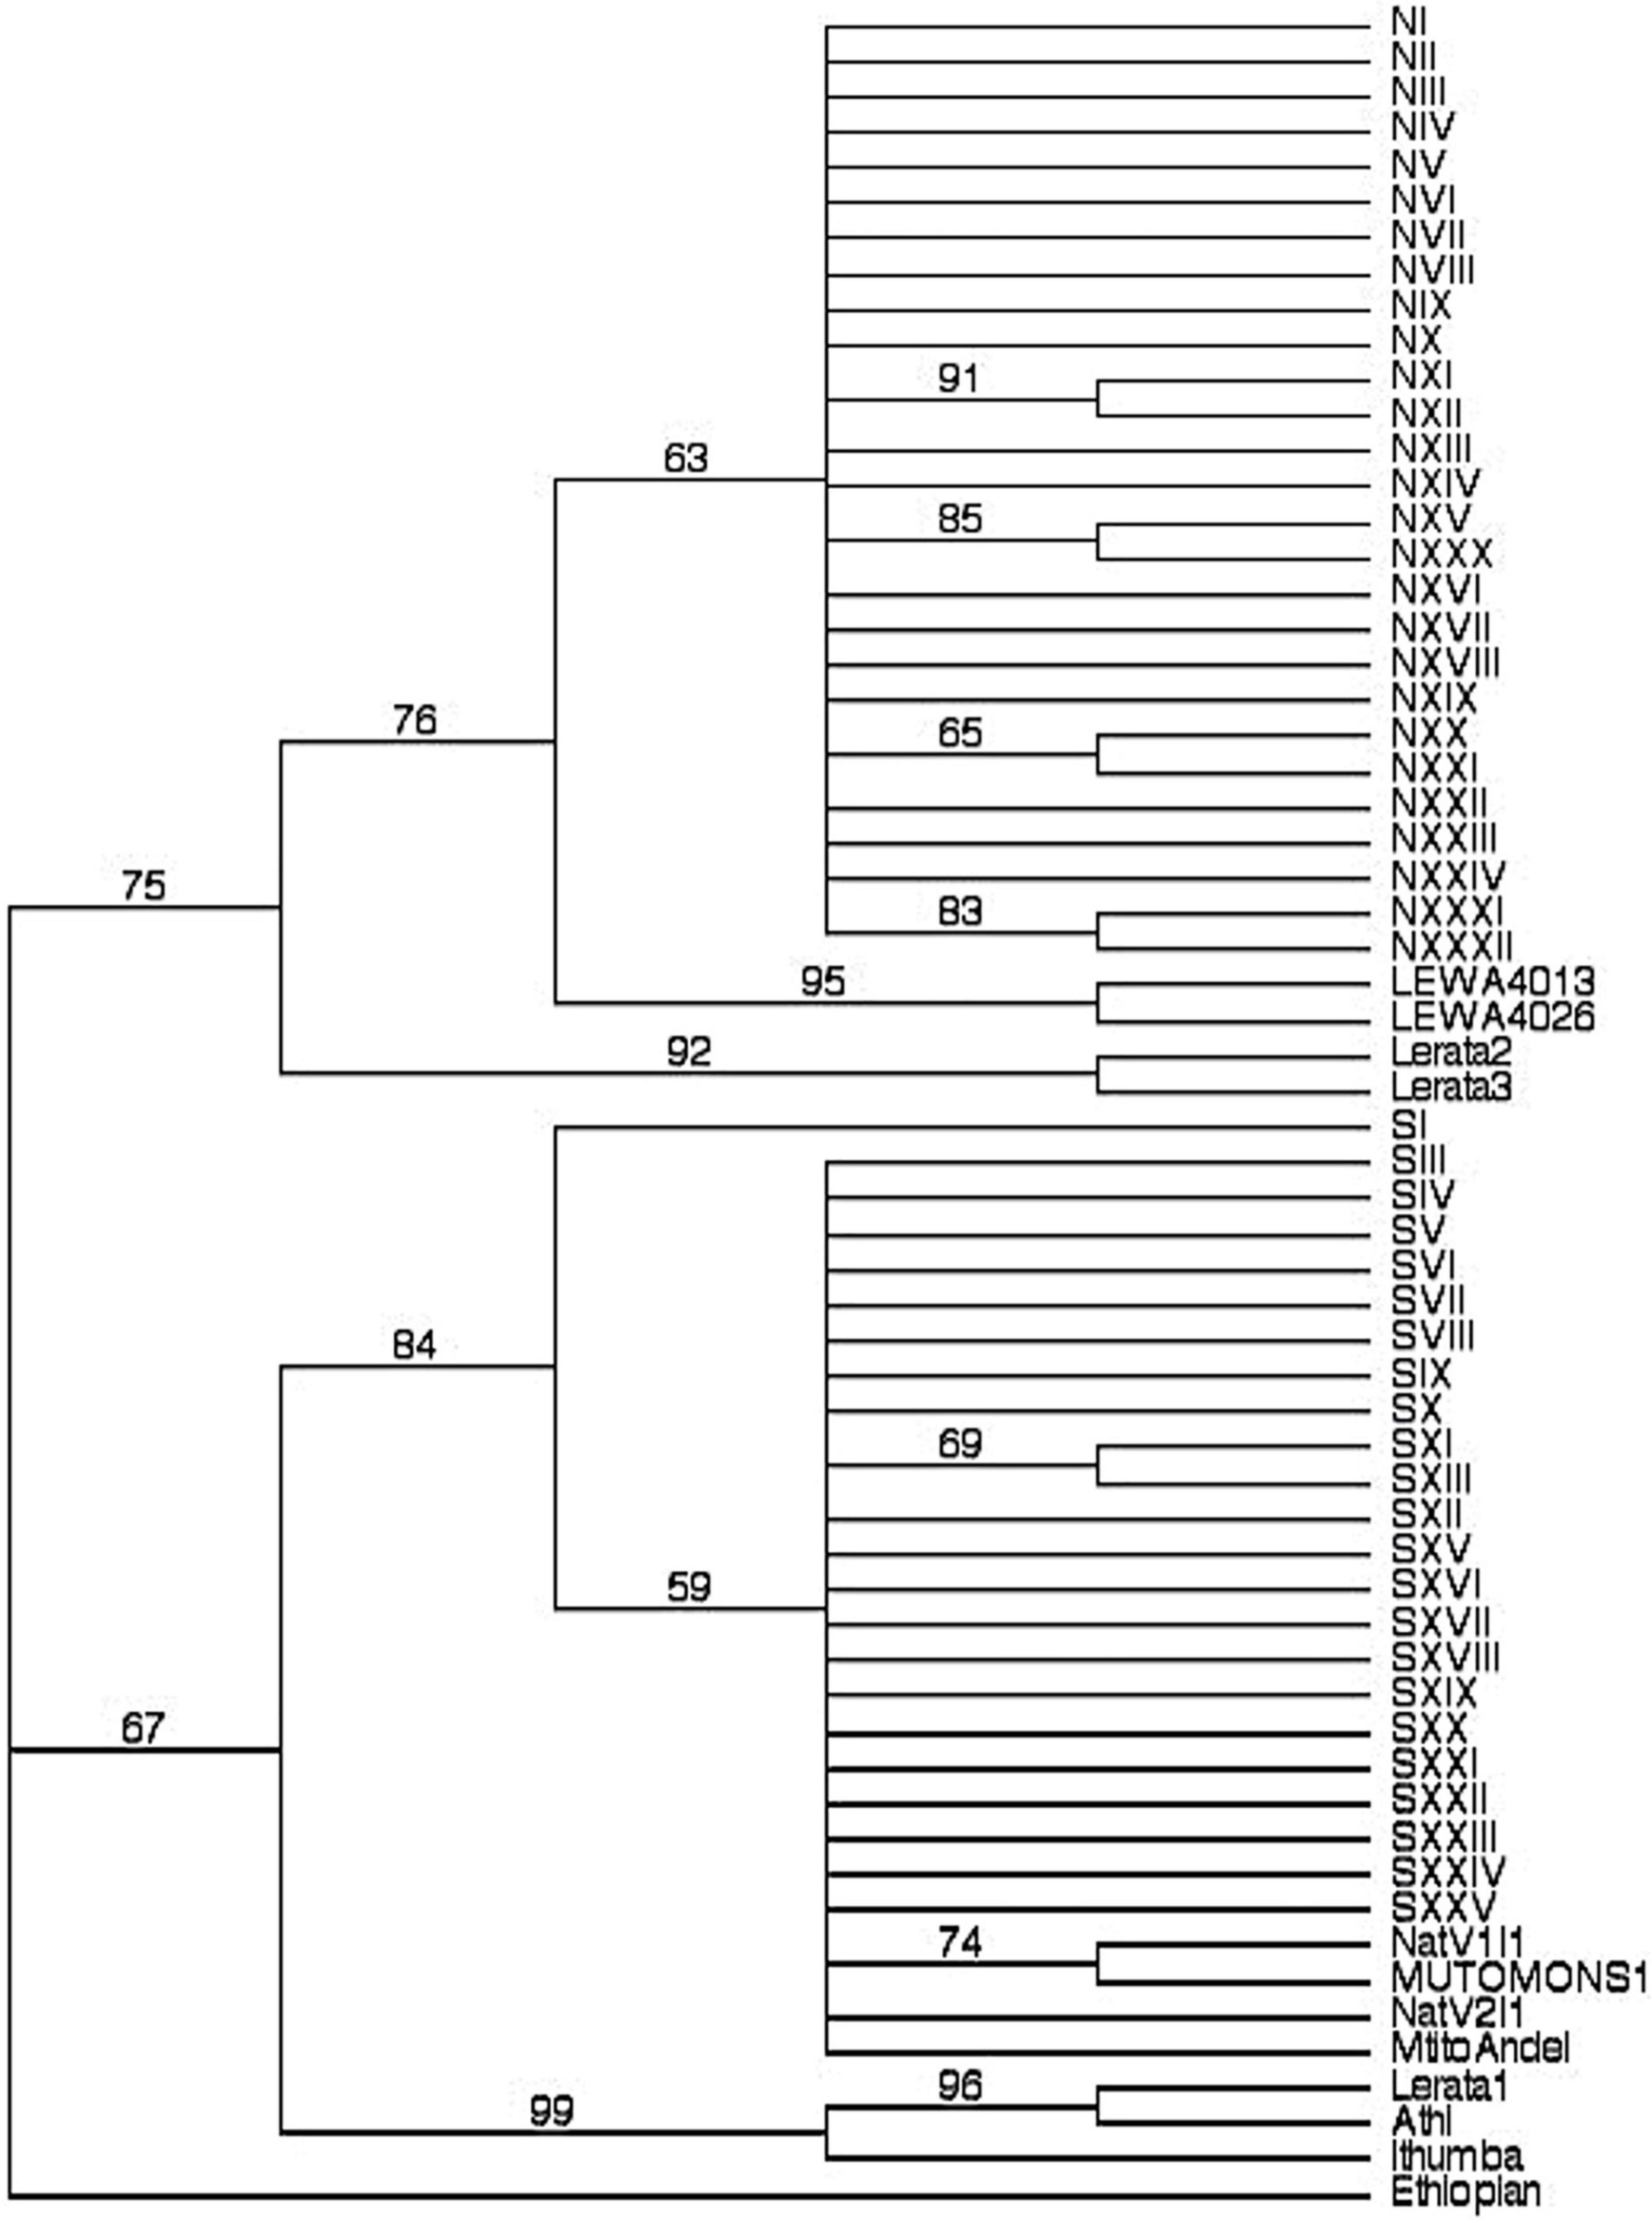
Figure 2. Phylogeny with bootstrap values from 1000 replications. The haplotypes found in our study site are labeled as N or S (referring to its membership in either the northern or southern haplotype network) with a roman numeral that was given to identify each unique haplotype. The haplotypes included from Faulkes et al. (1997a) are named Lerata, Mtito Andei, Ethiopian, Ithumba, and Athi. Faulkes et al. (1997a) sampled four colonies from Lerata, and found 3 haplotypes (Colonies 1 and 4 shared the same one). Both the NatV1 and V2 haplotypes were located in the area of Mutomo. We rooted this phylogeny with the same haplotype from the Ethiopian colony used as an outgroup by Faulkes et al. (1997a, 2004).
Nested clade phylogeographic analysis
The north clade and south clade were separated by a minimum of 25 mutational steps and so we analyzed these networks separately. Both clades had a few ambiguities in the network (northern clade, Figure 3A; southern clade, Figure 4A). We constructed multiple network alternatives that considered all possible connections to test how the different configurations affected the inferences obtained by the NCPA key (Supplementary Material); however, we present results based on the most parsimonious nesting for both northern (Figure 3B) and southern (Figure 4B) clades, and given the geographic distributions of the haplotypes we observed (Figures 5A, 6A for northern and southern clades, respectively).
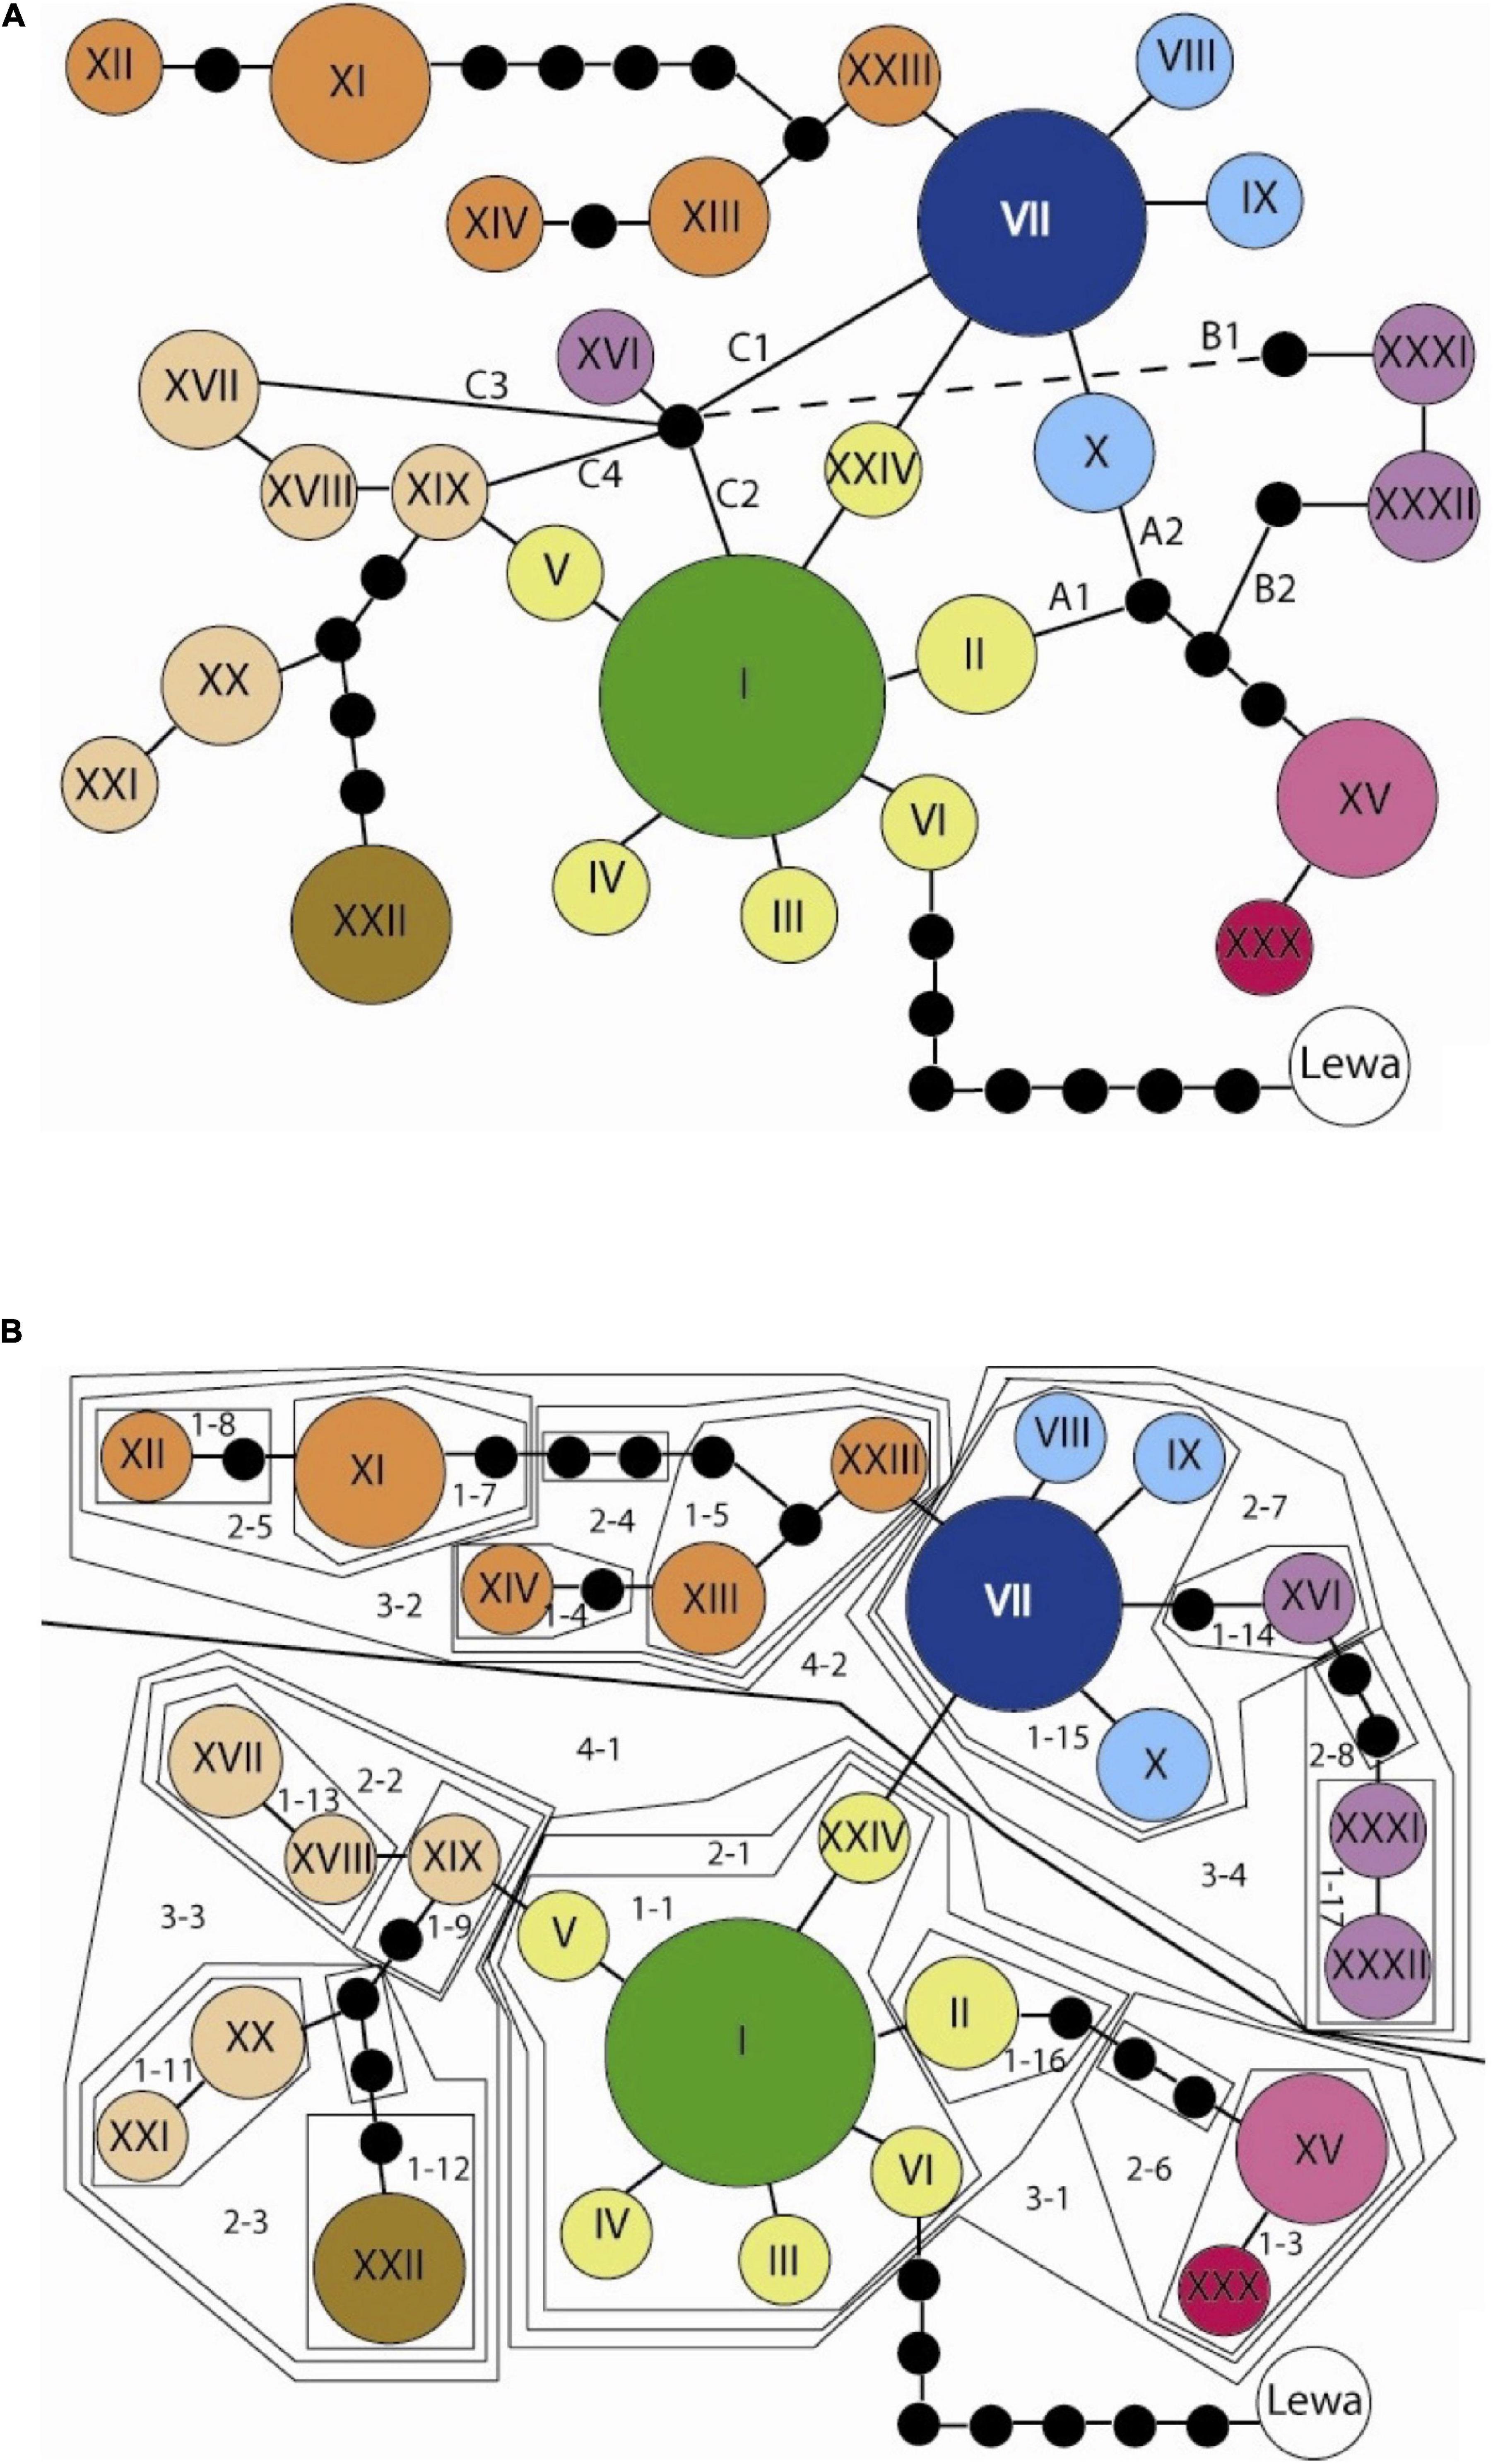
Figure 3. (A) Northern haplotype network with all the parsimonious connections. The black dots indicate unobserved haplotypes and each line represents one mutational step. The colors correspond to those used on the distribution map. The letters A, B, and C label the multiple possible connections that are referred to in the text and can produce 16 possible combinations of this network. The Lewa haplotype was found outside the study site at Lewa Downs and was used to root the network. (B) Northern network configuration 5 (A1B1C1). This configuration depicts what we considered to be the most reasonable or likely connections based on the criteria established in Crandall and Templeton (1993). The nested clades are numbered, and to distinguish the nesting in this configuration from the alternative configurations the clade numbers should be considered to have the subletter “a.”
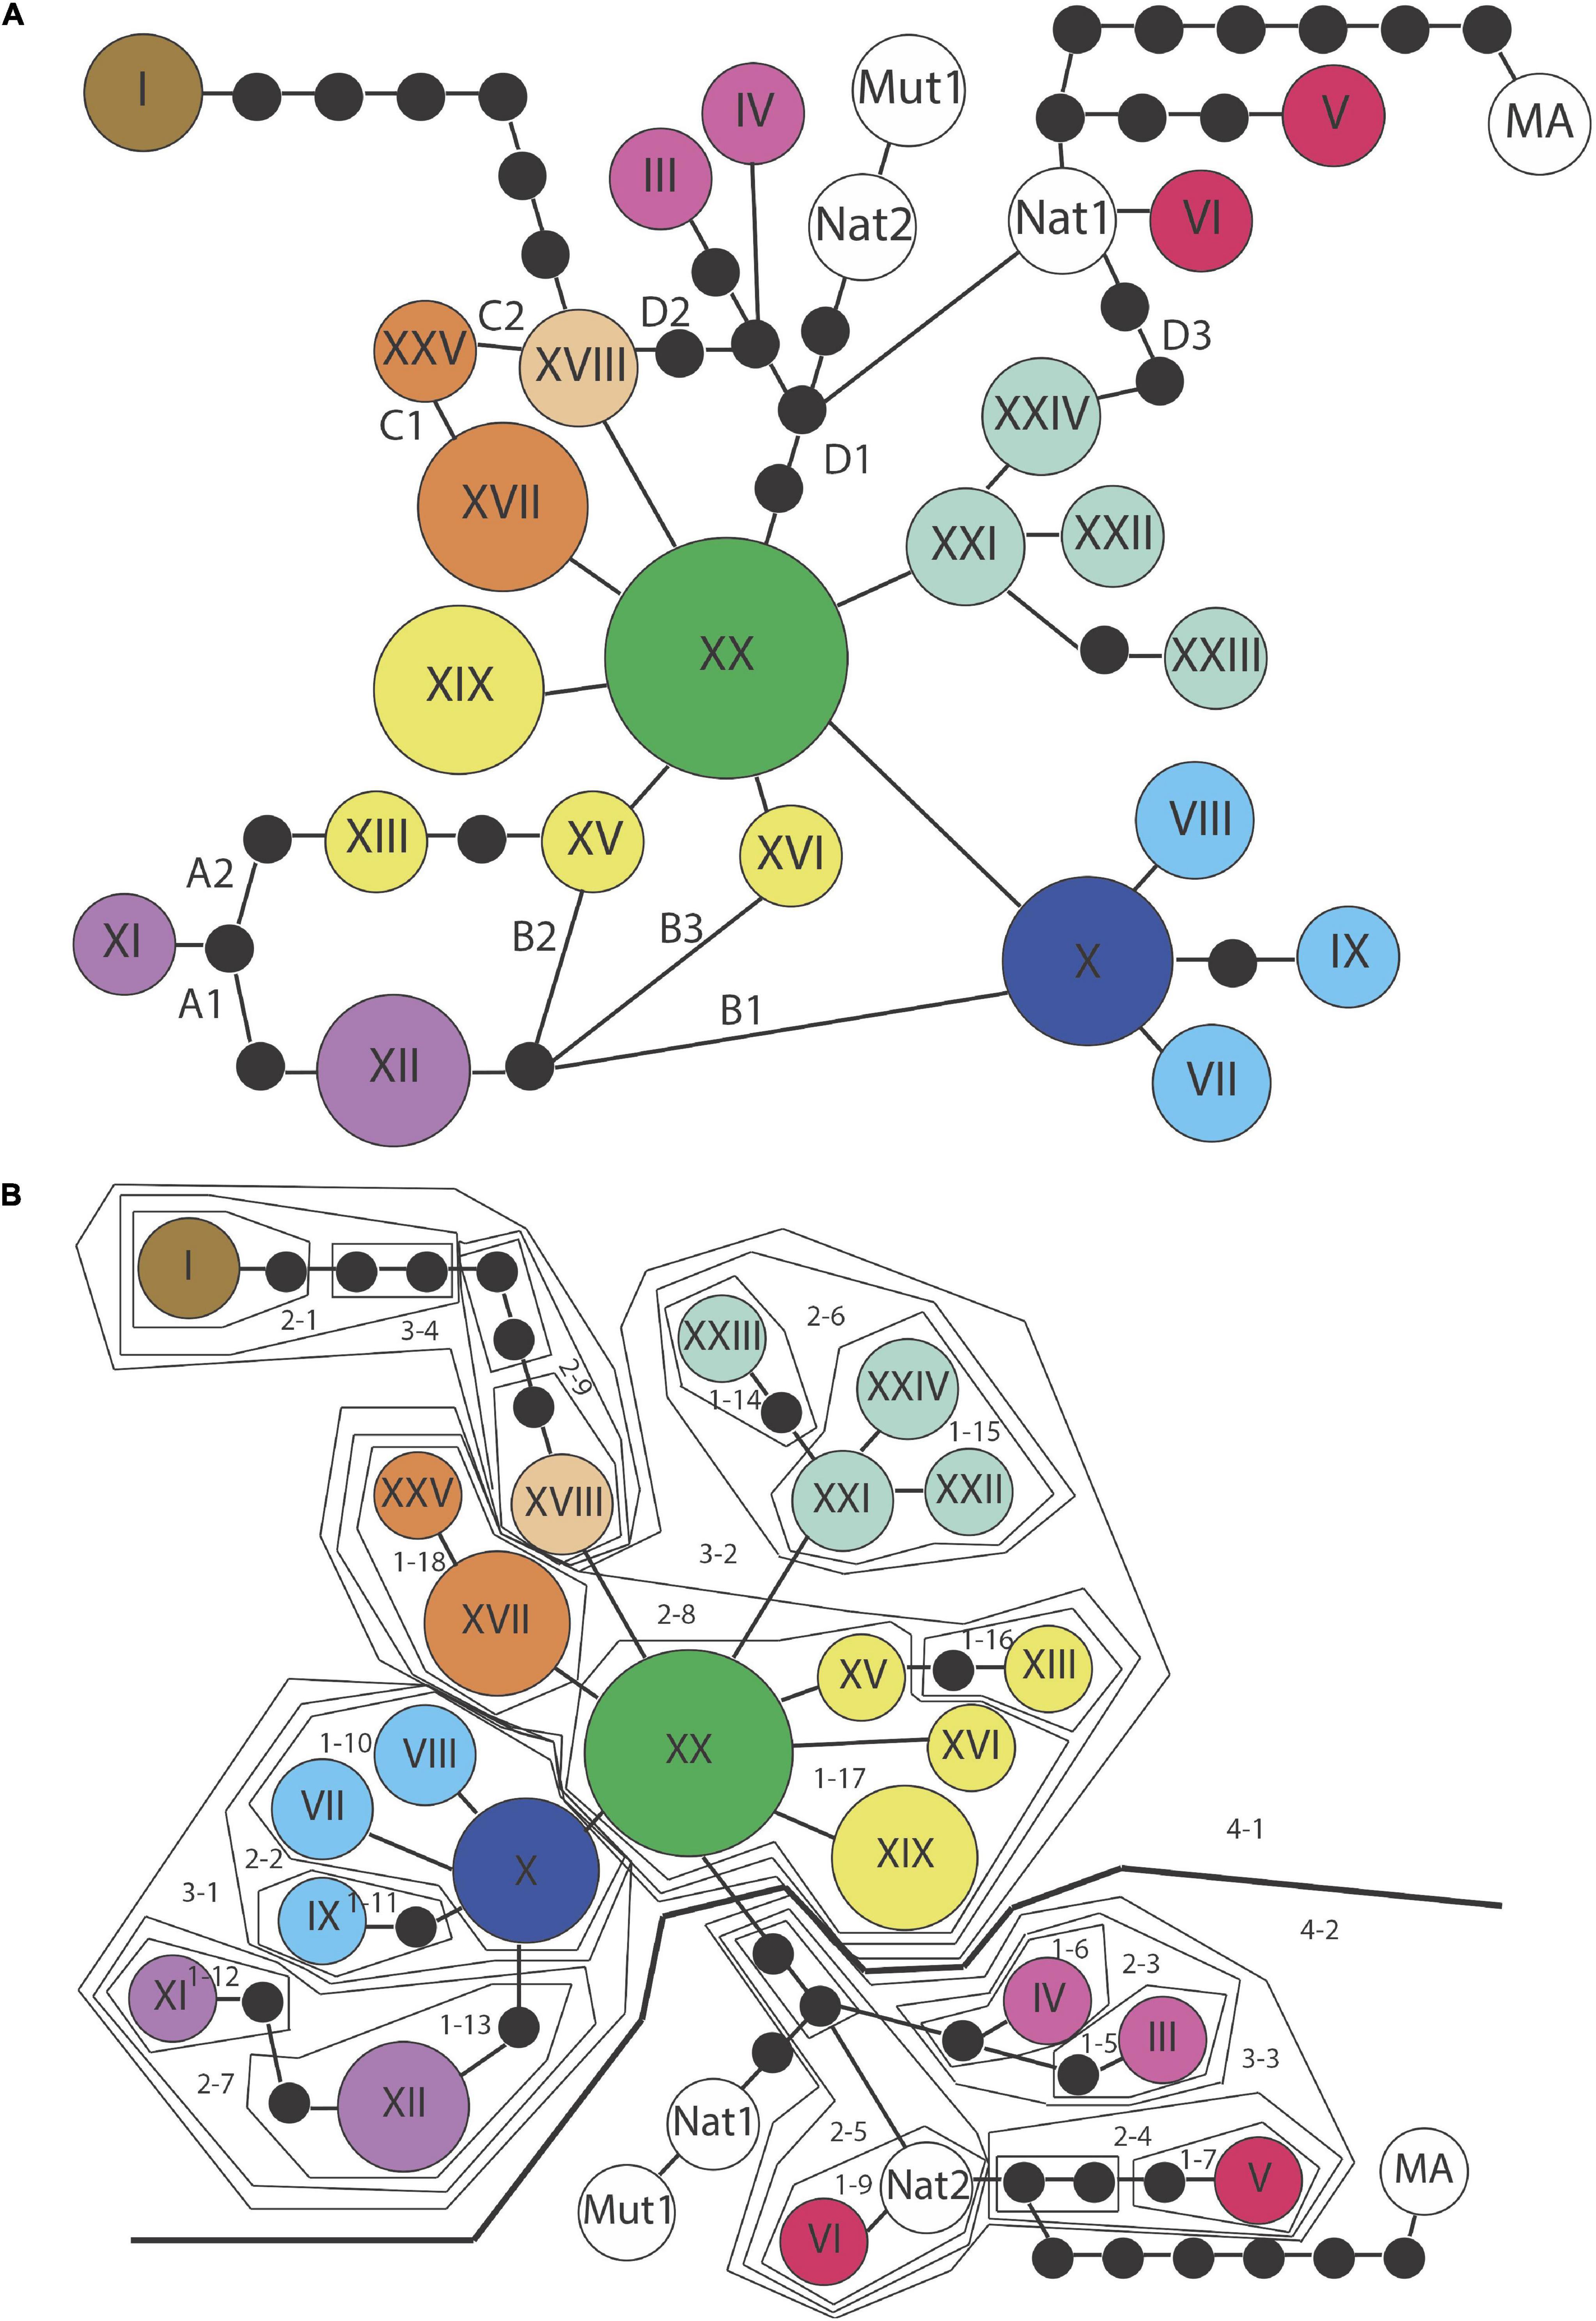
Figure 4. (A) Southern haplotype network showing all possible parsimonious connections. (B) Southern haplotype network most reasonable configuration 1. The combination of connections shown in A for this configuration (A1B1C1(D1)) were chosen based on three criteria described in Crandall and Templeton (1993) for resolving ambiguities and rooting the phylogeny.
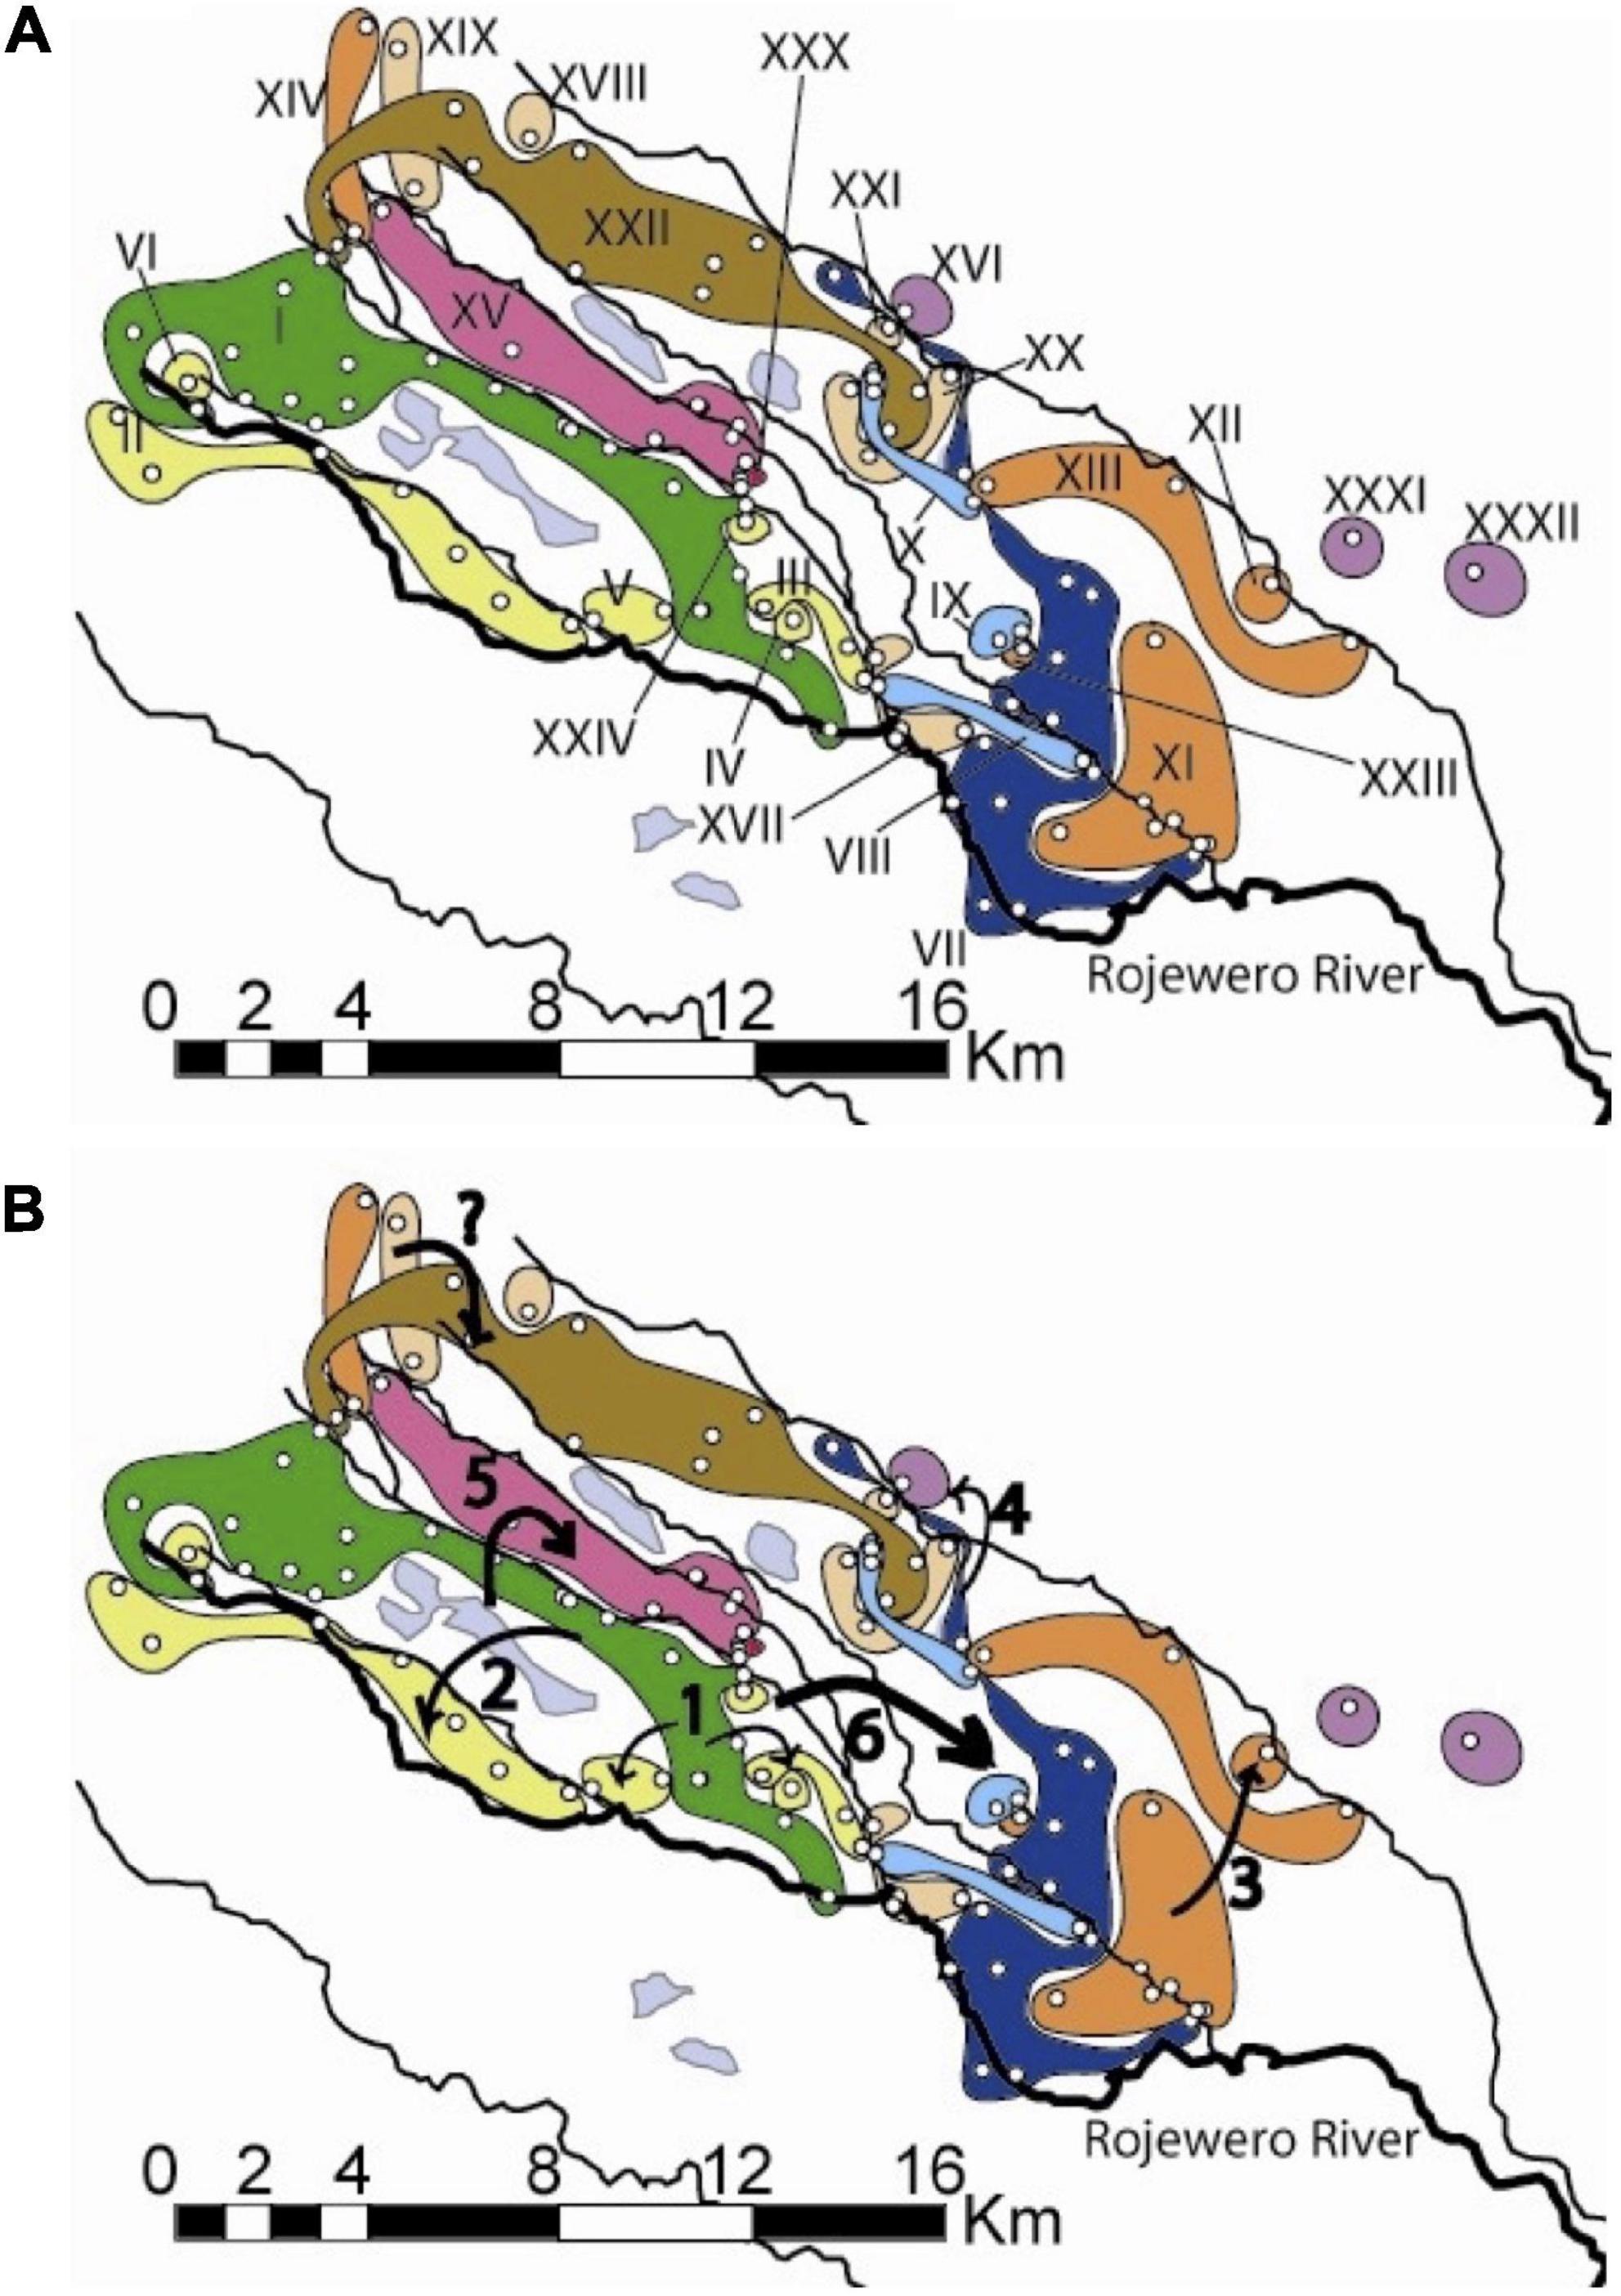
Figure 5. (A) Northern haplotype distributions. The roman numerals identify unique haplotypes and the colors correspond to those in the haplotype network in Figure 3. The light blue areas without roman numerals represent swamps. The Rojewero is labeled. Notice the three colonies that were found on the south side of the Rojewero: two from the yellow II haplotype and one from the dark blue VII haplotype. Bridges are located close to these “migrant” colonies. None of the colonies from the southern network are shown. These networks are separated by 25 bp steps. (B) Map showing the significant inferences of historical events of the northern NCPA. Arrows indicate the following inferences from Table 1: 1: restricted dispersal, 2: allopatric fragmentation, 3: range expansion, 4: allopatric fragmentation, 5: allopatric fragmentation, “?”: restricted dispersal. The “?” signifies the lack of robustness for this event, 6: long-distance colonization/subsequent fragmentation or fragmentation/range expansion.
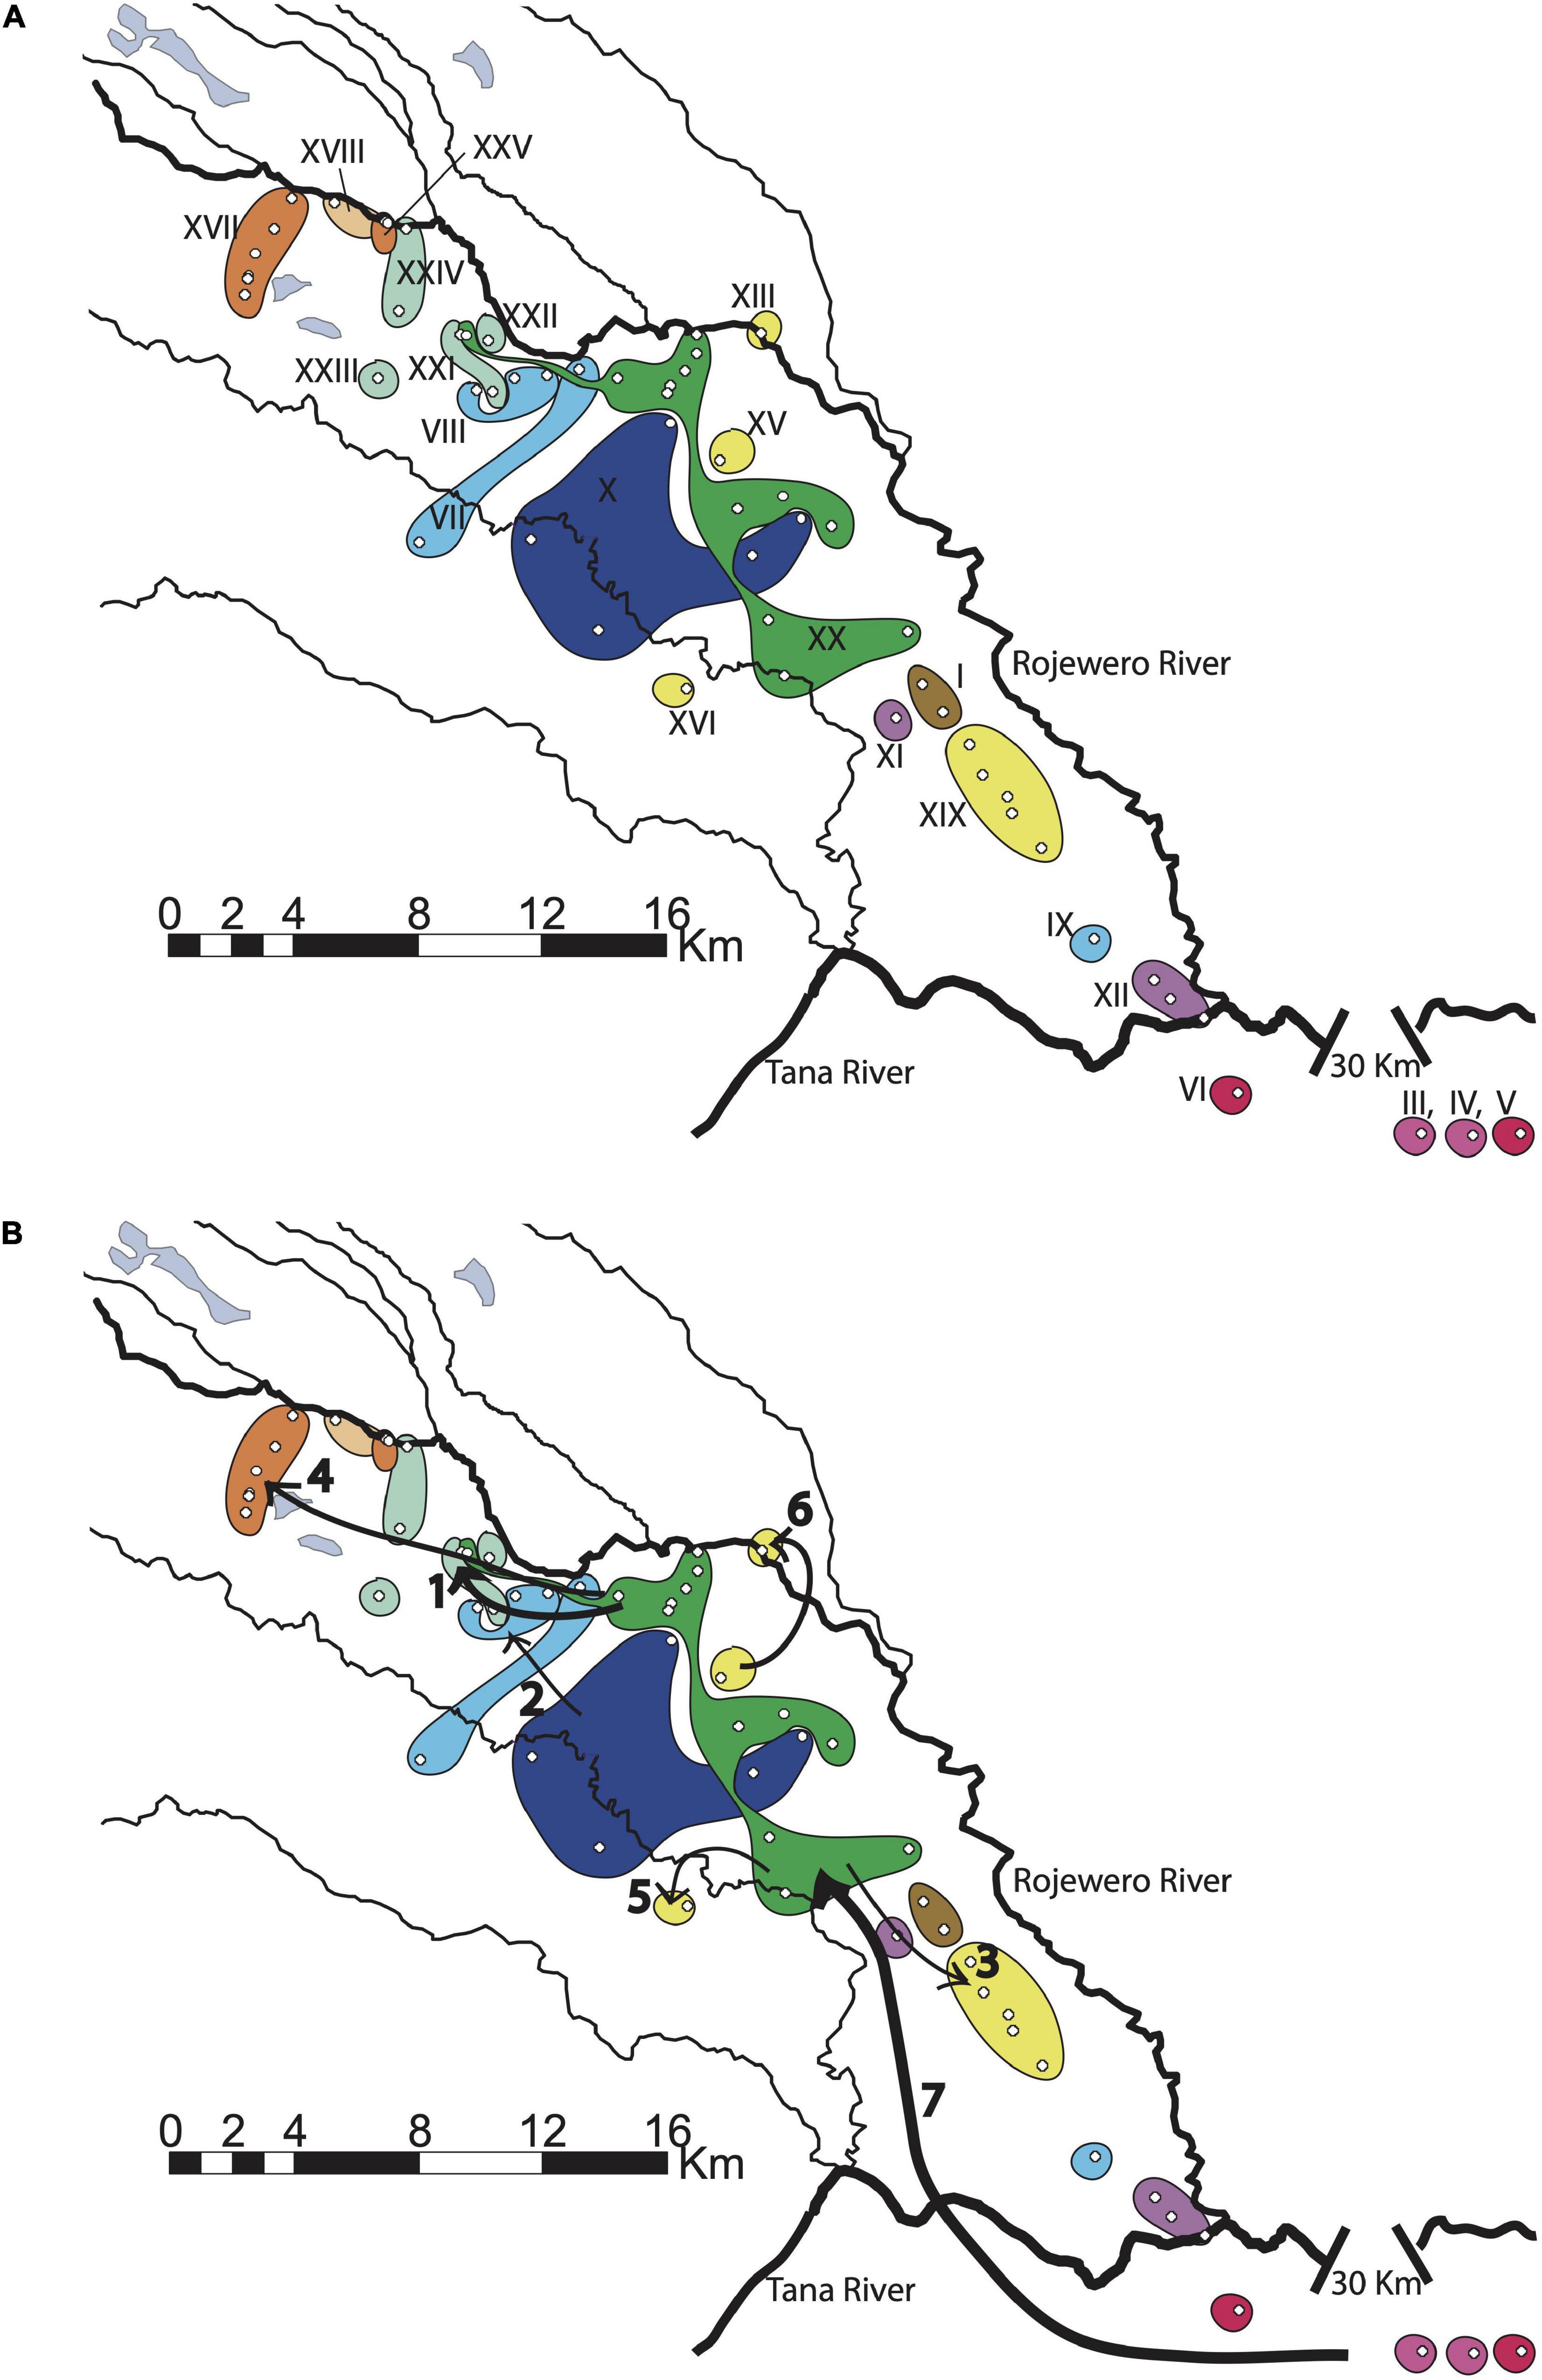
Figure 6. (A) Southern haplotype distributions with labels. (B) Significant historical inferences of the southern NCPA. Size of the arrows indicates the level of the nested clade, the larger the arrow the higher the nesting level. Arrows indicate the following inferences: 1: restricted gene-flow, 2: cannot discriminate fragmentation from restricted gene flow, 3: contiguous range-expansion, 4: long-distance colonization/fragmentation or fragmentation/range expansion, 5: allopatric fragmentation, 6: allopatric fragmentation, 7: allopatric fragmentation.
Northern clade network inferences
Nested clade phylogeographic analysis inferences with the most support (Table 1) are identified with arrows indicating the geographical areas where the event occurred (Figure 5B). We see evidence that restricted dispersal occurs within the larger areas between rivers. This is most clearly seen within the 1–1 clade (Figure 5B, arrows at numeral one). In addition, the following rivers have shown potential for being significant barriers to dispersal: the Kanjoo, Mutundu, and Murera. First, the Kanjoo was supported as a significant barrier through the high probability alternative configurations 1 through 3, which yield an allopatric fragmentation in the 2–1 clades with haplotype II originating from I (Figure 5B, arrow 2). Although this inference was significant in only half of the configurations (Figure 3A), this half consists of the configuration A1B1* (where * could be C1, C2, or C4) that collectively have a probability of 0.8892 compared to a probability of 0.1108 for the combined three non-significant networks. Second, the Mutundu River was supported as a significant barrier in all six networks, which yield allopatric fragmentation in the nested 3–1/3–4 clades involving haplotype XV originating from the 2-step clades of interior haplotype I or VII (Figure 5B, arrow 5). In addition, the Mutundu may also be responsible for yielding the inferences of fragmentation and long-distance colonization of the level 3 and 4 clades that included networks 2, 3, 4, and 5 with a collective probability of 0.6523 (Figure 5B, arrow 6). Third, the Murera River showed a very faint level of significance as a barrier due to the small number of samples collected on the eastern side. More thorough sampling may resolve the placement of the Murera colonies and whether the Murera River is correlated to a fragmentation event or not. However, the A1B1C1 high probability configuration and the lower probability A2B1C2 configuration did yield a significant inference of allopatric fragmentation involving the Murera haplotype XVI originating from the interior VII haplotype (Figure 5B, arrow 4), but the bulk of the probability mass over all network configurations was non-significant for fragmentation.
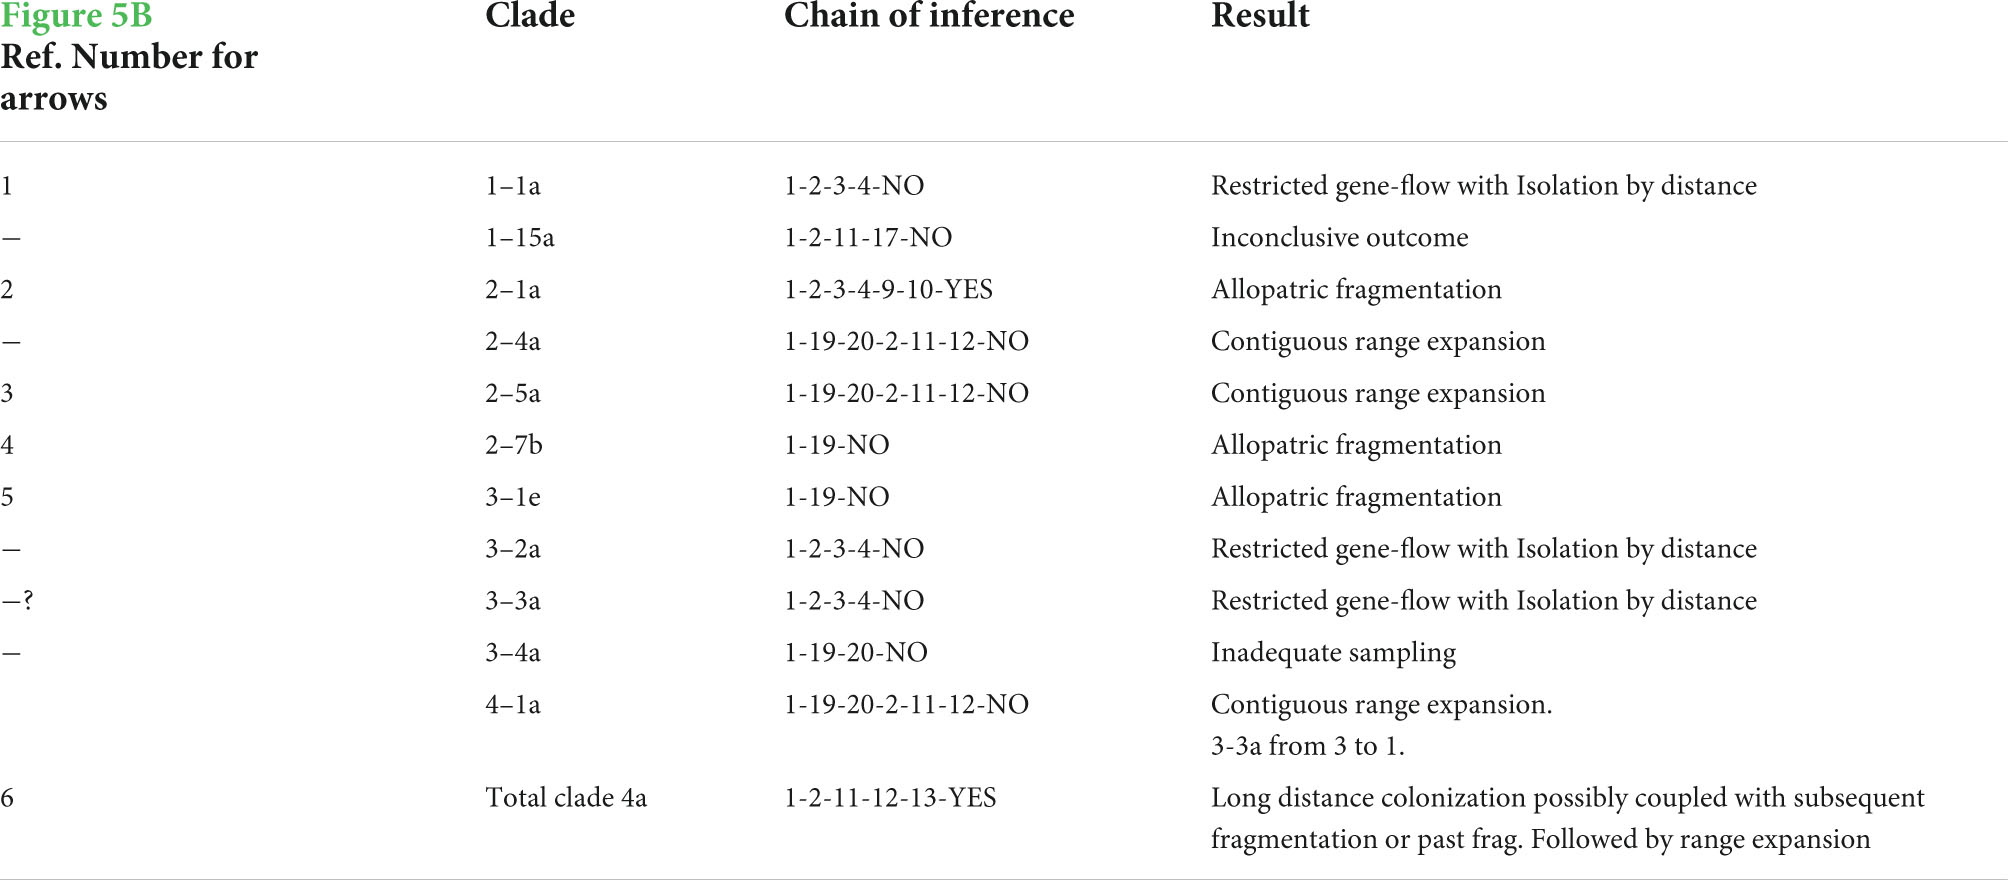
Table 1. Chain of inferences for configuration 5 (A1B1C1) of northern haplotype network.
Finally, a small range expansion between the site of the XI haplotype and its tip XII haplotype is inferred from all six networks (Figure 5B, arrow 3). However, the remaining inferences, such as the possible contiguous range expansion in the north (Figure 5B, arrow with “?”) and the contiguous range expansion from the eastern haplotypes colored in orange to the far northwestern haplotype in orange are still in question.
Significant inferences and alternative clades for the northern portion of our study area are discussed in more detail the Supplementary Material.
Southern clade
We found inferences of restricted dispersal in the southern clade of our study site concentrated around the middle of the region where the bulk of the distribution of the main haplotype XX is located (Table 2 and Figure 6A). From the interior XX haplotype, the 2–6 clade was inferred as a restricted dispersal/IBD event (Figure 6B, arrow 1). Also we see either fragmentation or IBD within the 1–10a clade (Figure 6B, arrow 2), which cannot be resolved without more sampling. Then we observe evidence that there may be contiguous range expansion (Figure 6B, arrow 3) and long-distance colonization (Figure 6B, arrow 4), respectively, to the southeast and northwest from the interior XX haplotype. Anecdotal support for an inference of long-distance colonization comes from our sampling data. We returned to areas in the south within the course of the season and to the northwest several times over 3 years without having success in capturing or finding signs of colony activity (i.e., colony volcanoes). In the south we hypothesized that excessive drying and hard soils may contribute to their absence and further to the northwest this absence may be due to the swampy conditions. However, we also have to consider that these absences may be a result of their location beyond a frontier population. The fact that very few colonies have crossed sides of the Rojewero supports this idea that the frontier is a new one. Finally, there is weak evidence based on single colonies that both the Kiolu River (Figure 6B, arrow 5) and Rojewero (Figure 6B, arrow 6) have experienced allopatric fragmentation events. However, we find strong evidence for a single fragmentation event that has split the north Tana and south Tana populations (Figure 6B, arrow 7). The Tana “split” is a much more recent fragmentation than the one presumed to have occurred between the populations north and south of the Rojewero. Based on the rooted phylogeny of these populations, the haplotypes in the southern network in our study were derived from the haplotypes found in southern Kenya at Ithumba and Athi. The northern network is sister to the Lewa and Lerata haplotypes.
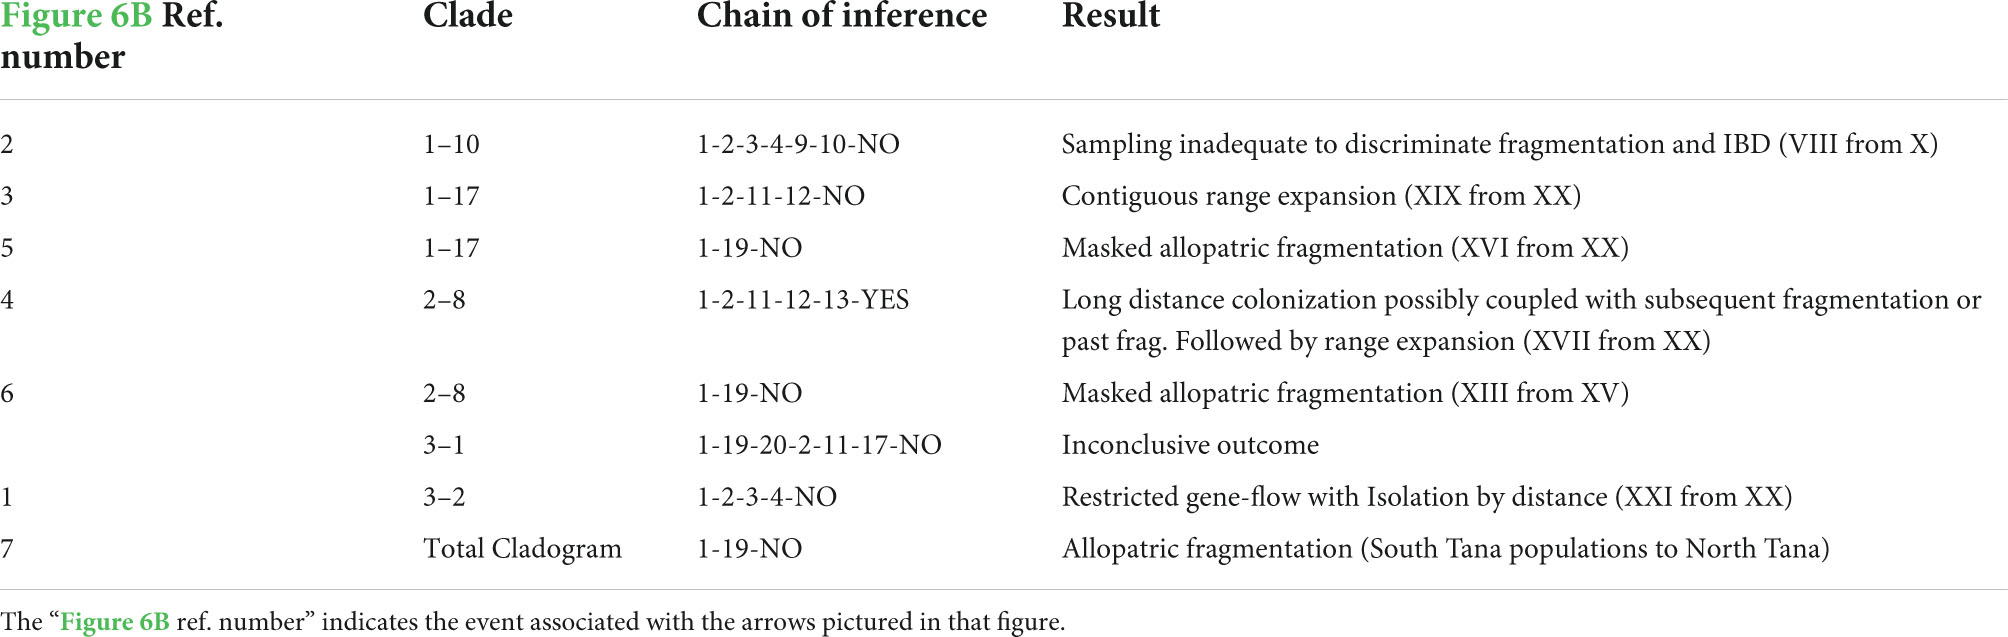
Table 2. Chain of inference for the Southern Haplotype Network configuration 1 (A1B1C1(D1)) that was the most reasonable.
Significant inferences and alternative clades for the southern portion of our study area are discussed in more detail the Supplementary Material.
Time estimation
The mutation rate in the mitochondrial control region is variable in mammals ranging from 3% in horses, 7–11% in primates, and 15% divergence in cape buffalo per million years (Slade et al., 1998; Van Hooft et al., 2002). To estimate the age of the two major fragmentation events in our study occurring between the northern and southern banks of the Tana and the opposite banks of the Rojewero, we used the extremes of this range of mutation rates to obtain a relative sense for the difference in time scale of the two events. Using the 3% sequence divergence per million years, we estimated that the fragmentation between the sides of the Rojewero occurred 0.695 MYA (95% C.I. = 0.217–1.45 MYA). In contrast we estimated the fragmentation event across the Tana River to have occurred 0.067 MYA (95% C.I. = 0.016–0.154). Alternatively using the 15% rate, we find these dates to be 0.139 MYA (95% C.I. = 0.043–0.289 MYA) and 0.013 MYA (95% C.I. = 0.003–0.031 MYA), respectively. The 95% confidence intervals of these date estimations are non-overlapping under both mutation rates, which is strong support that the fragmentation between the clades separated by the Rojewero is significantly older than the fragmentation across the Tana.
Riverine barrier effects on naked mole-rat population structure
We found support for the riverine barrier hypothesis (RBH) among one group of rivers in our study site. However, regarding the two largest rivers in this study, we found evidence for a more complicated history involving colonization and range expansion that did not fit a prediction of the RBH.
Our analyses testing associations of river size measures with pairwise sequence divergence as well as results from nested clade phylogeographical analysis (NCPA) did yield some support for the RBH. The river size measure, average discharge, had a consistent positive association with average pairwise sequence divergence which is concordant with one of the predictions RBH. Out of the other three river size measures, average river width also was found to have a significant positive association with sequence divergence, although only for the small rivers (i.e., excluding the Rojewero River). This result is similar to what Ayres and Cluttonbrock (1992) found in that both river width and discharge were discovered to fit an RBH prediction (these measures were negatively correlated with an index of similarity for primate fauna found on both banks of Amazonian rivers). Results from our NCPA on both the northern and southern area of our study site also supported the RBH by yielding six associations of fragmentation events with the presence of rivers. For the NCPA of our northern study area, fragmentation events were associated with the following three rivers: Kanjoo, Mutundu, and Murera. However, the Kanjoo and Murera fragmentation inferences were not robust in the context of the ambiguities in the haplotype network, although the Kanjoo was supported by the three most probable haplotype networks (a collective probability of 0.8892). In the case of the Murera, this inference had been based primarily on one colony, and additional sampling was recommended by the NCPA inference key to fill in gaps in sampling. The amount of pairwise sequence divergence between populations separated by a river may be partly responsible for the robustness of NCPA fragmentation inferences, because both the Mutundu and Murera had significantly larger sequence divergence as compared to Mukutano, Kanjoo, Bwatherongi, and Mulika rivers. In the NCPA of our southern study area, we found significant inferences of allopatric fragmentation associated with the Kiolu Sand, Rojewero, and Tana rivers. In this case, because the southern network was analyzed separately from the northern network, the inference involving the Rojewero in an allopatric fragmentation does not pertain to the enormous split separating the two networks but instead is based on a single colony on the north bank of the Rojewero that is assumed to have crossed recently. Likewise, the Kiolu had a single colony isolated on the south bank. In both these cases, additional sampling is required to strengthen the inference. The Tana River yielded a very robust inference of allopatric fragmentation.
Potential riverine barrier effects can be outweighed by historical events
Many studies have had mixed results fitting observed genetic patterns to RBH predictions. In other rodent species there was a lack of strong evidence linking rivers as barriers using the historical perspective afforded by sequence data (Patton et al., 1994, 1996; Matocq et al., 2000; Roratto et al., 2015; Mizerovská et al., 2019). In other taxa the potential isolating effect of rivers was found to be superseded by other factors, such as the presence of ancient ridges [(frog species) Gascon et al., 2000; Lougheed et al., 1999] and movement of a glacier [(shrew species) Lugon-Moulin et al., 1999]. Similar in the way these studies failed to support the RBH, we also found genetic results that do not fit an RBH prediction. The Tana and Rojewero are the two largest rivers in our study site in terms of discharge and they also differ significantly in size from each other. The Tana is the largest river in Kenya with a discharge average (234 cumecs) and is almost two orders of magnitude greater than the Rojewero (3.7 cumecs). However, these rivers violate the RBH prediction that river size should be positively associated with pairwise sequence divergence, because the smaller Rojewero River yielded a significantly greater sequence divergence than the Tana (0.01991 vs. 0.0059, respectively, p-value < 0.00001). According to date estimators and the 95% C.I. based on a log likelihood test, the fragmentation correlated with the Rojewero is a significantly older event than the fragmentation correlated with the Tana. However, the fact that the older fragmentation is associated with the presence of the smaller Rojewero river does not necessarily mean that the Rojewero river has been the barrier solely responsible for that fragmentation event. On the contrary, results from a phylogeny and haplotype network we constructed which combines both haplotypes from our study and previously published haplotypes from Faulkes et al. (1997a) supports our hypothesis that the naked mole-rat population inhabiting the region bordered by the Rojewero to the north and the Tana to the south has most likely been part of a relatively recent migration originating from populations south of the Tana River. This evidence is based on the fact that haplotypes from the southern portion of the naked mole-rat species distribution (Ithumba and Athi) are connected to the basal most nodes in our phylogeny, and southern haplotypes (Mutomo and Mtito Andei) are sister with our southern Tana haplotypes, indicating that our southern Rojewero population may more recently derived. NCPA show range expansion and long-distance dispersal into the area just south of the Rojewero and anecdotal evidence indicates this area is a frontier of new colonies (Much of this area is still devoid of naked mole-rat colonies despite what seems to be suitable habitat). Therefore, from all these lines of evidence, we hypothesize that the Rojewero is a meeting point of relatively old northern and southern lineages of the Kenyan lineage of naked mole-rats.
The large fragmentation event was first detected by Honeycutt et al. (1991) using restriction fragment analysis of mitochondrial DNA from colonies collected at three sites (Samburu, Mbuvu, and Mtito Andei). Samburu is geographically very close to our Lewa Downs colonies and similarly Mbuvu is close to our Mutomo samples. Honeycutt et al. (1991) showed that average nucleotide sequence divergence between Samburu and Mtito Andei and Samburu and Mbuvu was much higher (5.4%) than the divergence between Mtito Andei and Mbuvu (0.4%). This result is very similar to our findings in which Mtito Andei and Mutomo were different by 0.4–0.8%, while the sequence divergence between Mtito Andei and Lewa Downs was 3% and Mutomo to Lewa, 2.7–2.8%. So although the discovery of this large genetic break is not novel, resolving the break to a fine separation along the banks of the relatively small Rojewero is a significant finding.
Potential for glacial cycles that fragmented naked mole-rat populations
Unfortunately, until we have an accurate mutation rate for our species, we cannot conclude much from the dating estimates by way of associating fragmentation events with paleoclimactic changes or catastrophic events. However, it should be noted that East Africa has experienced four glacial cycles within the past 400,000 years (DeMenocal, 1995). These cycles have been associated with changes in the ranges of savannah and woodland areas that have in turn affected the displacement of the mammals adapted to these habitats (Vrba, 1992). Naked mole-rats occupy the space of their tunnels more like a plant occupies space and movement is mostly by the reproductive/dispersive phase of the life cycle. Hence they are even more impacted by glaciation or other climatic shifts that the ungulates and primate discussed by Vrba (1992). Further, Zemlemerova et al. (2021) performed a calibration method and dated a greater divergence (Middle Pleistocene; ca. 1.4–0.8 Mya) between naked mole-rat lineages from East Ethiopia and South Ethiopia/North Kenya; their dataset provided context for the timing of divergence in our dataset since their contained representatives of the northern and southern lineages (Lewa and Mtito Andei). This context makes it likely that the timing of the divergence of the northern and southern lineages in our study occurred more recently than the Middle Pleistocene, which is supported by the estimate that resulted using 3% sequence divergence per million years (ca. 0.695 MYA). In general, the Pleistocene climatic cycles have been suggested to play a large role shaping genetic structure of East African rodents (e.g., Aghová et al., 2017, 2019).
Naked mole-rat population structure mysteries remain
Despite the lines of evidence that we summarized supporting our hypotheses, a couple of mysteries remain. First, the haplotypes from Lerata prevent us from concluding that there is one contact zone centered at the Rojewero River where relatively ancient northern and southern lineages meet. Lerata is north of our study site and contains both northern and southern haplotypes. Lerata colonies 2 and 3 and Lerata colonies 1 and 4 are more closely related to the northern and southern haplotype groups, respectively. It is possible a west-to-east fragmentation may have occurred or alternatively one of the following may be true: Lerata haplotypes may include an ancient polymorphism in the Lerata population or there was a recent translocation or contamination of samples. Second, the haplotype from Mtito Andei located at the extreme southern end of the naked mole-rat distribution is more similar to the haplotypes in our study (South of Tana) than to haplotypes from colonies geographically closer to it at Ithumba and Athi. We simply do not have sufficient sampling to resolve these mysteries. The high degree of genetic structure exhibited by this species requires fine scale sampling (perhaps just slightly coarser than the present study) across the entire species distribution. Additional support for our conclusions may be found by studying other rodent species living in the same areas. Gerbils (Gerbillus harwoodi), spiny mice (Acomys wilsoni), and elephant shrews (Galegeeska rufescens) are all present in sufficient density for a population genetic survey (Alibhai and Key, 1985). Alternatively, a species of tenebrionid beetle, Paoligena heterocephaloides, which cohabitates and may even have a mutualistic relationship with naked mole-rats, would be another option to explore for correspondence in population structure. These beetles have wings, but have never been found outside of naked mole-rat burrows (Penrith, 1982).
Concluding remarks
There are multiple forces at work shaping population structure of naked mole-rats. Faulkes et al. (1997b) has highlighted isolation by distance from the limited dispersal of naked mole-rats as one of the main reasons for the increased genetic distance with geographical distance. A closer look has shown us that at fine scales riverine barriers and historical events may play a profound role in this effect. Our study uncovered a complexity of population genetic patterns that we used to infer range expansion, fragmentation, and restricted dispersal across the range of this species. This study underscores the importance of using a phylogenetic component to elucidate the likely historical events giving rise to current patterns of genetic variation before estimating population-genetic statistics such as relatedness. Without the historical perspective conclusions regarding the other processes such as mate choice that are involved in shaping the pattern of population structure can be misleading.
Data availability statement
The raw data supporting the conclusion of this article will be made available by the authors, without undue reservation.
Ethics statement
The animal study was reviewed and approved by the Research Office of the President of Kenya, 15C/116.
Author contributions
JH contributed to the collection of samples, molecular analysis, data analysis, and writing of the manuscript. SB contributed to the collection of samples and writing of the manuscript. CI contributed to writing of the manuscript. AT contributed to data analysis and writing of the manuscript. All authors contributed to the article and approved the submitted version.
Funding
Thanks to the Saint Louis Zoo for supporting this project through an FRC Grant to JH and SB.
Acknowledgments
We are grateful to the efforts and skills of Nathan Mathuku and Job Khaemba that made this extensive field collection possible. We also thank the reviewers for their collective knowledge and suggestions to improve earlier drafts of this manuscript.
Conflict of interest
The authors declare that the research was conducted in the absence of any commercial or financial relationships that could be construed as a potential conflict of interest.
The reviewer HB declared a past co-authorship with one of the author, SB to the handling editor.
Publisher’s note
All claims expressed in this article are solely those of the authors and do not necessarily represent those of their affiliated organizations, or those of the publisher, the editors and the reviewers. Any product that may be evaluated in this article, or claim that may be made by its manufacturer, is not guaranteed or endorsed by the publisher.
Supplementary material
The Supplementary Material for this article can be found online at: https://www.frontiersin.org/articles/10.3389/fevo.2022.857660/full#supplementary-material
References
Aghová, T., Palupèíková, K., Šumbera, R., Frynta, D., Lavrenchenko, L. A., Meheretu, Y., et al. (2019). Multiple radiations of spiny mice (Rodentia: Acomys) in dry open habitats of Afro-Arabia: evidence from a multi-locus phylogeny. BMC Evol. Biol. 19:69. doi: 10.1186/s12862-019-1380-9
Aghová, T., Sumbera, R., Pialek, L., Mikula, O., McDonough, M., Lavrenchenko, L., et al. (2017). Multilocus phylogeny of East African gerbils (Rodentia, Gerbilliscus) illunimates the history of the Somali-Masai savanna. J. Biogeogr. 44, 2295–2307.
Aleixo, A. (2004). Historical diversification of a Terra-firme forest bird superspecies: a phylogeographic perspective on the role of different hypotheses of Amazonian diversification. Evolution 58, 1303–1317. doi: 10.1111/j.0014-3820.2004.tb01709.x
Alibhai, S. K., and Key, G. (1985). A preliminary investigation of small mammal biology in the Kora National Reserve. Kenya. J. Trop. Ecol. 1, 321–327.
Allen, K. E., Greenbaum, E., Hime, P. M., Tapondjou, W. P. N., Sterkhova, V. V., Kusamba, C., et al. (2021). Rivers, not refugia, drove diversification in arboreal, sub- Saharan African snakes. Ecol. Evol. 11, 6133–6152. doi: 10.1002/ece3.7429
Ayres, J. M., and Cluttonbrock, T. H. (1992). River boundaries and species range size in amazonian primates. Am. Naturalist 140, 531–537. doi: 10.1086/285427
Braude, S. (2000). Dispersal and new colony formation in wild naked mole-rats: evidence against inbreeding as the system of mating. Behav. Ecol. 11, 7–12.
Braude, S., and Ciszek, D. (1998). Survival of naked mole-rats marked by implantable transponders and toe-clipping. J. Mammal. 79, 360–363.
Brett, R. A. (1991). “The population structure of naked mole-rat colonies,” in The Biology of the Naked Mole-Rat, eds P. W. Sherman, U. M. Jarvis, and R. D. Alexander (Princeton, NJ: Princeton University Press).
Capparella, A. P. (1988). Genetic variation in neotropical birds: implications for the speciation process. Acta Congressus Int. Ornithol. 19, 1658–1664.
Ciszek, D. (2000). New colony formation in the “highly inbred” eusocial naked mole-rat: outbreeding is preferred. Behav. Ecol. 11, 1–6.
Clement, M., Posada, D., and Crandall, K. A. (2000). TCS: a computer program to estimate gene genealogies. Mol. Ecol. 9, 1657–1659. doi: 10.1046/j.1365-294x.2000.01020.x
Crandall, K. A., and Templeton, A. R. (1993). Empirical tests of some predictions from coalescent theory with applications to intraspecific phylogeny reconstruction. Genetics 134, 959–969. doi: 10.1093/genetics/134.3.959
DeMenocal, P. B. (1995). Plio-pleistocene African climate. Science, 270, 53–59. doi: 10.1126/science.270.5233.53
Davis, S. K. (1986). Population Structure and Patterns of Speciation in Geomys (Rodentia:Geomyidae): An Analysis Using Mitochondrial and Ribosomal DNA. Ph.D. dissertation, St. Louis, MO: Washington University.
de Fraga, R., and Carvalho, V. T. (2021). Testing the Wallace’s riverine barrier hypothesis based on frog and Squamata reptile assemblages from a tributary of the lower Amazon River. Stud. Neotropical Fauna Environ.
ESRI (2003). ArcGIS Geographic Information System (GIS). Redlands: Environmental Systems Research, Inc.
Faulkes, C. G., Abbott, D. H., and Mellor, A. L. (1990). Investigation of genetic diversity in wild colonies of naked mole-rats (Heterocephalus-Glaber) by DNA fingerprinting. J. Zool. 221, 87–97.
Faulkes, C. G., Abbott, D. H., Obrien, H. P., Lau, L., Roy, M. R., Wayne, R. K., et al. (1997a). Micro- and macrogeographical genetic structure of colonies of naked mole-rats Heterocephalus glaber. Mol. Ecol. 6, 615–628. doi: 10.1046/j.1365-294x.1997.00227.x
Faulkes, C. G., Bennett, N. C., Bruford, M. W., Obrien, H. P., Aguilar, G. H., and Jarvis, J. U. M. (1997b). Ecological constraints drive social evolution in the African mole-rats. Proc. R. Soc. London Series B-Biol. Sci. 264, 1619–1627.
Faulkes, C. G., Verheyen, E., Verheyen, W., Jarvis, J., and Bennett, N. (2004). Phylogeographical patterns of genetic divergence and speciation in African mole-rats (Family: Bathyergidae). Molec. Ecol. 13, 613–629. doi: 10.1046/j.1365-294x.2004.02099.x
Gascon, C., Malcolm, J. R., Patton, J. L., da Silva, M. N. F., Bogart, J. P., Lougheed, S. C., et al. (2000). Riverine barriers and the geographic distribution of Amazonian species. Proc. Natl. Acad. Sci. U S A. 97, 13672–13677. doi: 10.1073/pnas.230136397
Goudie, A. S., Pye, K., and Watson, A. (1986). “The physical geography of Kora,” in Kora: An Ecological Inventory of the Kora National Reserve, Kenya. eds M. Coe and N. M. Collins (London: Royal Geographical Society).
Hickman, G. C., Nevo, E., and Heth, G. (1983). Geographic variation in the swimming ability of Spalax ehrenbergi (Rodentia: Spalacidae). Israel J. Biogeography 10, 29–36.
Honeycutt, R. L. K., Schlitter, N., and Sherman, D. A. P. W. (1991). “Genetic variation within and among populations of the naked mole-rat: evidence from nuclear and mitochondrial genomes,” in The Biology of the Naked Mole-Rat, eds P. W. J. Sherman, J. U. M. Jarvis, and R. D. Alexander (Princeton, NJ: Princeton University Press).
Ingram, C., Troendle, N., Gill, C., Braude, S., and Honeycutt, R. (2015). Challenging the inbreeding hypothesis in a eusocial mammal: population genetics of the naked mole-rat, Heterocephalus glaber. Mol. Ecol. 24, 4848–4865. doi: 10.1111/mec.13358
Jarvis, J. U. M. (1985). Ecological studies on Heterocephalus glaber, the naked mole-rat, in Kenya. Natl. Geographic Soc. Res. Rep. 20, 429–437.
Kimura, M. (1970). The length of time required for a selectively neutral mutant to reach fixation through random frequency drift in a finite population. Genet. Res. 15, 131–133. doi: 10.1017/s0016672300001439
Kopuchian, C., Campagna, L., Lijtmaer, D. A., Cabanne, G. S., García, N. C., Lavinia, P. D., et al. (2020). A test of the riverine barrier hypothesis in the largest subtropical river basin in the Neotropics. Mol. Ecol. 29, 2137–2149. doi: 10.1111/mec.15384
Lougheed, S. C., Gascon, C., Jones, D. A., Bogart, J. P., and Boag, P. T. (1999). Ridges and rivers: a test of competing hypotheses of Amazonian diversification using a dart-poison frog (Epipedobates femoralis). Proc. R. Soc. London Series B-Biol. Sci. 266, 1829–1835. doi: 10.1098/rspb.1999.0853
Lugon-Moulin, N., Brunner, H., Balloux, F., Hausser, J., and Goudet, J. (1999). Do riverine barriers, history or introgression shape the genetic structuring of a common shrew (Sorex araneus) population? Heredity 83, 155–161.
Matocq, M. D., Patton, J. L., and da Silva, M. N. F. (2000). Population genetic structure of two ecologically distinct Amazonian spiny rats: separating history and current ecology. Evolution 54, 1423–1432. doi: 10.1111/j.0014-3820.2000.tb00574.x
Mizerovská, D., Nicolas, V., Demos, T. C., Akaibe, D., Colyn, M., Denys, C., et al. (2019). Genetic variation of the most abundant forest-dwelling rodents in Central Africa (Praomys jacksoni complex): evidence for Pleistocene refugia in both montane and lowland forests. J. Biogeography 46, 1466–1478.
Nicolas, V., Jacquet, F. F. F., Hutterer, R., Konecny, A., Kouassi, S. K., Durnez, L., et al. (2019). Multilocus phylogeny of the Crocidura poensis species complex (Mammalia, Eulipotyphla): influences of thepalaeoclimate on its diversification and evolution. J. Biogeography 46, 871–883.
Nicolas, V., Missoup, A. D., Denys, C., Peterhans, J. K., Katuala, P., Couloux, A., et al. (2011). The roles of rivers and Pleistocene refugia in shaping genetic diversity in Praomys misonnei in tropical Africa. J. Biogeography 38, 191–207.
Oriain, M. J., Jarvis, J. U. M., and Faulkes, C. G. (1996). A dispersive morph in the naked mole-rat. Nature 380, 619–621.
Panchal, M., and Beaumont, M. A. (2010). Evaluating nested clade phylogeographic analysis under models of restricted gene flow. Systematic Biol. 59, 415–432.
Patton, J. L., Dasilva, M. N. F., and Malcolm, J. R. (1994). Gene genealogy and differentiation among arboreal spiny rats (Rodentia, Echimyidae) of the amazon basin - a test of the riverine barrier hypothesis. Evolution 48, 1314–1323. doi: 10.1111/j.1558-5646.1994.tb05315.x
Patton, J. L., DaSilva, M. N. F., and Malcolm, J. R. (1996). Hierarchical genetic structure and gene flow in three sympatric species of Amazonian rodents. Mol. Ecol. 5, 229–238. doi: 10.1111/j.1365-294x.1996.tb00310.x
Penrith, M.-L. (1982). A new species of paoligena (Coleoptera: Tenebrionidae: Strongyliini) from Kenya. Ann. Transvaal Museum 33, 291–298.
Posada, D., Crandall, K. A., and Templeton, A. R. (2000). GeoDis: a program for the cladistic nested analysis of the geographical distribution of genetic haplotypes. Mol. Ecol. 9, 487–488. doi: 10.1046/j.1365-294x.2000.00887.x
Rathert, D. (2003). Raster2xyz. Pp. Converts a Single-band Raster (GRID or image) to an ASCII Delimited text file of X,Y, and Z values. Provides Options for Delimiters and Headers and for Floating Point or Integer Output. Anchorage, AK.
Reeve, H. K., Westneat, D. F., Noon, W. A., Sherman, P. W., and Aquadro, C. F. (1990). DNA fingerprinting reveals high-levels of inbreeding in colonies of the eusocial naked mole-rat. Proc. Natl. Acad. Sci. U S A. 87, 2496–2500. doi: 10.1073/pnas.87.7.2496
Roratto, P., Fernandes, F., and deFreitas, T. R. O. (2015). Phylogeography of the subterranean rodent Ctenomys torquatus: an evaluation of the riverine barrier hypothesis. J. Biogeogr. 42, 694–705.
Sick, H. (1967). “Rios e enchentes na Amazonia como obstaculo para a avifauna,” in Atas do Simposio Sobre a Biota Amazonica, ed. H. Lent (Rio de Janeiro: Conselho de Pesquisas).
Slade, R. W., Moritz, C., Hoelzel, A. R., and Burton, H. R. (1998). Molecular population genetics of the southern elephant seal Mirounga leonina. Genetics 149, 1945–1957. doi: 10.1093/genetics/149.4.1945
Steinberg, E. K., and Patton, J. L. (2000). “Genetic structure and the geography of speciation in subterranean rodents: opportunities and constraints for evolutionary diversification,” in Life Underground, eds E. A. Lacey, J. L. Patton, and G. N. Cameron (Chicago, IL: The University of Chicago Press).
Templeton, A. R. (2003). “A maximum likelihood framework for cross validation of phylogeographic hypotheses,” in Evolutionary Theory and Processes: Modern Horizons, ed. S. P. Wasser (Netherlands: Kluwer Academic Publishers).
Templeton, A. R. (2004). Statistical phylogeography: methods of evaluating and minimizing inference errors. Mol. Ecol. 13, 789–809. doi: 10.1046/j.1365-294x.2003.02041.x
Templeton, A. R. (2009). Why does a method that fails continue to be used: the answer. Evolution 63, 807–812.
Templeton, A. R. (2015). “Population biology and population genetics of pleistocene hominins,” in Handbook of Paleoanthropology, eds W. Henke and I. Tattersall (Heidelberg: Springer).
Templeton, A., and Sing, C. (1993). A cladistic analysis of phenotypic associations with haplotypes inferred from restriction endonuclease mapping. IV. Nested analyses with cladogram uncertainty and recombination. Genetics 134, 659–669. doi: 10.1093/genetics/134.2.659
Templeton, A. R., Boerwinkle, E., and Sing, F. (1987). A cladistic analysis of phenotypic associations with haplotypes inferred from restriction endonuclease mapping. I. basic theory and an analysis of alcohol dehydrogenase activity in Drosophila. Genetics 117, 343–351. doi: 10.1093/genetics/117.2.343
Templeton, A. R., Crandall, K. A., and Sing, C. F. (1992). A cladistic analysis of phenotypic associations with haplotypes inferred from restriction endonuclease mapping and DNA sequence data. III. cladogram estimation. Genetics 132, 619–633. doi: 10.1093/genetics/132.2.619
Templeton, A. R., Routman, E., and Phillips, C. (1995). Separating population structure from population history: a cladistic analysis of the geographical distribution of mitochondrial DNA haplotypes in the Tiger Salamander, Ambystoma tigrinum. Genetics 140, 767–782. doi: 10.1093/genetics/140.2.767
Van Hooft, W. F., Groen, A. F., and Prins, H. T. (2002). Phylogeography of the African buffalo based on mitochondrial and Y-chromosomal loci: pleistocene origin and population expansion of the Cape buffalo subspecies. Mol. Ecol. 11, 267–279. doi: 10.1046/j.1365-294x.2002.01429.x
Voelker, G., Marks, B. D., Kahindo, C., A’genonga, U., Bapeamoni, F., Duffie, L. E., et al. (2013). River barriers and cryptic biodiversity in an evolutionary museum. Ecol. Evol. 3, 536–545. doi: 10.1002/ece3.482
Keywords: phylogeography, nested clade analysis, isolation-by-distance, fragmentation, genetic structure, river, naked mole-rat
Citation: Hess J, Braude S, Ingram C and Templeton A (2022) Population genetics of the naked mole-rat Heterocephalus glaber: The role of rivers in shaping genetic structure. Front. Ecol. Evol. 10:857660. doi: 10.3389/fevo.2022.857660
Received: 18 January 2022; Accepted: 25 July 2022;
Published: 18 August 2022.
Edited by:
Mingbo Yin, Fudan University, ChinaReviewed by:
Hynek Burda, University of Duisburg-Essen, GermanyJosef Bryja, Academy of Sciences of the Czech Republic (ASCR), Czechia
Copyright © 2022 Hess, Braude, Ingram and Templeton. This is an open-access article distributed under the terms of the Creative Commons Attribution License (CC BY). The use, distribution or reproduction in other forums is permitted, provided the original author(s) and the copyright owner(s) are credited and that the original publication in this journal is cited, in accordance with accepted academic practice. No use, distribution or reproduction is permitted which does not comply with these terms.
*Correspondence: Stan Braude, YnJhdWRlQHd1c3RsLmVkdQ==