 Kaikai Dong
 Zhaoli Liu2*
 Guanglei Hou
95% of researchers rate our articles as excellent or good
Learn more about the work of our research integrity team to safeguard the quality of each article we publish.
Find out more
ORIGINAL RESEARCH article
Front. Ecol. Evol. , 04 April 2022
Sec. Conservation and Restoration Ecology
Volume 10 - 2022 | https://doi.org/10.3389/fevo.2022.855453
This article is part of the Research Topic Theories, Methods, and Practices of Wetland Degradation and Restoration View all 17 articles
The effective allocation of funds is of significant importance for biodiversity conservation, but there is currently no scientific method for comparing the effectiveness of biodiversity conservation across different regions. Existing studies omit differences in the ecological background, such as the terrain, climate, hydrology, soil, and ecosystem, or do not differentiate between the impacts caused by humans and nature. To address these limitations, we take habitat quality as a proxy for biodiversity and quantify the human-induced habitat quality changes as a means of measuring the efforts of management departments, with the background differences eliminated using a reference condition index. The method is applied to the San Jiang Plain Wetlands and Northwest Tibet Qiang Tang Plateau Biodiversity National Key Ecological Function Region in China. The results show that the effects of human activities on habitat improvement or degradation are overestimated or underestimated if there is no differentiation between human and natural causes. Human-induced habitat quality changes broadly reflect the human efforts toward biodiversity conservation. By considering the human efforts and background differentiation, the proposed method allows the effectiveness of biodiversity conservation to be compared across different regions. This study provides a scientific reference for China’s transfer payment policy and for the biodiversity funds allocated in other countries. Furthermore, our results will guide the practice of improving habitat quality and biodiversity.
As a highly effective tool for biodiversity conservation, protected areas (PAs) have expanded rapidly around the globe, and currently cover 15% of the terrestrial surface (UNEP-WCMC et al., 2020). However, habitat loss and degradation in PAs remain serious areas of concern (Almond et al., 2020). One important reason is the scarcity of funds and resources (Coad et al., 2019; Reed et al., 2020). Generally, when more funds and resources are allocated for PAs, the effects of biodiversity conservation are more effective better. However, such funds are limited, which greatly restricts the protection effects. Therefore, the effective allocation of funds is a key issue in biodiversity conservation (Coad et al., 2019).
The most effective means of allocating funds is particularly important in China. To improve the national biodiversity level, China has designated several key ecological function regions, which are types of PAs (Fan et al., 2012). The Ministry of Ecology and Environment measures the protection work of local government management departments by quantitatively assessing the effectiveness of biodiversity conservation, and then takes actions such as administrative management, policy changes, and capital investment. Specifically, the central government provides transfer payment after measuring the biodiversity conservation efforts made by the management of these ecological function regions (Zheng et al., 2019). Those regions that have made greater efforts are rewarded with more funds, whereas those that have made lesser efforts may have funds deducted. Therefore, it is imperative to develop a method that can be used to compare the biodiversity conservation efforts between different ecological function regions.
To date, most assessment studies for biodiversity conservation effectiveness have focused on a single PA, such as in before–after comparisons (Liu et al., 2001; Gaveau et al., 2007), inside–outside comparisons, and matching comparisons (Andam et al., 2008; Joppa and Pfaff, 2011; Geldmann et al., 2019; Terraube et al., 2020). For example, Gaveau et al. (2007) compared the deforestation rates inside and outside PAs in Sumatra, while Geldmann et al. (2019) assessed the effectiveness of PAs at resisting anthropogenic pressures using matching analysis. Different from the above, Zheng et al. (2012) used key species numbers, endangered species numbers, and rare species numbers to compare the effectiveness of biodiversity conservation between different national wetland nature reserves in China. However, this evaluation could not reflect the true differences among protection effectiveness because there was no background differentiation between the ecological environment in different regions. For example, they gave the Sanjiangyuan nature reserve a poor conservation effectiveness grade just because its low ecological background, this result was not convincing and cannot stimulate the enthusiasm for the related management department. Furthermore, differences in ecological background can also lead to obvious differences in the difficulty of conducting ecological construction and protection, and the need for funds (Liu et al., 2020). For example, the afforestation cost in the western area of the Hexi Corridor in Gansu Province is as high as $4722 per hectare because of the fragile natural ecological environment, whereas the afforestation cost in Ergun, Inner Mongolia, is only $1416 per hectare because of its superior natural condition (Liu et al., 2017). The assessment results cannot be applied in practice without considering these differences.
To eliminate ecological background differentiation, Dong et al. (2018) developed a method of comparing the effectiveness of biodiversity conservation between different regions. They selected national natural reserves inside biodiversity ecological function regions as reference areas, and used the habitat quality of these reference areas as reference conditions reflecting the biological background. The degree of difference between the habitat quality of the ecological function region and its corresponding reference condition was then used to measure the effectiveness of biodiversity conservation between different regions. Although this approach successfully eliminates the ecological background differentiation, it does not differentiate between human-induced and nature-induced habitat change. When the central government transfers funding, human efforts should only be used to compare the effectiveness of biodiversity conservation. Here, human efforts include both positive impacts (ecological restoration) and negative human impacts (crop expansion and urbanization) on biodiversity. If natural processes are incorporated, the assessment results will be biased. Therefore, it is imperative to develop a method that considers both human efforts and ecological background differentiation.
In this study, we take the San Jiang Plain Wetlands (SJPW) and Northwest Tibet Qiang Tang Plateau Biodiversity National Key Ecological Function Region as study areas, and compare the effectiveness of biodiversity conservation from 1990–2018 by considering both human efforts and ecological background differences. The main objectives were as follows: (1) construct a human-induced habitat quality change index to measure human efforts on biodiversity conservation; (2) develop a method for comparing the effectiveness of biodiversity conservation across different regions. Our study provides a scientific reference for national transfer payment.
The SJPW and Northwest Tibet Qiang Tang Plateau (NTQTP) Biodiversity National Key Ecological Function Region were chosen as study areas (Figure 1). SJPW (45°0′57″–48°27′47″N, 129°29′52″–135°5′12″E) is located in the downstream area of the Songhua River near the confluence with Wusuli River in Heilongjiang Province. It extends over seven counties and has a total area of 48,000 km2. There are many national nature reserves in the district, such as Dongfanghong Wetlands National Nature Reserve. More than 150 species of rare birds inhabit the area, including eight first-class protected animals such as red-crowned cranes and white storks. The area has a temperate humid and semi-humid continental monsoon climate, with an average annual rainfall of 500–650 mm and an average temperature of 1.4–4.3°C. From 2015–2018, the land-use changes induced by crop expansion, urbanization, and land degradation covered 4824, 102, and 1 km2, respectively. Land-use changes induced by ecological restoration covered 590 km2. Therefore, SJPW is still suffering from intensive positive and negative human impacts.

Figure 1. Locations of study areas.
Northwest Tibet Qiang Tang Plateau is located in the northwestern part of the Tibet Autonomous Region, covering five counties and extending over a total area of 490,000 km2. Selincuo and Qiangtang National Nature Reserves lie inside this district. Several rare and endemic species inhabit the region, such as the Tibetan antelope, Tibetan wild donkey, and wild yak. The area belongs to the climate region of the Qinghai–Tibet Plateau, with an average annual rainfall of 100–300 mm, an average annual temperature of less than 0°C, and an average temperature of less than −10°C in the coldest month. From 2015 to 2018, land-use changes induced by land degradation and ecological restoration covered 1,261 and 1,684 km2, respectively; there was no crop expansion and only 3 km2 of urbanization-induced land-use changes.
In summary, there are obvious differences between the two regions in terms of the protection target species and environmental factors such as terrain, climate, hydrology, and soil. The positive/negative human impacts in the two regions are also different. We therefore chose these two regions as our study areas.
For this study, land use data from 1980, 1990, 1995, 2000, 2005, 2010, 2015, and 2018 with a spatial resolution of 1,000 m was downloaded from the Resource and Environmental Science and Data Center of China. The data were transformed and resampled from a vector format, which was produced by manual digitalization with a scale of 1:10,0000. The total classification accuracy is more than 90%. There are six first-class land types (cropland, forestland, grassland, water body, built-up areas, and unused land) and 25 second-class land types. Land use was reclassified according to the habitat classification framework developed by Song and Deng (2017) and Tang et al. (2021); see Table 1.
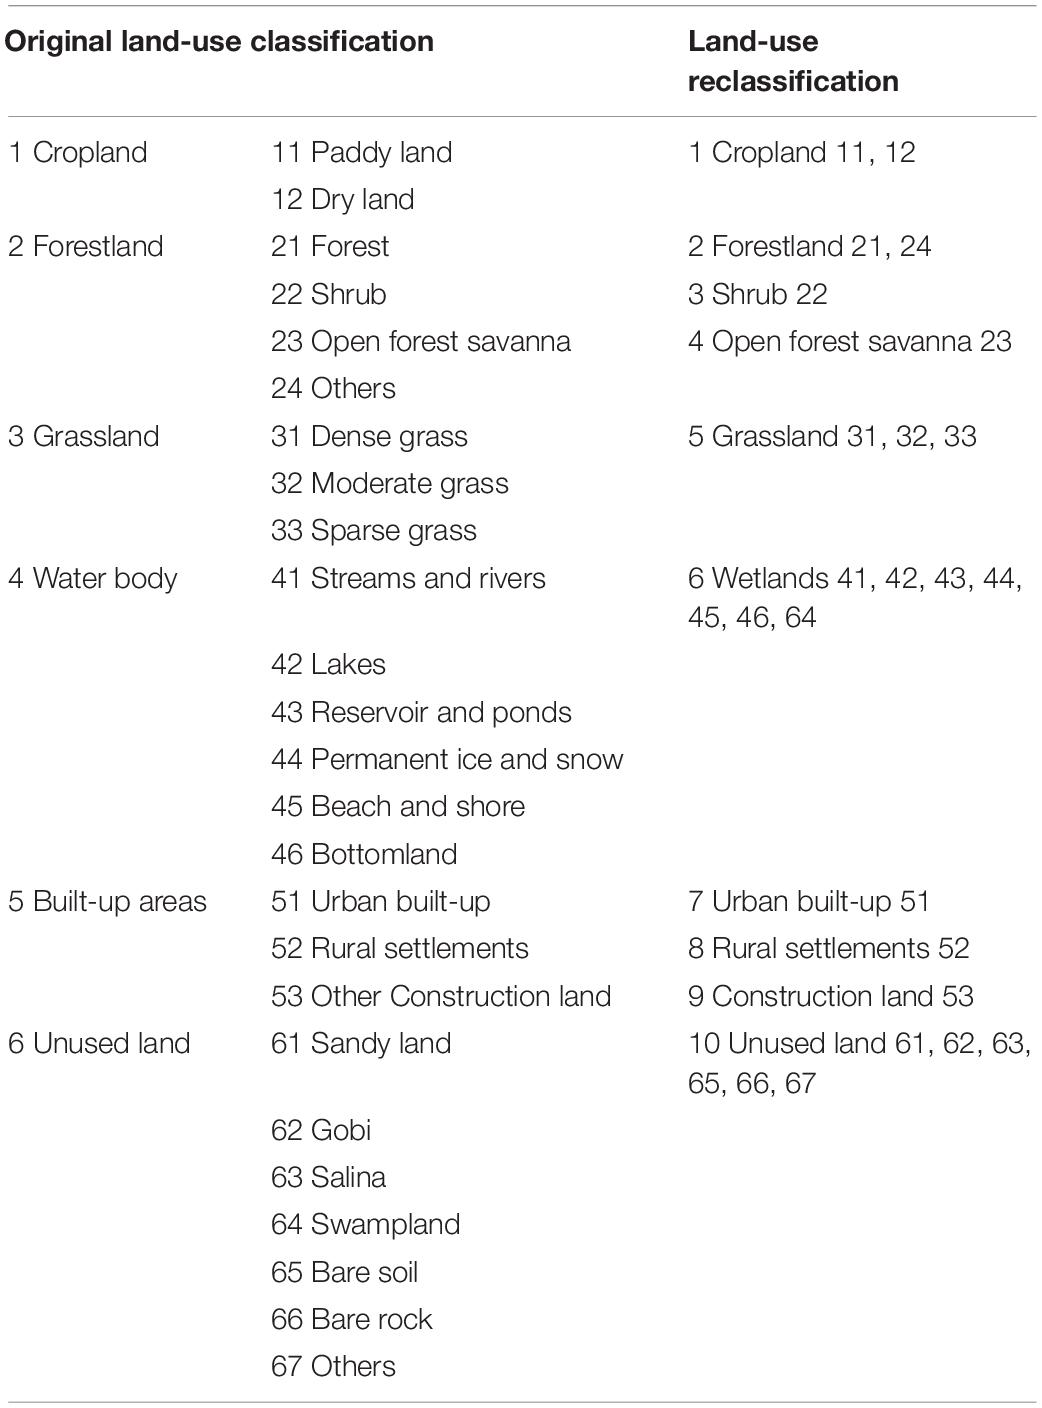
Table 1. Land-use reclassification.
The boundaries of SJPW and NTQTP were taken from the “National Planning for Key Function Areas” document (State Council of the People’s Republic of China, 2010). The boundaries of national nature reserves were obtained from the Resource and Environmental Science and Data Center.1
In this study, habitat quality was used as a proxy for biodiversity. To measure the degree of effort made by biodiversity management departments, human-induced habitat quality changes were computed by differentiating between human-induced land-use changes. A reference condition index, which reflects the ecological background, was then constructed. Finally, a comparable regional index of biodiversity conservation effectiveness was developed based on the reference condition index.
There is mounting evidence that habitat quality can be used as a proxy for biodiversity (Leh et al., 2013; Sallustio et al., 2017; Yi et al., 2018). The InVEST (Integrated Valuation of Ecosystem Services and Tradeoffs) model, jointly developed by Stanford University, The Nature Conservancy (TNC), and the World Wildlife Foundation (WWF), has been widely used for estimating habitat quality (Baral et al., 2014; Liu et al., 2021b; Mengist et al., 2021; Wu et al., 2021). Terrado et al. (2016) found that there was a significant correlation between the results estimated by the model and biodiversity observations, demonstrating the reliability of the model. Therefore, the InVEST model was used to estimate habitat quality as a representation of the biodiversity level.
In the InVEST model, habitat quality is determined by four factors: (1) the weights of different threat sources; (2) the relative sensitivity of each habitat to each threat source; (3) the distance between the habitat and the threat source; and (4) the degree of habitat protection. The formula for calculating the habitat quality Qxj is as follows:
where Qxj is the habitat quality of cell x of land-use type j; Hj is the habitat suitability of land-use type j, which can be assigned a value ranging from 0 to 1 (where 1 indicates the highest habitat suitability and 0 indicates no habitat suitability); Dxj is the threat level of cell x of land-use type j; kis the half-saturation constant [when , k = Dxj]; and z = 2.5 is a scaling factor. Dxj is calculated as follows:
where r denotes an ecological threat; R is the total number of ecological threats; y is a cell within ecological threat layer r; Yr is the total number of raster cells within ecological threat layer r; wr is the weight of ecological threat r, indicating the relative impact of a certain threat factor; βx is the accessibility level in grid cell x, where 1 indicates complete accessibility; Sjr is the sensitivity of land-use type j to threat r, and irxy is the impact of threat r that originates in grid cell y. We calculate irxy as follows:
In this study, cropland, urban areas, rural settlements, and construction land were selected as the major threat factors to natural habitat. The habitat suitability of each habitat, the habitat sensitivity to the threat factors, the scope of impacts, the weights, and the maximum weighting distances were determined according to previous studies (He et al., 2017; Sun et al., 2019; Tang et al., 2021). The specific parameters can be found in Supplementary Tables 1, 2.
Land-use changes can be divided into human-induced land-use changes and nature-induced land-use changes. Following Liu et al. (2021a), we defined the conversions between forestland, grassland, wetlands, shrubland, and open forest savanna as natural-induced land-use changes. Other conversions were defined as human-induced land-use changes (see Figure 2), covering four situations: (1) that induced by cropland expansion, i.e., the transfer from other land-use types to cropland; (2) that induced by urbanization, including the transfer to urban areas, rural settlements, and others; (3) that induced by land degradation, including the transfer to unused land; and (4) that induced by ecological restoration, including the transfer to forestland, grassland, and wetlands.
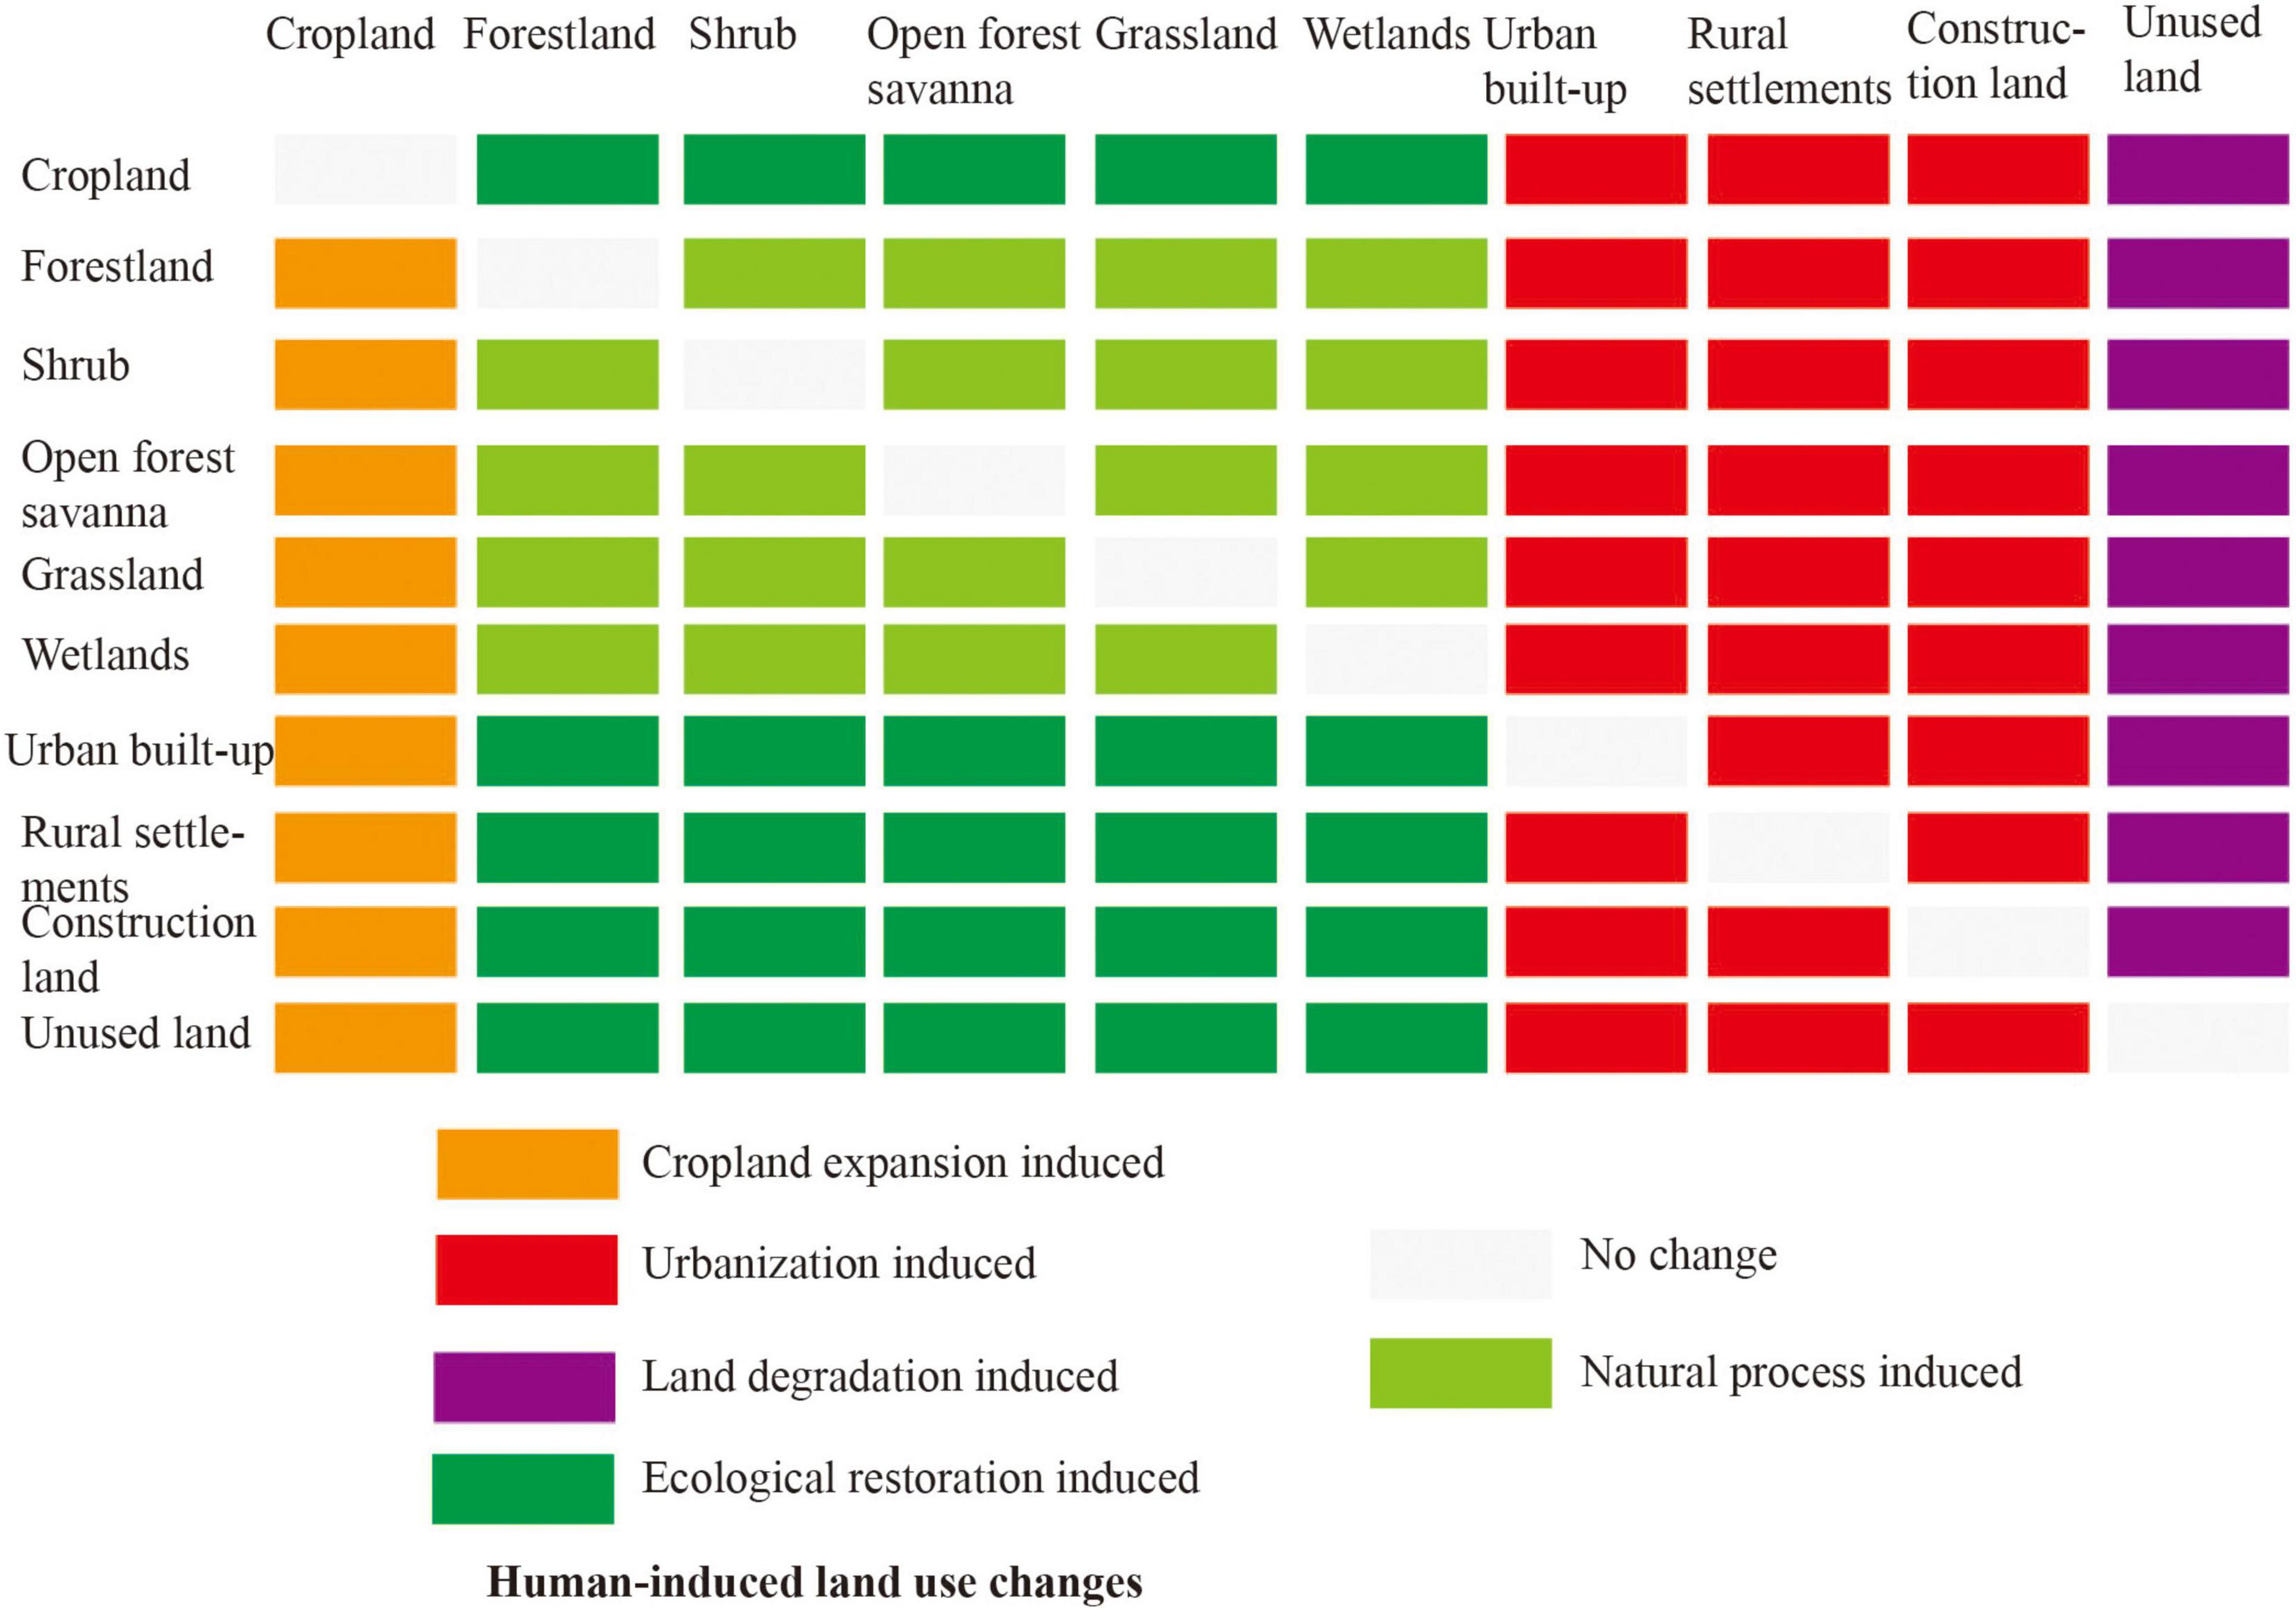
Figure 2. Definition of human-induced land-use changes.
Human-induced habitat quality changes reflect the human impacts of biodiversity maintenance capacity. These include positive impacts, which improve the ability for biodiversity maintenance, and negative impacts, which damage the potential for biodiversity maintenance.
The human-induced habitat quality changes index (HHQCI) was calculated as follows: (Figure 3) (1) based on the land-use change map from year T1 to year T2, calculated using ArcGIS, the human-induced land-use changes are obtained using the “Con” function in ArcGIS; (2) using the land-use map of year T1, the habitat quality map can be calculated using the InVEST model, and the human-induced habitat quality map from year T1 to year T2 can be obtained by imputing the human-induced changes from year T1 to year T2; (3) the spatial distribution of HHQCI from year T1 to year T2 can be calculated by subtracting the human-induced habitat quality map from year T1 to year T2 from the habitat quality map of year T1 using the raster calculator in the ArcGIS platform.
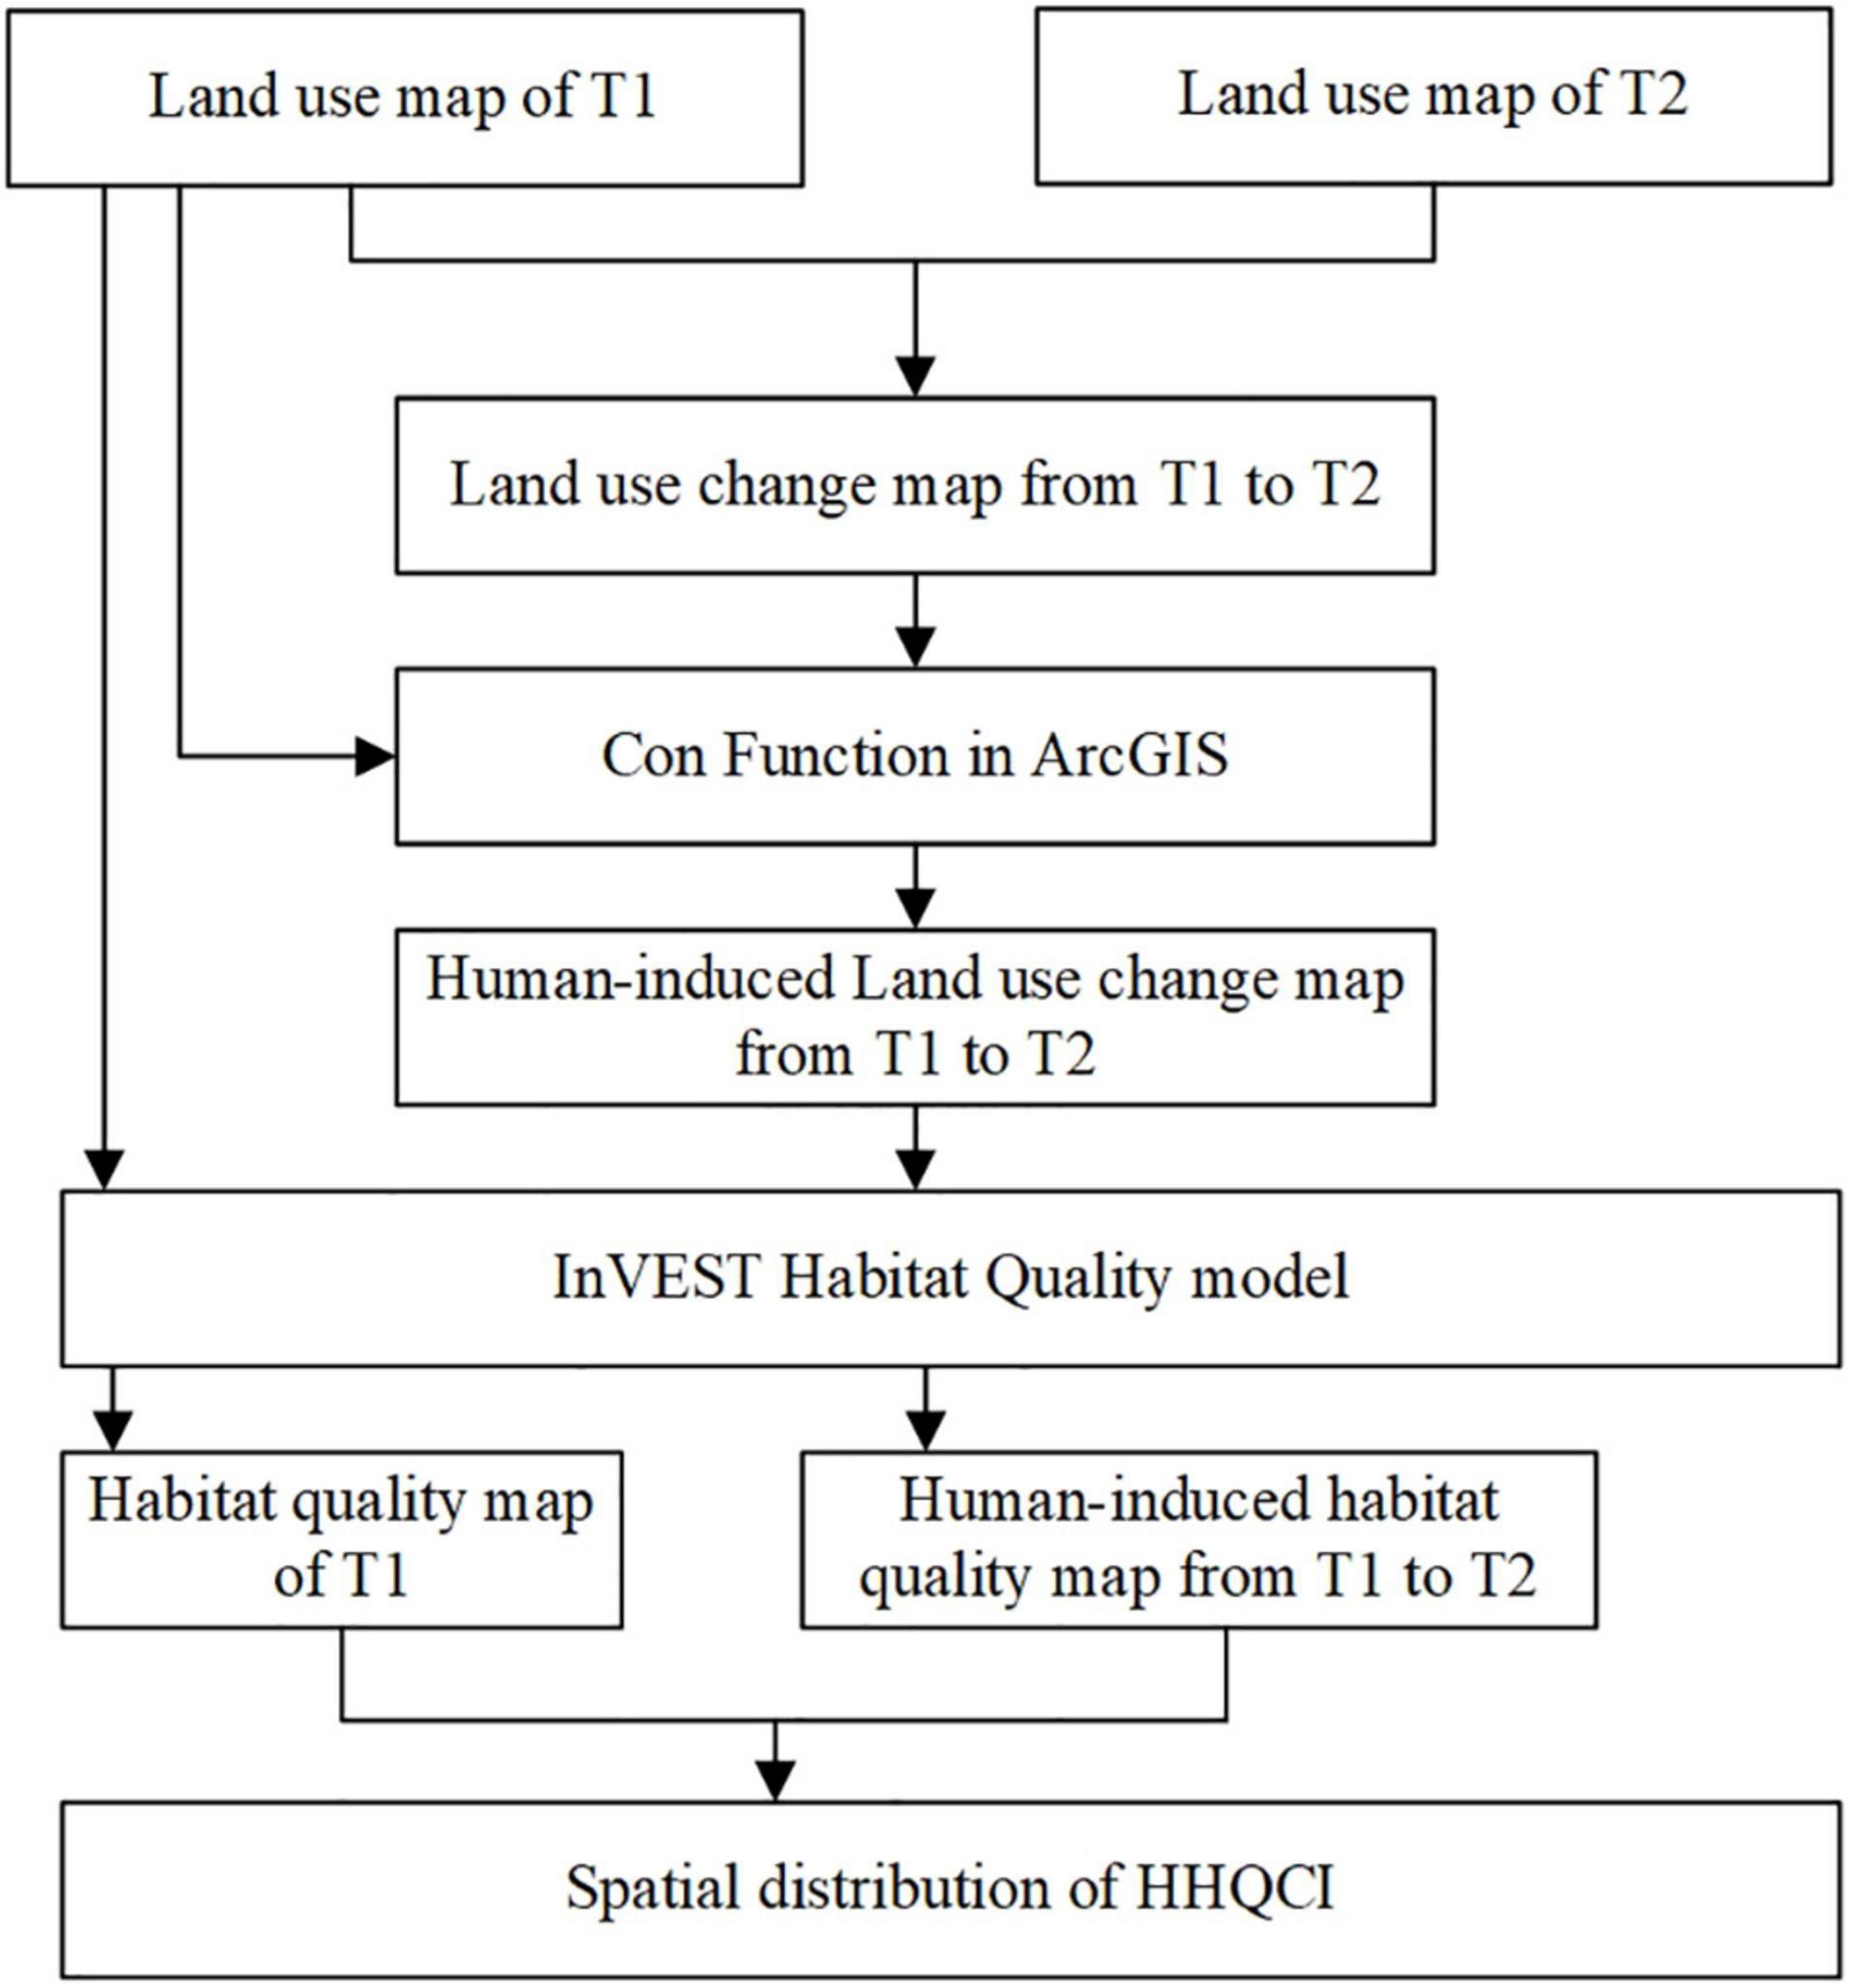
Figure 3. Flowchart of HHQCI calculation.
Reference conditions are widely used in restoration ecology. The reference condition refers to attribute values or characteristics of a reference ecosystem. Generally, several principles should be followed in selecting the reference conditions: (1) the reference should be the best of the existing conditions; (2) there should be little human disturbance; and (3) the reference condition should be achievable by the current sites if they are managed better.
The core areas of national nature reserves always suffer less human disturbance. Therefore, the optimum habitat quality value of the core area of national nature reserve located in the ecological function Regions from 1980–2018 were used to determine the reference condition index (RCI) through the following formula:
where HQ1980, HQ1990, HQ1995, HQ2000, HQ2005, HQ2010, HQ2015, and HQ2018 represent the habitat quality of the core area of the national nature reserves in 1980, 1990, 1995, 2000, 2005, 2010, 2015, and 2018, respectively.
Based on HHQCI and RCI, the biodiversity conservation effectiveness regional comparable index (CEI) was constructed as follows:
where CEIi,j is the CEI from year i to year j; HHQCIi,j is the HHQCI from year i to year j; and RCI is the reference condition index.
Human-induced habitat quality changes index and the total habitat quality changes (THQC) are presented in Table 2, along with their biases in SJPW and NTQTP. For the period 1980–2018, the HHQCI values in SJPW and NTQTP are −0.3055 and −0.1675, respectively. This is because the two regions have undergone severe human-induced land-use disturbances over this time (see Table 3). For SJPW, the land-use changes induced by crop expansion, urbanization, and land degradation cover 641, 641, and 3 km2, respectively, while ecological restoration-induced land-use changes extended across 941 km2. For NTQTP, although there were very low levels of crop expansion and urbanization, land degradation affected 136,899 km2, almost six times the area of ecological restoration. The HHQCI values of each time period in SJPW are negative, meaning that the habitat condition was consistently destroyed by human activities. The worst stage is 1980–1990, with an HHQCI value of −0.1038. In this period, crop expansion (5,863 km2) and urbanization (203 km2) induced severe land-use changes, while ecological restoration was applied to only 301 km2. The period of least human disturbance was 2000–2005, when the HHQCI value is −0.0073 and cropland expansion and urbanization covered only 449 and 4 km2, respectively. The HHQCI values of NTQTP are positive, negative, and zero, meaning that human impacts had positive and negative efforts on NTQTP. The maximum HHQCI value in NTQTP is 0.0734, from the period 1995–2000, when ecological restoration-induced land-use changes reached 72,124 km2. The minimum value is −0.1681 in 2005–2010, when land degradation had a severe impact.
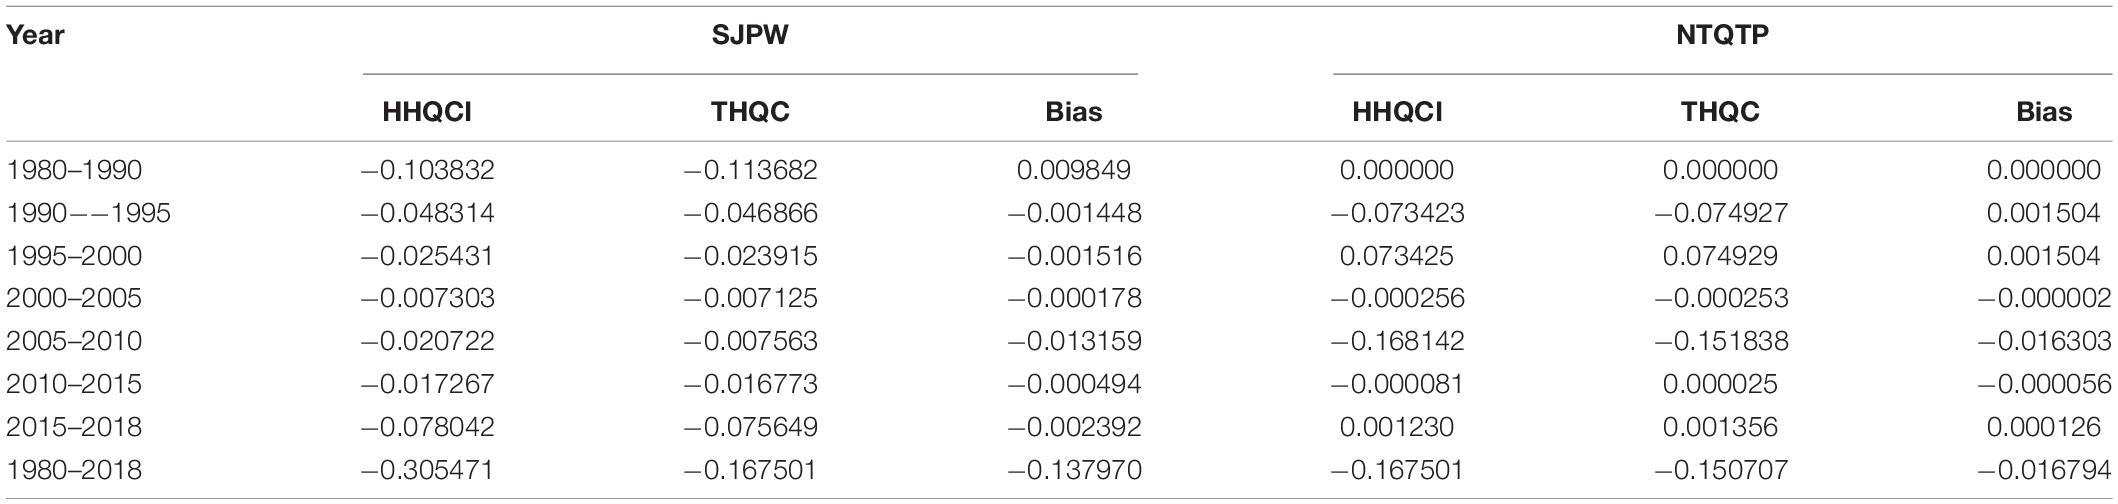
Table 2. HHQCI and total habitat quality changes and their biases from 1980–2018.

Table 3. Human-induced land-use changes from 1980–2018 (units: km2).
The biases were obtained by subtracting the absolute values of THQC and HHQCI. Positive biases indicate that human impacts are underestimated, while negative values indicate an overestimation of human impacts. For the period 1980–2018, the human impacts on SJPW and NTQTP would all be underestimated if we did not differentiate the human-induced habitat quality changes, having bias values of −0.137970 and −0.016794, respectively. The degree of underestimation is not the same, and will generally be different when using HHQCI to quantify the efforts of management departments. For different time periods, the biases of SJPW are all negative, except for 1980–1990. The maximum bias value is −0.013159 from the period 2005–2010. There is no bias in NTQTP from 1980–1990, as there is no change of habitat quality over this period. The maximum bias value is from 2005–2010, where the underestimation of habitat quality reaches 0.016303. Therefore, it is important to use HHQCI instead of THQC to measure human efforts, as this provides a more rational basis for the allocation of biodiversity funds.
Figure 4 shows the habitat quality changes of the core areas of the national nature reserves in SJPW and NTQTP from 1980–2018. It is clear that the habitat quality of the core areas in SJPW is much better than in NTQTP. Specifically, the habitat quality of nature reserves in SJPW decreases from 1980–2005, climbs to a peak in 2010, and declines again thereafter. Thus, the reference year for SJPW is 2010 and its RCI value is 0.897. The habitat quality of nature reserves in NTQTP first decreases from 1980–1995, then increases from 1995–2005, before decreasing again from 2005–2018. Therefore, the reference year for NTQTP is 1980 and its RCI value is 0.5500.
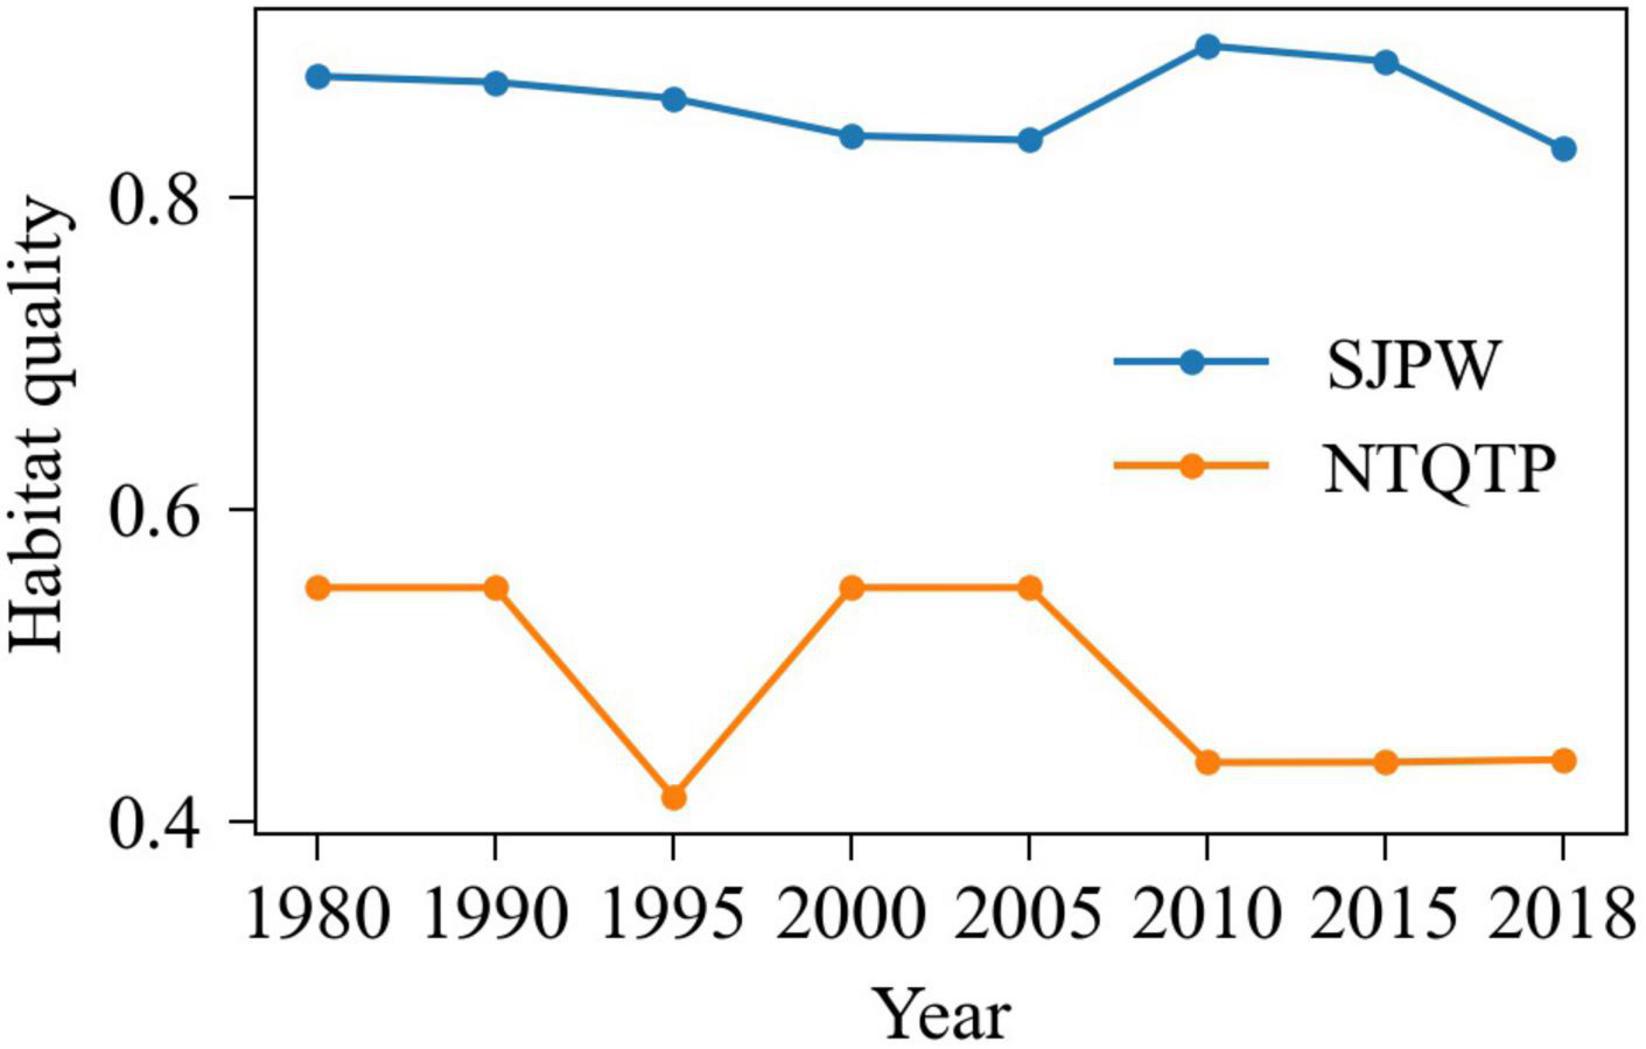
Figure 4. Habitat quality changes of the core areas of national nature reserves in SJPW and NTQTP from 1980–2018.
Figure 5 shows the habitat quality of SJPW and NTQTP from 1980–2018. The habitat quality of SJPW shows a consistent downward trend, decreasing from 0.6275 in 1990 to 0.3360 in 2018. The habitat quality of NTQTP exhibits a decreasing–increasing–decreasing. The maximum value of the habitat quality in NTQTP is 0.54288 in 1980 and 1990, and the minimum value is 0.39079 in 2010. Comparing the two areas, it can be seen that, with the exception of 2010 and 2015, the habitat quality of NTQTP is much better than that in SJPW. Figure 6 shows the spatial distribution of habitat quality changes in SJPW and NTQTP from 1980–2018. In general, the habitat quality degradation in SJPW (mean value of −0.2932) is much more serious than that in NTQTP (mean value of −0.1509). The habitat quality change in both SJPW and NTQTP from 1980–2018 exhibits obvious spatial differences. This is especially true in SJPW, where the habitat quality degradation is severe in the northern and southern regions, while habitat quality improvements are scattered across the whole region. In NTQTP, the habitat quality improvement is better in the northwest of the region.
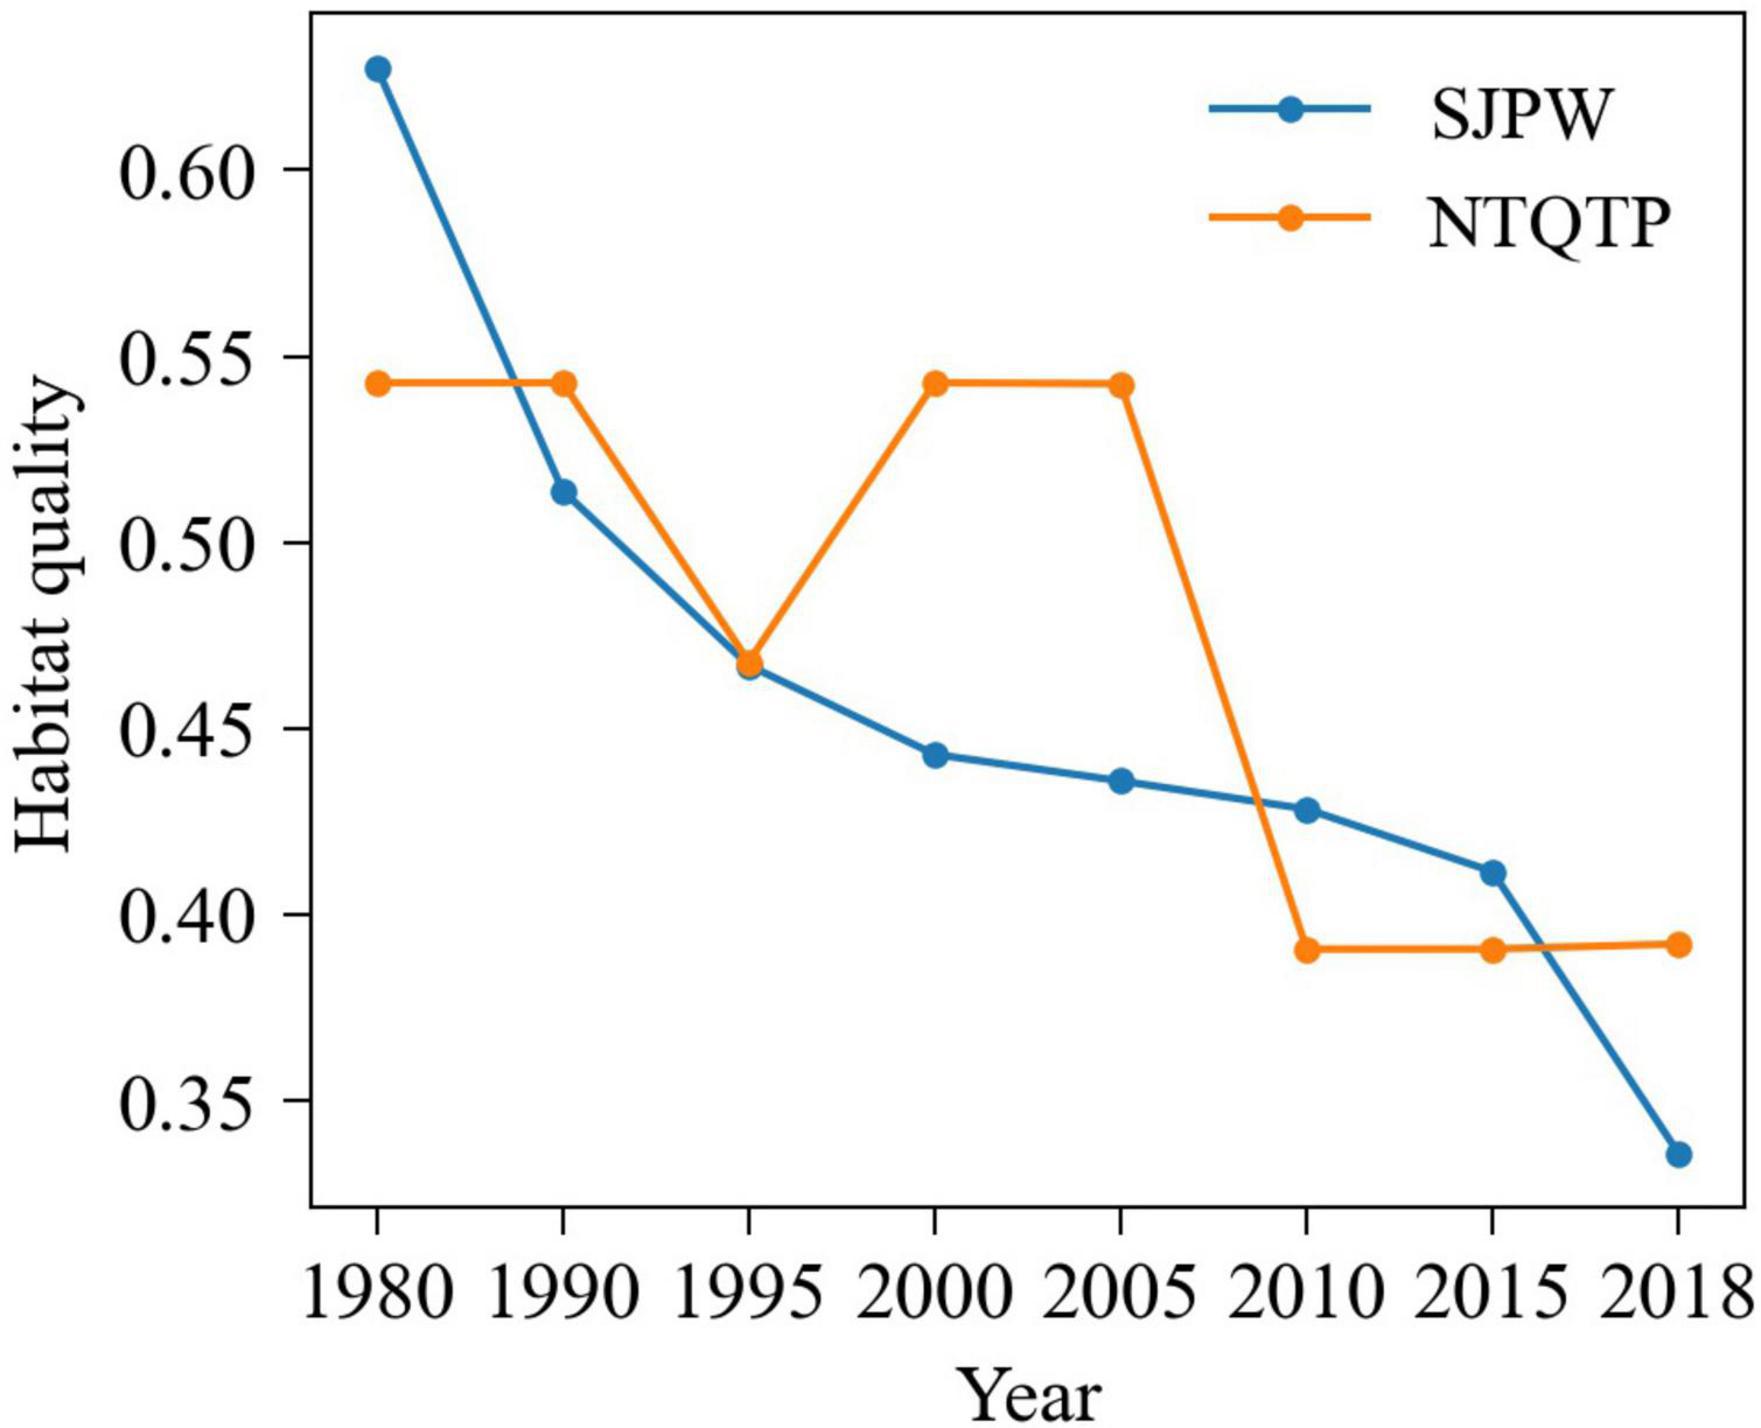
Figure 5. Habitat quality changes in SJPW and NTQTP from 1980–2018.
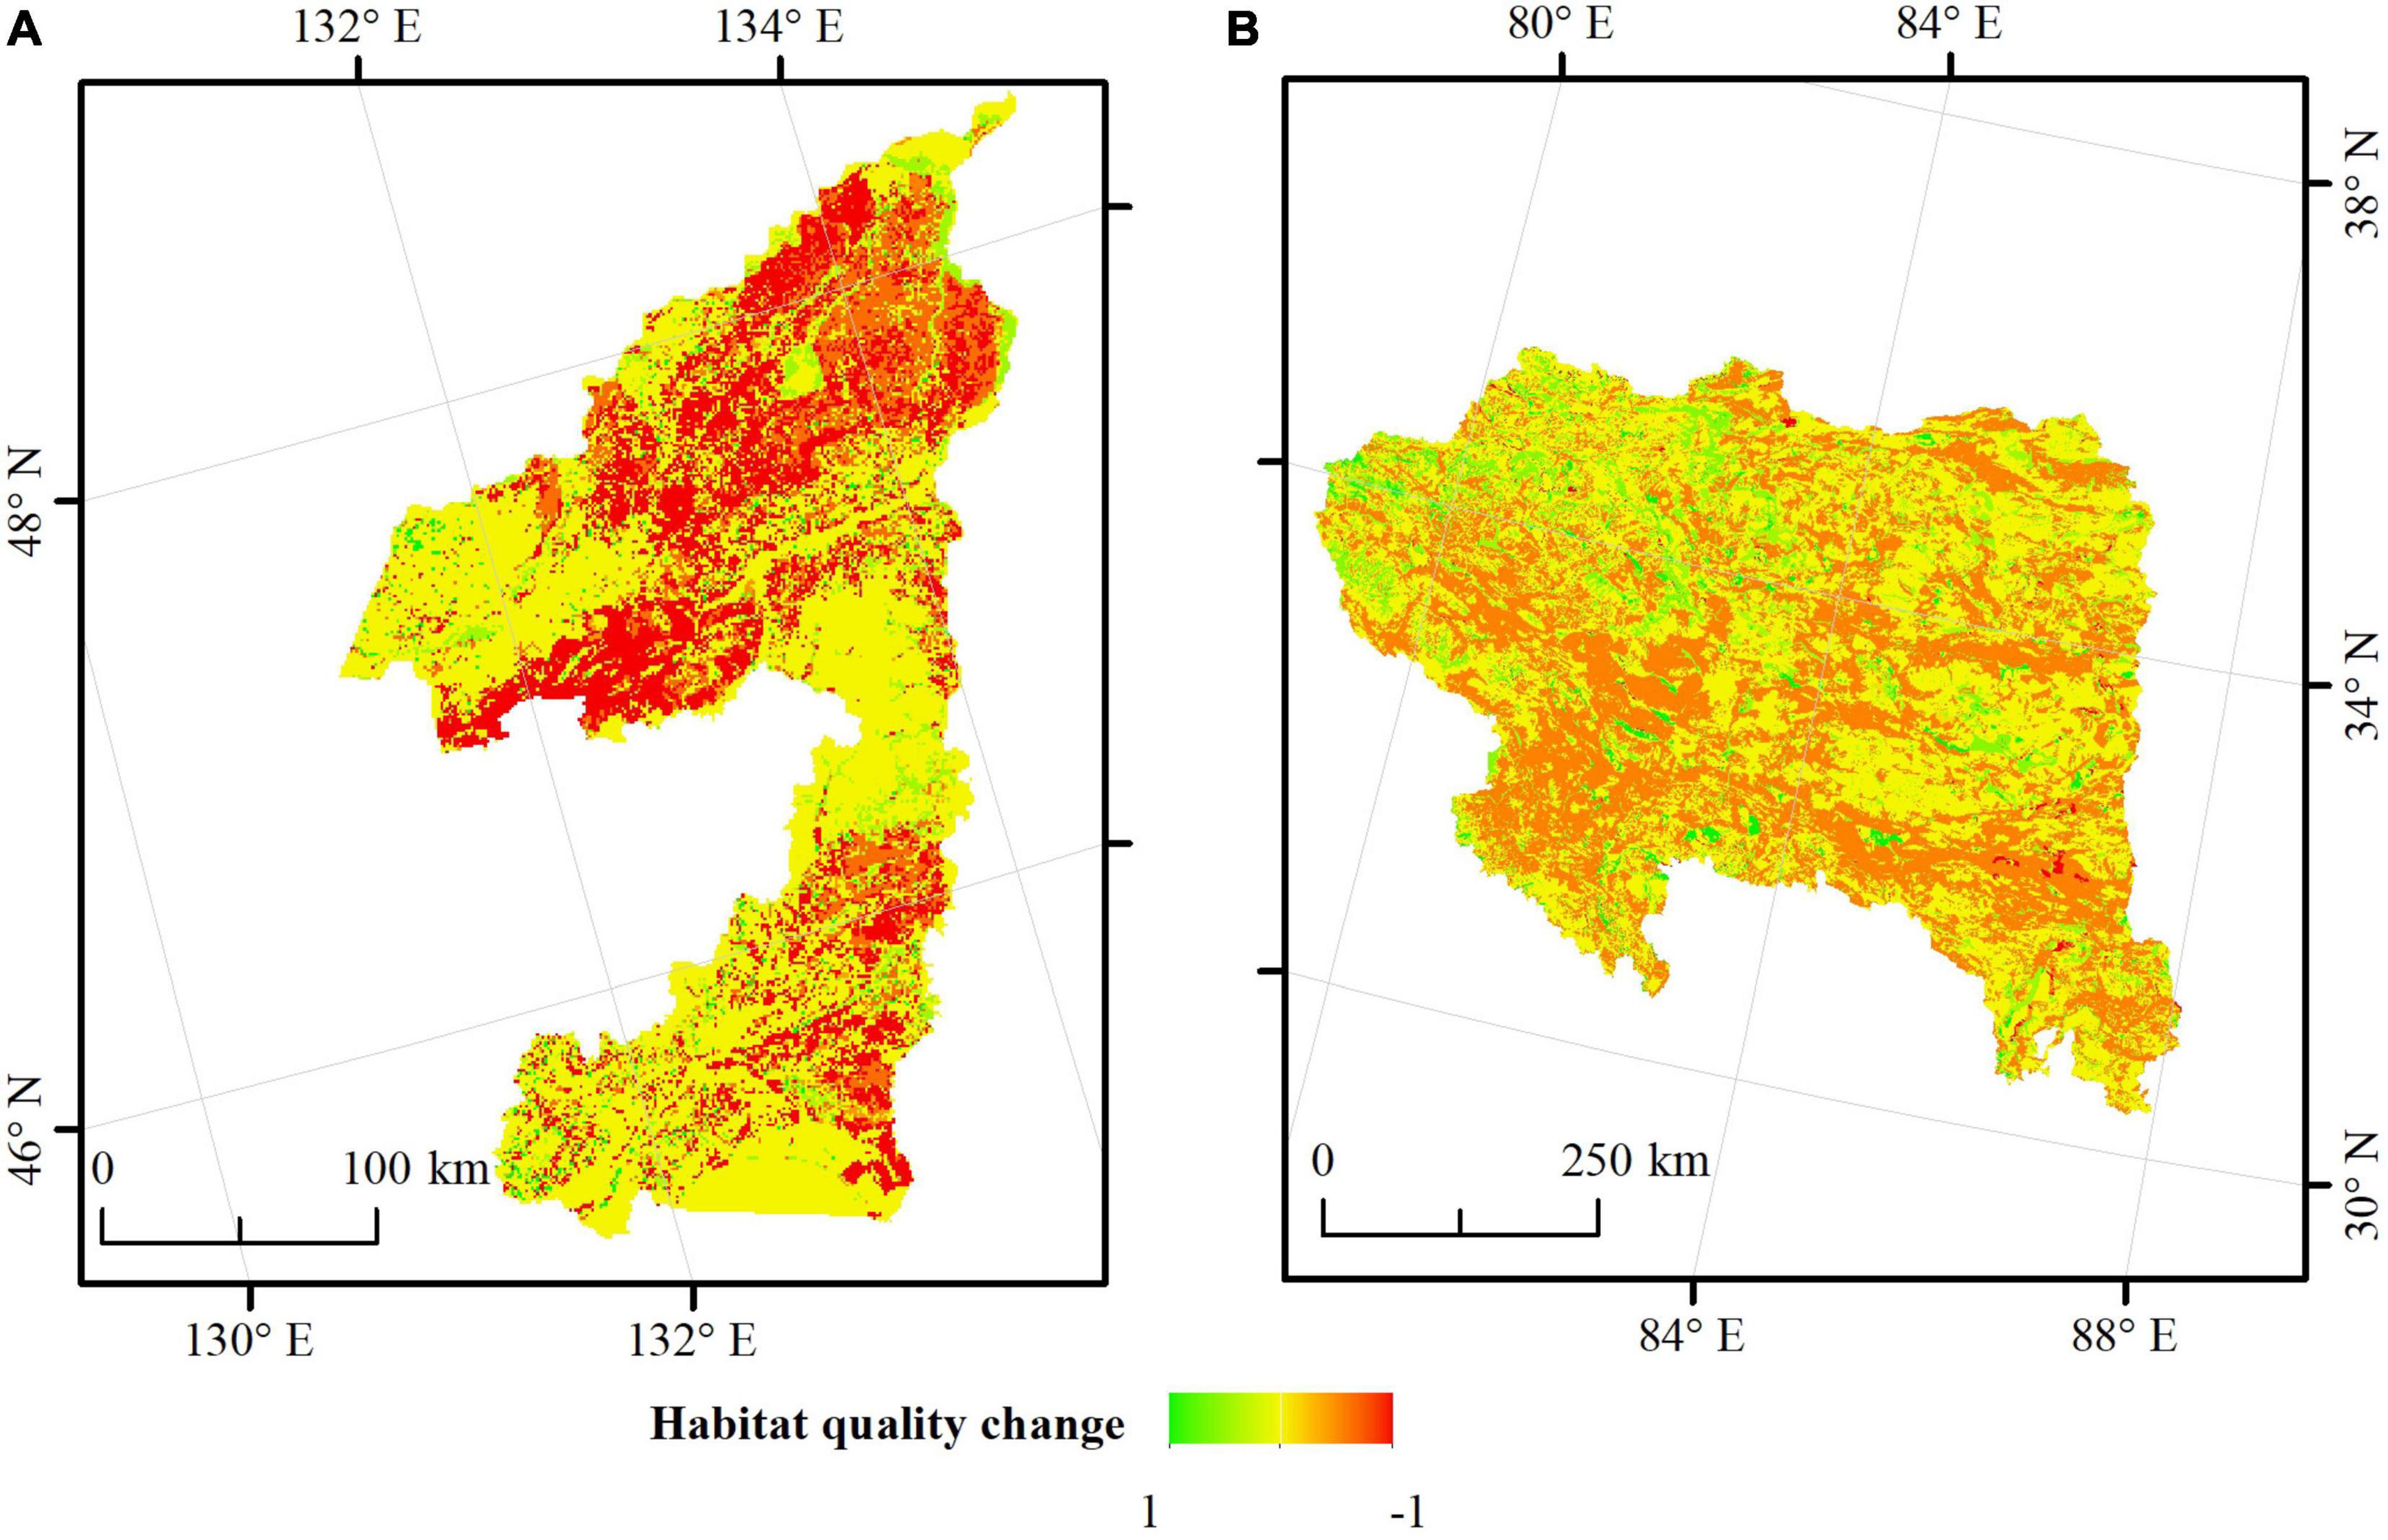
Figure 6. Spatial distribution of habitat quality changes in SJPW (A) and NTQTP (B) from 1980–2018.
Figure 7 shows the CEI of SJPW and NTQTP from 1990–2018. The conservation efforts in SJPW are most effective from 2000–2005, with a CEI value of −0.008. The worst period for SJPW is from 1980–1990, when the CEI is −0.1157. The effectiveness of conservation efforts in NTQTP is best from 1995–2000, with a CEI value of 0.1335. The least-effective conservation efforts occur from 2005–2010, with a CEI of −0.3057. In general, the conservation effectiveness of NTQTP is better than that in SJPW, except from 1990–1995 and 2005–2010. Figure 8 shows the spatial distribution of CEI in SJPW and NTQTP from 1980–2018. In general, the CEI in SJPW (mean value of −0.3405) is much worse than that in NTQTP (mean value of −0.3046). For SJPW, high CEI values are distributed in the middle and northwest parts of the region, while lower values are mainly distributed in the northeast part. For NTQTP, high values of CEI can be found in the northwest part, with lower values sporadically distributed in the southwest part of the region.
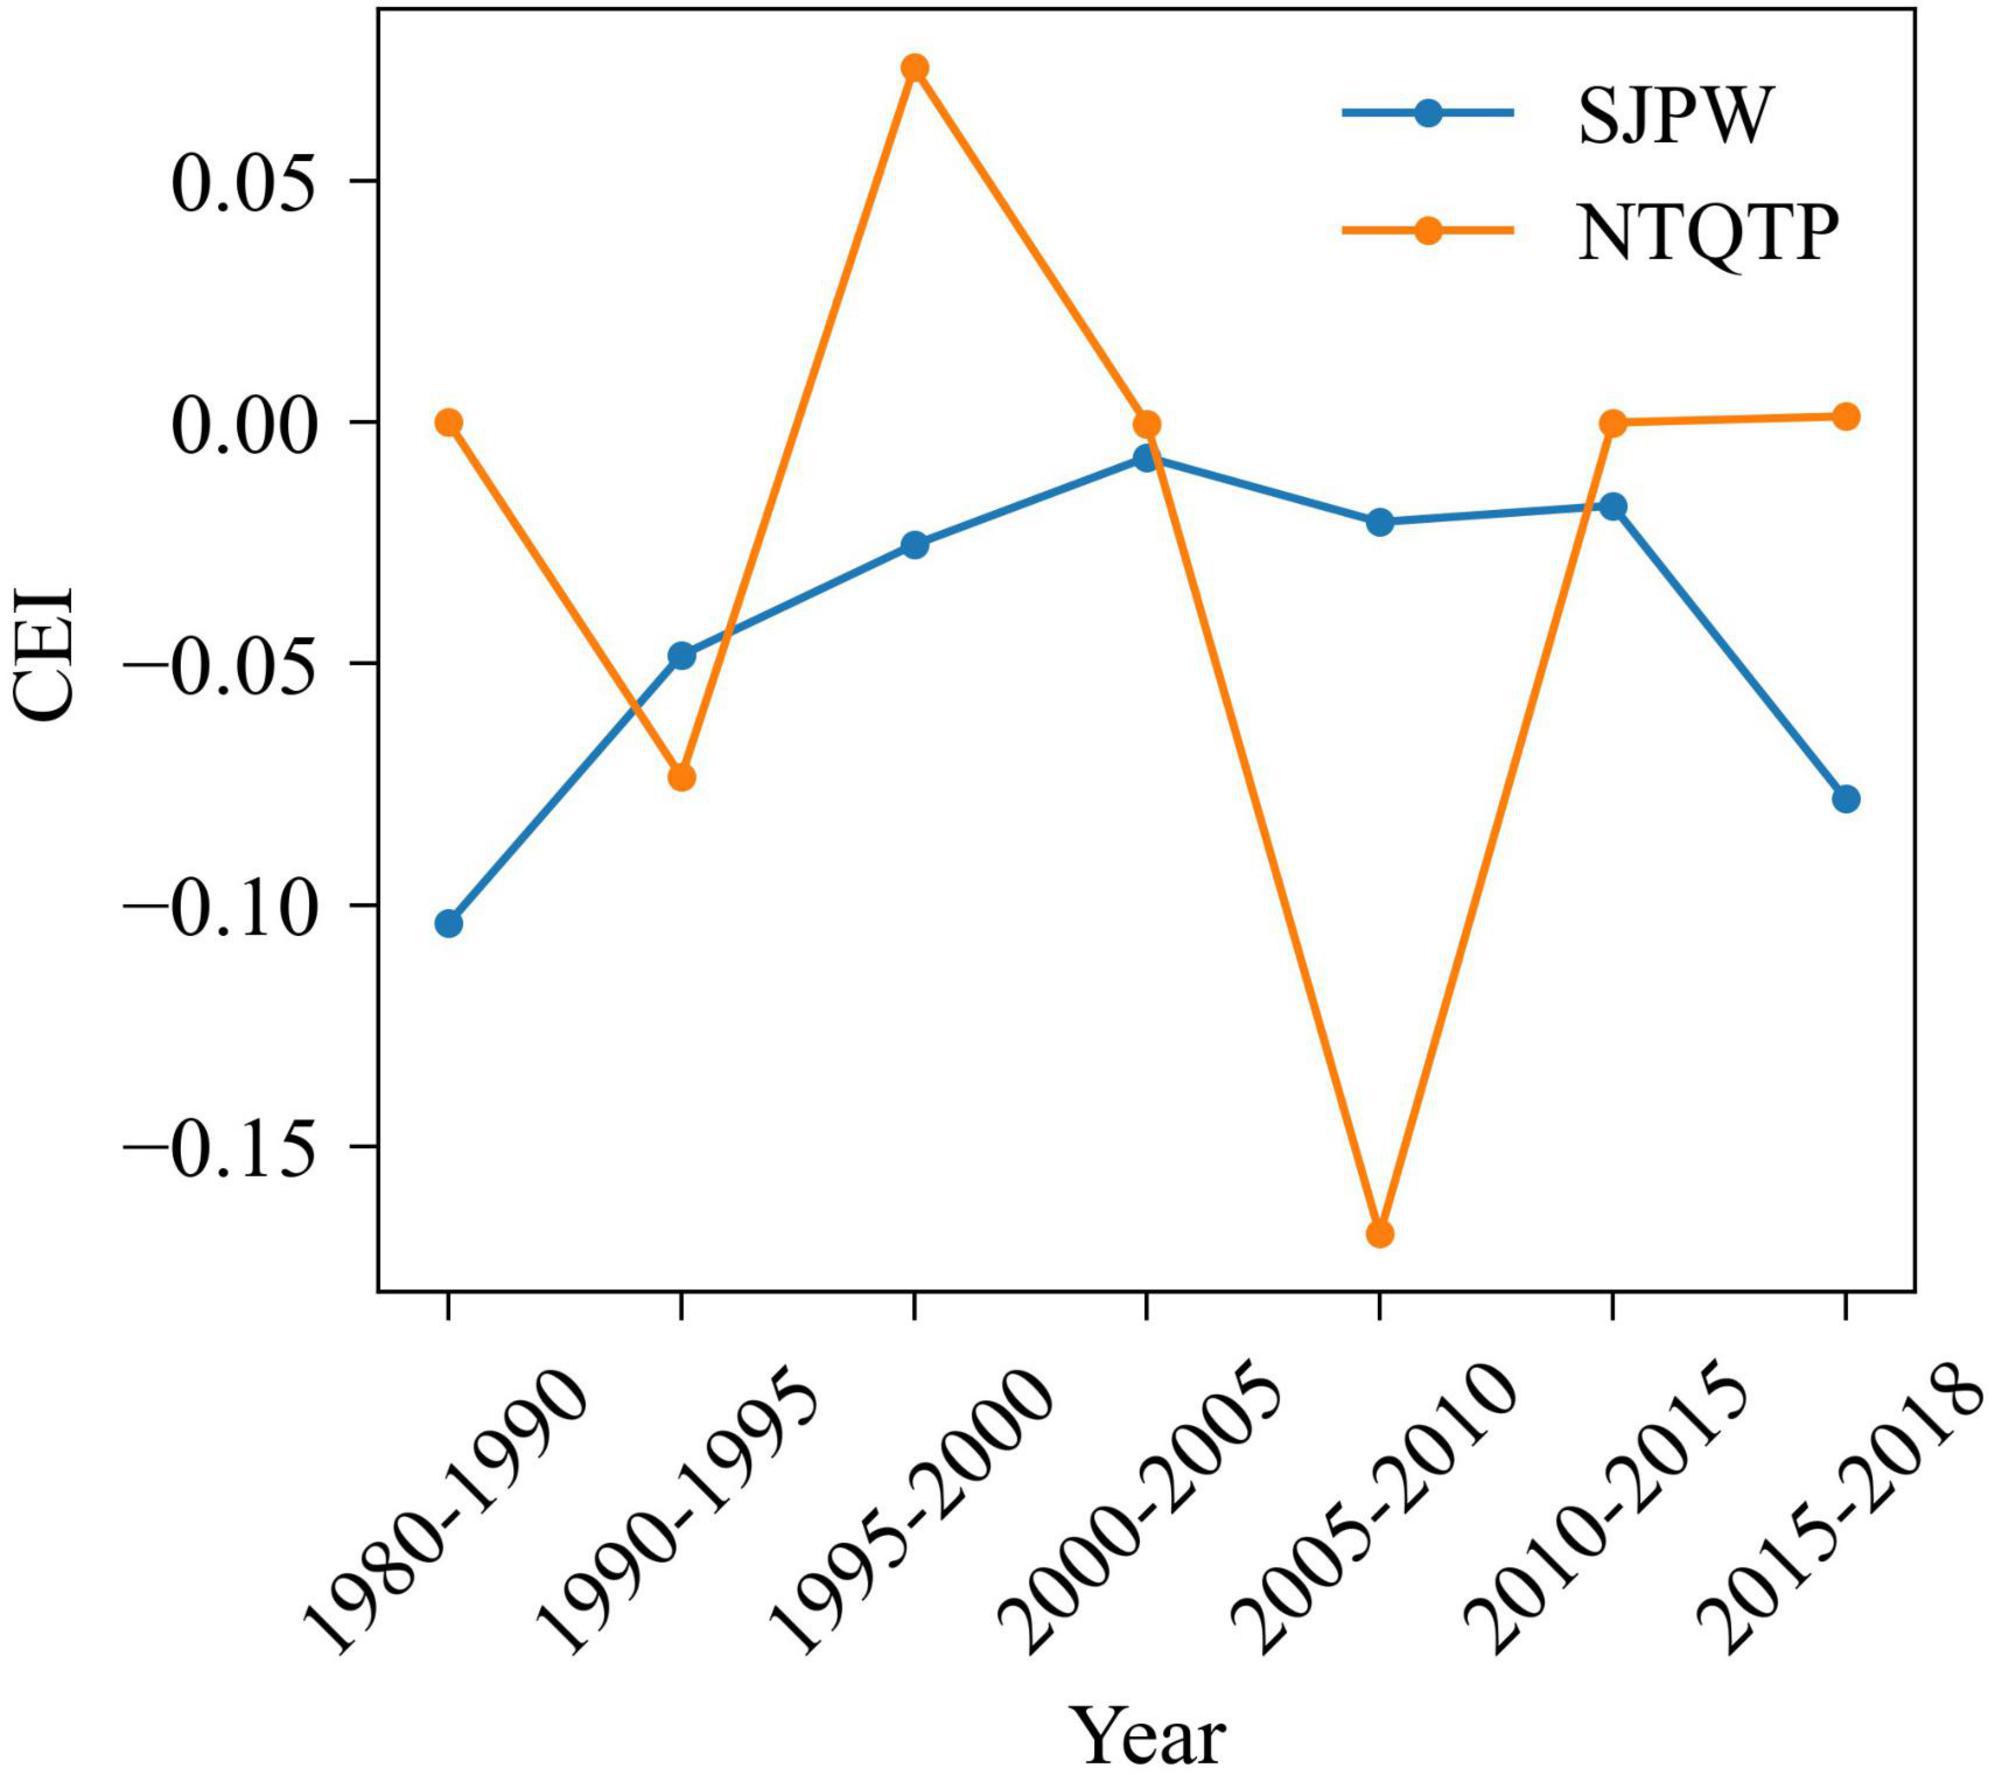
Figure 7. CEI of SJPW and NTQTP from 1980–2018.
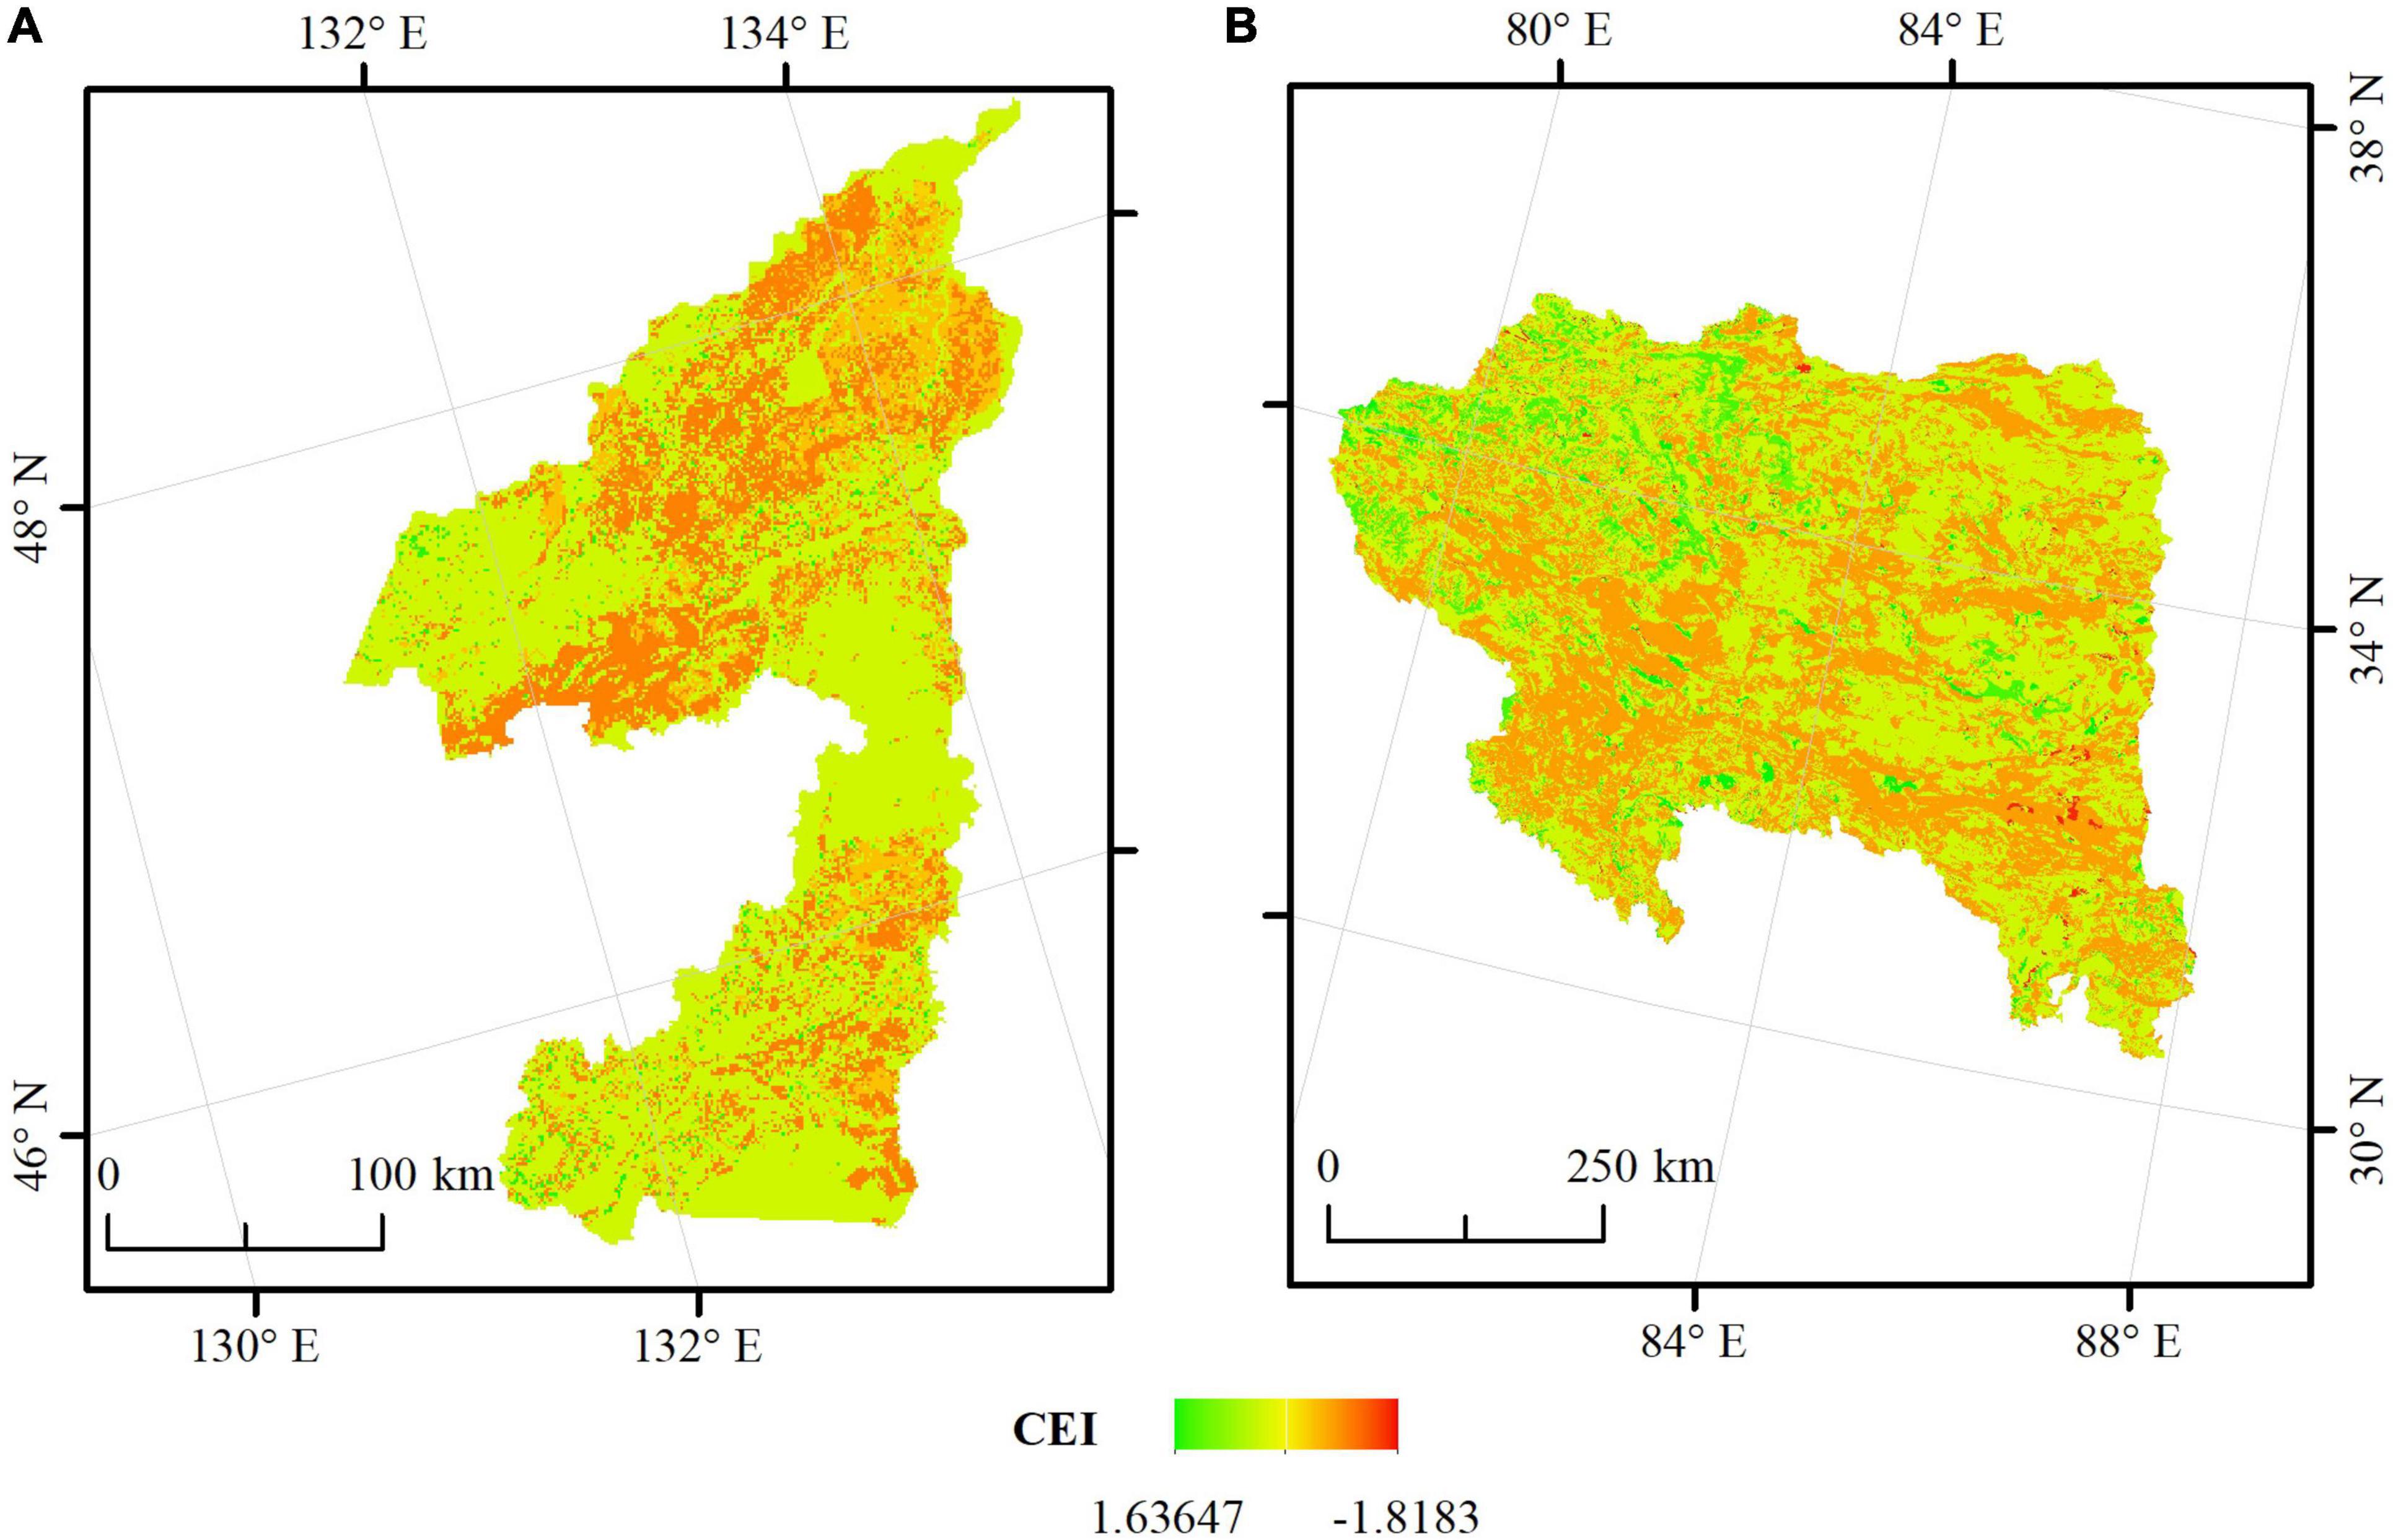
Figure 8. Spatial distribution of CEI in SJPW (A) and NTQTP (B) from 1980–2018.
To stimulate biodiversity conservation initiatives in management departments, China implemented the transfer payment policy. Transfer funds are allocated according to the assessment results of the effectiveness of biodiversity conservation. To ensure the equality of the policy, the protection effectiveness caused by human efforts should be comparable. Additionally, the different ecological backgrounds of different regions should be considered. These two aspects make it challenging to compare the effectiveness of biodiversity efforts across different regions.
Several studies have used the inside–outside comparison method to differentiate between the impacts of humans and nature (Mao et al., 2021; Mu et al., 2021). For example, Mu et al. (2021) combined a land-use dynamic index and landscape fragmentation dynamic index to assess the effectiveness of 92 wetland national nature reserves in China. They used sub-catchments containing PAs as references and distinguished the human- and nature-induced changes using statistical analysis. Their method takes the potential hypothesis that the natural conditions inside and outside the PAs are the same. Any differences between the changes inside and outside the PAs are then assumed to be caused by humans. However, the habitat outside the PAs can suffer positive or negative human disturbance, leading to overestimated or underestimated human impacts on the PAs. Gong et al. (2017) used changes in the distance between pandas and threat sources to measure the degree of human efforts. However, the distance to the threat source is only one aspect reflecting human efforts toward biodiversity protection. In this study, we used the human-induced habitat quality to reflect the efforts made by management departments. Human-induced habitat quality was estimated by the InVEST model, which considers habitat suitability, threat sources, and the distance to threat sources. Therefore, our method is much more comprehensive and reasonable.
Our study found that the total habitat quality changes may overestimate or underestimate the human impacts on habitat improvement or degradation, and the biases between total habitat quality changes and human-induced habitat quality changes are different in SJPW and NTQTP. This implies that if the human impacts are not differentiated, the effects of the efforts made by management departments will not be equitably reflected. Clarifying the causes of human-induced changes also guides the practice for improving habitat quality.
National nature reserves in China are the most strictly PAs for biodiversity conservation and suffer relatively little human disturbance (Xu et al., 2017). We used the optimum habitat quality of national nature reserves inside the ecological function regions as the reference condition, and applied the ratio of human-induced habitat quality changes to the reference condition value to eliminate the background differentiation. In our previous study (Dong et al., 2018), the distance to the reference was used as a metric of conservation effectiveness. If the changes in the distance to the reference remained the same between different regions, the conservation effectiveness was assumed to be equivalent. However, because there are large differences in the ecological background and recovery difficulties among different regions, the same conservation effectiveness value does not reflect the same human effort. Therefore, in this study, the ratio of human-induced habitat quality changes to the reference condition was used to eliminate the background difference.
Our results show that direct assessment using habitat quality produces different outcomes from assessment using CEI. Habitat quality is the same as the species richness index selected by Zheng et al. (2012) when they conducted a spatial comparison of national nature reserves. Both metrics reflect the biodiversity maintenance ability of the ecosystem itself, and do not consider the ecological background and restoration difficulties. The assessment results are therefore not convincing.
Equality is one of the most important principles in determining whether the central government will pay transfer funding across different regions. If biodiversity funds are not allocated equally, the policy will not perform well in terms of stimulating biodiversity conservation. To ensure equality, our method first distinguishes the human impacts and natural process impacts on habitat quality improvement or degradation. Positive and negative human impacts are then used to represent the human efforts made by management departments. However, this is not sufficient, because there are large differences in the ecological background of different regions, leading to large differences in the difficulty of restoration. Hence, a reference condition index was constructed and the ratio of human-induced habitat quality changes to the reference condition index was calculated to eliminate the background differences between different regions. Based on these two aspects, we believe our method provides a scientific reference for China’s transfer payment policy, as well as for the allocation of biodiversity funds in other countries.
There are some limitations to this study. First, except for habitat quality, hunting and invasive species pressures can also cause changes in the effectiveness of biodiversity conservation. However, this limitation does not affect the practicality of the proposed method. Second, habitat quality was estimated by the InVEST model, which cannot reflect habitat quality differences across regions that have the same land-use type. This leads to the omission of positive or negative human impacts in regions of the same land-use type, such as wetland degradation. Third, the InVEST model cannot measure the ecological background differences related to terrain, climate, hydrology, soil, and the ecosystem. Fortunately, this does not influence the rationality of our method, which eliminates the ecological background differences by constructing a reference condition index. These aspects will be considered further in future research.
In this study, we developed a method for comparing the effectiveness of biodiversity conservation between different regions. Using habitat quality as a proxy for biodiversity, human-induced habitat quality changes were used to represent the human efforts of management departments. A reference condition index was then constructed to represent the reference state, and the ratio of human-induced habitat quality changes to the reference condition index was calculated to eliminate the background differences between different regions. The main conclusions are as follows: (1) Human-induced habitat quality changes broadly reflect human efforts toward biodiversity conservation. (2) The application of the proposed method to SJPW and NTQTP has demonstrated its utility in comparing the effectiveness of biodiversity conservation across different regions. This study provides a significant reference for China’s transfer payment policy. It also gives an insight into ecological compensation in other countries. Furthermore, our results will guide the management of habitat enhancement and biodiversity conservation.
The original contributions presented in the study are included in the article/Supplementary Material, further inquiries can be directed to the corresponding author.
KD wrote the manuscript and performed the data analysis. ZL conceived the manuscript. YL, ZC, GH, and JS reviewed and edited the manuscript. All authors contributed to the article and approved the submitted version.
This study was supported by the National Natural Science Foundation of China (42001266).
The authors declare that the research was conducted in the absence of any commercial or financial relationships that could be construed as a potential conflict of interest.
The handling editor ZN declared a shared affiliation with the author(s) ZL, YL, ZC, and GH at the time of review.
All claims expressed in this article are solely those of the authors and do not necessarily represent those of their affiliated organizations, or those of the publisher, the editors and the reviewers. Any product that may be evaluated in this article, or claim that may be made by its manufacturer, is not guaranteed or endorsed by the publisher.
We thank Jing Tang at Northeast Institute of Geography and Agroecology, Chinese Academy of Sciences for her helpful suggestions.
The Supplementary Material for this article can be found online at: https://www.frontiersin.org/articles/10.3389/fevo.2022.855453/full#supplementary-material
Almond, R. E., Grooten, M., and Peterson, T. (2020). Living Planet Report 2020-Bending the Curve of Biodiversity Loss. WWF, Gland: World Wildlife Fund: Switzerland
Andam, K. S., Ferraro, P. J., Pfaff, A., Sanchez-Azofeifa, G. A., and Robalino, J. A. (2008). Measuring the effectiveness of protected area networks in reducing deforestation. Proc. Natl. Acad. Sci. U.S.A. 105, 16089–16094. doi: 10.1073/pnas.0800437105
Baral, H., Keenan, R. J., Sharma, S. K., Stork, N. E., and Kasel, S. (2014). Spatial assessment and mapping of biodiversity and conservation priorities in a heavily modified and fragmented production landscape in north-central victoria. Austral. Ecol. Indic. 36, 552–562. doi: 10.1016/j.ecolind.2013.09.022
Coad, L., Watson, J. E., Geldmann, J., Burgess, N. D., Leverington, F., Hockings, M., et al. (2019). Widespread shortfalls in protected area resourcing undermine efforts to conserve biodiversity. Front. Ecol. Environ. 17:259–264. doi: 10.1002/fee.2042
Dong, K. K., Hou, G. L., Xu, D. D., He, H. L., and Liu, Z. L. (2018). A method to compare the biodiversity conservation effectiveness between regions based on a reference condition. Sustainability. 10:3694. doi: 10.3390/su10103694
Fan, J., Sun, W., Zhou, K., and Chen, D. (2012). Major function oriented zone: new method of spatial regulation for reshaping regional development pattern in China. Chin. Geogr. Sci. 22, 196–209. doi: 10.1007/s11769-012-0528-y
Gaveau, D. L., Wandono, H., and Setiabudi, F. (2007). Three decades of deforestation in southwest sumatra: have protected areas halted forest loss and logging, and promoted re-growth? Biol. Conserv. 134, 495–504. doi: 10.1016/j.biocon.2006.08.035
Geldmann, J., Manica, A., Burgess, N. D., Coad, L., and Balmford, A. (2019). A global-level assessment of the effectiveness of protected areas at resisting anthropogenic pressures. Proc. Natl. Acad. Sci. U.S.A. 116, 23209–23215. doi: 10.1073/pnas.1908221116
Gong, M., Fan, Z., Zhang, X., Liu, G., Wen, W., and Zhang, L. (2017). Measuring the effectiveness of protected area management by comparing habitat utilization and threat dynamics. Biol. Conserv. 210, 253–260. doi: 10.1016/j.biocon.2017.04.027
He, J. H., Huang, J. L., and Li, C. (2017). The evaluation for the impact of land use change on habitat quality: a joint contribution of cellular automata scenario simulation and habitat quality assessment model. Ecol. Model. 366, 58–67. doi: 10.1016/j.ecolmodel.2017.10.001
Joppa, L. N., and Pfaff, A. (2011). Global protected area impacts. Proc. R. Soc. Lond. Ser. B. 278, 1633–1638. doi: 10.1098/rspb.2010.1713
Leh, M. D. K., Matlock, M. D., Cummings, E. C., and Nalley, L. L. (2013). Quantifying and mapping multiple ecosystem services change in West Africa. Agric. Ecosyst. Environ. 165, 6–18. doi: 10.1016/j.agee.2012.12.001
Liu, B., Pan, L. B., Qi, Y., Guan, X., and Li, J. S. (2021a). Land use and land cover change in the yellow river basin from 1980 to 2015 and its impact on the ecosystem services. Land. 10:1080. doi: 10.3390/land10101080
Liu, C., Cheng, K., Liu, H., Cheng, T. F., and He, D. (2017). Research on transfer payment of national key ecological function regions——taking five counties in gansu and two counties in inner mongolia as examples. For. Econ. 3, 3–15. doi: 10.13843/j.cnki.lyjj.2017.03.001
Liu, G. H., Wen, Y. H., Xie, J., and Liu, H. J. (2020). Evolution of transfer payment policy for national key ecological function areas and suggestions for improvement. Environ. Prot. 48, 9–14. doi: 10.14026/j.cnki.0253-9705.2020.17.002
Liu, J. G., Linderman, M., Ouyang, Z. Y., An, L., Yang, J., and Zhang, H. M. (2001). Ecological degradation in protected areas: the case of wolong nature reserve for giant pandas. Science. 292, 98–101. doi: 10.1126/science.1058104
Liu, Y. X., Liu, S. L., Wang, F. F., Sun, Y. X., Li, M. Q., Wang, Q. B., et al. (2021b). Responses of habitat quality and animal biodiversity to grazing activities on the Qinghai-Tibet Plateau. Front. Ecol. Evol. 9:349. doi: 10.3389/fevo.2021.681775
Mao, D. H., Wang, Z. M., Wang, Y. Q., Choi, C. Y., Jia, M. M., Jackson, M. V., et al. (2021). Remote observations in China’s ramsar sites: wetland Dynamics, anthropogenic threats, and implications for sustainable development goals. J. Remote Sens. 2021:9849343. doi: 10.34133/2021/9849343
Mengist, W., Soromessa, T., and Feyisa, G. L. (2021). Landscape change effects on habitat quality in a forest biosphere reserve: implications for the conservation of native habitats. J. Clean. Prod. 329:129778. doi: 10.1016/j.jclepro.2021.129778
Mu, Y. L., Li, X. W., Liang, C., Li, P., Guo, Y., Liang, F. Y., et al. (2021). Rapid landscape assessment for conservation effectiveness of wetland national nature reserves across the Chinese mainland. Glob. Ecol. Conserv. 31:e01842. doi: 10.1016/j.gecco.2021.e01842
Reed, J., Oldekop, J., Barlow, J., Carmenta, R., Geldmann, J., Ickowitz, A., et al. (2020). The extent and distribution of joint conservation-development funding in the tropics. One Earth. 3, 753–762. doi: 10.1016/j.oneear.2020.11.008
Sallustio, L., De Toni, A., Strollo, A., Di Febbraro, M., Gissi, E., Casella, L., et al. (2017). Assessing habitat quality in relation to the spatial distribution of protected areas in Italy. J. Environ. Manage. 201, 129–137. doi: 10.1016/j.jenvman.2017.06.031
Song, W., and Deng, X. Z. (2017). Land-use/land-cover change and ecosystem service provision in China. Sci. Total Environ. 576, 705–719. doi: 10.1016/j.scitotenv.2016.07.078
State Council of the People’s Republic of China. (2010). National Key Functional Zoning Plan. Zhongnanhai: State Council of the People’s Republic of China.
Sun, X. Y., Jiang, Z., Liu, F., and Zhang, D. Z. (2019). Monitoring spatio-temporal dynamics of habitat quality in Nansihu Lake basin, eastern China, from 1980 to 2015. Ecol. Indicators. 102, 716–723. doi: 10.1016/j.ecolind.2019.03.041
Tang, L. P., Ke, X. L., Chen, Y. Y., Wang, L. Y., Zhou, Q. S., Zheng, W. W., et al. (2021). Which impacts more seriously on natural habitat loss and degradation? Cropland expansion or urban expansion? Land. Degrad. Dev. 32, 946–964. doi: 10.1002/ldr.3768
Terrado, M., Sabater, S., Chaplin-Kramer, B., Mandle, L., Ziv, G., and Acuña, V. (2016). Model development for the assessment of terrestrial and aquatic habitat quality in conservation planning. Sci. Total Environ. 540, 63–70. doi: 10.1016/j.scitotenv.2015.03.064
Terraube, J., Helle, P., and Cabeza, M. (2020). Assessing the effectiveness of a national protected area network for carnivore conservation. Nat. Commun. 11:2957. doi: 10.1038/s41467-020-16792-7
Wu, L. L., Sun, C. G., and Fan, F. L. (2021). Estimating the characteristic spatiotemporal variation in habitat quality Using the InVEST model—a case study from Guangdong–Hong Kong–Macao greater bay area. Remote. Sens. 13:1008. doi: 10.3390/rs13051008
Xu, W. H., Xiao, Y., Zhang, J. J., Yang, W., Zhang, L., Hull, V., et al. (2017). Strengthening protected areas for biodiversity and ecosystem services in China. Proc. Natl. Acad. Sci. U.S.A. 114, 1601–1606. doi: 10.1073/pnas.1620503114
Yi, H., Güneralp, B., Kreuter, U. P., Güneralp, I., and Filippi, A. M. (2018). Spatial and temporal changes in biodiversity and ecosystem services in the San Antonio River Basin, Texas, from 1984 to 2010. Sci. Total Environ 619, 1259–1271. doi: 10.1016/j.scitotenv.2017.10.302
Zheng, H., Wang, L., Peng, W., Zhang, C., Li, C., Robinson, B. E., et al. (2019). Realizing the values of natural capital for inclusive, sustainable development: Informing China’s new ecological development strategy. Proc. Natl. Acad. Sci. U.S.A. 116:8623. doi: 10.1073/pnas.1819501116
Keywords: effectiveness assessment, biodiversity conservation, regional comparison, reference condition, human efforts, background differentiation, habitat quality
Citation: Dong K, Liu Z, Li Y, Chen Z, Hou G and Sun J (2022) Comparing the Effectiveness of Biodiversity Conservation Across Different Regions by Considering Human Efforts. Front. Ecol. Evol. 10:855453. doi: 10.3389/fevo.2022.855453
Received: 15 January 2022; Accepted: 11 March 2022;
Published: 04 April 2022.
Edited by:
Zhenguo Niu, Aerospace Information Research Institute (CAS), ChinaReviewed by:
Luan Zhaoqing, Nanjing Forestry University, ChinaCopyright © 2022 Dong, Liu, Li, Chen, Hou and Sun. This is an open-access article distributed under the terms of the Creative Commons Attribution License (CC BY). The use, distribution or reproduction in other forums is permitted, provided the original author(s) and the copyright owner(s) are credited and that the original publication in this journal is cited, in accordance with accepted academic practice. No use, distribution or reproduction is permitted which does not comply with these terms.
*Correspondence: Zhaoli Liu, bGl1emhhb2xpQGlnYS5hYy5jbg==
Disclaimer: All claims expressed in this article are solely those of the authors and do not necessarily represent those of their affiliated organizations, or those of the publisher, the editors and the reviewers. Any product that may be evaluated in this article or claim that may be made by its manufacturer is not guaranteed or endorsed by the publisher.
Research integrity at Frontiers
Learn more about the work of our research integrity team to safeguard the quality of each article we publish.