 Clemens Karwautz
 Yuxiang Zhou
 Marie-Emanuelle Kerros3
 Markus G. Weinbauer
 Christian Griebler
- 1Unit for Limnology, Department of Functional and Evolutionary Ecology, University of Vienna, Vienna, Austria
- 2Institute of Groundwater Ecology, Helmholtz Zentrum München, Neuherberg, Germany
- 3Laboratoire d’Oceìanographie de Villefranche (LOV), Sorbonne Universiteìs, Paris, France
Groundwater ecosystems are typically poor in organic carbon and productivity sustaining a low standing stock of microbial biomass. In consequence, microbial food webs in oligotrophic groundwater are hypothesized to be bottom-up controlled. To date, quantitative information on groundwater microbial communities, food web interactions, and carbon flow is relatively lacking in comparison to that of surface waters. Studying a shallow, porous alpine aquifer we collected data on the numbers of prokaryotes, virus-like particles and heterotrophic nanoflagellates (HNFs), the concentration of dissolved (DOC) and assimilable organic carbon (AOC), bacterial carbon production (BCP), and physical-chemical conditions for a 1 year hydrological cycle. The potential effects of protozoan grazing and viral lysis onto the prokaryotic biomass was tested. Flow of organic carbon through the microbial food web was estimated based on data from the literature. The abundance of prokaryotes in groundwater was low with 6.1 ± 6.9 × 10⁴ cells mL–1, seasonally influenced by the hydrological dynamics, with higher densities coinciding with a lower groundwater table. Overall, the variability in cell numbers was moderate, and so it was for HNFs (179 ± 103 HNFs mL–1) and virus-like particles (9.6 ± 5.7 × 10⁵ VLPs mL–1). The virus to prokaryotes and prokaryote to HNF ratios ranged between 2–230 and 33–2,084, respectively. We found no evidence for a viral control of prokaryotic biomass, and the biomass of HNFs being bottom-up controlled. First estimations point at carbon use efficiencies of 0.2–4.2% with prokaryotic production, and carbon consumed and recycled by HNFs and phages to be of minor importance. This first groundwater microbial food web analysis strongly hints at a bottom-up control on productivity and standing stock in oligotrophic groundwater ecosystems. However, direct measurement of protozoan grazing and phage mediated lysis rates of prokaryotic cells are urgently needed to deepen our mechanistic understanding. The effect of microbial diversity on the population dynamics still needs to be addressed.
Introduction
Groundwater differ considerably from other aquatic environments in their large ecosystems dependence on external energy inputs, exhibiting low water flow velocities (i.e., high water and matter residence time) and dampened seasonal variation (i.e., water temperature). Natural aquifers are typically low in organic carbon and are often limited by phosphorous (Hofmann and Griebler, 2018). Thus, they are considered to be bottom-up controlled, i.e., driven by the amount and bioavailability of organic carbon and major nutrients (Findlay et al., 2003; Foulquier et al., 2010; Stegen et al., 2016). Due to the low concentration of autochthonous substrates, heterotrophic microorganisms are dependent on the input of organic matter and nutrients from terrestrial ecosystems (Stegen et al., 2018; Hofmann et al., 2020). The common perception has been that groundwater contains mostly refractory dissolved organic carbon (DOC) (Hofmann et al., 2020), but in comparison to surface water there is only little available information about the seasonal variation of DOC quality and its availability (Hofmann and Griebler, 2018; Stegen et al., 2018). The import and mixing of electron donors (i.e., organic matter) and electron acceptors (e.g., oxygen, nitrate, etc.) is tightly coupled to the sediment matrix and hydrological dynamics (i.e., seasonal recharge and groundwater flow paths). Subsequently, the flux of organic matter and nutrients within the microbial food web potentially controls the microbial abundance, the productivity and community composition as well as species interactions (Baker et al., 2000; Longnecker et al., 2009; Foulquier et al., 2010).
Protozoa are an important source of nutrients that are made available to the pool of dissolved matter via excretions. At the same time bacteriovorous flagellates channel organic carbon from prokaryotic communities to higher trophic levels (Novarino et al., 1997; Weinbauer et al., 2007; Larsen et al., 2013; Figure 1). There is even evidence for the uptake and inactivation of viral particles by protozoa (Deng et al., 2014; Brown et al., 2020; McMinn et al., 2020). Thus, predation reduces the abundance of prokaryotic cells and viral particles, changes community composition and refreshes the available organic carbon and nutrient resources. Foraging theory predicts that the rate at which a predator population consumes prey depends on the average search time and the average growth yield obtained from a resource patch (Fernandez et al., 2019). Therefore, we expect protozoa and phages to be less capable of all microbial food web members disturbing prokaryotic communities in natural groundwater, due to the low overall abundances and low contact rates in this “diluted” environment (Cram et al., 2016). Protozoa are often exceeded at a ratio of 1:1000 by prokaryotes (Griebler and Lueders, 2009) while viral particles are estimated to outnumber bacteria 10-fold in groundwater (Kyle et al., 2008; Malki et al., 2020).
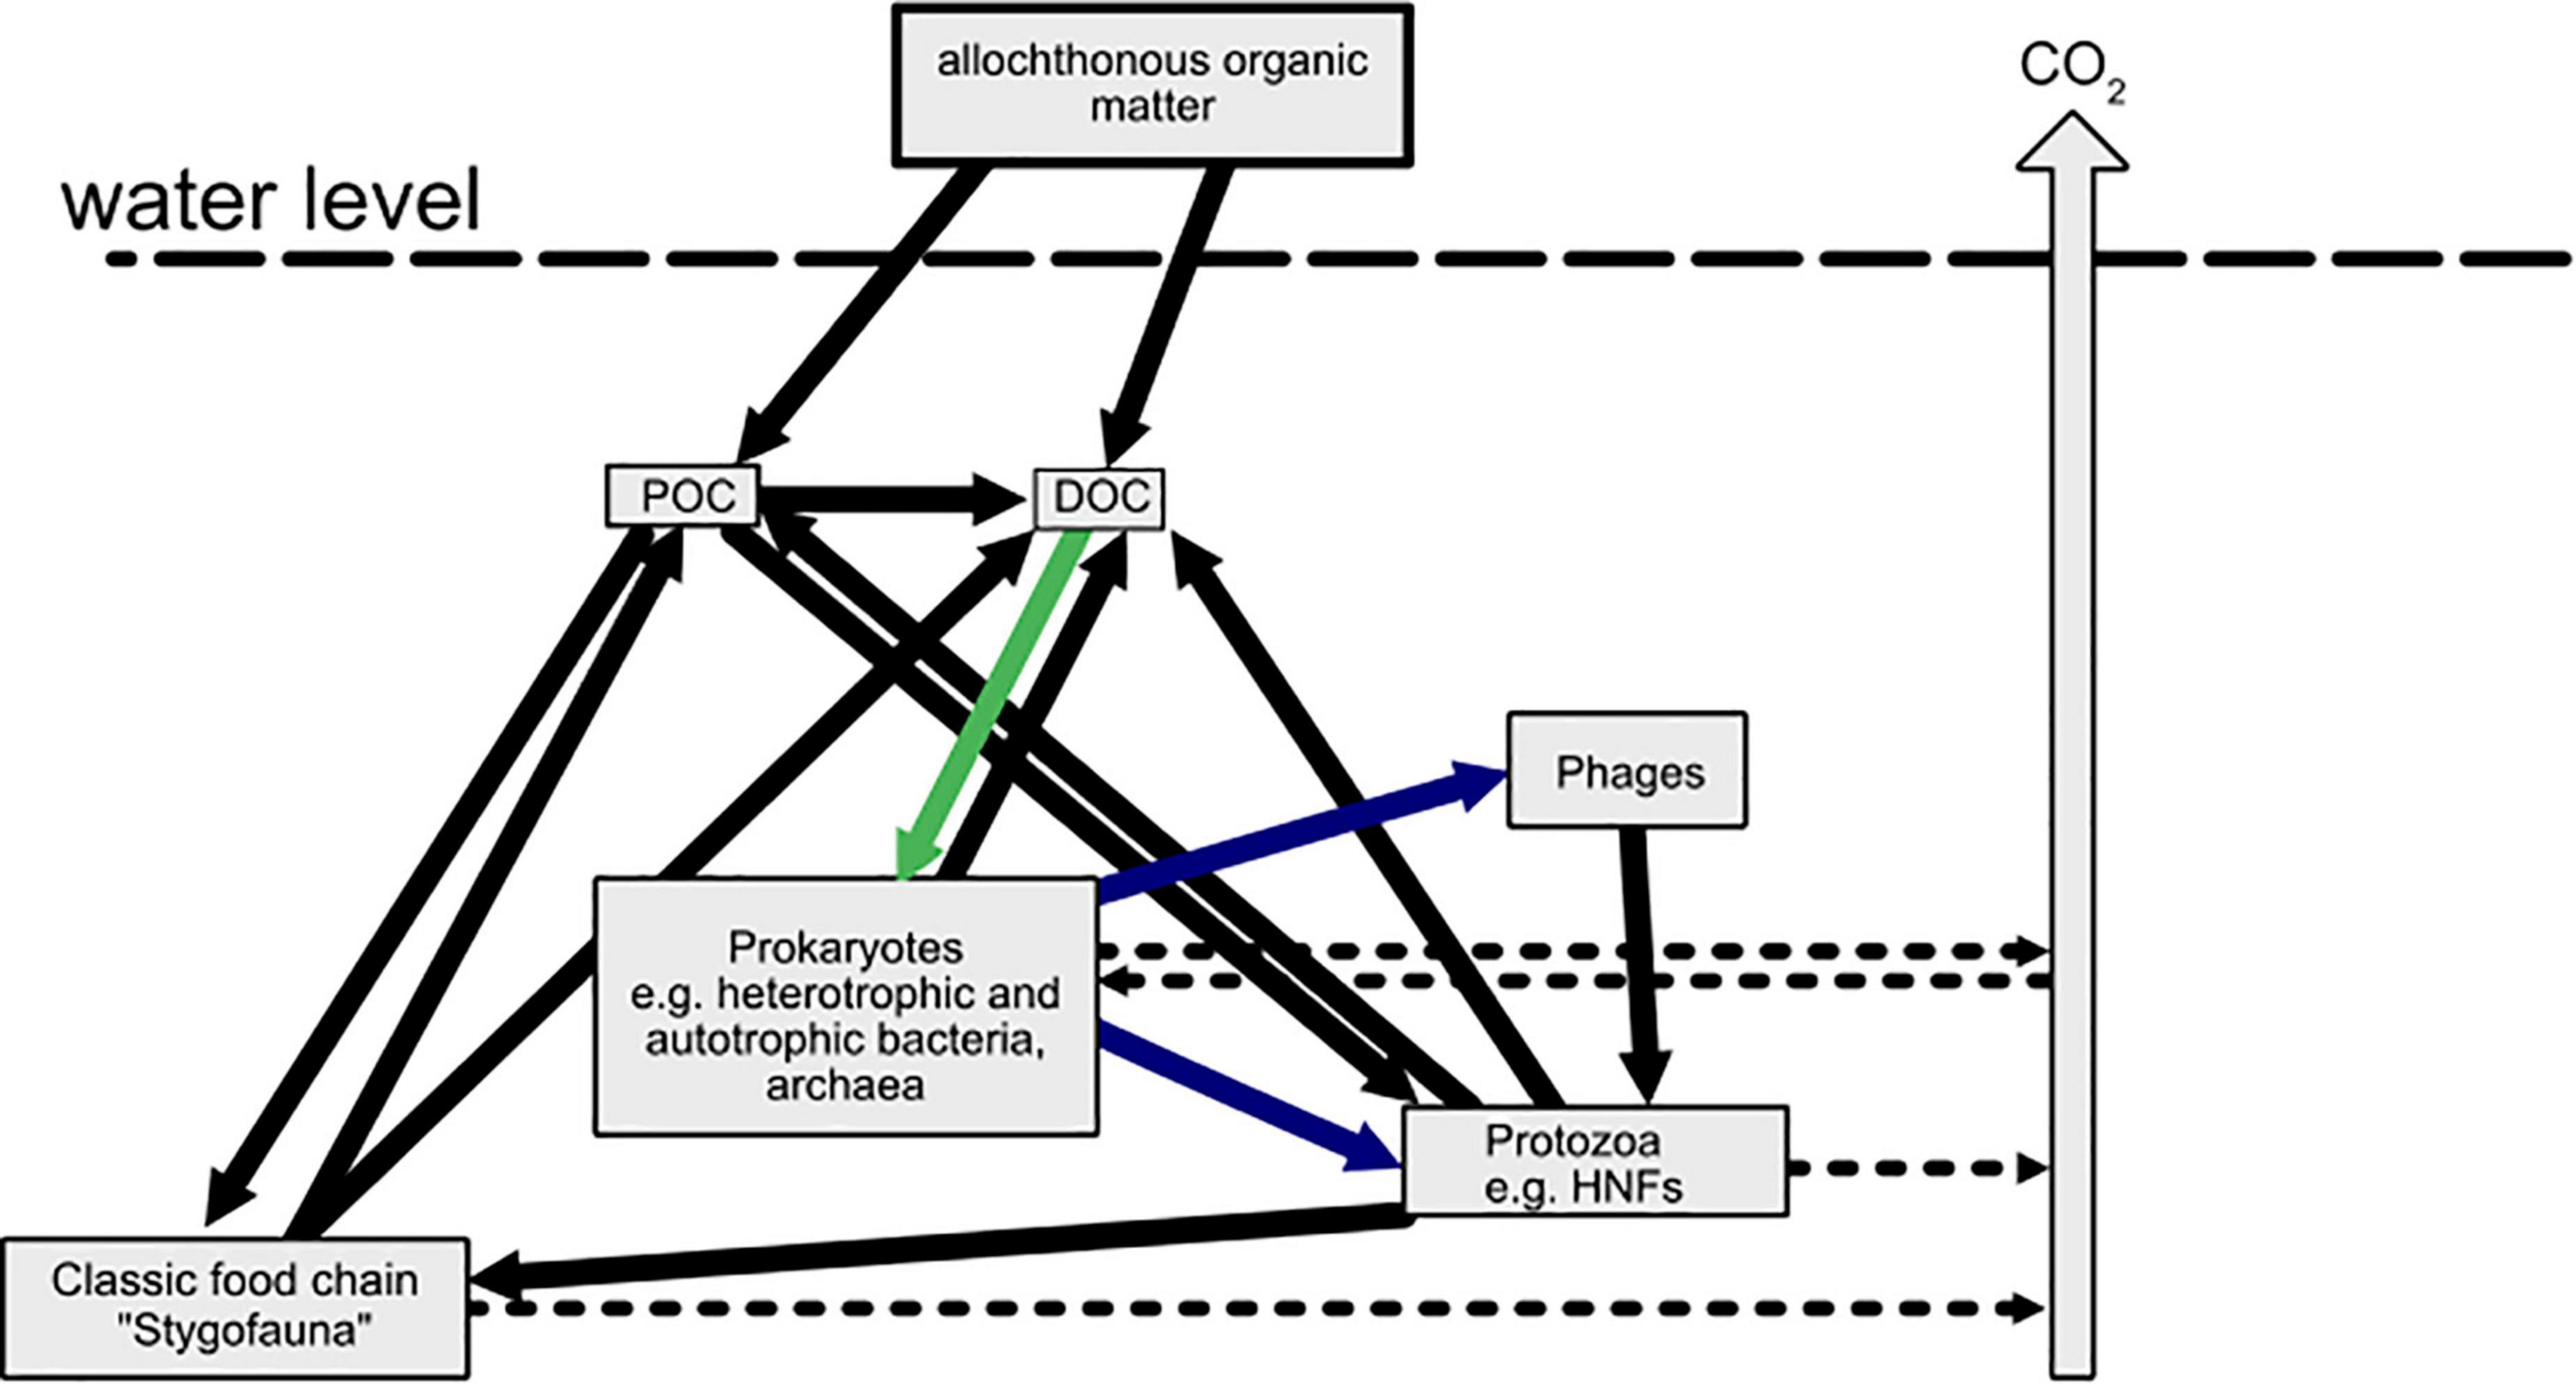
Figure 1. The microbial loop in groundwater ecosystems. In the absence of light, the prokaryotic biomass is largely depended on the import of dissolved organic carbon. Bottom-up control (green arrow) of prokaryotic biomass and top-down regulation (blue arrows) determine the microbial abundance, activity, and production.
The predation of prokaryotes by phages, i.e., viruses that infect bacteria and archaea, in subsurface environments is still debated (Kyle et al., 2008; Roudnew et al., 2013). Phages, can prey selectively on specific prokaryotic populations and replenish the labile DOM pool via the so-called viral shunt (Noble and Fuhrman, 1999; Danovaro et al., 2008). Viruses affect biodiversity at the species and strain level and influence the abundance and productivity of prokaryotic communities (Noble and Fuhrman, 1999; Chow et al., 2014). Several abiotic factors related to temporal variation (e.g., temperature, pH, UV-light) influence the decay of viral particles. Phage propagation is dependent on the physical contact between prokaryotic cells and the virus-particle and the subsequent infection of the cell (Wigington et al., 2016). The contact rate per prokaryotic cell is proportional to the ratio of viral and prokaryotic abundances (here termed virus-to-prokaryotic cell ratio—VPR).
The importance of top-down and bottom-up regulation switches, following changing environmental conditions which occur on spatial and temporal scales (Ducklow, 1992). The limited number of studies taking into account prokaryotes, phages and protozoa (often dominated by heterotrophic nanoflagellates) at these scales are exposing a considerable knowledge gap, especially foraquifers (Foulquier et al., 2010; Wilhartitz et al., 2013; Weitowitz et al., 2019).
Ultimately, these trophic interactions will affect the distribution, abundance and activity of organisms in groundwater ecosystems. The energy flow through a microbial food web links the dissolved organic matter (DOM) to heterotrophic prokaryote communities, predatory flagellates, as well as viral communities (Azam et al., 1983; Thingstad and Lignell, 1997; Rohwer and Thurber, 2009). However, to date there is no comprehensive concept for groundwater ecosystems, which essentially lack phototrophic primary production and the considerable input of detritus, the base for “traditional” food webs and thus the main supply of autochthonous DOC in most surface aquatic ecosystems. After passing the soil layers with seepage water, the remaining DOC is rather stable and needs to be broken up by physical and enzymatic reactions for assimilation by microbes resulting in higher energetic costs and a lower yield.
Alpine stream ecosystems are typically comprised of small catchments, which control the drainage of multiple water sources (i.e., glacier, snowmelt, precipitation, and groundwater). Through the hydrological connectivity, aquifers provide important ecological functions extending stream networks into the subsurface. In most mountainous streams, the highly permeable streambeds allow up- and downwelling of water which creates opportunities for replenishment of substrates and oxygen as well as retention and storage of carbon and nutrients under low flow conditions (Battin et al., 2008). The interplay of surface- and groundwater can be assessed following temporal changes in basic microbial features of both water bodies, such as total microbial abundance, biomass, and activities (van Driezum et al., 2018). In alpine aquifers, heavy rain events and snow melt are expected to temporally alter the nutrient availability and induce biological changes (Baker et al., 2000, p. 200). Seasonal flooding and connectivity to a surface water body will affect the exchange with groundwater in its vicinity (Stegen et al., 2016; van Driezum et al., 2018).
In the present study, we aimed to: (1) Assess whether the groundwater microbial food web in an alpine aquifer is top-down or bottom-up controlled. We further (2) investigate the natural variability of the environmental parameters and the microbial food web structure across space and time (i.e., within a seasonal cycle); and (3) estimate the carbon flux through the microbial groundwater food web. In this context, the availability and degradability of the dissolved organic carbon (DOC) is hypothesized to be an important factor, which regulates the productivity of the different trophic levels (prokaryotes, protozoa, and viruses).
Materials and Methods
We monitored the abundance of prokaryotic cells, heterotrophic flagellates and virus-like particles in a shallow, alpine groundwater system at four sampling sites over one seasonal cycle. The groundwater and adjacent river water were sampled every 2 months over the period of 1 year. Based on the concentrations of DOC, assimilable organic carbon (AOC) and prokaryotic carbon production (here termed BCP, since bacterial carbon production has been used more commonly in the literature), the carbon flux within the food web was estimated. Potential grazing rates of heterotrophic nanoflagellates (HNF) and virus induced bacterial lysis rates were used to estimate carbon cycling and mortality of prokaryotes.
Study Area
The investigated aquifer is located close to the village of Mittenwald, in the Bavarian alps, Germany (N47.42, E11.25). Groundwater was sampled from four monitoring wells, MIT037, MIT038, MIT039, and MIT052, which depict a hydrogeological gradient with varying influence from the adjacent Isar river and different land-use (Figure 2). In a preliminary study (Zhou et al., 2012), the aquifer was characterized as oligotrophic with only minor anthropogenic impacts (e.g., agricultural land-use, leaching of road salt in winter). Well MIT052 is located upstream on a mountain pasture, while the wells MIT038 and MIT039 are situated in a farmed grassland. MIT037 is closest to the Isar river (∼10 m) and the main road at the entrance to Mittenwald. The river water was collected next to well MIT037.
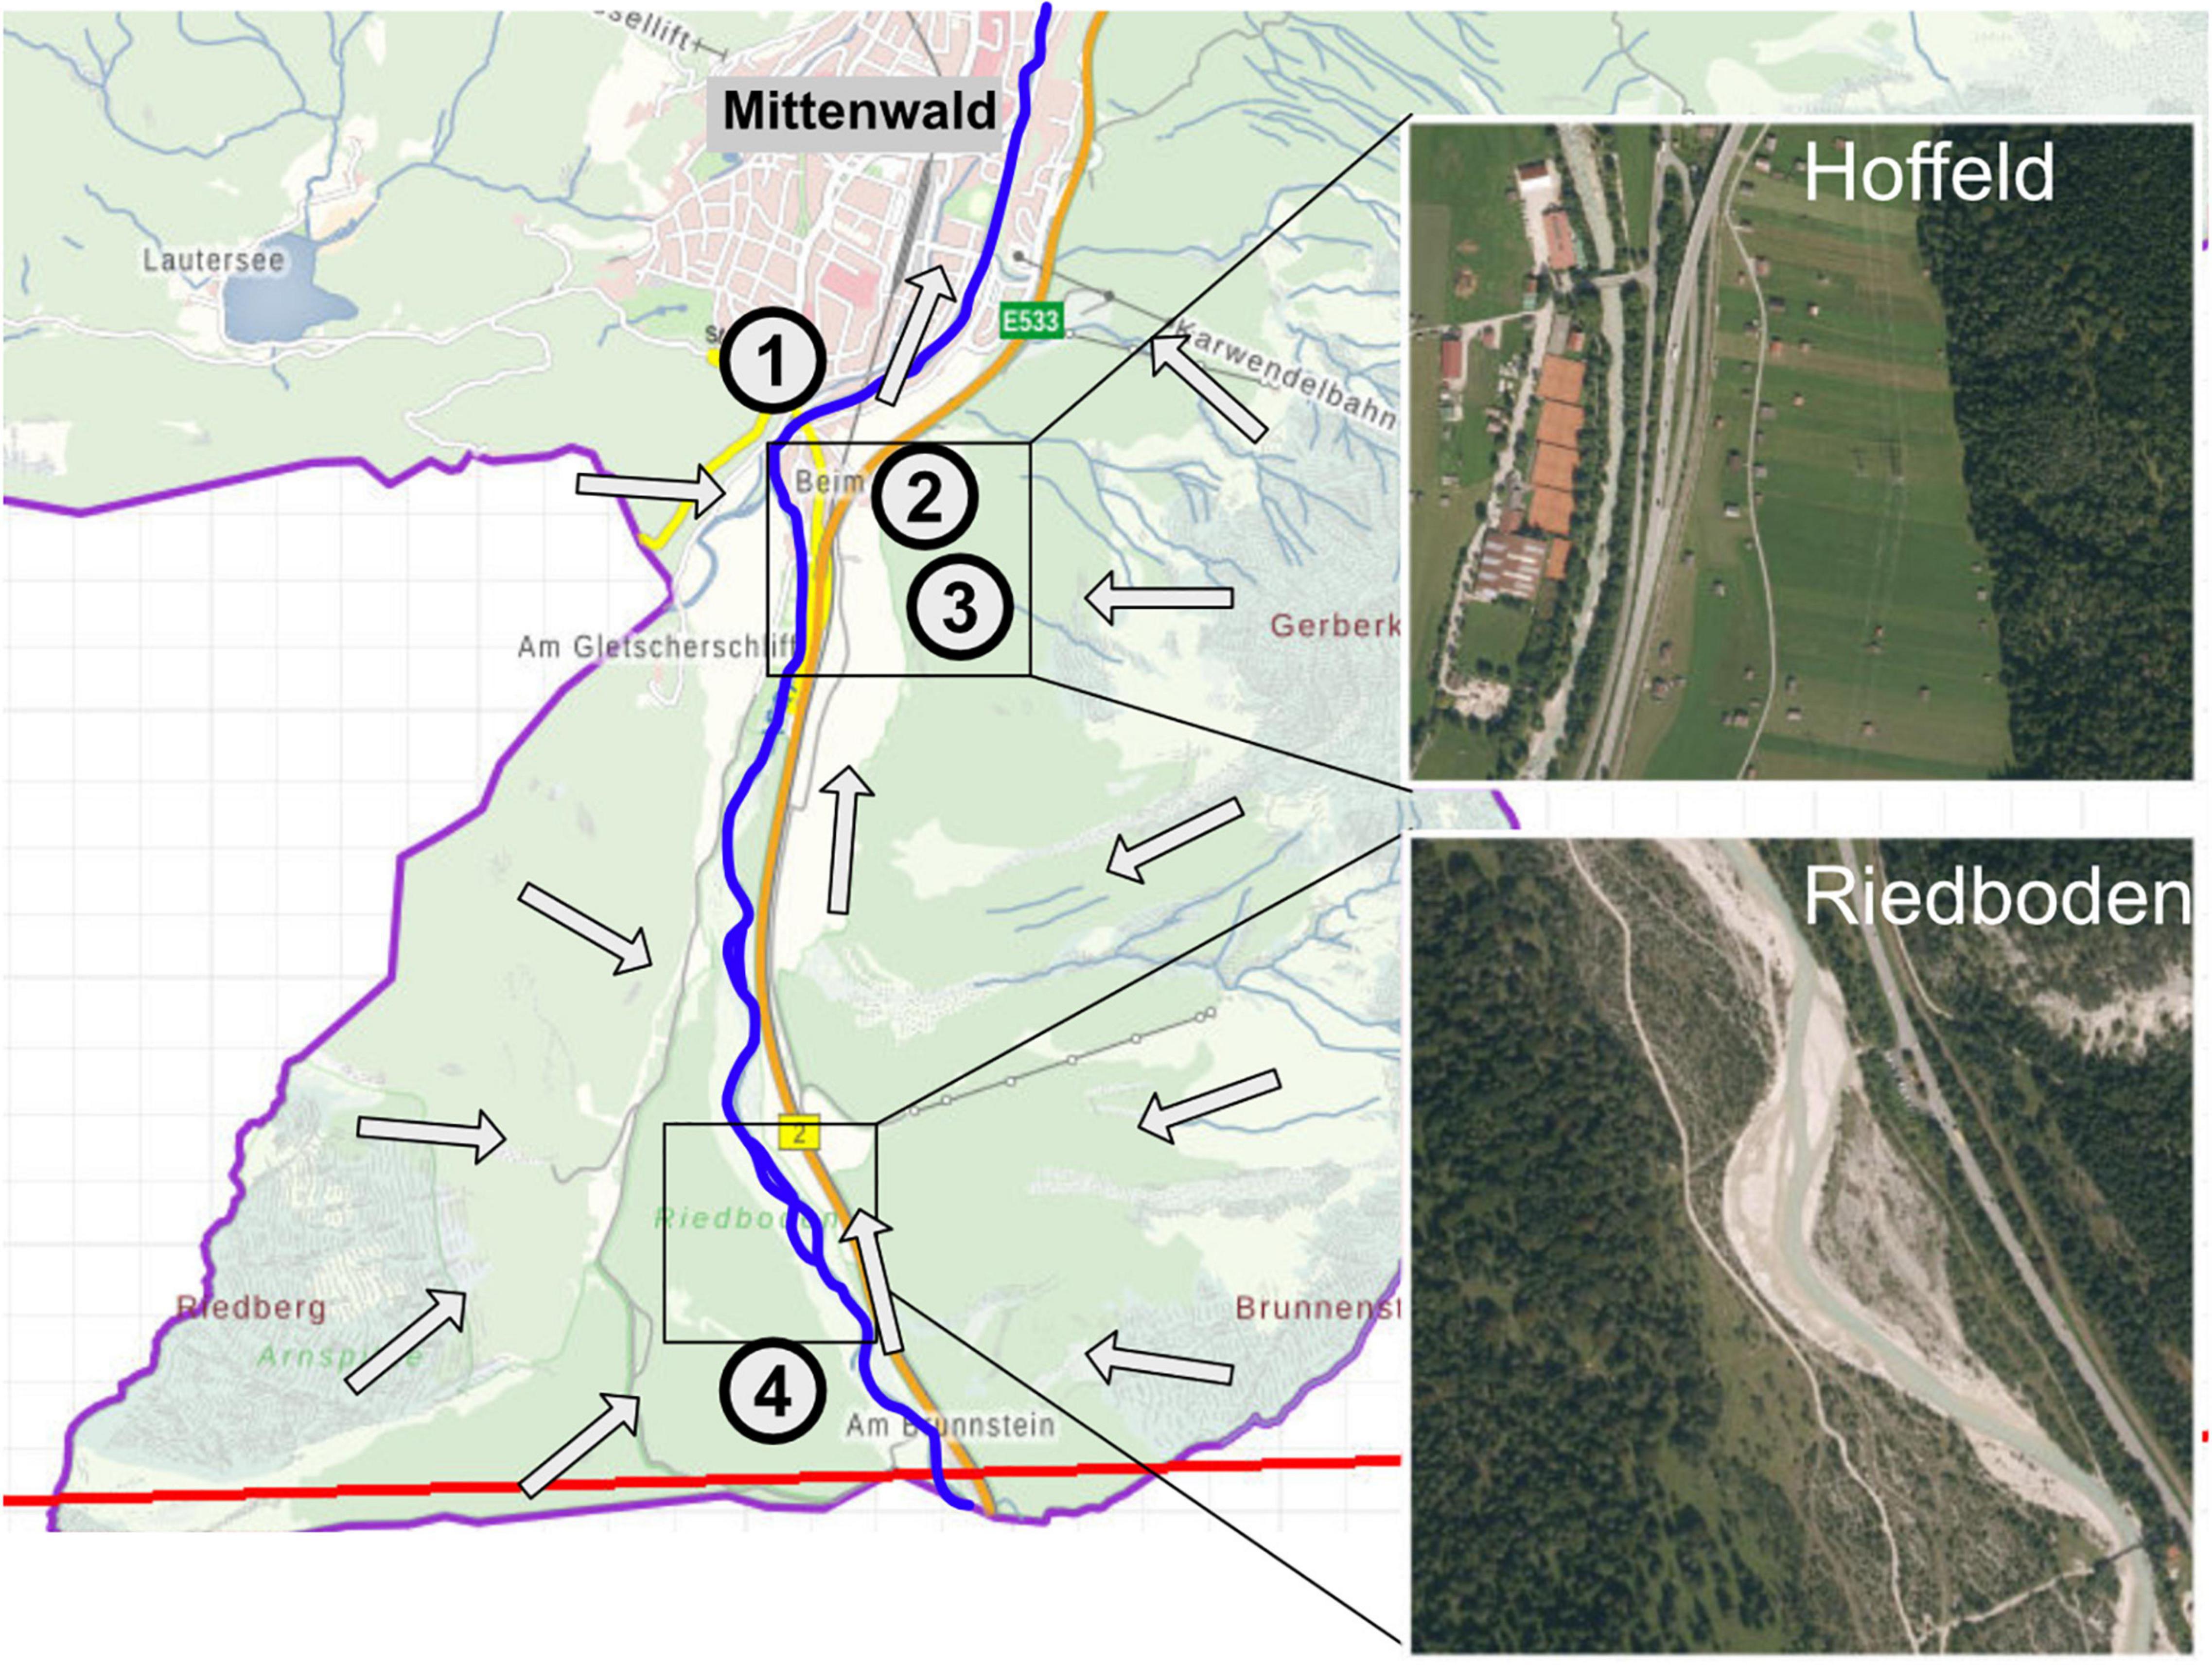
Figure 2. Map highlighting the location of the selected groundwater monitoring wells and the Isar River. Arrows indicate the general direction of groundwater flow. Wells MIT037 (1), MIT038 (2), and MIT039 (3) are distributed in the area of “Hoffeld” close to the village of Mittenwald, while well MIT052 (4) is located in the mountain pasture “Riedboden.” While the “Hoffeld” is dominated by meadows and hayfields, the “Riedboden” is interspersed with pine trees and shrubs. Satellite images provided by Google Maps (2022).
Mittenwald is characterized as a warm-summer humid continental climate. The mean annual air temperature lies at 7.5°C. The yearly precipitation starts with the lowest values (57 mm) Whereas in February and November the lowest precipitation values of 58 and 55 mm, respectively, are recorded, the highest precipitation is found in July and August (190 and 194 mm). In total an average annual precipitation of 1421 mm (2000–2021, Climate Data Center Germany) has been documented. The shallow, quaternary unconsolidated sediments consists of gravel and coarse to medium sand with a high hydraulic conductivity. The monitoring wells are fully screened with well depth ranging from 14.4 to 30.7 m and a mean water column of 13.2 + 4.3 m. The annual discharge displays a temporal pattern depicted in pronounced water table fluctuations and steep temperature changes (Supplementary Figure 1). The snow melting in spring to early summer contributes to the hydraulic mixing of meltwater, river water, and groundwater. Additionally, strong rain events in summer and autumn and the continuous discharge of karst water from the mountains impacts the aquifer hydrology.
Sampling
In total six sampling surveys were carried out in 2–3 months intervals from March 2010 to March 2011. Thereby, the seasonal variation (i.e., transpiration and precipitation) and its effect on groundwater hydrology (e.g., recharge) was assessed. Hydrological data and physico-chemical parameters (e.g., electrical conductivity, temperature, water table, pH, redox potential, and concentration of dissolved oxygen) were assessed on-site using field sensors (WTW, Weilheim, Germany). Well water was pumped according to the standard operating procedure (USGS, 2006) purging a minimum of three times the well volume with a MP1 submersible pump, which was placed at the center of the water column, before taking a representative groundwater sample. River water was collected from the Isar next to the monitoring well MIT037 and filled directly into sterile 10 liter containers. All samples were kept dark and refrigerated until further processing in the laboratory. The respective samples (cell counts and DOC) were fixed immediately in the field.
Dissolved, Nutrients, and Major Ions
The dissolved organic carbon (DOC) and major anions and cations were analyzed on a TOC analyzer (Shimadzu TOC-V, Germany) and an ion chromatograph (Dionex DX100, Germany), respectively (Zhou et al., 2012). The water samples for DOC measurement were acidified with HCl (∼pH 2) and filtered through pre-rinsed 0.45 μm pore size cellulose-nitrate filters (Millipore, Darmstadt, Germany). The non-purgeable organic carbon fraction was combusted (680°C) to CO2 and measured with a non-dispersive infrared detector. Major ions were separated by ion chromatography (for cations: CS 12A 4 mm column with a CSRS Ultra II 4 mm suppressor and for anions: AS 4A 4 mm column with an ASRS-Ultra II 4 mm suppressor) and quantified using reference standard solutions. All samples were kept in clean glass vials at 4°C until analysis in triplicates.
Carbon Turnover and Microbial Activity
For determining the microbial carbon production (i.e., BCP) and assimilable organic carbon (AOC) the water samples were incubated immediately after sampling and measured as described in detail by Zhou et al. (2012). In brief, for estimating the prokaryotic production of heterotrophic groundwater microorganisms, 3H-leucine incorporation into microbial proteins was measured (Brielmann et al., 2009). 3H-leucine (10 nM, 44 Ci mmol–1) was added to triplicates of 50 ml samples and incubated for 8 h in the dark at 12°C. Samples and a control, which was fixed immediately after 3H-leucine addition with formaldehyde (3.7% final conc.), were terminated and incubated with ice-cold trichloroacetic acid (TCA, 10% v/v) for the precipitation of proteins. After collection of macromolecules on a 0.2 μm cellulose nitrate filter (Millipore), the dried filters were dissolved in ethyl acetate and a scintillation cocktail was added. Samples were stored overnight at 4°C before measurement on a Tri-carb 1600 TR liquid scintillation counter (Perkin Elmer) and corrected for quenching. Incorporation rates were converted to carbon production rates (μg C L–1 h–1) as described in Baltar et al. (2010).
For estimating the AOC, triplicates of 45 ml samples were filtered (0.22 μm) and incubated with 5 ml of the same groundwater for 30 days at ambient temperature (Escobar and Randall, 2001). Cell numbers were determined by flow cytometry at the start and the end of the incubation and converted to carbon equivalents (15 fg C cell–1).
Last, microbial cell viability was determined based on ATP concentrations with the BacTiterGlo kit according to the manufacturer (Promega). Cells were lysed and the light produced by the ATP-dependent oxidation of luciferin by luciferase was detected at 600 nm in a Luminometer (GloMax, Promega, Walldorf, Germany). All samples were analyzed in biological triplicates.
Enumerating Prokaryotes, Heterotrophic Nanoflagellates, and Virus-Like Particles
For the enumeration of prokaryotic cells, HNFs and viruses, water samples were collected in sterile plastic tubes (Falcon, BD) and fixed with formaldehyde (final concentration 2.5%). The total number of prokaryotes was determined on a flow cytometer (FACSCalibur, BD Sciences, United States), equipped with an air-cooled laser, providing 15 mW at 488 nm. Samples were prepared according to the protocol of Anneser et al. (2010). The fixed water samples were stained with SYBR green I (Molecular Probes, Invitrogen, Karlsruhe, Germany) at a ratio of 1: 10 000 for 15 min in the dark at room temperature. Cells were identified by their signal in a plot of side scatter (SSC) vs. green fluorescence using a reference counting beads solution (BD Trucount). The same approach was applied for viruses. However, virus-like particles (VLPs) were stained with SYBR Green I (10,000 × concentrate in DMSO; Invitrogen, Molecular Probes) and prepared as described in detail by Brussaard (2004). In brief, 5 μL working stain solution (1:200 diluted in sterile Milli-Q water) was added to 500 μL sample. The samples were incubated at 80°C for 10 min in the dark, followed by a cooling period at room temperature in the dark for 5 min before analysis. In case of high VLP concentrations, samples were diluted with 1x TE-buffer (1:10 or 1:100) to increase the accuracy of the analysis. TE-buffer and autoclaved 0.2-μm-filtered sample were measured as controls. The samples were recorded in biological duplicates. Populations of VLPs were identified on the plots of the side scatter vs. green fluorescence at 530 nm. The flow cytometry data was analyzed using the CellQuest Pro software (BD Bioscences, version 4.0).
Enumeration of nanoflagellates was conducted using fluorescence in situ hybridization (FISH), following the protocol of Glöckner et al. (1996), which has been modified as follows. In order to collect enough cells, 300 mL water samples were fixed with formaldehyde and filtered through polycarbonate filters (0.2 μm pore size; 25 mm diameter; type GTTP; Millipore, Burlington, United States), supported by cellulose acetate filters (0.45 μm pore size; Millipore). Subsequently, filters were dipped in low-gelling-point agarose [0.1% (wt/vol) Biozym, United States], dried upside down on a glass slide at 37°C and dehydrated in 96% (vol/vol) ethanol. The cell walls were permeabilized by incubating the filters in lysozyme (10 mg mL–1 in 0.05 M EDTA, pH 8.0; 0.1 M Tris-HCl, pH 8.0; Sigma, Vienna, Austria) at 37°C for 1 h. For the inactivation of endogenous peroxidases filters were then washed three times in Milli-Q water and incubated in 0.01 M HCl for 20 min at room temperature. After washing off residues the filters were dehydrated in 50, 80, and 96% ethanol for 2 min and air-dried at room temperature. Each filter was wetted with 16 μl hybridization buffer [NaCl 0.9 mol L–1, TRIS HCl 0.02 mol L–1, formamide 45% (vol/vol), sodium dodecyl sulfate (SDS) 0.02% (wt/vol)] in a moisture chamber at 46°C. The labeled oligonucleotide probe EUK 1195 (5’-GGGCATCACAGACCTG-3’) (Giovannoni et al., 1988), was added to the hybridization buffer to a final concentration of 3 ng μl–1 and incubated for 90 min. After hybridization, the filters were transferred to a pre-heated washing buffer (TRIS HCl 20 mmol L–1, EDTA 5 mmol L–1, NaCl 30 mmol L–1, SDS 0.01%) at 48°C for 20 min. Filters were washed three times in Milli-Q water and air-dried on the glass slide at room temperature. The slides were counterstained (DAPI/Antifade Solution; Millipore, United States) and embedded in Glycerol/PBS buffer solutions (Citifluor, AF1). The cell counting was performed on a epifluorescence microscope (Axioplan 2 Zeiss, lamp: HXP-120 LEj, camera: Axiocam Zeiss) at 63× magnification.
Statistical Analysis and Data Elaboration
All statistical analyses were performed using the R computing language, version 3.6.1 (R Development CoreTeam, 2014). For the statistical comparisons and testing of relationships between hydrological and microbial we used the vegan package (2.5.−7) (Oksanen et al., 2013). Plots were refined using the Affinity Designer software (1.9.3).
The model to assess top-down vs. bottom-up control proposed by Gasol (1994) plots the log-transformed bacteria and HNFs abundances on a bivariate space. Two regression lines depict the opposing trends based on a large dataset from marine and freshwater ecosystems. The maximum attainable abundance line (MAA) represents the HNF abundance that could be attained for given prokaryotic abundance, assuming HNFs feed only on prokaryotes. The mean realized abundance line (MRA) is based on the averaged abundances of prokaryotes and flagellates from the original dataset (Gasol, 1994). Data points close to the MAA line indicate that HNF are mainly under bottom-up control. In contrast, location of data points close to the MRA line means that top-down processes are predominant in the control of HNF abundance. Data located far below the MRA line depict very strong grazing pressure on HNF.
Results and Discussion
Oligotrophic aquatic environments and in particular groundwater habitats, are considered to be bottom-up controlled (Findlay et al., 2003; Foulquier et al., 2010). Microbial production as well as growth efficiency do not only depend on total DOC concentrations but its composition and bioavailability (Thingstad and Lignell, 1997; Del Giorgio and Cole, 1998; Moran et al., 2022), as well as other nutrients (Hofmann and Griebler, 2018). The role of top-down forces and their drivers are often more complex to study, but are critical to be evaluated (Chow et al., 2014; Våge et al., 2018; Weitowitz et al., 2019).
The DOC pool in groundwater is composed of allochthonous and autochthonous inputs which are presumably of varying quality. DOC produced by grazing and lysis are supposedly of high quality and could be consumed immediately (Noble and Fuhrman, 1999; Sherr and Sherr, 2002; Danovaro et al., 2008; Moran et al., 2022). Hence, the activity of predators may replenish the bioavailable DOC pool. Evidence of grazing success would be displayed by a temporal increase in predators and a decrease of prokaryotic abundance. The subsequent release of degradable DOC could then result in an increase of prokaryotic growth determined by AOC and BCP values. Such a dynamical microbial system has been formalized in the generalized Lotka-Voltera equations. While the model seems to fit data of simple, lab-cultured communities, it is not easy to scale up to describe larger communities (Gonze et al., 2018).
Here, we discuss our data on the organismic standing stocks differentiated into protozoa, virus-like particles and prokaryotes. Furthermore, we examine the temporal and spatial variation of the environmental parameters and their impact on the prokaryotic activity and productivity. In addition to the comparison between groundwater monitoring wells and sampling times we include measurements from the river water in our analysis. Whenever we include the surface water in our analysis, we specifically state this in the text or graph. Finally, we use the available data of groundwater food-web interactions to infer rates and limitations. The data presented here is limited to four groundwater wells within one alpine aquifer and seasonal dynamics were recorded for just 1 year.
Temporal and Spatial Variation of Groundwater Chemistry, Dissolved, and Nutrient Availability
The investigated groundwater ecosystem exhibited strong hydrological changes, indicated by groundwater table fluctuations of several meters within a year. The groundwater table did not change significantly between seasons [ANOVA: F(3,20) = 3.593, p = 0.06], but a significant difference was found between wells [ANOVA: F(3,20) = 33.854, p < 0.05]. The groundwater levels in well MIT052 were significantly lower than in other wells (Welch t-test: t = −5.6, df = 5.4, p < 0.05) ranging from 9.1 to 16.9 m below land surface (Supplementary Figure 1). In all wells the rising water table was most likely driven by recharge from snow meltwater in late spring and heavy rain events in late summer.
Typical of the pristine conditions in the aquifer, most physico-chemical parameters (e.g., oxygen, pH, nitrate) stayed relative constant over the seasonal cycle (Table 1). The mean groundwater temperature was 7 ± 1.4°C with the highest variation in well MIT037 ranging from 2.6°C in winter to 9.3°C in summer. The raise in water temperature did not affect oxygen levels or the pH. The shallow groundwater was well-oxygenated throughout the year with dissolved oxygen (DO) concentrations ranging from 8.2 to 11.3 mg L–1. The pH stayed slightly alkaline with a mean of 7.8 ± 0.2.
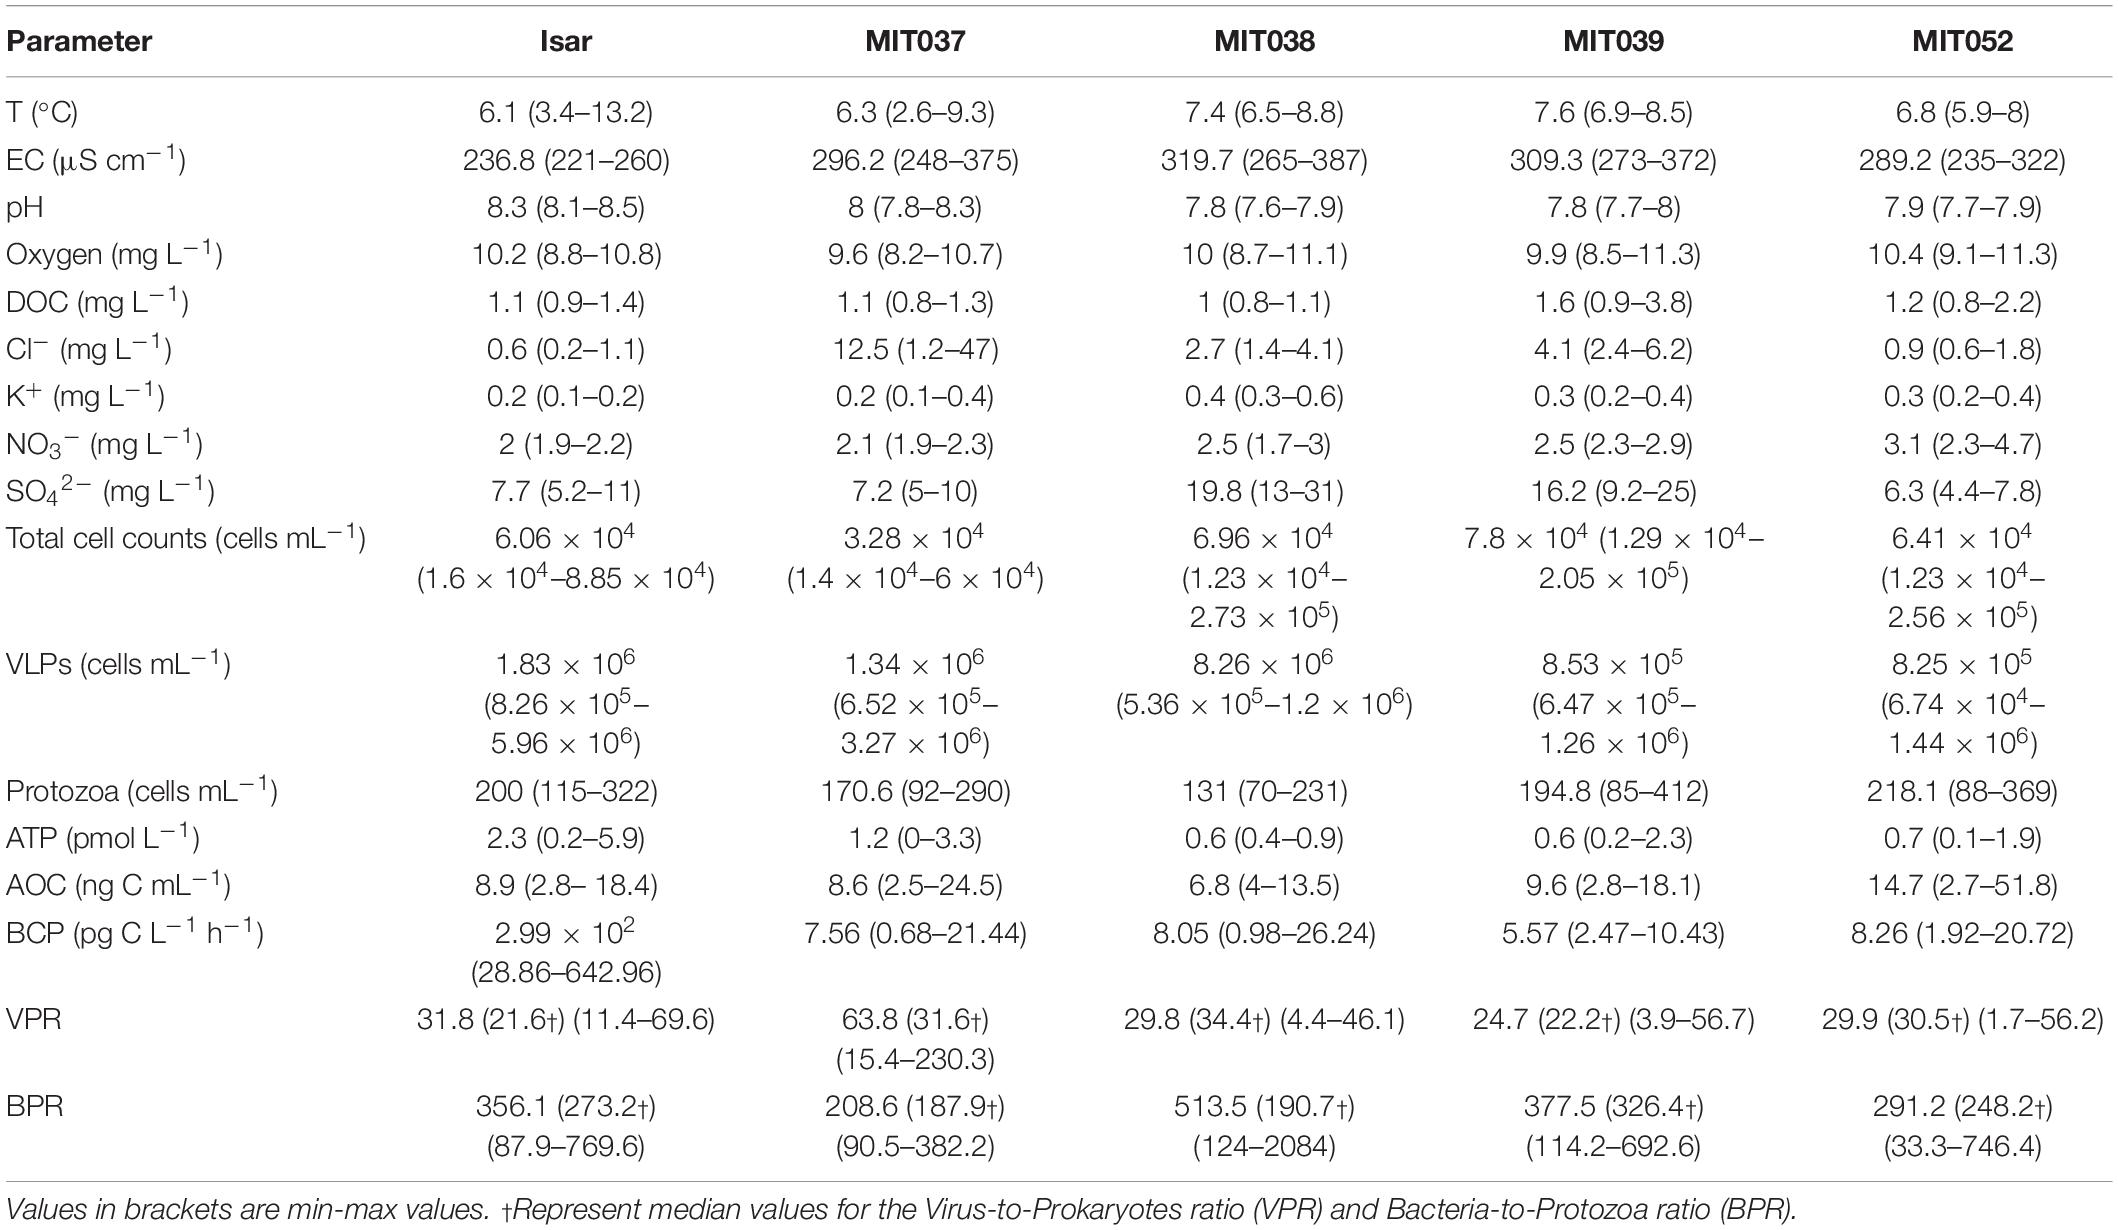
Table 1. Mean values of physicochemical and microbiological parameters of a 1 year sampling campaign.
Notably, the electrical conductivity, which is used as proxy for the nutrient- and ion load, was significantly higher in the groundwater than in the Isar river water (Welch t-test: t = −7, df = 24.8, p < 0.05). The groundwater showed a high temporal variation with the lowest values recorded in winter (274.9 ± 19.5 μS m–1) and the highest in summer (320 ± 45.8 μS m–1).
A peak in chloride concentrations of 47 mg L–1 in spring in the groundwater from well MIT037 may indicate road salt leaching as described in Zhou et al. (2012). Sulfate concentrations varied substantially (12.4 ± 7.3 mg L–1), with the highest variation in spring associated to the high concentrations (max = 31 mg L–1) at wells MIT038 and MIT039 and low values at wells MIT037 and MIT052 (min = 4.4 mg L–1). Seasonally, the sulfate concentrations were elevated in spring and decreased in summer, especially in the wells located in the farmed grassland (MIT038 and MIT039).
The comparison of all wells shows that the location and distance to the river water matters. While the water chemistry in water from well MIT037 was influenced by the river, groundwater from the other wells were much more disconnected. Wells MIT38 and MIT39 were very similar in their environmental setting and well MIT52 was the most distinct with the highest hydrodynamic fluctuations (Supplementary Figure 1).
We found no significant differences for DOC values between seasons (Kruskal-Wallis test: χ2 = 4.6, df = 3, p = 0.2) or well locations (Kruskal-Wallis test: χ2 = 2.8, df = 3, p = 0.42). The DOC concentrations in the groundwater and Isar river water showed no significant difference (t-test: t = −0.64, df = 27.6, p-value = 0.5).
The concentrations of carbon (DOC: 1.2 ± 0.6 mg L–1 SD), soluble reactive phosphorous (SRP) and nitrate (NO3–: 2.6 ± 0.6 mg L–1) showed little variability over the whole year. SRP concentrations in the groundwater and Isar water samples were close to the detection limit (<5 μg L–1). A similar pattern was observed for nitrate (Table 1), which represented the largest inorganic nitrogen pool in this aquifer.
The deficiency of dissolved organic carbon (<1 mg L–1) and nutrients in pristine aquifers is typically attributed to the microbial activity in the overlying soil layers. In an alpine setting, the surrounding vegetation contributes less organic matter (mostly coarse particulate organic matter) than in lowland systems and shows higher temporal variability (Hood et al., 2003; Fenoglio et al., 2014).
Community Dynamics of Prokaryotes, Virus-Like Particles, and Heterotrophic Nanoflagellates
In general, the prokaryotic cell densities in the alpine groundwater were low [mean () 6.1 × 10⁴ ± 6.9 × 10⁴ cells mL–1 SD] throughout the year and changed between sampling sites and sampling times. Comparison of the cell densities between wells revealed no significant differences. The highest variability of total cell counts (TCC) occurred in groundwater from well MIT039 ranging from 1.29 × 10⁴ to 2.05 × 10⁵ cells mL–1. In groundwater, the highest cell numbers and greatest variation between wells and within seasons was found in spring (7.2 × 10⁴ ± 8.1 × 10⁴ cells mL–1) and winter (8.6 × 10⁴ ± 9.9 × 10⁴ cells mL–1), the latter was due to high cell densities in well water from MIT038 and MIT039. Even though a visual inspection of graphs suggest a temporal dynamic for the prokaryotic cells in the groundwater (Figure 3), no significant difference was found [ANOVA: F(3,20) = 0.979, p = 0.422]. Surprisingly, the cell abundance in the Isar river water was in the same range (min: 6.1 × 10⁴ cells mL–1; max 8.8 × 10⁴ cells mL–1) as in groundwater (Student t-test: t = −0.02, df = 23.32, p-value = 0.98).
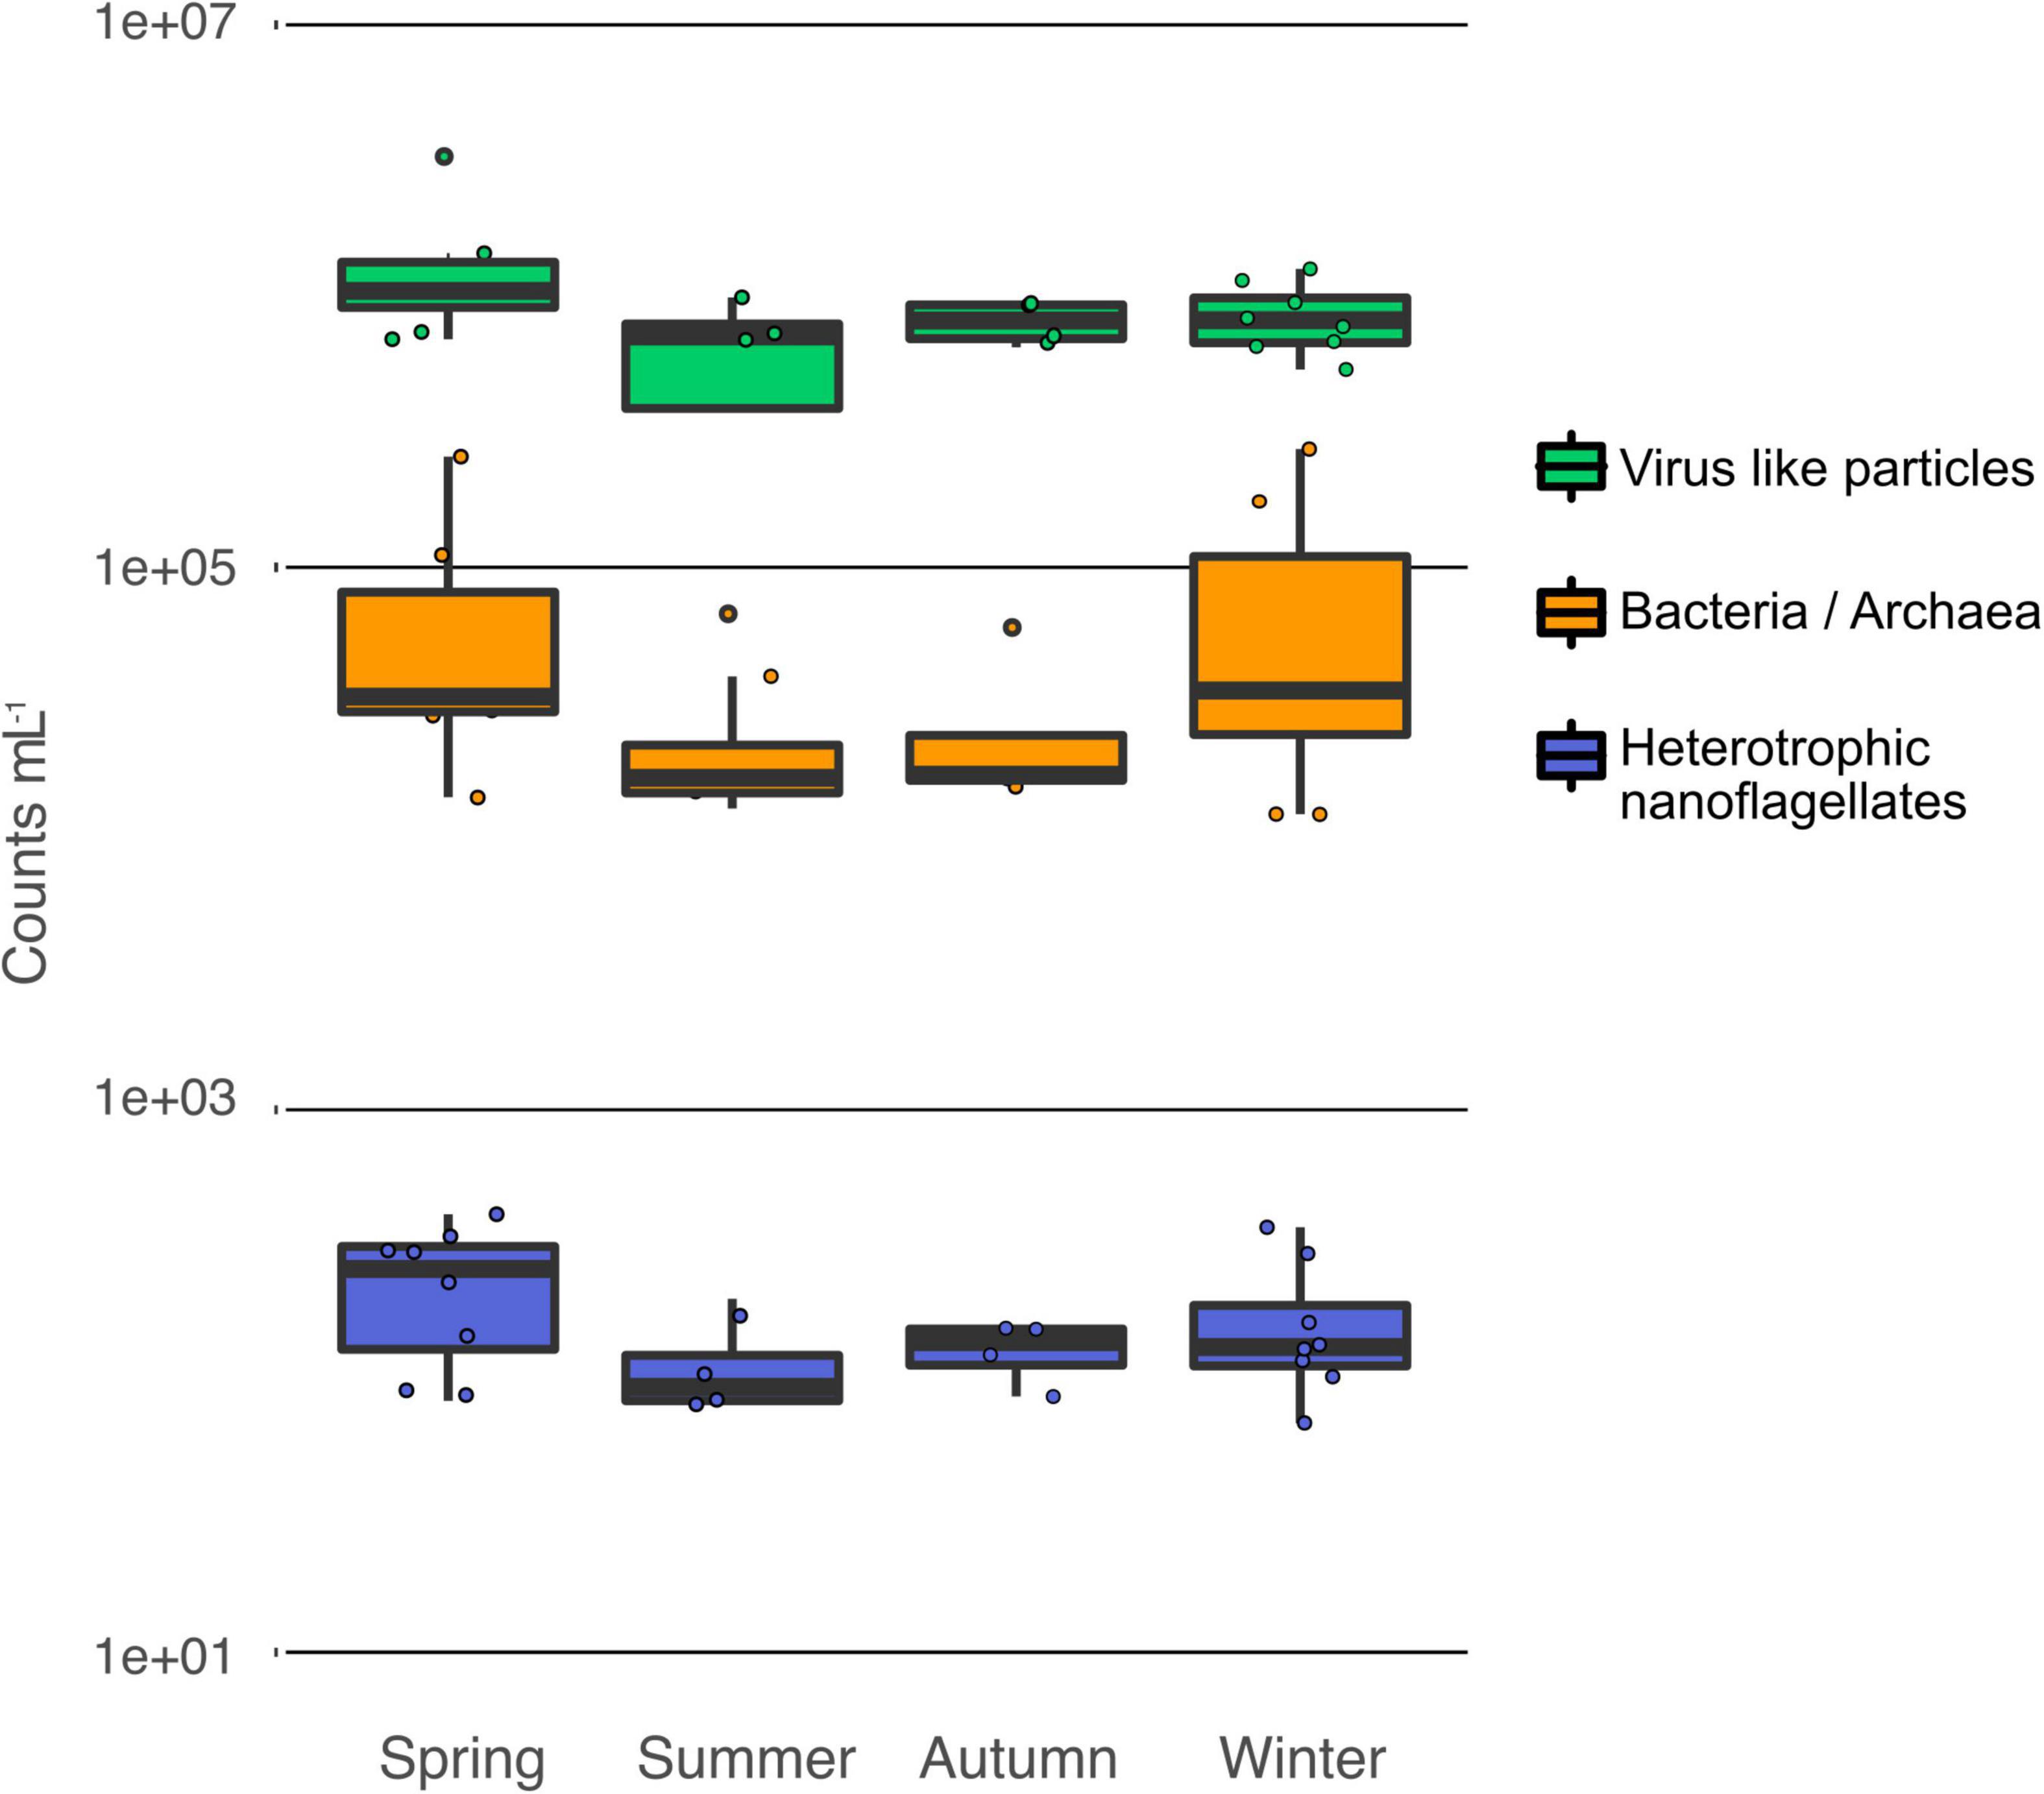
Figure 3. Temporal variation of the cell densities in alpine groundwater. Counts of prokaryotes, heterotrophic nanoflagellates, and virus-like particles.
In this study, we assumed that heterotrophic nanoflagellates were the most relevant protozoan predators. The densities of heterotrophic nanoflagellates ranged from 69 to 412 HNF mL–1 (Figure 3), as expected in oligotrophic groundwater (Griebler and Lueders, 2009; Wilhartitz et al., 2013). Seasonal differences of HNF abundance were not significant [ANOVA: F(3,20) = 1.56, p = 0.23]. Again, no substantial difference between the water of the alpine Isar river and the adjacent groundwater was observed. The ratio of prokaryotic cells to protozoa (BPR) in groundwater ranged from 33 to 2,084 (Table 1) with an average BPR of 347.
The abundance of viral particles (1 × 10⁶ ± 5.7 × 10⁵ VLPs mL–1) was variable throughout the year. The variability was caused by temporal and spatial fluctuations in VLP abundances (Table 1), especially in well MIT052. The VLP to prokaryotes ratio (VPR) ranged from 2 to 230 (37 ± 45). Still, no significant temporal pattern was observed for the VPR data [ANOVA: F(3,20) = 0.35 p = 0.79, log-transformed].
The abundance of prokaryotes (Spearman’s rank correlation: S = 3253.4, ρ = −0.41, p-value = 0.04) and heterotrophic nanoflagellates (Spearman’s rank correlation: S = 3288.2, ρ = −0.42, p = 0.03) were correlated with changes in groundwater table. The highest densities were recorded at low groundwater tables, indicating high water tables came along with a dilution effect. Virus-like particles did not follow this correlation (Spearman’s rank correlation: S = 3208.2, p-value = 0.06, ρ = 0.39).
This data indicates that independent of the distance to the river, there seems to be a more or less constant flux of microbes through the aquifer. However, with a changing composition of the planktonic prokaryotic community as was shown by Zhou et al. (2012) during the seasonal cycle.
Carbon Turnover and Microbial Activity
The oligotrophic groundwater represent an extreme environment, corresponding to long time periods between encounters with low resource levels. Microbes require ATP, derived from energy-yielding (i.e., catabolic) reactions, for biomass formation and cell maintenance. Decreasing the metabolism (e.g., dormancy) and miniaturized cell size are important life strategies in oligotrophic subsurface environments (Fernandez et al., 2019; Kundu et al., 2020). In response to favorable environmental conditions microorganisms can then exit the non-growing state. Phenotypic heterogenous prokaryotic populations, composed of active and dormant cells can still react to pulses of nutrients but remain low-energetic costs at the community level (Kundu et al., 2020). Such a mechanism would stabilize and buffer community functioning and cell densities (Lennon and Jones, 2011). In alpine groundwater, seasonal water table fluctuations and hydrogeochemical mixing impact carbon inputs and species turnover at short time scales (Zhou et al., 2012).
The microbial intracellular ATP concentrations in groundwater samples were found to be considerably low (0.79 pmol L–1 ± 0.84 pmol L–1). Considering an approximate ATP content of a bacterial cell (1.5–4.8 × 10⁻¹⁹ mol cell–1; Hammes and Egli, 2005) these values correspond to 9.5 × 10³–10.5 × 10⁶ active cells per liter. Consequently, only 19% (SD ± 23%) of all prokaryotic cells were considered viable. For the groundwater samples, the influence of temporal variation on ATP concentrations was tested. A non-parametric Kruskal–Wallis test showed that the effect of season on ATP levels was significant (χ2 = 8.79, df = 3, p < 0.05). At the same time no significant effect of the location was observed. Although the ATP concentrations in the Isar river water were slightly elevated compared to the groundwater sites (Table 1) the differences were not significant (t-test: t = 1.7078, df = 5.3881, p = 0.1441).
The assimilable organic carbon (AOC) assay is a standardized measure of the microbial growth potential (Escobar and Randall, 2001) determined as the increase of cell numbers (i.e., anabolism). The assimilable organic carbon (AOC) ranged from 2.5 to 51.8 μg C L–1 (Figure 4), accounting for only 0.2–4.3% of the bulk DOC. There was no significant difference between the ranked AOC concentrations and sampling time (i.e., seasons). Overall, the AOC of groundwater samples showed a slight but constant increase from spring and summer (5.7 ± 3.8 μg C L–1 and 6.4 ± 2 μg C L–1) to autumn and winter (12.9 ± 10.16 μg C L–1 and 14.5 ± 15.6 μg C L–1) as shown in Figure 4. The ability to build up new prokaryotic biomass is determined by their carbon use efficiency (CUE) (Del Giorgio and Cole, 1998). Assuming a CUE of 2%, the AOC would support the growth of 4.9 × 10⁷ to 1.0 × 10⁹ cells mL–1.
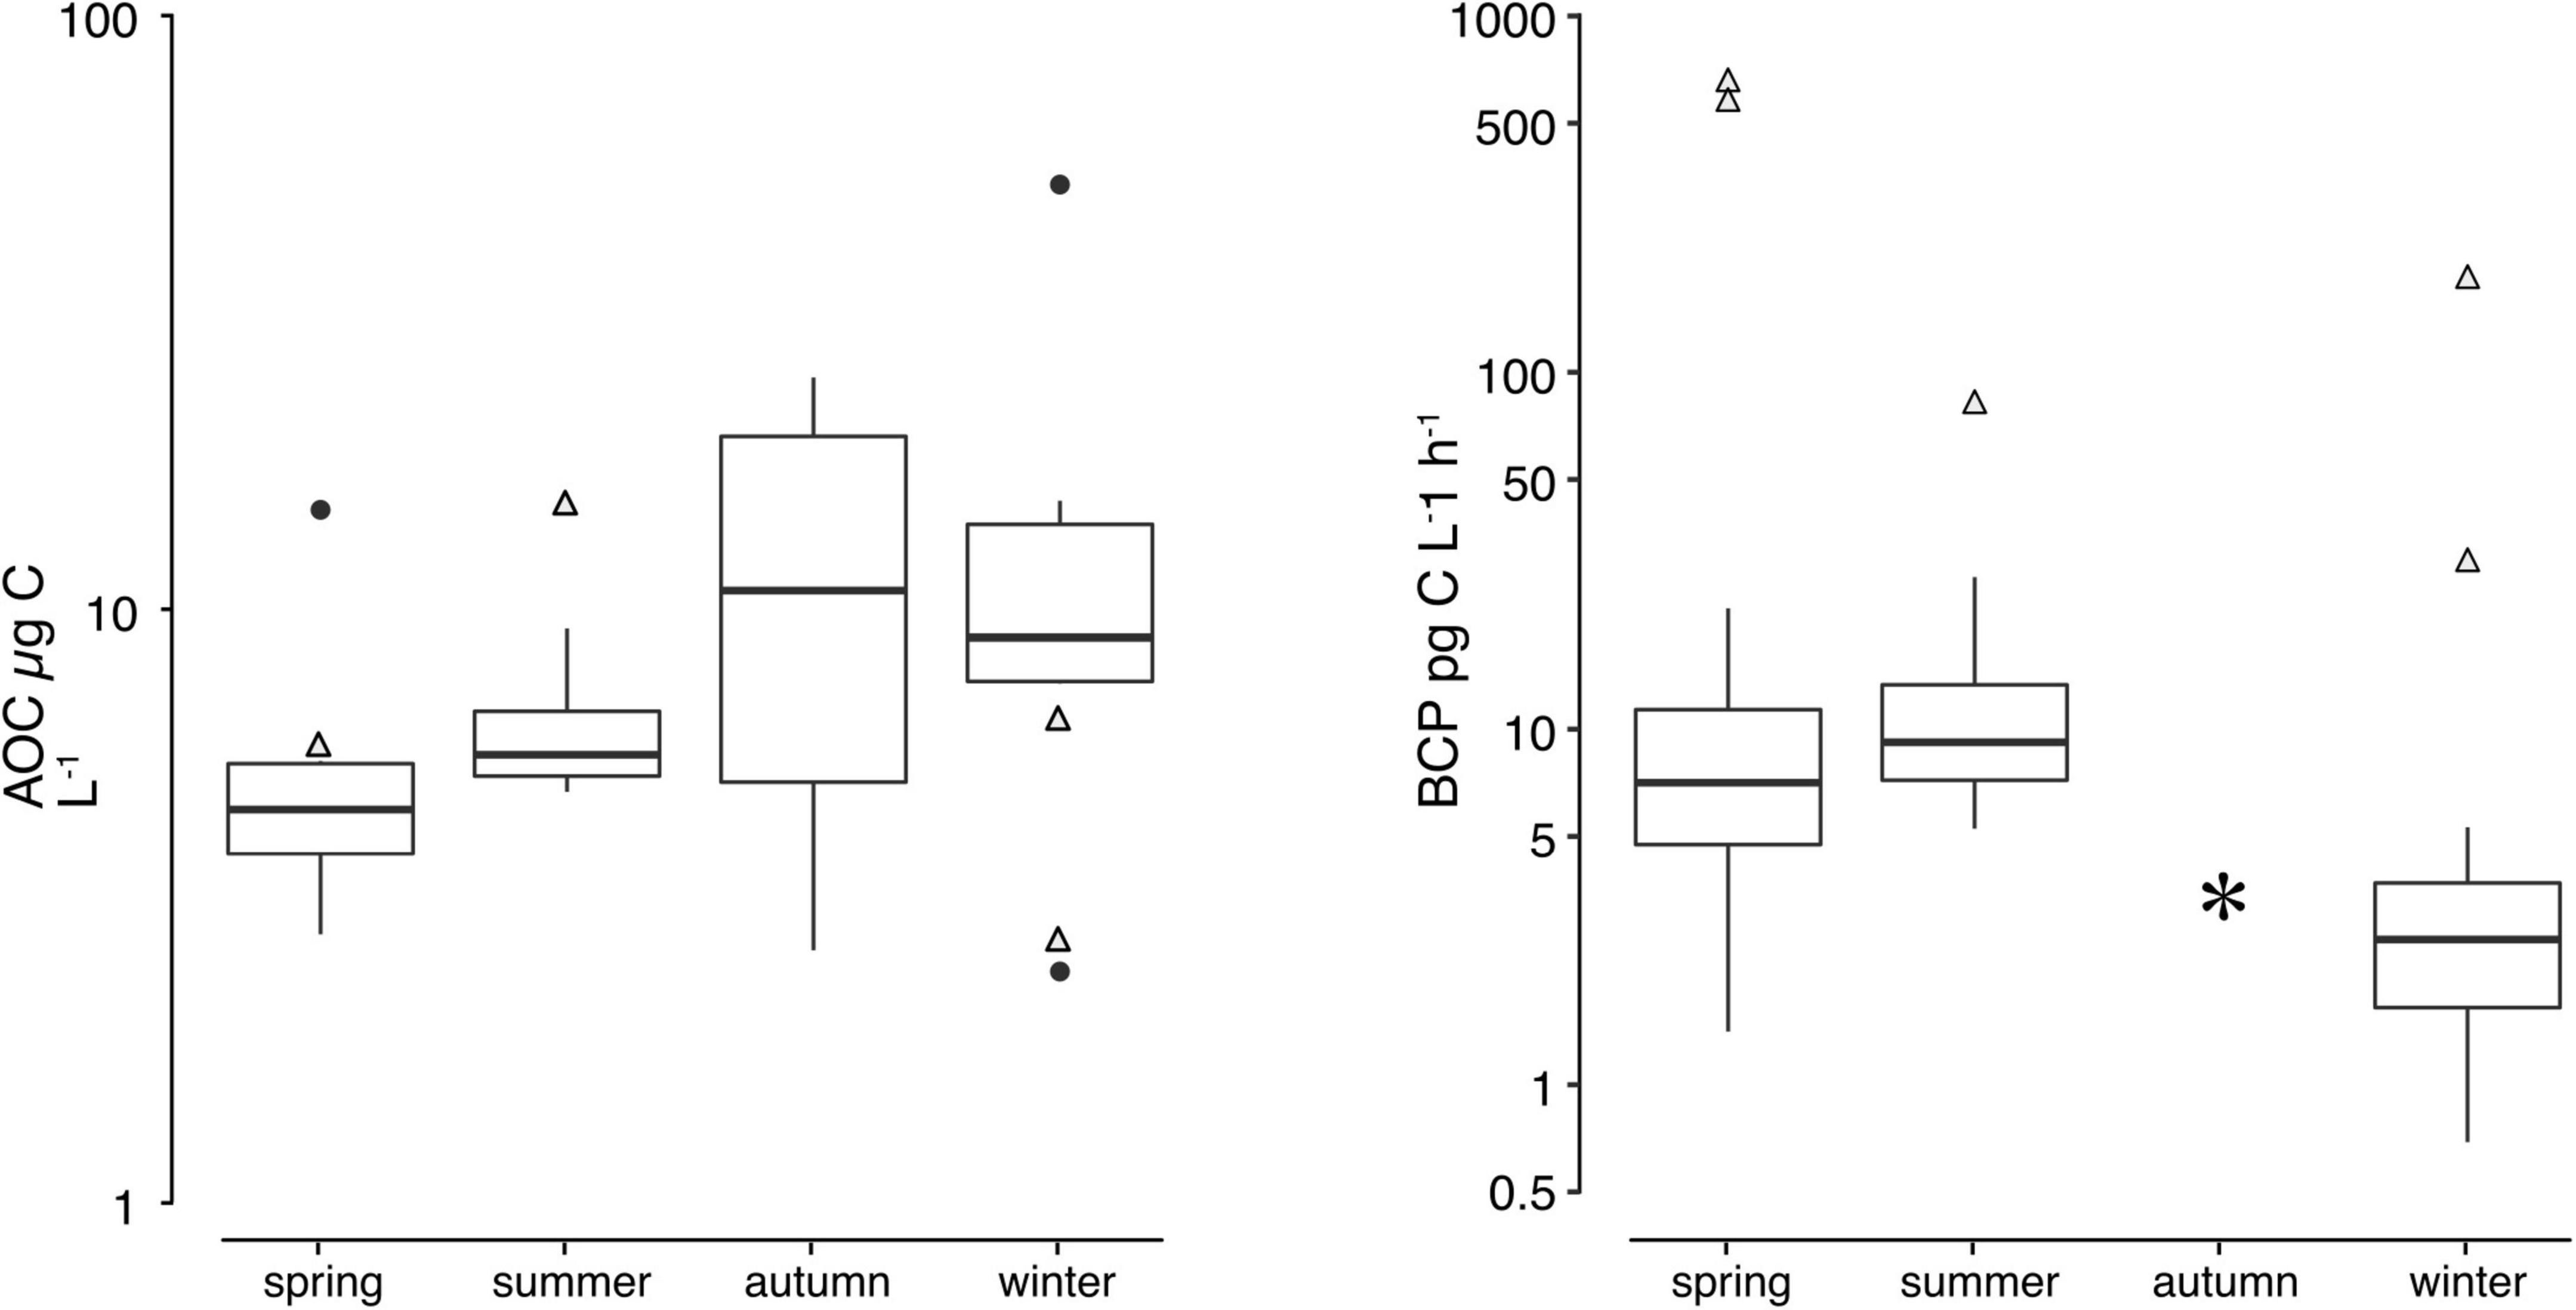
Figure 4. Temporal variation for AOC and BCP. Comparison of the assimilable organic carbon and bacterial carbon production. Triangles represent values measured from the Isar river water.
To follow up on these numbers, the actual carbon production rates were measured. The production rates of heterotrophic prokaryotes, here termed bacterial carbon production (BCP), were expectedly low in the aquifer throughout the year. The production rates ranging from 0.7 to 26 pg C L–1 h–1 in groundwater samples correspond to specific growth rates of 1.3 × 10⁻³ to 0.6 d–1. The lowest BCP rates were observed during the dry season in winter (mean = 2.8 ± 1.7 pg C L–1 h–1). The highest BCP rates (12.4 ± 9.5 pg C L–1 h–1) occurred during summer (May–July 2010). No BCP values could be recorded in autumn due to technical problems. An analysis of variance (ANOVA) on log-transformed BCP rates between seasonal samples of groundwater yielded significant variation [F(2,24) = 6.06, p < 0.05]. A post-hoc Tukey HSD test comparing these BCP rates revealed significant differences between the winter sampling and the other samples. The bacterial carbon production in the Isar river water was significantly higher than in groundwater (one-sided Student t-test: t = −6.8, df = 23, p < 0.05). While the ATP and AOC was in the same range between all samples, the production rates were 40 times higher in the river than in the groundwater. This result further illustrates the slower growth and carbon turnover in groundwater. Comparable results of relatively low biomass but high prokaryotic production rates in surface waters have been reported previously (van Driezum et al., 2018). The differences of biological processes between the sampling sites emphasize small-scale differences and heterogeneities in subsurface ecosystems (Brockman and Murray, 1997).
The different patterns that were observed for the metrics of productivity, microbial activity, and organic carbon availability (Table 1) deserve a critical assessment. The low DOC concentrations throughout the year with two outliers in spring above 2 mg L–1 were not related to an increase in AOC or BCP, therefore its impact appears negligible. Even though the DOC concentration was lowest in autumn, the AOC and ATP were at its highest, which coincided with higher nutrient (N, P) concentrations. Thus, nutrient-limitation rather than carbon limitation appears to be the governing factor (Hofmann and Griebler, 2018). Additionally, the AOC was slightly increasing from spring to autumn. Whereas the AOC concentrations were consistently low in spring and summer they were also more dynamic in autumn and late winter. This may indicate temporal variation of the quality of carbon sources due to changes in landcover, leaching of plant detritus and primary production imported as allochthonous input (Hood et al., 2003) supporting a more active community.
It is noteworthy, that the assimilable organic carbon is an integrated value measured over a timespan of weeks, while the bacterial carbon production is calculated from the incorporation of labeled leucine into proteins within a few hours. Prokaryotic production measurements based on changes in biomass (AOC) or incorporation (BCP) neglect excretion processes which even take place under nutrient and carbon limitation (Del Giorgio and Cole, 1998). An additional parameter, the biodegradable dissolved organic carbon (BDOC) which measures the DOC concentration in water before and after a batch incubation in the dark, was not determined. These parameters may overestimate the microbial growth efficiency, biomass production, and represent the combined values of the diverse heterotrophic microbial community/population whether they are active or inactive in the biogeochemical processes (Lever et al., 2015).
Disentangling Bottom-Up and Top-Down Regulation
There are several metrics to evaluate bottom-up and top-down regulation such as the relationship between microbial production and abundance (Billen et al., 1990) or the ratio of bacteria to heterotrophic flagellates (Gasol, 1994) and the virus to bacteria ratio (Wommack and Colwell, 2000).
In this study, prokaryotic production (i.e., BCP) was not correlated (Pearson’s r = −0.27, p = 0.24) with the bioavailable carbon sources (AOC) (Supplementary Figure 2) or the abundance of prokaryotes. The limited nutrient availability and low concentrations of readily available carbon may not reach a threshold to support a readily growing planktonic prokaryotic community.
In order to assess the effect of HNF grazing a model for surface waters (Gasol, 1994) was applied by plotting the log-transformed abundance of HNF against the log-transformed total cell counts of prokaryotes (Figure 5). We observed a weak but statistically significant positive relationship (R2 = 0.18, slope = 0.26, intercept = 0.98, p < 0.05) between the prokaryotic cell abundance and HNF abundance (Figure 5). Data close to the maximum attainable abundance (MAA) line, suggested a strong coupling between the prokaryotic and HNF abundance. The data points that lie above the MAA line (30%), suggest a strong predation on prokaryotes in these samples. Most values (83.3%) were close to the mean realized abundance (MRA) line, which indicates that in the alpine aquifer heterotrophic nanoflagellates were mainly bottom-up controlled by the prokaryotic communities, i.e., the available prey. The results imply a higher regulation effect of prokaryotes on HNF rather than the top-down control of grazing by higher trophic levels, which has been previously described for other oligotrophic aquatic habitats (Billen et al., 1990).
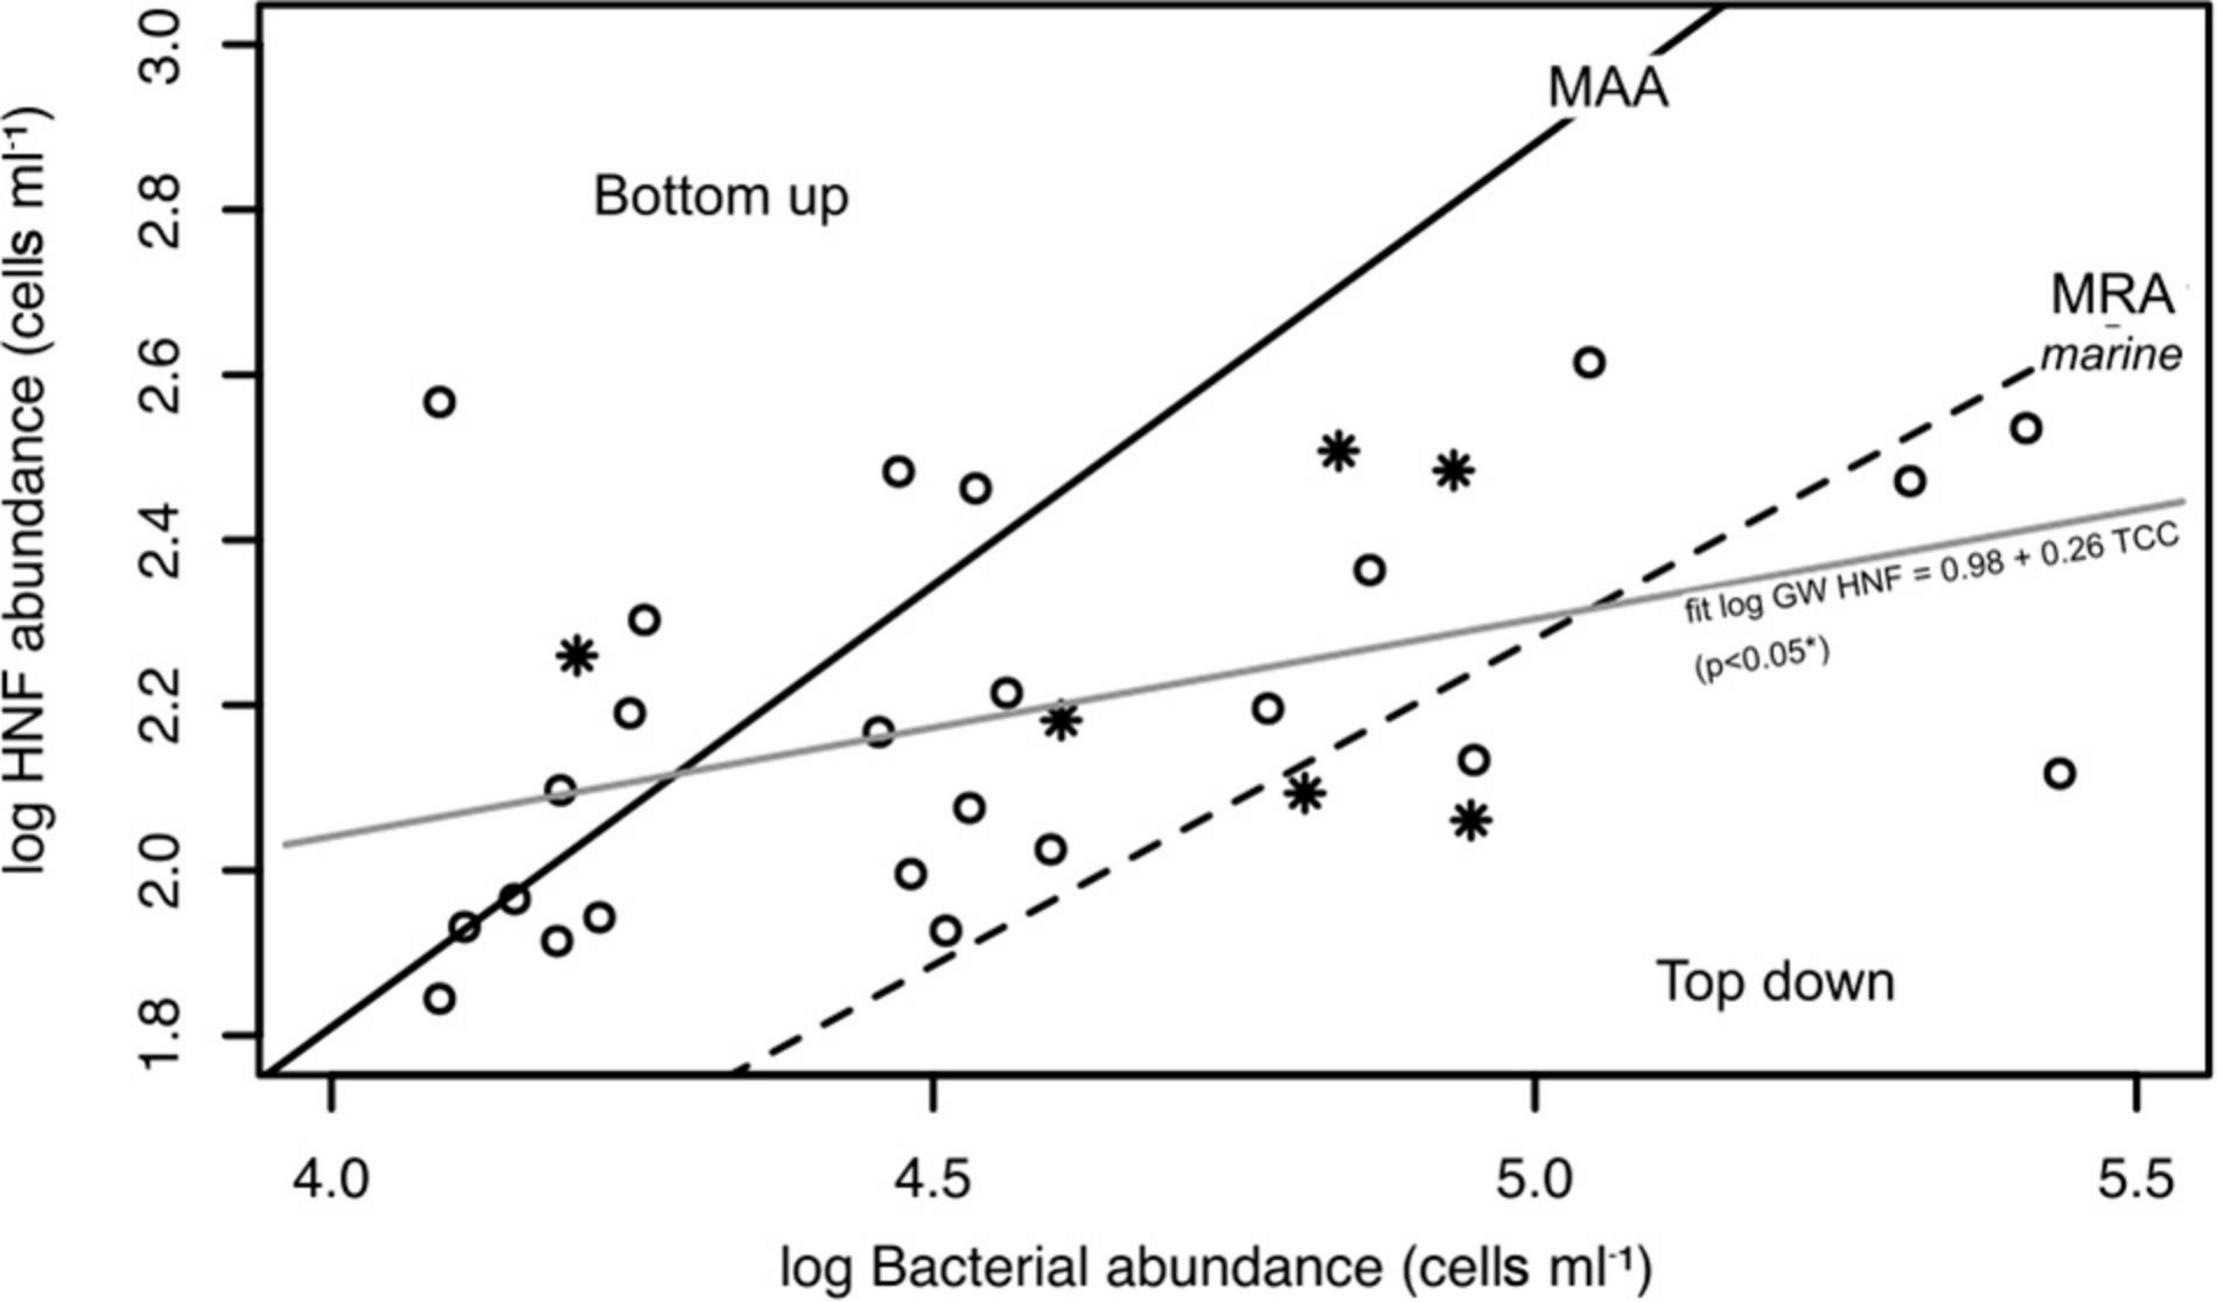
Figure 5. The assessment of top-down vs. bottom-up control of HNF abundance Log-log plot of the abundance of prokaryotes and heterotrophic nanoflagellates (HNF) in the groundwater (°) samples from the river (*) were added to the graph for comparison. MAA, maximum attainable HNF abundances max log10HNF = −2.47 + 1.07 log10 TCC; MRA, mean realized abundances intercept = −1.67, slope = 0.79; determined by Gasol (1994).
Viruses may exert strong top-down effects on prokaryotic communities but little is known about the seasonal patterns of natural virus populations in groundwater. It is hypothesized that the physiology of the hosts influence the phages life cycles (i.e., lysogenic and lytic). In oligotrophic lakes, high VPR were related to temporal effects (e.g., ice cover) and subsequent cell damage rather than prokaryotic growth and production (Maurice et al., 2010). Interactions between phages and prokaryotes are often host specific so that the bulk dynamics represents the sum of all these individual interactions. Våge et al. (2016) propose a model where the viral densities are related to the prokaryotic diversity and the abundance of prokaryotes is determined by competition and predation. Thereby virus abundance is controlled by limiting resource concentrations and resistance against viral lysis, whereas the microbes are primarily controlled by grazing.
Variable virus to prokaryote ratios (VPRs) have been reported for aquatic ecosystems ranging from 0.01 to 267.2 in fresh water and from 0.08 to 43 in groundwater (Roudnew et al., 2013; Parikka et al., 2017; Malki et al., 2020). Generally, higher VPRs (>10) indicate environmental conditions favoring bacterial lysis, whereas lower VPRs (<1) indicate little to no influence on the prokaryotic community. High or low VPRs are not necessarily derived from high or low productive environments, but mainly rely on the bacterial production rates (Weinbauer and Höfle, 1998). Recently, Wigington et al. (2016) found that the relationship between marine virus and prokaryotic abundances can be better described by a non-linear power-law function (log10VLP = α0 + α1 log10TCC) of prokaryotic cells rather than a 10:1 model. The slope α1 of the fitted line denotes the power-law exponent that best describes the relationship between the variables, whereas the intercept α0 denotes the logarithmically transformed pre-factor (Wigington et al., 2016). Although the power-law function fails to explain the variation in our data (R2 < 0), it may provide useful information in future groundwater studies. Here, we found that the viral abundances was independent of that of prokaryotic cells (Supplementary Figure 3).
In summary, we report that the microbial community (i.e., heterotrophic bacteria, archaea, and microeukaryotes) in a pristine alpine groundwater are exposed to an extreme environment deprived of readily available carbon sources. Therefore, the bacterial carbon production remained low throughout this study. Temporal patterns in prokaryotic cell abundance are likely derived from the hydraulic shortcut between the surface and the aquifer rather than biological interactions. Predation by HNFs and phages seems to play only a minor role at least for the observed prokaryotic densities. In the next step, we evaluated the carbon flux for this ecosystem, through extrapolation and comparison with process rates acquired from the literature.
Proposed Carbon Flux Within an Alpine Groundwater Microbial Food Web
The turnover of DOC by microbial metabolism is often highest in headwaters where the mixing of surface- and groundwater ensures favorable conditions for the attached microbial communities in the streambed and the hyporheic zone (Battin et al., 2008; Stegen et al., 2016). The microbial respiration in streams (discharge < 0.5 m3 s–1) contributes substantially to the earth carbon fluxes (Battin et al., 2008). In alpine streams the hydrology can control DOM composition and dynamics (Fasching et al., 2016). Even though allochthonous DOM of terrestrial origin comprises the largest proportion in headwater streams, augmentation of freshly produced autochthonous DOM especially from benthic biofilms contributes to the heterotrophic metabolism. Our measurements show that the stream water transports a comparable amount of microbial biomass as the groundwater, but at the same time supports a higher prokaryotic activity.
The observed DOC peaks in early spring neither increased the prokaryotic density nor the bacterial carbon production, which may correlate to the small fraction of assimilable organic carbon (0.2–4%) in groundwater. The increase of DOC coincides with recharge events and hydrodynamic mixing. A positive correlation between microbial activity (i.e., ATP) and the density of prokaryotes has been reported earlier for other oligotrophic shallow groundwater systems (Fillinger et al., 2019). This correlation was not found in our data. The extremely low ATP concentrations in groundwater indicated that the planktonic cells are at low activity or even non-active with only a small fraction of cells actively growing. This finding adds to the mounting evidence that the prokaryotic biomass and activity is closely related to the availability and composition of the carbon resources (Egli, 2010; Wu et al., 2018).
Our data suggests, that the carbon demand of the prokaryotic community is low, because of the microbial yield from available carbon sources, the low growth rates and the prokaryotic abundance (Thingstad and Lignell, 1997). Therefore, a temporal increase of DOC does not necessarily go along with a stimulation of microbial activity and production (Hofmann and Griebler, 2018; Hofmann et al., 2020). Even an increased supply of energy in form of labile organic matter may not enhance bacterial carbon production as prokaryotic communities run into the limitation by essential nutrients (i.e., phosphorous). The microbial production will be proportional to the rate at which degradable organic carbon is produced and thus it is bottom-up controlled. However, the production and excretion processes are poorly understood in groundwater ecosystems (Del Giorgio and Cole, 1998).
In this study, heterotrophic microorganisms can potentially access an average of 1.2 mg L–1 of dissolved organic carbon of which only a fraction of 9.9 μg L–1 is assimilable organic carbon (AOC). The mean bacterial carbon production rate of 7.36 pg C L–1 h–1 results in an estimated microbial growth efficiency (BGE) of 2% calculated from the BGE model of Del Giorgio and Cole (1998). The values for the bacterial carbon production rate are three orders lower than values reported for lowland groundwater (van Driezum et al., 2018). Low microbial growth efficiencies of 2–20% reported for a wide range of groundwater sources (Del Giorgio and Cole, 1998; Hofmann and Griebler, 2018) are generally related to the sources and availability of carbon, nitrogen, and phosphorous. Thus, we conclude the major part of the assimilable carbon is exported or respired but does not contribute to a significant increase of microbial biomass.
To our knowledge no in situ data regarding microbial carbon demand, viral infection, and protozoan grazing is available for groundwater ecosystems. In order to estimate the carbon fluxes in the alpine groundwater, missing data on process rates and interactions from comparable aquatic environments were adapted, to link the analyzed trophic levels.
The carbon bound in microorganisms comprises of 0.92 μg C L–1 for the prokaryotic communities (15 fg C cell–1; Caron et al., 1995), 1.9 × 10⁻² μg C L–1 for the viral particles (2 × 10⁻² fg C VLP–1; Jover et al., 2014) and 8.6 μg C L–1 for the heterotrophic nanoflagellates (4.8 × 10⁴ fg C HNF–1; Menden-Deuer and Lessard, 2000), which sums up to a total of 9.7 μg C L–1. In conclusion, we found that the carbon stored in the organisms is more or less equivalent to the readily assimilable organic carbon. The results are in stark contrast to the study of Wilhartitz et al. (2013) where only 10–13% of the microbial biomass was contributed by protozoa. The relationship between HNFs and prokaryotes in aquifers might not be correctly represented by the Gasol model (Gasol, 1994). The potential reasons for deviations are: the relatively low numbers of active and viable prokaryotic cells in groundwater (Sintes et al., 2004), the impact of other predators, and HNFs using alternative food sources or grazing at low prey densities (Cho et al., 2000).
Turnover rates between the trophic groups were calculated by taking into account grazing by nanoflagellates and viral lysis. Food uptake is assumed to be proportional to food concentration. Grazing rates were estimated as the product of total cell counts of prokaryotes, HNF densities and a clearance rate of 0.5 nl protozoa–1 h–1 (Kinner et al., 1998). This translates into a potential uptake rate of 6.8 prokaryotic cells protozoa–1 h–1 or 103 pg C L–1 h–1, which relates to 3% of the microbial cells per day. The calculated value for the ingested prokaryotic carbon surpasses the estimated carbon production and hence supports the evidence for a bottom-up controlled food web. More experimental data on clearance rates especially in diluted environments are necessary.
The productivity and density of the prokaryotic host populations affects the proliferation and distribution of viruses in aquatic environments. In a “diluted environment,” viral and prokaryotic densities fall below a certain threshold, at which phages cannot sustain the viral production, presumably due to low contact rates (Cram et al., 2016) whereas microbes would grow back to a starting concentration. Applying this threshold of 4 × 10¹¹–4.2 × 10¹² cells × VLP mL–2 (Cram et al., 2016), the studied groundwater can be considered a diluted environment characterized by low viral and prokaryotic abundances (in the range of 2.67 × 10⁹–3.69 × 10¹¹ cells × VLP mL–2). Even for infected microbial cells mortality should be very low as a reduced metabolism is unlikely to engage the lytic mechanism. Thus, the significance of phages in these food webs remains to be elucidated, but appears to be negligible in terms of carbon turnover.
Conclusion
This study presents field data on the microbial food web and cross-kingdom interactions in oligotrophic groundwaters from an alpine aquifer. The ecology of aquifers is in many ways different from surface water ecosystems and is therefore still perceived as a frontier in aquatic research. The limited availability of data especially regarding the communities in subterranean ecosystems is due to the extent and isolation of subsurface ecosystems. Here, we conclude that the major fraction of dissolved organic carbon in the groundwater is transported seemingly unfazed by uptake processes. Only a small portion of assimilabile DOC is transformed by prokaryotes. With the exception of the microbial activity, the measured differences between surface water and groundwater were small. The carbon in the subsurface that moves through the food web and is bound to biomass is making up a considerable fraction. Alpine groundwater should be considered a dilute environment where top-down control plays a minor role. Overall, the persistent knowledge gaps relate to the true variation across space and time as well as the different methodologies that have been used (Moran et al., 2022). The parameters used in our estimations of carbon pools and turnover have either been sparsely measured or are originating from divergent environments.
Consequently, grouping organisms into a series of more or less discrete trophic levels could prove helpful to model energy relationships in aquatic systems (Våge et al., 2018). In our analysis, we were restricted to define organismic groups using molecular markers (e.g., prokaryotes and HNFs) and size differences (e.g., virus-like particles), which neglects the different trophic strategies within these groups. Nonetheless, this dataset provides an overview of an alpine groundwater ecosystem focusing on the microbial food web (i.e., planktonic organisms) and the variation across space and time. The concerted analysis of microbial food web members, nutrients and carbon process rates sheds light on the forces governing ecosystem productivity and abundance.
This is the first dataset of an alpine groundwater system including microbial food-web estimates which can be used for future comparisons and evaluate human impact.
Data Availability Statement
The original contributions presented in the study are included in the article/Supplementary Material, further inquiries can be directed to the corresponding author.
Author Contributions
YZ and CG developed the idea and completed the field work. CK performed data analysis and drafted the manuscript with help from MW and CG. YZ, M-EK, and MW performed laboratory analysis. All authors assisted in editing the manuscript and approved the submitted version.
Funding
The authors gratefully acknowledge the financial support by the German Federal Environment Agency (grant no. 3708 23 200).
Conflict of Interest
The authors declare that the research was conducted in the absence of any commercial or financial relationships that could be construed as a potential conflict of interest.
Publisher’s Note
All claims expressed in this article are solely those of the authors and do not necessarily represent those of their affiliated organizations, or those of the publisher, the editors and the reviewers. Any product that may be evaluated in this article, or claim that may be made by its manufacturer, is not guaranteed or endorsed by the publisher.
Acknowledgments
We are grateful to Claudia Kellermann for organization and assistance with sampling. We thank the KEW Karwendel Energie & Wasser GmbH Mittenwald, especially M. Pöll and J. Gschwendtner, E. Eichenseher from the Wasserwirtschaftsamt Weilheim, and M. Giering from the Landesamt für Umwelt (LfU) Bayern for their support and allowing us site access.
Supplementary Material
The Supplementary Material for this article can be found online at: https://www.frontiersin.org/articles/10.3389/fevo.2022.854228/full#supplementary-material
References
Anneser, B., Pilloni, G., Bayer, A., Lueders, T., Griebler, C., Einsiedl, F., et al. (2010). High resolution analysis of contaminated aquifer sediments and groundwater—what can be learned in terms of natural attenuation? Geomicrobiol. J. 27, 130–142. doi: 10.1080/01490450903456723
Azam, F., Fenchel, T., Field, J., Gray, J., Meyer-Reil, L., and Thingstad, F. (1983). The ecological role of water-column microbes in the sea. Mar. Ecol. Prog. Series 10, 257–263. doi: 10.3354/meps010257
Baker, M. A., Valett, H. M., and Dahm, C. N. (2000). Organic carbon supply and metabolism in a shallow groundwater ecosystem. Ecology 81, 3133–3148. doi: 10.1890/0012-9658(2000)081[3133:ocsami]2.0.co;2
Baltar, F., Arístegui, J., Gasol, J. M., and Herndl, G. J. (2010). Prokaryotic carbon utilization in the dark ocean: growth efficiency, leucine-to-carbon conversion factors, and their relation. Aqua. Microbial Ecol. 60, 227–232. doi: 10.3354/ame01422
Battin, T. J., Kaplan, L. A., Findlay, S., Hopkinson, C. S., Marti, E., Packman, A. I., et al. (2008). Biophysical controls on organic carbon fluxes in fluvial networks. Nat. Geosci. 1, 95–100. doi: 10.1038/ngeo101
Billen, G., Servais, P., and Becquevort, S. (1990). Dynamics of bacterioplankton in oligotrophic and eutrophic aquatic environments: bottom-up or top-down control? Hydrobiologia 207, 37–42. doi: 10.1007/bf00041438
Brielmann, H., Griebler, C., Schmidt, S. I., Michel, R., and Lueders, T. (2009). Effects of thermal energy discharge on shallow groundwater ecosystems. FEMS Microbiol. Ecol. 68, 273–286. doi: 10.1111/j.1574-6941.2009.00674.x
Brockman, F. J., and Murray, C. J. (1997). Subsurface microbiological heterogeneity: current knowledge, descriptive approaches and applications. FEMS Microbiol. Rev. 20, 231–247. doi: 10.1111/j.1574-6976.1997.tb00311.x
Brown, J. M., Labonté, J. M., Brown, J., Record, N. R., Poulton, N. J., Sieracki, M. E., et al. (2020). Single Cell Genomics Reveals Viruses Consumed by Marine Protists. Front. Microbiol. 11:524828 doi: 10.3389/fmicb.2020.524828
Brussaard, C. P. D. (2004). Optimization of Procedures for Counting Viruses by Flow Cytometry. Appl. Environ. Microbiol. 70, 1506–1513. doi: 10.1128/AEM.70.3.1506-1513.2004
Cho, B. C., Na, S. C., and Choi, D. H. (2000). Active ingestion of fluorescently labeled bacteria by mesopelagic heterotrophic nanoflagellates in the East Sea, Korea. Mar. Ecol. Prog. Series 206, 23–32. doi: 10.3354/meps206023
Chow, C.-E. T., Kim, D. Y., Sachdeva, R., Caron, D. A., and Fuhrman, J. A. (2014). Top-down controls on bacterial community structure: microbial network analysis of bacteria, T4-like viruses and protists. ISME J. 8, 816–829. doi: 10.1038/ismej.2013.199
Cram, J. A., Parada, A. E., and Fuhrman, J. A. (2016). Dilution reveals how viral lysis and grazing shape microbial communities. Limnol. Oceanogr. 61, 889–905. doi: 10.1002/lno.10259
Danovaro, R., Dell’Anno, A., Corinaldesi, C., Magagnini, M., Noble, R., Tamburini, C., et al. (2008). Major viral impact on the functioning of benthic deep-sea ecosystems. Nature 454:1084. doi: 10.1038/nature07268
Del Giorgio, P. A., and Cole, J. J. (1998). Bacterial growth efficiency in natural aquatic systems. Ann. Rev. Ecol. Syst. 29, 503–541. doi: 10.1146/annurev.ecolsys.29.1.503
Deng, L., Krauss, S., Feichtmayer, J., Hofmann, R., Arndt, H., and Griebler, C. (2014). Grazing of heterotrophic flagellates on viruses is driven by feeding behaviour. Environ. Microbiol. Rep. 6, 325–330. doi: 10.1111/1758-2229.12119
Ducklow, H. (1992). Factors regulating bottom-up control of bacteria biomass in open ocean plankton communities. Arch. für Hydrobiol. Beiheft Ergebnisse Limnol. 37, 207–217. doi: 10.1023/a:1020578418898
Egli, T. (2010). How to live at very low substrate concentration. Water Res. 44, 4826–4837. doi: 10.1016/j.watres.2010.07.023
Escobar, I. C., and Randall, A. A. (2001). Assimilable organic carbon. (AOC). and biodegradable dissolved organic carbon. (BDOC). Water Res. 35, 4444–4454. doi: 10.1016/S0043-1354(01)00173-7
Fasching, C., Ulseth, A. J., Schelker, J., Steniczka, G., and Battin, T. J. (2016). Hydrology controls dissolved organic matter export and composition in an Alpine stream and its hyporheic zone. Limnol. Oceanogr. 61, 558–571. doi: 10.1002/lno.10232
Fenoglio, S., Bo, T., Cammarata, M., López-Rodríguez, M. J., and Tierno de Figueroa, J. M. (2014). Seasonal variation of allochthonous and autochthonous energy inputs in an alpine stream. J. Limnol. 73272–277 doi: 10.4081/jlimnol.2014.1082
Fernandez, V. I., Yawata, Y., and Stocker, R. (2019). A Foraging Mandala for Aquatic Microorganisms. ISME J. 13, 563–575. doi: 10.1038/s41396-018-0309-4
Fillinger, L., Hug, K., Trimbach, A. M., Wang, H., Kellermann, C., Meyer, A., et al. (2019). The DA-(C). index: A practical approach towards the microbiological-ecological monitoring of groundwater ecosystems. Water Res. 163:114902. doi: 10.1016/j.watres.2019.114902
Findlay, S. E., Sinsabaugh, R. L., Sobczak, W. V., and Hoostal, M. (2003). Metabolic and structural response of hyporheic microbial communities to variations in supply of dissolved organic matter. Limnology and oceanography 48, 1608–1617. doi: 10.4319/lo.2003.48.4.1608
Foulquier, A., Simon, L., Gilbert, F., Fourel, F., Malard, F., and Mermillod-Blondin, F. (2010). Relative influences of DOC flux and subterranean fauna on microbial abundance and activity in aquifer sediments: new insights from 13C-tracer experiments. Freshwater Biol. 55, 1560–1576. doi: 10.1111/j.1365-2427.2010.02385.x
Gasol, J. M. (1994). A framework for the assessment of top-down vs bottom-up control of heterotrophic nanoflagellate abundance. Mar. Ecol. Prog. Series. Oldendorf 113, 291–300. doi: 10.3354/meps113291
Giovannoni, S. J., DeLong, E. F., Olsen, G. J., and Pace, N. R. (1988). Phylogenetic group-specific oligodeoxynucleotide probes for identification of single microbial cells. J. Bacteriol. Res. 170, 720–726. doi: 10.1128/jb.170.2.720-726.1988
Glöckner, F. O., Amann, R., Alfreider, A., Pernthaler, J., Psenner, R., Trebesius, K., et al. (1996). An in situ hybridization protocol for detection and identification of planktonic bacteria. Syst. Appl. Microbiol. 19, 403–406. doi: 10.1016/s0723-2020(96)80069-5
Google Maps (2022). [Google Map of Mittenwald, Germany]. Available online at: https://www.google.com/maps/@47.4259419,11.2555563,4287m/data=!3m1!1e3 (accessed May 16, 2022).
Gonze, D., Coyte, K. Z., Lahti, L., and Faust, K. (2018). Microbial communities as dynamical systems. Curr. Opin. Microbiol. 44, 41–49. doi: 10.1016/j.mib.2018.07.004
Griebler, C., and Lueders, T. (2009). Microbial biodiversity in groundwater ecosystems. Freshwater Biol. 54, 649–677. doi: 10.1111/j.1365-2427.2008.02013.x
Hammes, F. A., and Egli, T. (2005). New method for assimilable organic carbon determination using flow-cytometric enumeration and a natural microbial consortium as inoculum. Environ. Sci. Technol. 39, 3289–3294. doi: 10.1021/es048277c
Hofmann, R., and Griebler, C. (2018). DOM and bacterial growth efficiency in oligotrophic groundwater: absence of priming and co-limitation by organic carbon and phosphorus. Aquat. Microbial Ecol. 81, 55–71. doi: 10.3354/ame01862
Hofmann, R., Uhl, J., Hertkorn, N., and Griebler, C. (2020). Linkage Between Dissolved Organic Matter Transformation, Bacterial Carbon Production, and Diversity in a Shallow Oligotrophic Aquifer: Results From Flow-Through Sediment Microcosm Experiments. Front. Microbiol. 11:543567. doi: 10.3389/fmicb.2020.543567
Hood, E., McKnight, D. M., and Williams, M. W. (2003). Sources and chemical character of dissolved organic carbon across an alpine/subalpine ecotone, Green Lakes Valley, Colorado Front Range, United States. Water Resour. Res. 39:1188 doi: 10.1029/2002WR001738
Jover, L. F., Effler, T. C., Buchan, A., Wilhelm, S. W., and Weitz, J. S. (2014). The elemental composition of virus particles: implications for marine biogeochemical cycles. Nat. Rev. Microbiol. 12, 519–528. doi: 10.1038/nrmicro3289
Kinner, N., Harvey, R., Blakeslee, K., Novarino, G., and Meeker, L. (1998). Size-selective predation on groundwater bacteria by nanoflagellates in an organic-contaminated aquifer. Appl. Environ. Microbiol. 64, 618–625. doi: 10.1128/AEM.64.2.618-625.1998
Kundu, K., Weber, N., Griebler, C., and Elsner, M. (2020). Phenotypic heterogeneity as key factor for growth and survival under oligotrophic conditions. Environ. Microbiol. 22, 3339–3356. doi: 10.1111/1462-2920.15106
Kyle, J. E., Eydal, H. S., Ferris, F. G., and Pedersen, K. (2008). Viruses in granitic groundwater from 69 to 450 m depth of the Äspö hard rock laboratory. Sweden. ISME J. 2:571. doi: 10.1038/ismej.2008.18
Larsen, T., Ventura, M., Andersen, N., O’Brien, D. M., Piatkowski, U., and McCarthy, M. D. (2013). Tracing carbon sources through aquatic and terrestrial food webs using amino acid stable isotope fingerprinting. PLoS One 8:e73441. eCollection 2013 doi: 10.1371/journal.pone.0073441
Lennon, J. T., and Jones, S. E. (2011). Microbial seed banks: the ecological and evolutionary implications of dormancy. Nat. Rev. Microbiol. 9, 119–130. doi: 10.1038/nrmicro2504
Lever, M. A., Rogers, K. L., Lloyd, K. G., Overmann, J., Schink, B., Thauer, R. K., et al. (2015). Life under extreme energy limitation: a synthesis of laboratory- and field-based investigations. Giudici-Orticoni M-T. (Ed.). FEMS Microbiol. Rev. 39, 688–728. doi: 10.1093/femsre/fuv020
Longnecker, K., Da Costa, A., Bhatia, M., and Kujawinski, E. B. (2009). Effect of carbon addition and predation on acetate-assimilating bacterial cells in groundwater. FEMS Microbiol. Ecol. 70, 456–470. doi: 10.1111/j.1574-6941.2009.00767.x
Malki, K., Rosario, K., Sawaya, N. A., Székely, A. J., Tisza, M. J., and Breitbart, M. (2020). Prokaryotic and viral community composition of freshwater springs in Florida, USA. mBio 11:e00436–20. doi: 10.1128/mBio.00436-20
Maurice, C. F., Bouvier, T., Comte, J., Guillemette, F., and Del Giorgio, P. A. (2010). Seasonal variations of phage life strategies and bacterial physiological states in three northern temperate lakes. Environ. Microbiol. 12, 628–641. doi: 10.1111/j.1462-2920.2009.02103.x
McMinn, B. R., Rhodes, E. R., Huff, E. M., and Korajkic, A. (2020). Decay of infectious adenovirus and coliphages in freshwater habitats is differentially affected by ambient sunlight and the presence of indigenous protozoa communities. Virol. J. 17:1. doi: 10.1186/s12985-019-1274-x
Menden-Deuer, S., and Lessard, E. J. (2000). Carbon to volume relationships for dinoflagellates, diatoms, and other protist plankton. Limnol. Oceanogr. 45, 569–579. doi: 10.4319/lo.2000.45.3.0569
Moran, M. A., Ferrer-González, F. X., Fu, H., Nowinski, B., Olofsson, M., Powers, M. A., et al. (2022). The Ocean’s labile DOC supply chain. Limnol. Oceanogr. 05:2022. doi: 10.1002/lno.12053
Noble, R. T., and Fuhrman, J. A. (1999). Breakdown and microbial uptake of marine viruses and other lysis products. Aqua. Microbial Ecol. 20, 1–11. doi: 10.3354/ame020001
Novarino, G., Warren, A., Butler, H., Lambourne, G., Boxshall, A., Bateman, J., et al. (1997). Protistan communities in aquifers: a review. FEMS Microbiol. Rev. 20, 261–275. doi: 10.1111/j.1574-6976.1997.tb00313.x
Oksanen, J., Blanchet, F. G., Kindt, R., Legendre, P., Minchin, P. R., O’Hara, R., et al. (2013). Community Ecology Package. Available online at: https://cran.r-project.org/web/packages/vegan/index.html
Parikka, K. J., Romancer, M. L., Wauters, N., and Jacquet, S. (2017). Deciphering the virus-to-prokaryote ratio. (VPR): insights into virus–host relationships in a variety of ecosystems. Biol. Rev. 92, 1081–1100. doi: 10.1111/brv.12271
R Development CoreTeam (2014). R: A language and environment for statistical computing. Vienna, Aus: R foundation for statistical computing.
Rohwer, F., and Thurber, R. V. (2009). Viruses manipulate the marine environment. Nature 459, 207–212. doi: 10.1038/nature08060
Roudnew, B., Lavery, T. J., Seymour, J. R., Smith, R. J., and Mitchell, J. G. (2013). Spatially varying complexity of bacterial and virus-like particle communities within an aquifer system. Aqua. Microbial Ecol. 68, 259–266. doi: 10.3354/ame01615
Sherr, E. B., and Sherr, B. F. (2002). Significance of predation by protists in aquatic microbial food webs. Antonie Leeuwenhoek 81, 293–308. doi: 10.1023/a:1020591307260
Sintes, E., Martínez-Taberner, A., Moyà, G., and Ramon, G. (2004). Dissecting the microbial food web: structure and function in the absence of autotrophs. Aqua. Microbial Ecol. 37, 283–293. doi: 10.3354/ame037283
Stegen, J. C., Fredrickson, J. K., Wilkins, M. J., Konopka, A. E., Nelson, W. C., Arntzen, E. V., et al. (2016). Groundwater–surface water mixing shifts ecological assembly processes and stimulates organic carbon turnover. Nat. Commun. 7:11237. doi: 10.1038/ncomms11237
Stegen, J. C., Johnson, T., Fredrickson, J. K., Wilkins, M. J., Konopka, A. E., Nelson, W. C., et al. (2018). Influences of organic carbon speciation on hyporheic corridor biogeochemistry and microbial ecology. Nat. Commun. 9:585.
Thingstad, T., and Lignell, R. (1997). Theoretical models for the control of bacterial growth rate, abundance, diversity and carbon demand. Aqua. Microbial Ecol. 13, 19–27. doi: 10.3354/ame013019
USGS (2006). Collection of water samples. Version 2.0, Revised September 2006. (original version published September 1999). U.S. Geological Survey, Reston, VA. Report, 231pp. doi: 10.3133/twri09A4
Våge, S., Bratbak, G., Egge, J., Heldal, M., Larsen, A., Norland, S., et al. (2018). Simple models combining competition, defence and resource availability have broad implications in pelagic microbial food webs. Ecol. lett. 21, 1440–1452. doi: 10.1111/ele.13122
Våge, S., Pree, B., and Thingstad, T. F. (2016). Linking internal and external bacterial community control gives mechanistic framework for pelagic virus-to-bacteria ratios: Framework for VBR. Environ. Microbiol. 18, 3932–3948. doi: 10.1111/1462-2920.13391
van Driezum, I. H., Chik, A. H. S., Jakwerth, S., Lindner, G., Farnleitner, A. H., Sommer, R., et al. (2018). Spatiotemporal analysis of bacterial biomass and activity to understand surface and groundwater interactions in a highly dynamic riverbank filtration system. Sci.Total Environ. 627, 450–461. doi: 10.1016/j.scitotenv.2018.01.226
Weinbauer, M. G., and Höfle, M. G. (1998). Significance of Viral Lysis and Flagellate Grazing as Factors Controlling Bacterioplankton Production in a Eutrophic Lake. Appl. Environ. Microbiol. 64, 431–438. doi: 10.1128/AEM.64.2.431-438.1998
Weinbauer, M. G., Hornák, K., Jezbera, J., Nedoma, J., Dolan, J. R., and Šimek, K. (2007). Synergistic and antagonistic effects of viral lysis and protistan grazing on bacterial biomass, production and diversity. Environ. Microbiol. 9, 777–788. doi: 10.1111/j.1462-2920.2006.01200.x
Weitowitz, D. C., Robertson, A. L., Bloomfield, J. P., Maurice, L., and Reiss, J. (2019). Obligate groundwater crustaceans mediate biofilm interactions in a subsurface food web. Freshwater Sci. 38, 491–502. doi: 10.1086/704751
Wigington, C. H., Sonderegger, D., Brussaard, C. P. D., Buchan, A., Finke, J. F., Fuhrman, J. A., et al. (2016). Re-examination of the relationship between marine virus and microbial cell abundances. Nat. Microbiol. 1:15024. doi: 10.1038/nmicrobiol.2015.24
Wilhartitz, I. C., Kirschner, A. K. T., Brussaard, C. P. D., Fischer, U. R., Wieltschnig, C., Stadler, H., et al. (2013). Dynamics of natural prokaryotes, viruses, and heterotrophic nanoflagellates in alpine karstic groundwater. Microbiol. 2, 633–643. doi: 10.1002/mbo3.98
Wommack, K. E., and Colwell, R. R. (2000). Virioplankton: Viruses in Aquatic Ecosystems. Microbiol. Mol. Biol. Rev. 64, 69–114. doi: 10.1128/MMBR.64.1.69-114.2000
Wu, X., Wu, L., Liu, Y., Zhang, P., Li, Q., Zhou, J., et al. (2018). Microbial Interactions With Dissolved Organic Matter Drive Carbon Dynamics and Community Succession. Front. Microbiol 9:1234. doi: 10.3389/fmicb.2018.01234
Keywords: biogeochemistry, carbon turnover, microbial biomass, seasonal variation, microbial loop, top-down control
Citation: Karwautz C, Zhou Y, Kerros M-E, Weinbauer MG and Griebler C (2022) Bottom-Up Control of the Groundwater Microbial Food-Web in an Alpine Aquifer. Front. Ecol. Evol. 10:854228. doi: 10.3389/fevo.2022.854228
Received: 13 January 2022; Accepted: 05 May 2022;
Published: 27 May 2022.
Edited by:
Sanda Iepure, Romanian Academy, RomaniaReviewed by:
Kathryn Korbel, Macquarie University, AustraliaStefano Amalfitano, National Research Council, Italy
Copyright © 2022 Karwautz, Zhou, Kerros, Weinbauer and Griebler. This is an open-access article distributed under the terms of the Creative Commons Attribution License (CC BY). The use, distribution or reproduction in other forums is permitted, provided the original author(s) and the copyright owner(s) are credited and that the original publication in this journal is cited, in accordance with accepted academic practice. No use, distribution or reproduction is permitted which does not comply with these terms.
*Correspondence: Christian Griebler, Y2hyaXN0aWFuLmdyaWVibGVyQHVuaXZpZS5hYy5hdA==