 Kexin Huang
 Li Peng
 Xiaohui Wang
 Tiantian Chen3
- 1College of Geography and Resources, Sichuan Normal University, Chengdu, China
- 2Key Laboratory of Land Resources Evaluation and Monitoring in Southwest, Ministry of Education, Sichuan Normal University, Chengdu, China
- 3College of Geography and Tourism, Chongqing Normal University, Chongqing, China
Because of implementation of ecological projects, the restoration of vegetation not only changes the typological composition and spatial structure of the landscape, but also improves the regional ecosystem function. The present study considered the effects of natural-anthropogenic factors and landscape connectivity on vegetation restoration. It also explored the impact and underlying mechanisms by which structural changes in landscape connectivity affect vegetation coverage in the karst region of Guizhou Province and provided a novel perspective for the maintenance of regional ecological security. We used morphological spatial pattern analysis (MSPA) and integrated valuation of ecosystem services and tradeoffs (InVEST) and circuit theory to identify ecological networks and explore the changes in landscape structure. We performed a Theil-Sen Median trend analysis and a Mann-Kendall (MK) trend test to determine spatiotemporal variations in vegetation coverage. We conducted a coupling analysis to discover correlations between the average cumulative current density (CCD) and the normalized difference vegetation index (NDVI) in various karst landform counties. We also implemented a geographical detector to detect the factors affecting the NDVI trend and disclose interactions among factors. The results showed that (1) Though the total area of forests and core areas was reduced, the ecological networks and landscape connectivity steadily improved. (2) Areas with improved vegetation coverage accounted for 77.77% of the total. By contrast, the degraded areas covered 14.28% while the remaining 7.95% was stable. (3) The relationships between the average CCD and the NDVI were inconsistent among various geomorphological counties. The counties with the highest proportions of karst landforms presented with negative correlations between the average CCD and the NDVI in 2005 and positive correlations between these parameters in 2018. (4) The NDVI trend was influenced by several factors. Of these, anthropogenic activity played a dominant role. Nevertheless, changes in landscape connectivity was also implicated. Attention should be paid to the impact of landscape connectivity on ecological restoration. The foregoing results indicated that the rocky desertification projects effectively improved landscape connectivity and vegetation coverage and provided a reference for developing policies establishing and maintaining ecological security of the karst ecosystem and coordinating sustainable development in this region.
Introduction
Vegetation comprises the hub of material circulation and energy exchange in ecosystems and prevents ecological degradation. Elucidating the spatiotemporal patterns in vegetation cover and the impact of climate change and human activity on it helps clarify the effects of ecosystem restoration and facilitates the sustainable development of terrestrial ecosystems (Peng et al., 2021). The normalized difference vegetation index (NDVI) is commonly used in remote sensing estimation of vegetation coverage (Lagomasino et al., 2015). It comprehensively reflects vegetation type (Zhang et al., 2013), growth status, and coverage density in an observation area. Thus, it is widely used in the dynamic monitoring of vegetation coverage (Zhu et al., 2019). The NDVI time series data are used to study variations in vegetation and their response to external disturbances, which is of great value in identifying the ecological benefits of the ecosystem and is very important in global change research.
Patch corridor matrix model can be used to describe landscape structure heterogeneity and reflect the landscape pattern (Forman and Wilson, 1995), which helps clarify landscape structure, function, and dynamic change (Feyissa and Gebremariam, 2018). Landscape connectivity describes the connections among landscape elements within a spatial pattern or ecological process (Uroy et al., 2019), and this connection may be species or gene flow between biological communities or the exchange of materials and energy between landscape elements (Forman and Godron, 1986; Taylor et al., 1993). It also lays theoretical and empirical foundations for elucidating the relationships among spatial patterns and for ecological network planning (An et al., 2021). It usually comprises both structural and functional connectivity (Tischendorf and Fahrig, 2000). Structural connectivity measures the structural characteristics of the landscape such as its size, shape, and habitat patch locations. It reflects the spatial pattern of the physical connections among landscape patches, but does not consider ecological processes (Carlier and Moran, 2019). Functional connectivity is based on the biological and ecological processes among patches determined by observation, experimentation, and model predictions (Salgueiro et al., 2021). The regional landscape structure may be reconstructed by restoring existing (Williams and Baker, 2012) or introducing new landscape elements (Haider et al., 2016), adjusting their spatial configuration, and enhancing landscape connectivity (Dondina et al., 2018). In this manner, the security of the regional landscape pattern is established and maintained. Several tools are available to depict landscape connectivity. Carlier and Moran (2019) used morphological spatial pattern analysis (MSPA) for the comprehensive description of the structural connectivity among linear and spatial habitats. Dai et al. (2021) combined Minimum Cumulative Resistance (MCR) and Duranton and Overman Index (DOI) models to identify ecological networks and maintain landscape connectivity. Circuit theory identifies ecological networks by assigning different degrees of significance to various physical variables. It integrates the strengths of the random walking and graph theories (McRae, 2006). Gao J. et al. (2021) integrated ecosystem services and the circuit theory to portray landscape connectivity and identify karst ecological networks. An et al. (2021) took both structural connectivity and functional connectivity into consideration, using the integrative method of MSPA and circuit theory to construct and optimize the ecological networks, which has greater ecological significance.
LeGrand (1973) first paid attention to the ecological problems in karst regions. Guizhou Province is typical and representative of the karst area in Southwestern China (Tian et al., 2017). Karstification and high intensity development and construction make the phenomenon of landscape isolation in karst region increasingly serious (Peng et al., 2018). Rocky desertification impoverishes ecosystems, destroys natural habitats, and impedes regional sustainable development (Huang et al., 2010). With the decrease of the connectivity of multiple landscape patches, the free migration of species and the normal ecological circulation process of landscape were hindered. Since the onset of the 21st century, several large-scale ecological protection and construction projects have been initiated in China and have achieved positive results. In Guizhou Province, the long-term rocky desertification project has involved extensive tree planting and afforestation and has significantly increased forest and grass coverage (Liao et al., 2018). Nevertheless, it is also necessary to determine the changes in landscape structure caused by these projects and assess the impact that these modifications have on ecosystem function. Prior studies on karst regions mainly evaluated the impact of vegetation restoration from the perspective of climate change and human activity and confirmed that anthropogenic factors play major roles (Cai et al., 2014; Peng et al., 2021). However, the landscape pattern strongly influences landscape function and ecological processes (Pausas, 2003). Hence, it is necessary to consider its impact on variations in vegetation from the perspective of landscape connectivity.
The ecological restoration project has been implemented in Guizhou Province since approximately 2,000. However, vegetation may have to pass through several succession stages until its ecological function is optimized. For this reason, the present study was initiated in 2005. The ecological networks were mapped according to the patch corridor matrix model using MSPA and the integrated valuation of ecosystem services and tradeoffs (InVEST) and circuit theory models. Based on MODIS NDVI data, the spatiotemporal pattern of vegetation coverage and the stability of ecosystem functions was analyzed by Theil-Sen trend analysis and the Mann-Kendall (MK) trend test. Correlations between the average cumulative current density (CCD) and the normalized difference vegetation index (NDVI) in various karst counties were evaluated. The factors and their interactions influencing the NDVI trends were revealed with geographical detectors. This study aims to clarify the mechanisms by which the karst areas in Guizhou Province respond to changes in landscape connectivity. Additionally, it will present evidence of the efficacy of the ecological restoration projects in these regions.
Materials and Methods
Study Area
Guizhou Province is in the eastern part of the Yunnan-Kweichow Plateau in the karst region of Southwestern China (24°37′–29°13′N, 103°36′–109°35′E) (Figure 1). Its total area is 17.62 × 10⁴ km2 of which ∼70% is karst. The regional climate is subtropical humid monsoon. The average annual temperature is 10–18°C and the annual precipitation is 1,000–1,500 mm. Carbonate rocks are widely distributed in Guizhou Province. The ecosystem structure is complex, the spatial heterogeneity and ecological sensitivity are high, the environmental capacity is low, and the habitat is fragile. Guizhou is the only province in China lacking plains. Its average elevation is ∼1,100 m. Plateaus and mountains account for ∼87% of the total area. Long-term human activity has intensified rocky desertification there. Guizhou Province has been the focus of national rocky desertification and ecological restoration projects since 2000.
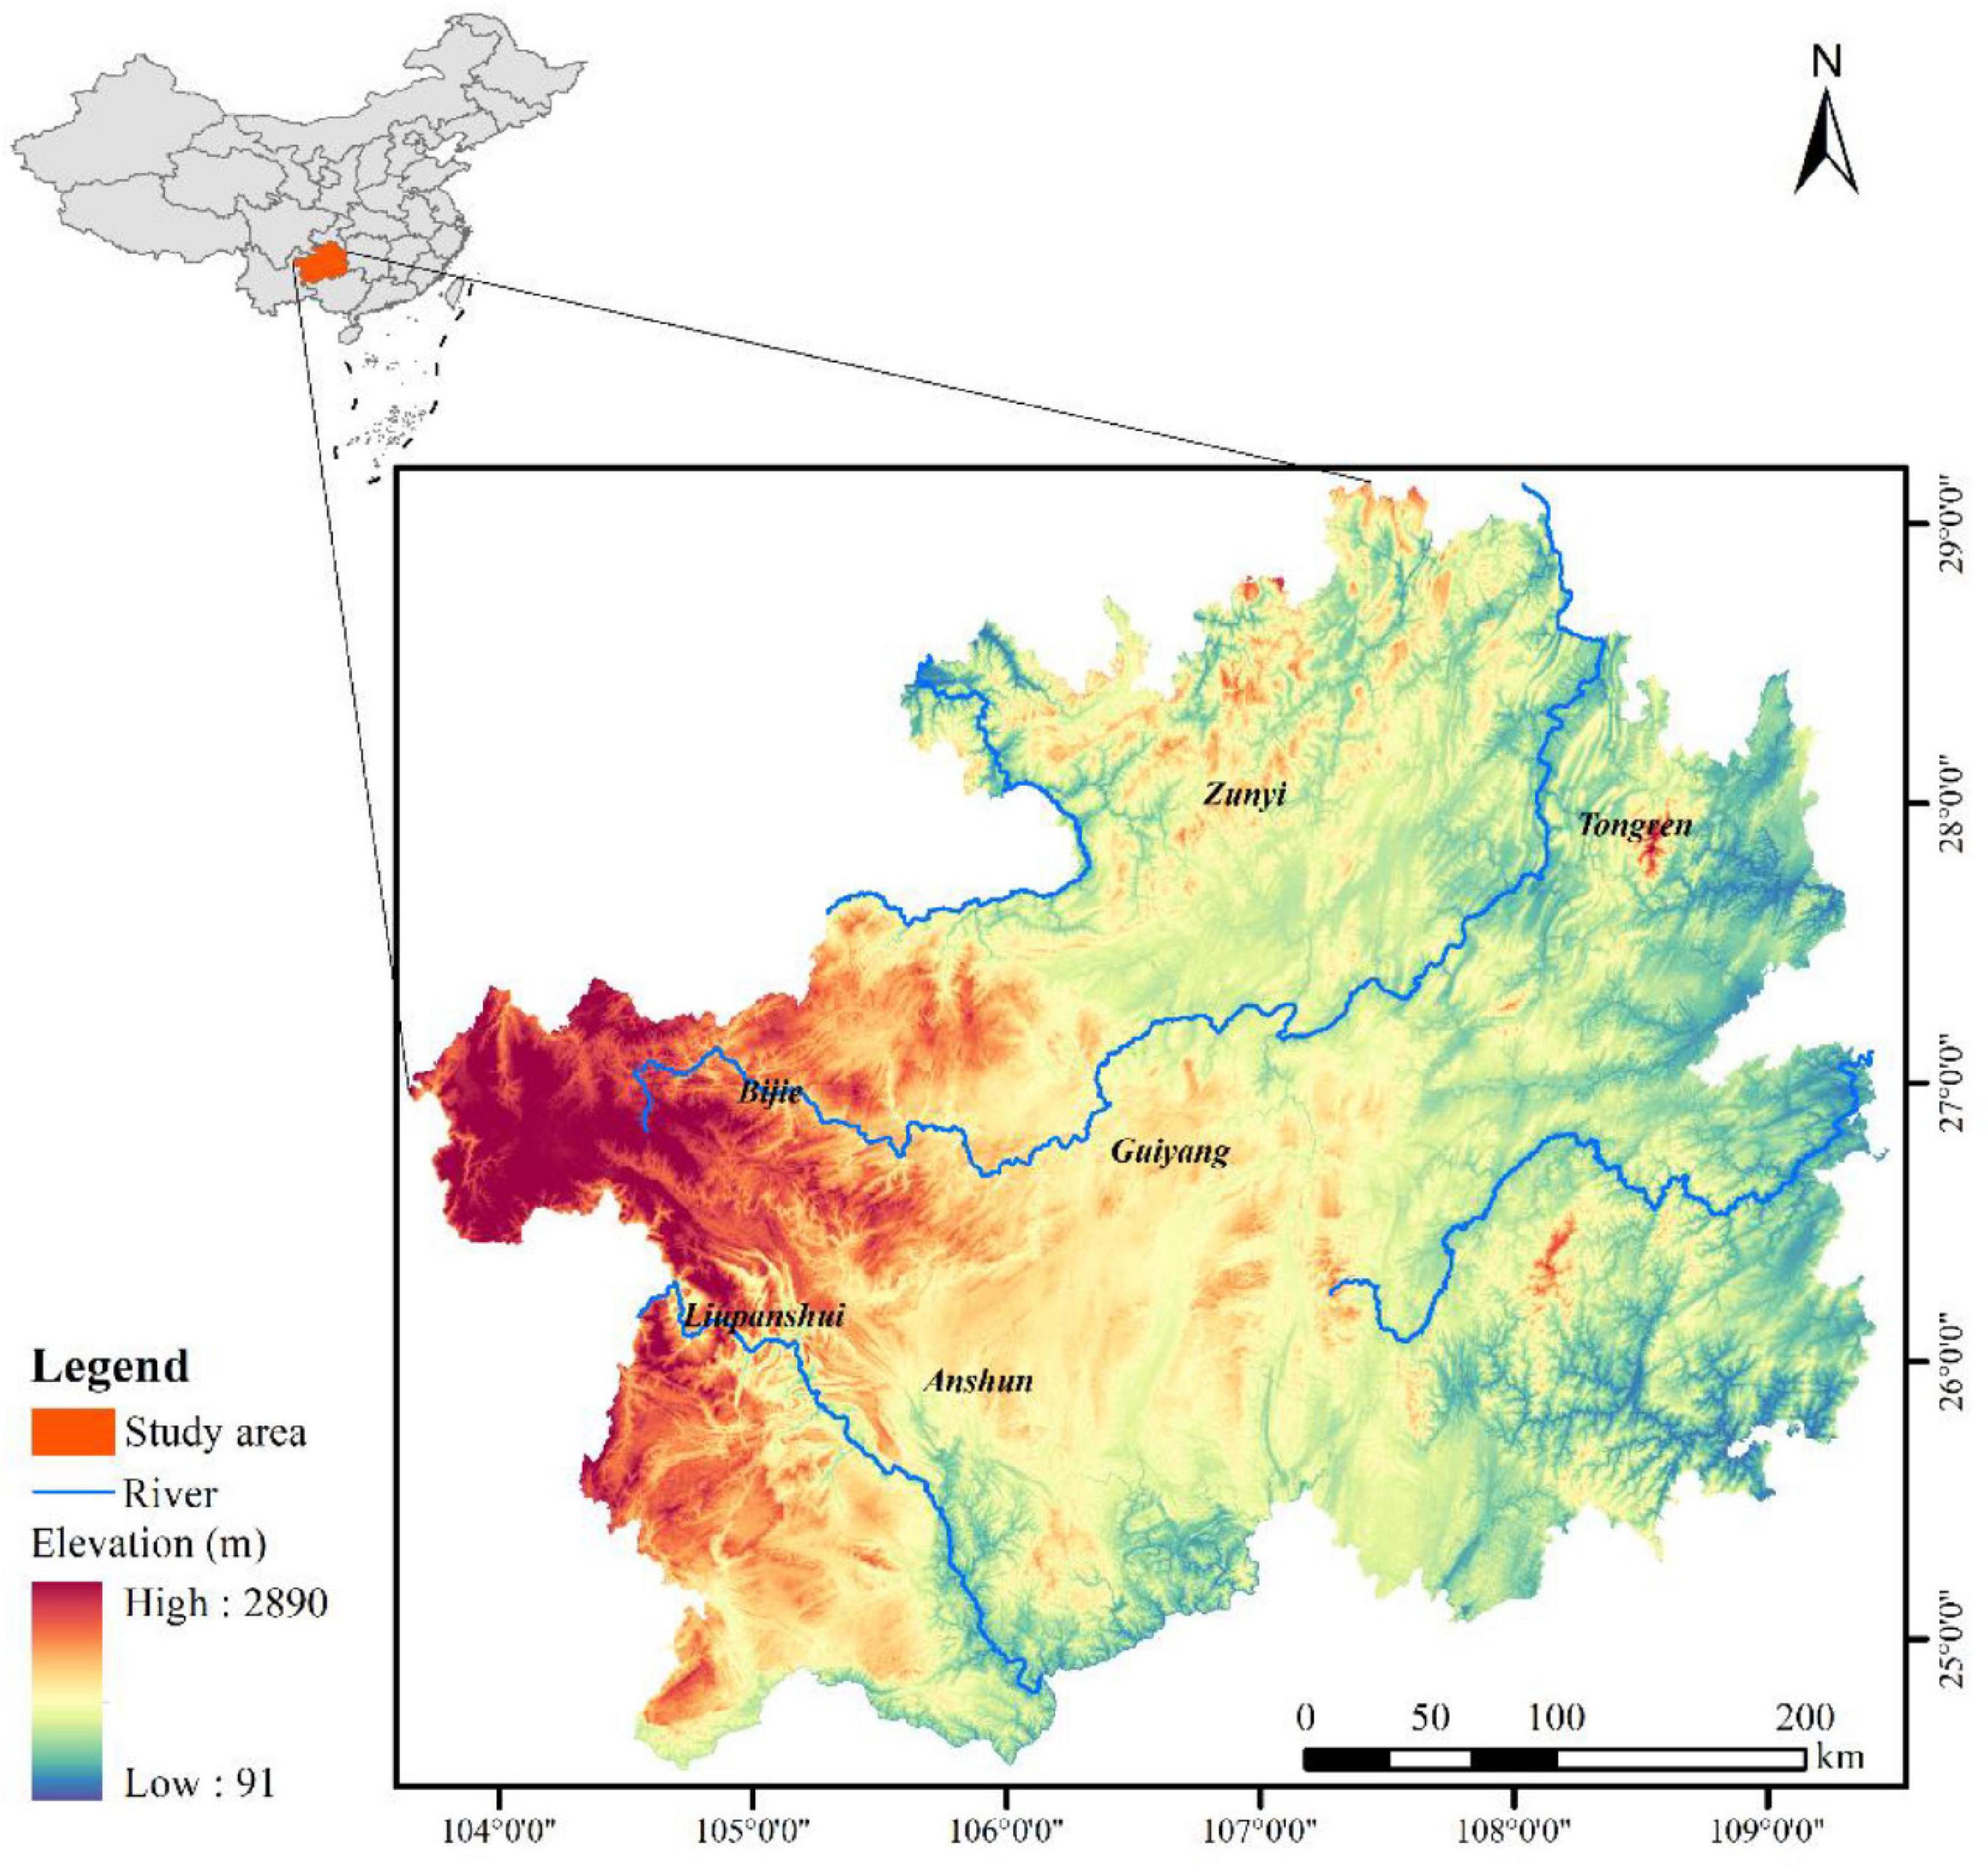
Figure 1. Study site in Guizhou Province.
Data Source
The datasets used in this study included land use data for 2005 and 2018, a digital elevation model (DEM), and ground meteorological data derived from the Resources and Environmental Science and Data Center of the Chinese Academy of Sciences.1 The annual mean precipitation and temperature data were obtained from the China Surface Climatic Data Daily Dataset (v. 3.0) of the National Meteorological Science Data Center2 and were calculated by inverse distance weighting (IDW) interpolation. The NDVI data were obtained using the MOD13Q1 product of the Land Processes Distributed Active Archive Center of NASA.3 The MODIS reprojection tool (MRT4) was used to extract the NDVI data and convert them to a raster file. ArcGIS 10.4 software was used to obtain the largest NDVI per pixel per year and the NDVI of each county-level administrative region. County-level afforestation data were acquired from the China Forestry and Grassland Statistical Yearbook.5 Socioeconomic data were procured from the Guizhou Statistical Yearbook.6 The research framework is shown in Figure 2.
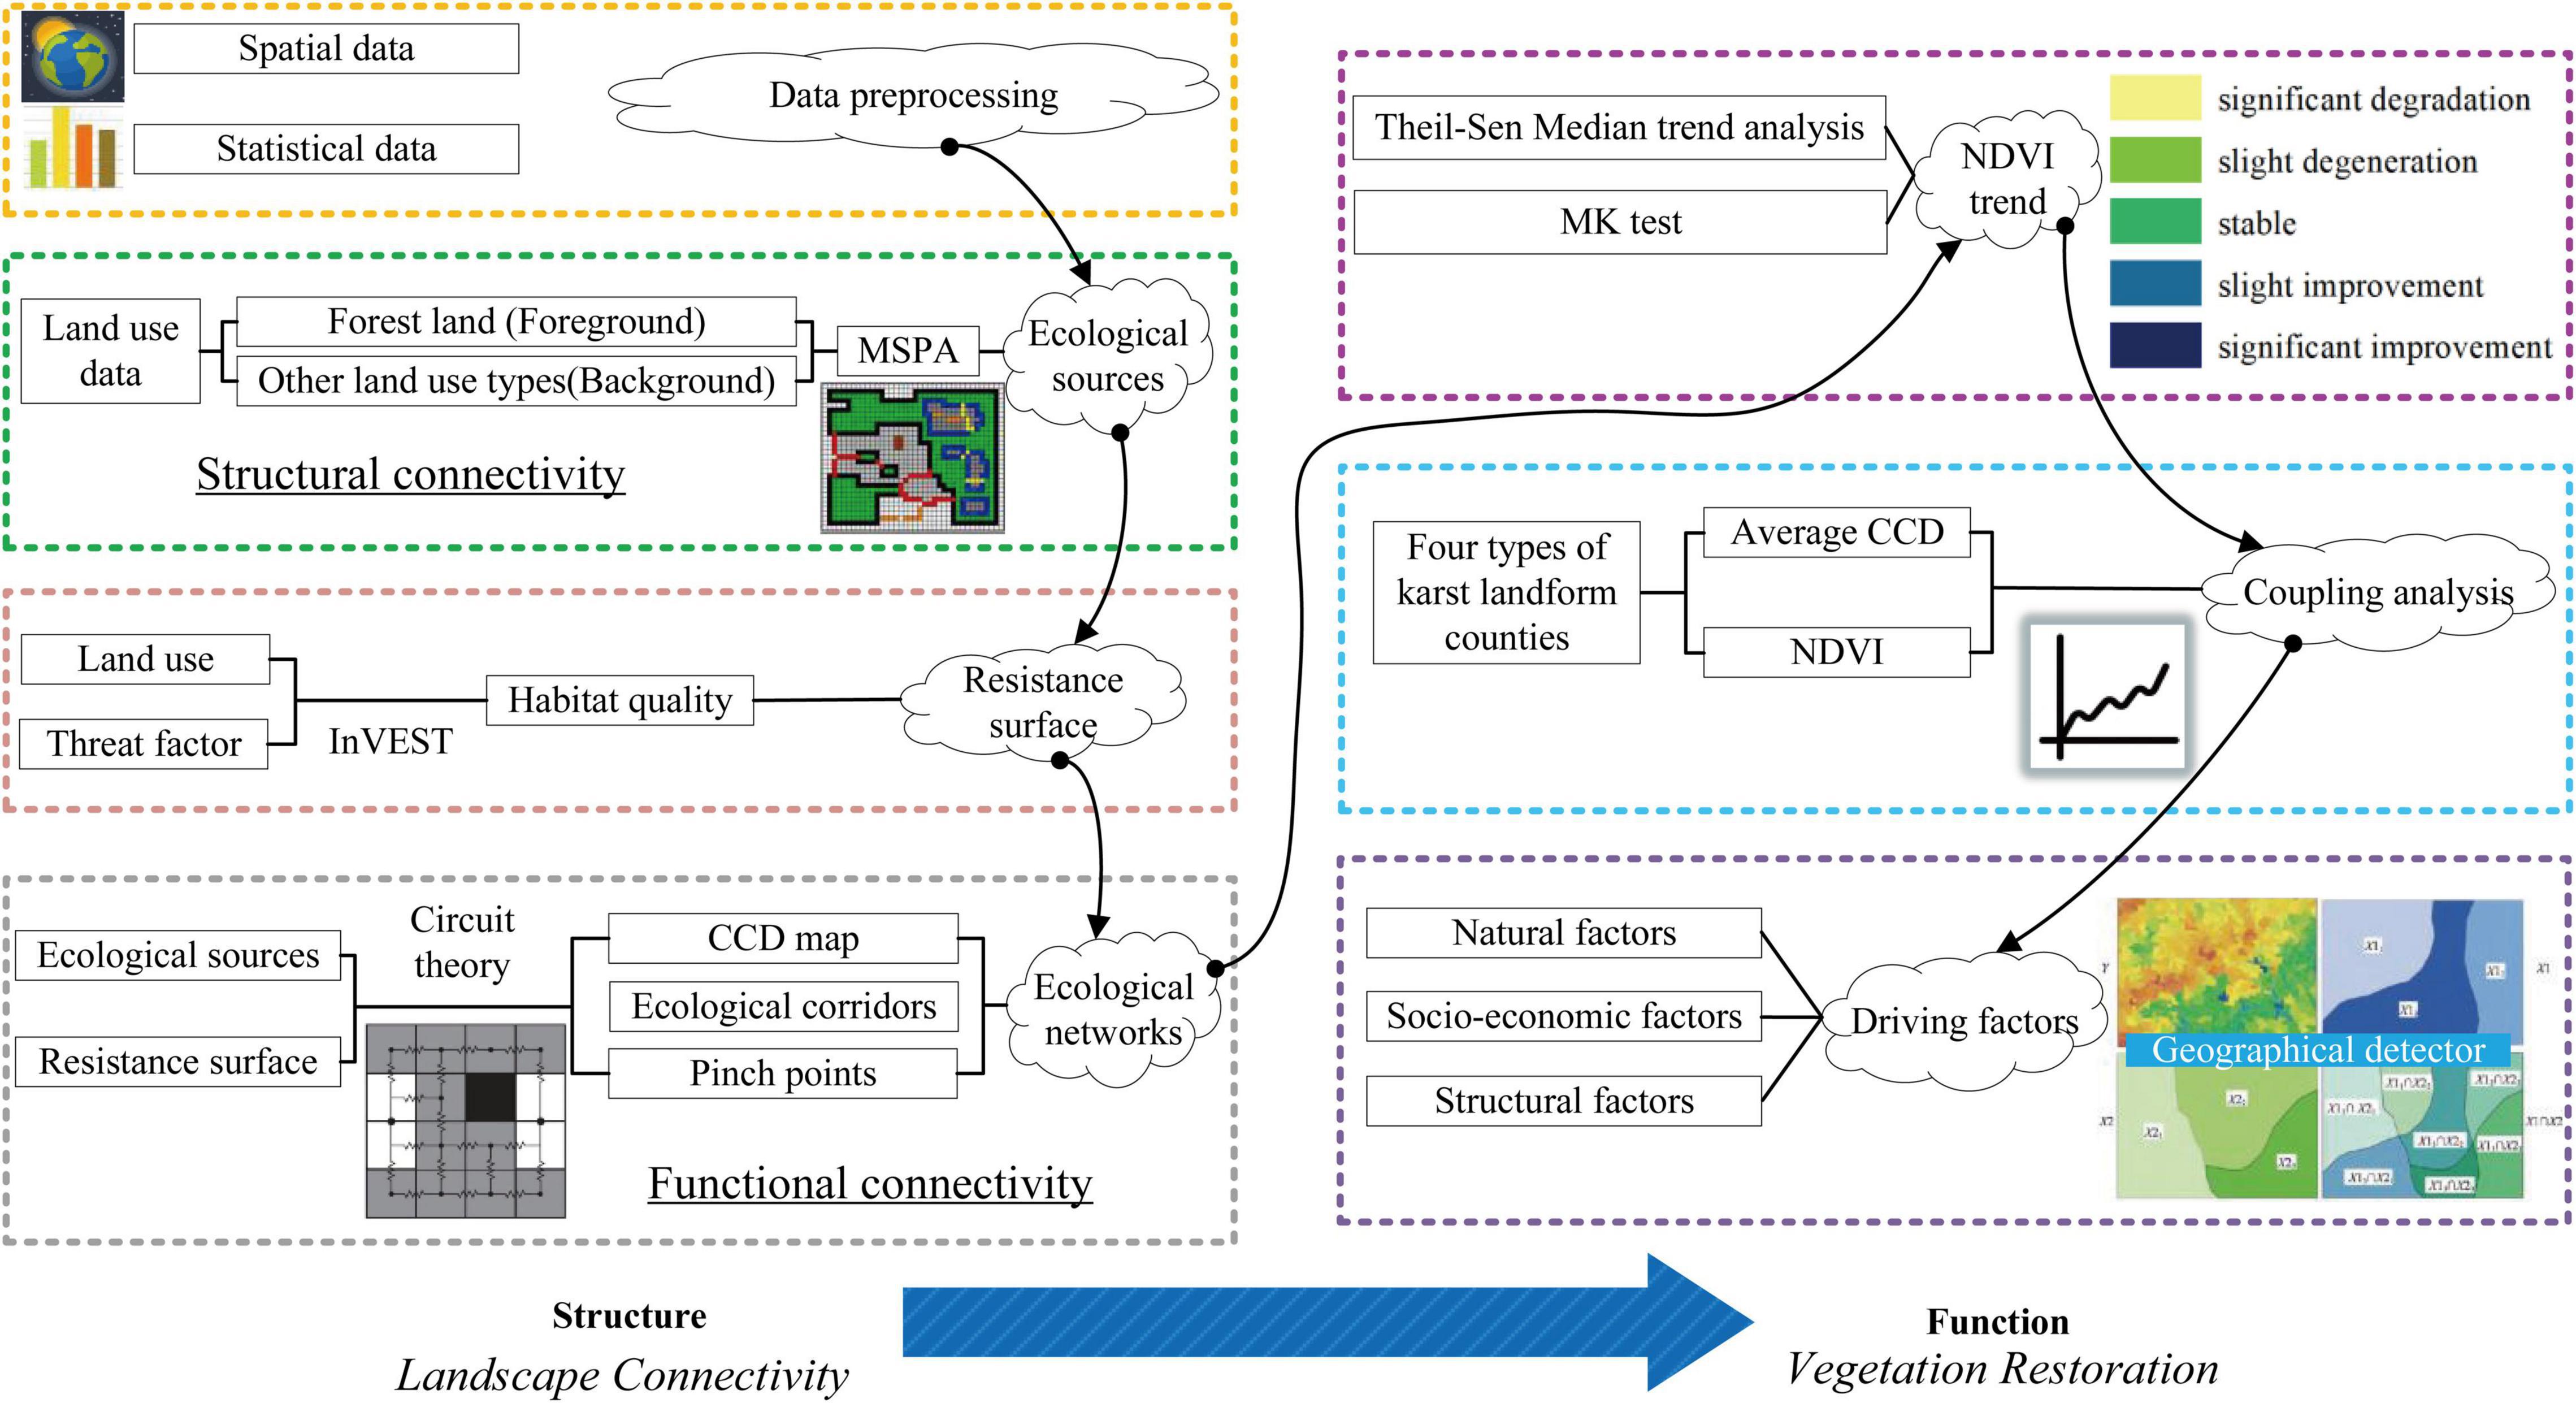
Figure 2. Study methodology.
Identification of Core Area Patches by the Morphological Spatial Pattern Analysis Method
Morphological spatial pattern analysis is a classification processing method based on mathematical morphology. It analyzes the topological relationship of an image at the pixel level. MSPA divides the pixels of a binary image into seven mutually exclusive landscape elements (Soille and Vogt, 2009). Using the MSPA method to extract ecological patches requires no indicator selection or complex data processing.
Forestland coverage accounts for ∼53% of the total area in Guizhou Province. Areas with relatively less human disturbance are primarily mosaic communities dominated by forests. The ecological function of forestland is greater than that of other vegetation communities and thus partially determines the state of the entire ecosystem. For the restoration and reconstruction of karst regions, although other biological and engineering measures also play a certain role in ecological regulation, it is difficult to overcome the main contradiction that leads to the degradation of karst ecosystems, that is, the problem of water conservation. Forestland has a richer hierarchical structure than other vegetation, and its water conservation function is much higher than that of other vegetation. Therefore, forestlands were selected as foreground elements while other land use types were used as background elements. A binary image was generated and GuidosToolbox software7 was used to identify the seven MSPA-based landscape elements, namely, core, bridge, edge, branch, loop, islet, and perforation. The core is the source of various ecological processes. Bridges are linear elements connecting various core area patches representing landscape connectivity. Edges are transition zones between the external perimeters of the core area and the non-forest landscape area. Branches are narrow regions connected to the core areas. Loops are the internal access points of material and energy exchange within a single core area. Islets are isolated small patches with low landscape connectivity. Perforations are the interior perimeters of a core area patch. Here, we used GuidosToolbox to assess forestland connectivity, adopted an eight-connectivity analysis, and set the edge width to three (Gao J. et al., 2021).
Ecological Resistance Surface Identification
The resistance surface is the basis of ecological network identification and represents the resistance that various animal species must overcome when they move in space. Here, habitat quality was calculated with the habitat quality module in the InVEST model. The resistance surface was the reciprocal of the habitat quality as the latter indicates high biodiversity and low species resistance. The resistance surface extracted by this method was relatively more ecologically significant (Peng et al., 2018). Space limitations prohibit description of the calculation processes here.
Ecological Networks Identification
Circuit theory treats landscape as an electrical circuit. Heterogeneous landscapes may be viewed as circuits containing a series of nodes and resistors. Ecological corridors link ecological sources and usually consist of belt-like areas with specific widths. In the raster data, the CCD is defined as the amount of current flowing through a single pixel, and it can reflect the probability that a wanderer will move along a certain node or path. With the increase of the circuit path number, the effective resistance of the parallel circuit decreases and the corresponding current increases. That is to say, when resistance to the movement of species in the landscape decreases, CCD will increase, meaning that functional connectivity will also improve. Prior studies regarded ecological corridors as optimal paths for species migration (Beaujean et al., 2021; Fan et al., 2021). However, not all species may accurately identify the optimal path they must follow to reach their habitat destinations. Therefore, certain suboptimal paths are potential ecological flow corridors. Based on random walk characteristics of species in landscape, circuit theory can provide multiple potential corridors. This is better aligned with the behavioral characteristics of species (Ciudad et al., 2021). Besides, circuit theory model also can be used to identify “pinch points” corresponding to areas with high CCD in the voltage diagrams. Pinch point is the area with good connectivity between source areas, which is very important to maintain the connection of the whole ecological networks. Animal species either prefer to move through them or do so because there are no alternate paths. If a pinch point is removed or changed, it may significantly affect landscape connectivity (McRae et al., 2008; Cushman et al., 2013). Besides, circuit theory can provide a basis for improving the quality of existing corridors and patches and identifying key conservation and restoration areas, thereby helping to control and improve biological and abiotic flows and improve the efficiency of other important ecological processes and services (Taylor et al., 2006). In this study, Circuitscape 4.0 software8 and Linkage Mapper9 were applied to calculate the CCD and create voltage diagrams across the landscape based on available node and resistance surface data.
Theil-Sen Median Trend Analysis and Mann-Kendall Trend Test
A combination of Theil-Sen Median trend analysis and the MK trend test analyzes patterns of variation in vegetation over extended time series (Fensholt and Proud, 2012; Fensholt et al., 2012; Jiang et al., 2015). Theil-Sen Median trend analysis is a non-parametric statistical method used to calculate trends in variation (Healy et al., 1983). Its slope was used here to evaluate improvement and degradation in the vegetation of Guizhou Province between 2005 and 2018. The formula is as follows:
where SNDVI is the slope of the Theil-Sen median and NDVIb and NDVIa are the NDVI for years b and a. SNDVI > 0 indicates a rising trend while SNDVI ≤ 0 indicates a falling trend.
The MK trend test is also a non-parametric statistic measuring the significance of SNDVI. Its input samples need not conform to certain distributions and it is not susceptible to the interference of outliers. The MK trend test has also been proposed to study patterns of variation in vegetation over extended time series (Jiang et al., 2015). The significance level |Z| > u1–α/2 indicates that the time series significantly varies at the α level. Here, the significance of the SNDVI from 2005 to 2018 was measured at the 0.05 confidence level.
Division of Karst Landform Counties
As there are extensive karst landforms in Guizhou Province, lithology strongly affects the heterogeneity of landscape structure and function. The 88 counties of Guizhou Province were divided into four categories according to their proportions of carbonate rocks. Lin (2001) divided the counties of Guizhou Province into four classes based on their proportions of karst area. The county categories were: (a) higher proportion of karst landforms; (b) lower proportion of karst landforms; (c) interlaced karst and non-karst landforms; and (d) non-karst landforms. According to this classification system, the 88 counties in Guizhou Province were reclassified by lithology data and changes in administrative division. Sixty-two counties had >60% karst area, seven had karst area in the range of 50–60%, another seven had interlaced karst and non-karst landforms in an area ratio of 25–50%, and the remaining 12 were non-karst counties.
Geographical Detector Model
The geographical detector is a spatial statistic model proposed by Wang et al. (2010). It has been used to quantify the influences of potential driving factors on geographical phenomena based on spatial variance analysis (Wang et al., 2016, 2017; Gao F. et al., 2021). Our aim was to investigate the effects of structural changes in regional landscape connectivity on key ecological processes and ecosystem functions. To this end, we selected three dynamic indicators representing changes in spatial structure, namely, the rates of change in the core, bridge, and average CCD. However, the NDVI was also related to climatic, surface, and human activity factors. Therefore, we added the following control variables: annual average and temperature, urbanization growth rate, land surface relief, percentage of carbonate rocks, areas of artificial afforestation and closing hillsides to facilitate afforestation, and rates of change in GDP per capita and population density. The pixel-level NVDI slope was calculated for Guizhou Province and the average slope of each county unit was calculated as the dependent variable by using the zonal statistics method in ArcGIS. Factor and interaction detectors were used and they indicated which factors had the most significant impact on the slope of NDVI. They also disclosed the interactive effects among various pairs of factors.
Factor Detector
The factor detector calculates the q-value which quantifies the impact of potential driving factors on the spatiotemporal trend in NDVI variation. The influence of q on the spatiotemporal trend in NDVI variation increases with its value:
where N is study area comprising N units layered into h = 1, 2, 3, …L strata. Stratum h comprises Nh units. σ2 and σh2 are the global variance of the dependent variable of the study area and the variances of the dependent variables in the sub-areas, respectively. SSW and SST are the “within sum of squares” and “total sum of squares,” respectively. The q-value is in the range of 0–1.
Interaction Detector
The interaction detector indicates whether two factors strengthen or weaken each other. It compares their combined and separate contributions (Wang et al., 2010). The model categorized five interactive effects (Table 1).
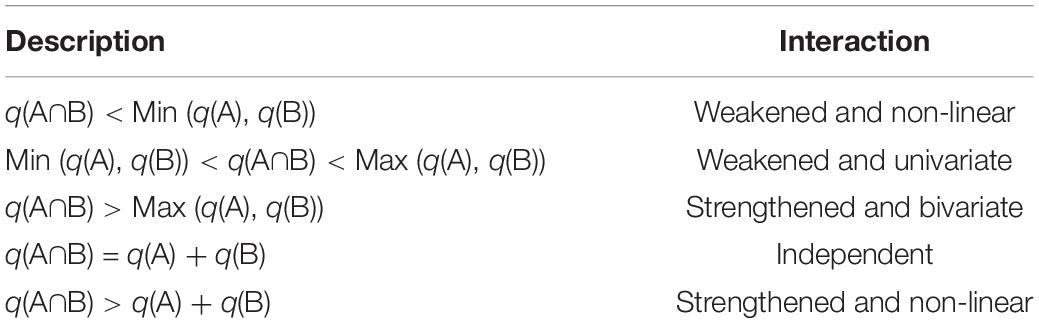
Table 1. Interactions between covariate pairs.
Results
Identification of Ecological Sources and Resistance Surface
In 2005 and 2018, the Guizhou Province forestland occupied 94,781.33 and 93,082.51 km2, respectively. The changes in morphological spatial pattern were most evident in Central and Western Guizhou Province. By contrast, the other regions remained relatively stable. The proportions of various landscape elements in the foreground area were also stable. The proportion of perforation decreased by 0.48%. The core area was 57,806.25 and 56,870.55 km2 in 2005 and 2018, respectively, and occupied mainly the northeastern and southeastern parts of the study area. However, there were also small dispersive core areas and the landscape was fragmented (Figure 3). Cores with areas >10 km2 (based on MSPA) were defined as ecological sources. They were entered into the circuit theory model for landscape connectivity analysis (Gao J. et al., 2021). There were 453 and 507 core patches extracted as ecological sources in 2005 and 2018, respectively. Overall, the ecological sources were large but fragmented. This finding was consistent with the distribution characteristics of typical karst landform vegetation.
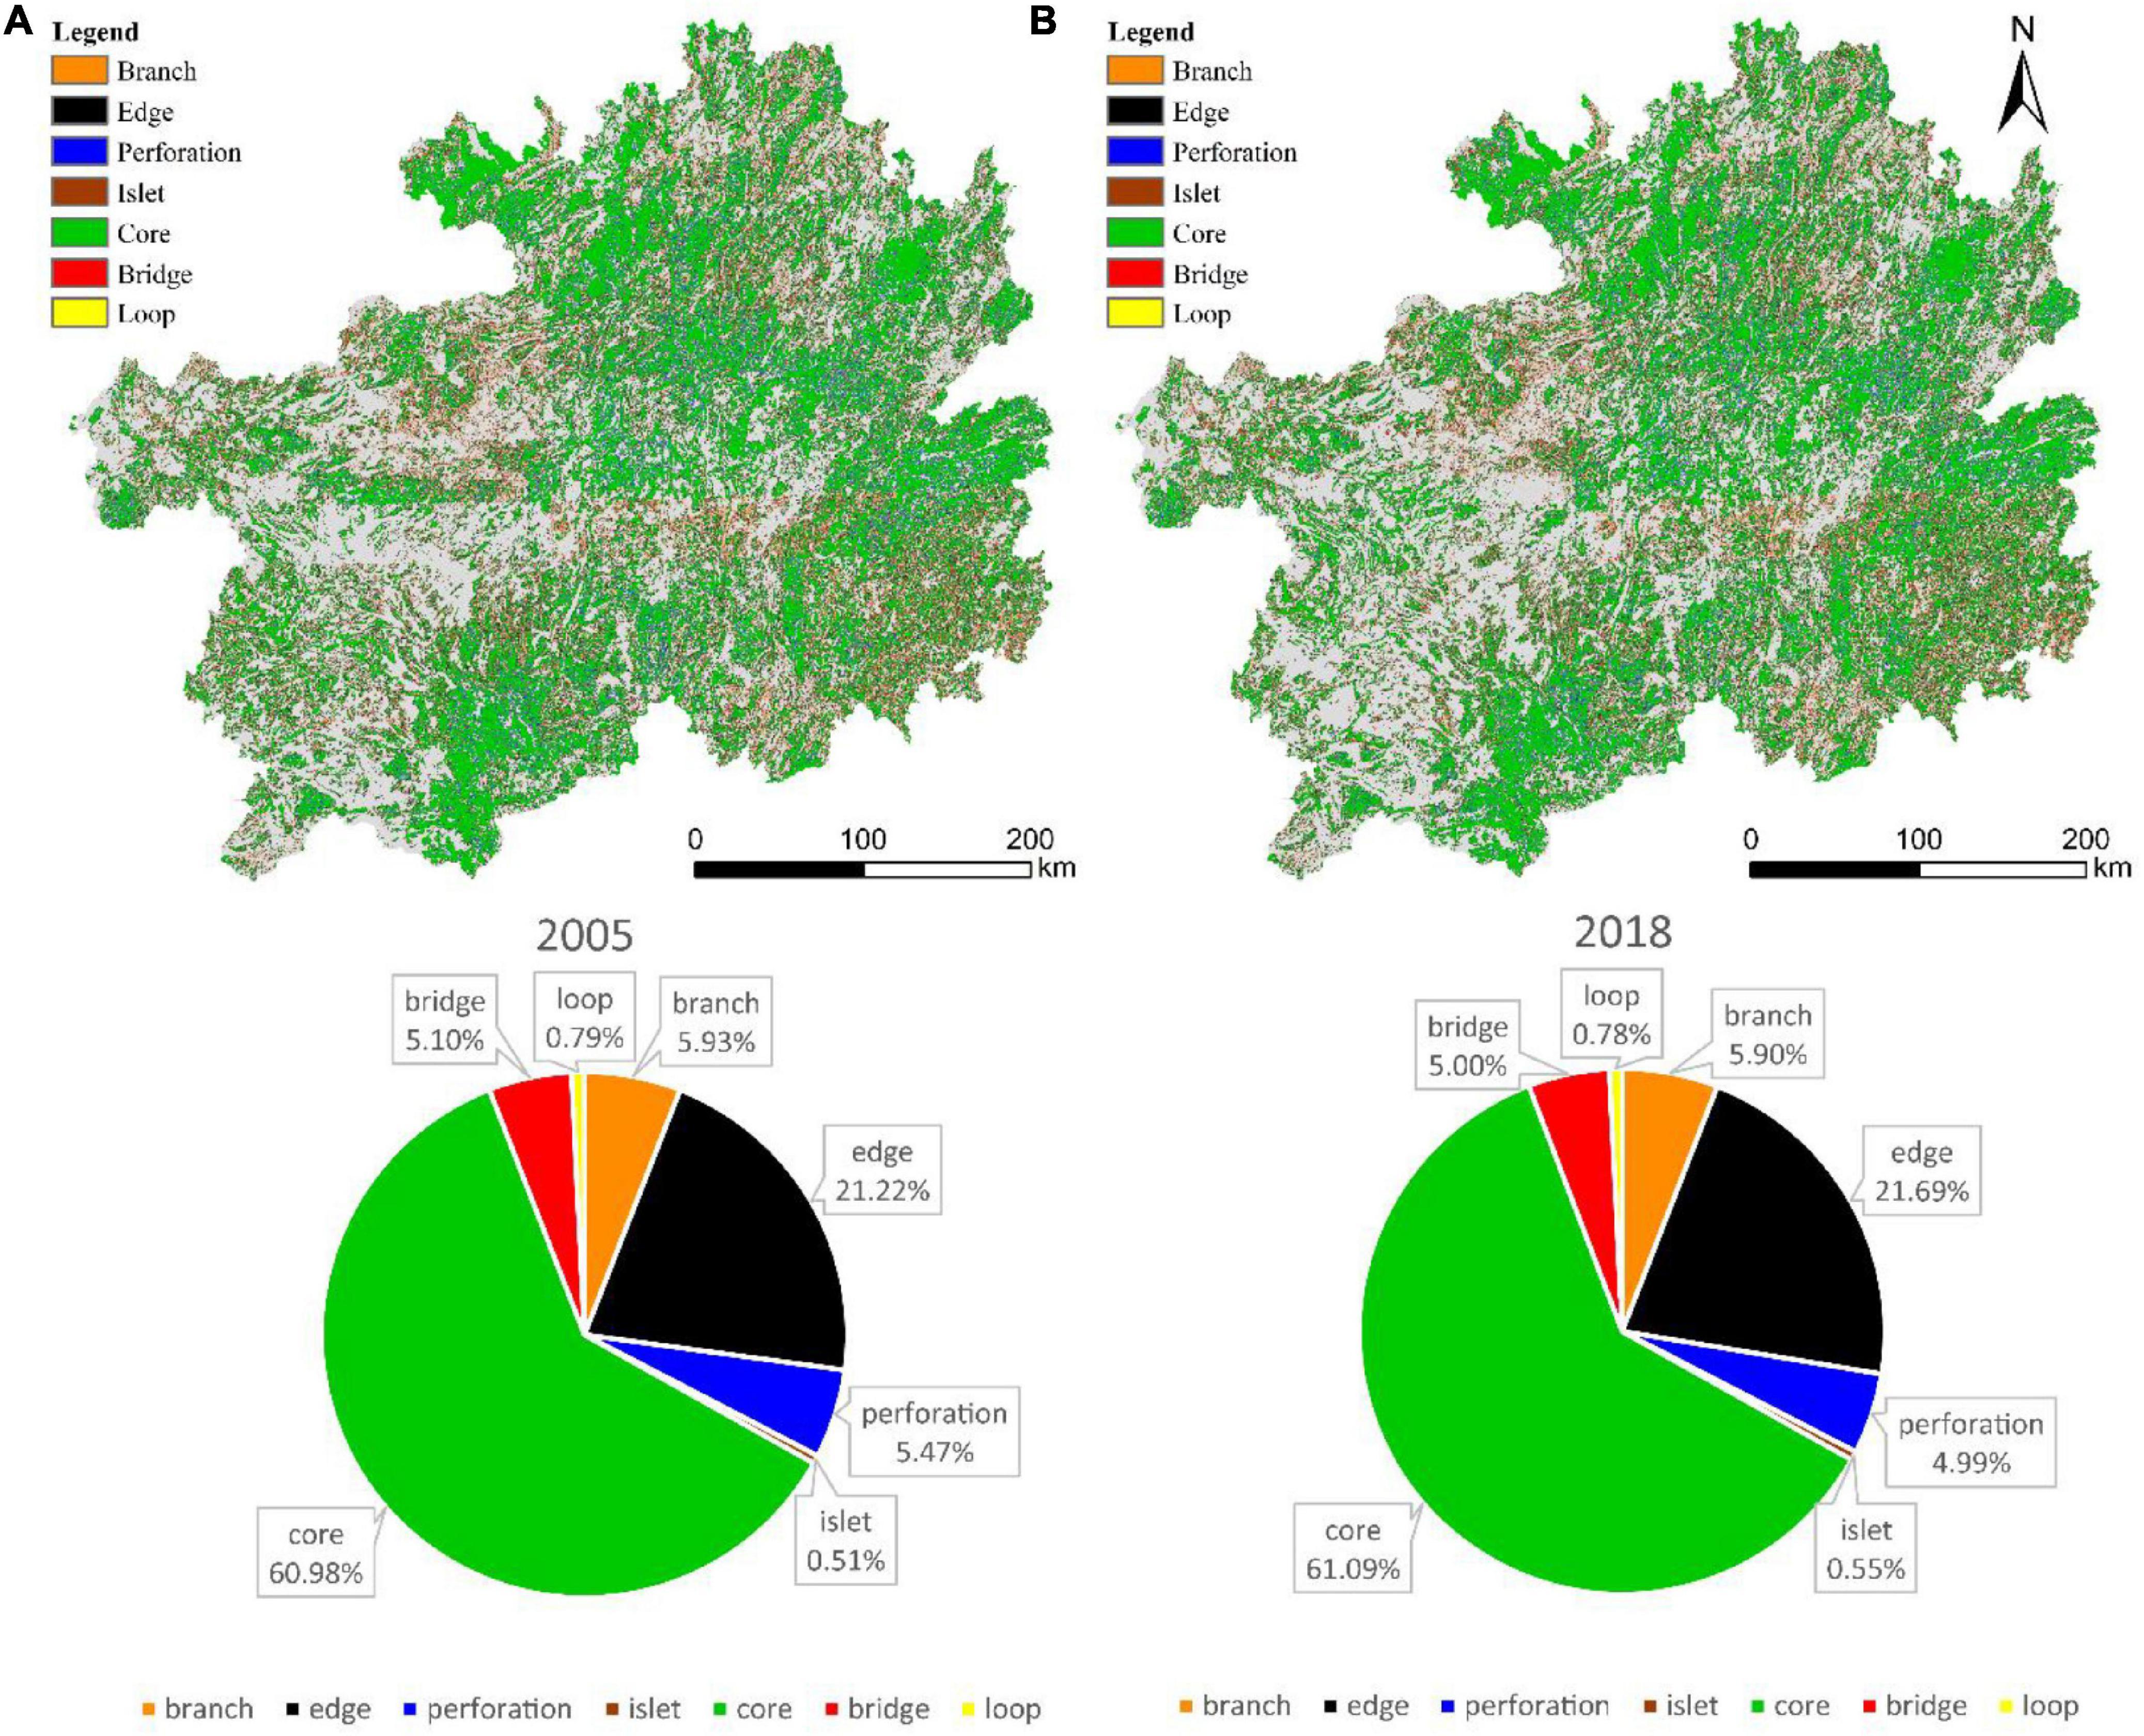
Figure 3. Spatial distributions of morphological spatial pattern analysis (MSPA) in 2005 (A) and 2018 (B). Percentages of forestland are shown.
Connectivity of the landscape ecological flow must overcome resistance contributed by various influencing factors in the space. As is shown in Figure 4, the average ecological resistance values in Guizhou were 1.2039 and 1.2074 in 2005 and 2018, respectively. Thus, ecological resistance rose slightly but nonetheless remained low. The areas with strong resistance were located mainly in the urban areas of Guiyang, Zunyi, Kaili, and Liupanshui City and their environs. The habitat quality of these areas was zero. Hence, they showed infinite resistance.
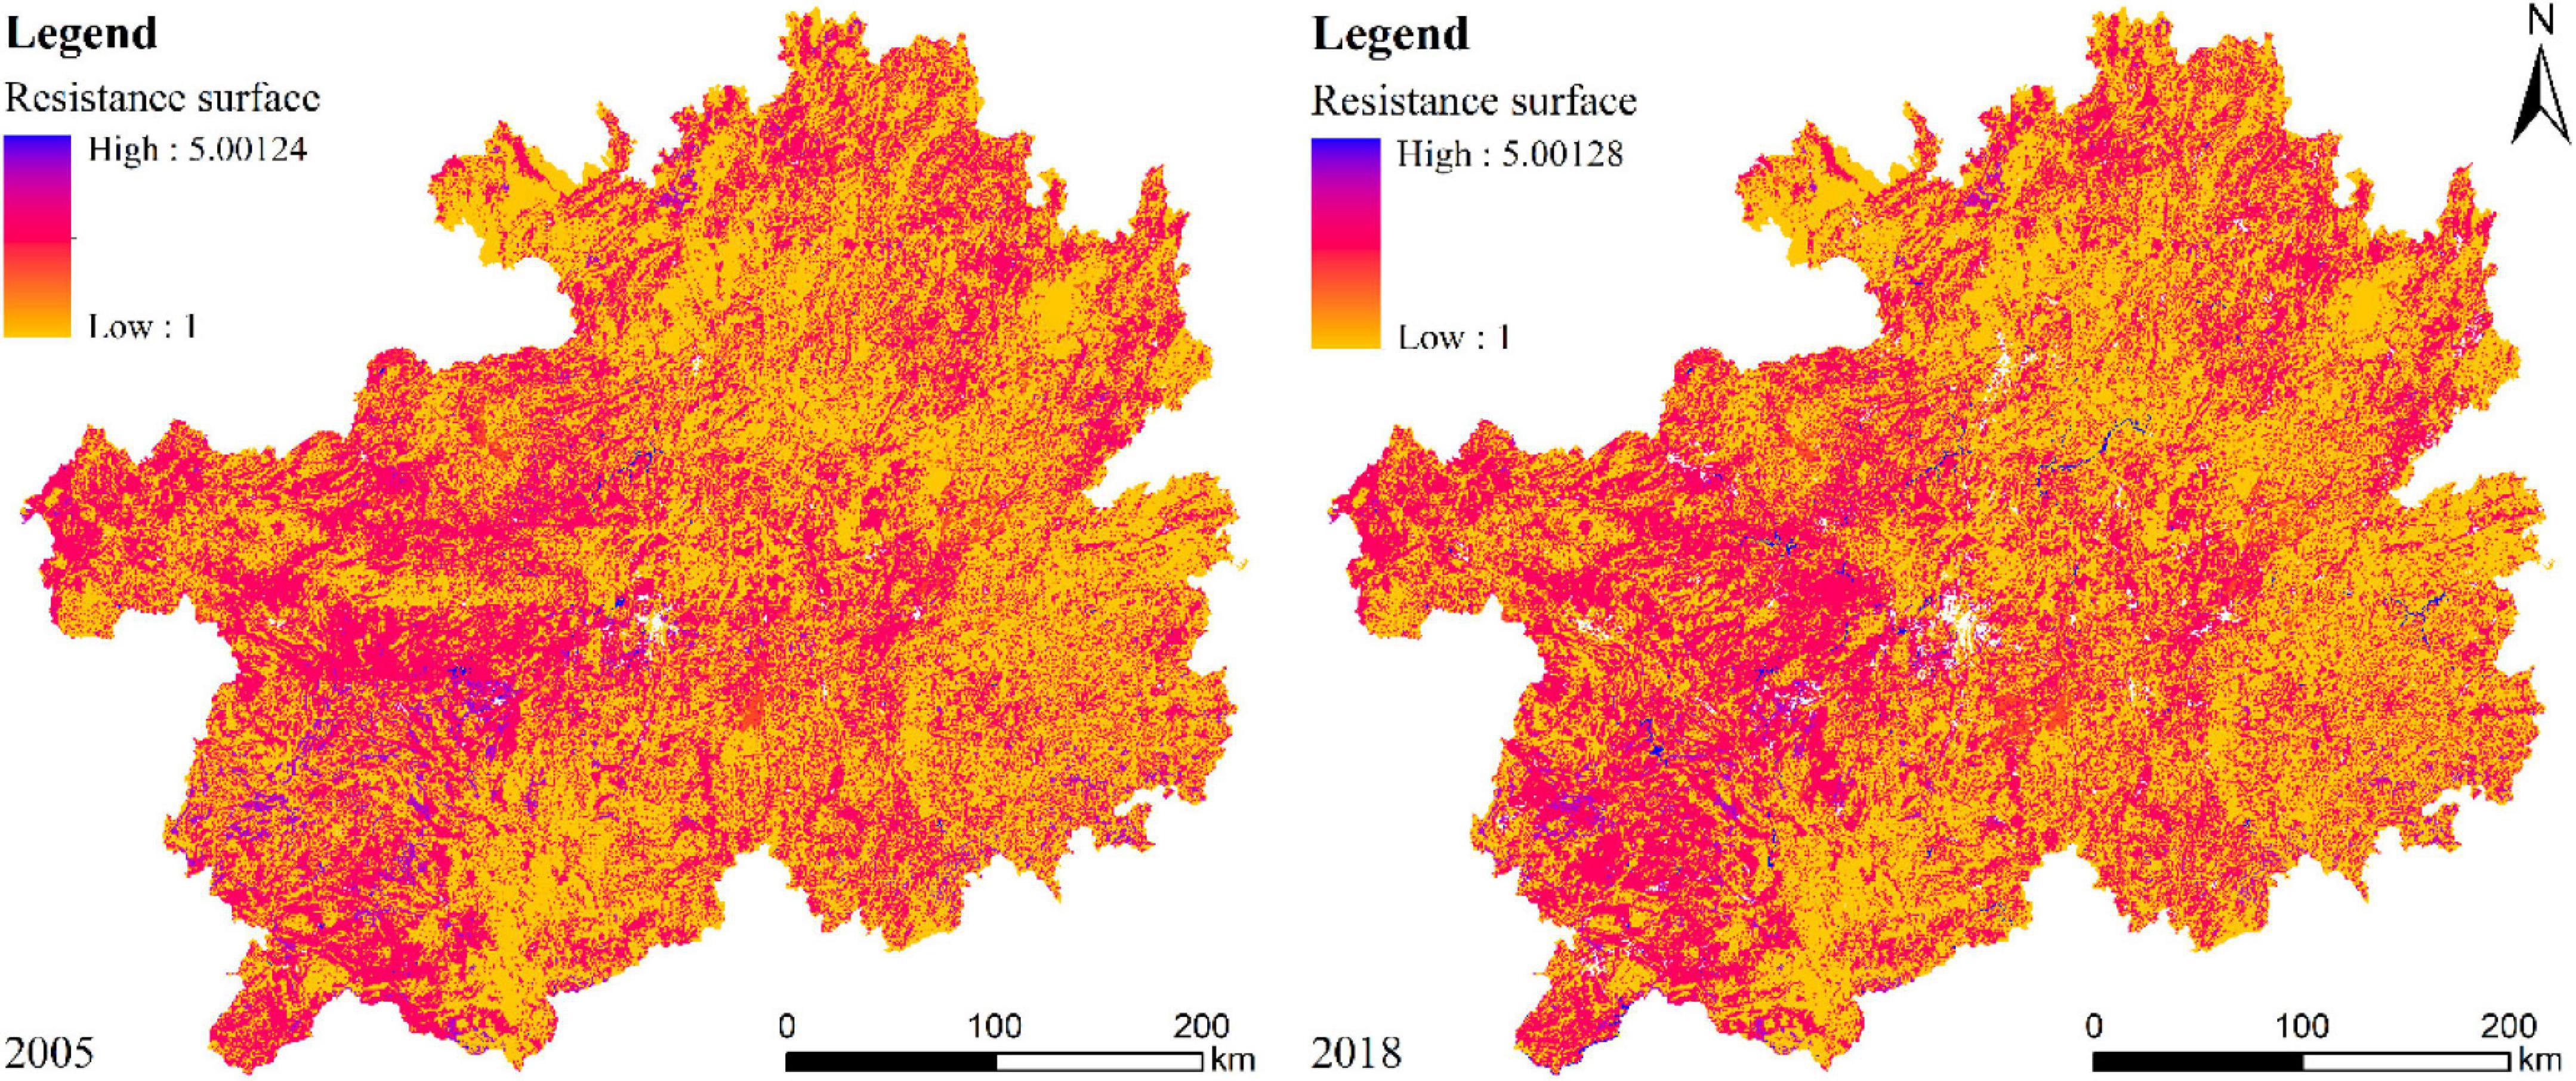
Figure 4. Spatial distributions of resistance surfaces in 2005 and 2018.
Identification of Ecological Networks and Their Variations
The ecological networks (Figures 5A,B) showed that the numbers of ecological sources and corridors in Guizhou Province increased overall and the potential corridors were extended. In Guiyang City, the ecological sources and corridors became scattered and their numbers decreased. Hence, urbanization markedly contributed to the change in vegetation cover in Guizhou Province. However, this degradation was ecologically compensated in remote areas. In 2018, small forest patches appeared in the southwest and they improved the landscape connectivity of the surrounding area. Figures 5C,D show the CCD values for 2005 and 2018. The maximum and average CCD were 1,681.94 and 58.49, respectively, in 2005 and 1,896.97 and 81.74, respectively, in 2018. Though the total forestland area and the core area decreased, there was overall improvement in forest landscape connectivity in Guizhou Province. Figure 5D shows that the positions of most pinch points in Western Guizhou remained unchanged. However, their ranges narrowed. Thus, resistance around the pinch points decreased and landscape connectivity improved in Western Guizhou. New pinch points appeared in Northeastern Guizhou. Therefore, the ecological resistance around them increased and the landscape connectivity deteriorated.
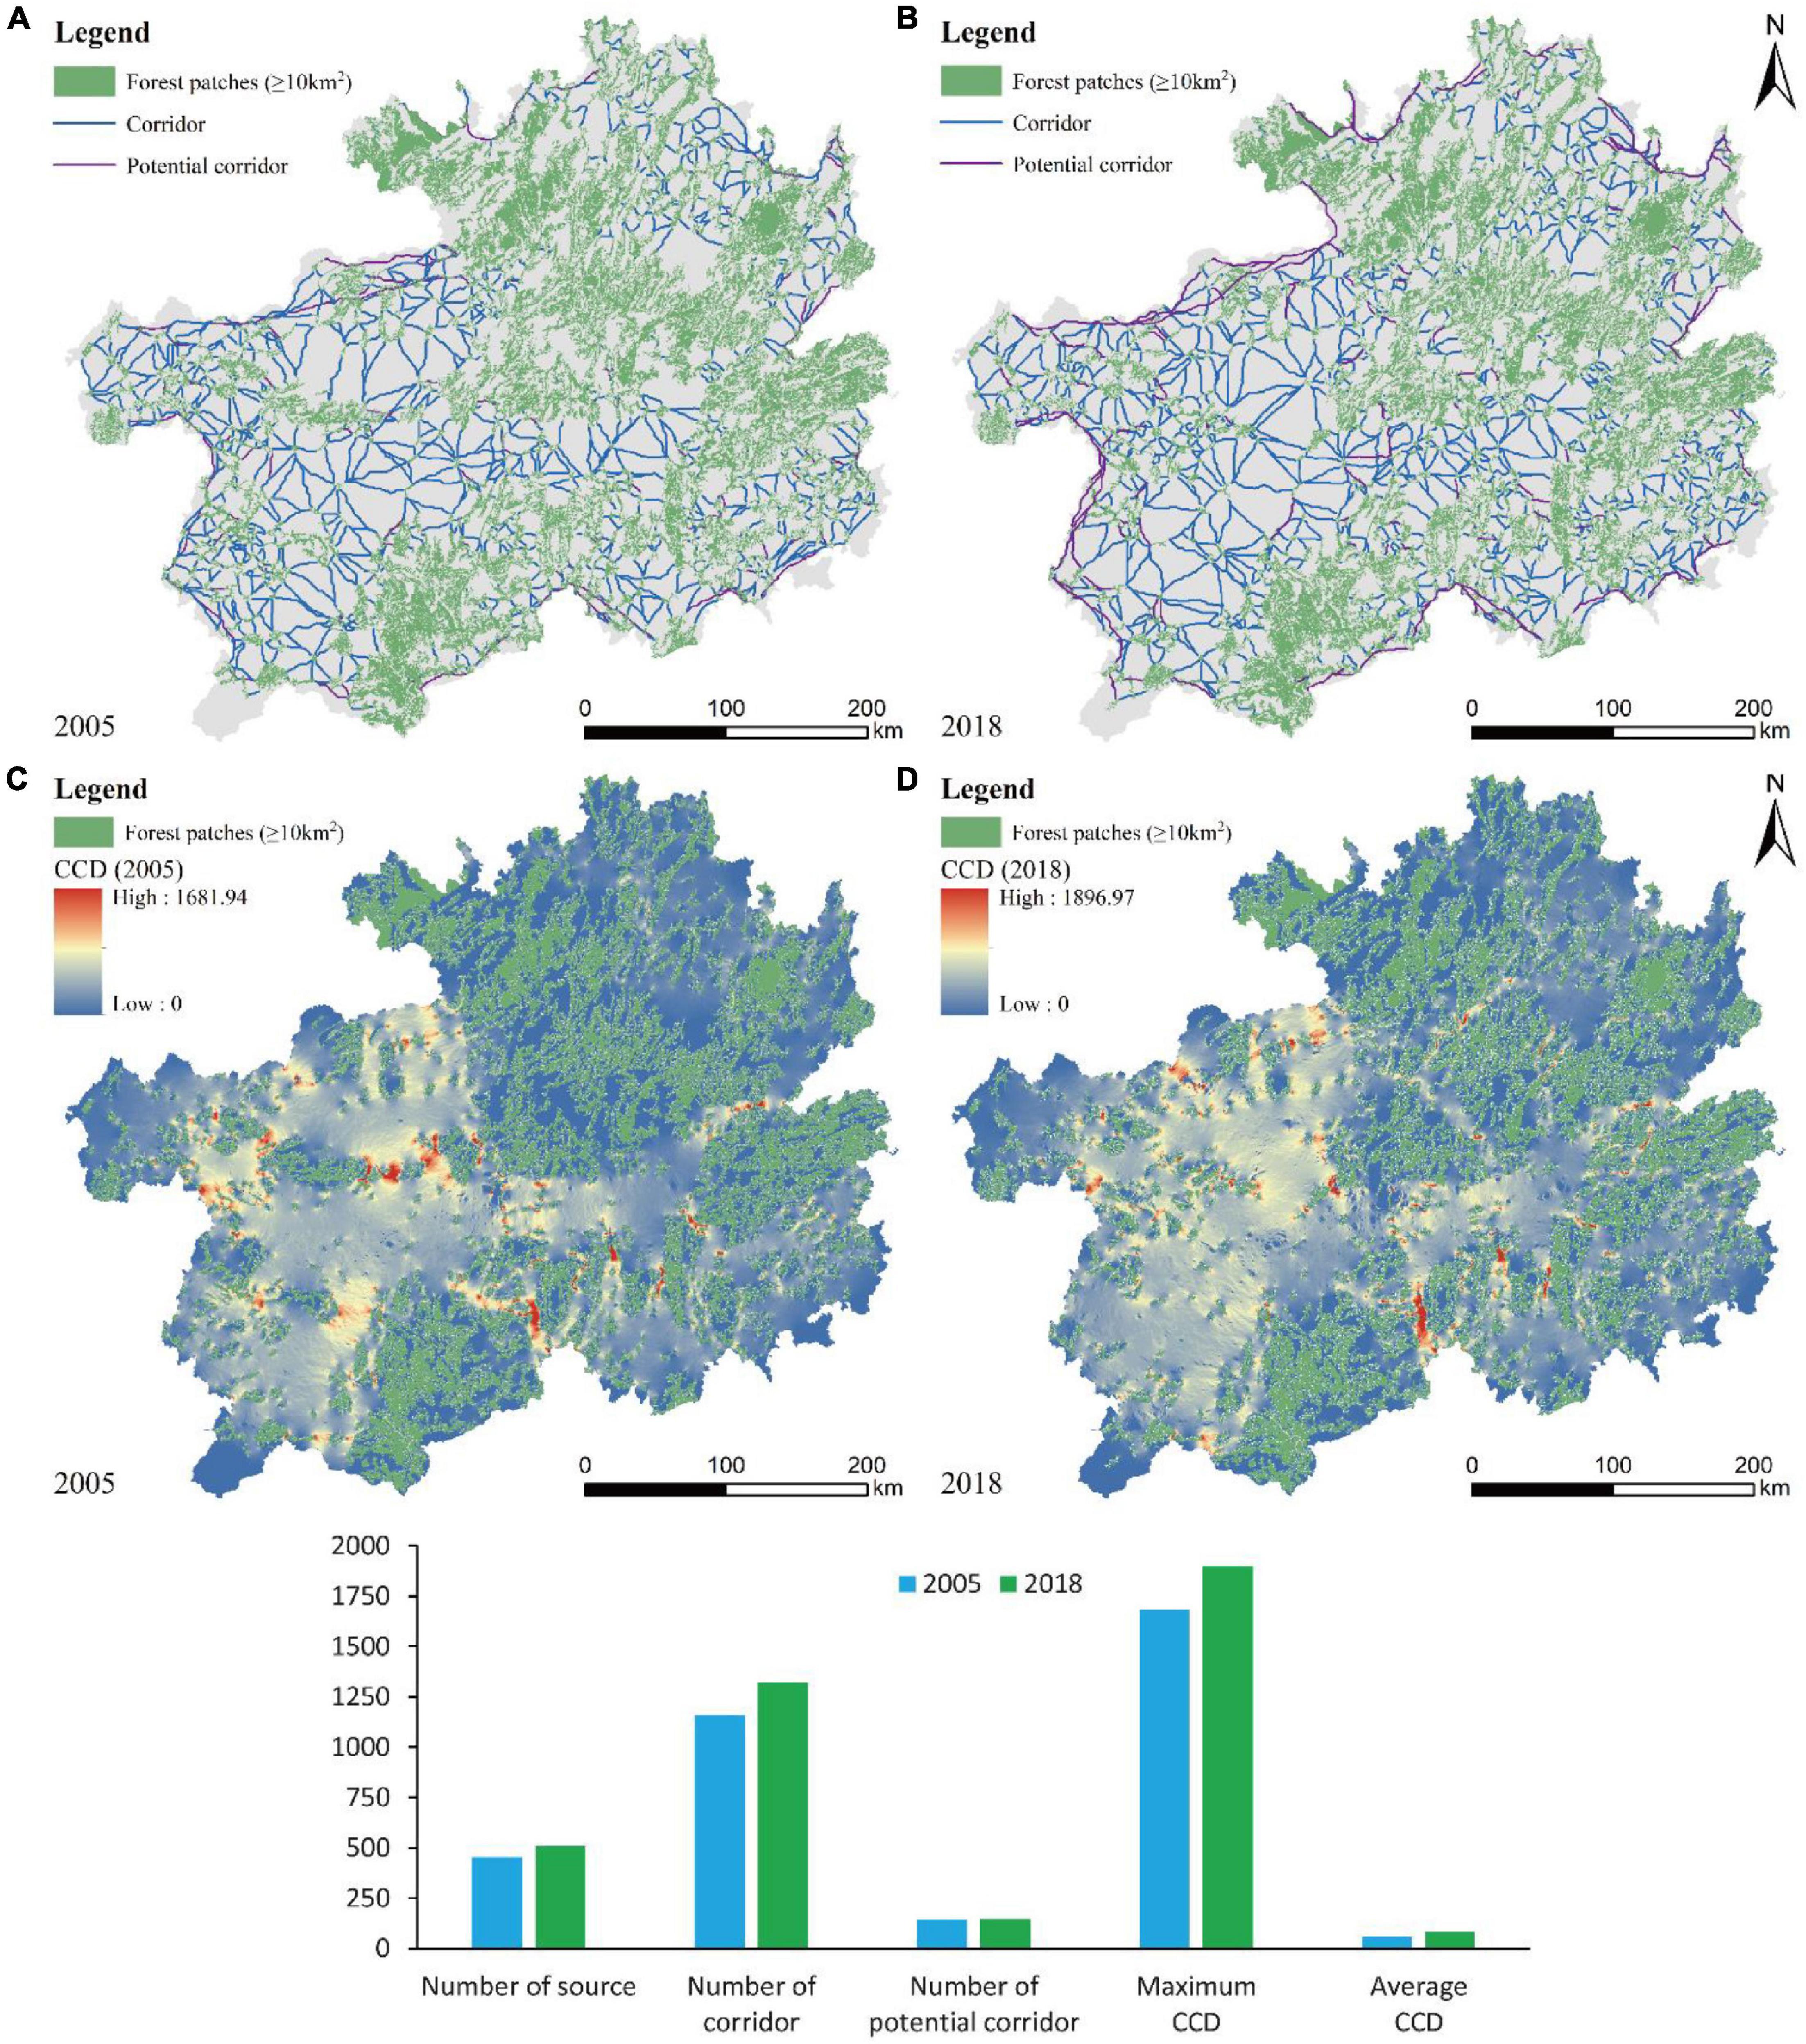
Figure 5. (A,B) Spatial distributions of ecological sources and corridors in 2005 and 2018. (C,D) Cumulative current density (CCD) maps for 2005 and 2018.
The Variation in Trends of Vegetation Coverage
Integration of the Theil-Sen Median trend analysis and the MK trend test reflects variations in the vegetation trends of Guizhou Province. Regions with SNDVI = 0 do not exist. Therefore, we created the categories according to real SNDVI conditions. Areas with SNDVI in the range of −0.0005 to 0.0005 were rated as stable. Areas with SNDVI ≥ 0.0005 were rated as improved. Areas with SNDVI < 0.0005 were rated as degraded. The results of the MK trend test were classified as significant (Z > 1.96 or Z < −1.96) or insignificant (−1.96 ≤ Z ≤ 1.96) variations and categorized into five grades (Table 2).
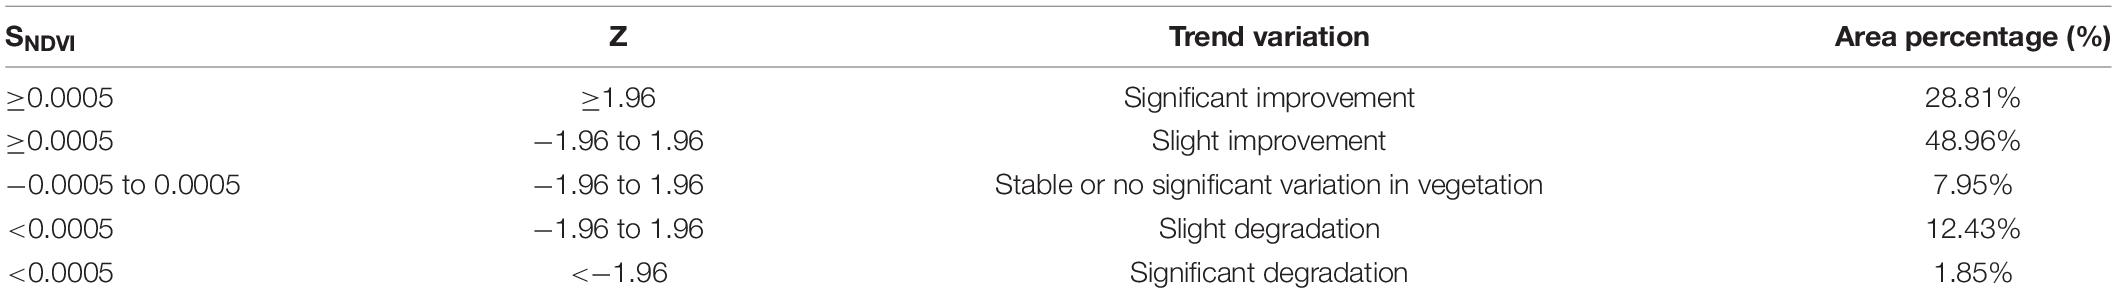
Table 2. Normalized difference vegetation index (NDVI) trend variations in Guizhou Province.
Overall, the NDVI improved; however, greening and degradation may have occurred in different areas. Regions with improved vegetation far exceeded degraded ones in Guizhou Province between 2005 and 2018 (Figure 6). Regions with significantly improved vegetation coverage were located primarily in Northwestern and Southwestern Guizhou Province. Regions with slightly improved vegetation coverage showed a dispersive distribution. Regions with stable or slightly degraded vegetation coverage were distributed mostly in Central and Eastern Guizhou Province. Regions with severe degradation were distributed mainly in Guiyang City, Xingyi City, Zunyi City, and Kaili City.
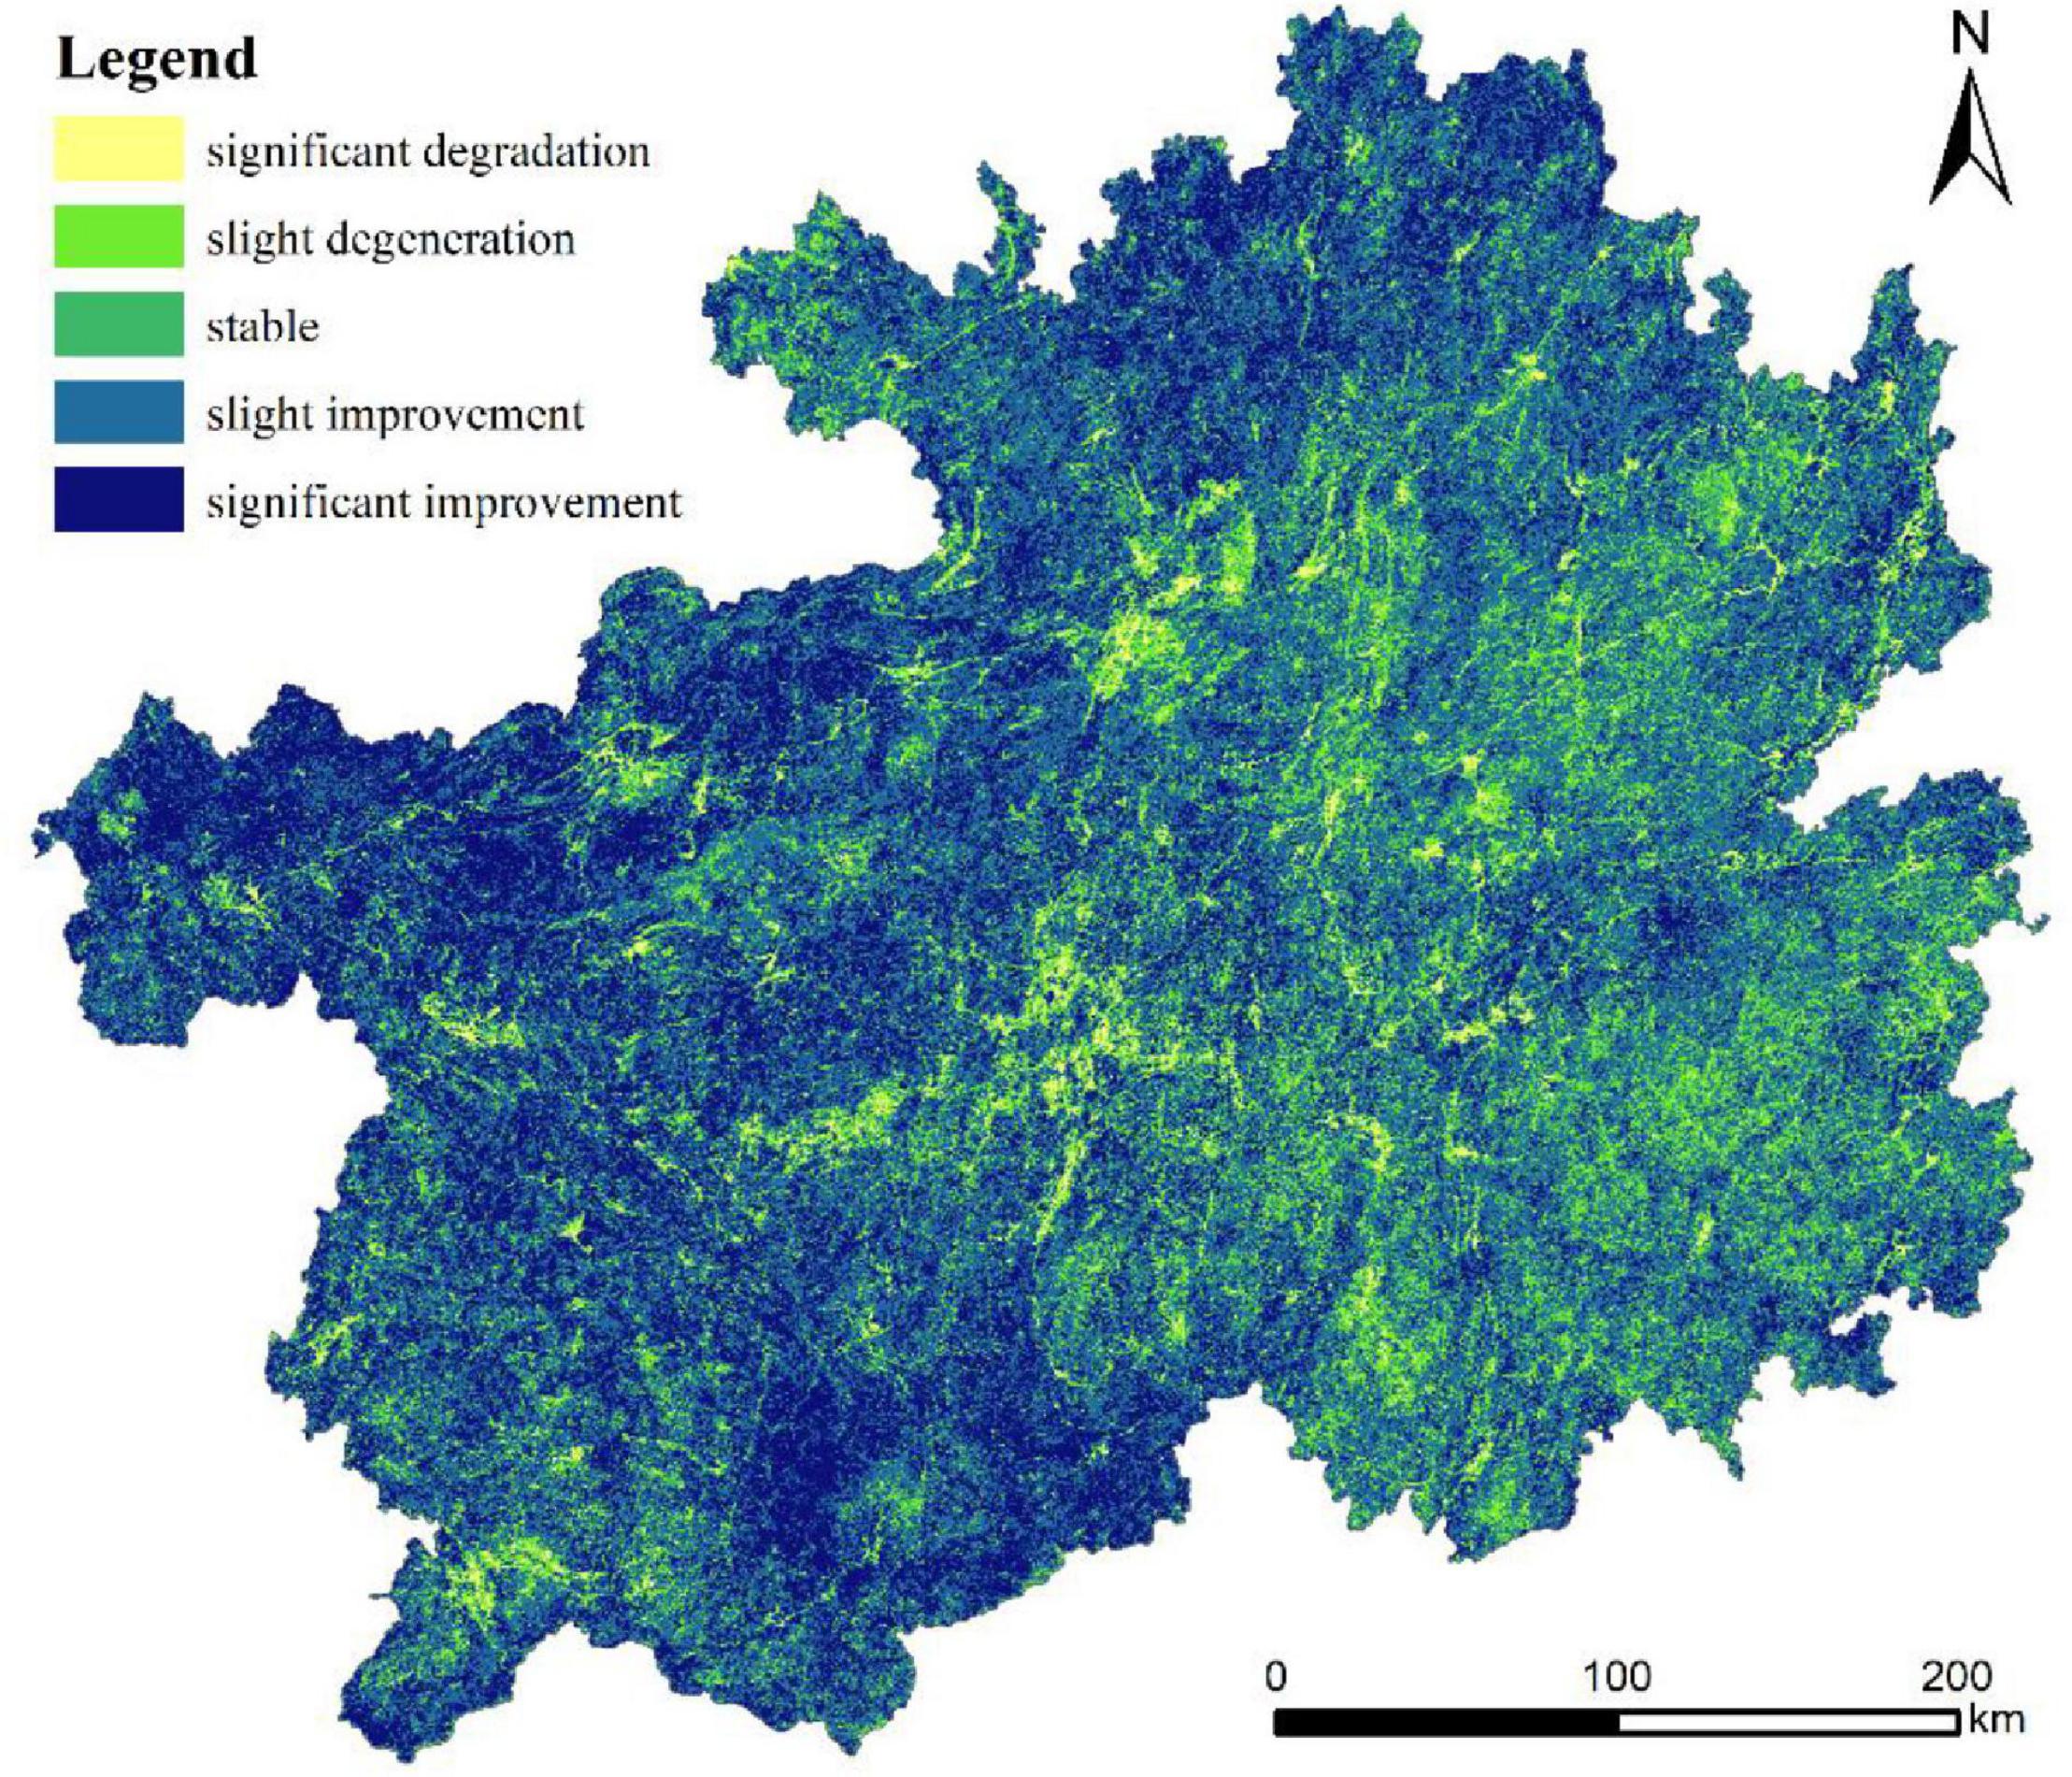
Figure 6. Spatial SNDVI distribution in Guizhou Province between 2005 and 2018.
Coupling Analysis of Landscape Connectivity and Normalized Difference Vegetation Index
Landscape structure influences the representation of landscape function. Coupling analysis identifies the relationship between landscape connectivity and NDVI at the statistical level and reflects regional ecological security. According to the result of the division of karst landform counties, we then explored the correlations between the average CCD values and the NDVI in the various karst counties in 2005 and 2018. Figure 7 shows that in general, the average CCD values increased especially for counties with higher proportions of karst areas. Their average CCD were relatively low in 2005 and had significantly increased by 2018. In 2018, the NDVI for most counties had gradually improved relative to those of 2005. Hence, the ecological environment was sustainably developed. Certain counties with higher proportions of karst landforms were not conducive to the growth or restoration of vegetation because of high levels of urbanization or high proportions of carbonate rocks. Hence, their average CCD and NDVI had declined over time.

Figure 7. Correlation analysis of average cumulative current density (CCD) and normalized difference vegetation index (NDVI) in counties with different geomorphic forms.
The trend of the eight fitting lines for 2005 and 2018 demonstrated inconsistent correlations between the average CCD and the NDVI of the counties with different geomorphologies. The average CCD and the NDVI were positively correlated for the counties with non-karst landforms and those with interlaced karst and non-karst landforms. For the counties with lower proportions of karst landforms, the average CCD was negatively correlated with the NDVI in 2005 and 2018, but negative correlation alleviated in 2018. For the counties with higher proportions of karst landforms, the average CCD and the NDVI were negatively correlated in 2005 but positively correlated in 2018. The rocky desertification projects improved the landscape connectivity and positively changed the NDVI in areas with widespread karst landforms.
Effects of Influencing Factors on Trends in Normalized Difference Vegetation Index Change
We described the statistical correlation between landscape connectivity and the NDVI. We also used metrology and a regression model to quantify the impact of this association. We selected the corresponding control variables, used SNDVI as the dependent variable, and applied the factor detector to calculate the q-value for each factor on SNDVI between 2005 and 2018. Seventy-five percent of the q-values were statistically significant at the 1% level (Table 3). The order of the q-values corresponding to each factor was: X5 > X3 > X6 > X4 > X1 > X2 > X7 > X8 > X12 > X11 > X10 > X9. Non-climatic factors are the main reasons for the observed general improvements in the vegetation of Guizhou Province. Urbanization growth rate, rate of change in GDP per capita, and population density all affect vegetation change in Guizhou Province to varying degrees. Urbanization promotes the adjustment of rural industrial structure, and a huge number of rural labor forces choose to work in non-agricultural industries, which increases per capita income and land utility intensive level. According to the 2019 Statistical Yearbook, the population in rural areas of Guizhou province decreased by 30.74% from 2005 to 2018, indicating the phenomenon of population outflow and significant reduction of human disturbance on rural land, which is beneficial to vegetation restoration. The reconstruction, restoration and protection of vegetation not only change the composition of landscape types, but also strongly affect the landscape structure. Closing hillsides to facilitate afforestation reduces anthropogenic disturbance of vegetation, and artificial afforestation also accelerates forest growth. The ecological benefits brought by ecological restoration projects are being reflected. Moreover, the relief degree of land surface and the proportion of carbonate rocks also influence variations in vegetation. Thus, ecological construction must be conducted based on local conditions to restore vegetation. The rates of change in average CCD and bridge also affected the change in the NDVI, which proved that the improvement of landscape connectivity also had a certain effect on vegetation change. The improvement of the connectivity of the landscape pattern is conducive to the improvement of the ecological function of the vegetation and the promotion of the ecological process.
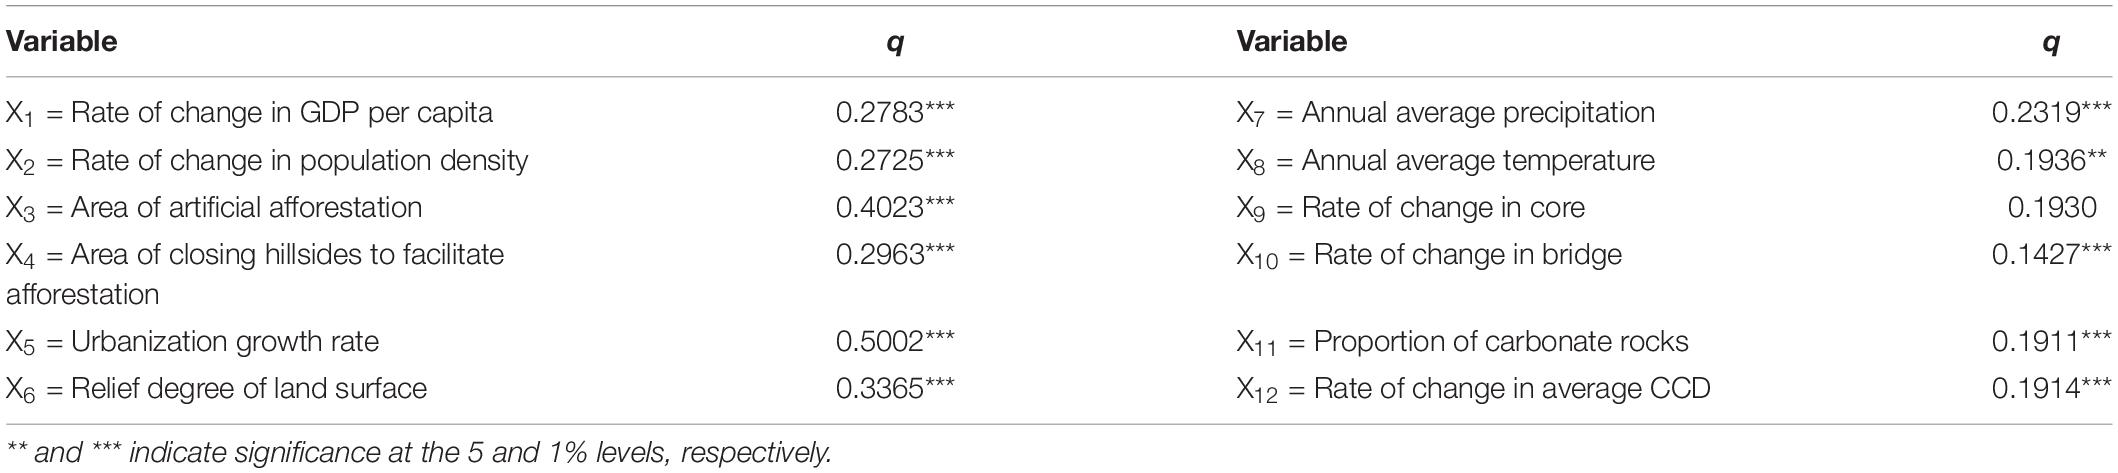
Table 3. Factors influencing the q-value for the normalized difference vegetation index (NDVI) trend in Guizhou, 2005–2018.
Twelve factors and 33 of their interactions were evaluated using the interaction detector. Table 4 shows that each factor had a different interactive effect. All interactions contributed bivariate or non-linear enhancement. Therefore, SNDVI was the product of synergy among multiple factors. The interactions adding the highest q-values to SNDVI were [urbanization growth rate ∩ annual average temperature] (q = 0.7477) and [urbanization growth rate ∩ annual average precipitation] (q = 0.7176). It indicates that the influence of temperature and precipitation on vegetation change will be enhanced in areas with high urbanization growth rate. Urbanization migrated the population to cities and towns and significantly altered vegetation which, in turn, reduced human activity, mitigated forest damage, and increased land abandonment in rural areas. Moreover, we found that the interactions between landscape connectivity (X10 and X12) and other factors enhanced the variation in vegetation.
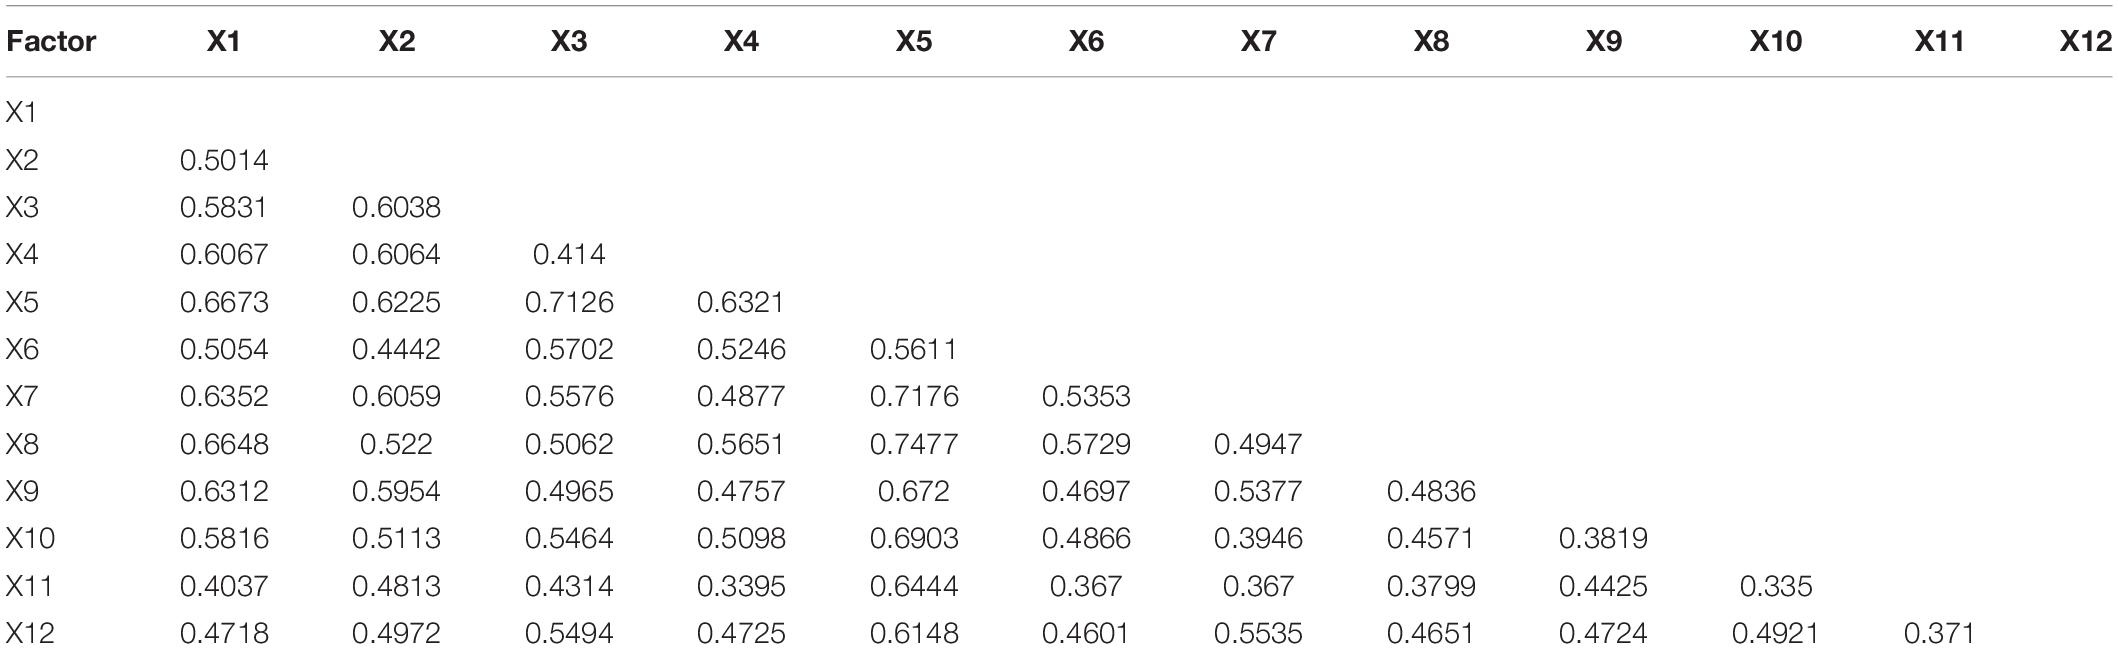
Table 4. Effects of interactions among influencing factors on SNDVI in Guizhou Province, 2005–2018.
Discussion
The core and forestland areas of Guizhou Province have decreased in response to natural factors and human activity. Moreover, landscape connectivity and the trends of vegetation coverage have also been markedly altered in Guizhou Province. Significant ecological sources and corridors have increased and overall landscape connectivity has improved. The area of vegetation significantly improved was much larger than that of vegetation degradation. Current studies have analyzed regional changes in vegetation by regarding natural and human factors. Nevertheless, they did not consider the impact of changes in landscape structure on ecological function and process. In this paper, rate of change in bridge representing structural connectivity and rate of change in average CCD representing functional connectivity are introduced into vegetation change analysis. According to the result of factor detector, although these two factors are not the dominant factors affecting vegetation change, their impact on landscape change is still significant. Circuit theory models simulate migration and diffusion in the biological flow within ecosystems, which use the random walking characteristic of electrons in a circuit. Species diffusion and migration may be predicted based on the current strength between source areas. Landscape elements and pinch points that strongly influence landscape connectivity may be effectively identified. MSPA and circuit theory model need only small amount of data required for calculation and the simple process, and integrate structural connectivity and functional connectivity between ecological source areas. This paper meets the needs of multi-species migration and is more consistent with the real situation of species movement. It provides a new method for quantitative identification of key areas in ecological networks and can provide scientific basis for ecological protection planning in karst area. However, landscape connectivity strongly depends on the scale characteristics of the research object. The ecological process and function of landscape spatial structure characteristics at different scales are different, and landscape connectivity varies greatly. Therefore, multi-scale studies on landscape connectivity need to be further explored, and more attention should be paid to the effect of landscape pattern on vegetation change.
In this study, we considered the positive impact of human activity and improvements in landscape connectivity on changes in vegetation. However, we ignored the significant degradation of the vegetation in certain areas. The impact of ecological engineering implementation on landscape connectivity and ecosystem processes and functions is complex. Large-scale afforestation may increase vegetation transpiration, consume more water, and reduce vegetation coverage in the afforestation area. Most artificially planted species are not indigenous and grow rapidly. Hence, they simplify the community structure, have a negative effect on biodiversity, and may interrupt or even reverse ecological succession. Afforestation reduces the incident light below the canopy, thereby attenuating photosynthesis in the understory plants. Changes in ecosystem types caused by urbanization, drought, and illegal logging and overgrazing may also lead to poor vegetation growth. At the same time, the National Forestry and Grassland Administration’s Bulletin on the Status of Rocky Desertification in 2018 also indicated that local rocky desertification land is still expanding, causing vegetation degradation in some areas, and the prevention and control situation is grim. Environmental engineering must consider the original landscape structure and landscape connectivity improvement to produce beneficial ecological and economic results. As the karst ecological environment is fragile, forest, shrub, and grass collocation must be regarded as well. In the future research, we should evaluate the vegetation restoration situation in karst areas more comprehensively, and deeply explore the positive and negative effects of ecological restoration projects on regional vegetation changes.
A geographical detector accurately identifies the relationships and interactions among multiple factors and is widely used to analyze driving force mechanisms. We explored the changes in vegetation cover in response to the natural environment, human activity, and changes in landscape structure at the county scale. The change in vegetation cover was influenced mainly by anthropogenic factors. The urbanization growth rate strongly interacted with the annual mean precipitation and temperature. Urbanization has concentrated people in cities and towns. Reduced human activity in rural areas has decreased deforestation and/or increased land abandonment. Thus, an increase in urbanization can reinforce interactions among factors. Interactions among landscape connectivity and other factors also significantly increased the variation in vegetation. The geographical detector model is affected by a modifiable areal unit problem when it is used to analyze the factors influencing variation in vegetation including the scale and zoning effects. The number of layers also affects the results. Here, we selected several unsupervised classification discretization methods and quantities using the “optidisc” function in the GD package of R. We made comparisons to choose the optimal combinations of discretization methods to avoid the subjectivity of artificial classification. However, the influences of number and stratification method on the results remain to be established.
Conclusion
The MSPA indicated that the degree of fragmentation was still high for each element. However, the proportion of each element did not markedly change. Several cities with a high level of urbanization, their morphological spatial pattern changed significantly. By contrast, the other regions remained relatively stable. Ecological resistance was reduced in certain areas which led to improvements in the ecological resistance surface of biological migration, the path and quantity of ecological corridors, and landscape connectivity. The structure of the ecological networks steadily improved because the number of ecological sources and ecological corridors were both increased. Identification of the ecological networks enhanced the function of the ecological barriers and provided guidance for future ecological protection and restoration programs in Guizhou Province.
The areas with improved vegetation coverage were substantially larger than the degraded areas in Guizhou Province in 2005–2018. The improved and degraded areas accounted for 77.77 and 14.28% of the total area, respectively. The remaining 7.95% was stable. We divided the 88 counties into four categories based on their karst landforms. Most of them were counties with higher proportions of karst landforms. A coupling analysis of the average CCD and the NDVI showed that they were generally higher in 2018 than 2005 for most counties. Nevertheless, the growing demands for economic development and the limitations of the karst environment lowered the average CCD and the NDVI for several counties with higher proportions of karst landforms. The average CCD and the NDVI were positively correlated for counties with non-karst and interlaced karst and non-karst landforms. In 2005, the average CCD and the NDVI were strongly negatively correlated for counties with lower proportions of karst landforms. By 2018, however, the average CCD and the NDVI were only weakly negatively correlated for these counties. For counties with higher proportions of karst landforms, the average CCD and the NDVI were negatively correlated in 2005 but positively correlated in 2018. It can be concluded that ecological restoration projects have a more obvious impact on counties with higher proportions of karst landforms. The rocky desertification problem and landscape connectivity have been improved.
Natural and socioeconomic factors as well as improvement in landscape connectivity significantly influenced the change in the NDVI. The interactive detector revealed that [urbanization growth rate ∩ annual average temperature] and [urbanization growth rate ∩ annual average precipitation] jointly drove the variation in vegetation in Guizhou Province. Therefore, the urbanized area is more likely to enhance the effects of temperature and precipitation than the rural area because the latter has a smaller population. In addition, interactions among landscape connectivity and other factors significantly enhance the spatial variations in vegetation. Thus, changes in landscape pattern play crucial roles in the restoration of vegetation in this region. Future research should investigate the coordinated development of urbanization and ecological restoration within the karst region.
Data Availability Statement
The datasets presented in this study can be found in online repositories. The names of the repository/repositories and accession number(s) can be found in the article.
Author Contributions
KH and LP performed the material preparation and data collection and analysis. KH wrote the first draft of the manuscript. All authors commented on previous versions of the manuscript, contributed to the study conception and design, read, and approved the final manuscript.
Funding
The research was supported by the National Natural Science Foundation of China (No. 42001090), the Guangxi Natural Science Foundation Program (No. 2020GXNSFDA238012), and the National Key Basic Research Program of China (973 Program) (No. 2015CB452706).
Conflict of Interest
The authors declare that the research was conducted in the absence of any commercial or financial relationships that could be construed as a potential conflict of interest.
Publisher’s Note
All claims expressed in this article are solely those of the authors and do not necessarily represent those of their affiliated organizations, or those of the publisher, the editors and the reviewers. Any product that may be evaluated in this article, or claim that may be made by its manufacturer, is not guaranteed or endorsed by the publisher.
Acknowledgments
We would like to thank Editage (www.editage.cn) for English language editing.
Footnotes
- ^ http://www.resdc.cn/
- ^ http://data.cma.cn/
- ^ https://www.usgs.gov/
- ^ https://modis-land.gsfc.nasa.gov/tools.html
- ^ https://navi.cnki.net/knavi/yearbooks/YGFDS/detail?uniplatform=NZKPT
- ^ https://navi.cnki.net/knavi/yearbooks/YGUIZ/detail
- ^ https://forest.jrc.ec.europa.eu/en/activities/lpa/gtb/
- ^ https://circuitscape.org/downloads/
- ^ https://linkagemapper.org
References
An, Y., Liu, S., Sun, Y., Shi, F., and Beazley, R. (2021). Construction and optimization of an ecological network based on morphological spatial pattern analysis and circuit theory. Landsc. Ecol. 36, 2059–2076.
Beaujean, S., Nor, A. N. M., Brewer, T., Zamorano, J. G., Dumitriu, A. C., Harris, J., et al. (2021). A multistep approach to improving connectivity and co-use of spatial ecological networks in cities. Landsc. Ecol. 36, 2077–2093. doi: 10.1007/s10980-020-01159-6
Cai, H., Yang, X., Wang, K., and Xiao, L. (2014). Is forest restoration in the southwest China Karst promoted mainly by climate change or human-induced factors? Remote Sen. 6, 9895–9910. doi: 10.3390/rs6109895
Carlier, J., and Moran, J. (2019). Landscape typology and ecological connectivity assessment to inform Greenway design. Sci. Total Environ. 651, 3241–3252. doi: 10.1016/j.scitotenv.2018.10.077
Ciudad, C., Mateo-Sánchez, M. C., Gastón, A., Blazquez-Cabrera, S., and Saura, S. (2021). Landscape connectivity estimates are affected by spatial resolution, habitat seasonality and population trends. Biodivers. Conserv. 30, 1395–1413.
Cushman, S., Mcrae, B., Adriaensen, F., Beier, P., Shirley, M., and Zeller, K. (2013). Key Topics in Conservation Biology 2. Hoboken, NJ: Wiley-Blackwell.
Dai, L., Liu, Y., and Luo, X. (2021). Integrating the MCR and DOI models to construct an ecological security network for the urban agglomeration around Poyang Lake, China. Sci. Total Environ. 754:141868. doi: 10.1016/j.scitotenv.2020.141868
Dondina, O., Saura, S., Bani, L., and Mateo-Sánchez, M. C. (2018). Enhancing connectivity in agroecosystems: focus on the best existing corridors or on new pathways? Landsc. Ecol. 33, 1741–1756. doi: 10.1007/s10980-018-0698-9
Fan, F., Liu, Y., Chen, J., and Dong, J. (2021). Scenario-based ecological security patterns to indicate landscape sustainability: a case study on the Qinghai-Tibet Plateau. Landsc. Ecol. 36, 2175–2188. doi: 10.1007/s10980-020-01044-2
Fensholt, R., Langanke, T., Rasmussen, K., Reenberg, A., Prince, S. D., Tucker, C., et al. (2012). Greenness in semi-arid areas across the globe 1981–2007–an earth observing satellite based analysis of trends and drivers. Remote Sens. Environ. 121, 144–158.
Fensholt, R., and Proud, S. R. (2012). Evaluation of earth observation based global long term vegetation trends–comparing GIMMS and MODIS global NDVI time series. Remote Sens. Environ. 119, 131–147. doi: 10.1016/j.rse.2011.12.015
Feyissa, G., and Gebremariam, E. (2018). Mapping of landscape structure and forest cover change detection in the mountain chains around Addis Ababa: the case of Wechecha Mountain, Ethiopia. Remote Sens. Appl. Soc. Environ. 11, 254–264. doi: 10.1016/j.rsase.2018.07.008
Forman, R., and Wilson, E. (1995). Land Mosaics: The Ecology of Landscapes and Regions. Cambridge: Cambridge University Press.
Gao, F., Li, S., Tan, Z., Wu, Z., Zhang, X., Huang, G., et al. (2021). Understanding the modifiable areal unit problem in dockless bike sharing usage and exploring the interactive effects of built environment factors. Int. J. Geogr. Inf. Sci. 35, 1905–1925. doi: 10.1080/13658816.2020.1863410
Gao, J., Du, F., Zuo, L., and Jiang, Y. (2021). Integrating ecosystem services and rocky desertification into identification of karst ecological security pattern. Landsc. Ecol. 36, 2113–2133. doi: 10.1007/s10980-020-01100-x
Haider, J. A., Höbart, R., Kovacs, N., Milchram, M., Dullinger, S., Huber, W., et al. (2016). The role of habitat, landscape structure and residence time on plant species invasions in a neotropical landscape. J. Trop. Ecol. 32, 240–249. doi: 10.1017/s0266467416000158
Healy, M., Hoaglin, D., Mosteller, F., and Tukey, J. (1983). Understanding robust and exploratory data analysis. Biometrics 39:1126.
Huang, Q., Li, M., Chen, C., Mao, K., Chen, Z., Li, F., et al. (2010). “Assessment of land degradation in Guizhou Province, Southwest China using AVHRR/NDVI and MODIS/NDVI data,” in Proceedings of the 2010 18th International Conference on Geoinformatics (Beijing: Peking University).
Jiang, W., Yuan, L., Wang, W., Cao, R., Zhang, Y., and Shen, W. (2015). Spatio-temporal analysis of vegetation variation in the Yellow River Basin. Ecol. Indic. 51, 117–126. doi: 10.1016/j.ecolind.2014.07.031
Lagomasino, D., Price, R. M., Whitman, D., Melesse, A., and Oberbauer, S. F. (2015). Spatial and temporal variability in spectral-based surface energy evapotranspiration measured from Landsat 5TM across two mangrove ecotones. Agricult. For. Meteorol. 213, 304–316. doi: 10.1016/j.agrformet.2014.11.017
LeGrand, H. E. (1973). Hydrological and ecological problems of Karst regions. Science 179, 859–864. doi: 10.1126/science.179.4076.859
Liao, C., Yue, Y., Wang, K., Fensholt, R., Tong, X., and Brandt, M. (2018). Ecological restoration enhances ecosystem health in the karst regions of southwest China. Ecol. Indic. 90, 416–425. doi: 10.1016/j.ecolind.2018.03.036
Lin, J. (2001). The distributed area and the features analysis of karst and non karst landscape in Guizhou. J. Guizhou Educ. Coll. 12, 43–46.
McRae, B. H., Dickson, B. G., Keitt, T. H., and Shah, V. B. (2008). Using circuit theory to model connectivity in ecology, evolution, and conservation. Ecology 89, 2712–2724. doi: 10.1890/07-1861.1
Pausas, J. G. (2003). The effect of landscape pattern on Mediterranean vegetation dynamics: a modelling approach using functional types. J. Veget. Sci. 14, 365–374. doi: 10.1111/j.1654-1103.2003.tb02162.x
Peng, J., Jiang, H., Liu, Q., Green, S. M., Quine, T. A., Liu, H., et al. (2021). Human activity vs. climate change: distinguishing dominant drivers on LAI dynamics in karst region of southwest China. Sci. Total Environ. 769:144297. doi: 10.1016/j.scitotenv.2020.144297
Peng, J., Yang, Y., Liu, Y., Hu, Y. N., Du, Y., Meersmans, J., et al. (2018). Linking ecosystem services and circuit theory to identify ecological security patterns. Sci. Total Environ. 644, 781–790. doi: 10.1016/j.scitotenv.2018.06.292
Salgueiro, P. A., Valerio, F., Silva, C., Mira, A., Rabaça, J. E., and Santos, S. M. (2021). Multispecies landscape functional connectivity enhances local bird species’ diversity in a highly fragmented landscape. J. Environ. Manag. 284:112066. doi: 10.1016/j.jenvman.2021.112066
Soille, P., and Vogt, P. (2009). Morphological segmentation of binary patterns. Pattern Recogn. Lett. 30, 456–459.
Taylor, P., Fahrig, L., Henein, K., and Merriam, G. (1993). Connectivity is a vital element of landscape structure. Oikos 68:571. doi: 10.1093/database/bav010
Taylor, P., Fahrig, L., and With, K. (2006). Landscape Connectivity: A Return to the Basics. Cambridge: Cambridge University Press, 29–43.
Tian, Y., Bai, X., Wang, S., Qin, L., and Li, Y. (2017). Spatial-temporal changes of vegetation cover in Guizhou Province, Southern China. Chin. Geogr. Sci. 27, 25–38. doi: 10.1007/s11769-017-0844-3
Tischendorf, L., and Fahrig, L. (2000). On the usage and measurement of landscape connectivity. Oikos 90, 7–19. doi: 10.1034/j.1600-0706.2000.900102.x
Uroy, L., Ernoult, A., and Mony, C. (2019). Effect of landscape connectivity on plant communities: a review of response patterns. Landsc. Ecol. 34, 203–225. doi: 10.3390/ijerph16214241
Wang, J. F., Li, X. H., Christakos, G., Liao, Y. L., Zhang, T., Gu, X., et al. (2010). Geographical detectors-based health risk assessment and its application in the neural tube defects study of the Heshun region, China. Int. J. Geogr. Inf. Sci. 24, 107–127. doi: 10.1080/13658810802443457
Wang, J.-F., Zhang, T.-L., and Fu, B.-J. (2016). A measure of spatial stratified heterogeneity. Ecol. Indic. 67, 250–256. doi: 10.1016/j.ecolind.2016.02.052
Wang, Y., Wang, S., Li, G., Zhang, H., Jin, L., Su, Y., et al. (2017). Identifying the determinants of housing prices in China using spatial regression and the geographical detector technique. Appl. Geogr. 79, 26–36. doi: 10.1016/j.apgeog.2016.12.003
Williams, M. A., and Baker, W. L. (2012). Spatially extensive reconstructions show variable-severity fire and heterogeneous structure in historical western United States dry forests. Glob. Ecol. Biogeogr. 21, 1042–1052. doi: 10.1111/j.1466-8238.2011.00750.x
Zhang, X., Liao, C., Li, J., and Sun, Q. (2013). Fractional vegetation cover estimation in arid and semi-arid environments using HJ-1 satellite hyperspectral data. Int. J. Appl. Earth Observ. Geoinform. 21, 506–512.
Keywords: circuit theory, ecological network, geographical detector, Guizhou Province, landscape connectivity, karst vegetation restoration
Citation: Huang K, Peng L, Wang X and Chen T (2022) Integrating Landscape Connectivity and Natural-Anthropogenic Interaction to Understand Karst Vegetation Restoration: A Case Study of Guizhou Province, China. Front. Ecol. Evol. 10:844437. doi: 10.3389/fevo.2022.844437
Received: 28 December 2021; Accepted: 31 January 2022;
Published: 11 March 2022.
Edited by:
Jinyan Zhan, Beijing Normal University, ChinaReviewed by:
Qiuwen Zhou, Guizhou Normal University, ChinaMiaomiao Xie, China University of Geosciences, China
Copyright © 2022 Huang, Peng, Wang and Chen. This is an open-access article distributed under the terms of the Creative Commons Attribution License (CC BY). The use, distribution or reproduction in other forums is permitted, provided the original author(s) and the copyright owner(s) are credited and that the original publication in this journal is cited, in accordance with accepted academic practice. No use, distribution or reproduction is permitted which does not comply with these terms.
*Correspondence: Li Peng, cGVuZ2xpQGltZGUuYWMuY24=