 Nathan J. Robinson1,2†
 Joseph B. Pfaller3,4*†
- 1Fundación Oceanogràfic, Ciudad de las Artes y las Ciencias, Valencia, Spain
- 2Institut de Ciències del Mar, Spanish National Research Council (CSIC), Barcelona, Spain
- 3Caretta Research Project, Savannah, GA, United States
- 4Archie Carr Center for Sea Turtle Research, Department of Biology, University of Florida, Gainesville, FL, United States
Competition for space drives many marine propagules to colonize the external surfaces of other marine organisms, a phenomenon known as epibiosis. Epibiosis appears to be a universal phenomenon among sea turtles and an extensive body of scientific literature exists describing sea turtle-epibiont interactions. When viewed in isolation, however, these epibiont “species lists” provide limited insights into the factors driving patterns in taxonomic diversity on a global scale. We conducted an exhaustive literature review to collate information on sea turtle-epibiont interactions into a global database. As studies involving meio- and micro-epibionts, as well as plants, are limited, we exclusively focused on animal, macro-epibionts (>1 mm). We identified 304 studies that included a combined total of 1,717 sea turtle-epibiont interactions involving 374 unique epibiont taxa from 23 Higher Taxon categories (full Phylum or select phyla differentiated by Subphylum/Class/Subclass). We found that loggerhead turtles hosted the highest taxonomic richness (262 epibiont taxa) and diversity, including representative taxa from 21 Higher Taxon categories, followed by hawksbill, green, olive ridley, leatherback, Kemp’s ridley, and flatback turtles. In addition, the taxonomic richness for all turtle species except leatherbacks was projected to increase with additional studies. We found that taxonomic richness not only varies between species but also between well-studied populations of loggerhead turtles. Lastly, we assessed biases in the current literature and identified knowledge gaps for certain species (e.g., Kemp’s ridleys and flatbacks), life stages (e.g., juveniles), habitats (e.g., oceanic habitats), and geographic regions (e.g., central Pacific, east Atlantic, and east Indian oceans). Our hope is that this database will serve as a foundational platform for future studies investigating global patterns of the diversity, ecological function, and evolutionary origins of sea turtle epibiosis.
Introduction
Competition for space drives marine propagules to colonize almost any exposed, undefended surface in the marine environment (Harder, 2009; Wahl, 2009). While colonization frequently occurs on inanimate structures (e.g., submerged bedrock and dock pilings), the external surfaces of other marine organisms can also provide suitable substrata for settlement—resulting in a phenomenon known as epibiosis. Epibiosis involves a single host species and one or more colonizers called epibionts. Most epibionts are opportunistic organisms found “free living” in the surrounding environment, while others are obligate commensals of specific hosts. In complex and captivating cases of epibiosis, epibionts colonize the bodies of migratory marine megafauna, such as sea turtles and cetaceans, and are transported as “hitchhikers” across marine habitats and even entire ocean basins (Ingels et al., 2020).
Sea turtles are renowned for hosting diverse communities of epibionts, including representative taxa from almost every Phylum within Animalia (e.g., Frick et al., 1998; Lazo-Wasem et al., 2011; Corrêa et al., 2014). While robust, encrusting forms, such as barnacles, tend to be more common and exhibit greater diversity (Zardus, 2021), other taxonomic groups that are less resistant to abrasion and dramatic shifts in environmental conditions tend to be rarer and less diverse (e.g., Lazo-Wasem et al., 2007; Perrault et al., 2015). Because epibiosis necessitates ecological overlap between host turtles and “free living” populations of epibionts and/or their propagules, the assemblages of epibionts found on sea turtles also tend to reflect the regions and habitats where host turtles spend time (e.g., Reich et al., 2010; Pfaller et al., 2014; Ten et al., 2019). Consequently, the presence of certain epibiont species or assemblages that occupy specific regions (e.g., tropical, temperate, or polar) and/or habitats (e.g., oceanic/pelagic or neritic/benthic) can serve as indicators of the migratory movements and habitat preferences of sea turtles (Casale et al., 2004; Frick and Pfaller, 2013). Similarly, the diversity of sea turtle epibionts and the equally diverse ways they interact with their hosts, means that the presence or absence of particular epibiont taxa can also serve as indicators of the hosts’ foraging preferences (Pfaller et al., 2014), social or reproductive behavior (Domènech et al., 2017; Robinson et al., 2017a), body condition and/or health status (Lazo-Wasem et al., 2007; Nolte et al., 2020), and more.
Following a rich history of anecdotal reports dating back to Darwin (1851, 1854) and Pilsbry (1916), the epibiont communities of sea turtles have received considerable attention (Frick and Pfaller, 2013). Most of this work has focused on animal, macro-epibionts (>1 mm) as they are relatively easy to identify and sample; however, it is increasingly being realized that sea turtles also frequently host meio- and micro-epibionts as well as various plant species (Robinson et al., 2016; Ingels et al., 2020). There is now an extensive body of scientific literature describing the epibiotic diversity of sea turtle populations worldwide. However, most studies only report the species of epibionts found on a single sea turtle species at a single locality. Viewed in isolation, these “species lists” provide limited inferences for understanding the factors driving patterns in epibiont richness and diversity on a global scale (Lazo-Wasem et al., 2011; Pinou et al., 2019; Zardus, 2021). Moreover, because measures of species richness are inherently connected to sampling effort, comparisons of epibiotic diversity among turtle species and regions may be biased by variations in sample size (i.e., the number of studies or turtles surveyed) (Robinson et al., 2017b). Collating these “species lists” along with their associated metadata (e.g., host species and life stage, geographic region, habitat, etc.), while also accounting for differences in sampling effort, could therefore provide a foundation to analyze broad-scale patterns in sea turtle epibiosis. Such an effort would also help identify understudied species or regions, thereby guiding productive directions for future research.
To enact this important step in the field of sea turtle epibiosis, we conducted an exhaustive review of published scientific articles and gray literature (i.e., government reports, theses and dissertations, and conference presentations) to collate information on sea turtle-epibiont species pairs as well as their associated metadata. Because studies involving meio- or micro-epibionts, as well as plants, are limited, we exclusively focused on animal, macro-epibionts (>1 mm) (Hereafter, we use the term “epibionts” to exclusively refer to animal macro-epibionts unless stated otherwise). As an initial investigation of the information amassed in this global database, we first quantified and compared the taxonomic diversity of epibionts for each sea turtle species to answer two questions. (1) Which sea turtle species hosts the greatest epibiont diversity? (2) Does the current literature for each turtle species fully encompass the taxonomic richness of their epibiont communities? Next, we investigated similar questions among three well-studied populations of loggerhead turtles (Caretta caretta). Last, we characterized the current epibiont literature for each sea turtle species in terms of turtle life stage, habitat type, and geographic distribution to assess biases and identify knowledge gaps for future research.
Methods
Database Development
Between March 2018 and December 2020, we conducted a two-tiered literature search to compile all records of sea turtle-epibiont interactions. A structured search was conducted in Web of Science, Google Scholar, and Sea Turtle Online Bibliography (Archie Carr Center for Sea Turtle Research, University of Florida) using the following Boolean search terms: epibiont, epibiosis, epifauna, epibiota, and both common and scientific names of the seven marine turtle species: loggerhead turtle (C. caretta), green turtle (Chelonia mydas), leatherback turtle (Dermochelys coriacea), hawksbill turtle (Eretmochelys imbricata), olive ridley turtle (Lepidochelys olivacea), Kemp’s ridley turtle (Lepidochelys kempii), and flatback turtle (Natator depressus). Secondly, an unstructured literature search was conducted by reviewing the reference lists of relevant publications and reports from the structured search. We included any peer-reviewed scientific article, thesis/dissertation, conference presentation, and official report that contained information on sea turtle epibiosis. When the same data were presented in separate publications by the same author/s, we only included the data from the original source publication. We did not include references published after December 2020 (i.e., those published between the completion of our literature search and the publication of this article).
We constrained our two-tiered literature search to only include records of sea turtle-epibiont interactions from (1) turtles surveyed in the wild, (2) animal epibionts (i.e., Kingdom Animalia), and (3) macro-epibionts (>1 mm). We excluded records from turtles reared in captivity (e.g., Crespo-Picazo et al., 2017) to focus on naturally occurring instances of epibiosis. We excluded epibiotic interactions involving plants (namely algae) as very few studies have included plants and, those that have, tend to show relatively low taxonomic diversity. Lastly, we focused our review exclusively on macro-epibionts (>1 mm) even though sea turtles are known to host meio- or micro-epibionts (<1 mm) (e.g., Robinson et al., 2016; Ingels et al., 2020). This was because the collection and identification of meio- or micro-epibionts generally requires specialist equipment (e.g., light and/or scanning electron microscopes), while this is not the case for macro-epibionts.
From each applicable reference, we extracted data on all reported sea turtle-epibiont interactions according to the data parameters and descriptions listed in Table 1. If a single study included more than one host-epibiont pair (e.g., multiple epibiont taxa from one host species or multiple host species or life stages for one epibiont taxon), each specific host-epibiont pair was listed on a separate row within the database. At minimum, we recorded the host turtle species, the epibiont taxon (the lowest taxonomic level reported), the study site, and the type of survey conducted. When data were available, we also recorded the number of turtles surveyed, the life stage of the sampled turtles, the habitat where turtles were encountered, the percent frequency of occurrence per host for each epibiont taxa, the total number of recorded individuals of each epibiont taxon, the turtle body part/s on which each taxon was found, and the deposition location for collected specimens.
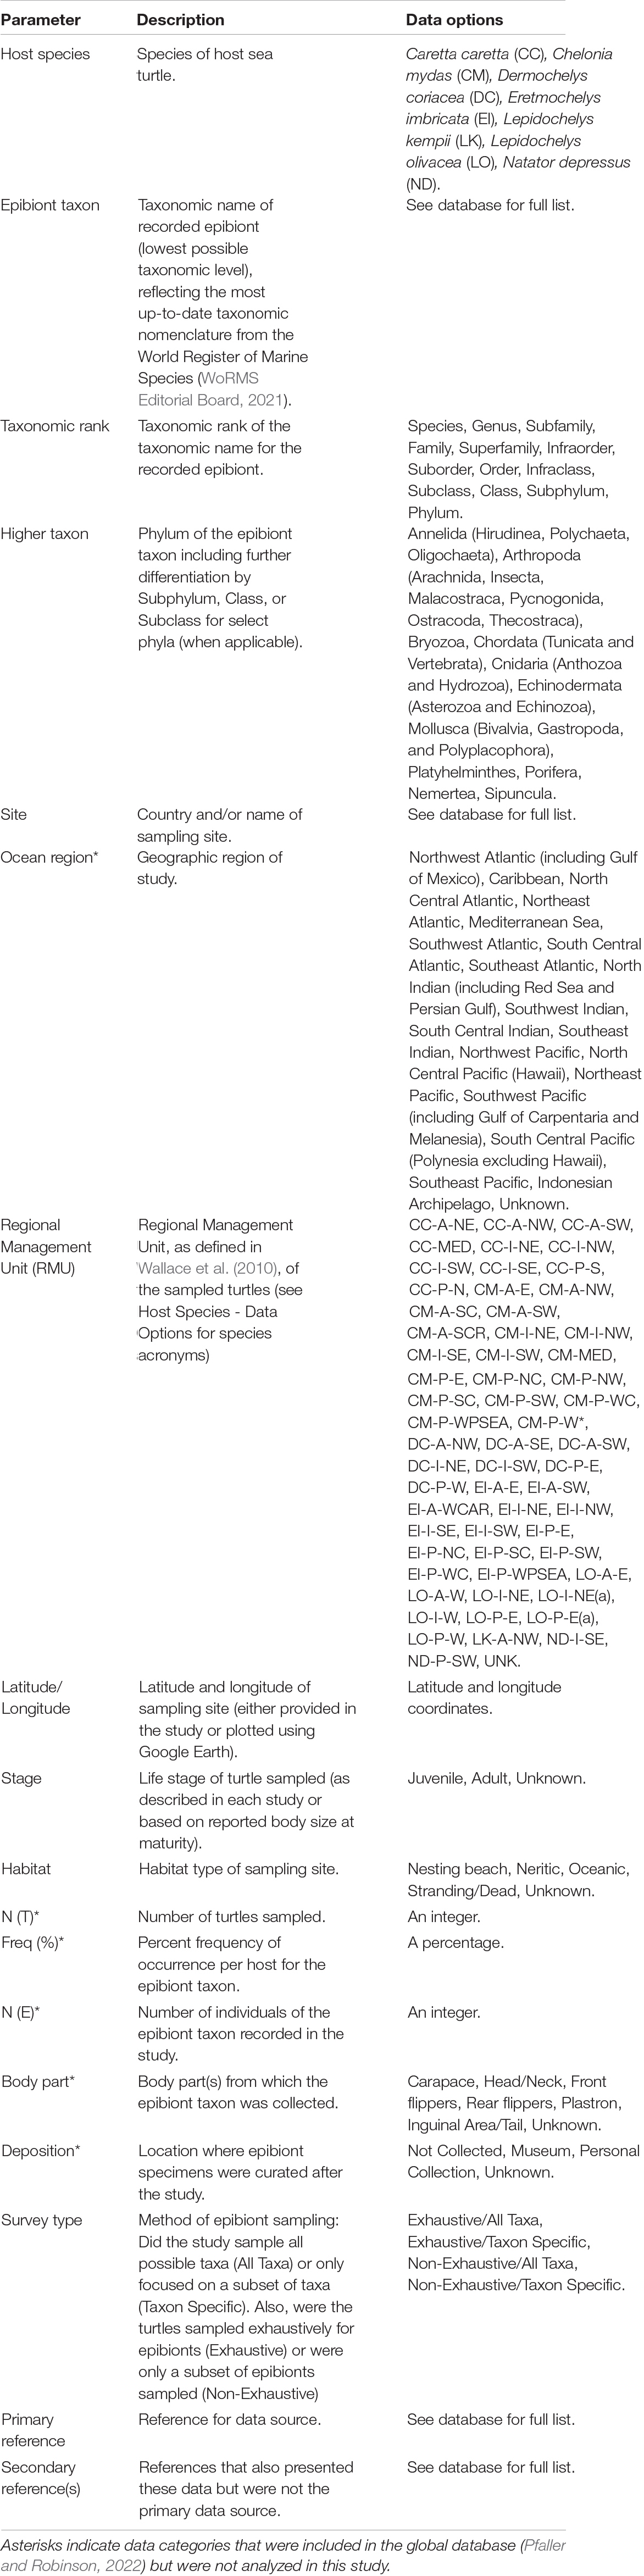
Table 1. Data parameters and descriptions extracted for each sea turtle-epibiont interaction identified during an exhaustive review of published articles and gray literature (i.e., government reports, theses and dissertations, and conference presentations), including possible data options for each category.
To extract further information on each epibiont taxon, we recorded the Higher Taxon (either full Phylum or select phyla differentiated by Subphylum/Class/Subclass) and the taxonomic rank (e.g., species, genus, family, etc.) of the taxonomic name reported in the study. Five phyla were not differentiated further: Bryozoa, Nemertea, Platyhelminthes, Porifera, and Sipuncula. However, the diversity of taxa within six phyla warranted further differentiation by either Subphylum, Class, or Subclass: Annelida (Hirudinea, Polychaeta, and Oligochaeta), Arthropoda (Arachnida, Insecta, Malacostraca, Pycnogonida, Ostracoda, and Thecostraca), Chordata (Tunicata and Vertebrata), Cnidaria (Anthozoa and Hydrozoa), Echinodermata (Asterozoa and Echinozoa), and Mollusca (Bivalvia, Gastropoda, and Polyplacophora). To ensure that we used the most up-to-date taxonomic nomenclature and rank for each epibiont taxon, we referred to the World Register of Marine Species (WoRMS Editorial Board, 2021).
To define the geographic location of each study site, we recorded the latitude and longitude (either provided in the study or plotted using Google Earth) and the ocean region that best described the study site (see Table 1 for a list of potential ocean regions). Lastly, to further characterize the sea turtle population from which epibionts were sampled for each sea turtle-epibiont interaction, we recorded the regional management unit (RMU) following designations by Wallace et al. (2010) as these are considered geographic cohorts of turtles on independent evolutionary trajectories. When a study site was within overlapping RMUs, we used the best available data (e.g., life stage and habitat) to select the most likely RMU for the surveyed turtles.
Comparing Epibiont Diversity
We collated the total number of distinct epibiont taxa documented for each turtle species and for three loggerhead RMUs (Northwest Atlantic, Mediterranean, and North Pacific). We selected these specific RMUs because each had been the focus of >15 studies. To avoid overestimating the number of taxa when studies identified epibionts to different taxonomic ranks (e.g., species versus genus level), we counted all potentially equivalent taxa as one taxon. For example, if three different studies on olive ridley turtles identified Lepas anatifera (species rank), Lepas sp. (genus rank), and Lepadidae (family rank), we combined these three taxa into one taxon and only counted them once. We therefore defined taxonomic richness as the total number of unique epibiont taxa that could not be further hierarchically combined. Because most studies reported epibiont taxa at the species level, the mean percentage of taxa that we hierarchically combined in this way within each host species and within the three loggerhead RMUs was relatively low (10.2 and 9.0%, respectively).
For each turtle species, as well as the three loggerhead RMUs, we plotted the number of taxa and proportion of taxa documented within each Higher Taxon category (either full Phylum or select phyla differentiated by Subphylum/Class/Subclass as detailed in Table 1). To minimize the number of categories displayed in these figures, we combined Higher Taxon categories within a given Phylum (e.g., Echinodermata – Asterozoa and Echinodermata – Echinozoa) when no individual turtle species was documented hosting eight or more taxa within a Higher Taxon category. All remaining Higher Taxon categories with fewer than seven total host-epibiont pairs across all turtle species were also combined into a single category called “Other taxa.” One exception to these rules was the Higher Taxon category Annelida – Hirudinea, which includes two globally distributed species of marine turtle leech that retained in the diversity plots because of their important role in sea turtle health and disease transmission (Greenblatt et al., 2004; Köhnk et al., 2021).
Extrapolating Taxonomic Richness
To evaluate whether the current scientific literature fully encompasses the taxonomic richness of each turtle species, as well as the three selected loggerhead RMUs, we used rarefaction curves following the Bernoulli product model to estimate the rate at which epibiont taxonomic richness increased with increasing sample sizes (Colwell et al., 2012). This allowed us to account for differences in samples sizes when comparing the taxonomic richness between different turtle species and RMUs. Because rarefaction curves can reasonably extrapolate species richness up to double or triple the reference sample size (Colwell et al., 2012), we estimated taxonomic richness after 150 studies for each turtle species and after 80 studies for each loggerhead RMU. We excluded Kemp’s ridley and flatback turtles from the rarefaction analyses because there were <15 studies available for these two species and this was not sufficient to provide accurate extrapolations of taxonomic richness.
We used individual studies as the baseline sampling unit and built sample-based rarefaction curves instead of individual-based rarefaction curves. While it would have been preferential to use individual turtles as the sampling unit for the rarefaction analyses, most studies only presented the combined epibiont communities of all turtles sampled and not the unique epibiont communities on each turtle. We acknowledge this violates two key assumptions of rarefaction curves: samples are collected at random from the population and samples are collected with equal effort. Indeed, global epibiont studies were not conducted at random between different RMUs (see section “Results: Identifying Knowledge Gaps”) and the same number of turtles were not sampled in each study. For these reasons, the sample-based rarefaction curves in this study likely underestimate total taxonomic richness. Sample-based rarefaction and extrapolation curves as well as their 95% confidence intervals were calculated using the program EstimateS V.9.1.
Identifying Knowledge Gaps
To identify knowledge gaps in the literature, we quantified sampling effort (i.e., the number of studies) for each turtle species in terms of turtle life stage and habitat type. For turtle life stage, we collated the number of studies documenting epibionts on juveniles (i.e., non-sexually mature), adults (i.e., sexually mature), and turtles of unknown size or reproductive status (i.e., not indicated in the study). For habitat type, we collated the number of studies documenting epibionts on turtles that were intercepted while nesting on beaches, captured in neritic habitats (<200 m depth), captured in oceanic habitats (>200 m depth), found dead/debilitated in the marine environment or washed ashore, and those in which the habitat type was unknown. Studies in which epibionts were surveyed on both juvenile and adult turtles or where turtles were surveyed in more than one habitat type were counted in each applicable category.
Additionally, we assessed knowledge gaps in terms of geographic distribution by plotting every sea turtle epibiont study onto global maps that delineated RMUs for each turtle species following Wallace et al. (2010). We distinguished between studies that reported only the presence of a subset of epibiont taxa (Taxon Specific surveys) from those that focused on all potential taxa (All Taxa surveys) because these differences may bias geographic patterns in taxonomic richness among sea turtle RMUs. For example, studies investigating the phylogenetics of a specific sea turtle barnacle will only report the collection localities of that barnacle species and not on the other epibiont taxa that may have also occurred on the host turtles sampled in those regions (e.g., Pinou et al., 2013). In contrast, All Taxa studies attempt to document and report on all epibiont taxa detected on surveyed turtles (e.g., Robinson et al., 2017b). Maps were created in ArcGIS v10.6.
Results
Database Summary
From our literature review, we identified 304 studies that contained data on a combined total of 1,717 sea turtle-epibiont interactions. Across the seven sea turtle species, we recorded 374 unique epibiont taxa representing 11 Phyla, separated into 23 Higher Taxon categories. The earliest record included was published in 1886. Since then, there was a steady increase in the annual number of publications reporting on sea turtle epibiosis until approximately 2010, after which there was a slight decline (Figure 1). This increase included both All Taxa and Taxon Specific studies, although Exhaustive studies only began to increase after 1985.
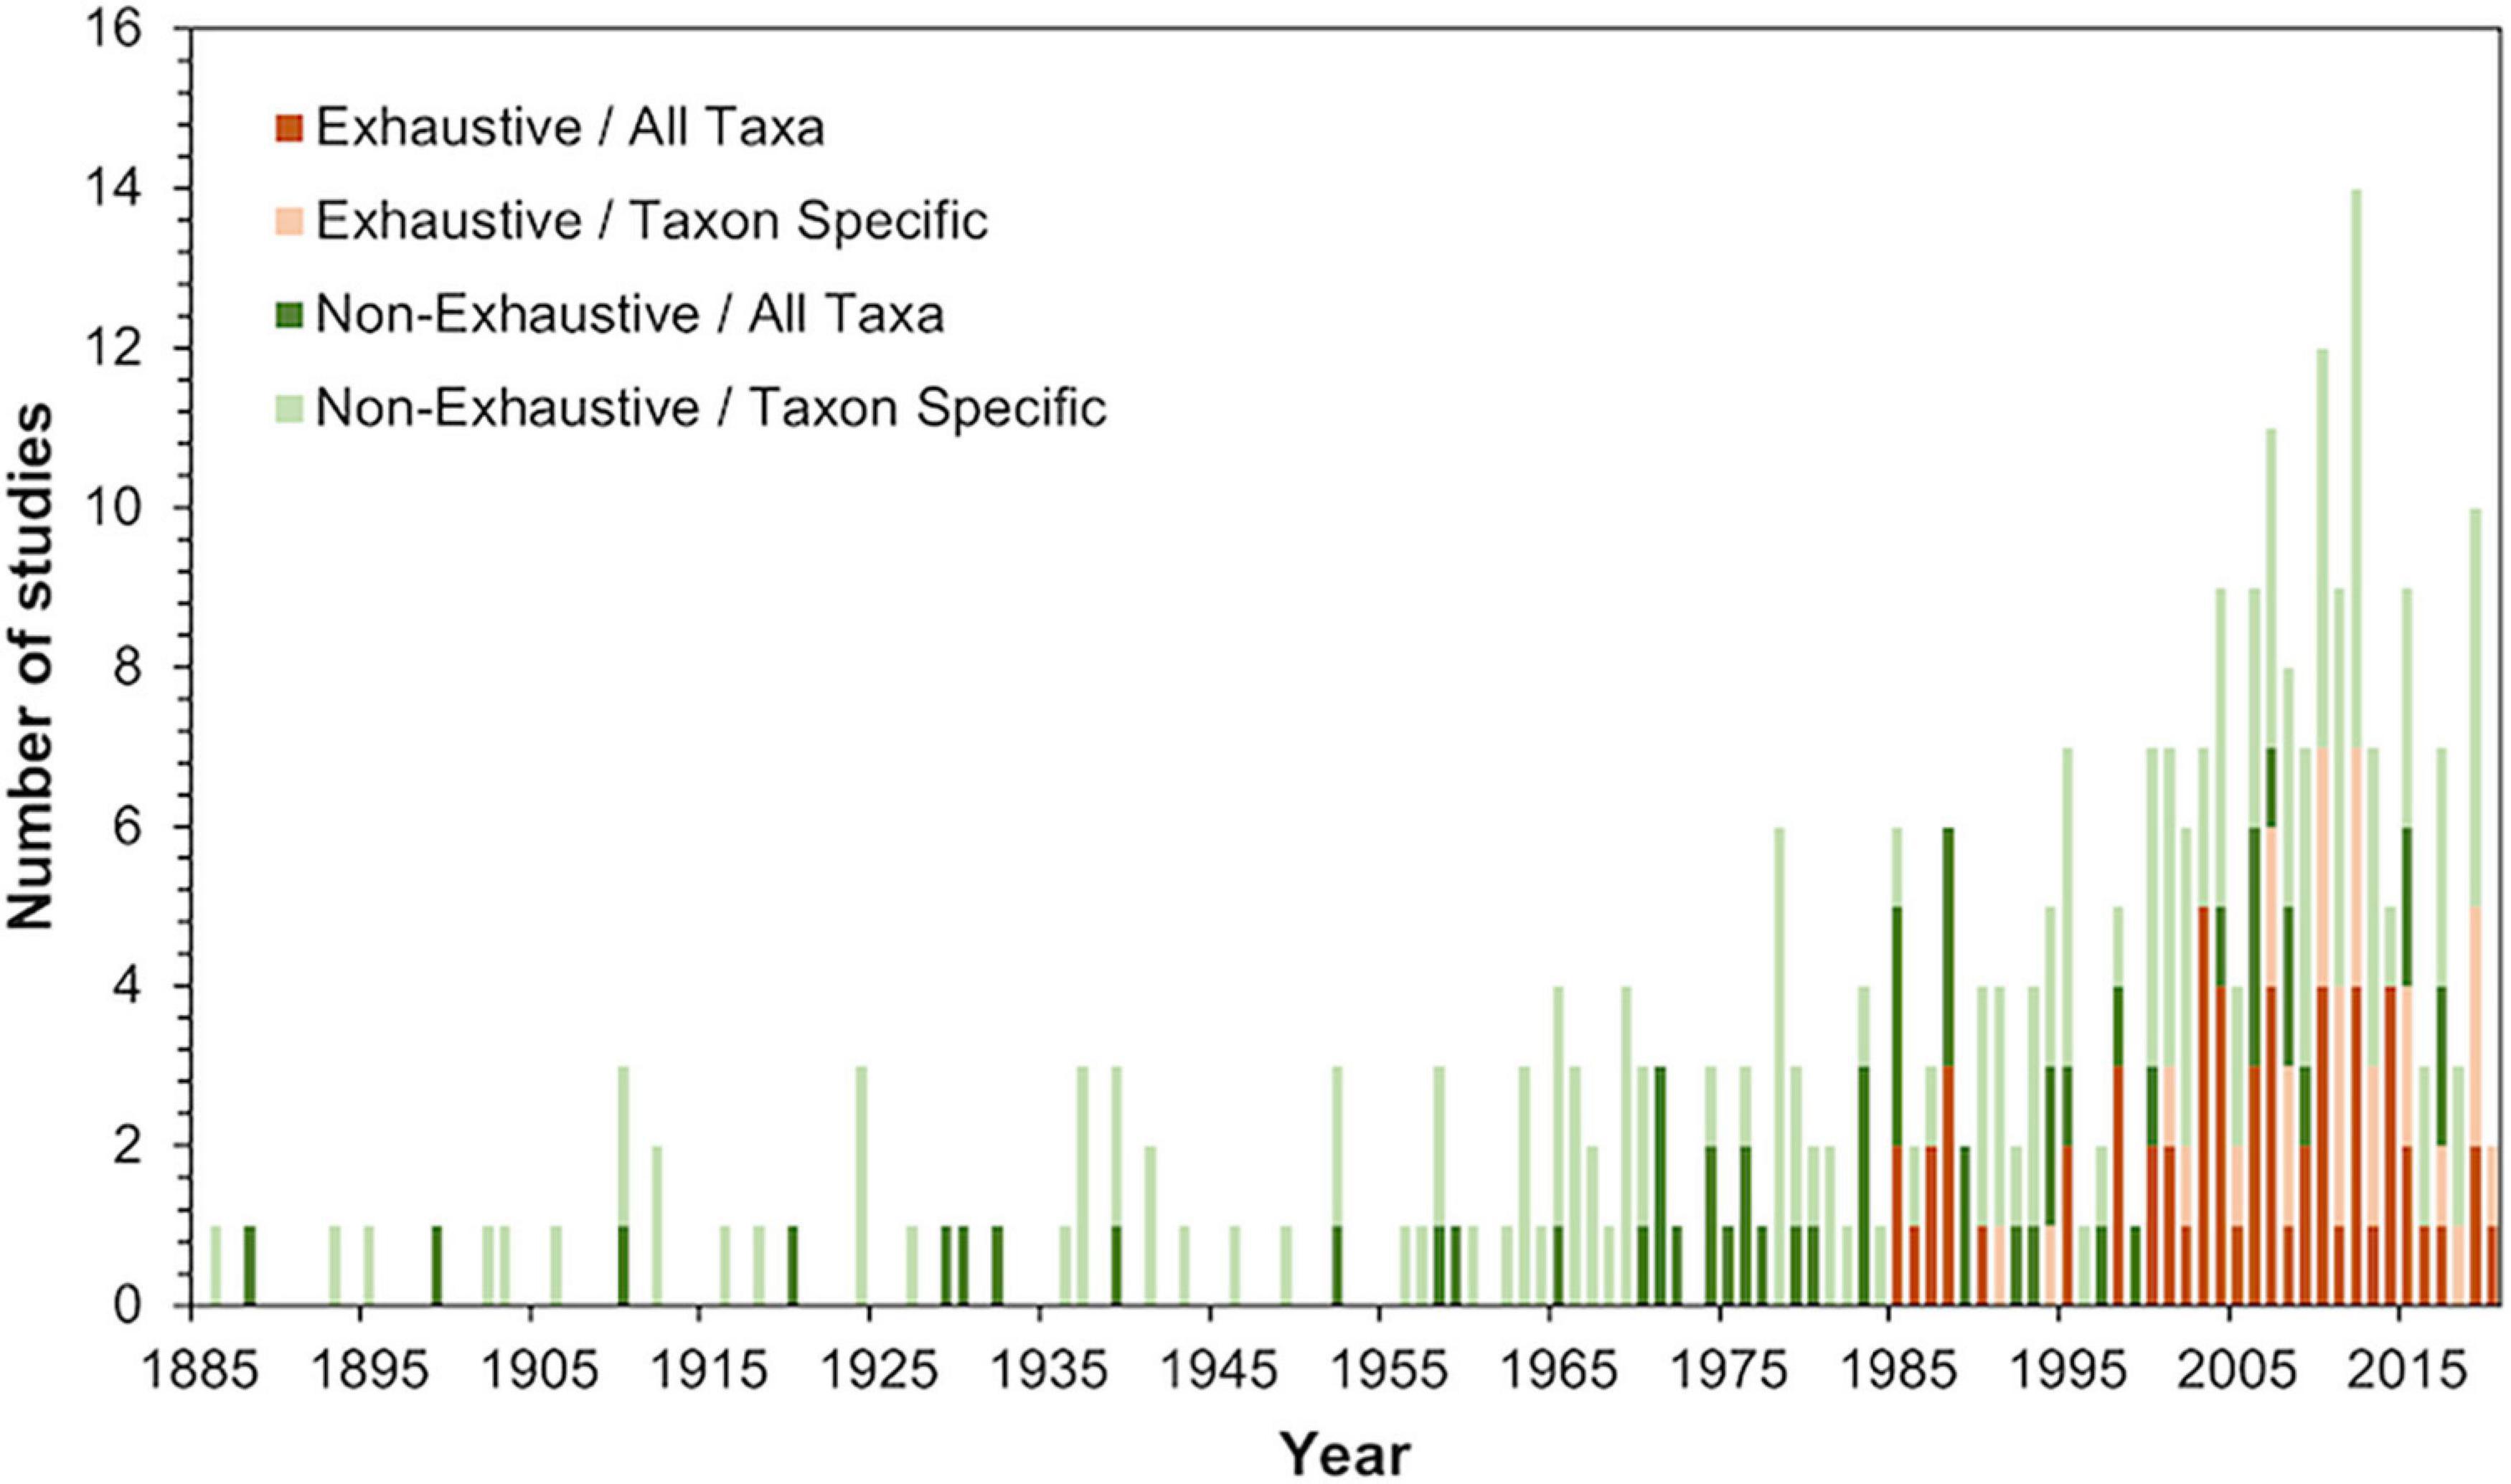
Figure 1. Number of All Taxa, Taxon Specific, Exhaustive, and Non-Exhaustive studies by year that included data on sea turtle-epibiont interactions identified during our two-tiered search of both published scientific articles and gray literature (e.g., government reports, theses and dissertations, and conference presentations). All Taxa studies attempt to document all possible epibiont taxa, while Taxon Specific studies focus on one or more specific taxonomic groups. Exhaustive studies sampled all observed epibionts, while Non-Exhaustive only sampled a subset of the observed epibionts.
To encourage further exploration of the information amassed in this database, we have made it freely available in the Dryad Digital Repository1 (Pfaller and Robinson, 2022). Data compiled for several categories listed in Table 1 were not analyzed in this study but were included in the database because they provide important biological and/or methodological information specific to each sea turtle-epibiont interaction (e.g., frequency of occurrence, body part, etc.) that may be used in future studies. We expect future authors to update this database with information from new publications (after 2020), as well as any sea turtle-epibiont interactions that were missed during our literature review.
Comparing Epibiont Diversity
Of the 374 epibiont taxa representing 23 Higher Taxon categories (either full Phylum or select phyla differentiated by Subphylum/Class/Subclass) that were documented on sea turtles globally, loggerheads hosted 262 taxa from 21 categories (Figure 2 and Supplementary Table 1). Loggerheads from the Northwest Atlantic RMU hosted 162 taxa from 18 Higher Taxon categories, while loggerheads from the Mediterranean and North Pacific RMUs hosted 85 taxa from 12 categories and 27 taxa from six categories, respectively (Supplementary Figure 1). Hawksbills hosted a similar level of diversity as loggerheads (20 Higher Taxon categories), but the total taxonomic richness was lower (87 taxa). The richness and diversity of epibionts hosted by the other five sea turtle species were considerably lower than that of loggerheads and somewhat lower than that of hawksbills: greens (56 taxa from 12 Higher Taxon categories), olive ridleys (51 taxa from 14 categories), leatherbacks (15 taxa from 4 categories), Kemp’s ridley (7 taxa from 3 categories), and flatbacks (7 taxa from 3 categories) (Figure 2 and Supplementary Table 1).
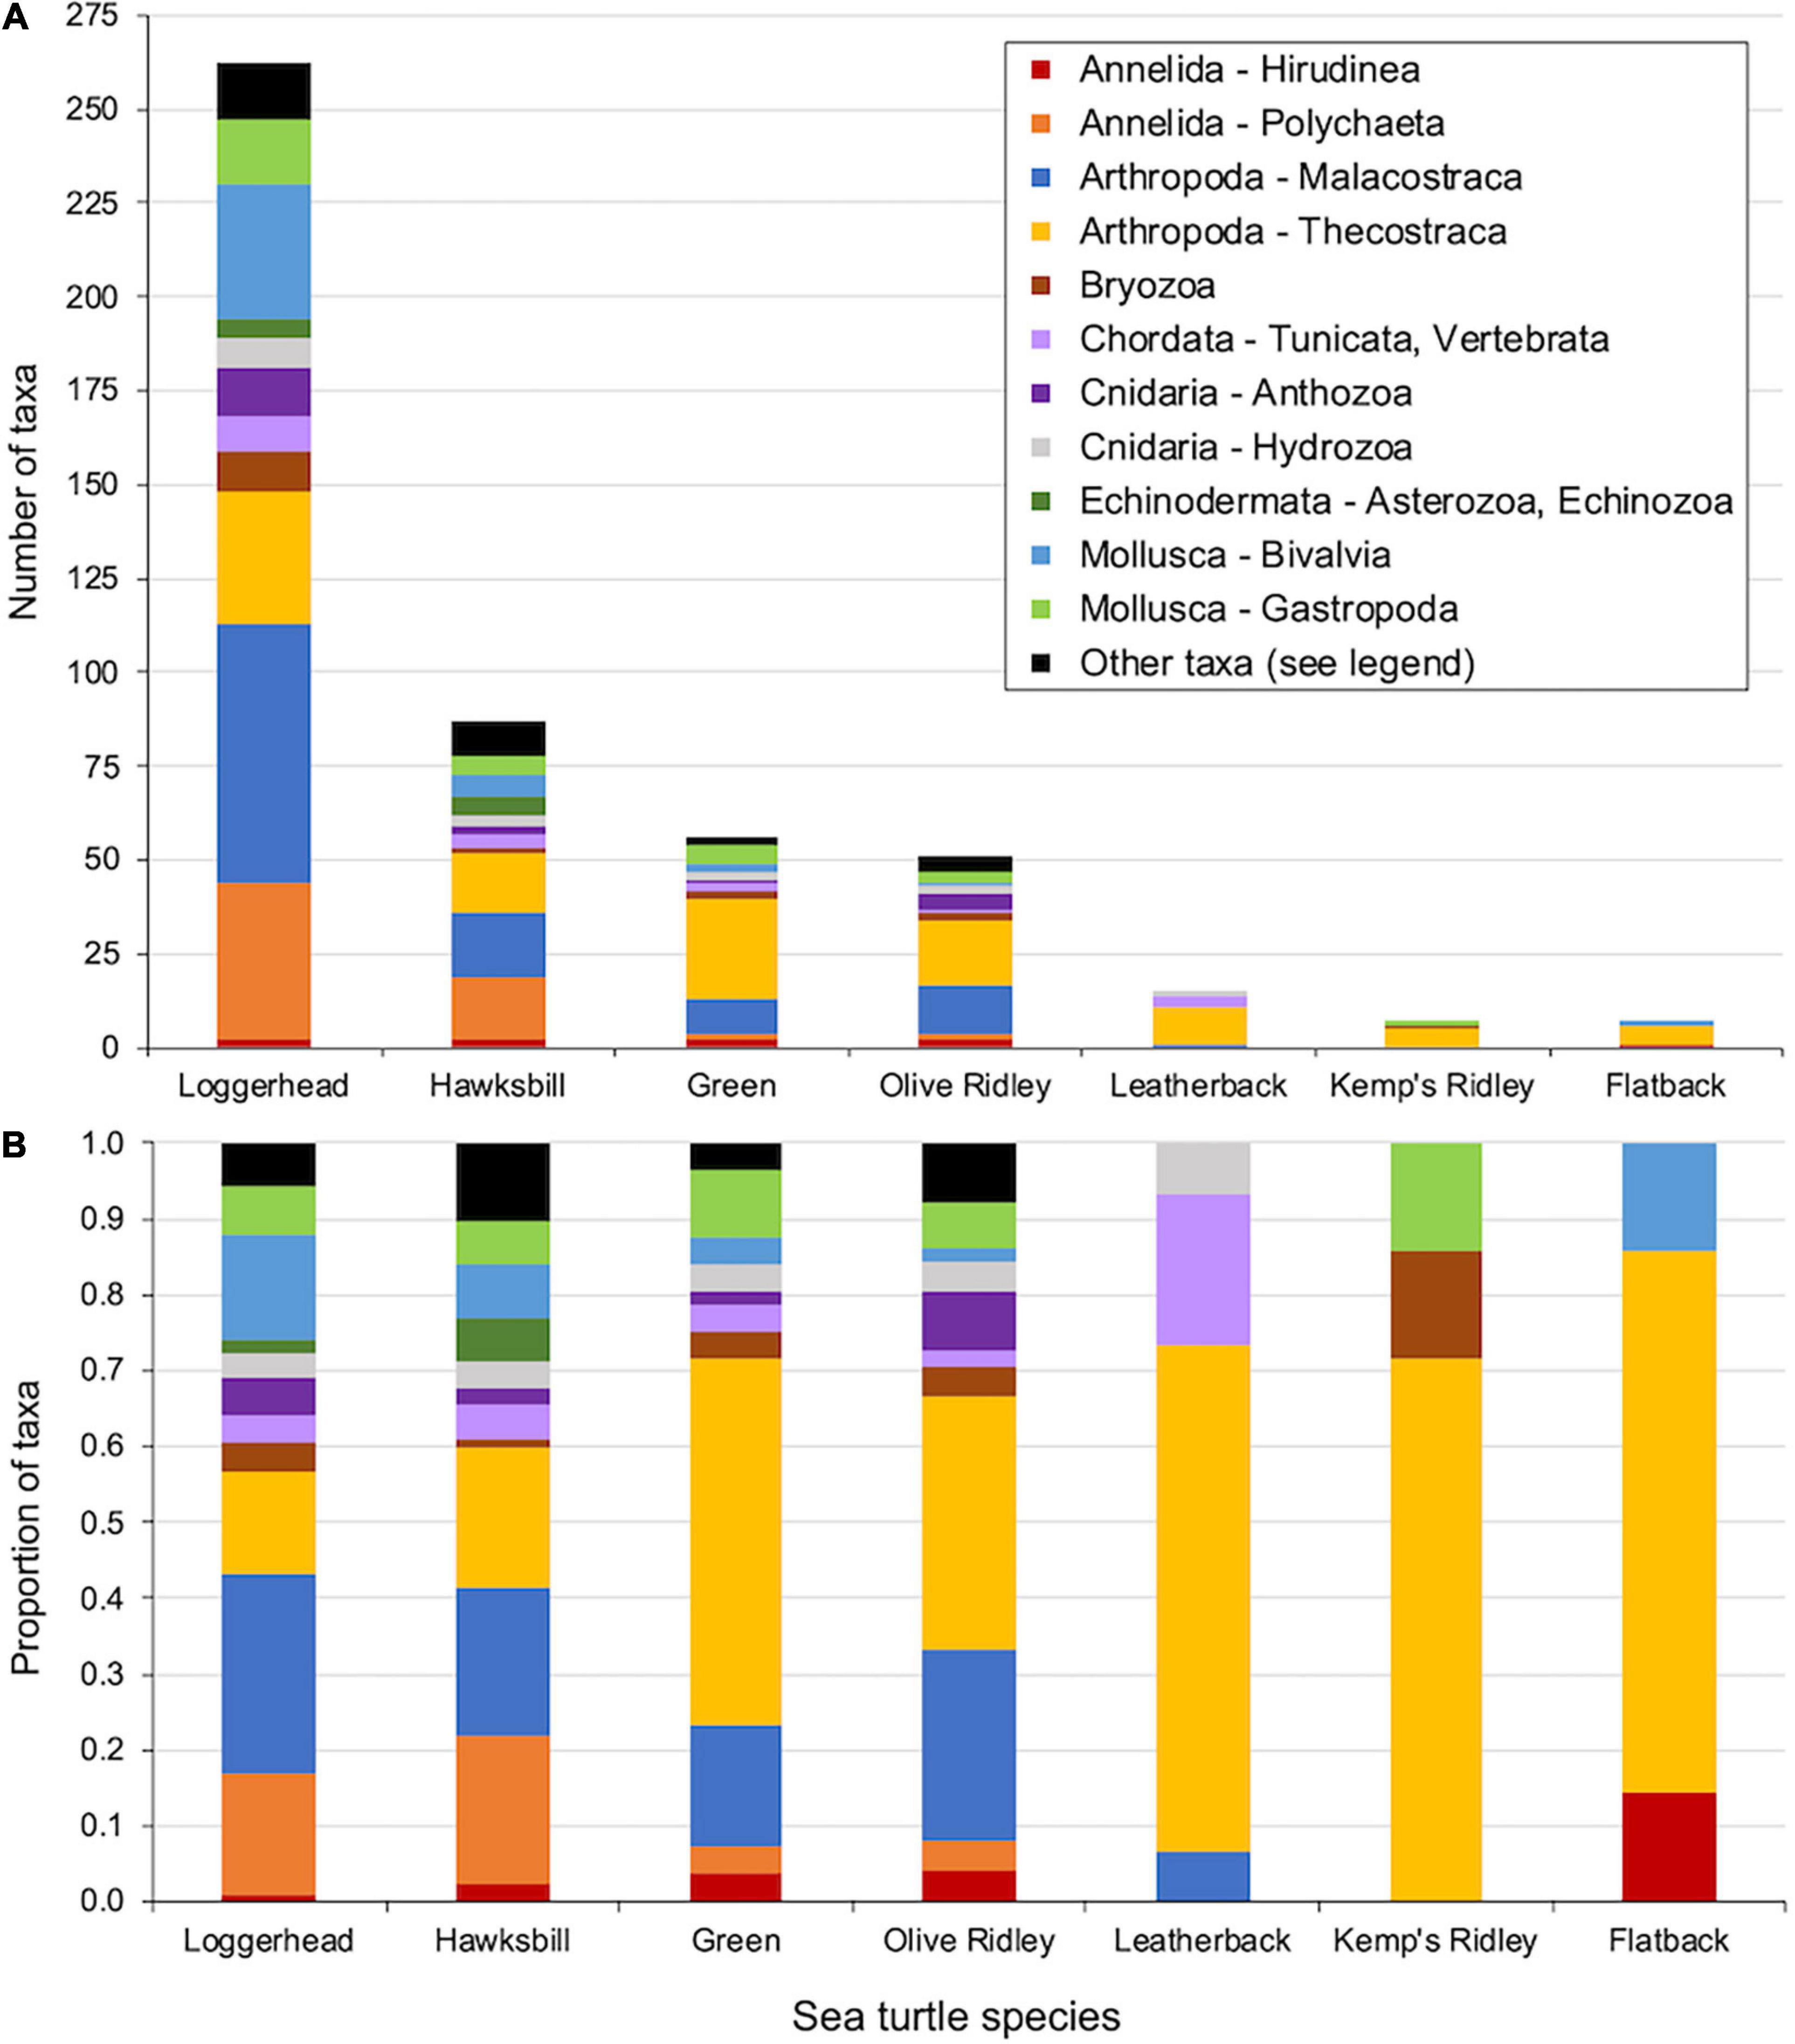
Figure 2. Taxonomic composition of the epibiont communities reported from all seven sea turtle species. (A) Number of taxa per Higher Taxon category (either full Phylum or select phyla differentiated by Subphylum/Class/Subclass) and (B) proportion of taxa per Higher Taxon category. The category “Other taxa” combines taxa from 10 Higher Taxon categories in which fewer than six total taxa were documented across all turtle species (Loggerhead: Annelida – Oligochaeta, Arthropoda – Ostracoda, Arthropoda – Pycnogonida, Mollusca – Polyplacophora, Nemertea, Platyhelminthes, Porifera, and Sipuncula; Hawksbill: Annelida – Oligochaeta, Arthropoda – Insecta, Arthropoda – Ostracoda, Mollusca – Polyplacophora, Platyhelminthes, Porifera, and Sipuncula; Green: Arthropoda – Arachnida and Platyhelminthes; Olive Ridley: Arthropoda – Pycnogonida, Mollusca – Polyplacophora, Platyhelminthes, and Porifera). See Supplementary Table 1 for numerical summary of the number of epibiont taxa reported within each Higher Taxon for each sea turtle species.
Among the 13 Higher Taxon categories not combined into “Other taxa,” loggerheads and hawksbills were the only species that hosted epibiont taxa from all categories (Figure 2 and Supplementary Table 1). Moreover, loggerheads and hawksbills hosted roughly similar proportions of taxa from each category, with the predominant categories being Annelida – Polychaeta (i.e., polychaete worms), Arthropoda – Malacostraca (e.g., crabs, shrimps, and amphipods), and Arthropoda – Thecostraca (e.g., acorn and goose-necked barnacles). Northwest Atlantic loggerheads hosted epibiont taxa from 12 Higher Taxon categories not combined into “Other taxa,” while Mediterranean and North Pacific loggerheads hosted epibiont taxa from nine and five categories, respectively (Supplementary Figure 1 and Supplementary Table 1). Green and olive ridley turtles hosted epibiont taxa from all but one category (Echinodermata – Asterozoa, Echinozoa were not recorded for either host species), while leatherbacks, Kemp’s ridleys, and flatbacks hosted epibiont taxa from four, three, and three categories, respectively. Arthropoda – Thecostraca was the only Higher Taxon category reported from all seven sea turtle species and its predominance (% of taxa) tended to increase as the total epibiont richness of a host species decreased.
Extrapolating Taxonomic Richness
Rarefaction curves indicated that loggerhead turtles both host the highest total taxonomic richness of all seven sea turtle species and have had the greatest sampling effort in terms of number of studies (Figure 3). Extrapolating beyond the current 135 studies documenting the epibiont diversity of loggerheads, the rarefaction curve approaches 300 epibiont taxa after 150 studies. This suggests that the current scientific literature has not yet fully described the taxonomic richness for loggerhead epibionts on a global scale.
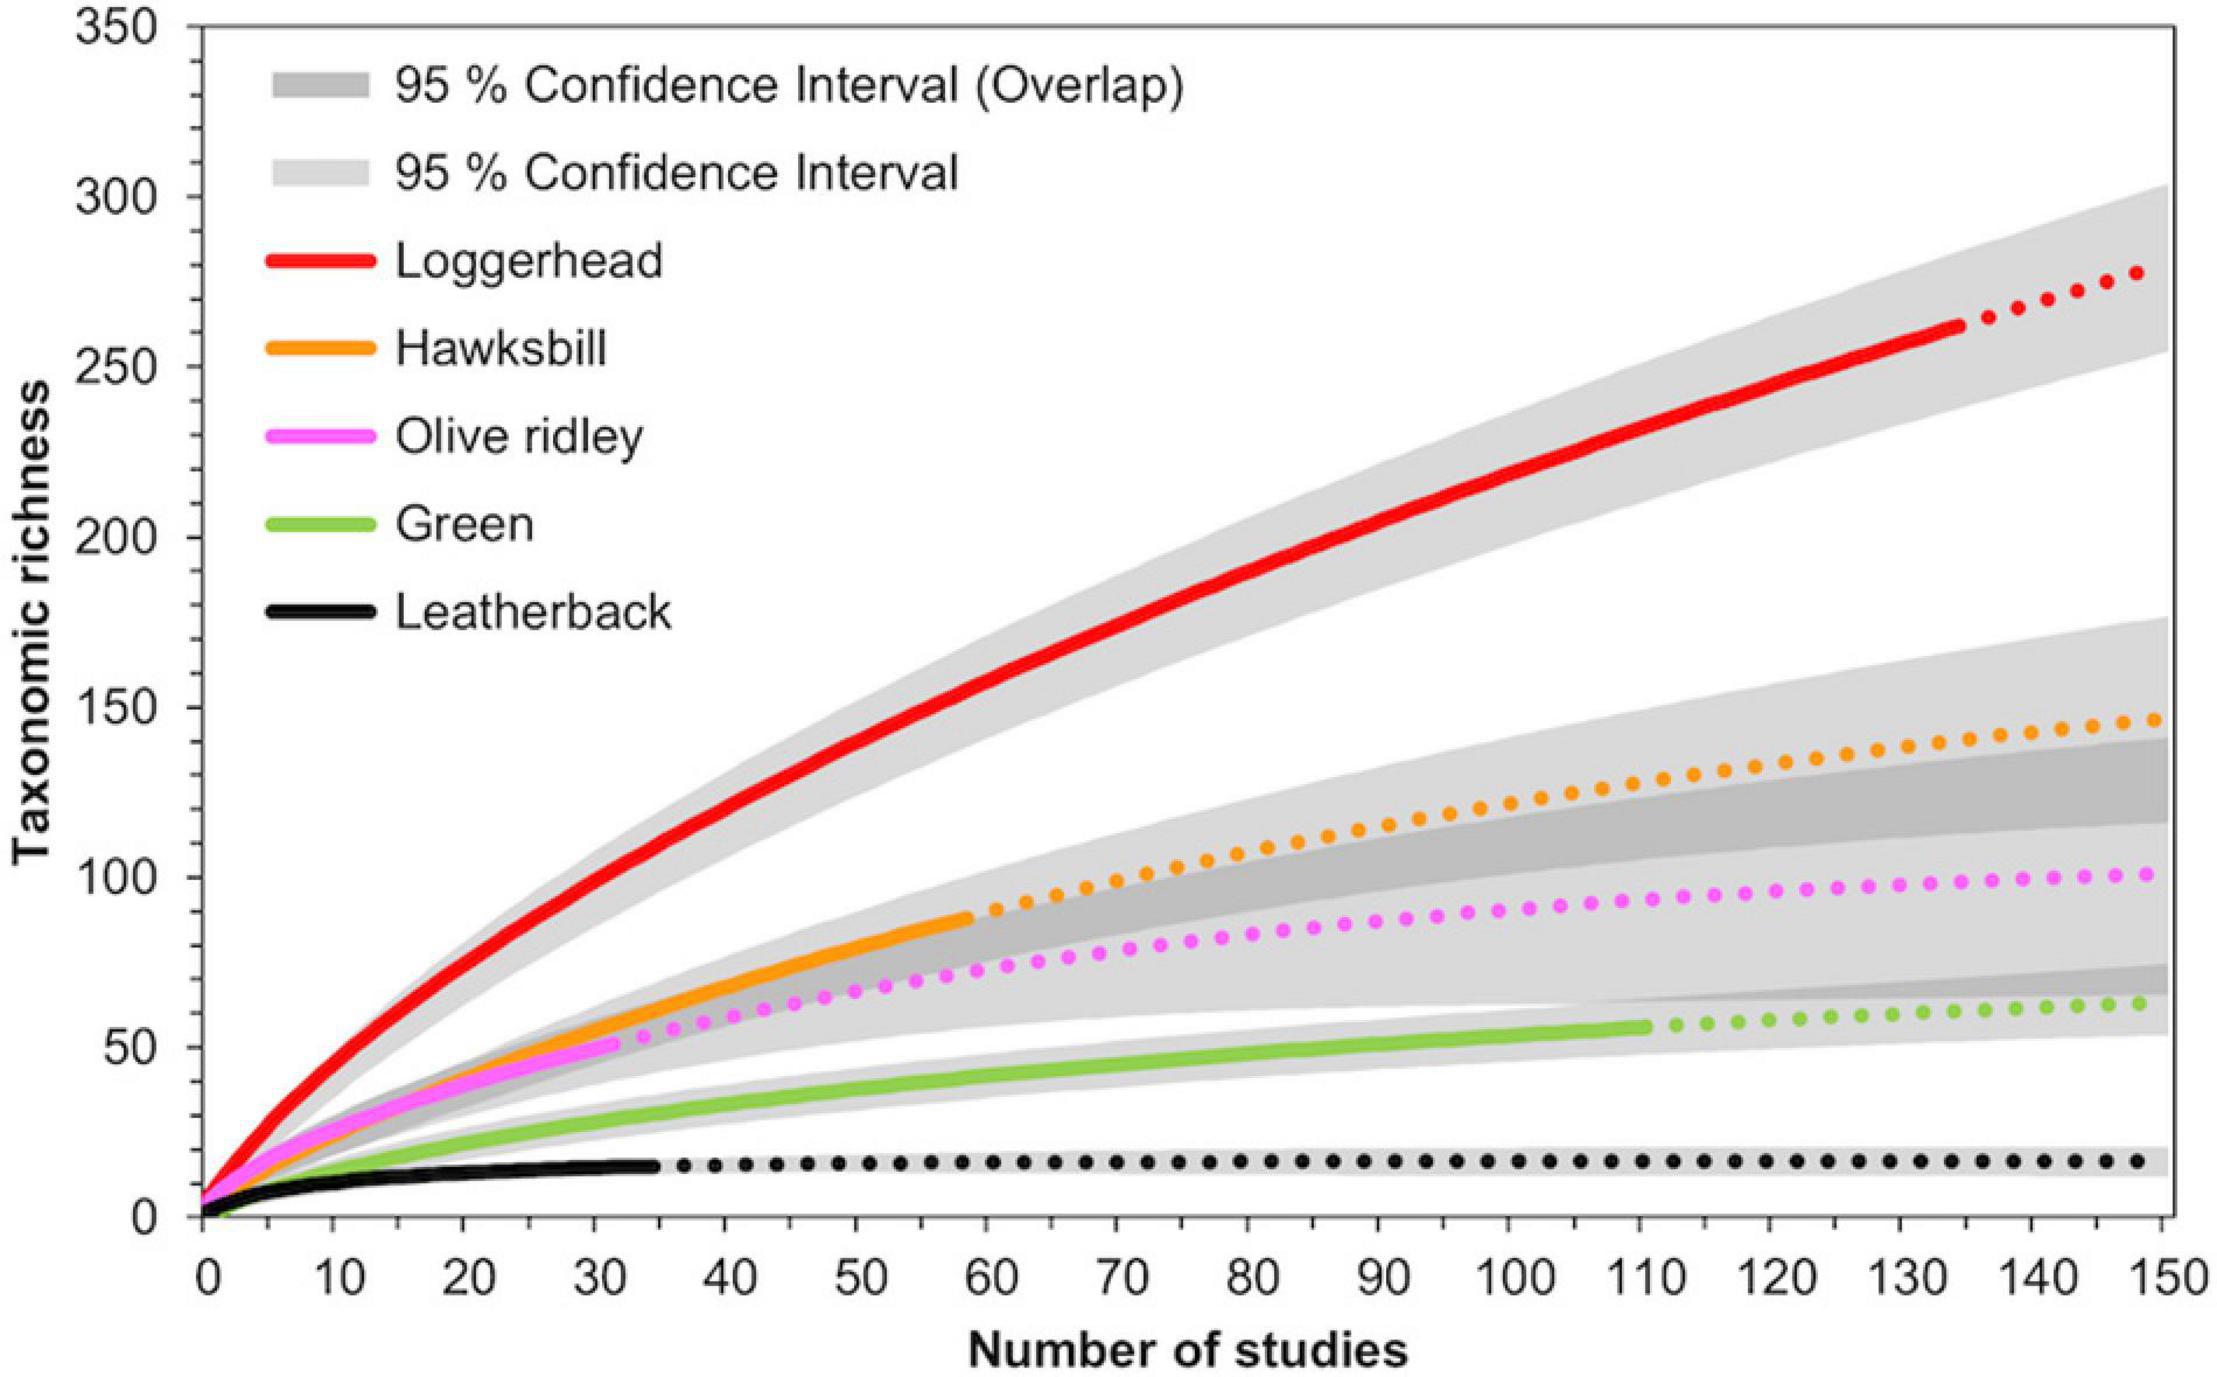
Figure 3. Rarefaction curves to estimate taxonomic richness of epibionts for loggerhead, hawkbill, olive ridley, green, and leatherback sea turtles. Solid lines indicate data curves calculated from previous studies, while dashed lines represent extrapolated data.
The rarefactions curves for loggerheads from the Northwest Atlantic, Mediterranean, and North Pacific RMUs also suggested that further studies will reveal additional epibiont diversity (Figure 4). Extrapolating up to 80 studies per RMU indicated that the taxonomic richness of Northwest Atlantic loggerheads could reach an estimated 202 epibiont taxa, while Mediterranean and North Pacific loggerheads could reach an estimated 137 and 55 epibiont taxa, respectively. While extrapolations suggest that current studies have not fully described the taxonomic richness within each loggerhead RMU, the lack of overlap between the 95% confidence intervals suggests that geographic variation in taxonomic richness among loggerhead RMUs represents a true biological pattern.
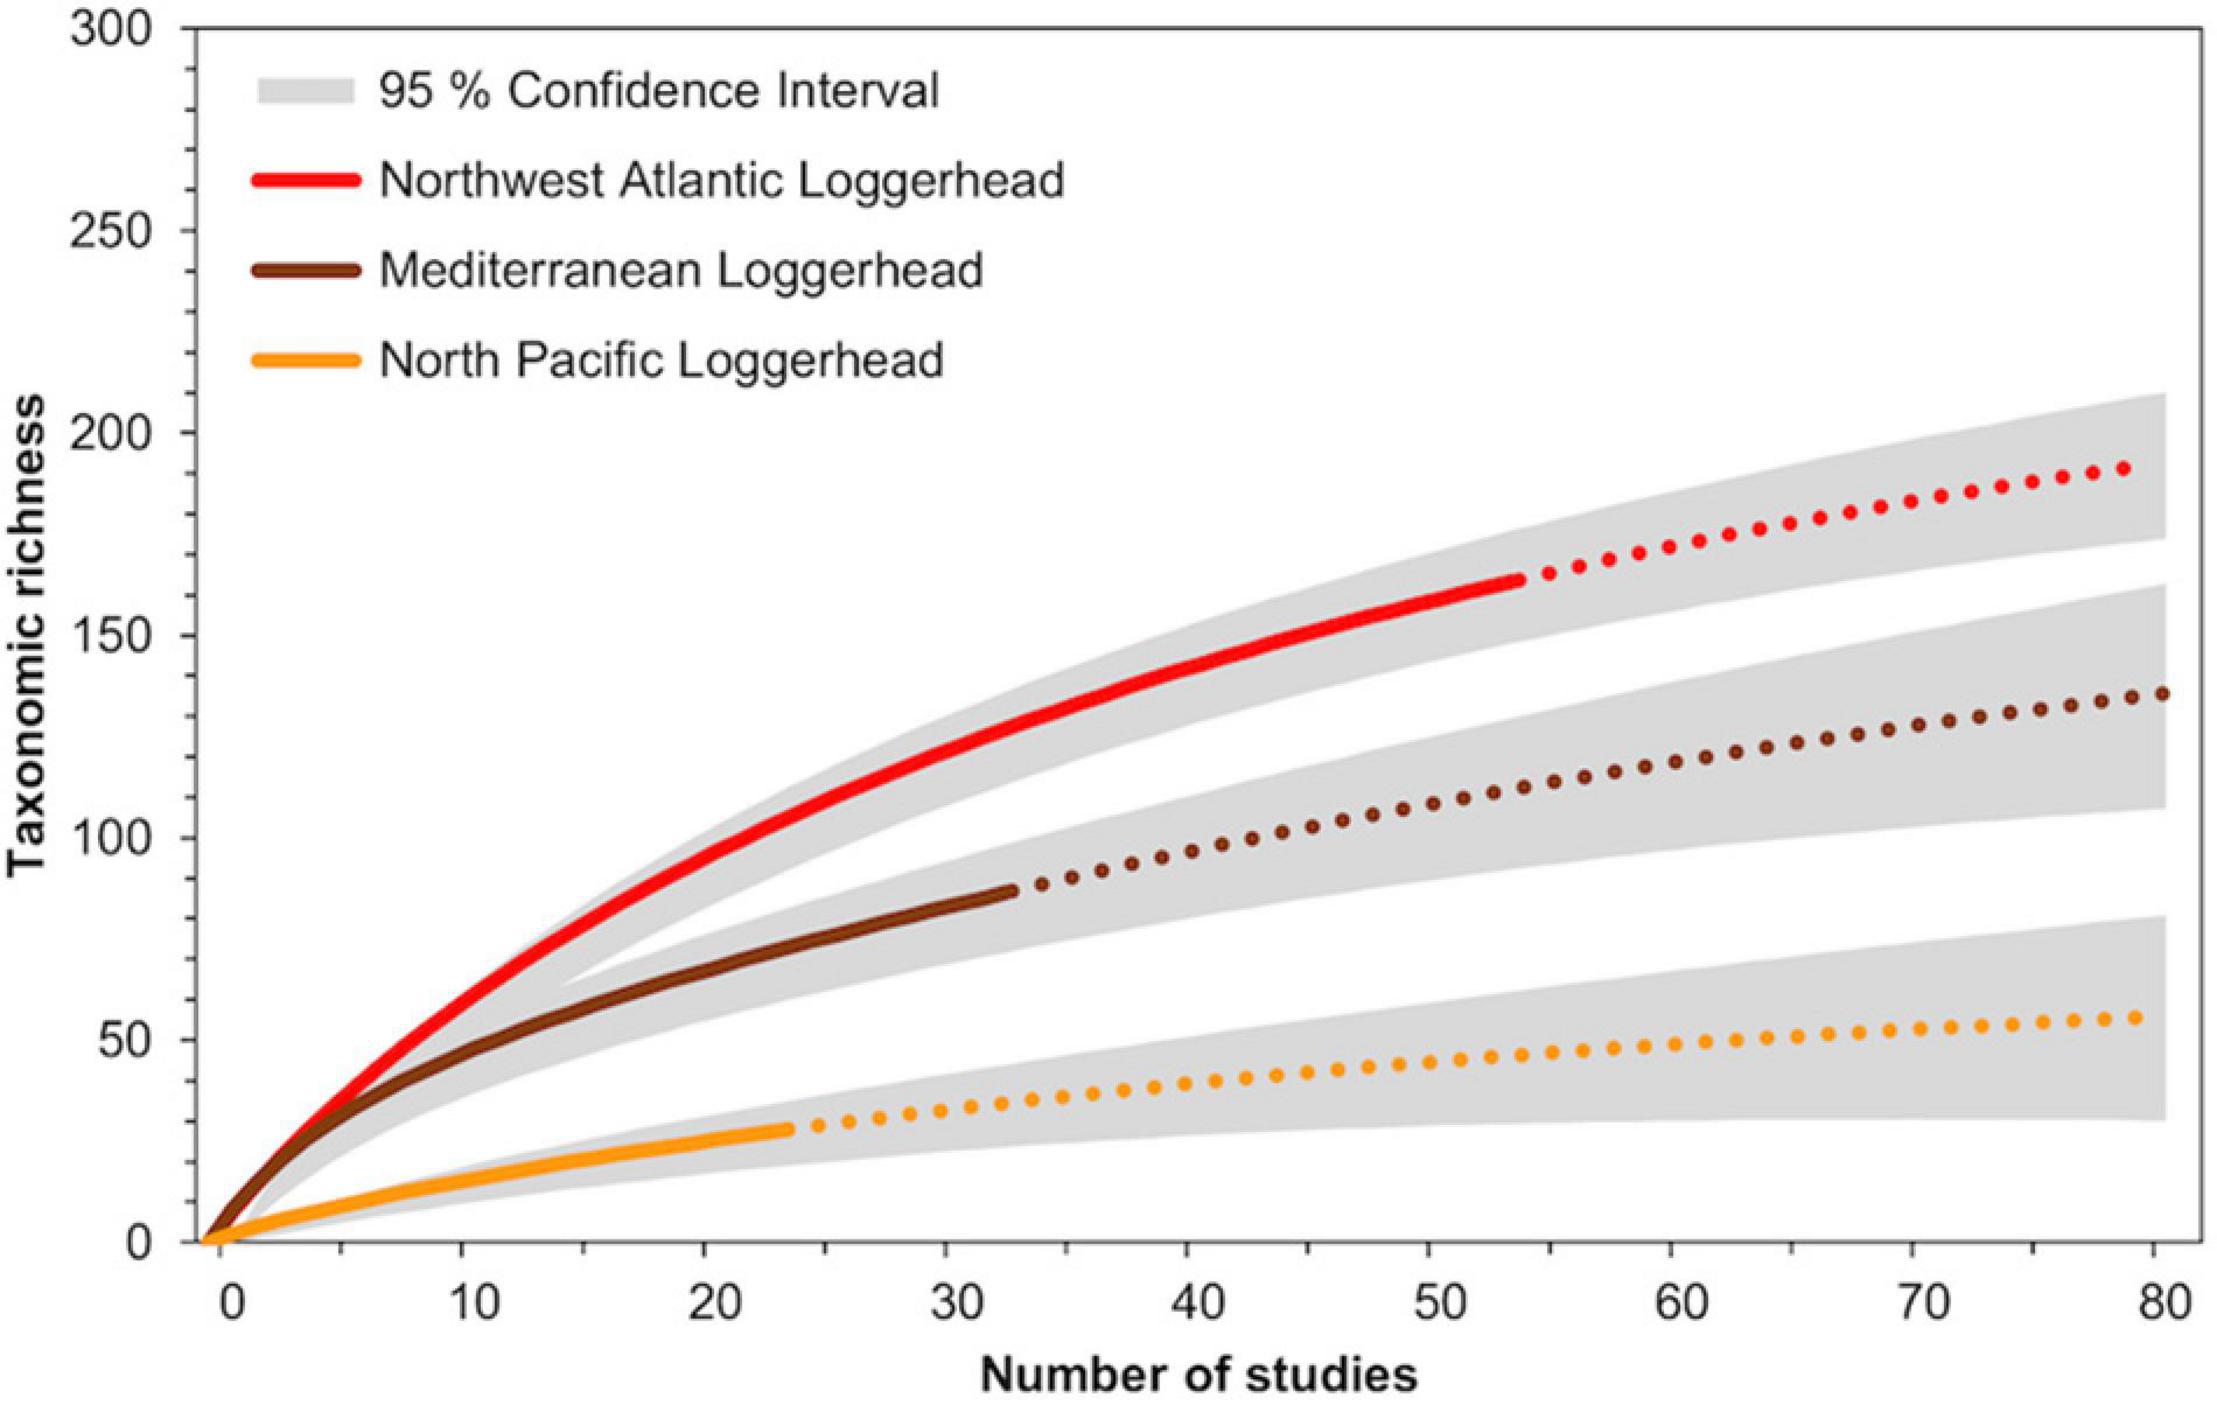
Figure 4. Rarefaction curves to estimate the taxonomic richness of epibionts for three loggerhead Regional Management Units: Northwest Atlantic, Mediterranean, and North Pacific. Solid lines indicate data curves calculated from previous studies, while dashed lines represent extrapolated data.
Hawksbill turtles hosted the second highest taxonomic richness after loggerheads. However, because this diversity was recorded from comparably fewer studies (N = 58), the extrapolated rarefaction curve for hawksbills reached 148 epibiont taxa after 150 studies (Figure 3). The 95% confidence intervals for hawksbills overlapped with that of olive ridleys. Like hawksbills, olive ridleys hosted relatively high diversity from comparably fewer studies (N = 32), causing the extrapolated rarefaction curve to estimate approximately double the diversity (101 taxa) after 150 studies. Additional studies investigating the epibiont diversity of hawksbills and olive ridleys globally are needed to unequivocally determine whether the epibiont communities of hawksbill turtles are more taxonomically rich than olive ridley turtles.
Green turtles, despite having the second most studies (N = 111), were recorded hosting significantly fewer epibiont taxa than hawksbills and approximately the same number of taxa as olive ridleys. Consequently, the extrapolated rarefaction curve for green turtles estimated only 64 epibiont taxa after 150 studies, which was only eight taxa higher than is currently reported (Figure 3). Similarly, epibiont research on leatherbacks has appeared to reach a plateau: 15 taxa have been recorded from 35 studies to date, but only 16 total taxa are expected to be recorded after 150 studies are conducted.
Identifying Knowledge Gaps – Life Stage and Habitat
Turtle life stage (adult and/or juvenile) was only reported in 52% of studies (Figure 5A). Within each turtle species, the percentage of studies reporting turtle life stage ranged from 49% in greens and 84% in olive ridleys. Among studies that reported turtle life stage, there were strong biases toward adult turtles for flatbacks (100%), leatherbacks (86%), and olive ridleys (84%), while significant biases toward adult turtles were not as apparent for hawksbills (59%), loggerheads (54%), and green turtles (48%). Kemp’s ridleys were the only species with a strong bias toward juveniles (25% adult). Nevertheless, the two species with the strongest biases (Kemp’s ridleys and flatbacks) also had relatively few studies (seven and two total studies, respectively).
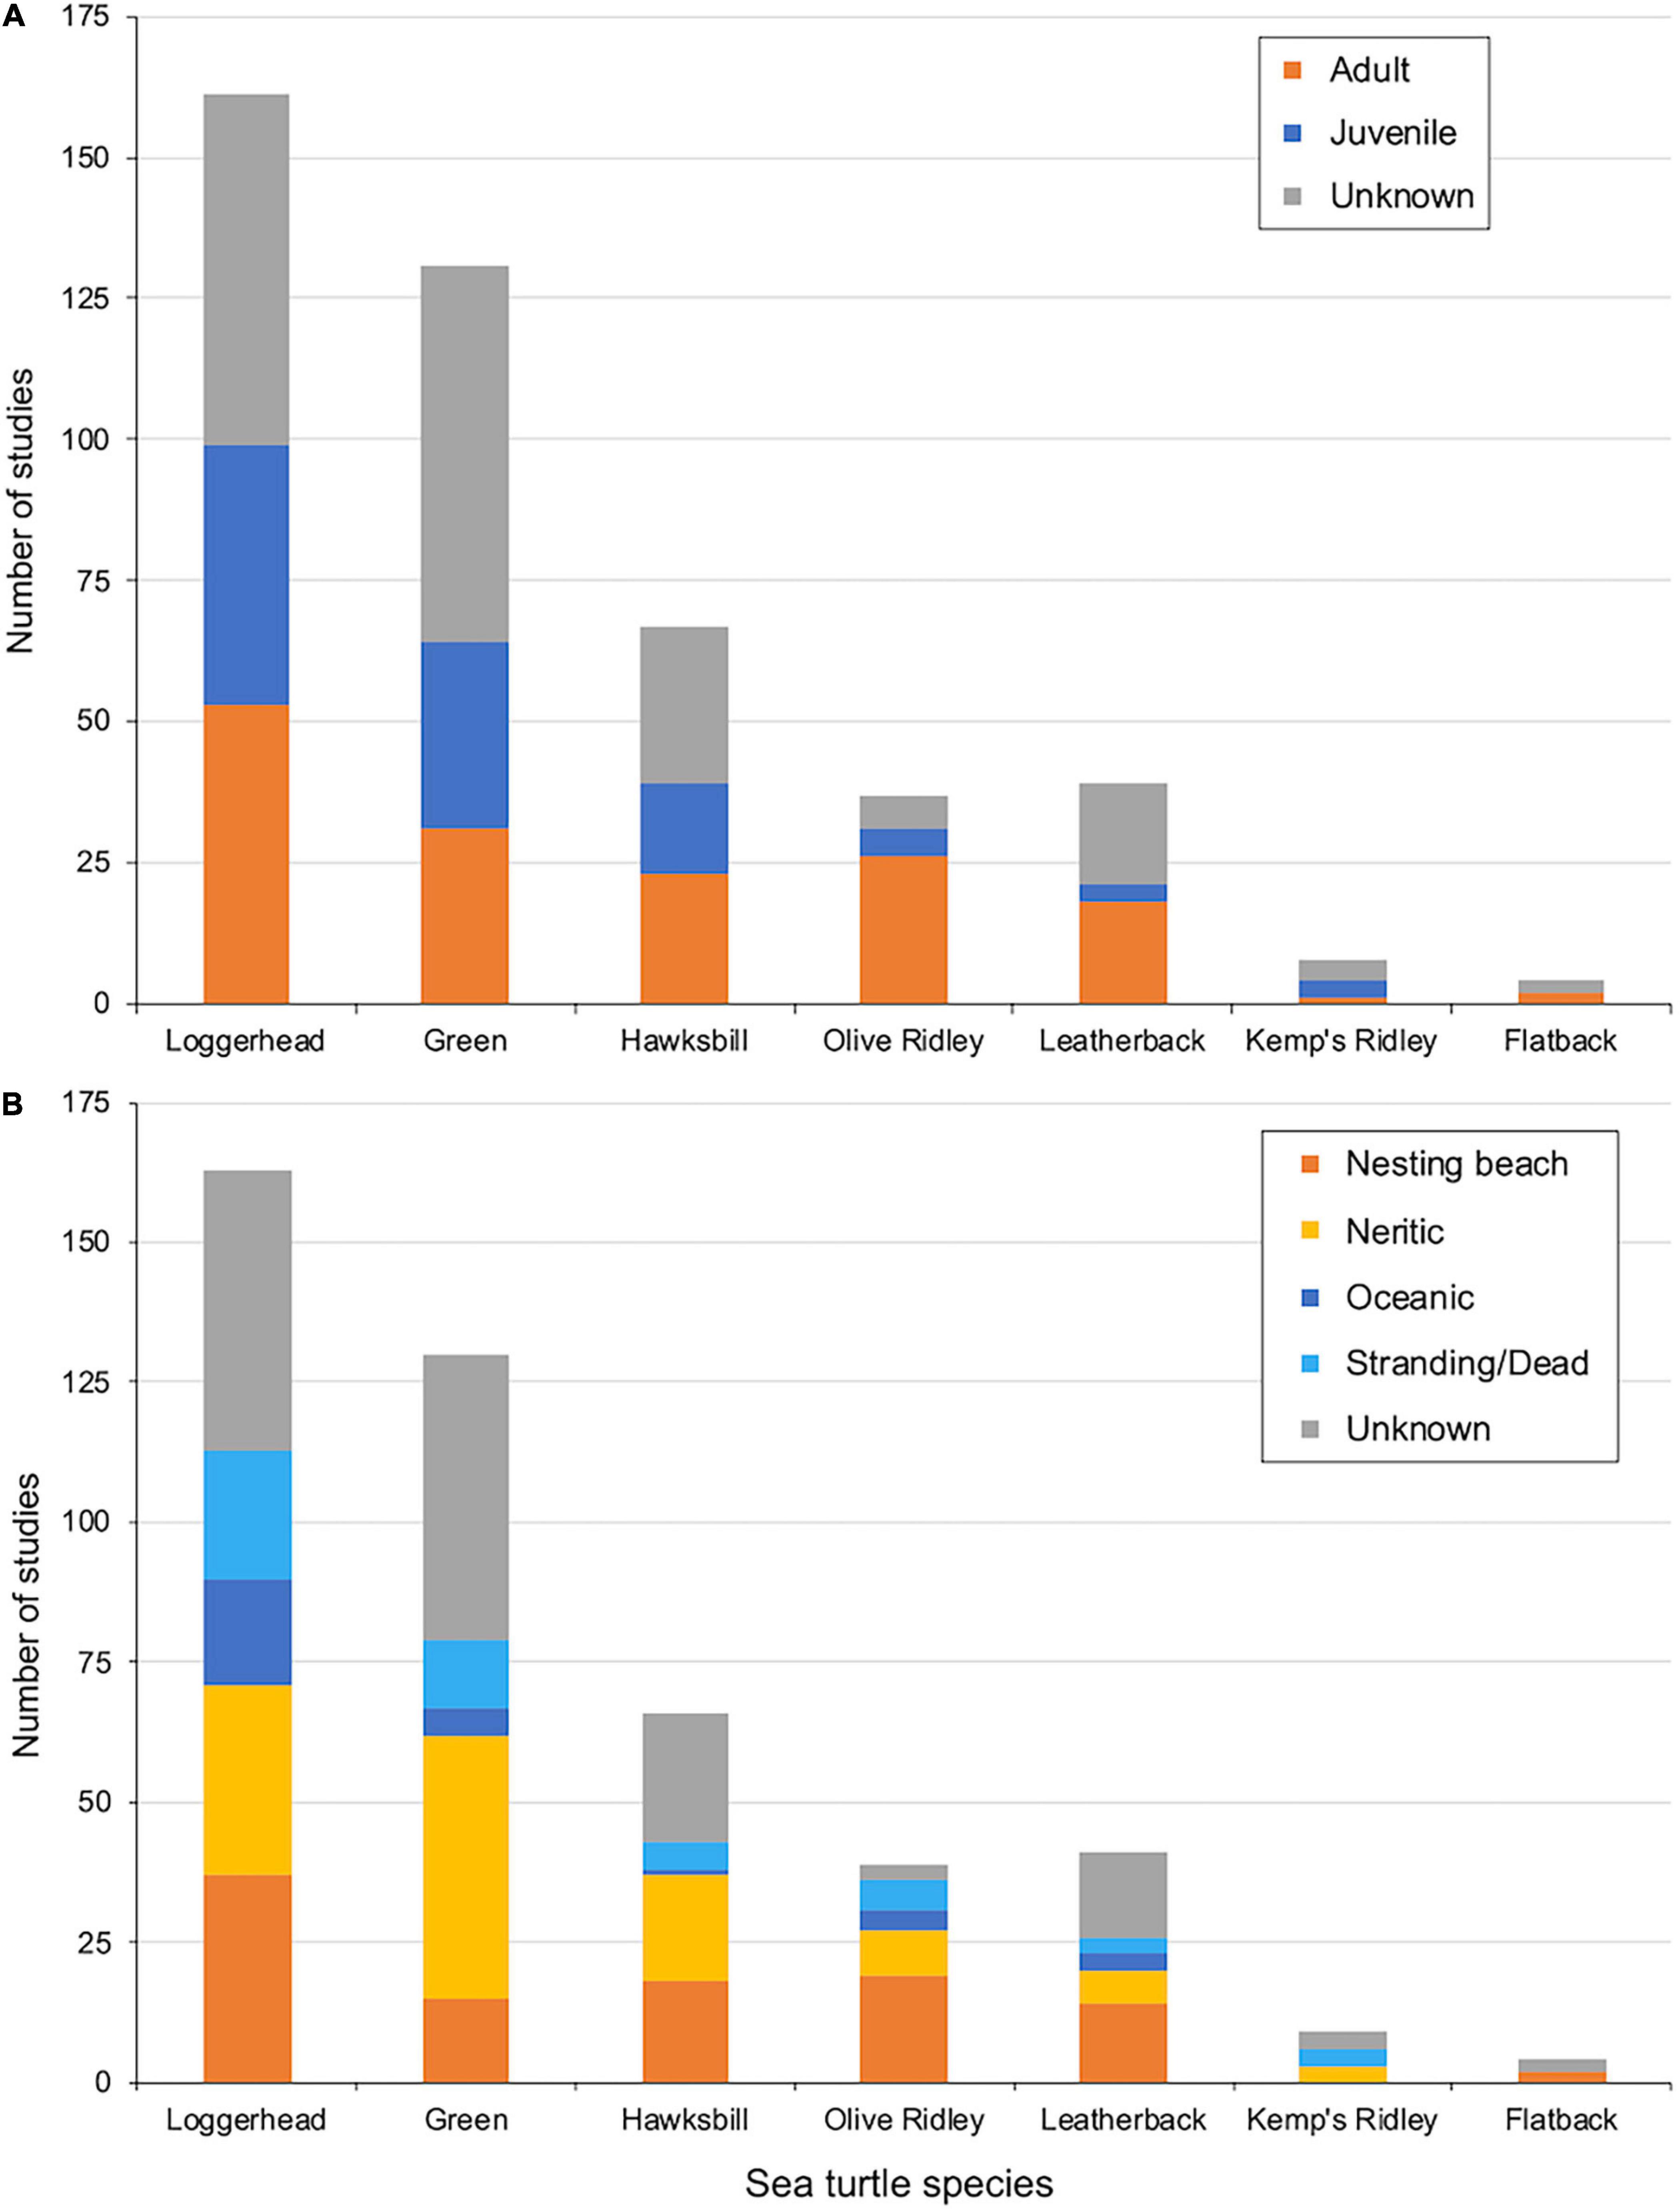
Figure 5. (A) Number of epibiont studies separated by turtle species and life stage (either adult, juvenile or unknown). (B) Number of epibiont studies separated by turtle species and habitat type (nesting beach, neritic, oceanic, stranding/dead animals, or unknown).
Habitat type (nesting beach, neritic, oceanic, and/or stranding/dead) was reported for only 63% of studies (Figure 5B). Within each turtle species, the percentage of studies that reported habitat type ranged from 50% in flatbacks and 92% in olive ridleys. Among studies that reported habitat type, there were biases toward nesting beaches for flatbacks (100%), leatherbacks (54%), and olive ridleys (53%), reflecting their biases toward studies on adult turtles. The habitat types among studies on leatherbacks and olive ridleys were similar in proportion: nesting beaches (54 and 53%, respectively), neritic (22 and 23%, respectively), oceanic (11 and 12%, respectively), and stranding/dead (14 and 12%, respectively). Studies on loggerheads were more balanced between habitat types: nesting beach (33%), neritic (30%), oceanic (17%), and stranding/dead (20%). Studies on hawksbills were biased toward nesting beaches (42%) and neritic habitats (44%) and away from oceanic habitats (only 2%). Studies on greens and Kemp’s ridleys were biased toward neritic habitats (59 and 50%, respectively) and away from nesting beaches (19 and 0%, respectively) and oceanic habitats (6 and 0%, respectively), but studies on Kemp’s ridleys also suffered from a small sample size (only three neritic, three stranding/dead, and three unknown habitats for Kemp’s ridleys). Studies on flatbacks were also biased by low sample sizes (two studies on nesting beaches and two in unknown habitats). Among all studies from all species, including those that included turtles sampled from more than one habitat type (i.e., those counted in more than one category), 38% were in neritic waters, 34% were on nesting beaches, 11% were in oceanic waters, and 17% were from stranded or dead turtles.
Identifying Knowledge Gaps – Geography and Regional Management Units
For loggerheads, epibiont studies were geographically concentrated in the Northwest Atlantic (33%) and Mediterranean (22%) RMUs, where a high percentage of studies were All Taxa surveys (42 and 33%, respectively) (Figure 6A). Conversely, loggerhead studies in the western portion of the North Pacific RMU were relatively numerous (15%) but were predominantly Taxon Specific surveys (87%). For green turtles, epibiont studies were globally distributed but most studies were Taxon Specific (79%) (Figure 6B). Both Taxon Specific and All Taxa surveys were geographically concentrated in the East Pacific RMU and the area of overlap between the Southwest Atlantic and South Central Atlantic RMUs in southern Brazil and Uruguay. Taxon Specific surveys were also concentrated in the Northwest Pacific, Southwest Pacific, and Northwest Indian RMUs, while All Taxa surveys were also concentrated in the North Central Pacific RMU (i.e., Hawaii).
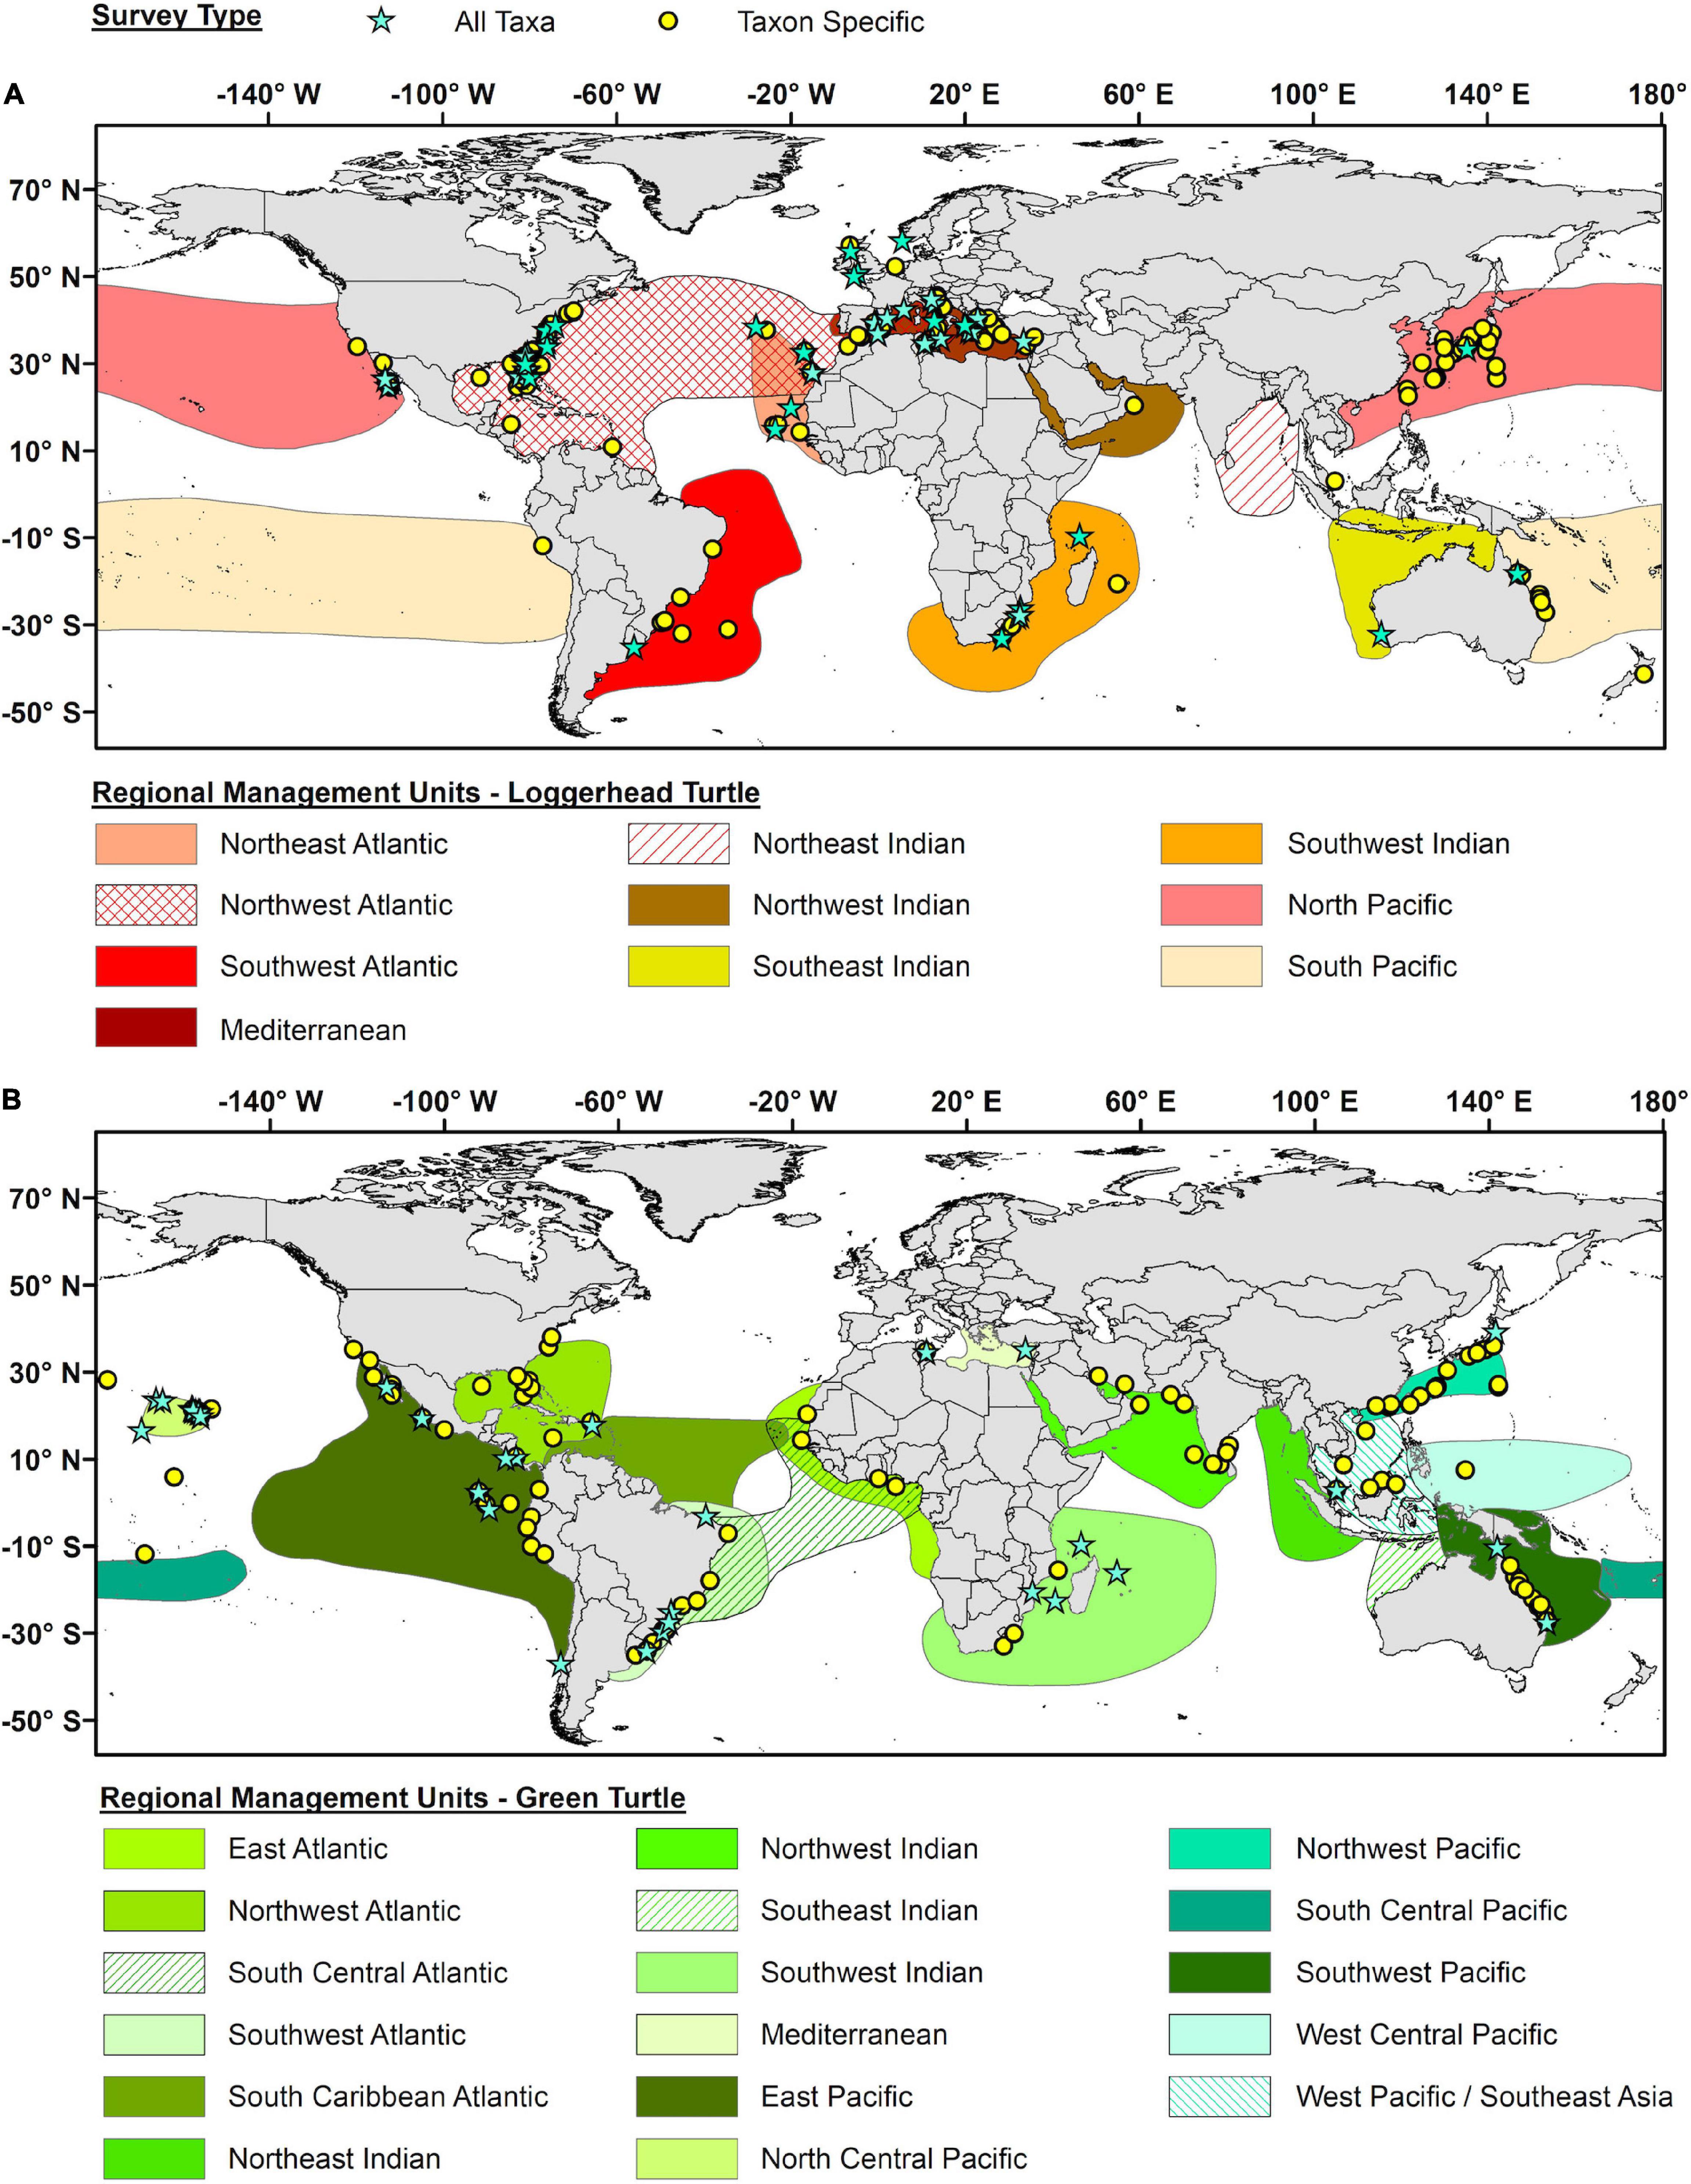
Figure 6. Geographic distribution of all epibiont studies for (A) loggerhead turtles (Caretta caretta) and (B) green turtles (Chelonia mydas). Blue stars represent studies that report on all potential taxa (All Taxa), while yellow circles represent studies that only focus on specific taxa (Taxon Specific). The geographic outlines for each Regional Management Unit as represented by differentially colored polygons (based on Wallace et al., 2010).
For hawksbills, Taxon Specific surveys were more common (69%) and geographically more homogeneous (Figure 7A), with the West Pacific/Southeast Asia RMU and East Pacific RMU having the most Taxon Specific surveys (75 and 100%, respectively) and only one All Taxa survey each. All Taxa surveys for hawksbills were geographically concentrated in the Western Caribbean/United States (100%) and Southwest Pacific RMUs (71%). For leatherbacks, both Taxon Specific and All Taxa surveys were geographically concentrated in the Northwest Atlantic RMU (Figure 7B), which included epibiont studies conducted in both eastern North America and the Caribbean as well as western Europe in the Northeast Atlantic. Two All Taxa surveys have been conducted on leatherbacks in the northern portion of the East Pacific RMU. The West Pacific RMU was the subject of several Taxon Specific surveys. However, these surveys covered a very wide geographic area, ranging from Japan to Malaysia to New Zealand.
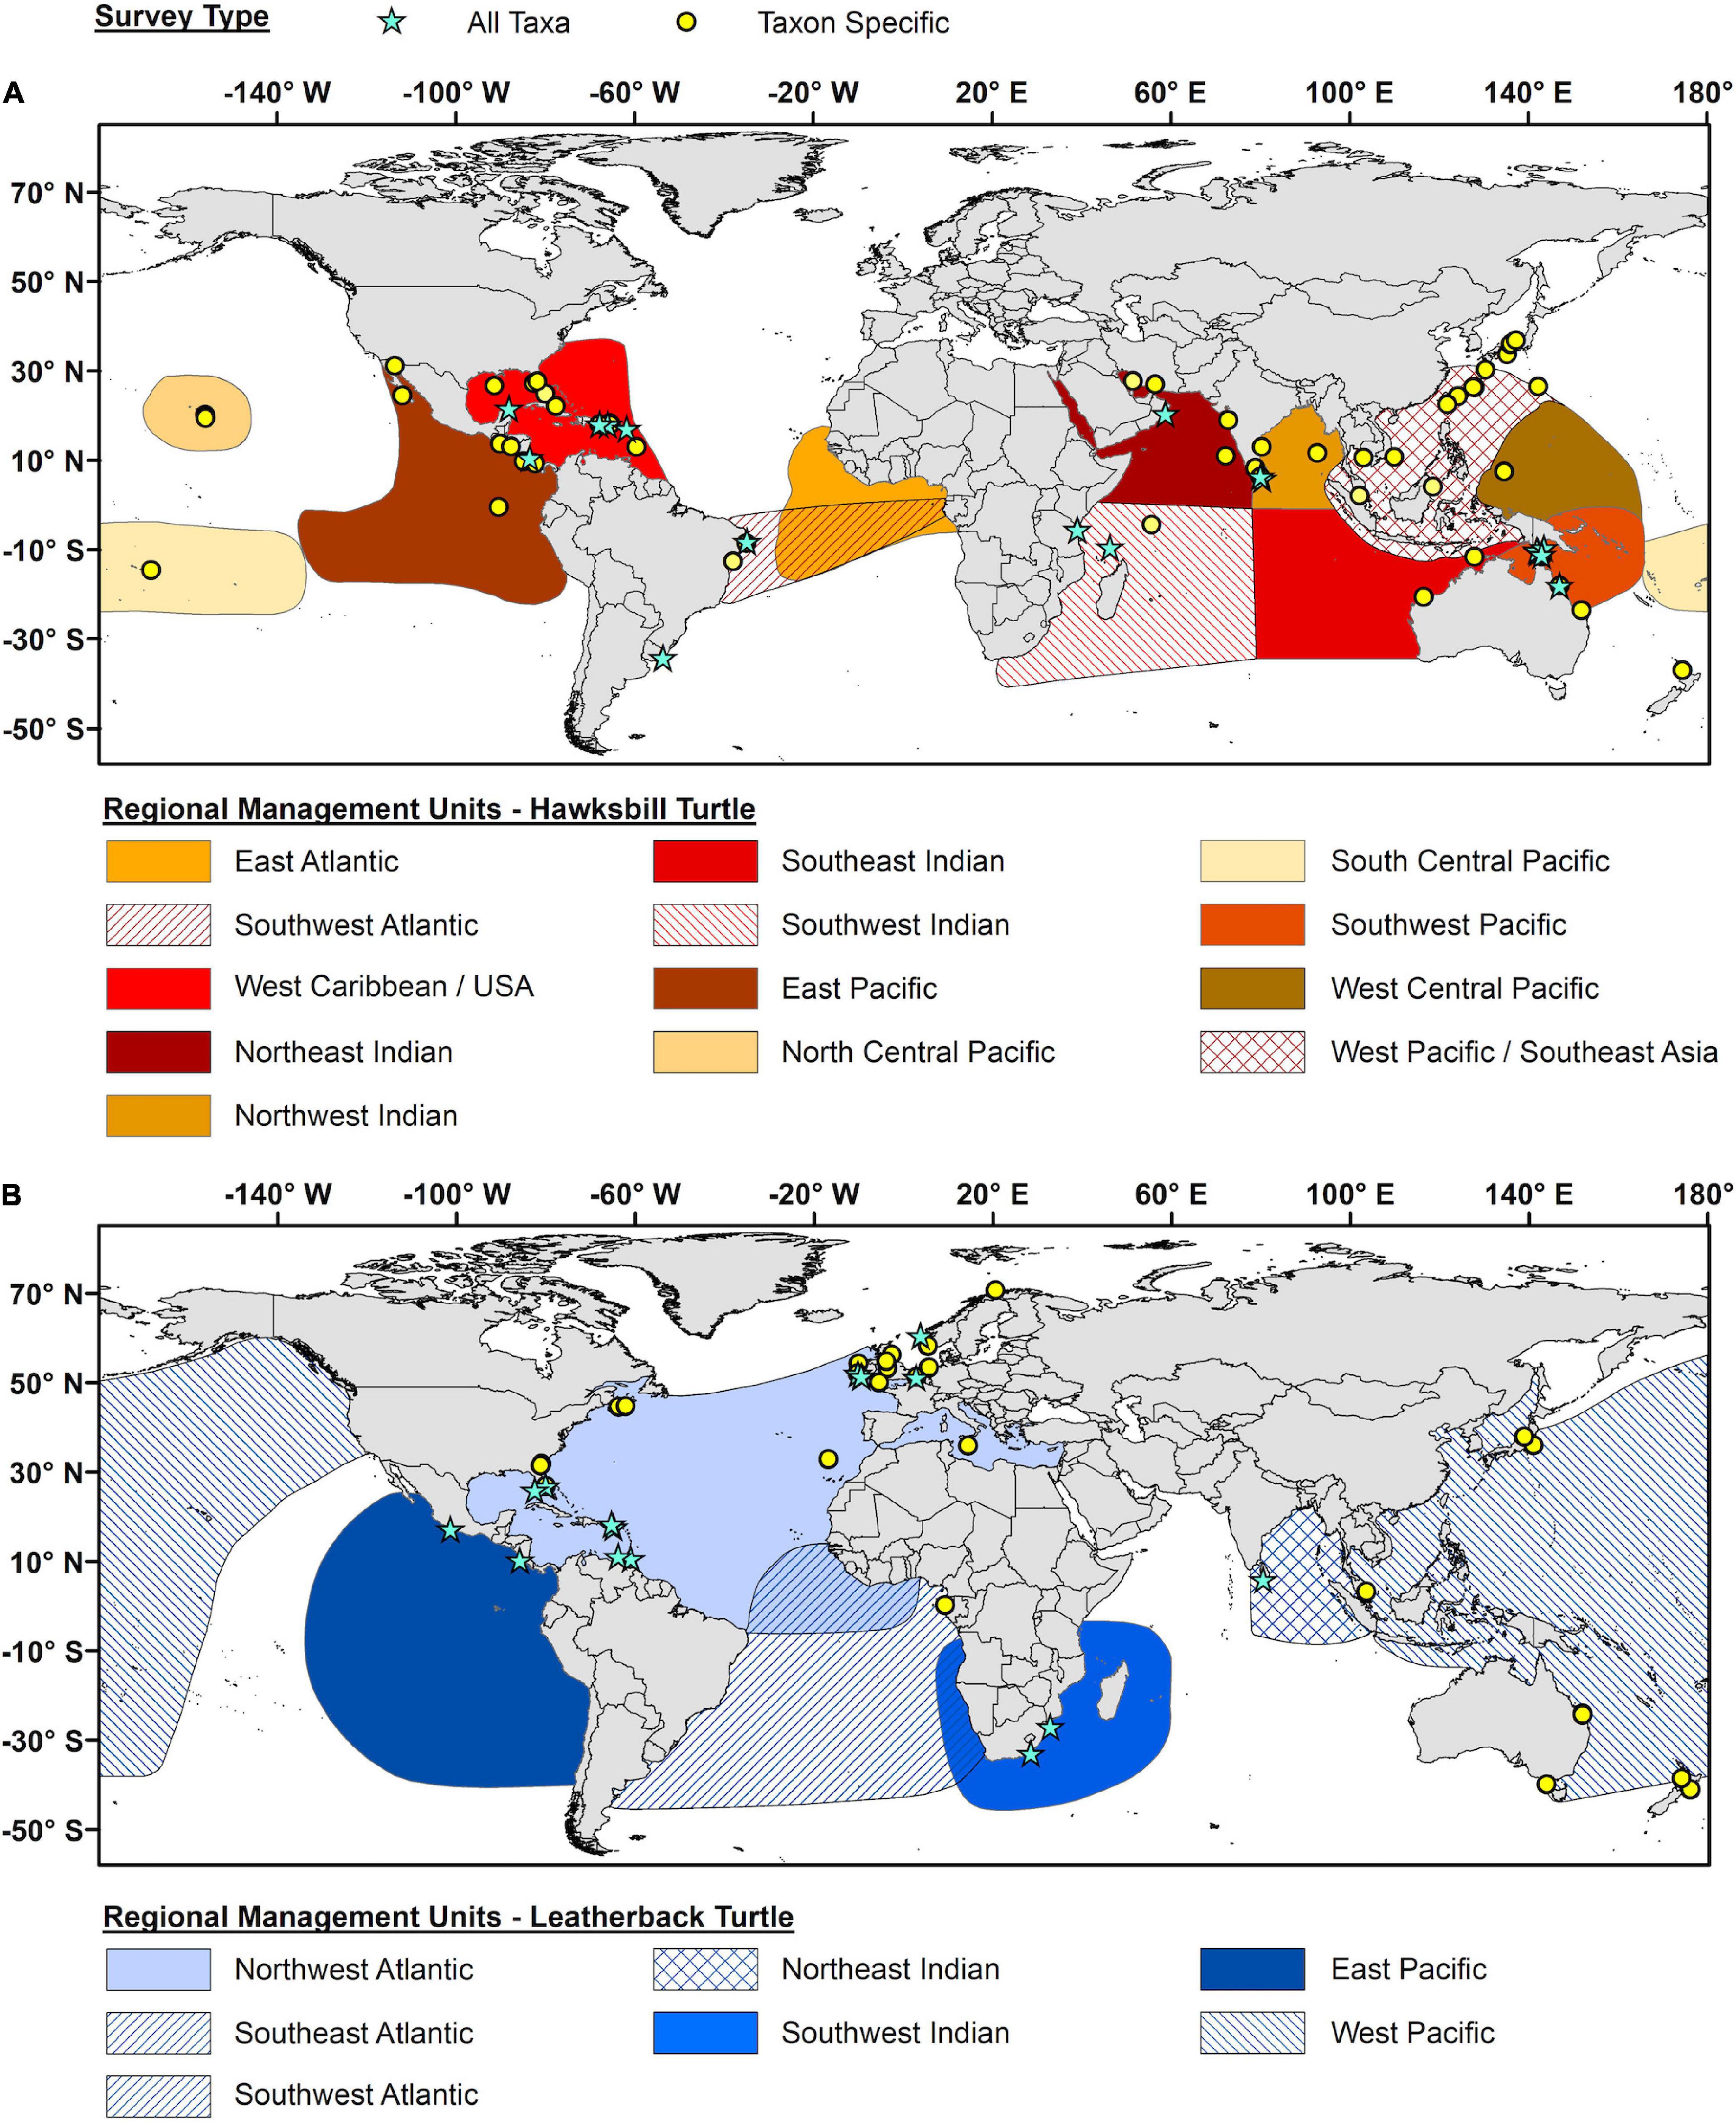
Figure 7. Geographic distribution of all epibiont studies for (A) hawksbill turtles (Eretmochelys imbricata) and (B) leatherback turtles (Dermochelys coriacea). Blue stars represent studies that report on all potential taxa (All Taxa), while yellow circles represent studies that only focus on specific taxa (Taxa Specific). The geographic outlines for each Regional Management Unit as represented by differentially colored polygons (based on Wallace et al., 2010).
For Kemp’s and olive ridleys, by far the greatest concentration of both Taxon Specific and All Taxa surveys were in the East Pacific olive ridley RMU (Figure 8A), representing 81% of the All Taxa surveys and 64% of the Taxon Specific surveys for ridleys. Kemp’s ridley studies in the Gulf of Mexico and Northwest Atlantic were few with only seven studies but were balanced between Taxon Specific and All Taxa surveys. For flatbacks, only four studies have been conducted (Figure 8B): one All Taxa survey in the Southeast Indian RMU, and one All Taxa and two Taxon Specific surveys in the Southwest Pacific RMU.

Figure 8. Geographic distribution of all epibiont studies for (A) Kemp’s and olive ridley turtles (Lepidochelys kempii and L. olivacea) and (B) flatback turtles (Natator depressus). Blue stars represent studies that report on all potential taxa (All Taxa), while yellow circles represent studies that only focus on specific taxa (Taxa Specific. The geographic outlines for each Regional Management Unit as represented by differentially colored polygons (based on Wallace et al., 2010).
Discussion
The first studies documenting epibionts of sea turtles were conducted over a century ago and since then data available on sea turtle epibiosis has grown extensively. To utilize this growing body of knowledge, we developed a global database of sea turtle-epibiont interactions. We compiled data from 304 studies, spanning both published scientific articles and gray literature, and explored global patterns in epibiont diversity. In doing so, we synthesized over 100 years of sea turtle epibiont research. We demonstrate that additional epibiont diversity remains to be documented, even within the most well-studied sea turtle species and populations, and we identify biases in sampling effort that may reveal additional diversity in future studies.
Which Sea Turtle Species Hosts the Greatest Epibiont Diversity?
Based on the current literature and confirmed via the rarefaction analyses, loggerhead turtles host the most diverse epibiont communities both in terms of total taxonomic richness and number of higher taxa represented (262 taxa from 21 Higher Taxon categories). This level of epibiont diversity is only rivaled by hawksbill turtles (20 Higher Taxon categories). Nevertheless, the total taxonomic richness reported for hawksbills (87 taxa) is still far lower than loggerheads. As for the other five sea turtle species, the richness and diversity of their epibionts communities were considerably lower than that of loggerheads and somewhat lower than that of hawksbills, especially for leatherbacks, Kemp’s ridleys, and flatbacks. Differences in the taxonomic richness and diversity among the epibiont communities of different sea turtles may be attributed to several, non-mutually exclusive factors.
First, because epibiosis necessitates spatial overlap between the ranges of host turtles and their epibionts (Frick and Pfaller, 2013), sea turtle species with wider geographic ranges would theoretically encounter a greater diversity of potential epibionts and thus host greater richness and diversity. Consistent with this hypothesis, Kemp’s ridleys and flatbacks have the smallest geographic ranges of the seven sea turtle species and host the lowest epibiont richness and diversity. However, among the remaining sea turtle species, this hypothesis is not consistent with the observed patterns. Leatherbacks have the widest geographic range, spanning all tropical to sub-polar oceans of the world (James et al., 2006), yet host comparably low epibiont richness and diversity. In contrast, loggerheads, greens, hawksbills, and olive ridleys have comparable circumglobal ranges, yet exhibit considerable differences in epibiont richness and diversity. Moreover, for example, North Pacific loggerheads have a vastly wider geographic range than Mediterranean loggerheads yet host lower epibiont richness and diversity. Clearly, geographic range size is not the only factor driving differences in epibiont richness and diversity among sea turtle species or populations.
Second, sea turtles occupying a wider array of habitats during their life cycle may overlap with a greater diversity of potential epibionts and thus host greater richness and diversity. In support of this hypothesis, loggerheads, which host the greatest epibiont diversity, not only exhibit an extended oceanic developmental phase (Bolten, 2003; Avens et al., 2013) but are also well known for a behavioral polymorphism in which some individuals transition to neritic foraging areas while other remain oceanic (Hatase et al., 2010; Rees et al., 2010; Vander Zanden et al., 2010). In contrast, greens and hawksbills exhibit a more truncated oceanic developmental phase and primarily inhabit neritic habitats (Vander Zanden et al., 2013; Martinez-Estevez et al., 2021), while leatherbacks and olive ridleys occupy primarily oceanic habitats (Fossette et al., 2010; Pikesley et al., 2013). Moreover, not all habitats will contain equally diverse communities of potential epibionts. For example, the coastal hard-bottom and coral reef habitats occupied by loggerheads and hawksbills not only support high invertebrate biodiversity but also exhibit intense competition for space, both of which may contribute to greater epibiont diversity in these habitats. In contrast, the oceanic habitats occupied by leatherbacks and olive ridleys and the coastal seagrass meadows occupied by green turtles support lower biodiversity and less intense competition for space. As such, our results support the idea that the number and type of habitats occupied by sea turtles, rather than the size of their geographic range, is likely a more important factor driving differences in epibiont richness and diversity.
Third, sea turtles presenting more suitable conditions for epibiont settlement would be more likely to host greater epibiont richness and diversity. Especially for sessile epibionts, the surface properties (e.g., chemical signals, rugosity, and wettability) of the skin and carapace of different sea turtle species may provide more (or less) favorable conditions for larval attachment and subsequent growth. Leatherbacks, in particular, have uniquely smooth skin covering their carapace and this may provide a less favorable substrate for epibionts than the rigid keratin covering the carapace of “hard-shelled” sea turtles (Wyld and Brush, 1983). This could be one of the primary reasons why leatherbacks host lower epibiont richness and diversity than other sea turtles. Among “hard-shelled” sea turtles, the thick, overlapping scutes of hawksbills and characteristically “rough” scutes of loggerheads may facilitate epibiont attachment and persistence to a greater degree than the “smooth” scutes of green and ridley turtles and the thin, waxy scutes of flatbacks. Moreover, the presence of certain sessile epibionts may also provide settlement cues for other epibionts, including many motile forms (e.g., Arthropoda – Malacostraca). Sea turtles that provide favorable conditions for these “pioneer” species may develop more diverse epibiont communities that begin to resemble the faunal assemblages found in the surrounding environment (e.g., nesting loggerheads in the Northwest Atlantic RMU; Frick et al., 1998). Many of these hypotheses have yet to tested empirically but are likely important biological factors driving differences in epibiont richness and diversity.
Overall, it is unlikely that one single factor that explains why some sea turtles host greater epibiont richness and diversity than others. Instead, a complex suite of factors including geographic range, habitat use and behavior, surface properties, and likely others we have not discussed here, collectively drive the observed patterns. To evaluate the relative importance of various factors, we recommend more detailed comparisons between the epibiont communities of turtles from (1) different RMUs of the same species and (2) different species with overlapping RMUs. Current data may be sufficient to compare some RMUs (e.g., Northwest Atlantic, Mediterranean, and North Pacific loggerhead RMUs). However, for most other RMUs, the acquisition of more data is needed to make such comparisons.
Does the Current Literature Fully Encompass the Taxonomic Richness of Sea Turtle Epibionts?
Despite over 100 years of research describing the epibiont diversity of sea turtles, the current literature has not yet fully encompassed the taxonomic richness of most sea turtle species (Figure 3) or even three well-studied loggerhead RMUs (Figure 4). Rarefaction analyses indicate that the rate at which taxonomic richness has increased with additional sampling effort (number of studies) has not plateaued for any species or RMU, except leatherbacks.
For the “hard-shelled” or Cheloniid sea turtles, additional studies are expected to continue to reveal more undiscovered taxonomic richness in all species and regions. That said, some species are projected to be greater sources of additional richness than others. Green turtles, which have already been included in over 100 studies, host relatively modest epibiont diversity, and appear to be approaching a plateau in taxonomic richness around 70 taxa globally. Conversely, the taxonomic richness of hawksbill and olive ridley turtles, which have received comparably less attention than green turtles, are projected to almost double after 150 studies, adding an estimated 61 and 50 new epibiont taxa, respectively. Even within the most well-studied sea turtle RMUs, like Northwest Atlantic and Mediterranean loggerheads, dozens of new epibiont taxa are expected to be found with additional sampling effort. These patterns suggest that addressing the knowledge gaps identified in this study (see below), as well as conducting further sampling in well-studied RMUs, will both be productive and interesting areas of future research.
Epibiont research on leatherbacks has appeared to reach a plateau in taxonomic richness: only 16 taxa are projected after 150 studies, only one higher than currently described. While there are still sampling gaps for leatherbacks in terms of life stage, habitat type, and geography (see below), their oceanic lifestyle and inhospitable surface properties (i.e., leathery skin) have likely constrained the diversity of their epibiont communities to a limited number and type of taxa. Indeed, the epibionts of leatherbacks tend to either be oceanic/pelagic specialists or taxa found only on sea turtles, including two species of barnacle (Platylepas coriacea and Stomatolepas dermochelys) that are essentially exclusive to leatherbacks (Zardus, 2021; this study). Future studies on leatherbacks are therefore unlikely to reveal additional undocumented diversity.
What Knowledge Gaps in Life Stage and Habitat Type Were Identified?
As with many aspects of sea turtle biology, the relative ease of accessing adult female turtles on nesting beaches has created biases in epibiont research as well. Although nesting females represent a relatively small proportion of the total individuals in any sea turtle population (Heppell et al., 2003), the majority of epibiont studies that report life stage and/or habitat for leatherbacks, olive ridleys, and flatbacks come from adult turtles (>80% of studies) and nesting beaches (>50%). While approximately half of epibiont studies that report life stage for loggerheads, greens, and hawksbills come from adult turtles, there is a better balance of studies between nesting beaches and neritic habitats for loggerheads and hawksbills and an emphasis toward neritic habitats for green turtles. Only Kemp’s ridleys have yet to be surveyed for epibionts on nesting beaches. While nesting beaches provide an excellent opportunity to initiate epibiont research in many understudied RMUs, the full richness and diversity of epibionts in those RMUs will not be discovered until in-water studies (both neritic and oceanic) are also conducted.
Relative to their abundance, juvenile turtles have received considerably less attention than adult turtles, especially for leatherbacks and olive ridleys. Similarly, the number of non-breeding turtles inhabiting neritic and oceanic foraging areas is always far greater than the number of breeding females (Heppell et al., 2003), yet the percentage of epibiont studies conducted at in-water sites only exceeds that of nesting beaches for green turtles. The difficulty of sampling turtles in oceanic habitats is evident from the relatively low percentages of epibiont studies conducted in these habitats. Nevertheless, the turtle species that spend more time in oceanic habitats (leatherbacks, olive ridleys, and, to a lesser extent, loggerheads) tend to have proportionately more epibiont studies in those habitats (11–17%) than the turtle species that have a truncated oceanic stage (hawksbill and green turtles; 2 and 6%, respectively). Epibiont studies on Kemp’s ridleys and flatbacks were too few to assess biases in life stage and habitat.
Two issues regarding life stage and habitat type emerged from our assessment of the sea turtle epibiont literature. First, a significant percentage of studies that report sea turtle epibionts did not indicate the life stage (48%) or habitat type (37%) of the sampled turtles (Figure 5). We strongly encourage researchers interested in reporting epibionts from sea turtles to also collect and provide these important pieces of metadata. Efforts to gain insights from the epibionts of specific turtles and understand global patterns in sea turtle epibiosis require these important data. Second, excluding Kemp’s ridleys and flatbacks, between 12 and 20% of the studies that report habitat type came from stranded/dead turtles. Because stranded and/or dead turtles may acquire epibiont taxa after their debilitation or death, their epibiont communities may not be characteristic of the surrounding population of healthy turtles. Instead, the processes involved in the development of their epibiont communities may be quite different. For this reason, inferences gleaned from epibiont taxa found on stranded/dead should be made with caution.
What Knowledge Gaps Among Regional Management Units Were Identified?
Because sea turtle RMUs are defined by their shared geography, critical habitats, and evolutionary trajectory (Wallace et al., 2010), individual RMUs should also be considered the basic unit of sampling for epibiont research. Indeed, we demonstrated that epibiont communities vary dramatically not only between sea turtle species but also between conspecific RMUs. Developing a holistic checklist of sea turtle epibionts on a global scale would therefore require sampling turtles from all RMUs.
When initially assessing the sea turtle epibiont literature for knowledge gaps, it was evident that the two turtle species with the smallest geographic ranges and fewest RMUs were also the most understudied. Kemp’s ridleys and flatbacks have been the subjects of seven and four epibiont studies, including just three and two All Taxa studies, respectively. Compared to other turtle species, far more sampling effort would be needed to fully describe the epibiont communities of these hosts. However, when comparing among RMUs, the one global RMU of Kemp’s ridleys (Northwest Atlantic) and the two global RMUs for flatbacks (Southeast Indian and Southwest Pacific) have in fact received more attention than many RMUs for the other “well-studied” sea turtle species. Most notably, the following RMUs have never been the focus of a single epibiont study: Northeast Indian loggerheads, Northeast Indian greens, and East Atlantic hawksbills. Moreover, unlike the RMUs for Kemp’s ridley and flatback turtles, many RMUs for the other turtle species have also never been the focus of an All Taxa study (e.g., Northwest Indian loggerheads, West Pacific and Southwest Atlantic leatherbacks, and many RMUs for hawksbills, greens, and olive ridleys). Because individual RMUs should be considered the basic unit for epibiont sampling, future epibiont research should focus not only on understudied host species but also on understudied RMUs within well-studied species.
Based on the geographic distribution of epibiont studies as well as their study types (All Taxa versus Taxon Specific), we have identified the most prominent knowledge gaps among RMUs for each turtle species to help guide future research:
• Loggerheads: eastern portion of the South Pacific RMU (Peru and Chile), Northeast Indian RMU (India, Bangladesh, and Myanmar), and Southeast RMU (NW Australia and southwestern Indonesia), as well as the globally important Northwest Indian RMU, which includes Oman and countries surrounding the Red Sea, Persian Gulf, and gulfs of Oman and Aden.
• Greens: South Caribbean Atlantic RMU (northern South America and Lesser Antilles), Northeast Indian RMU (Bangladesh, Myanmar, and eastern Indonesia), Southeast Indian RMU (northern Australia and south-central Indonesia), West Central Pacific RMU (Philippines and west Micronesia), and South Central Pacific RMU (eastern Melanesia and central Polynesia).
• Hawksbills: East Atlantic RMU (Mauritania to Angola and into the central South Atlantic), Southeast Indian RMU (Western Australia), West Central Pacific RMU (Micronesia), and South Central Pacific RMU (central Polynesia).
• Leatherbacks: central and eastern portions of the West Pacific RMU, the southern portion of the East Pacific RMU (western South America), Southeast and Southwest Atlantic RMUs (eastern South America to western Africa), and Northeast Indian RMU (India, Bangladesh, Myanmar, and eastern Indonesia).
• Olive ridleys: excluding the East Pacific RMU, all five remaining RMUs (West Atlantic, East Atlantic, West Indian, Northeast Indian, and West Pacific).
• Kemp’s ridleys: northern and eastern Gulf of Mexico and southeast Atlantic coast of United States (North Carolina thru Florida).
• Flatbacks: western and northern portions of the Southeast Indian RMU (northern Western Australia and southwestern Papua) and the western and southern portion of the Southwest Pacific RMU (Gulf of Carpentaria and central and southern Queensland, as well as southeastern Papua New Guinea).
Future Directions
We built this global database from over 100 years of sea turtle epibiont research and made the first effort to use it by analyzing broad-scale patterns and identifying knowledge gaps. However, the capacity for the information amassed in this database to answer additional questions in this field is extensive. Our hope is that this database will serve as a foundational platform on which a novel array of hypothesis-driven questions can be tested with respect the taxonomic diversity, ecological complexity, and evolutionary origins of sea turtle epibiosis.
Research questions that we consider important for promoting scientific progress in the field of sea turtle epibiosis include but are not limited to:
(1) How does geographic range and habitat use influence the epibiont richness and diversity of different sea turtle species and RMUs?
(2) How do turtle behaviors (e.g., migrating, diving, mating, nesting, etc.) and habitats influence epibiont diversity, as well as the frequency and intensity of different epibiont taxa?
(3) How do surface properties and settlement cues affect the epibiont communities of different turtles?
(4) How does the diversity of meio- and micro-epibionts compare and/or contrast with macro-epibiont communities?
(5) What characteristics make certain “free living” taxa common sea turtle epibionts?
(6) How do the geographic ranges of “free living” populations of common sea turtle epibionts correspond with that of their hosts?
(7) Are obligate epibiont taxa more abundant than facultative taxa on certain turtle species?
(8) Does the frequency and intensity of “pioneer” epibiont taxa facilitate higher species richness?
(9) Which epibiont taxa/communities are best suited to serve as ecological indicators of the behaviors and habitat preferences of their turtle hosts?
(10) How do local oceanographic and climatic factors influence epibiont diversity?
(11) Can epibiont communities be used as indicators of the health status of sea turtles and/or sea turtle populations?
(12) Are certain obligate epibiont taxa of comparable conservation concern as their endangered sea turtle hosts?
Data Availability Statement
Publicly available datasets were analyzed in this study. This data can be found here: NR and JP (2022) Data from: Sea turtle epibiosis: global patterns and knowledge gaps. Dryad Digital Repository (http://doi.org/10.5061/dryad.x3ffbg7m8).
Author Contributions
Both authors contributed to the article and approved the submitted version.
Conflict of Interest
The authors declare that the research was conducted in the absence of any commercial or financial relationships that could be construed as a potential conflict of interest.
Publisher’s Note
All claims expressed in this article are solely those of the authors and do not necessarily represent those of their affiliated organizations, or those of the publisher, the editors and the reviewers. Any product that may be evaluated in this article, or claim that may be made by its manufacturer, is not guaranteed or endorsed by the publisher.
Acknowledgments
A sincere thank you to the thousands of scientists and volunteers who have published on sea turtle epibiosis. A special thank you to Alex Smith and Abi Ferrazzini for their help in collating data and Lourdes Rojas for tracking down many difficult-to-access articles. NR is supported by Severo Ochoa post-doctoral fellowship granted by the Institut de Ciències del Mar.
Supplementary Material
The Supplementary Material for this article can be found online at: https://www.frontiersin.org/articles/10.3389/fevo.2022.844021/full#supplementary-material
Footnotes
References
Avens, L., Goshe, L. R., Pajuelo, M., Bjorndal, K. A., MacDonald, B. D., Lemons, G. E., et al. (2013). Complementary skeletochronology and stable isotope analyses offer new insight into juvenile loggerhead sea turtle oceanic stage duration and growth dynamics. Mar. Ecol. Prog. Ser. 491, 235–251. doi: 10.3354/meps10454
Bolten, A. B. (2003). “Variation in sea turtle life history patterns: neritic vs. oceanic developmental stages,” in The Biology of Sea Turtles, Vol. 2, eds P. L. Lutz, J. A. Musick, and J. Wyneken (Boca Raton, FL: CRC Press), 243–257. doi: 10.1201/9781420040807.ch9
Casale, P., Freggi, D., Basso, R., and Argano, R. (2004). Epibiotic barnacles and crabs as indicators of Caretta caretta distribution and movements in the Mediterranean Sea. J. Mar. Biol. Assoc. U.K. 84, 1005–1006. doi: 10.1017/S0025315404010318h
Colwell, R. K., Chao, A., Gotelli, N. J., Lin, S.-Y., Mao, C. X., Chazdon, R. L., et al. (2012). Models and estimators linking individual based and sample-based rarefaction, extrapolation, and comparison of assemblages. J. Plant Ecol. 5, 3–21. doi: 10.1093/jpe/rtr044
Corrêa, G. V., Ingels, J., Valdes, Y. V., Fonseca-Genevois, V. G., Farrapeira, C. M., and Santos, G. A. (2014). Diversity and composition of macro-and meiofaunal carapace epibionts of the hawksbill sea turtle (Eretmochelys imbricata Linnaeus, 1822) in Atlantic waters. Mar. Biodivers. 44, 391–401. doi: 10.1007/s12526-013-0189-9
Crespo-Picazo, J. L., García-Parraga, D., Domènech, F., Tomás, J., Aznar, F. J., Ortega, J., et al. (2017). Parasitic outbreak of the copepod Balaenophilus manatorum in neonate loggerhead sea turtles (Caretta caretta) from a head-starting program. BMC Vet. Res. 13:154. doi: 10.1186/s12917-017-1074-8
Darwin, C. (1851). A Monograph on the Sub-Class Cirripedia, with Figures of All Species. The Lepadidae, or, Pedunculated Cirripedes. London: The Ray Society.
Darwin, C. (1854). A Monograph on the Subclass Cirripedia, with Figures of All the Species. The Balanidae, the Verrucidae, etc. London: The Ray Society.
Domènech, F., Tomás, J., Crespo-Picazo, J. L., García-Párraga, D., Raga, J. A., and Aznar, F. J. (2017). To swim or not to swim: potential transmission of Balaenophilus manatorum (Copepoda: Harpacticoida) in marine turtles. PLoS One 12:e0170789. doi: 10.1371/journal.pone.0170789
Fossette, S., Girard, C., Lopez-Mendilaharsu, M., Miller, P., Domingo, A., Evans, D., et al. (2010). Atlantic leatherback migratory paths and temporary residence areas. PLoS One 5:e13908. doi: 10.1371/journal.pone.0013908
Frick, M. G., and Pfaller, J. B. (2013). “Sea turtle epibiosis,” in The Biology of Sea Turtles, Vol. 3, eds J. Wyneken, K. J. Lohmann, and J. A. Musick (Boca Raton, FL: CRC Press), 399–426.
Frick, M. G., Williams, K. L., and Robinson, M. (1998). Epibionts associated with nesting loggerhead sea turtles (Caretta caretta) in Georgia, USA. Herpetol. Rev. 29, 211–214.
Greenblatt, R. J., Work, T. M., Balazs, G. H., Sutton, C. A., Casey, R. N., and Casey, J. W. (2004). The Ozobranchus leech is a candidate mechanical vector for the fibropapilloma-associated turtle herpesvirus found latently infecting skin tumors on Hawaiian green turtles (Chelonia mydas). Virology 321, 101–110. doi: 10.1016/j.virol.2003.12.026
Harder, T. (2009). “Marine epibiosis: concepts, ecological consequences and host defence,” in Marine and Industrial Biofouling. Springer Series on Biofilms, Vol. 4, eds H.-C. Flemming, P. Sriyutha Murthy, R. Venkatesan, and K. E. Cooksey (Berlin: Springer), 219–231. doi: 10.1007/978-3-540-69796-1_12
Hatase, H., Omuta, K., and Tsukamoto, K. (2010). Oceanic residents, neritic migrants: a possible mechanism underlying foraging dichotomy in adult female loggerhead turtles (Caretta caretta). Mar. Biol. 157, 1337–1342. doi: 10.1007/s00227-010-1413-9
Heppell, S. S., Snover, M. L., and Crowder, L. B. (2003). “Sea turtle population ecology,” in The Biology of Sea Turtles, Vol. 2, eds P. L. Lutz, J. A. Musick, and J. Wyneken (Boca Raton, FL: CRC Press), 275–305. doi: 10.1201/9781420040807.ch11
Ingels, J., Valdes, Y., Pontes, L. P., Silva, A. C., Neres, P. F., Corrêa, G. V., et al. (2020). Meiofauna life on loggerhead sea turtles-diversely structured abundance and biodiversity hotspots that challenge the meiofauna paradox. Diversity 12:203. doi: 10.3390/d12050203
James, M. C., Davenport, J., and Hays, G. C. (2006). Expanded thermal niche for a diving vertebrate: a leatherback turtle diving into near-freezing water. J. Exp. Mar. Biol. Ecol. 335, 221–226. doi: 10.1016/j.jembe.2006.03.013
Köhnk, S., Petros, C., Lomas, C., Riyad, E. M., Shameel, I., Hawlitschek, O., et al. (2021). Stowaways: marine leeches infecting olive Ridley sea turtles entangled in ghost nets in Maldivian waters. Comp. Parasitol. 88, 169–176.
Lazo-Wasem, E. A., Pinou, T., de Niz, A. P., and Feuerstein, A. (2011). Epibionts associated with the nesting marine turtles Lepidochelys olivacea and Chelonia mydas in Jalisco, Mexico: a review and field guide. Bull. Peabody Mus. Nat. Hist. 52, 221–240. doi: 10.3374/014.052.0203
Lazo-Wasem, E. A., Pinou, T., de Niz, A. P., Salgado, M. A., and Schenker, E. (2007). New records of the marine turtle epibiont Balaenophilus umigamecolus (Copepoda: Harpacticoida: Balaenophilidae): new host records and possible implications for marine turtle health. Bull. Peabody Mus. Nat. Hist. 48, 153–156. doi: 10.3374/0079-032x(2007)48[153:nrotmt]2.0.co;2
Martinez-Estevez, L., Amador, J. P. C., Amador, F. C., Zilliacus, K. M., Pacheco, A. M., Seminoff, J. A., et al. (2021). Spatial ecology of hawksbill sea turtles (Eretmochelys imbricata) in foraging habitats of the Gulf of California, Mexico. Glob. Ecol. Conserv. 27:e01540. doi: 10.1016/j.gecco.2021.e01540
Nolte, C. R., Nel, R., and Pfaff, M. C. (2020). Determining body condition of nesting loggerhead sea turtles (Caretta caretta) in the south-west Indian Ocean. J. Mar. Biol. Assoc. U.K. 100, 291–299. doi: 10.1017/S0025315420000107
Perrault, J. R., Muller, E. M., Emily, R., and Rotjan, R. D. (2015). Presence of the northern star coral (Astrangia poculata) as an epibiont on the carapace of a nesting loggerhead turtle (Caretta caretta) in the western Gulf of Mexico. Reef Encount. 30:46.
Pfaller, J. B., Alfaro-Shigueto, J., Balazs, G. H., Ishihara, T., Kopitsky, K., Mangel, J. C., et al. (2014). Hitchhikers reveal cryptic host behavior: new insights from the association between Planes major and sea turtles in the Pacific Ocean. Mar. Biol. 161, 2167–2178. doi: 10.1007/s00227-014-2498-3
Pfaller, J. B., and Robinson, N. J. (2022). Data from: sea turtle symbiosis: global patterns and knowledge gaps. Dryad Digit. Repository doi: 10.5061/dryad.x3ffbg7m8
Pikesley, S. K., Maxwell, S. M., Pendoley, K., Costa, D. P., Coyne, M. S., Formia, A., et al. (2013). On the front line: integrated habitat mapping for olive ridley sea turtles in the southeast Atlantic. Divers. Distrib. 19, 1518–1530. doi: 10.1111/ddi.12118
Pilsbry, H. A. (1916). The sessile barnacles (Cirripedia) contained in the collections of the U.S. National Museum; including a monograph of the American species. U.S. Natl. Mus. Bull. 93, 1–366.
Pinou, T., Domènech, F., Lazo-Wasem, E. A., Majewska, R., Pfaller, J. B., Zardus, J. D., et al. (2019). Standardizing sea turtle epibiont sampling: outcomes of the epibiont workshop at the 37th International Sea Turtle Symposium. Mar. Turt. Newsl. 157, 22–32.
Pinou, T., Lazo-Wasem, E. A., Dion, K., and Zardus, J. D. (2013). Six degrees of separation in barnacles? Assessing genetic variability in the sea-turtle epibiont Stomatolepas elegans (Costa) among turtles, beaches and oceans. J. Nat. Hist. 47, 2193–2212. doi: 10.1080/00222933.2013.798701
Rees, A. F., Al Saady, S., Broderick, A. C., Coyne, M. S., Papathanasopoulou, N., and Godley, B. J. (2010). Behavioural polymorphism in one of the world’s largest populations of loggerhead sea turtles Caretta caretta. Mar. Ecol. Prog. Ser. 418, 201–212. doi: 10.3354/meps08767
Reich, K. J., Bjorndal, K. A., Frick, M. G., Witherington, B. E., Johnson, C., and Bolten, A. B. (2010). Polymodal foraging in adult female loggerheads (Caretta caretta). Mar. Biol. 157, 113–121. doi: 10.1007/s00227-009-1300-4
Robinson, N. J., Figgener, C., Gatto, C., Lazo-Wasem, E. A., Paladino, F. V., Tomillo, P. S., et al. (2017a). Assessing potential limitations when characterising the epibiota of marine megafauna: effect of gender, sampling location, and inter-annual variation on the epibiont communities of olive ridley sea turtles. J. Exp. Mar. Biol. Ecol. 497, 71–77.
Robinson, N. J., Lazo-Wasem, E. A., Paladino, F. V., Zardus, J. D., and Pinou, T. (2017b). Assortative epibiosis of leatherback, olive ridley and green sea turtles in the Eastern Tropical Pacific. J. Mar. Biol. Assoc. U.K. 97, 1233–1240. doi: 10.1017/S0025315416000734
Robinson, N. J., Majewska, R., Lazo-Wasem, E. A., Nel, R., Paladino, F. V., Rojas, L., et al. (2016). Epibiotic diatoms are universally present on all sea turtle species. PLoS One 11:e0157011. doi: 10.1371/journal.pone.0157011
Ten, S., Pascual, L., Pérez-Gabaldón, M. I., Tomás, J., Domènech, F., and Aznar, F. J. (2019). Epibiotic barnacles of sea turtles as indicators of habitat use and fishery interactions: an analysis of juvenile loggerhead sea turtles, Caretta caretta, in the western Mediterranean. Ecol. Indic. 107:105672. doi: 10.1016/j.ecolind.2019.105672
Vander Zanden, H. B., Arthur, K. E., Bolten, A. B., Popp, B. N., Lagueux, C. J., Harrison, E., et al. (2013). Trophic ecology of a green turtle breeding population. Mar. Ecol. Prog. Ser. 476, 237–249. doi: 10.3354/meps10185
Vander Zanden, H. B., Bjorndal, K. A., Reich, K. J., and Bolten, A. B. (2010). Individual specialists in a generalist population: results from a long-term stable isotope series. Biol. Lett. 6, 711–714. doi: 10.1098/rsbl.2010.0124
Wahl, M. (2009). “Epibiosis,” in Marine Hard Bottom Communities, ed. M. Wahl (Berlin: Springer), 61–72. doi: 10.1007/b76710_4
Wallace, B. P., DiMatteo, A. D., Hurley, B. J., Finkbeiner, E. M., Bolten, A. B., Chaloupka, M. Y., et al. (2010). Regional management units for marine turtles: a novel framework for prioritizing conservation and research across multiple scales. PLoS One 5:e15465. doi: 10.1371/journal.pone.0015465
WoRMS Editorial Board (2021). World Register of Marine Species. Available Online at: https://www.marinespecies.org at VLIZ [accessed December 5, 2021].
Wyld, J. A., and Brush, A. H. (1983). Keratin diversity in the reptilian epidermis. J. Exp. Zool. 225, 387–396. doi: 10.1002/jez.1402250306
Keywords: commensalism, epibiont, parasite, species richness, symbiosis
Citation: Robinson NJ and Pfaller JB (2022) Sea Turtle Epibiosis: Global Patterns and Knowledge Gaps. Front. Ecol. Evol. 10:844021. doi: 10.3389/fevo.2022.844021
Received: 27 December 2021; Accepted: 08 February 2022;
Published: 01 March 2022.
Edited by:
Adrienne M. S. Correa, Rice University, United StatesReviewed by:
Jeroen Ingels, Florida State University, United StatesBenny K. K. Chan, Academia Sinica, Taiwan
Copyright © 2022 Robinson and Pfaller. This is an open-access article distributed under the terms of the Creative Commons Attribution License (CC BY). The use, distribution or reproduction in other forums is permitted, provided the original author(s) and the copyright owner(s) are credited and that the original publication in this journal is cited, in accordance with accepted academic practice. No use, distribution or reproduction is permitted which does not comply with these terms.
*Correspondence: Joseph B. Pfaller, anBmYWxsZXJAdWZsLmVkdQ==
†These authors have contributed equally to this work and share senior authorship