 Marcello Hernández-Blanco
 Monica Moritsch
 Marilyn Manrow
 Leander Raes3
- 1Independent Researcher, San José, Costa Rica
- 2Department of Ecology and Evolutionary Biology, University of California, Santa Cruz, Santa Cruz, CA, United States
- 3International Union for Conservation of Nature, Washington, DC, United States
We modeled the coastal protection and blue carbon ecosystem services provided by the mangroves of the Paz River Basin (El Salvador and Guatemala) using InVEST Coastal Vulnerability and Coastal Blue Carbon Models, with the goal of supporting the Regional Coastal Biodiversity Project of the International Union for the Conservation of Nature, in determining potential priority mangrove areas for conservation and restoration. To quantify the relative coastal protection that mangroves provide, we combined maps of different aspects of vulnerability, including ecological, physical, and social data. We also estimated carbon stocks, net sequestration, and the economic value of carbon sequestration as a service in 2050 and 2100. We then developed a combined index of coastal protection and carbon sequestration services to highlight potential priority conservation and restoration areas for mangroves. We found that in Guatemala the coastal protection service was provided in greater quantity in the province of Moyuta, while in El Salvador this service was the highest in the provinces of San Francisco Menéndez, Jujutla and Acajutla, which also had the greatest total carbon stock. In the Paz River Basin, we estimate there are approximately 1,741 hectares of mangroves that provide the highest coastal protection and carbon sequestration services. Furthermore, we identified 318.9 hectares across both countries where mangroves could potentially be restored.
Introduction
Mangroves provide a wide variety of ecosystem services that benefit society at local and global scales (Millennium Ecosystem Assessment, 2005; Russi et al., 2013). These benefits have proven to have a high economic value, although the majority are not recognized in current markets. For example, Salem and Mercer (2012) provide mean economic values for services such as recreation and tourism ($37,927 ha–1 yr–1), fisheries ($23,613 ha–1 yr–1), coastal protection ($3,116 ha–1 yr–1) and carbon sequestration ($967 ha–1 yr–1), among others. Other studies have estimated the total economic value of mangroves, ranging from $13,819 ha–1 yr–1 (UNEP/GPA, 2003) to $22,526 ha–1 yr–1 (Chong, 2006). The economic value of mangroves from the Gulf of Nicoya in Costa Rica represents 0.16% of the country’s GDP (Hernández-Blanco et al., 2021), demonstrating that conservation and restoration of these ecosystems is key to the livelihoods of coastal communities in developing countries.
Nevertheless, the economic and social value of mangroves is often not recognized, and therefore these ecosystems have been significantly impacted by human activities such as agriculture, aquaculture, forestry, and coastal development (Valiela et al., 2001). As a consequence, 16% of mangroves species are threatened with extinction, where both coasts of Central America are of particular concern (Polidoro et al., 2010). The loss of mangroves has both an ecological impact on the landscape due to the loss of physical structure, as well as a socioeconomic impact due to the loss of benefits provided to local communities (e.g., food, coastal protection) and the global population as a whole (e.g., climate regulation).
Fortunately, stopping and reversing the loss of mangroves has recently gained traction in different local and global development agendas, specially under the nature-based solutions framework. Nature-based solutions are defined as actions to protect, sustainably manage, and restore ecosystems, seek to address societal challenges and promote human wellbeing (Cohen-Shacham et al., 2016). Mangrove conservation and restoration as a nature-based solution has received attention specially to tackle climate change’s dual challenge of reducing greenhouse gases at the same time that society adapts to the unavoidable effects of past emissions. In the Sindh Province of Pakistan, communities have created mangrove management areas where the extraction of fuelwood has been reduced or replaced with solar power and have implemented a campaign to restore 42,000 hectares of mangroves. In Kwale County, Kenya, a community-based mangrove restoration has been growing and replanting mangrove seedlings along the coastline as an adaptation measure to extreme weather events. In Costa Rica, a collaboration led by Conservation International with women from the fishing community of Chira Island in the Gulf of Nicoya have been replanting mangroves and stablishing mangrove nurseries to increase the habitat area of fish species that are of commercial interest, at the same time other ecosystem services are restored (Cohen-Shacham et al., 2016). Finally, in the provinces of Artemisa and Mayabeque of Cuba, a country highly vulnerable to climate change, a mangrove restoration project funded by the Adaptation Fund and implemented by the United Nations Development Program (UNDP) is reforesting mangroves along an 84-km coastline, and at the same time increasing monitoring and control, as well as conducting vulnerability assessments to better understand how climate change is affecting coastal communities (Almeida-Famada et al., 2020).
Moreover, an increasing number of countries is incorporating mangrove conservation and restoration as mitigation actions in their National Determined Contributions (NDC) under the Paris Agreement from the United Nations Framework Convention on Climate Change (UNFCCC). 93% of countries that have submitted NDCs contain at least one marine and/or coastal ecosystem (Herr and Landis, 2016), and 43% of those focused on mangroves (Seddon et al., 2019). Furthermore, Earth Security (2020) found that there are more than 700,000 hectares of mangroves globally with restoration potential, which could capture 380 million tCO2 by 2040. This global restoration of mangroves would require a total investment of US$ $11.1 over a 20-year period (Earth Security, 2020).
A global restoration of ecosystems is the objective of the UN Decade on Ecosystem Restoration 2021–2030, proclaimed in March 2019 under Resolution 73/284, with the objective to prevent, halt and reverse the degradation of ecosystems worldwide. All initiatives within the UN Decade have a dual focus on protecting as well as restoring ecosystems (UNEP, 2020). The restoration of ecosystems and their services at the global level will play an important role in achieving the Sustainable Development Goals of the UN 2030 Agenda for Sustainable Development. A key issue to the success of the Decade will be the promotion of science-based initiatives (Science Task Force for the UN Decade on Ecosystem Restoration, 2021).
This study is part of the research conducted under the Regional Coastal Biodiversity Project (RCBP) of the International Union for the Conservation of Nature (IUCN), focused on the conservation and restoration of coastal and marine ecosystems for the benefit of local communities in high biodiversity areas in Central America, including the lower basin of the Paz River (El Salvador and Guatemala), which is the focus of our analysis. The aim of this study is to provide the RCBP with a first approximation of where conservation and restoration activities could potentially yield the highest provision of ecosystem services. We modeled two ecosystem services, carbon sequestration and coastal protection, and then identified where these services had the highest combined levels.
Methodology
Study Area
The Río Paz Basin has an area of 2,647 km2, of which 1,722 km2 (66%) belongs to Guatemala and 925 km2 (34%) to El Salvador. The total extension of mangroves in the Rio Paz Basin is 57,000 ha (Figure 1). This and other coastal and marine ecosystems of the basin are located along the Pacific coast in the departments of Jutiapa and Santa Rosa in Guatemala, and Sonsonate and Ahuachapan in El Salvador. Coastal communities in El Salvador side are Mestizos, Lenca and Nahua-Pipil, and in Guatemala side are Mayas, Xinka, and Ladinos (IUCN, 2019).
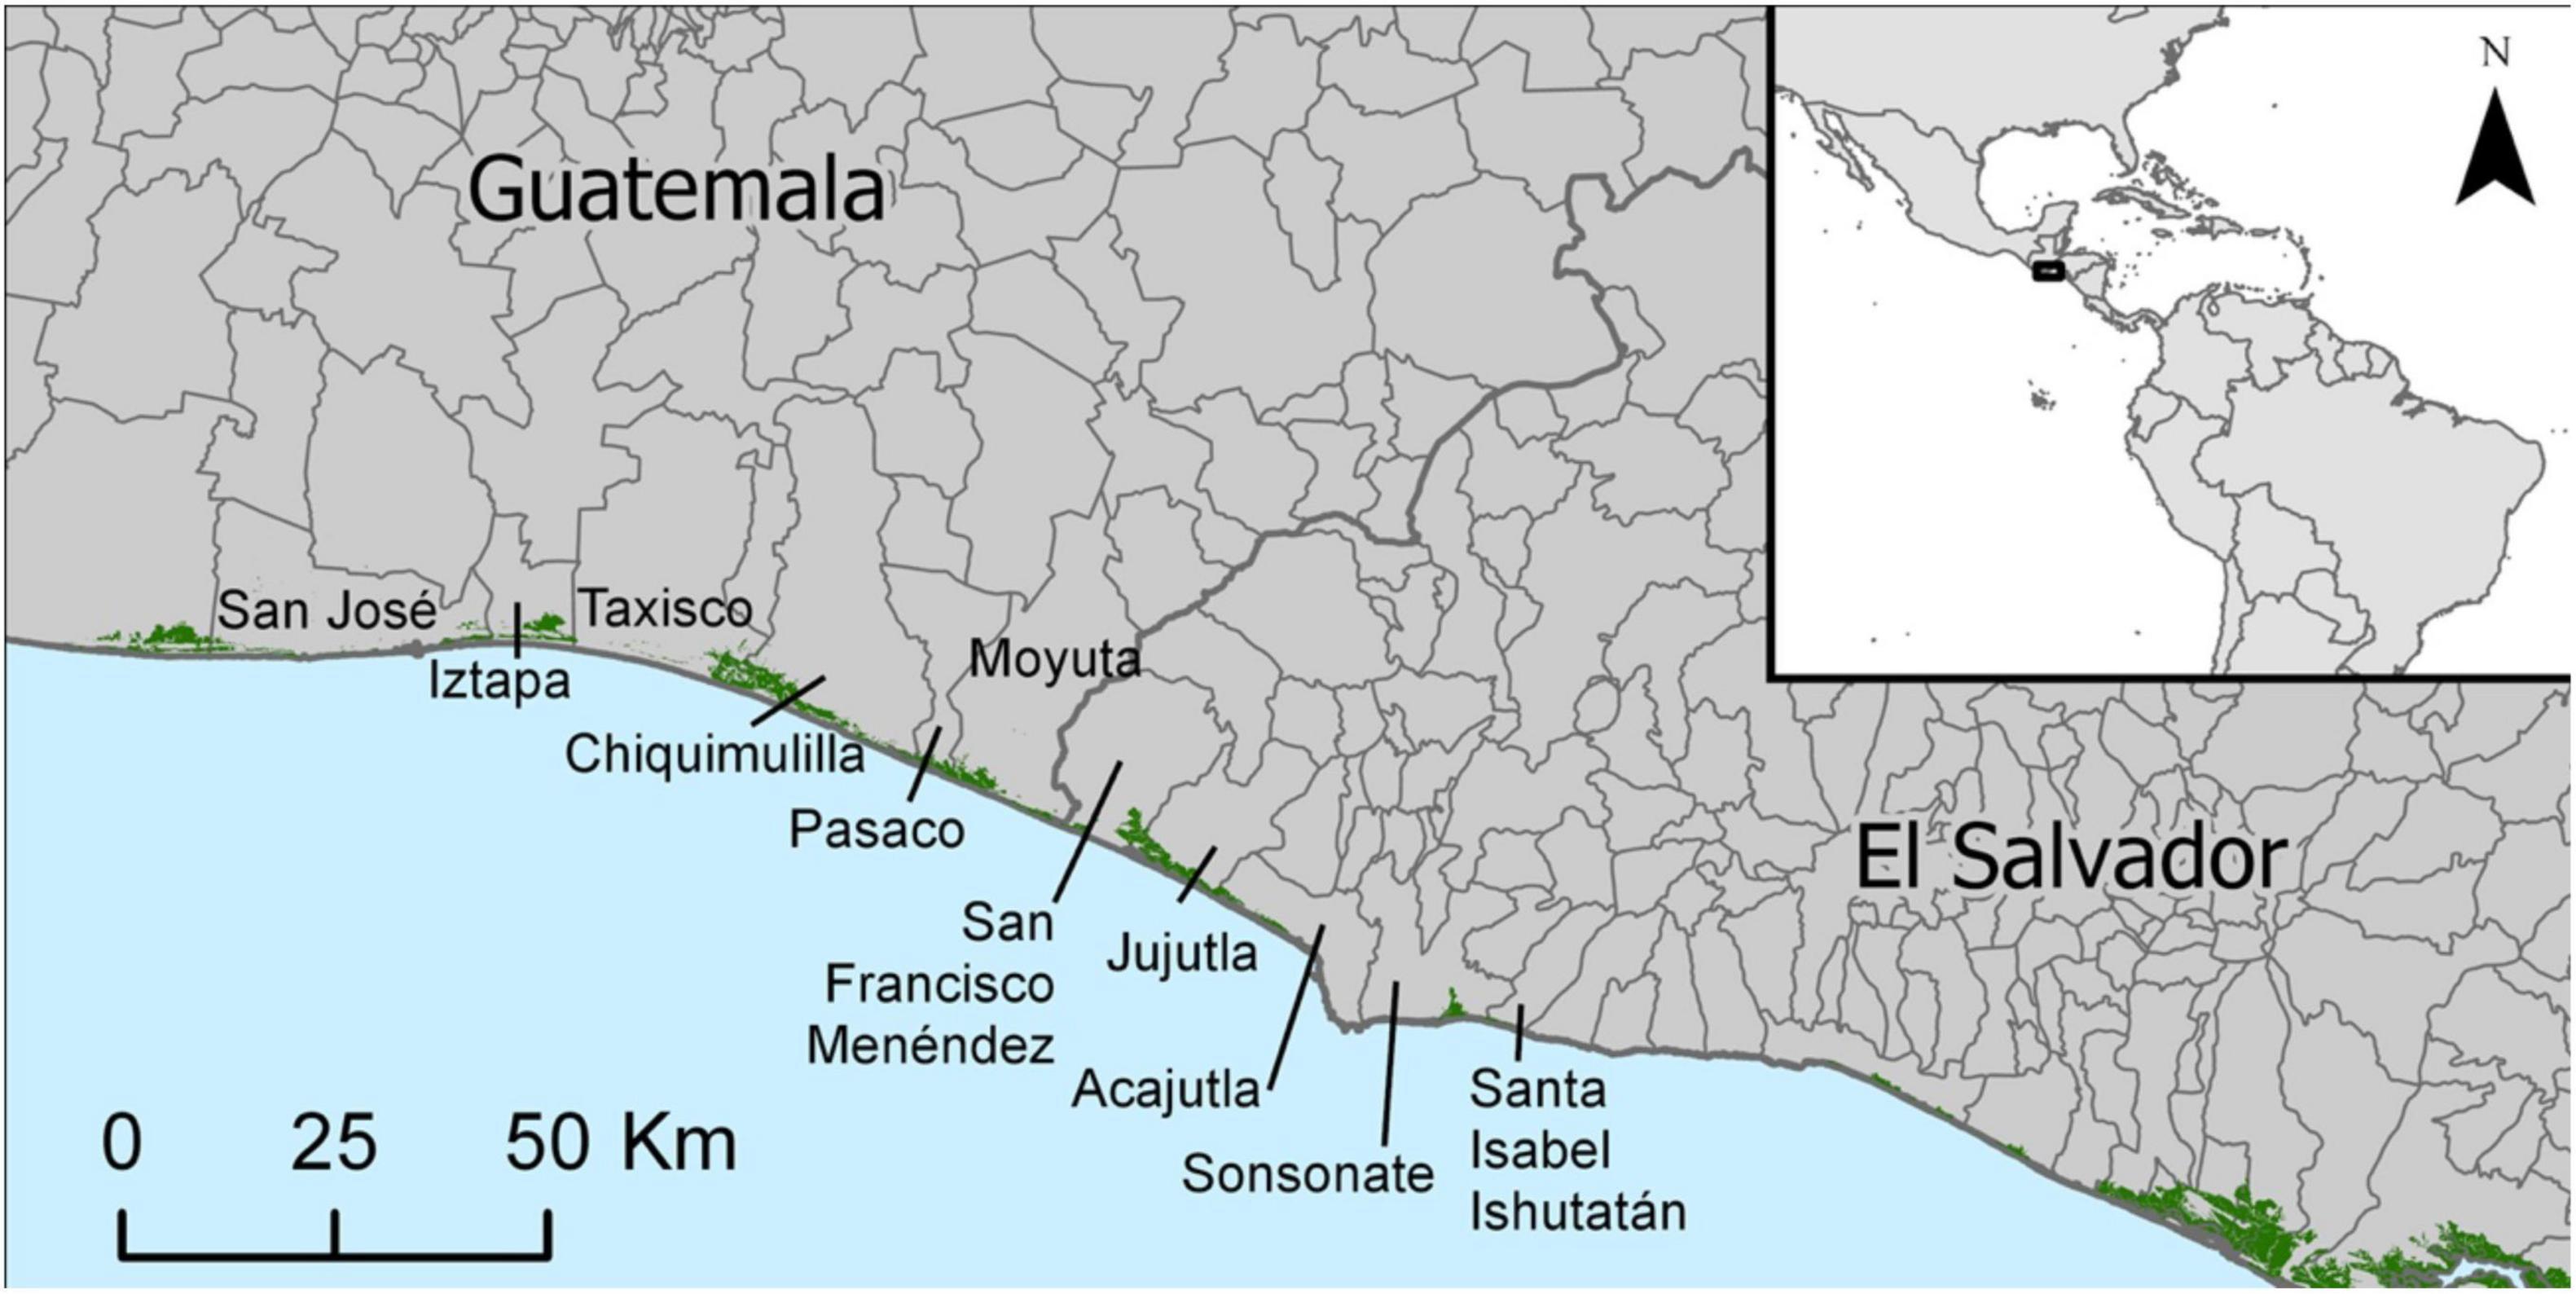
Figure 1. Mangrove cover (green) in the study area.
The principal economic activity in the study area is agriculture. Coffee is the main permanent crop in the upper part of the basin, cattle in the middle part, and staple grains in the basin profile. These activities have had environmental impacts on the local ecosystems, mainly the reduction in fresh water flows due to its unsustainable use for sugar cane and cattle grazing irrigation. Furthermore, climate change is projected to reduce rainfall by more than 15%, as well as increase coastal vulnerability to inundation due to sea level rise and intensifying coastal storms (IUCN, 2019).
Ecosystem Service Modeling: Coastal Protection
Using the Coastal Vulnerability model from the Integrated Valuation of Ecosystem Services and Tradeoffs (InVEST, version 3.6) tool suite (Natural Capital Project; Sharp et al., 2016), we created a relative index of exposure of the coast to erosion and flooding caused by coastal storms and sea level rise. The Coastal Exposure Index ranges from 1 to 5 (5 equals highest exposure) and accounts for the combined influence of shoreline geomorphology, presence of different habitat types, coastal relief, winds, waves, storm surge potential, and trends in sea level rise on relative vulnerability of each shoreline segment to erosion and inundation (Silver et al., 2019). The Coastal Exposure Index can be calculated with and without the presence of coastal and marine habitats. The difference between these two values estimates the relative influence of habitats on protecting the coastline, and it identifies locations where that protection is highest along the coast. To create this index, we first created a mangroves polygon using national data from both countries. Specifically, data from El Salvador was derived from satellite images from Landsat 1998, LIDAR 2014 and cadastral maps (Ministerio de Medio Ambiente y Recursos Naturales [MARN], 2018), and the data from Guatemala was based on satellite images from Landsat TM5 and TM7, AlosPalsar 2010 and Hyperion 2003–2010 (Ministerio de Ambiente y Recursos Naturales [MARN], 2013).
We then produced a polyline layer of shoreline geomorphology (e.g., rocky beach, sandy beach, cliff, etc.) using Google Earth at a resolution that varied from 2.5 to 30 m. Each geomorphology type received a rank from 1 to 5 (5 being highest) depending on its level of susceptibility to erosion. We created a polygon of sea level change using the Reference global mean sea level (GMSL) map produced by SSALTO/DUACS in collaboration with LEGOS and distributed by AVISO+. Due to data constraints in the study area, the rest of inputs for this model used global data from Sharp et al. (2016) (i.e., bathymetry, relief, continental shelf, and population density) and (Tolman, 2009) (i.e., wind and wave exposure). We calculated the Exposure Index with and without mangroves present for every 250 m segment of coastline. The difference between these two values was used to locate where on the coast mangroves offered greatest protection.
Ecosystem Service Modeling: Blue Carbon
We used the InVEST Coastal Blue Carbon Model (version 3.6, Natural Capital Project) to estimate future carbon stock, sequestration, and economic value in 2050 and 2100. The Coastal Blue Carbon Model is a raster-based, spatially explicit model that adds annual carbon sequestration to existing carbon stock across a landscape. The model calculates a monetary value (Net Present Value) for the cumulative C sequestration and applies a discount rate, such that monetary gains in the far future are assigned a lower value than short-term gains. We valued carbon using the Social Cost of Carbon metric, or the average global cost of damages caused by each additional metric ton of carbon dioxide in the atmosphere (Environmental Protection Agency [EPA], 2016). Value schedules for the Social Cost of Carbon were derived from Sharp et al. (2016). 2020 was the start year for all model runs. We estimated economic value of carbon sequestration in 2050 and 2100 using a 3% discount rate and a 5% discount rate. The Social Cost of Carbon is traditionally expressed in terms of cost per Mg CO2 equivalent. We converted this to cost per Mg C by multiplying by a factor of 3.67 (i.e., the ratio of the molecular weight of carbon dioxide to that of carbon). Using the Zonal Statistics as Table tool in ArcMap 10.6.1 (ESRI), we found the per hectare mean and standard deviation of carbon stock (Mg C ha–1) across all map pixels within the study area at 2020, 2050, and 2100. We also found the mean of carbon sequestration (Mg C ha–1) and its Net Present Value (USD ha–1) from 2020 to 2050 and from 2020 to 2100. Standard deviation did not apply to sequestration and net present value because all raster cells had uniform input and output values. Additionally, we calculated the sum of carbon stock, sequestration, and Net Present Value across all mangroves in the study area at each time point.
Data on blue carbon stocks and sequestration rate for mangroves were compiled from existing literature. For carbon stock in soils and in litter (fallen wood), we used data from Cifuentes et al. (2018) in El Salvador and Rodriguez-Hernández (2017) in Guatemala. We combined root carbon stock with soil carbon stock for the purposes of this model. We used rasters of aboveground biomass from Simard et al. (2019) to calculate carbon stock. Aboveground biomass was converted to aboveground carbon stock by multiplying by a factor of 0.475 (Hamilton and Friess, 2018). Where our mangrove footprint did not overlap with the aboveground biomass rasters, we used data from Cifuentes et al. (2018) in El Salvador and Rodriguez-Hernández (2017) in Guatemala to calculate average biomass carbon stocks. We used a uniform carbon sequestration rate across both countries, which represented the best available data for this study area (Murray et al., 2010; Maldonado and Zarate-Barrera, 2015). This was an ecosystem-wide sequestration rate combining estimated annual sequestration in mangrove soils and biomass (Table 1).
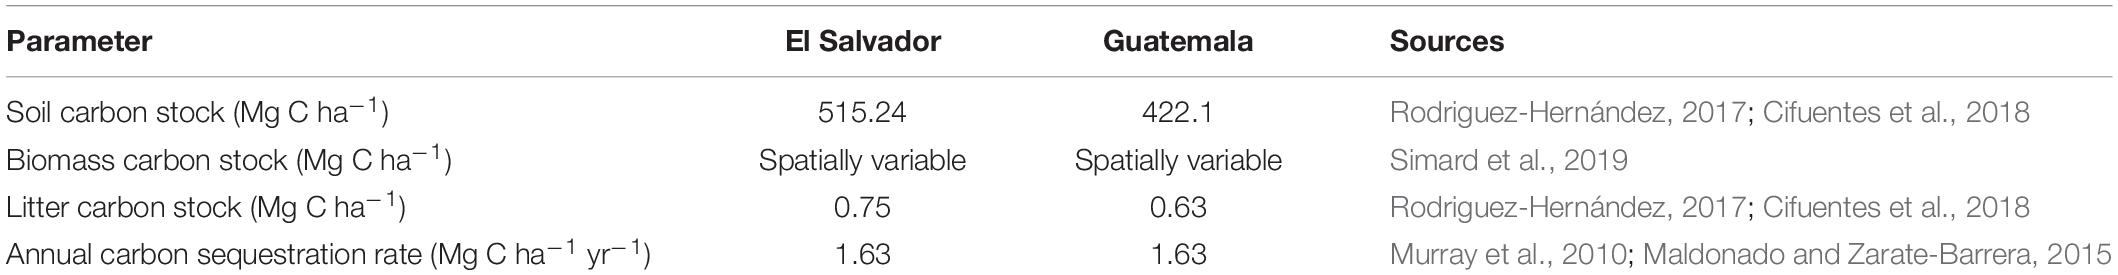
Table 1. Parameters used for the InVEST Blue Carbon Model.
Identifying Potential Mangrove Restoration Areas With High Service Provision
Finally, we identified potential priority areas for conservation and restoration based on the two ecosystem services (i.e., areas where mangroves provided the highest combined amount of benefits). To create the restoration priority map, we used data on mangrove extent for 1996–2016 from Global Mangrove Watch (Bunting et al., 2018). Areas where mangroves had been present in 1996–2015 but were no longer there in 2016 were considered locations for potential mangrove restoration. We excluded any areas that had been converted to urban, mining, or landfill uses by using land use classifications from Guatemala and El Salvador.
To help land use planners set priority locations for mangrove restoration, we evaluated mangrove restoration locations in terms of their potential benefits to coastal protection (as carbon sequestration was modeled as a spatially uniform rate across the study area). To do this, we created a 500 m buffer around each restoration polygon within 2,000 m of the coastline. Overlapping buffers were dissolved into a single polygon. Restoration areas sharing a contiguous buffer were considered a single group. We found the average values of the Coastal Exposure Index (with habitats) and Coastal Exposure Index without Habitat for segments on the coastline directly in front each restoration group. This allowed ranking of potential restoration areas based on their proximity to coastline with highest Coastal Exposure Index (mangrove restoration groups with highest exposure ranked #1). We did not rank restoration groups based on Habitat Role because we were assessing priority locations for creating additional mangrove habitat, not the role played by existing mangrove habitat.
The rank order of mangrove restoration groups by Coastal Exposure Index did not change when habitats were removed from the index, simplifying identification of locations offering the highest existing coastal protection.
We scaled the ranks for coastal protection from 0 to 1 (1 = least protection conferred) for each group of mangroves using the following equation: (Ranked Habitat Role-1)/(Total number of groups). We also scaled the 2100 carbon stock for each cell of the 2100 carbon stock raster from 0 to 1 as follows: (C stock of cell—Mininum C stock)/(Maximum C stock—Minimum C stock). For each cell of mangrove, we took the average of both scaled values to determine the relative amount of ecosystem services provided. We used the Slice function in ArcMap 10.5 to sort the results in order from 1 to 100 based on the order of values in the raster, with 1 corresponding to the highest intensity services provided and 100 corresponding to the lowest intensity services provided.
To find the average rank for each mangrove group, we used the Zonal Statistics As Table function to calculate statistics for all the cells of the Combined service index raster for each individual mangrove polygon.
Assumptions and Limitations
The Coastal Vulnerability model’s outcomes are qualitative reflections on risk and the relative role of mangroves in reducing that risk; the model does not estimate absolute probabilities of coastal flooding or erosion. The resolution of the exposure index, 250 m, does not allow estimating the risk at the site level. This model assumes that the current coastline will remain the same and that existing hard structures along the shoreline will remain in place and that the protection they provide will not diminish over time. Finally, the model determined the protection provided by mangroves based on the distance from the nearest hectare of mangrove, regardless of the number of hectares of mangrove around it or the density of woody vegetation.
One of the main limitations of the Coastal Blue Carbon Model is that the ability to predict potential carbon sequestration is limited by the available estimates of carbon sequestration in El Salvador and Guatemala. A uniform sequestration rate was used for all mangroves based on regional averages. Our analysis also assumes that mangroves currently present in the study area will remain in place and maintain the same level of annual carbon sequestration until 2100. It is unclear how future climate change will affect carbon sequestration rates in blue carbon ecosystems (especially changes in salinity, sea level rise and temperature) (Morris et al., 2002; Macreadie et al., 2019). Finally, the net present value is sensitive to the discount rate used. A 3% discount rate was used, which is appropriate for low to intermediate levels of uncertainty about the future existence of mangroves. Discount rates should increase as uncertainty increases. A higher discount rate would disproportionately lower the estimated value of carbon sequestration in 2100 in comparison to 2050.
The restoration potential estimated also has limitations. For Global Mangrove Watch (GMW) spatial coverage data, Landsat-7 ETM + scan line error affects classification in certain areas, resulting in streaks in the data. It is important to note that data derived from global scale data set, generated with a unique methodology applied to all regions, and therefore, the accuracy of the map can vary between locations.
Results
The outcomes maps from the INVEST Coastal Vulnerability model of coastal exposure, geomorphology, relief, natural habitats (based on the mangrove cover map), wave exposure, wave potential, and sea level rise, were used in combination to estimate the coastal exposure index which shows the most vulnerable areas of the Río Paz area to erosion and flooding during storms (Figure 2). The coast of Guatemala has mostly low and medium coastal exposure in the Municipality of Moyuta, while the coast of El Salvador has a high coastal exposure, especially in the area of Los Cóbanos.
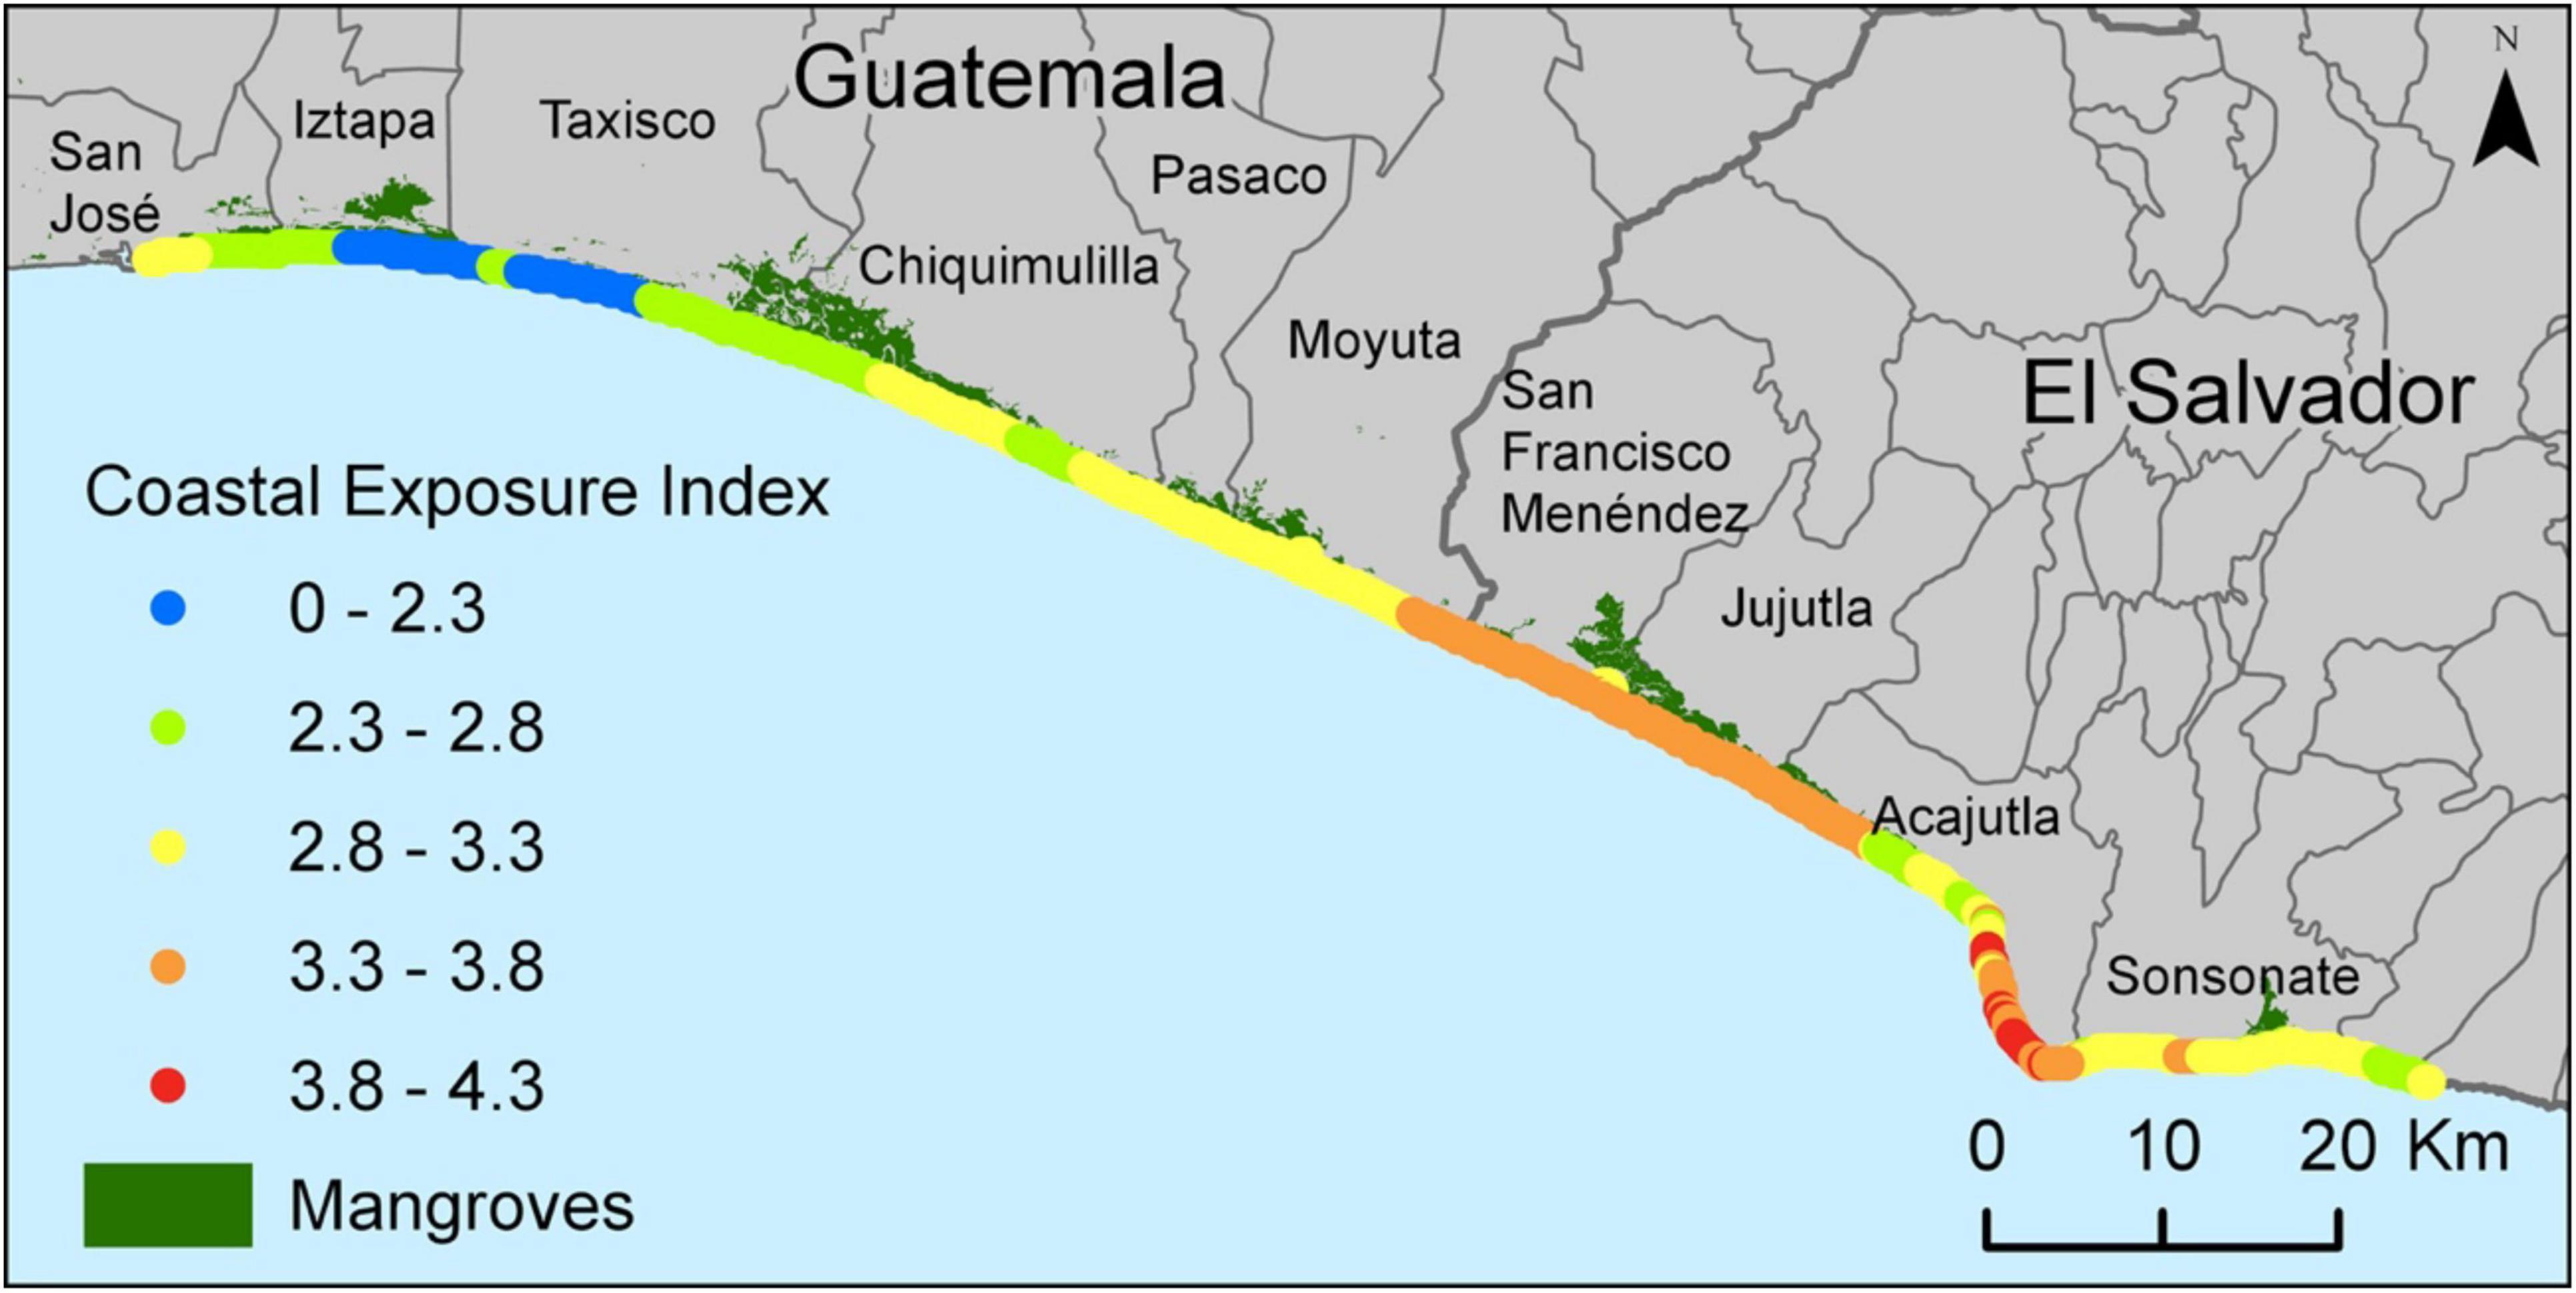
Figure 2. Map of coastal exposure index values for each 250 m coastline segment for the entire study area. The index is a relative measure of exposure to coastal flooding and erosion based on geomorphology, proximity of mangroves, exposure to waves, exposure to wind, relief, storm surge potential, and rates of sea level rise.
The difference between the Coastal Exposure Index with and without habitats determines the coastal protection ecosystem service that mangroves provide by reducing threats of coastal erosion and flooding. Mangroves of Guatemala provide this service in greater levels in Moyuta, while on the El Salvador side, this service is higher in the municipalities of San Francisco Menéndez, Jujutla and Acajutla (Figure 3).
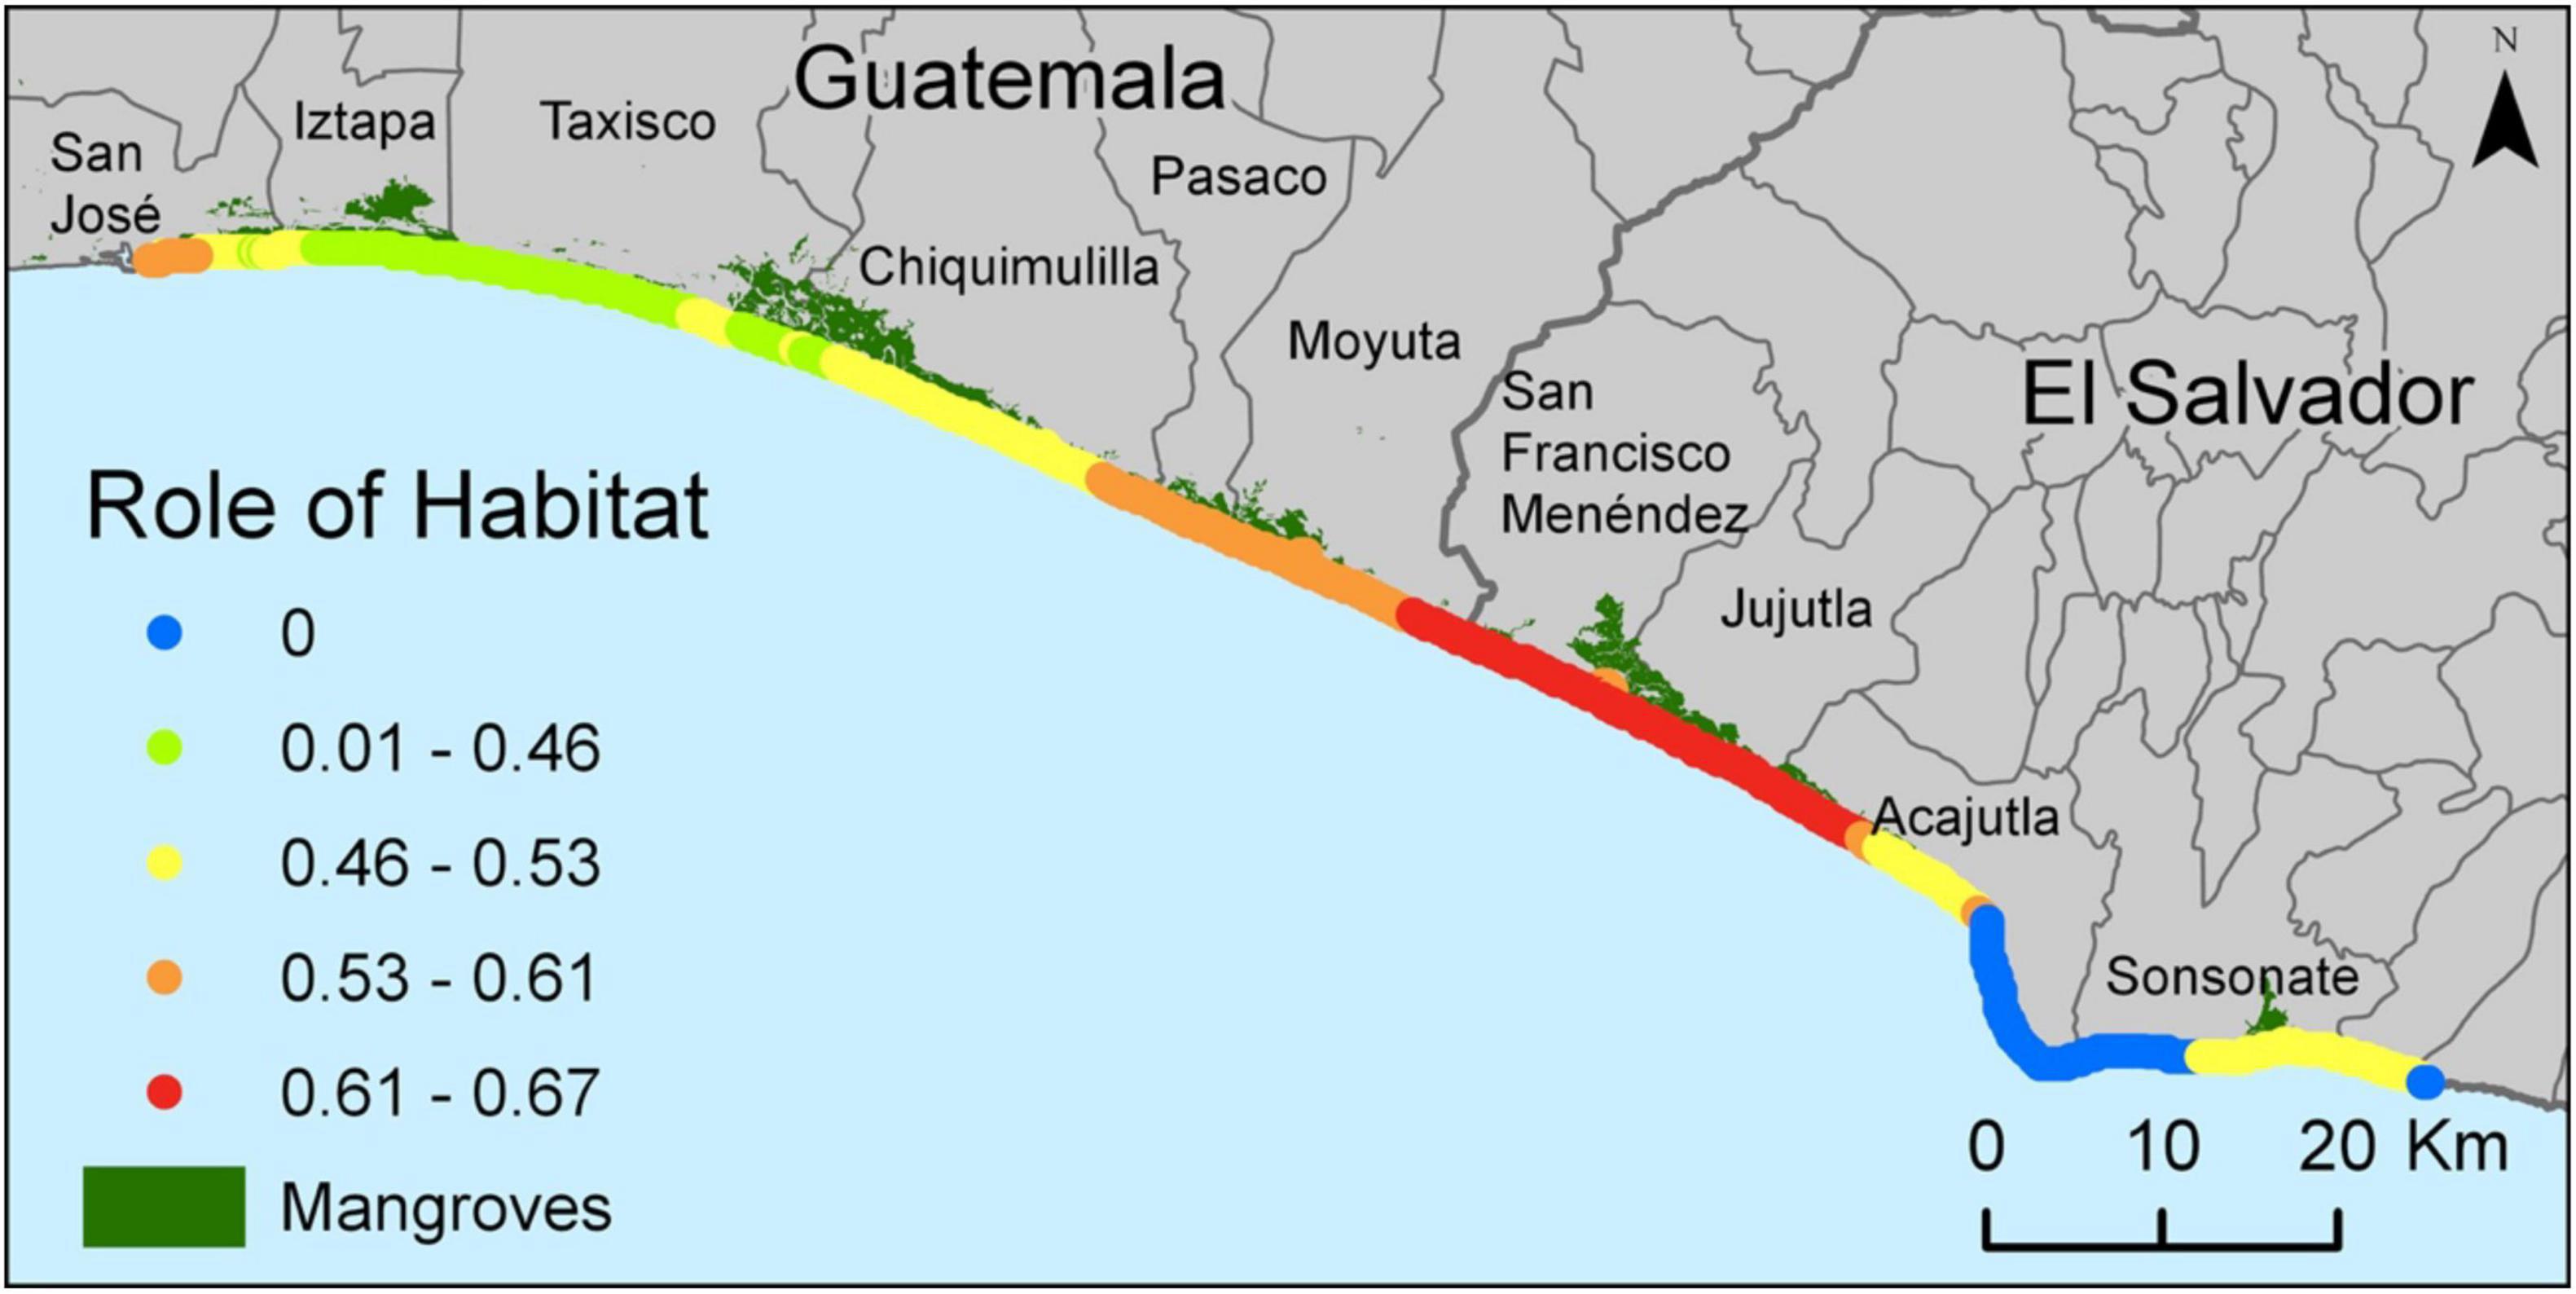
Figure 3. Map of the difference between the Exposure Index including mangroves and the Exposure Index without mangroves for each 250 m coastline segment for the entire study area. The role of habitats is a relative measure of how mangroves reduce exposure to coastal flooding and erosion.
The InVEST Blue Carbon Model produced maps of present and future carbon stocks for 3 years: 2020, 2050, and 2100 (Figure 4). The total carbon stocks varied significantly throughout the mangroves of the study area, but mangroves in El Salvador had the highest total carbon stock, mainly because these mangroves store in soils on average almost 100 Mg C ha–1 more than Guatemala’s mangroves (Table 1).
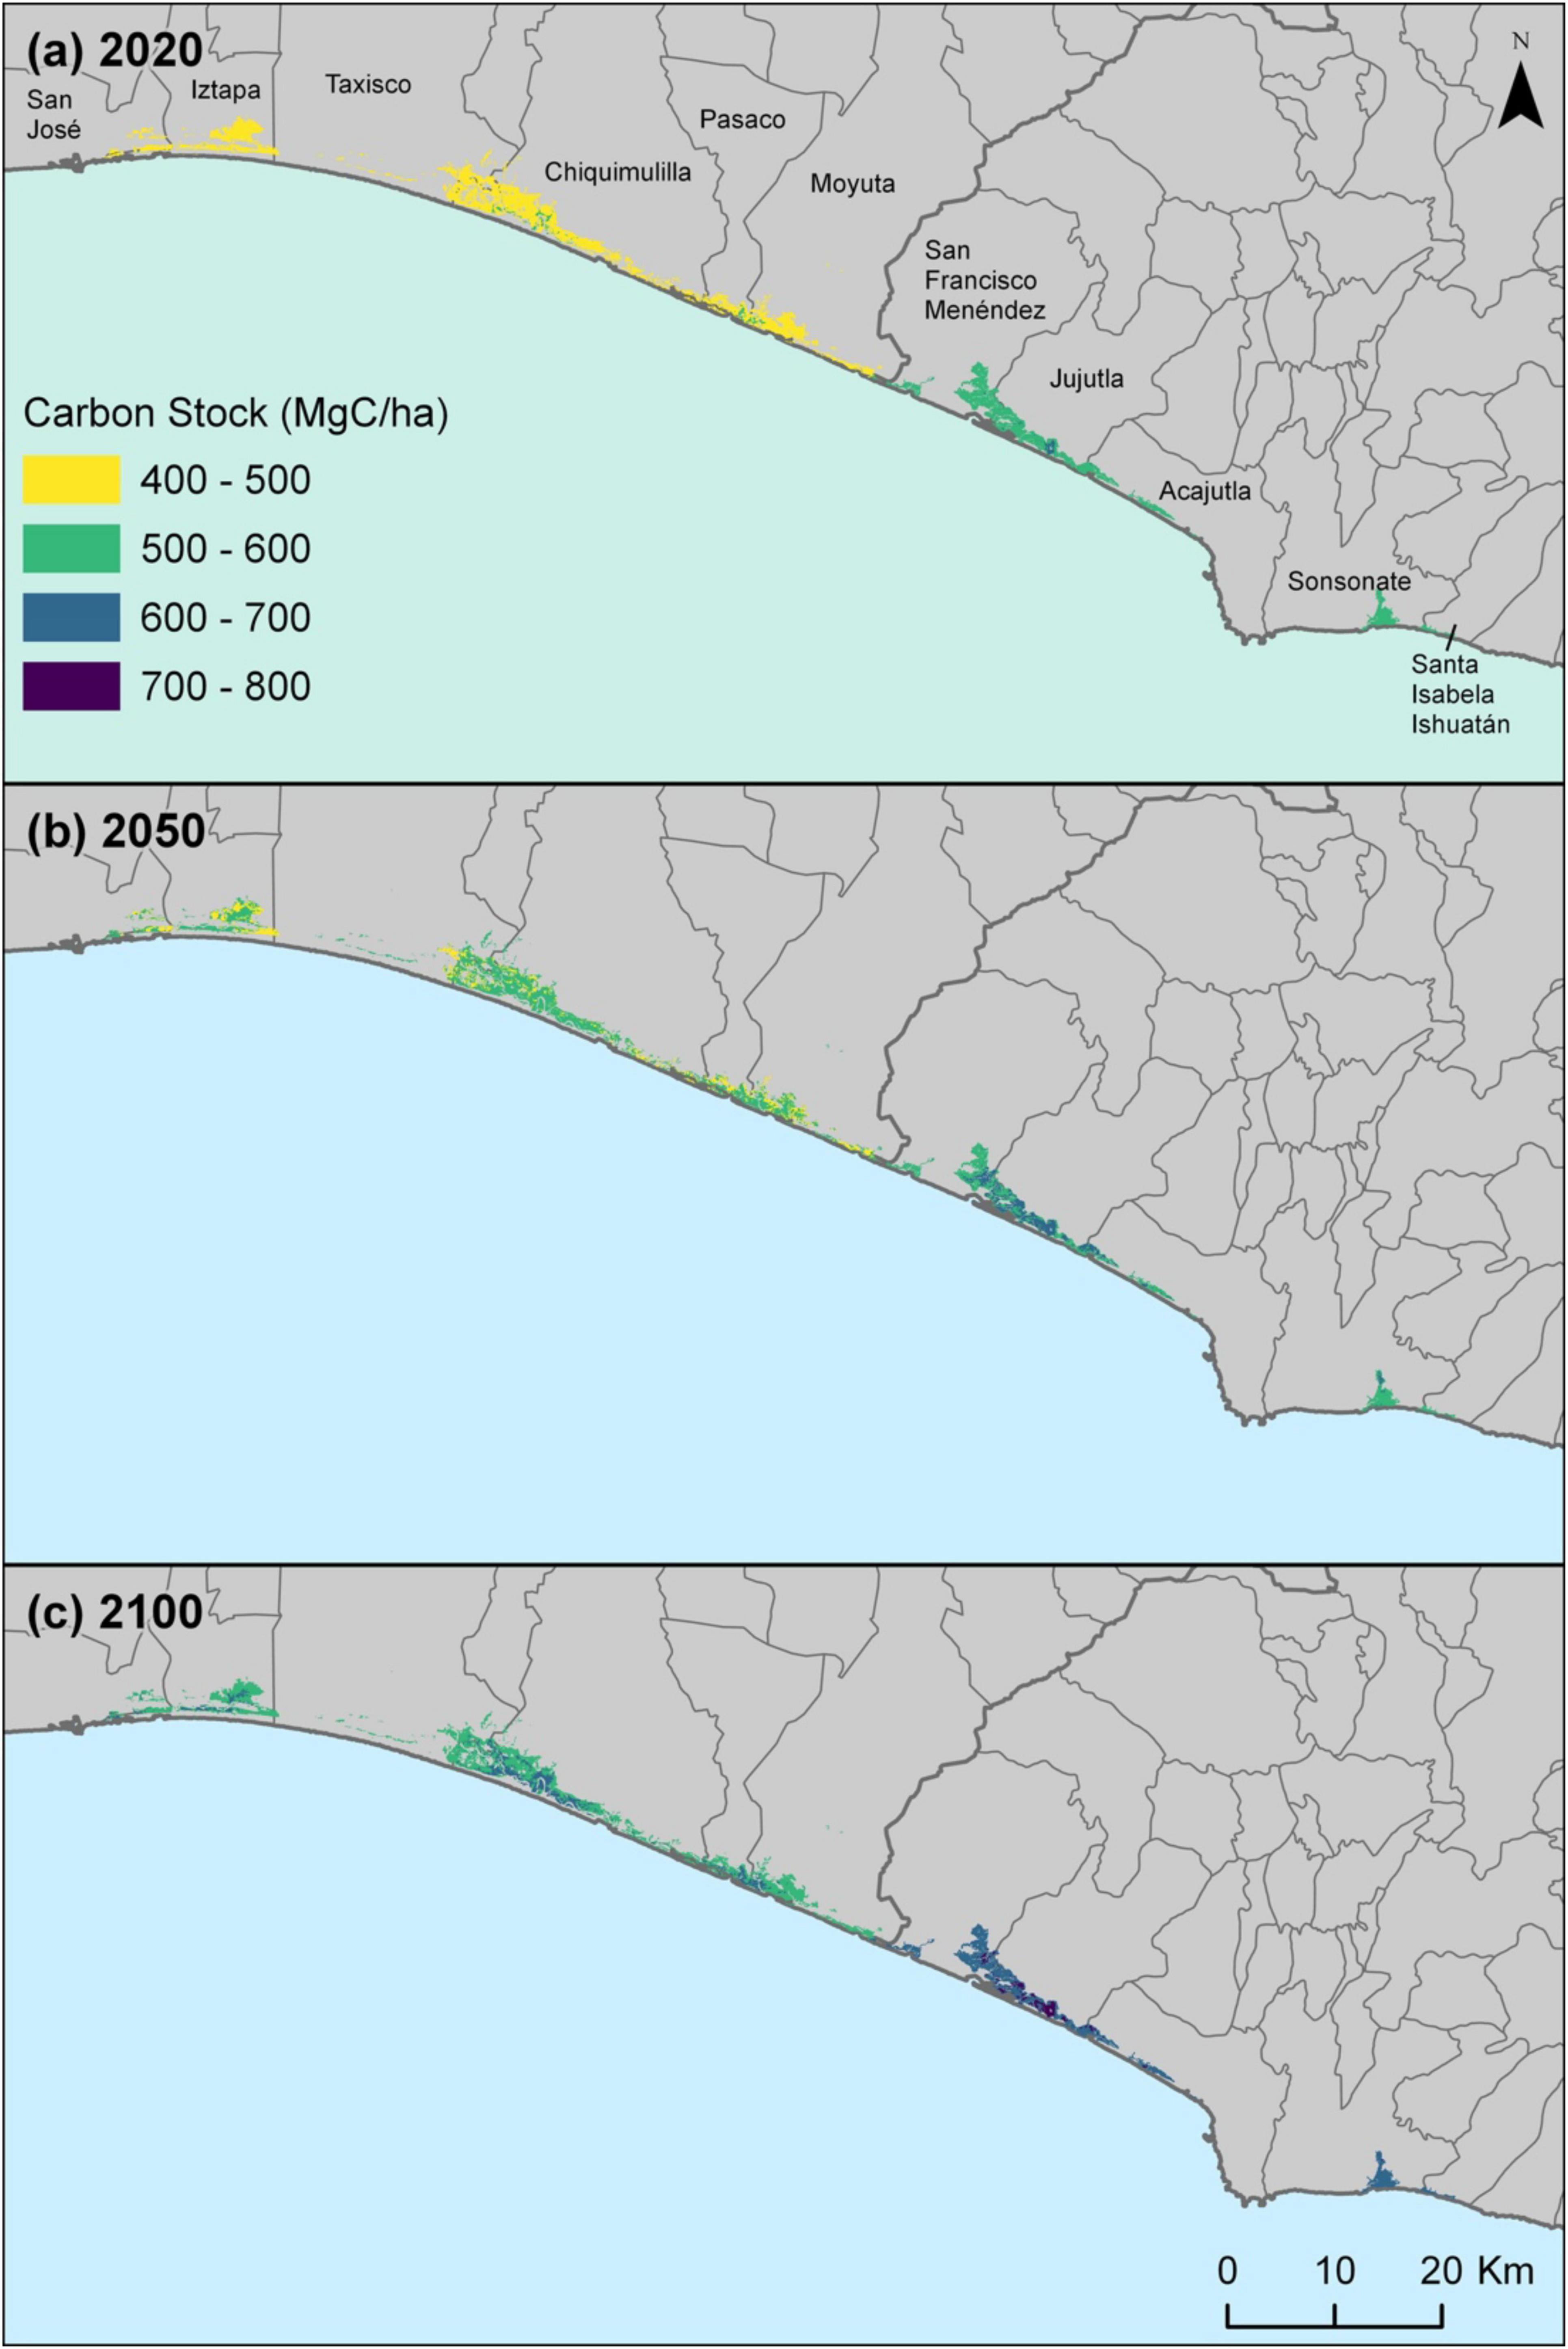
Figure 4. Total carbon stocks in mangroves in 2020 (a), 2050 (b), and 2100 (c), the start year of the modeling period. Soil carbon, fallen wood, and aboveground biomass were added to produce total metric tons of carbon per hectare.
Total carbon stock for the Río Paz Basin was 457,496 Mg C in 2020, and it is projected to be 503,392 Mg C in 2050 and 579,886 Mg C in 2100, assuming a constant carbon sequestration rate and that no disturbances to the ecosystem occur. Mean carbon sequestration for 2050 and 2100 was 50 Mg C ha–1 and 130 Mg C ha–1, respectively, with total sequestration of 45,896 Mg C and 122,390 Mg C within the study area, respectively. Due to the spatially homogeneous carbon sequestration rate we used, the net carbon sequestration was homogeneous throughout the study area (Figure 5).
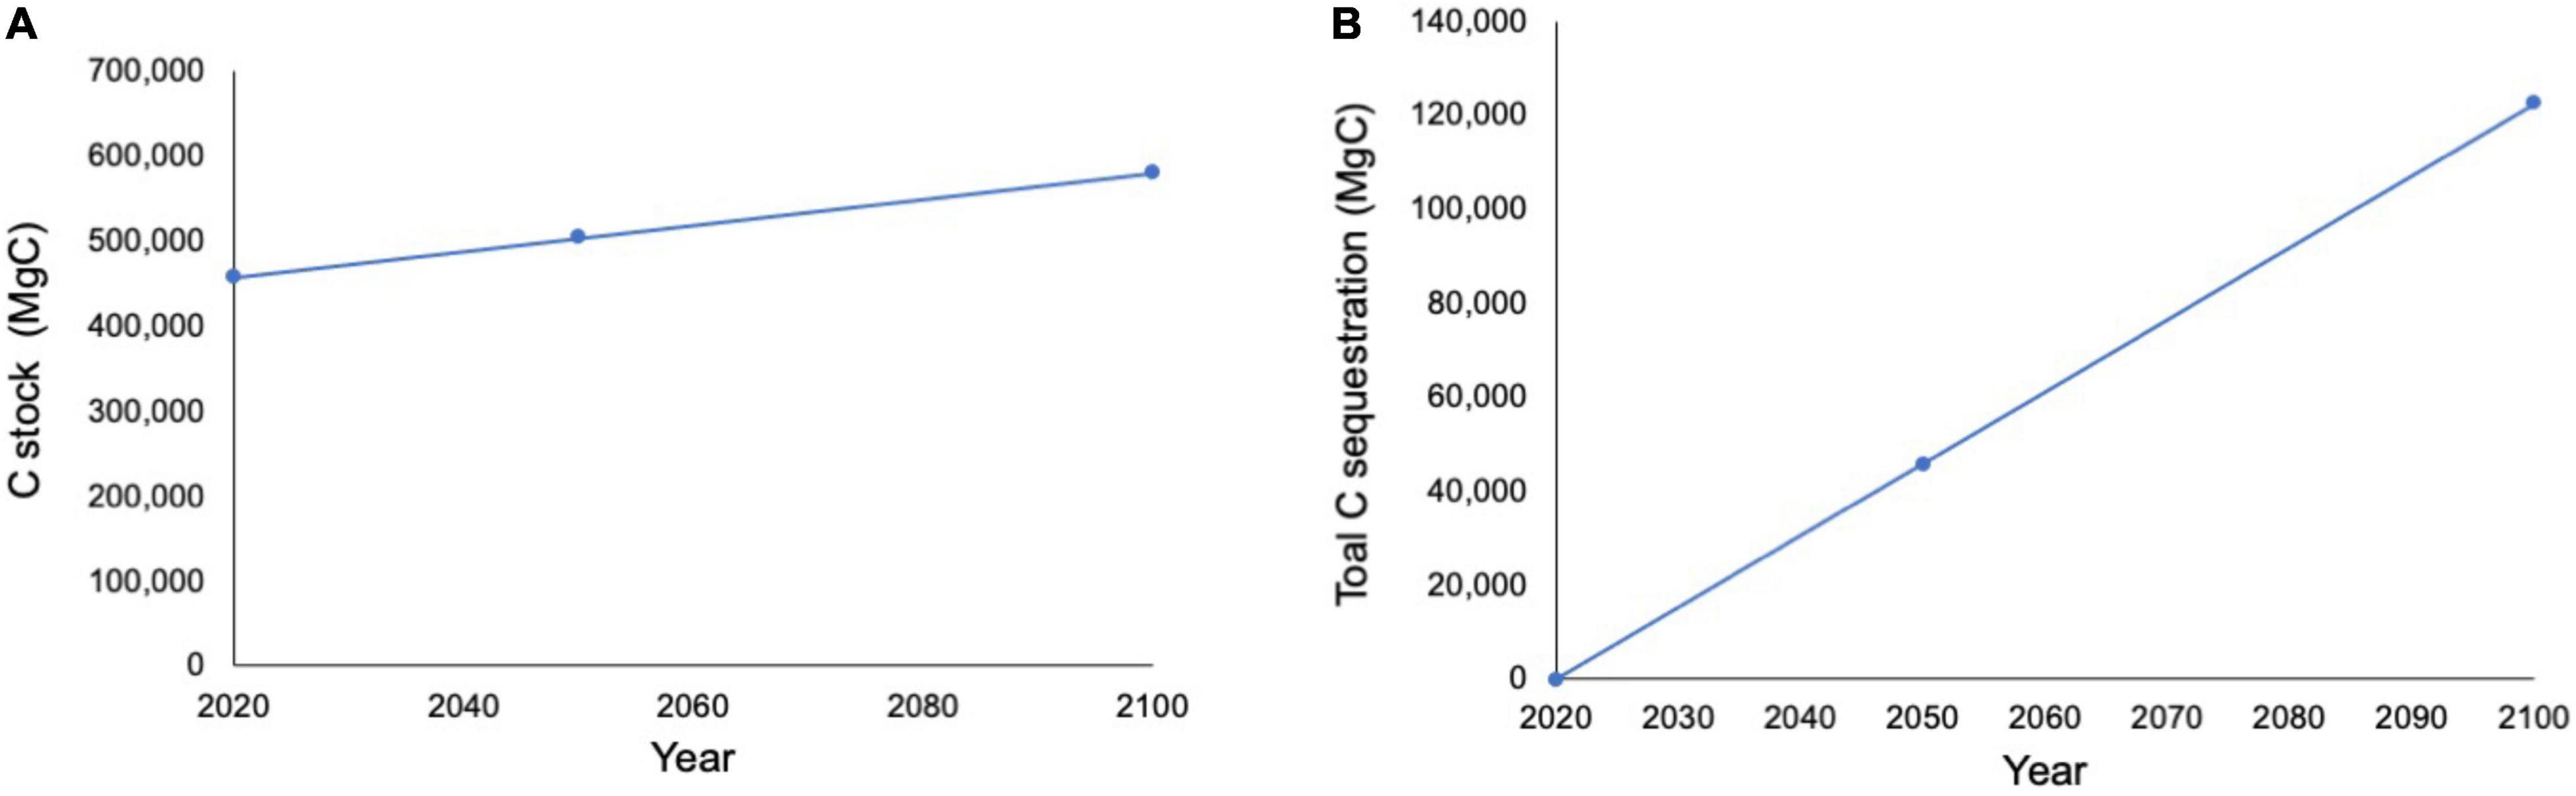
Figure 5. (A) Carbon stocks over time. (B) Total carbon sequestration over time.
Regarding the economic value of the carbon sequestered in the mangroves of Río Paz, using a discount rate of 3%, the average net present value is projected to be $6,344 ha–1 in 2050 and $11,959 ha–1 in 2100. In total, the net present value of the mangrove blue carbon stocks for the years 2050 and 2100 is projected to be $5,953,902 and $11,224,040, respectively. If a discount rate of 5% is applied, net present values per hectare decreased to $966 and $1,535 for 2050 and 2100, respectively, and net present value for the total area of mangroves will be $906,735 in 2050 and $1,440,979 in 2100 (Figure 6).
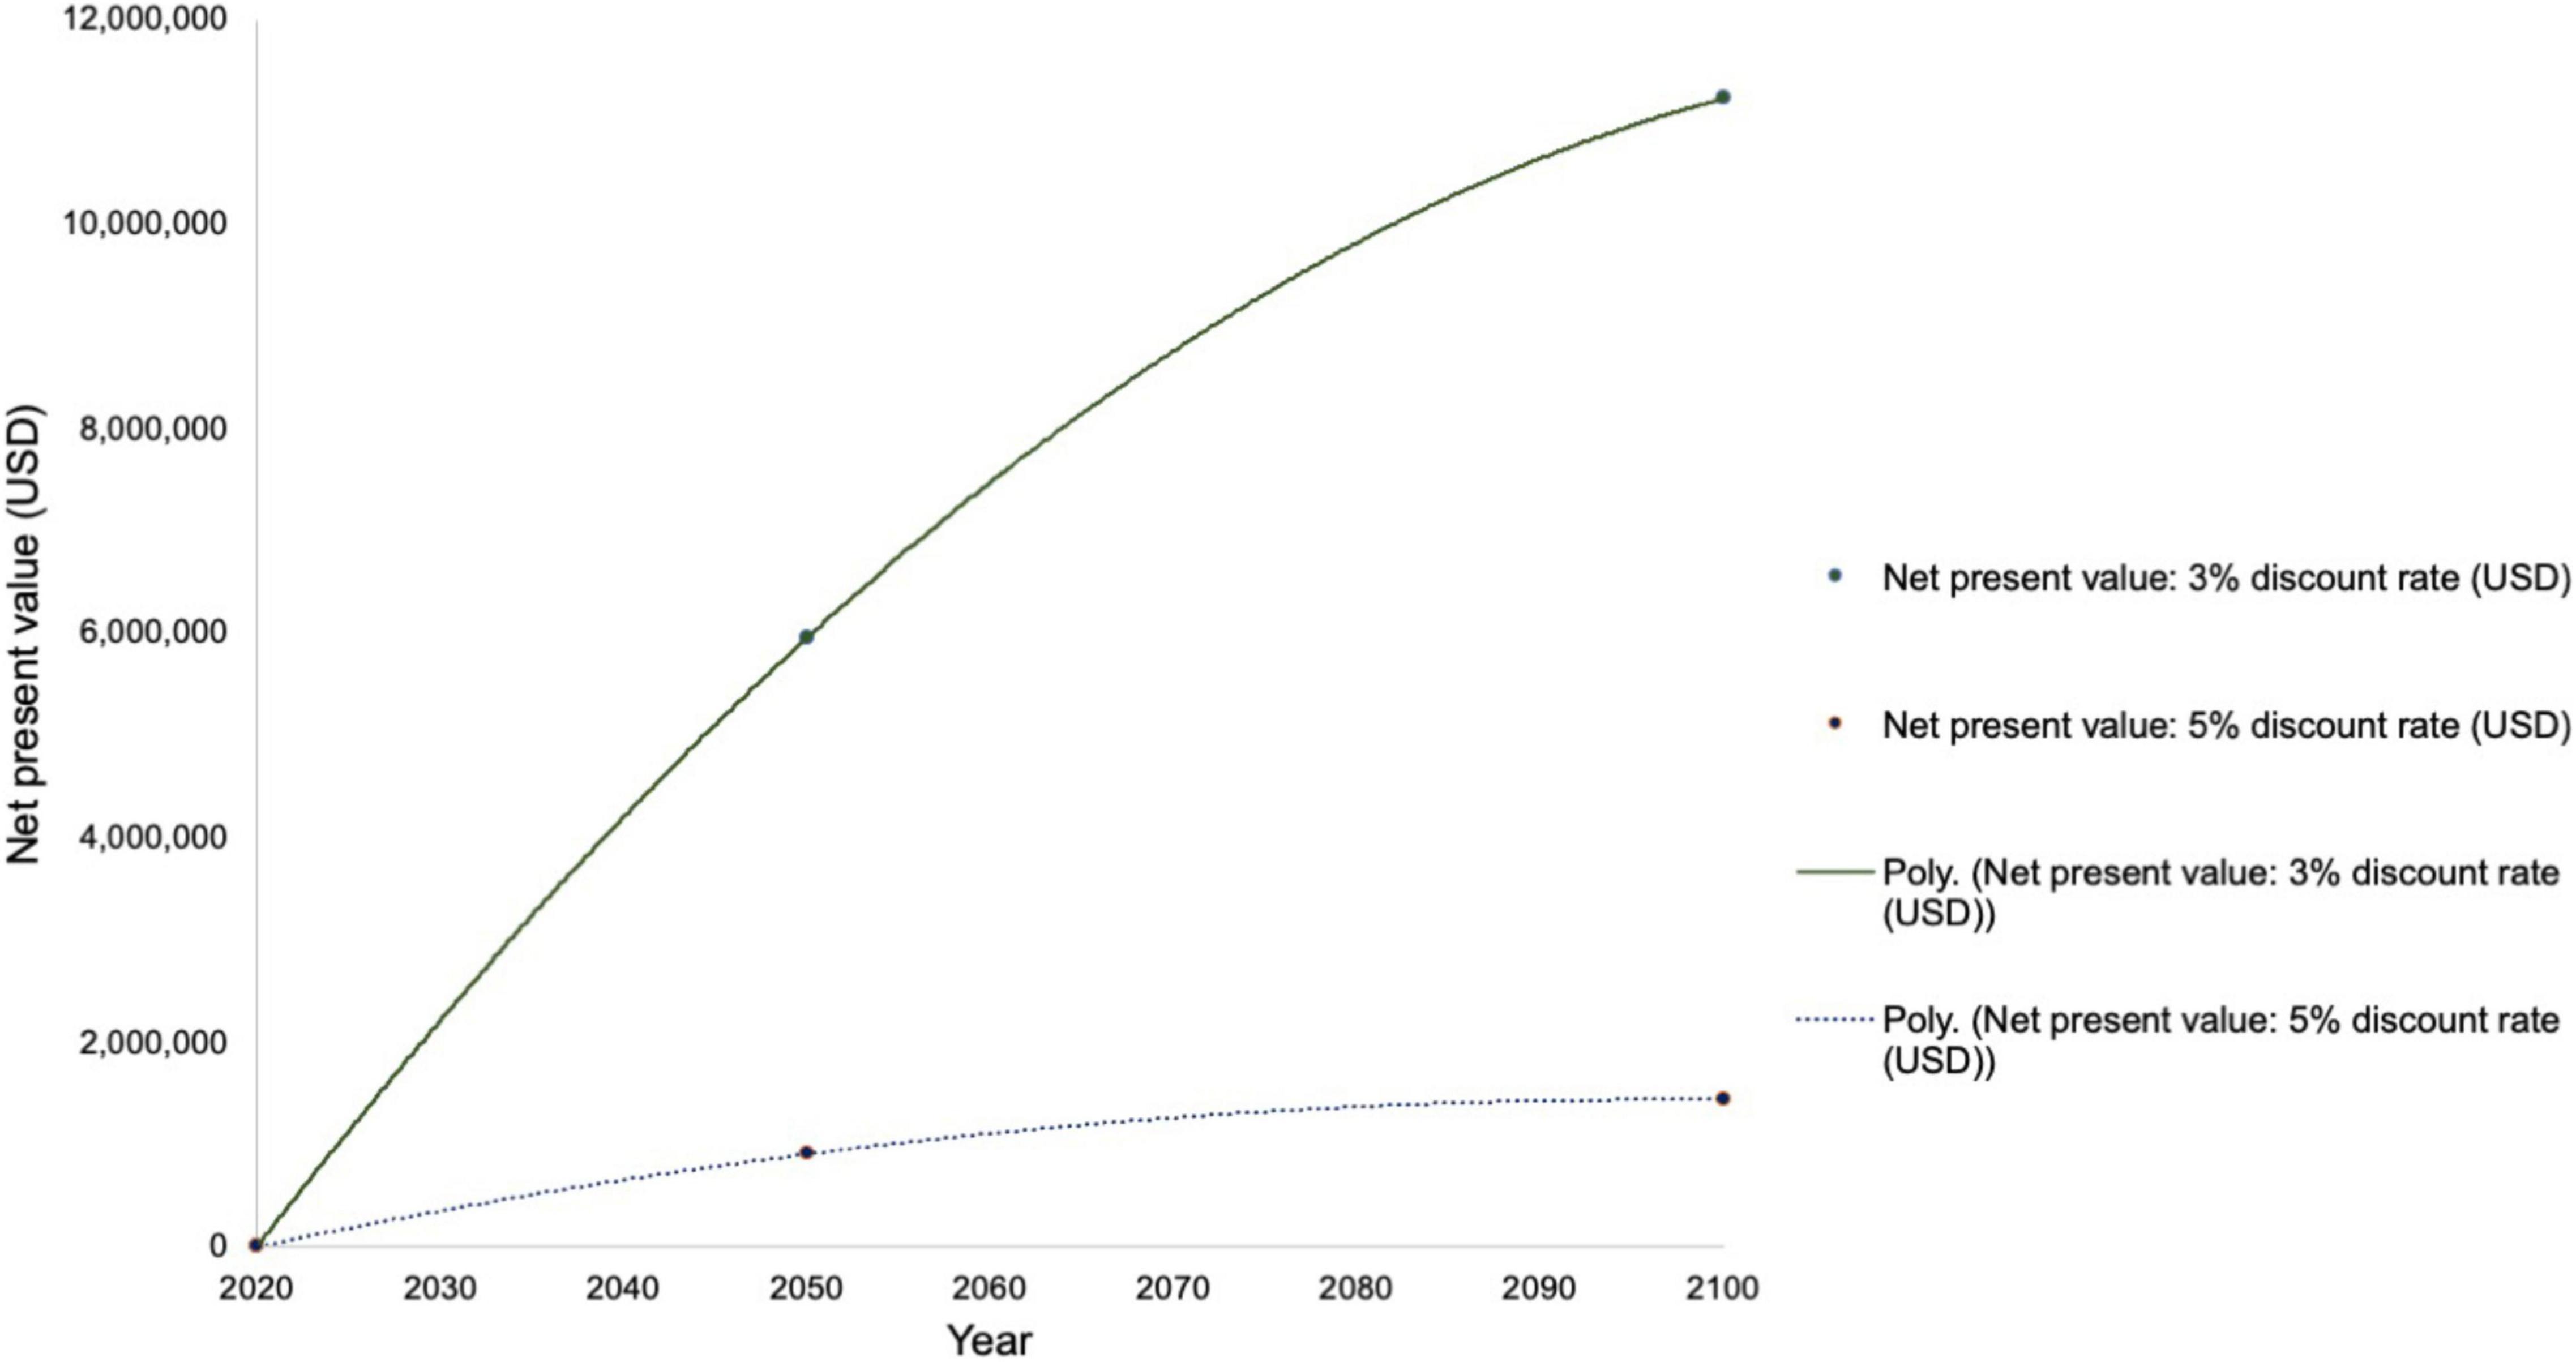
Figure 6. Net present value of blue carbon sequestration using a 3 and 5% discount rates.
We created a map with the mangrove areas that provide the highest combined ecosystem services provision, and therefore areas that should be prioritized for conservation in order to provide these benefits to the local and global population (Figure 7). We present the results using an index from 1 to 100, with lower values being the priority areas. Because we used mean values of each mangrove polygon, the value range goes from 14 to 86. Approximately 19% of the total mangrove area can be classified as the highest priority, which is exclusively located in El Salvador, and 24% of high priority area which is distributed among both countries.
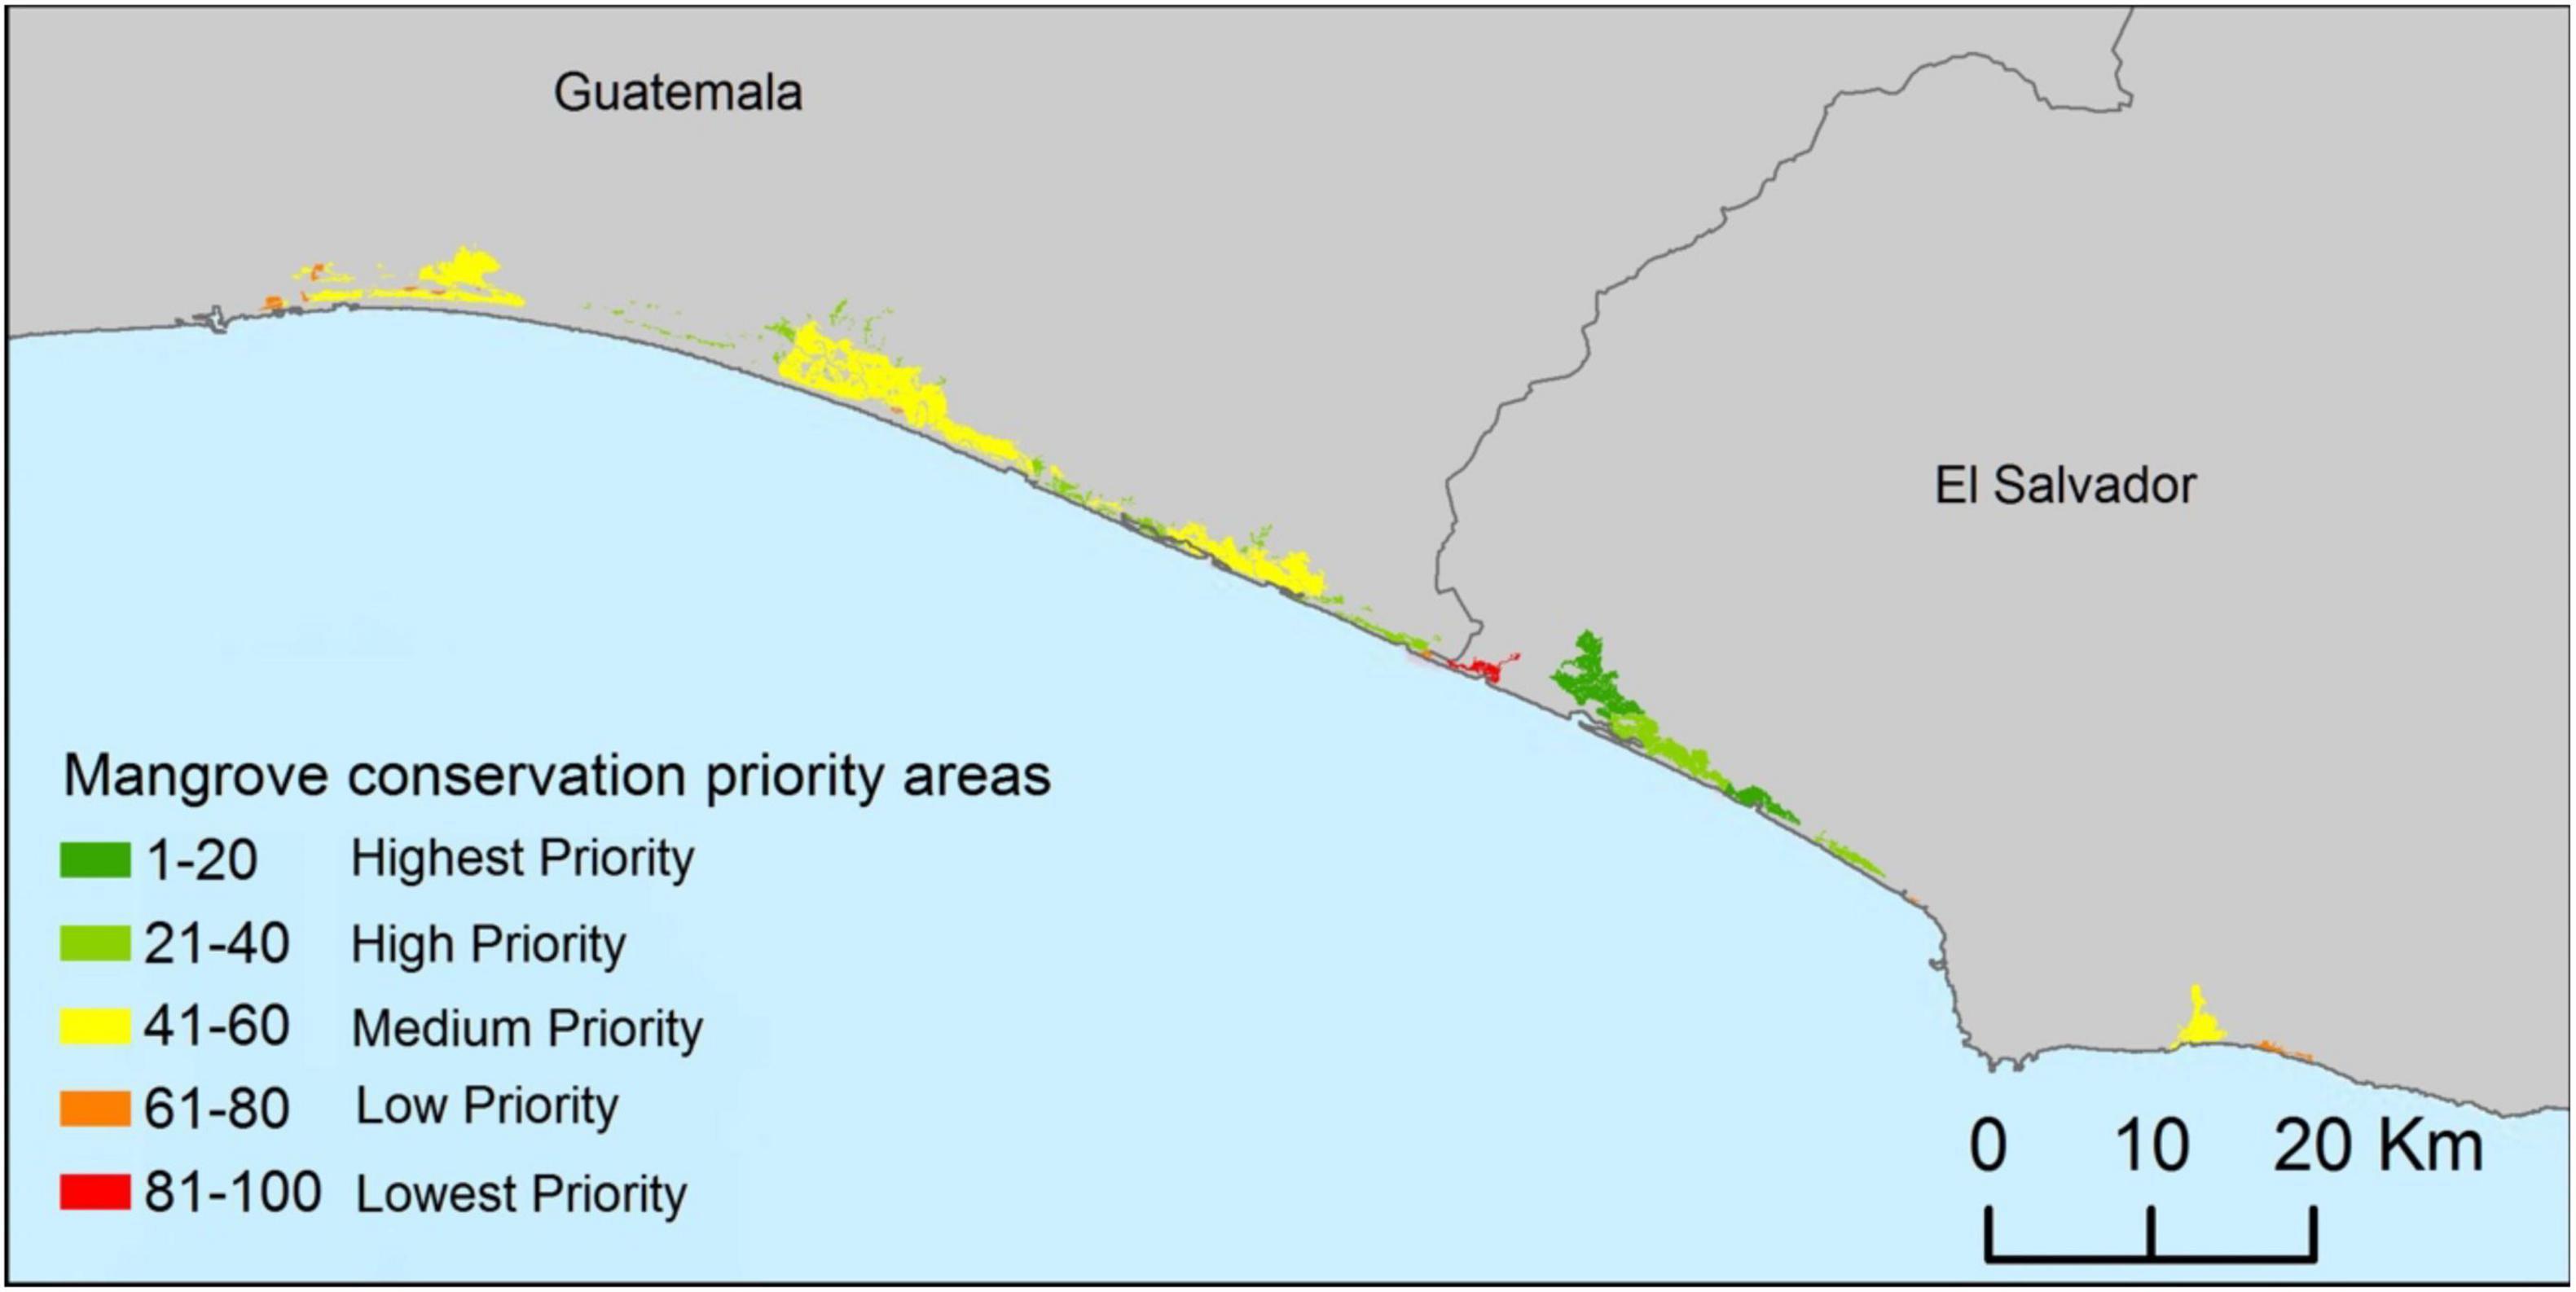
Figure 7. Identification of potential priority mangrove conservation areas taking into account the combined provision of coastal protection and blue carbon storage.
Finally, we identified mangroves that had been lost by 2016 based on a comparison of Global Mangrove Watch mangrove maps from 1996, 2007, 2008, 2009, 2010, 2015, and 2016. From these historical estimates, 318.9 ha were identified as meeting the potential restoration criteria (Figure 8).
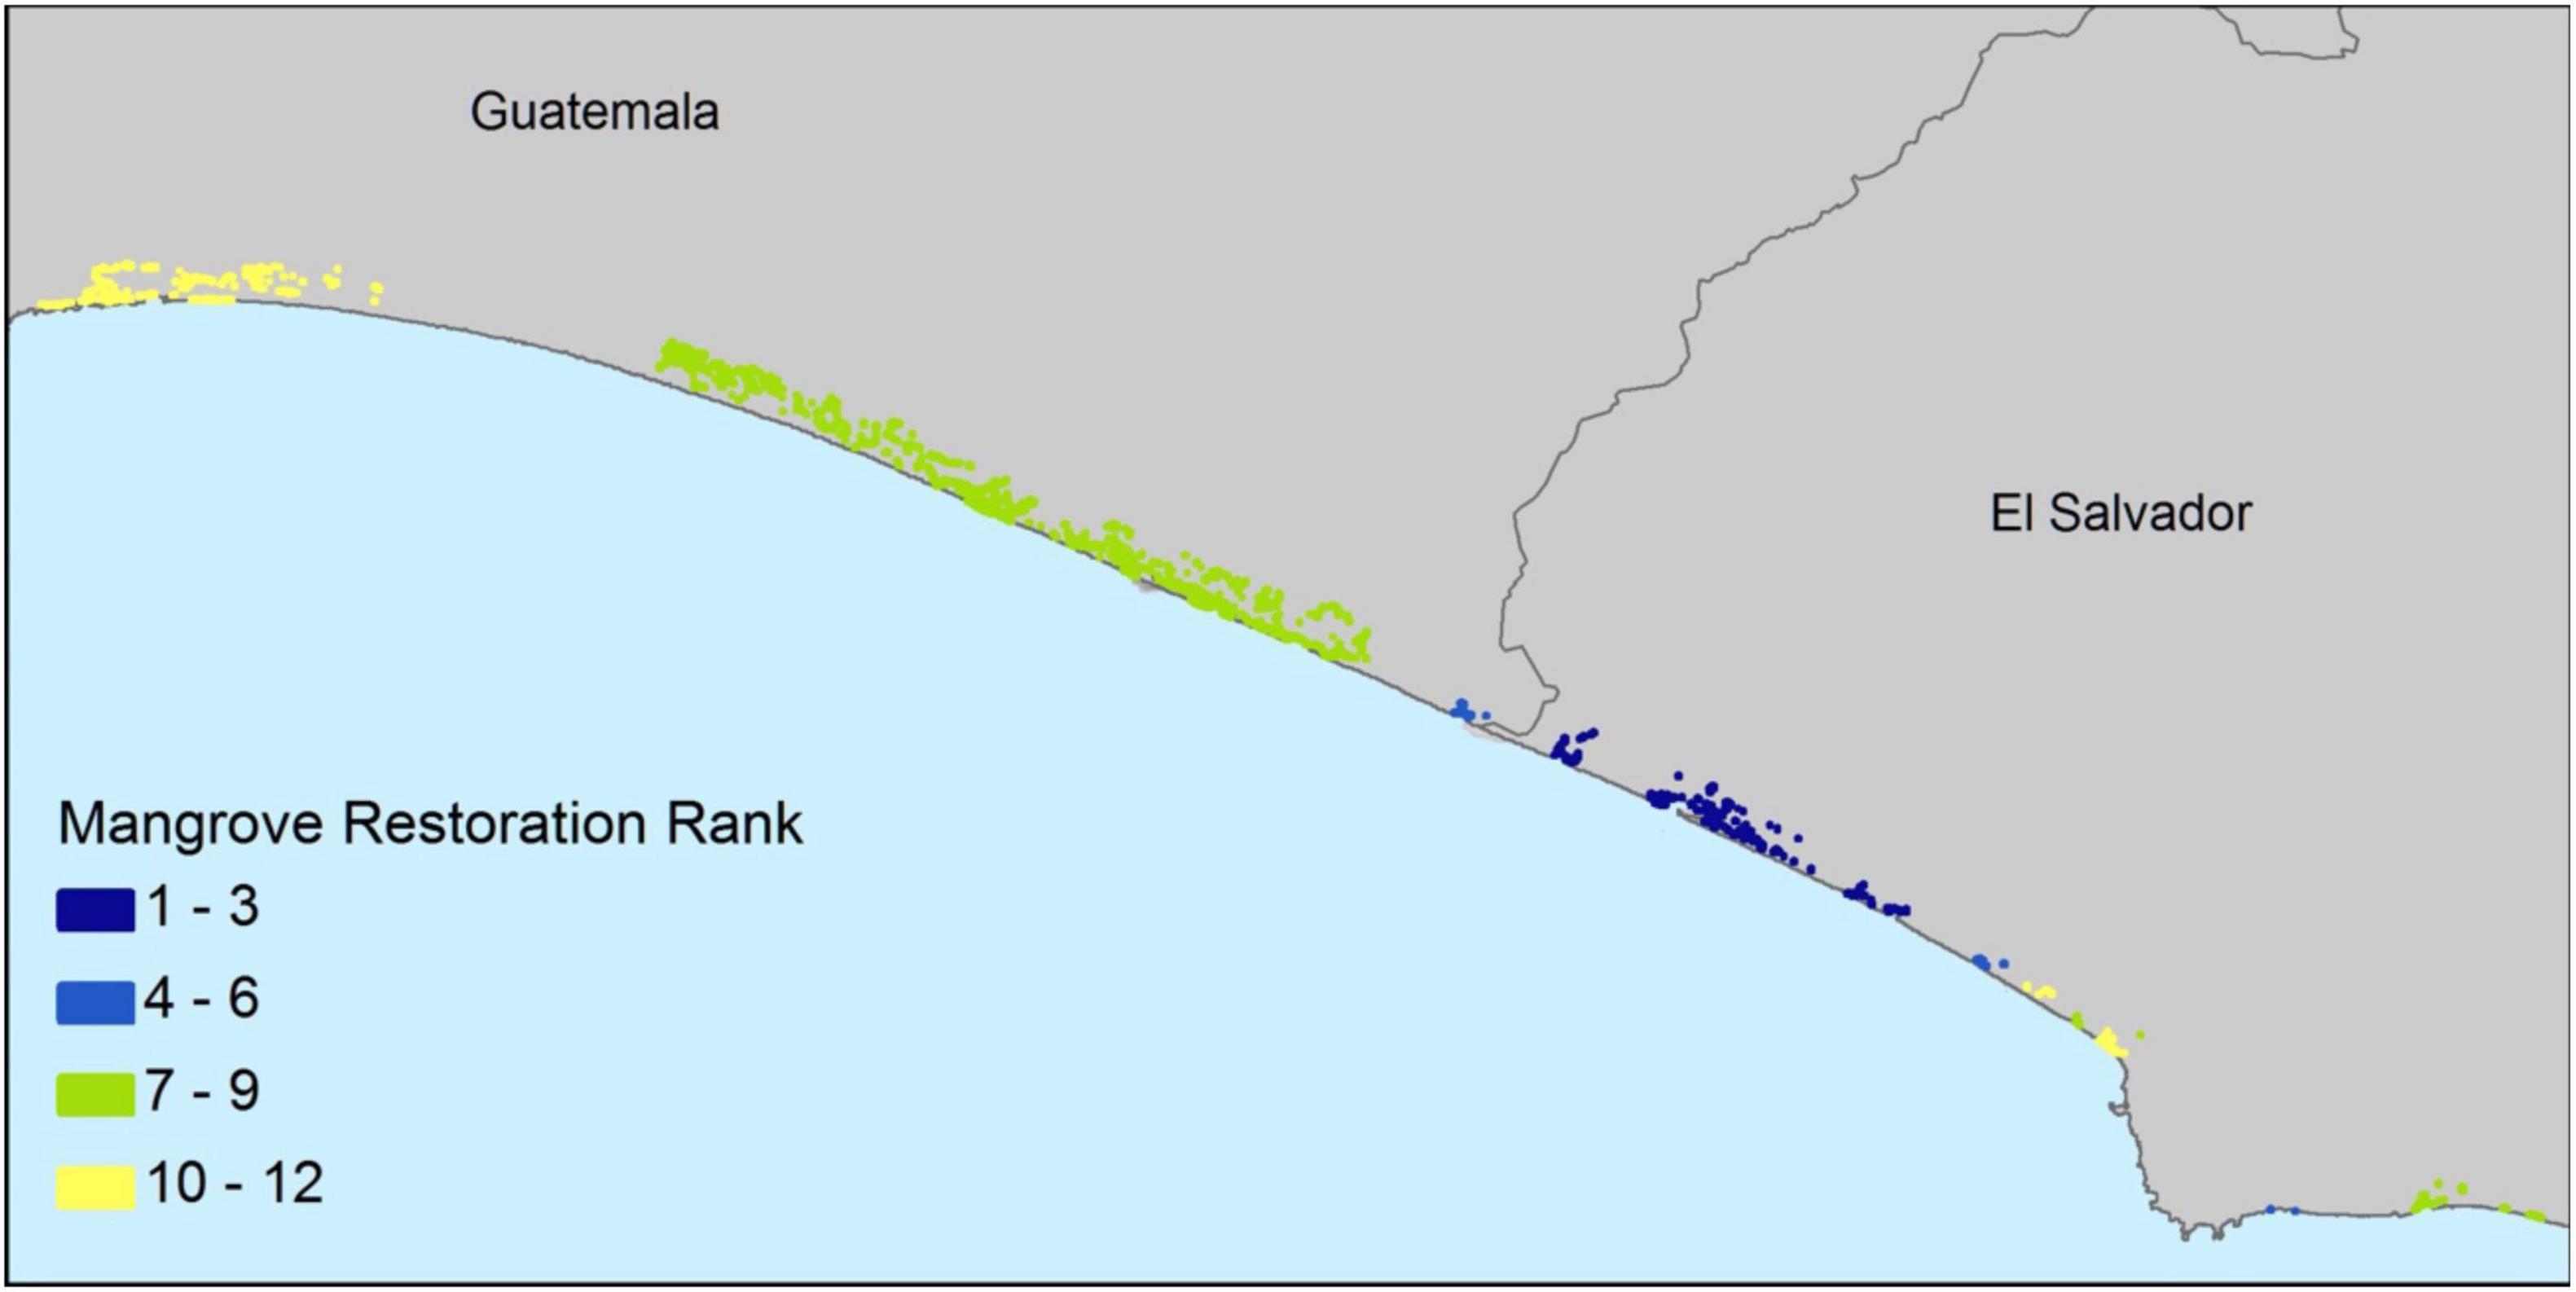
Figure 8. Restorable areas for mangroves classified according to the Coastal Vulnerability Index. Areas in dark blue are those that should have a higher Index and therefore are a priority.
It is important to emphasize again that for the identification of potential priority areas for restoration, we considered the coastal vulnerability to erosion and storms as the main criterion, so that the most vulnerable areas were prioritized for mangrove restoration. Potential restoration areas were ranked below in descending order according to their restoration range (which is directly related to the Coastal Exposure Index). The lower rank represents priority sites. El Salvador contained the highest ranking restoration areas, although it contained only 70.48 ha of the total. Restoring these sites could improve coastal protection in case of high risk. Guatemala contained 248.42 ha of potential restoration area, but much of it had a lower average Coastal Exposure Index.
Discussion
Maps from the Coastal Vulnerability model identify areas with the highest relative exposure to flooding and erosion by coastal storms. They also identify places where mangroves play the most important role in reducing that exposure. Policymakers can use these maps to prioritize the protection of mangroves that provide the greatest coastal protection. For example, in 2017 El Salvador launched the Restoration Action Plan for ecosystems and landscapes under a climate mitigation and adaptation approach, which considers the restoration of 2,000 ha of mangroves that would represent a net benefit of $4,000 per hectare (MARN, 2017).
These maps can also be combined with maps of relative socioeconomic vulnerability. Not all coastal populations will be able to respond to climate disasters equally (Arkema et al., 2013). Mangroves that protect large numbers of low-income families could be identified in future analyses. Critical infrastructure can also be incorporated into these maps to identify where mangroves protect socially important features, such as high-usage roads, power plants, hospitals, and airports (Dobson et al., 2021). Finally, maps of coastal property value or asset value can be analyzed to identify where mangroves protect major financial interests (Arkema et al., 2013). Frequently, the locations of high-value properties and socially vulnerable populations are different, requiring discussion on how to adequately protect both.
Considering the climate regulation ecosystem service of mangroves, these ecosystems and other “blue carbon” coastal ecosystems have historically been overlooked as a strategy for carbon sequestration, though they are beginning to receive sustained attention in national and sub-national climate adaptation strategies around the globe (Moritsch et al., 2021; Wedding et al., 2021). The results of this research highlight the potential of mangroves to contribute to the emission reduction goals of Guatemala and El Salvador. Inclusion in national carbon budgets also helps each country maintain its commitment to the Paris Agreement (United Nations, 2015).
Historically, the negative consequences of land use change (e.g., reduced ecosystem function) have been difficult to measure on the same terms as benefits (e.g., financial reward). Our analysis allows the comparison of those costs in the same financial units, at least for carbon sequestration. Estimates of the social cost of carbon reflect the average economic value of the damage that would occur from climate change if that carbon were in the atmosphere rather than stored in mangroves. Therefore, this amount represents a cost savings generated by preserving existing mangroves. The social cost of carbon can be compared to the income from land uses that would destroy mangroves. For example, converting mangroves to aquaculture ponds will generate income, but the financial gains will be offset by the cost of climate-related damage (Pendleton et al., 2012). Furthermore, the removal of mangroves will disturb soils, leading to the release of more than 40% of the carbon already stored in the atmosphere as carbon dioxide (Lovelock et al., 2017). The cost of these carbon emissions must be combined with the lost opportunity of carbon sequestration to account for the climate-related damage that occurs when mangroves are removed.
We present key practical considerations when considering mangrove conservation and restoration projects. According to Worthington and Spalding (2018), first of all, it is vital that local communities inform decisions about where and how to restore mangroves. This includes local ecological and physical conditions, but also social, legal, and economic influences. Moreover, mangrove restoration can be greatly hampered if land tenure is not understood and respected. Community involvement and support can ensure long-term security for restoration projects. Equitable benefit sharing can prevent further degradation and provide an example that, in turn, takes advantage of additional restoration efforts.
As a starting point for mangrove restoration, it is prudent to consider placing them in places where they have been recently lost, as long as it is possible to prevent the loss from occurring again and local conditions remain adequate (e.g., appropriate soil, tidal and elevation conditions for restoration, proximity to other mangrove patches) (Worthington and Spalding, 2018). In many cases, restoration is accomplished largely through restoration of the physical hydrological process. Restoring the connectivity of tidal flows and the appropriate elevation of the land facilitates the natural transport of mangrove propagules, and over time the regeneration of mangroves can occur without planting. Planting, by contrast, can help accelerate recovery rates in places where natural recruitment can be reduced. Ecological knowledge is critical; the right species must be placed in the right elevation ranges. To increase the chances of a successful restoration, long-term monitoring and management of the site should be incorporated into the project protocol.
Considering the public ownership nature of both ecosystem services assessed here, and the fact that they are not part of any market that can account for their value to human wellbeing, these benefits are often overlooked in cost-benefit analyses that prioritize the construction of built capital over natural capital conservation (Balmford et al., 2002). Furthermore, and in part due to this non-market and public nature of these services, funding is often insufficient to secure the health of mangroves to keep proving benefits at the national and global scale. One solution that has proven to be successful to address these issues to protect natural capital is the Payment for Ecosystem Services (PES) schemes, which ideally could be capable of incorporating environmental externalities (positive externalities in the case of services provided by mangroves, and negative externalities in the case of drivers of loss and/or degradation), in which beneficiaries of these services pay ecosystem stewards to conserve, enhance or restore ecosystems in order to maintain the flow of services (Muradian et al., 2010; Tacconi, 2012; Schomers and Matzdorf, 2013).
Broadly speaking, there are three key elements of any PES scheme: (1) the seller(s), (2) the buyer(s), and (3) the financial mechanism (Engel et al., 2008; Hernández-Blanco, 2019). Moreover, it is important to consider that ecosystem services can be sold under a “stacking” or “layering” approach, in which separate payments are made for each ecosystem service; or they can be sold under a “bundling” approach, in which payments are made for multiple ecosystem services grouped together into a single package of conservation and restoration outcomes (Lau, 2013). A final consideration is that payments can be made directly on the bases of the ecosystem service provided (i.e., output-based payments) or per activity implemented per spatial unit (i.e., input-based payments). In the case of the mangroves from the Paz River Basin in El Salvador and Guatemala, in order to reduce the transaction cost of the PES scheme, we propose a scheme that pays for the total bundle of services, not only the ones assessed here, as well as paying in relation to the conservation and restoration activities implemented.
Therefore, under this type of scheme, the sellers could be both the government as well as those “implementers” (e.g., community associations, NGO’s, research institutions) that conduct the conservation and restoration activities. Regarding buyers, the PES scheme should target those who benefit the most from the presence of mangroves in the Paz River Basin (e.g., property owners, fishermen, wood collectors, tourists) and those who represent a threat for these ecosystems (e.g., aquaculture, coastal development). Finally, the financial mechanism could be made up by the funding sources (i.e., the buyers mentioned before, plus others financial instruments such as fees, taxes, and compensation credits) and the funding destinations (i.e., mangrove conservation and restoration activities).
If it is preferred by the authorities in both countries to make payments specific to certain services (i.e., stacking approach), then the scheme could create two types of instruments based on our results. First, blue carbon credits could be sold as a mitigation measure of stakeholders looking to compensate their greenhouse gases emissions in El Salvador and Guatemala, as well as in any other country, which could create a blue carbon market. Second, the coastal protection service assessed here could be sold as an adaptation strategy to local stakeholders that depend on this service, such as property owners along the coastline in the Paz River Basin, including sectors such as real state, agriculture, and infrastructure, among others.
Finally, our results are key to establish differentiated payments in relation to the areas that provide the highest quantity and quality of ecosystem services, which would increase the “natural rate” of the investments made on conservation and restoration activities. We recommend complementing our results with a threat analysis to have a combined index of prioritization that ensures the additionality of the payments made.
Conclusion
We applied a relatively simple modeling approach for the identification of key conservation and restoration mangrove areas in two Central American countries that host a high level of coastal biodiversity. Our results can improve the efficacy and efficiency of the use of limited financial resources from governmental and international agencies dedicated to environmental protection, among other stakeholders that invest in sustainable development.
Although we focused on two ecosystem services, this approach could be expanded to cover more services, especially those that are key for coastal communities. In particular, food production is an important service to consider, since mangroves are a habitat for species of commercial interest such as mollusks, white shrimp and several species of corvinas (Hernández-Blanco et al., 2021). Recreation and ecotourism could be evaluated as potential new services. In the case that the study area does not yet have high demand for tourism, this modeling framework could assist decision makers at local and national scale with identifying new job opportunities based on the sustainable use of this blue natural capital.
Also, our biophysical assessment of the coastal protection service provided by mangroves estimates not only the supply of the service, but the demand, which is often absent in highly used economic valuation methods such as benefit transfer (Navrud and Ready, 2007). In this method, our estimates can help adjust the transfer of values and therefore significantly reducing its error.
Finally, for future modeling of ecosystem services such as the one conducted in this paper, we also recommend implementing a scenario planning process, in which stakeholders (e.g., local community, government, academia, and non-governmental organizations, among others) can develop a set of different plausible scenarios for natural capital management, this will help identify how ecosystem services such as blue carbon can change in the future, as well as the best conservation and restoration interventions that can provide the highest resilience to mangroves and therefore to the communities that benefits from its services.
Data Availability Statement
The datasets presented in this article are not readily available because data is protected under the research funding agreement. Requests to access the datasets should be directed to the corresponding author (MH-B), bWFyY2VsbG8uaGVybmFuZGV6LmJAZ21haWwuY29t.
Author Contributions
MH-B designed the research project. MH-B and MMo wrote the manuscript. MMo did the modeling on blue carbon and restoration areas. MH-B and MMa did the modeling on coastal protection. LR provided sources of spatial data and other policy relevant information. All authors contributed to the article and approved the submitted version.
Funding
This research was funded by the International Union for the Conservation of Nature (contract #RQ003476).
Conflict of Interest
The authors declare that the research was conducted in the absence of any commercial or financial relationships that could be construed as a potential conflict of interest.
Publisher’s Note
All claims expressed in this article are solely those of the authors and do not necessarily represent those of their affiliated organizations, or those of the publisher, the editors and the reviewers. Any product that may be evaluated in this article, or claim that may be made by its manufacturer, is not guaranteed or endorsed by the publisher.
Acknowledgments
This manuscript was undertaken under the Regional Coastal Biodiversity Project of IUCN, funded by the United States Agency for International Development (USAID), and in collaboration with GOAL International, the Mosquitia Development Agency (MOPAWI), the Defenders of Nature Foundation, the Wildlife Rescue and Conservation Association (ARCAS) and the Salvadoran Ecological Unit (UNES).
References
Almeida-Famada, L. D., Escobar-Herrera, T., Xilotl, M., and Egan, A. (2020). Restoring natural habitats and protecting coastal communities in Cuba. UNDP. Available Online at: https://undp.medium.com/this-village-needed-this-project-and-it-arrived-in-the-right-moment-4c72c3047694.
Arkema, K., Guannel, G., Verutes, G., Wood, S., Guerry, A., Ruckelshaus, M., et al. (2013). Coastal habitats shield people and property from sea-level rise and storms. Nat. Clim. Change 3, 913–918. doi: 10.38/NCLIMATE1944
Balmford, A., Bruner, A., Cooper, P., Costanza, R., Farber, S., Green, R. E., et al. (2002). Economic reasons for conserving wild nature. Science 297, 950–953. doi: 10.1126/science.1073947
Bunting, P., Rosenqvist, A., Lucas, R., Rebelo, L.-M., Hilarides, L., Thomas, N., et al. (2018). The Global Mangrove Watch – a New 2010 Global Baseline of Mangrove Extent. Remote Sens. 10:1669. doi: 10.3390/rs1010669
Chong, V. C. (2006). Sustainable utilization and management of mangrove ecosystems of Malaysia. Aqu. Ecosys. Health Manage. 9, 249–260.
Cifuentes, M., Rivera, C. G., Rivas, J. M., Velasquez, S., Gómez, D. T., et al. (2018). Dinámica de la cobertura del suelo y las existencias de carbono en los manglares de El Salvado. Turrialba: CATIE.
Cohen-Shacham, E., Walters, G., Janzen, C., and Maginnis, S. (eds) (2016). Nature-based Solutions to address global societal challenges. Gland: IUCN, 97.
Dobson, J. G., Johnson, I. P., Kowal, V. A., Rhodes, K. A., Lussier, B. C., and Byler, K. A. (2021). GuamCoastal Resilience Assessment. UNC Asheville National Environmental Modeling and Analysis Center. Asheville, NC: Prepared for the National Fish and Wildlife Foundation.
Earth Security (2020). Financing the Earth’s assets: The case for mangroves as a nature-based climate solution. London, UK: Earth Security
Engel, S., Pagiola, S., and Wunder, S. (2008). Designing payments for environmental services in theory and practice: an overview of the issues. Ecol. Econ. 65, 663–674.
Environmental Protection Agency [EPA] (2016). Technical Support Document: Technical Update of the Social Cost of Carbon for Regulatory Impact Analysis Under Executive Order 12866. Available online at: https://19january2017snapshot.epa.gov/sites/production/files/201612/documents/sc_co2_tsd_august_2016.pdf.
Hamilton, S. E., and Friess, D. A. (2018). Global carbon stocks and potential emissions due to mangrove deforestation from 2000 to 2012. Nat. Clim. Change 8, 240–244. doi: 10.1038/s41558-018-0090-4
Hernández-Blanco, M. (2019). The Treasure of the Commons: Valuing and Managing Natural Capital in Costa Rica. [PhD Thesis], Canberra: The Australian National University.
Hernández-Blanco, M., Costanza, R., and Cifuentes-Jara, M. (2021). Economic valuation of the ecosystem services provided by the mangroves of the Gulf of Nicoya using a hybrid methodology. Eco. Services 49:101258. doi: 10.1016/j.ecoser.2021.101258
Herr, D., and Landis, E. (2016). Coastal blue carbon ecosystems. Opportunities for Nationally Determined Contributions. Policy Brief. Switzerland: IUCN.
IUCN (2019). Río Paz Basin. Available online at: https://www.iucn.org/regions/mexico-central-america-and-caribbean/r%C3%ADo-paz-basin. (accessed on May 24, 2020)
Lau, W. W. (2013). Beyond carbon: conceptualizing payments for ecosystem services in blue forests on carbon and other marine and coastal ecosystem services. Ocean Coast. Manage. 83, 5–14. doi: 10.1016/j.ocecoaman.2012.03.011
Lovelock, C. E., Fourqurean, J. W., and Morris, J. T. (2017). Modeled CO2 Emissions from Coastal Wetland Transitions to Other Land Uses: Tidal Marshes, Mangrove Forests, and Seagrass Beds. Front. Mar. Sci. 4:143. doi: 10.3389/fmars.2017.00143
Macreadie, P. I., Atwood, T. B., Seymour, J. R., Fontes, M. L. S., Sanderman, J., Nielsen, D. A., et al. (2019). Vulnerability of seagrass blue carbon to microbial attack following exposure to warming and oxygen. Sci. Total Environ. 686, 264–275. doi: 10.1016/j.scitotenv.2019.05.462
Maldonado, J. H., and Zarate-Barrera, T. G. (2015). Valuing blue carbon: carbon sequestration benefits provided by the marine protected areas in Colombia. PLoS One 10:e0126627. doi: 10.1371/journal.pone.0126627
MARN (2017). Plan de acción de restauración de ecosistemas y paisajes de El Salvador con enfoque de mitigación basada en adaptación. El Salvador: Ministerio de Ambiente y Recursos Naturales.
Millennium Ecosystem Assessment (2005). Ecosystems and human well-being: Synthesis. Washington, DC: Millennium Ecosystem Assessment
Ministerio de Ambiente y Recursos Naturales [MARN]. (2013). Informe técnico: Estudio de la cobertura de mangle en la República de Guatemala. Guatemala: MARN.
Ministerio de Medio Ambiente y Recursos Naturales [MARN] (2018). Inventario Nacional de Bosques de El Salvador (IBN) 2018. El Salvador: MARN
Moritsch, M. M., Young, M., Carnell, P., Macreadie, P. I., Lovelock, C., Nicholson, E., et al. (2021). Estimating blue carbon sequestration under coastal management scenarios. Sci. Total Environ. 777:145962. doi: 10.1016/j.scitotenv.2021.145962
Morris, J. T. P. V., Sundareshwar, P. V., Nietch, C., Kjerfve, T. B., Cahoon, D., et al. (2002). Responses of coastal wetlands to rising sea level. Ecology 83, 2869–2877.
Muradian, R., Corbera, E., Pascual, U., Kosoy, N., and May, P. H. (2010). Reconciling theory and practice: an alternative conceptual framework for understanding payments for environmental services. Ecol. Econ. 69, 1202–1208.
Murray, B. C., Jenkins, W. A., Sifleet, S., Pendleton, L., and Baldera, A. (2010). Payments for blue carbon: Potential for protecting threatened coastal habitats. Policy Brief. Durham: Nicholas Institute for Environmental Policy Solutions. Durham: Duke University.
Navrud, S., and Ready, R. (2007). Lessons learned for environmental value transfer. In Environmental value transfer: Issues and methods. Berlin: Springer, 283–290.
Pendleton, L., Donato, D. C., Murray, B. C., Crooks, S., Jenkins, W. A., Sifleet, S., et al. (2012). Estimating Global “Blue Carbon” Emissions from Conversion and Degradation of Vegetated Coastal Ecosystems. PLoS One 7:e43542. doi: 10.1371/journal.pone.0043542.
Polidoro, B. A., Carpenter, K. E., Collins, L., Duke, N. C., Ellison, A. M., et al. (2010). The Loss of Species: mangrove Extinction Risk and Geographic Areas of Global Concern. PLoS One 5:e10095. doi: 10.1371/journal.pone.0010095
Rodriguez-Hernández, C. H. (2017). Existencias de carbono azul y la dinámica histórica de la cobertura del bosque manglar en el área conservación Sipacate Naranjo. Turrialba: CATIE.
Russi, D., Ten Brink, P., Farmer, A., Badura, T., Coates, D., Förster, J., et al. (2013). The economics of ecosystems and biodiversity for water and wetlands. London: IEEP, 78.
Salem, M. E., and Mercer, D. E. (2012). The economic value of mangroves: a meta-analysis. Sustainability 4, 359–383. doi: 10.3390/ijerph17165830
Schomers, S., and Matzdorf, B. (2013). Payments for ecosystem services: A review and comparison of developing and industrialized countries. Ecosys. Services 6, 16–30. doi: 10.1016/j.ecoser.2013.01.002
Science Task Force for the UN Decade on Ecosystem Restoration (2021). Science-based ecosystem restoration for the 2020s and beyond. Switzerland: IUCN.
Seddon, N., Sengupta, S., García-Espinosa, M., Hauler, I., Herr, D., and Rizvi, A. R. (2019). Nature-based Solutions in Nationally Determined Contributions: Synthesis and recommendations for enhancing climate ambition and action by 2020. Oxford: University of Oxford.
Sharp, R., Tallis, H. T., Ricketts, T., Guerry, A. D., Wood, S. A., Kramer, R. C., Nelson, E., et al. (2016). InVEST +VERSION+ User’s Guide. The Natural Capital Project. Stanford, US: Stanford University
Silver, J. M., Arkema, K., Griffin, R. M., Lashley, B., Lemay, M., Maldonado, S., et al. (2019). Advancing Coastal Risk Reduction Science and Implementation by Accounting for Climate, Ecosystems, and People. Front. Mar. Sci. 6:556. doi: 10.3389/fmars.2019.00556
Simard, M., Fatoyinbo, T., Smetanka, C., Rivera-monroy, V. H., Castaneda-mova, E., Thomas, N., et al. (2019). Global Mangrove Distribution, Aboveground Biomass, and Canopy Height. Tennessee, USA: ORNL DAAC. doi: 10.3334/ORNLDAAC/1665
Tolman, H. L. (2009). User manual and system documentation of WAVEWATCH III version 3.14, Technical Note, U. S. Department of Commerce Nat. Oceanic and Atmosphe. Admin., Nat. Weather Service. Camp Springs, MD:Nat. Centers for Environmental Pred.
UNEP (2020). The United Nations Decade on Ecosystem Restoration Strategy’. Available online at https://wedocs.unep.org/bitstream/handle/20.500.11822/31813/ERDStrat.pdf?sequence=1&isAllowed=y.
UNEP/GPA (2003). The economic valuation of alternative uses of mangrove forests in Sri Lanka. Nairobi: UNEP
Valiela, I., Bowen, J., and York, J. (2001). Mangrove Forests: One of the World’s Threatened Major Tropical Environments. Bioscience 10:807. doi: 10.1371/journal.pone.0250022
Wedding, L. M., Moritsch, M. M., Verutes, G., Arkema, K., Hartge, E., Reiblich, J., et al. (2021). Incorporating blue carbon sequestration benefits into sub-national climate policies. Glob. Environ. Change 69:102206.
Keywords: mangroves, ecosystem services, natural capital, coastal protection, blue carbon
Citation: Hernández-Blanco M, Moritsch M, Manrow M and Raes L (2022) Coastal Ecosystem Services Modeling in Latin America to Guide Conservation and Restoration Strategies: The Case of Mangroves in Guatemala and El Salvador. Front. Ecol. Evol. 10:843145. doi: 10.3389/fevo.2022.843145
Received: 24 December 2021; Accepted: 10 February 2022;
Published: 24 March 2022.
Edited by:
Kamaljit Kaur Sangha, Charles Darwin University, AustraliaReviewed by:
Fernanda Adame, Griffith University, AustraliaHsiao-Chun Tseng, National Taiwan Ocean University, Taiwan
Copyright © 2022 Hernández-Blanco, Moritsch, Manrow and Raes. This is an open-access article distributed under the terms of the Creative Commons Attribution License (CC BY). The use, distribution or reproduction in other forums is permitted, provided the original author(s) and the copyright owner(s) are credited and that the original publication in this journal is cited, in accordance with accepted academic practice. No use, distribution or reproduction is permitted which does not comply with these terms.
*Correspondence: Marcello Hernández-Blanco, bWFyY2VsbG8uaGVybmFuZGV6LmJAZ21haWwuY29t