 Yaran Yu
 Zhiyong Wang
 Zhenjin Li
- College of Geodesy and Geomatics, Shandong University of Science and Technology, Qingdao, China
The excessive exploitation of coal resources has caused serious land subsidence, which seriously threatens the lives of the residents and the ecological environment in coal mining areas. Therefore, it is of great significance to precisely monitor and analyze the land subsidence in the mining area. To automatically detect the subsidence basins in the mining area from the interferometric synthetic aperture radar (InSAR) interferograms with wide swath, a lightweight model for detecting the subsidence basins with an anchor-free and adaptive sample assignment based on the YOLO V5 network, named Light YOLO-Basin model, is proposed in this paper. First, the depth and width scaling of the convolution layers and the depthwise separable convolution are used to make the model lightweight to reduce the memory consumption of the CSPDarknet53 backbone network. Furthermore, the anchor-free detection box encoding method is used to deal with the inapplicability of the anchor box parameters, and an optimal transport assignment (OTA) adaptive sample assignment method is introduced to solve the difficulty of optimizing the model caused by abandoning the anchor box. To verify the accuracy and reliability of the proposed model, we acquired 62 Sentinel-1A images over Jining and Huaibei coalfield (China) for the training model and experimental verification. In contrast with the original YOLO V5 model, the mean average precision (mAP) value of the Light YOLO-Basin model increases from 45.92 to 55.12%. The lightweight modules of the model sped up the calculation with the one billion floating-point operations (GFLOPs) from 32.81 to 10.07 and reduced the parameters from 207.10 to 40.39 MB. The Light YOLO-Basin model proposed in this paper can effectively recognize and detect the subsidence basins in the mining areas from the InSAR interferograms.
Introduction
Large-scale land subsidence resulting from coal mining has caused a series of ecological and environmental problems, including destroying farmlands, damaging buildings, and even inducing geological disasters (Wang et al., 2021a; Yuan et al., 2021). It threatens the lives and property of the local residents and restricts the economic sustainable development in mining areas (Fan et al., 2018; Wang et al., 2020). Therefore, it is of great significance to continuously monitor and analyze the land subsidence in mining areas. Traditional geodetic surveying methods mainly include precise leveling, total station measurement, and global navigation satellite system (GNSS) (Fan et al., 2018). These methods have some limitations such as low spatial resolution, limited monitoring area, and low observation efficiency (Chen et al., 2015; Chen Y. et al., 2020; Shi M. Y. et al., 2021). Interferometric synthetic aperture radar (InSAR) technology has become a new means for monitoring the surface deformation in mining areas with the advantages of day/night data acquisition, all-weather imaging capability, and strong penetrability (Ng et al., 2017; Chen B. Q. et al., 2020; Wang et al., 2020).
Currently, the main research directions of InSAR technology for monitoring mine subsidence have evolved from acquiring single surface deformation information to three-dimensional deformation information or subsidence prediction based on deformation theory (Yang et al., 2017a,b, 2018a,b; Chen et al., 2021; Dong et al., 2021; Fan et al., 2021). Most of these works are targeted at one or more subsidence basins. However, the imaging mode of mainstream synthetic aperture radar (SAR) satellites, such as ALOS-2 and RadarSat-2, has an image width of more than 80 km. The image width of the interferometric wide swath (IW) mode of the Sentinel-1A satellite even reaches 250 km (Zheng et al., 2018). It is time-consuming and labor-intensive to search for subsidence basins with a radius of only a few hundred meters in a wide range of images. At present, there have been few studies on the automatic detection of subsidence basins from the InSAR interferogram. Hu et al. (2013) proposed a differential interferometric synthetic aperture radar (D-InSAR) based illegal-mining detection system, aiming to increase both accuracy and efficiency of underground-mining detection. The detection results are highly dependent on the quality of the phase unwrapping and subjective processing experience. By using the methods of D-InSAR technology, geographic information system (GIS), and mining subsidence, Xia et al. (2018) proposed a novel theory of effectively recognizing the subsidence basins. This method can detect subsidence basins without manual intervention. However, like the method proposed by Hu et al. (2013), the detection accuracy will also be affected by the quality of the phase unwrapping. Yang et al. (2018c) proposed a space-based method for recognizing the subsidence basins by relating the geometric parameters of subsidence basins to the InSAR derived line of sight deformation with the probability integral method (PIM). This method can determine the boundary of the subsidence basins, but it is not suitable for detecting subsidence basins in large-scale areas. Du et al. (2019) proposed a feature-point-based method for efficiently detecting subsidence basins. Du first used D-InSAR to monitor subsidence basins caused by mining and then used the PIM to determine the inflection and boundary points of the subsidence basins. Wang et al. (2021b) proposed a model for detecting the subsidence basin based on the histogram of oriented gradient features and support vector machine classifier. This method is limited by the feature detection operator and cannot effectively detect the subsidence basin with obscure edge features and too small scope. Bala et al. (2021) proposed a circlet transform method for detecting subsidence basins. This method reduces manual intervention, but the detection time is longer. Due to the long detection time, the above methods are difficult to carry out in a large-scale area. Furthermore, these methods conduct detection mostly based on the deformation gradient and the shape characteristics of the subsidence basin on the deformation map. The quality of the phase unwrapping is susceptible to atmospheric effects and noises, resulting in lower detection accuracy. Therefore, we propose a new method to detect subsidence basins from InSAR interferogram with large-scale areas.
After underground coal mining, a series of subsidence basins will appear in the mining area. Subsidence basins are scattered and large in number in the InSAR interferogram. It is difficult to identify these subsidence basins manually. The single subsidence basin of the mining area in the InSAR interferogram is approximately concentric circles or concentric ellipses, with a small scale and obvious edge features. Currently, the convolution neural network (CNN)-based objection detection method has been widely applied in many research fields (LeCun et al., 2015; Shi et al., 2020; Ren et al., 2021). For SAR images, it is mainly used to identify ships (Chang et al., 2019; Jiang et al., 2021; Wu Z. T. et al., 2021) and marine oil spills, etc. The CNN-based objection detection method can realize the automatic detection of subsidence basins. CNN-based objection detection frameworks primarily consist of three components, including backbone network, neck network, and detection head (Chen Q. S. et al., 2020; Fu K. et al., 2020). The backbone network mainly extracts the basic features of the input image, such as the ResNet (He et al., 2016; Xie et al., 2017) series and the DarkNet series. The main function of the neck network is to further strengthen the features extracted by the backbone network. For example, the feature pyramid network (FPN) combined features of different scales with lateral connections in a top-down manner to construct a series of scale-invariant feature maps, and multiple scale-dependent classifiers were trained on these feature pyramids (Lin et al., 2017a). The detection head network is responsible to predict and refine the bounding box, calculating the bounding box coordinates, confidence score, and classification score. According to the different head networks, object detection frameworks can be primarily divided into two categories. One is two-stage detectors that have high detection accuracy, mainly including R-CNN (Girshick et al., 2014), Fast-RCNN (Girshick, 2015), and Faster-RCNN (Ren et al., 2015), etc. Two-stage detectors first use a region proposal network to generate a sparse set of candidate object bounding boxes and then to extract features from each candidate bounding box for the following classification and bounding box regression tasks. The other is one-stage detectors that achieve high inference speed, mainly including the YOLO series (Redmon et al., 2016; Redmon and Farhadi, 2017, 2018; Bochkovskiy et al., 2020), SSD (Liu et al., 2016), and RetinaNet (Lin et al., 2017b), etc. One-stage detectors generate prediction boxes, confidence scores, and object classes concurrently.
At present, many CNN-based object detection methods have been proposed, most of which are designed to detect objects in natural images. However, there are two problems for recognizing the subsidence basins when directly using these methods. First, due to the various object categories and shapes in natural images, big networks (such as DarkNet53, Resnet101) are often used as the backbone. However, the shape of the subsidence basin is relatively simple and the detection category is single, hence there is no need for a heavy network to detect subsidence basin. In addition, with the continuous development of SAR satellites, the image width is also increasing, then it will also increase the burden on the computer hardware when using heavy networks. Second, the anchor boxes obtained by clustering object structure in natural images are not suitable for the detection of subsidence basins.
The YOLO V5 model, a one-stage detector, has the advantages of high accuracy and fast speed. It has been widely used in various domains such as face recognition, text detection, and logo detection (Wu W. et al., 2021; Yan et al., 2021; Zhao et al., 2021). In order to automatically recognize and detect subsidence basins in large-scale mining areas with high accuracy, we proposed a lightweight detection model with adaptive sample assignment. The proposed model is based on the path aggregation network (PANet) of YOLO V5.
The main sections of this paper are organized as follows. In section “Data and Materials,” the model proposed in this paper for detecting the subsidence basins from the InSAR interferogram is described. It mainly includes the depthwise separable convolution, anchor-free, and OTA adaptive sample assignment. The experimental results and quantitative evaluation are presented in Section “Method.” Section “Results and Analysis” shows the discussions and the analysis of each module in the proposed model and the comparison results with the original YOLOV5 model. Finally, some valuable conclusions of this study are drawn in Section “Discussion.”
Data and Materials
Study Area
We selected the Jining and Huaibei mining areas in China as the study areas. The two mining areas are rich in coal resources and have a long mining history. There are many mines in the two areas with a complex distribution. The Jining mining area (115°50′–117°48′E, 34°58′–35°59′N) is located in the southwest of Shandong Province, China, with a cumulative proven coal reserve of nearly 15.1 billion tons. The Huaibei mining area (116°23′–117°12′E, 33°16′–34°14′N) is located in the north of the Huaihe River of Anhui Province, China, with a cumulative proven coal reserve of 13 billion tons. The locations of the study areas are shown in Figure 1.
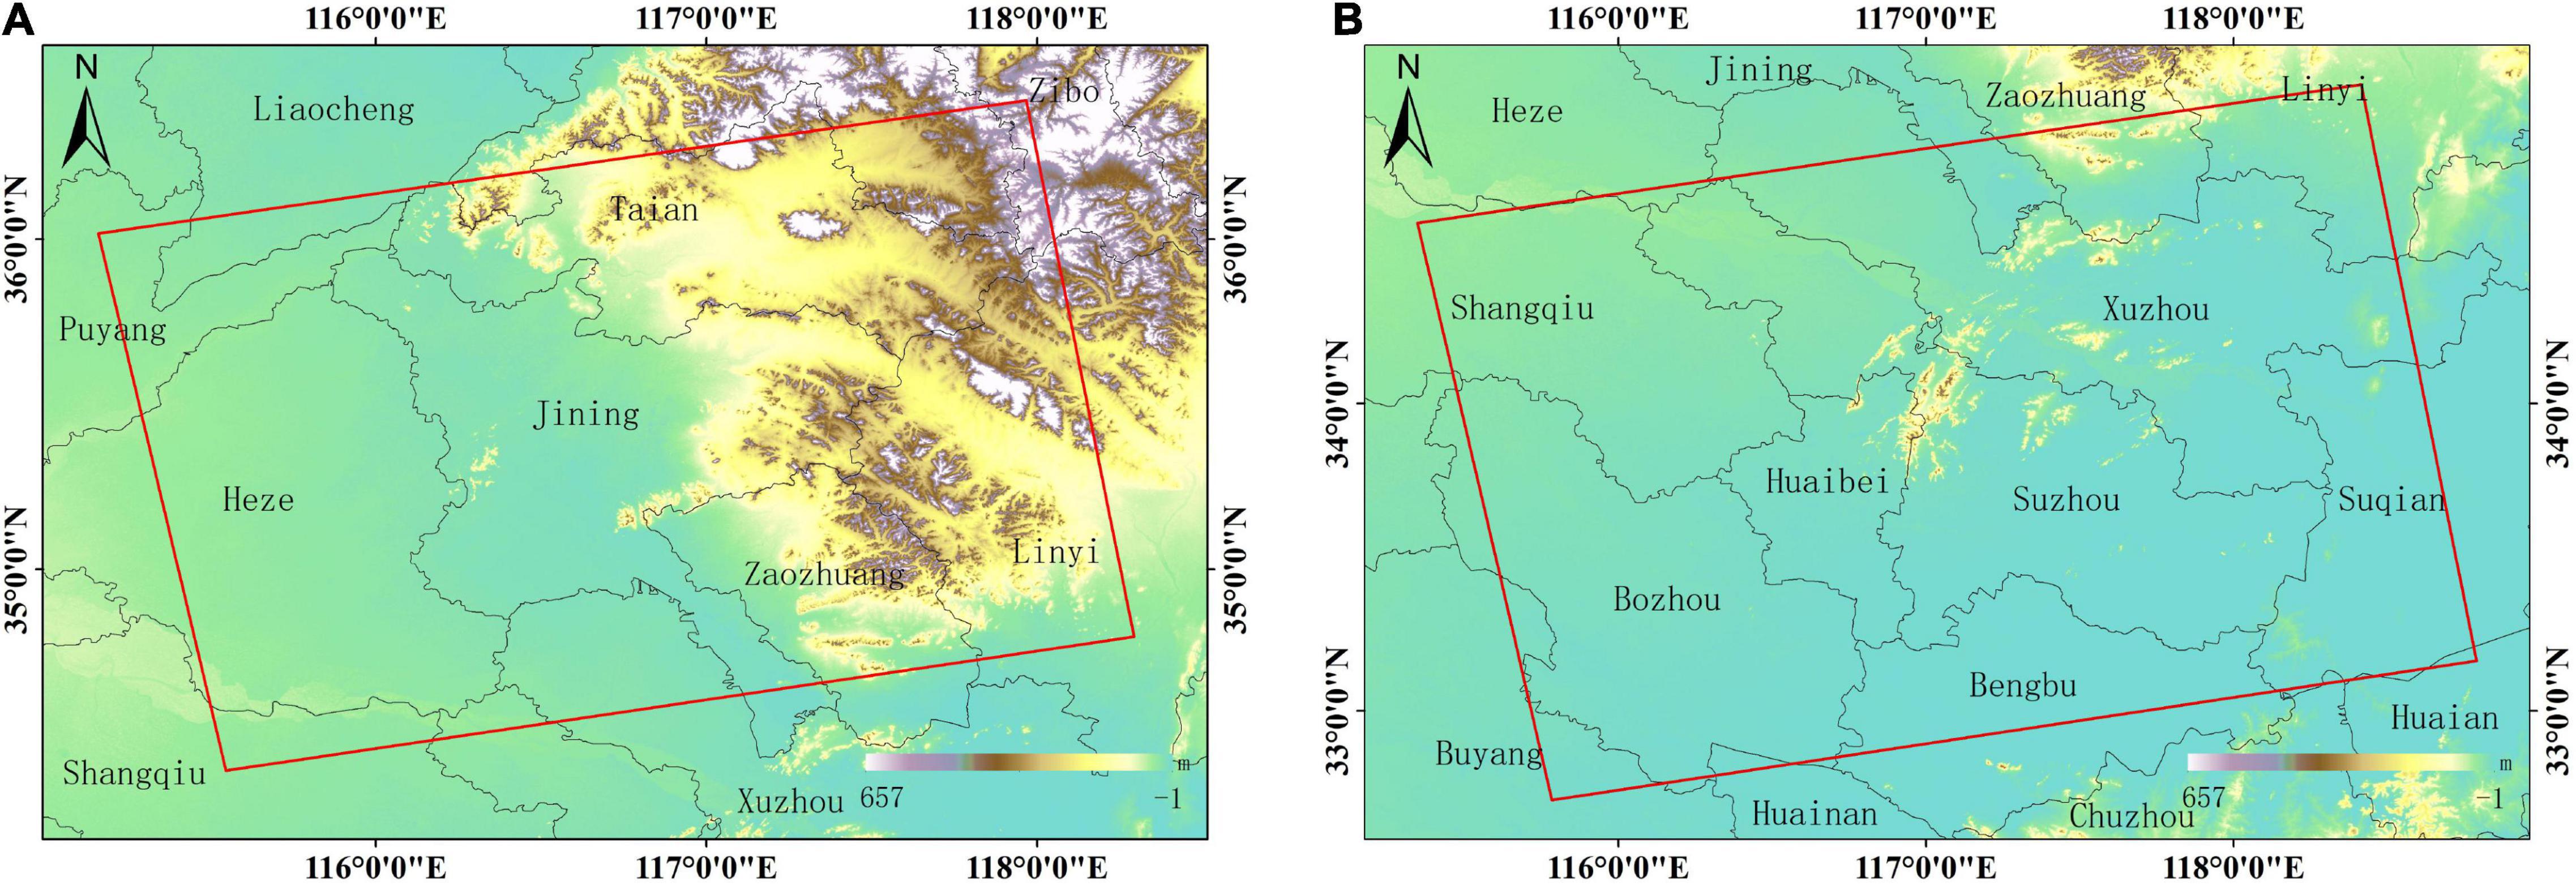
Figure 1. Location of the study area. (A) The geographic location of the Jining mining area; (B) geographic location of the Huaibei mining area.
Experimental Data
We used 24 Sentinel-1A images acquired from November 2017 to March 2020 over the Jining mining area and used 34 Sentinel-1A images acquired from November 2017 to March 2020 over the Huaibei mining area. The specific information of the partial interferometric pairs is shown in Table 1. The experimental Sentinel-1A data are interferometric wide swath imaging mode (Level 1 single-look complex images products) and in VV polarization with the 38.9° incidence angle. The revisit period of Sentinel-1A is 12 days and has a pixel size of about 2.33 × 13.91 m. Moreover, the shuttle radar topography mission digital elevation model (SRTM DEM) released by the National Aeronautics and Space Administration (NASA) was applied to remove both the flattening and terrain phases in D-InSAR data processing.
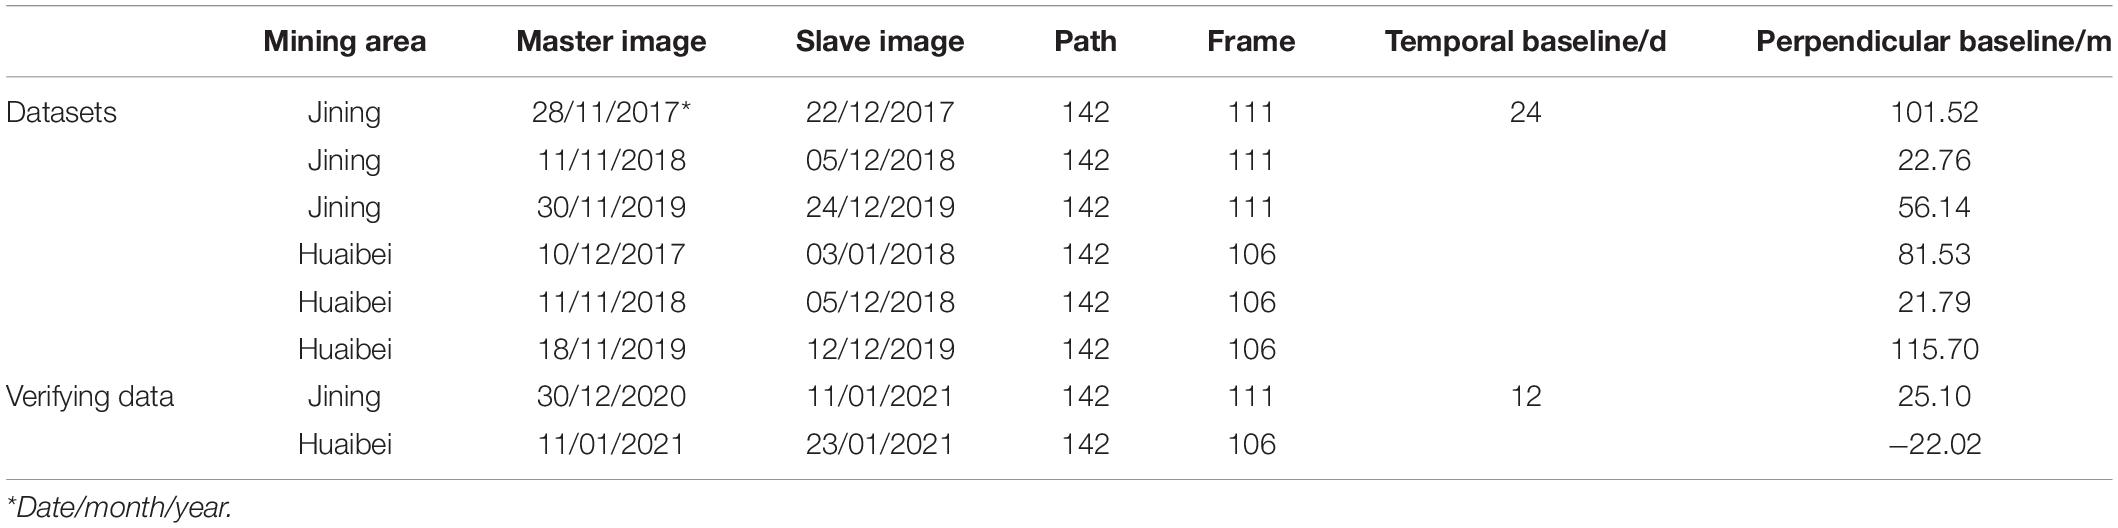
Table 1. Sentinel-1A interferometric pairs for constructing the training/testing datasets and verifying the performance of the proposed model.
In order to obtain the differential interferograms of the two mining areas, we used the two-pass D-InSAR technology (Ou et al., 2018; Dai et al., 2020) to process these Sentinel-1A data. The procedures of D-InSAR technology mainly include interferogram generation, SAR simulation based on digital elevation model (DEM), differential processing between the real interferogram and the simulated interferogram, phase unwrapping, transformation from phase to deformation, and geocoding (Ilieva et al., 2019; Chen D. H. et al., 2020). Figure 2 is a flow chart of the two-pass D-InSAR data processing. Interferograms with serious decoherence and large noise influence were excluded. We set the temporal baseline threshold of the interferogram to 36 days and the spatial baseline threshold to 200 m. The longest spatial baseline of the interferogram in this paper is 155.71 m. We obtained 62 interferograms in the Jining and Huaibei mining areas. The ratio of multi-looking is 1:5. The pixel size in the range direction is 18.54 m, and the pixel size in the azimuth direction is 13.89 m for the interferogram. The interferograms are too large to be used by the deep neural architecture, which generally accepts an image with a size of 416 × 416 as an input. Therefore, we segment the interferograms into smaller sub-images with a size of 416 × 416 according to the standard of the YOLO V5 model. The image data annotation software called “LabelImg” was used to draw the outer rectangular boxes of the subsidence basins on each sub-image, realizing the manual annotation of the border and labels of the ground truth box. The ground truth boxes were annotated according to the features of the subsidence basin. The subsidence basin on the InSAR interferogram is a series of approximately circular or elliptical interferometric fringes with a small scale and obvious edge features (Wang et al., 2021b). We have obtained a total of 1,160 sample images. In this study, 812 sample images were randomly selected from 1,160 images as the training samples; the remaining 30% were selected as the testing samples, which had a total of 348 images. The partial examples of the sample datasets are shown in Figure 3. In order to alleviate the over-fitting phenomenon during the training model incurred by limited sample datasets, rotation, translation, and flipping were used for data augmentation.
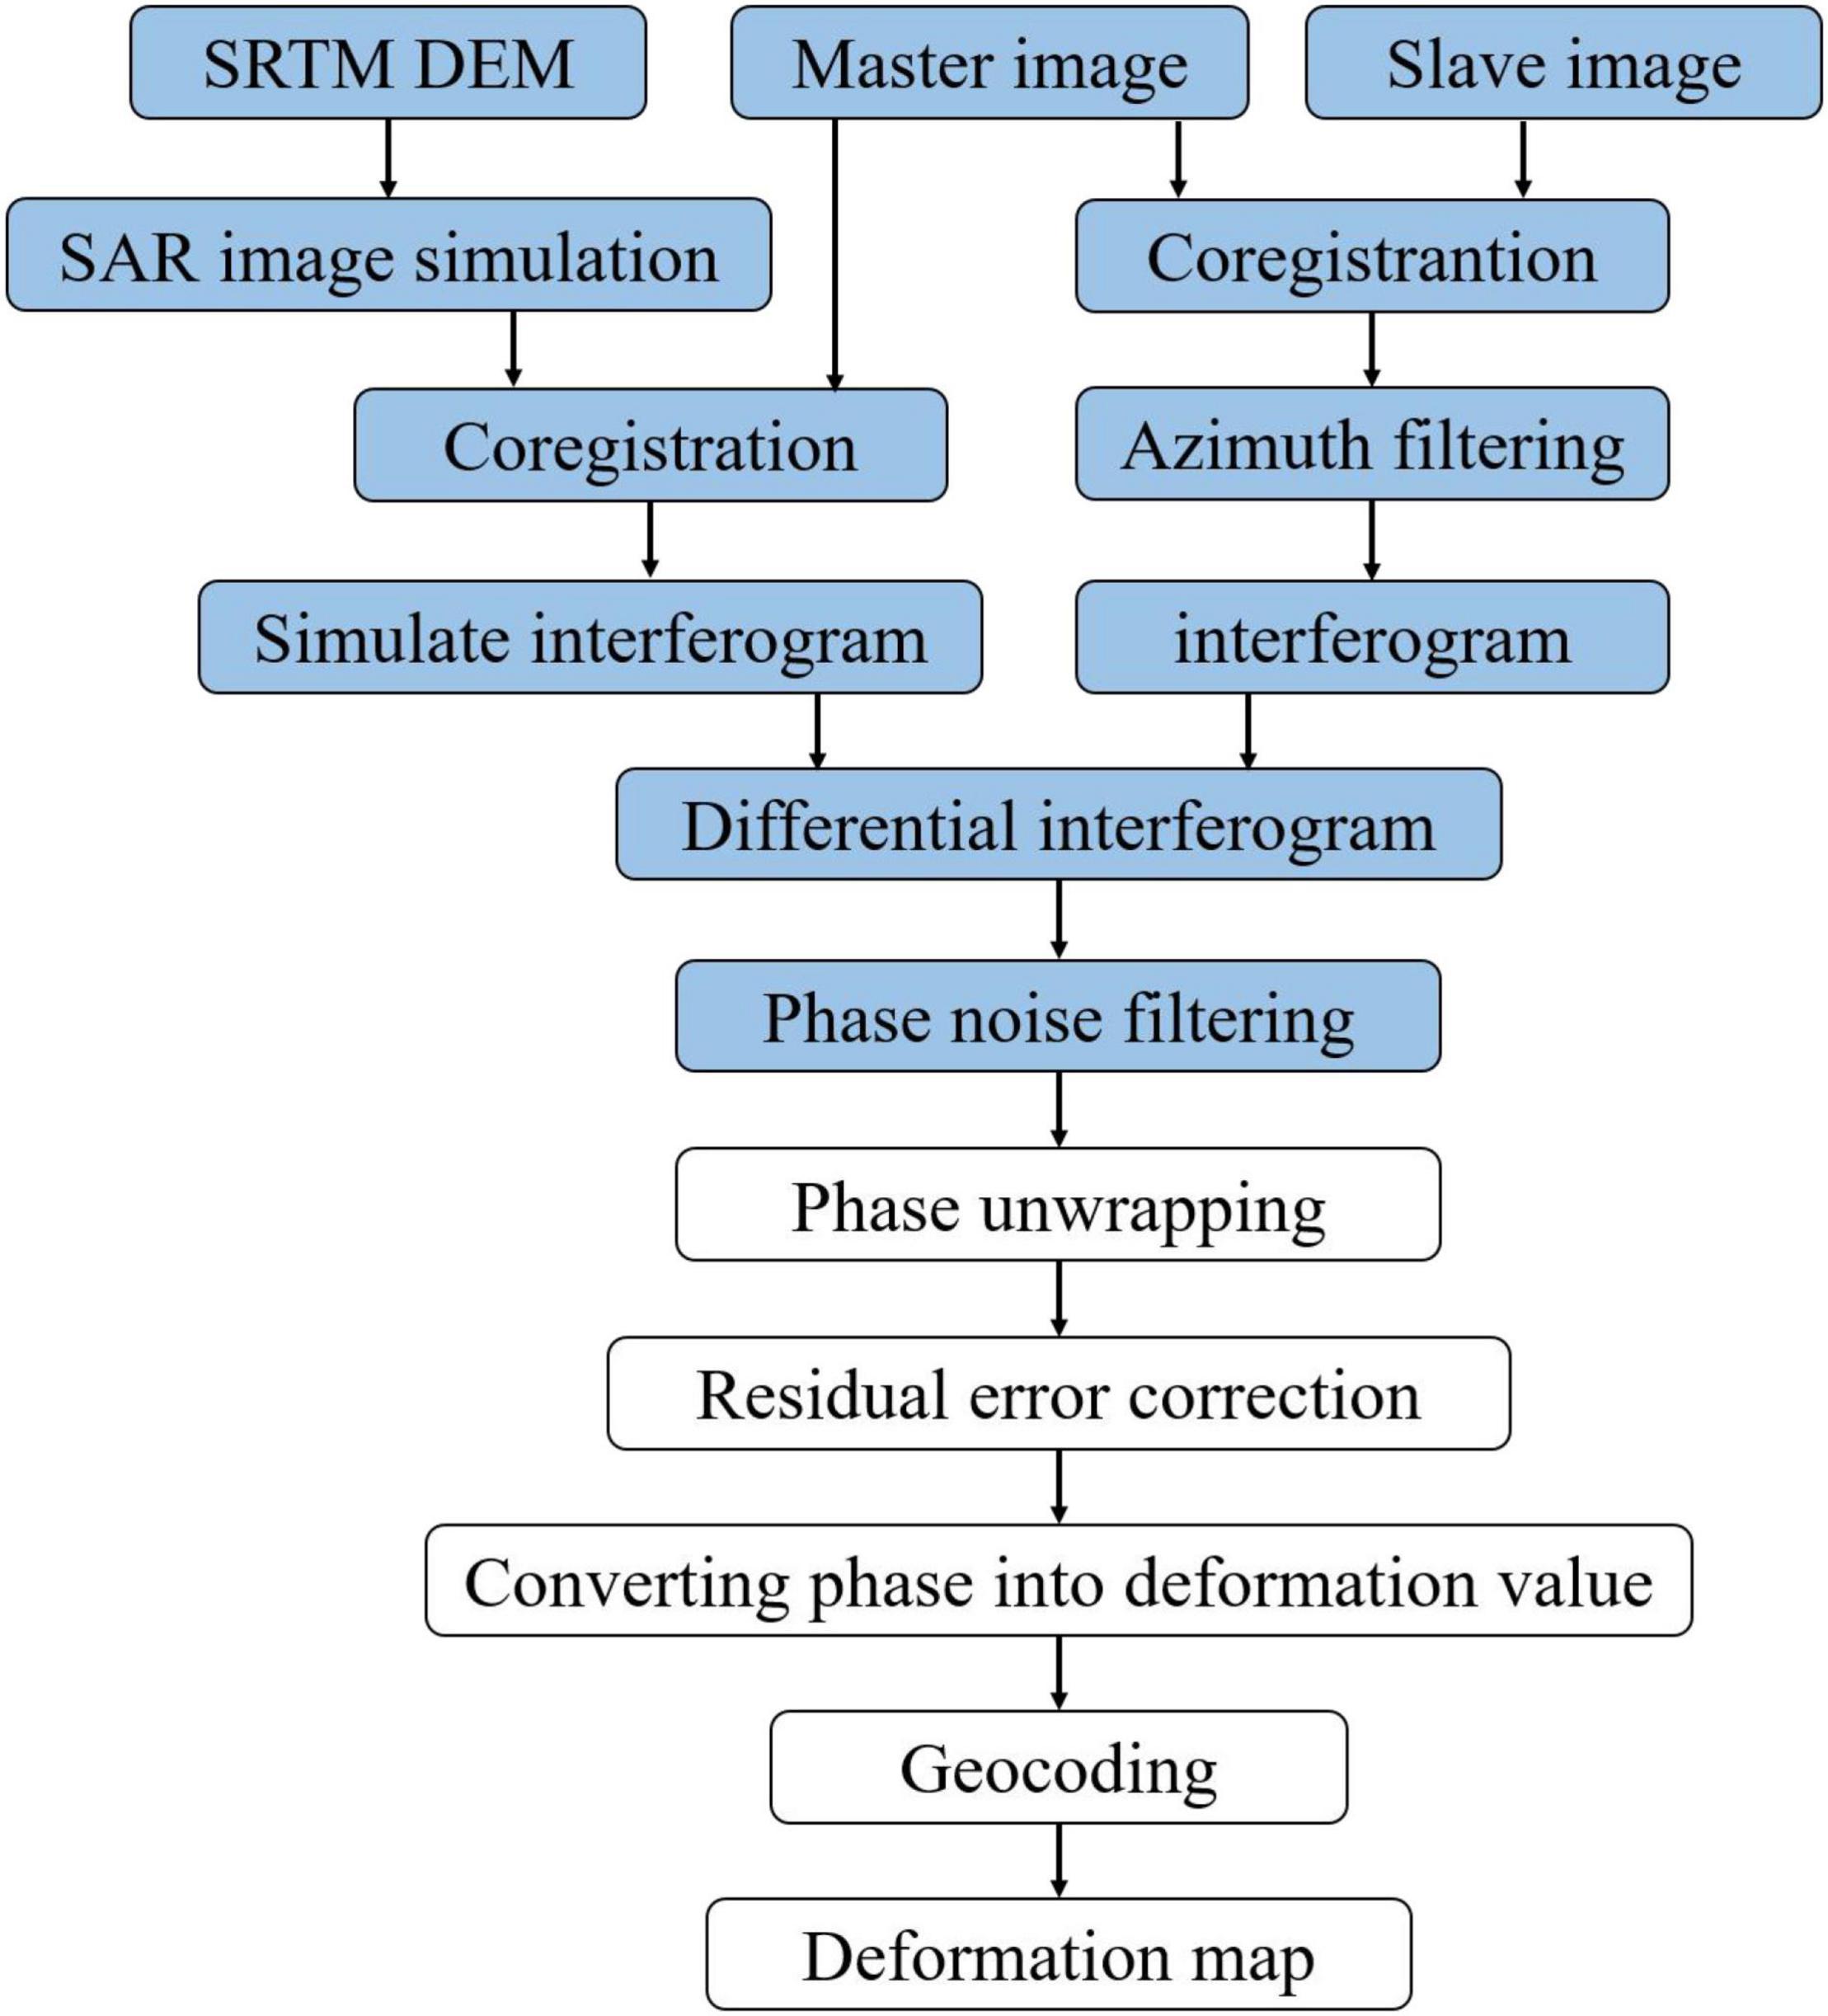
Figure 2. The data processing flow of the two-pass differential interferometric synthetic aperture radar (D-InSAR). The blue part is the data processing implemented in the paper.
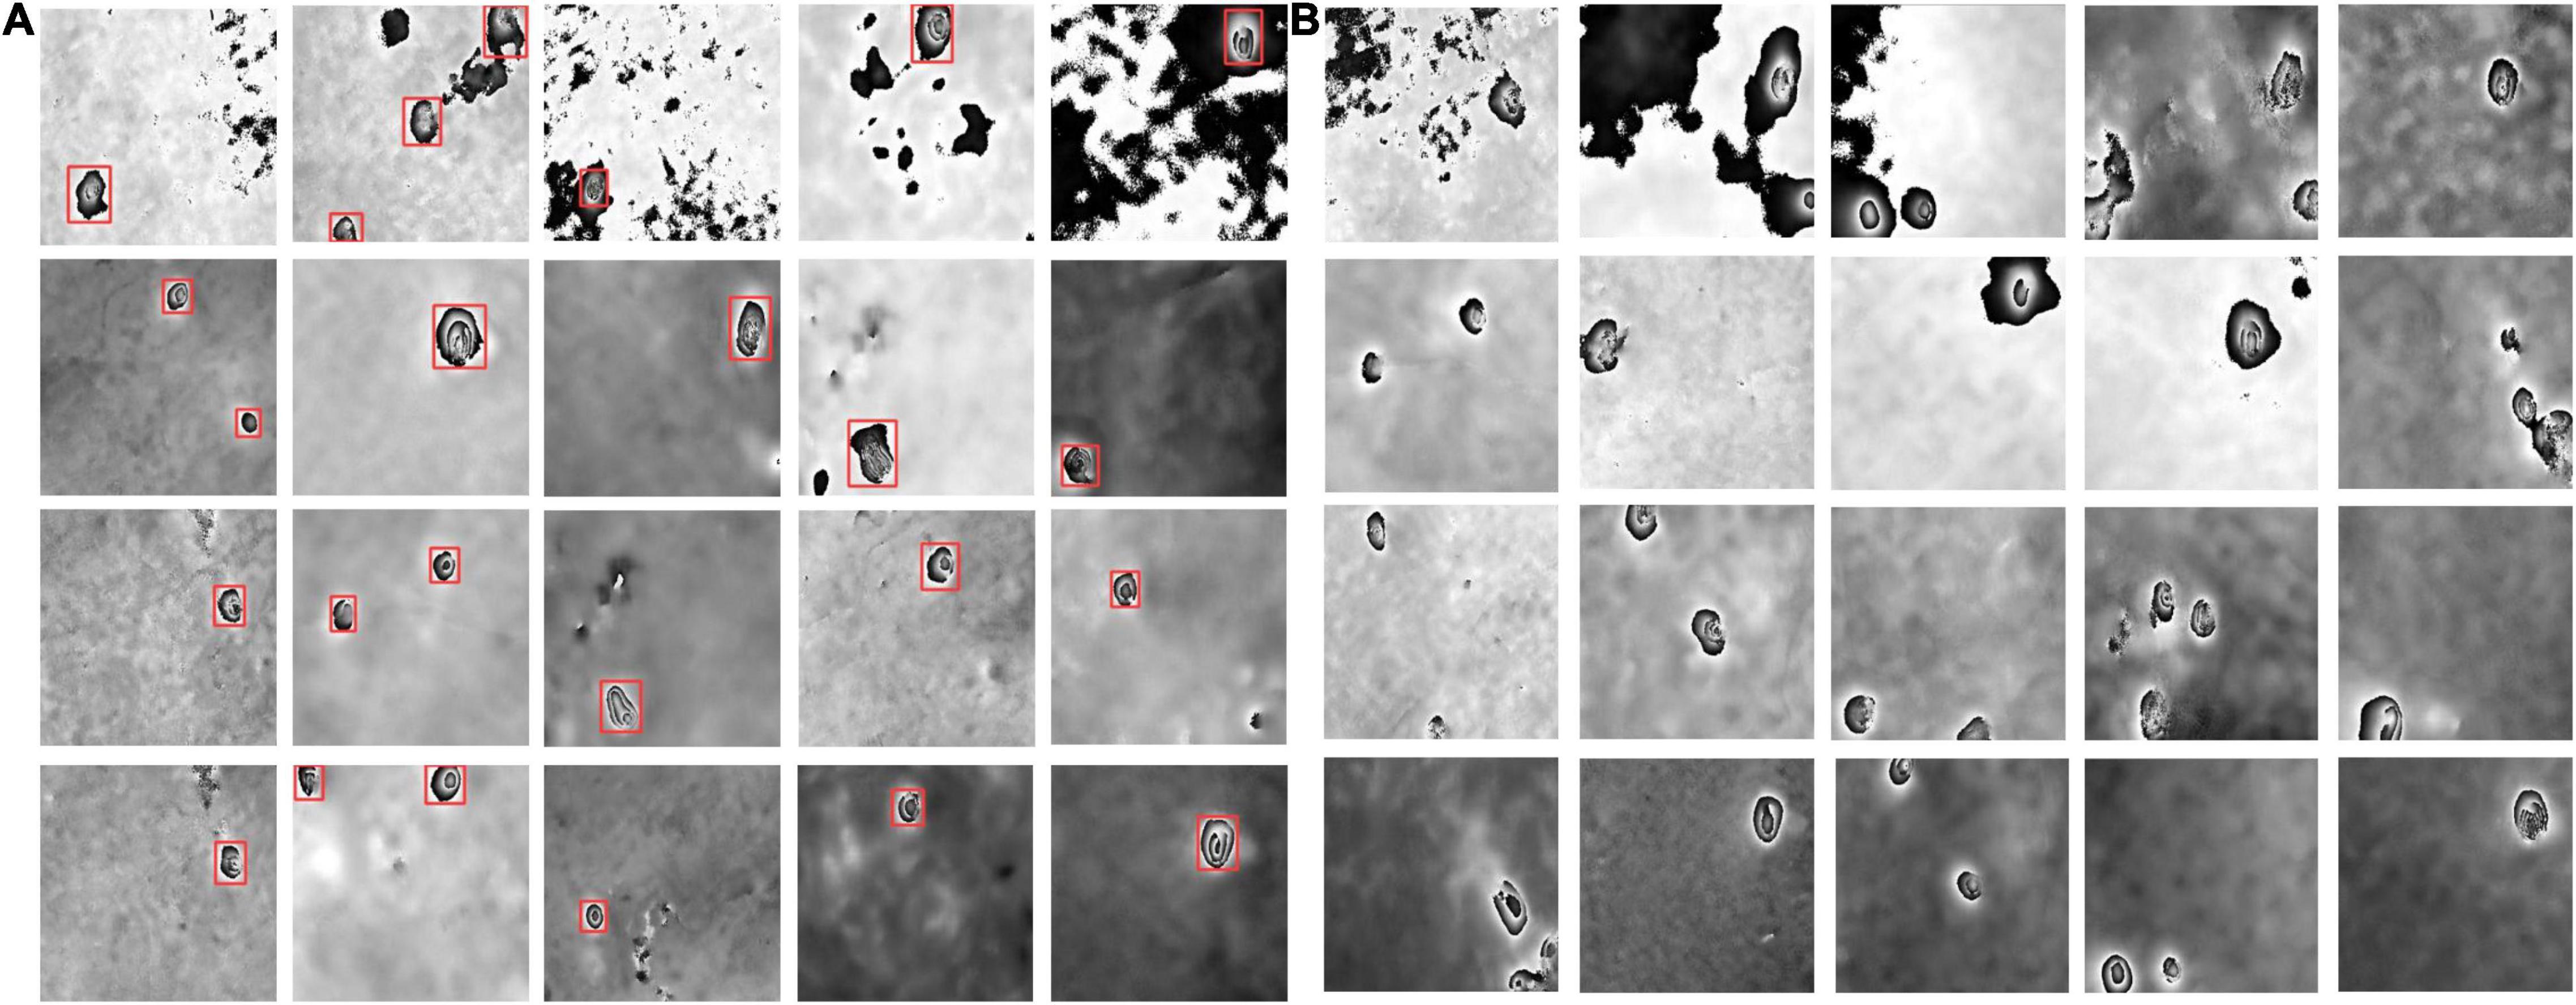
Figure 3. Some examples of sample datasets. (A) Partial training data; (B) partial testing data. The red boxes represent the manual annotation of the ground truth box in panel (A).
We selected two Sentinel-1A images acquired from December 2020 to January 2021 over the Jining mining area and two Sentinel-1A images acquired from January 2021 over the Huaibei mining area, constituting a total of two interferometric pairs to test the performance of the proposed model for detecting the subsidence basins from the interferograms. The parameters of the two interferometric pairs are listed in Table 1.
Method
To automatically detect the subsidence basins from the InSAR interferograms, a lightweight detection model with an adaptive sample assignment based on the YOLO V5 model was proposed. We first use the channel number scaling and depthwise separable convolution (Howard et al., 2017) to make the CSPDarknet53 network lightweight, and then model the prediction boxes as a width and height fit problem based on the center point like the anchor-free strategy in FCOS (Tian et al., 2019). In addition, we also introduced an OTA (Ge et al., 2021) that assigns positive and negative samples in an adaptive manner. The proposed model for detecting the subsidence basin was named the Light YOLO-Basin model. The network architecture of the Light YOLO-Basin model is shown in Figure 4.
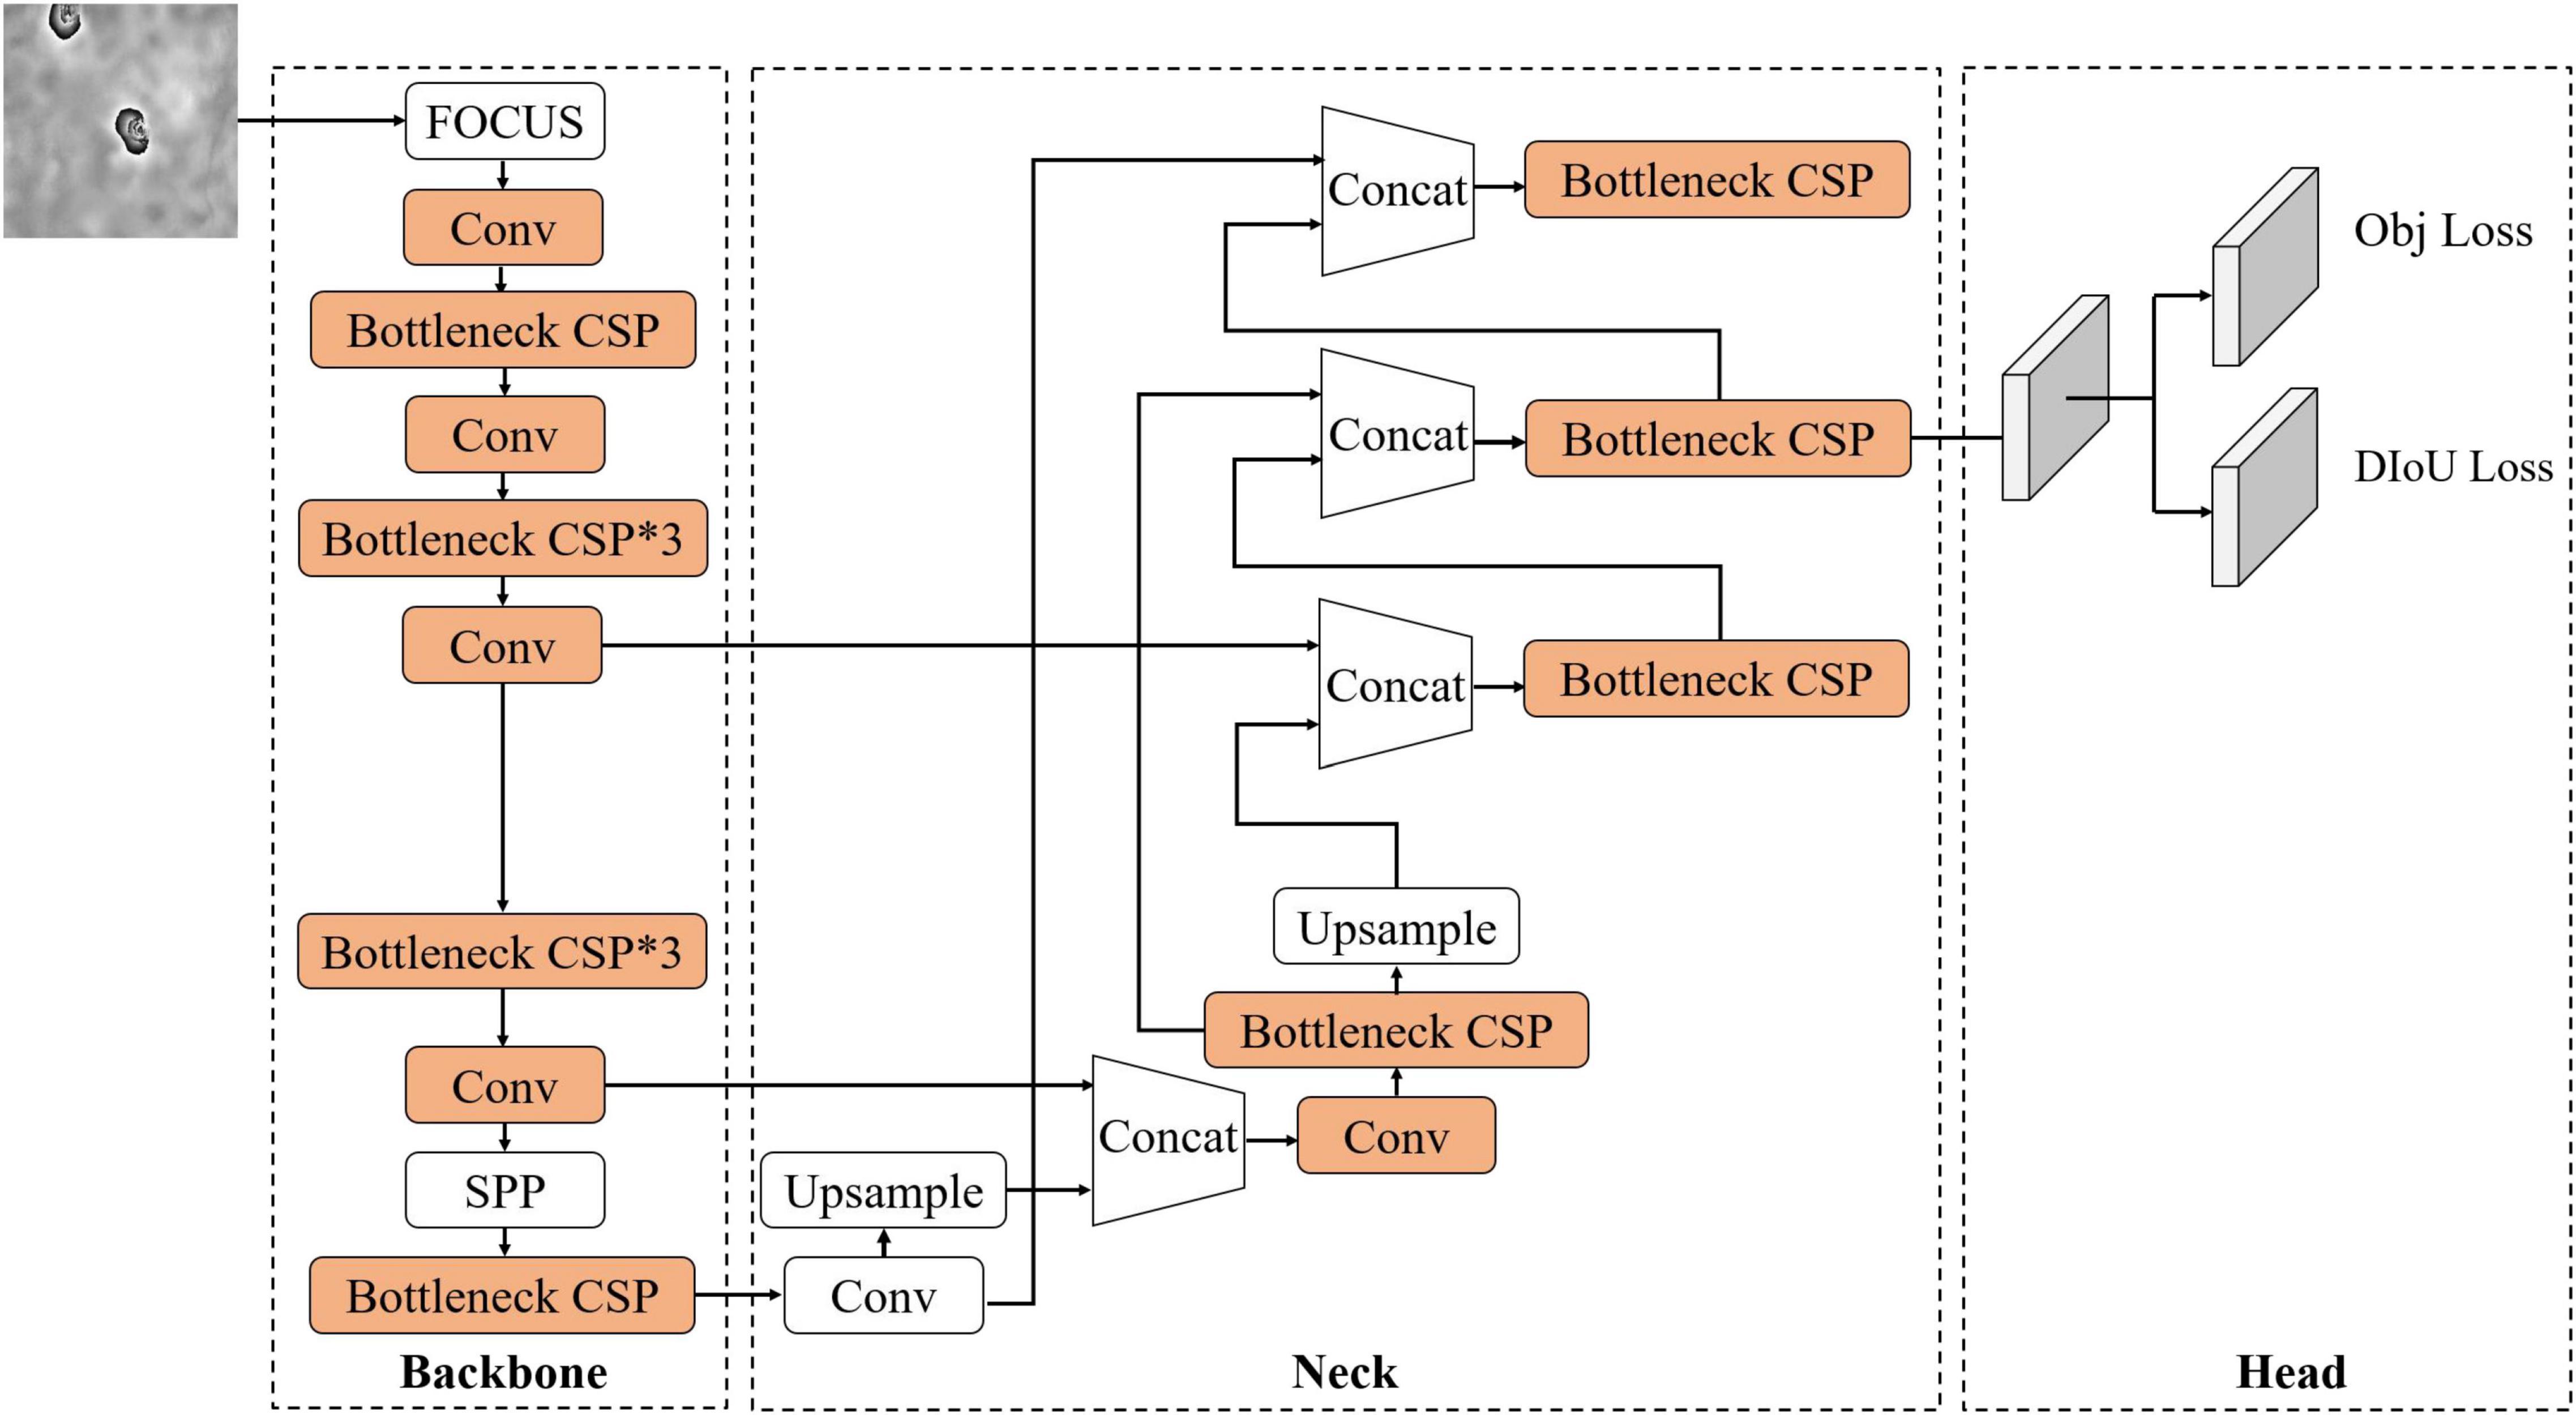
Figure 4. Architecture of the Light YOLO-Basin network. SPP is spatial pyramid pooling. Upsample uses bilinear interpolation. Obj and distance intersection over union loss (DIoU) represent confidence loss and bounding box regression loss, respectively. In addition, convolution modules that can be lightweight are in orange.
YOLO V5 Network
The YOLO V5 model, as the basic framework for detecting the subsidence basins in this paper, mainly consists of three components: backbone network, neck network, and detection head. The backbone network is designed to extract the features of the subsidence basin, mainly composed of the CSPDarknet53 network and spatial pyramid pooling (SPP) (Purkait et al., 2017). The neck network adopts the path aggregation network instead of feature pyramid networks in YOLO V5. The detection head, as the final detection part of the model, is used to output the detection results of the subsidence basin. It utilizes the high-level semantic information outputted from the neck network to classify the category and regress the location of the objects.
The loss function of the YOLO V5 network mainly consists of three parts: bounding box regression loss, classification loss, and confidence loss (Shi P. F. et al., 2021). Since this paper only has the category of the subsidence basins, we only used confidence loss and bounding box regression loss, as shown in Formula (1).
where Lobj and LDIoU mean confidence loss and bounding box regression loss, respectively. λ is the balancing factor and the value is 5 (Yan et al., 2021).
The Light YOLO-Basin model used the Focal Loss (Lin et al., 2017b) function confidence loss to alleviate the problem caused by the imbalanced number of hard and easy samples, as shown in Formula (2), in which the positive sample p with the high confidence is the easy sample and vice versa. Focal loss reduces the weight of easy samples so that the model can focus more on hard samples, ensuring that the contributions of all samples to model parameter updating are relatively balanced.
where y = 1 means positive samples and y = 0 means negative samples; the parameter α is used to balance the weight of the positive and negative samples during the model training; the parameter γ is used to balance the weight of the easy samples in the model; the parameter p ϵ [0,1] is the model estimated probability for the confidence loss. The bounding box regression loss of the original YOLO V5 model adopts generalized intersection over union loss (GIoU Loss), but it only focuses on the overlapping areas and other non-overlapping areas, which ignores the impact of the bounding box on the IoU. The Light YOLO-Basin model used distance IoU loss (DIoU Loss) (Luo et al., 2020) as the bounding box regression loss. DIoU Loss is defined as Formula (3). It not only considers the distance of the center and the overlapping area between the ground truth box and prediction box, but also minimizes the center point distance.
where A represents the area of the prediction box and B represents the area of the ground truth box; the parameter b and bgt mean the center points of the prediction box A and ground truth box B, respectively; ρ2 is the Euclidean Distance between b and bgt; the parameter c represents the diagonal length of the smallest closed shape that includes the ground truth box A and the prediction box B.
The detection head module of the YOLO V5 model directly uses a single convolutional layer to calculate the classification loss, confidence loss, and bounding box regression loss. However, there is no classification loss in our study, the structure of the detection head requires to be changed. Some researches demonstrated that there is a conflict between classification and regression tasks (Song et al., 2020; Wu et al., 2020), so referencing the ideas of FCOS (Tian et al., 2019) and the literature (Song et al., 2020), the Light YOLO-Basin model used double-head as the detection head module. The Light YOLO-Basin model architecture after decoupling is shown in Figure 4. The double-head splits the output features of the subsidence basin into regression and confidence branches. The regression branch provides prediction box coordinates. Meanwhile, the confidence branch calculates the probability of positive samples.
The Lightweight of the CSPDarknet53 Network
At present, the YOLO V5 model has achieved great success in natural image datasets such as PASCAL VOC, ImageNet, and MS COCO. However, compared with objects in natural images, subsidence basins on the interferograms have more obvious edges and texture features and simpler shapes. Intuitively, the detection of the subsidence basins on the interferogram from D-InSAR is simpler than the multi-category detection on natural images. This also leads to the conjecture of whether the heavy CSPDarknet53 network is necessary for detecting the subsidence basins. In order to verify that, we used the three versions of the YOLO V5 model (Large, Middle, and Small) to detect the subsidence basins from the interferograms. The variation of detection accuracy is shown in Figure 5. Experimental results show that as the number of parameters and computations of the model reduces, the detection accuracy of the model shows a rising trend instead of decreasing. The results demonstrate that the detection of subsidence basins does not require a heavy network. In addition, since the swath of SAR images is large wide, for example, the swath of Sentinel-1 is about 250 km, a lightweight model is used to detect subsidence basins from the interferograms to lighten the burden on the computer hardware. Therefore, we introduced depthwise separable convolutions to make the CSPDarknet53 network lightweight.
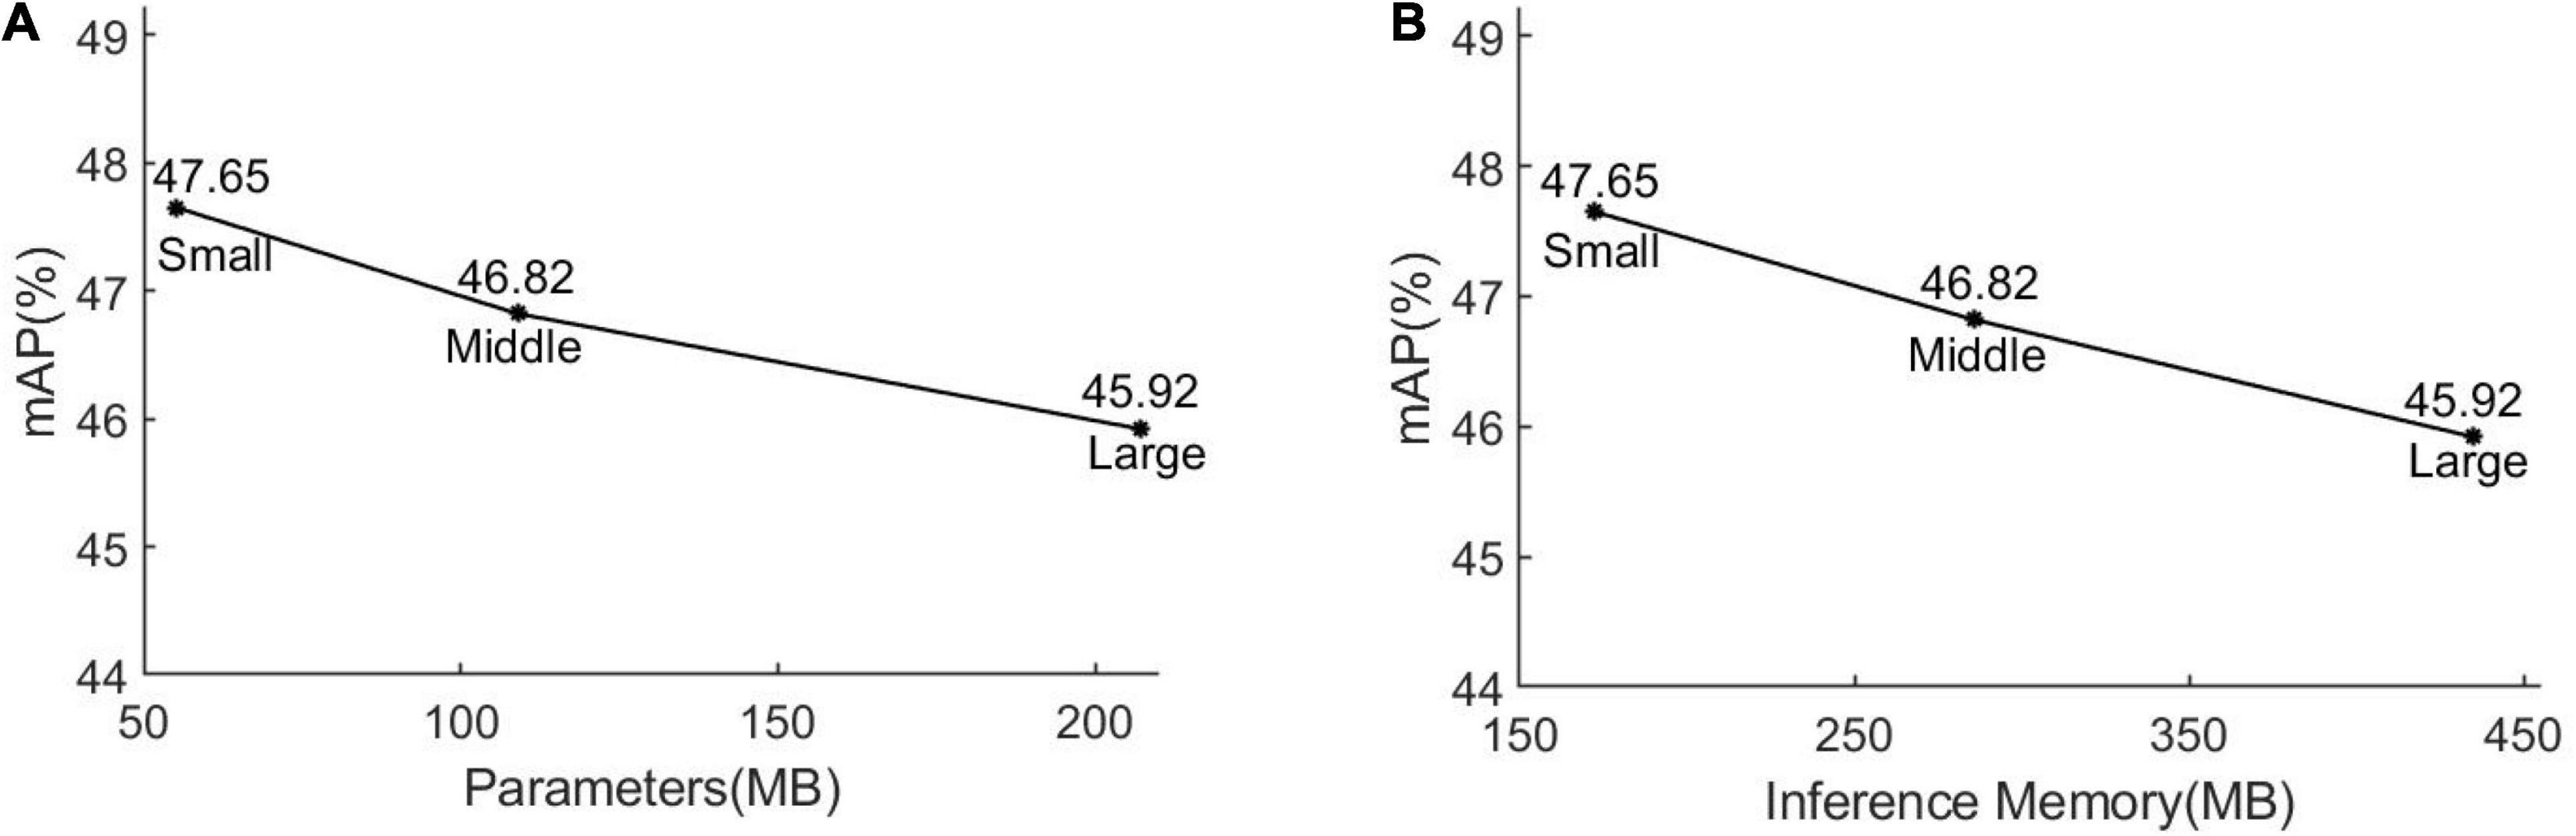
Figure 5. Comparison results between the mean average precision (mAP) and parameters/inference memory of the three versions of YOLO V5 (Large, Middle, and Small) model. The abscissa in panel (A) represents the parameter amount of the model; the abscissa in panel (B) means the inference memory of the model for processing a 416 × 416 image. The numerical values of the mAP of the three versions of the YOLO V5 model.
Compared with standard convolution, depthwise separable convolution generally sacrifices a small amount of detection accuracy to save the computations and parameters of the model. Depthwise separable convolution is a form of factorized convolutions that factorizes a standard convolution into a depthwise convolution and a pointwise convolution. Firstly, the depthwise convolution applies a single convolution to each channel feature map to extract feature information and keeps the number of feature maps unchanged. Secondly, the pointwise convolution applies multiple 1 × 1 convolutions to combine the feature maps obtained by the depthwise convolution. The process of performing depthwise separable convolution on a feature map with the size of W × H × C (W and H are the spatial width and height of the feature map, respectively, and C is the number of feature channels) is shown in Figure 6. The computation of the standard convolution is 3 × 3 × C × N × W × H, while the computation of the depthwise separable convolution is 3 × 3 × C × W × H+1 × 1 × C × N × W × H = (3 × 3+N) × (C × W × H), which is approximately 1/N + 1/(3 × 3) of the standard convolution. The parameter of the standard convolution is 3 × 3 × C × N, while the parameter of the depthwise separable convolution is 3 × 3 × C + 1 × 1 × C × N, which is about 1/N + 1/(3 × 3) of the standard convolution. The depthwise separable convolution has the effect of drastically reducing the computation and model size. In this study, the depthwise separable convolution is introduced into the CSPDarknet53 network, which is combined with the scaling of the depth (the number of convolutional layers) and the width (the number of channels of the convolution kernel) to realize the lightweight of the model, as shown in the orange part of Figure 4.
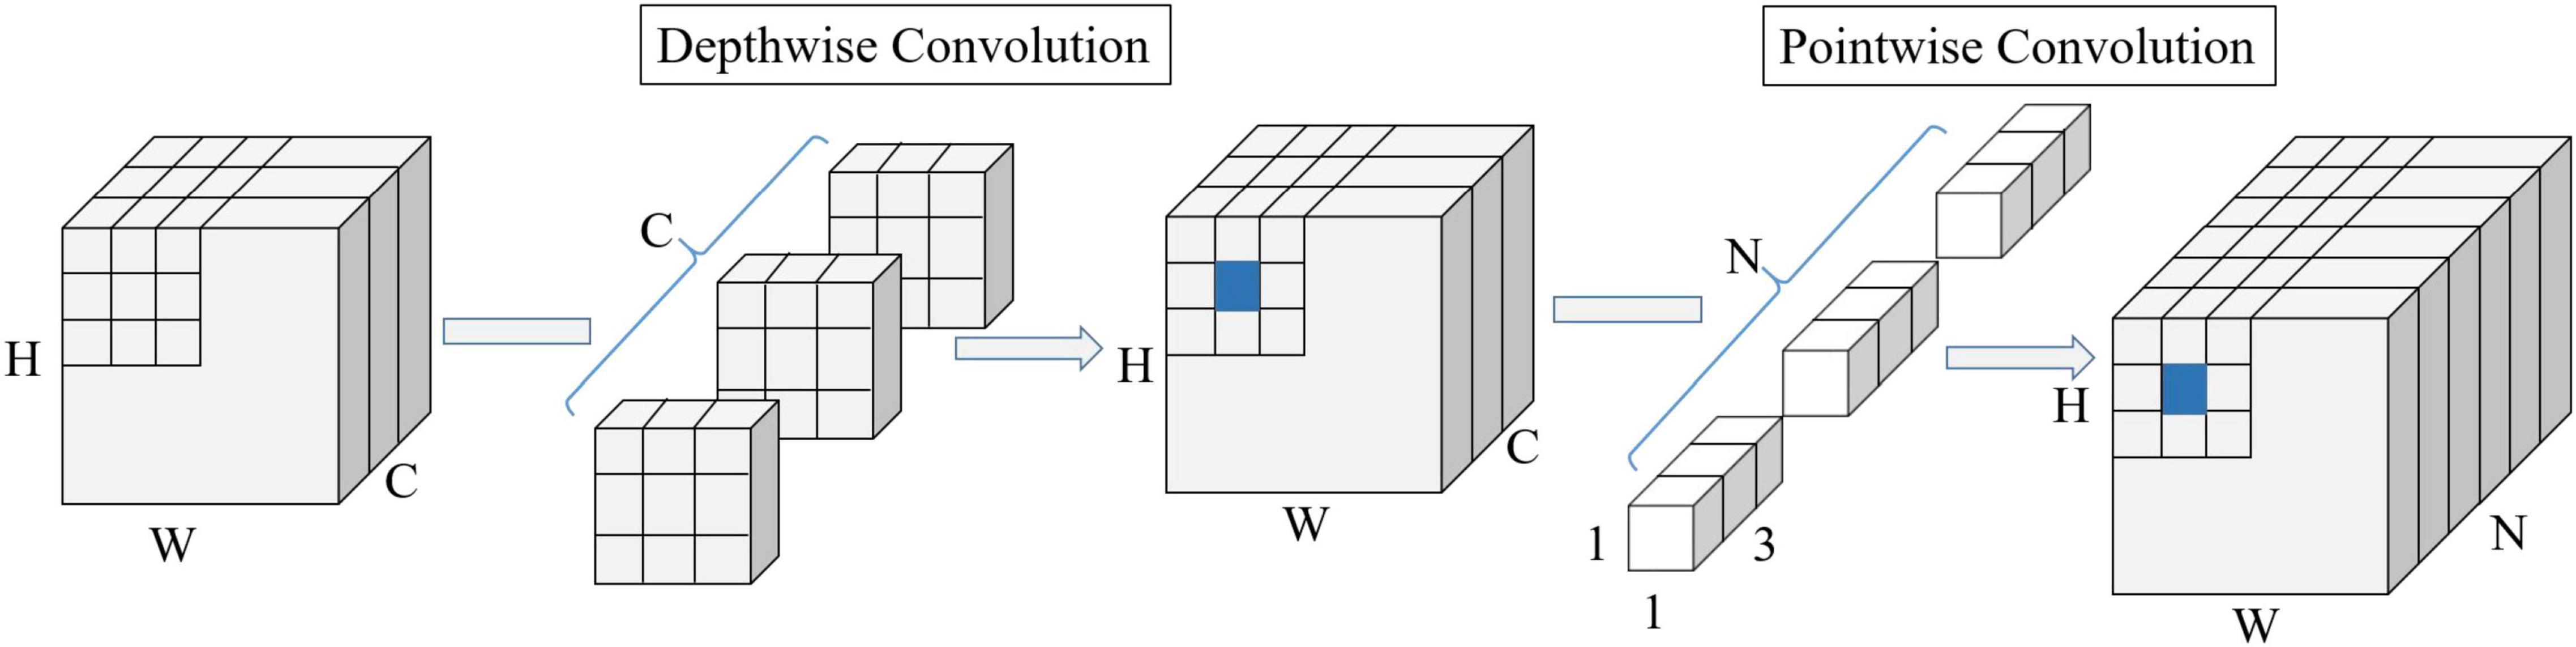
Figure 6. The structure diagram of depthwise separable convolution. W and H are the spatial width and height of the feature map, respectively. C is the number of feature channels; N is the number of feature channels after depthwise separable convolution.
Anchor-Free and Adaptive Sample Assignment
YOLO V5, an anchor-based method, predicts boxes by fitting the deviation of the anchor boxes, where the anchor boxes have a preset width and height. Although anchor-based methods improve the detection accuracy to a certain extent, there are still some drawbacks (Fu J. M. et al., 2020). First, a large number of anchor boxes are used in the model, resulting in excessive redundant computation and slowing down the detection speed of the model. Second, only a tiny fraction of the anchor boxes is labeled as positive samples, resulting in a huge imbalance between positive and negative samples. Third, fixed anchor boxes cannot be applied to various data, which increases the difficulty of model optimization. Anchor boxes generally require to be reset according to different data. Currently, the anchor boxes obtained by clustering objects in natural images are quite different from the features of the subsidence basins in the InSAR interferograms. In addition, since the training data cannot represent all the subsidence basins, the anchor-boxes obtained by clustering the characteristics of the subsidence basins cannot guarantee their versatility. Therefore, we used an anchor-free method to detect the subsidence basins from interferograms.
The location of the prediction box in the original YOLO V5 model is determined by the center point and the width and height of the anchor box, as shown in Figure 7A. The coordinate value of the center point is represented by the offset from the top left corner of the cell, and the width and height are the scaling ratios of the corresponding anchor box. However, if the anchor box is abandoned, the width and height cannot be expressed. Hence, the Light YOLO-Basin model directly fits the width and height instead of the ratio of the anchor box and keeps the computation of the center point unchanged to achieve anchor-free (Law and Deng, 2018; Duan et al., 2019), as shown in Figure 7B.
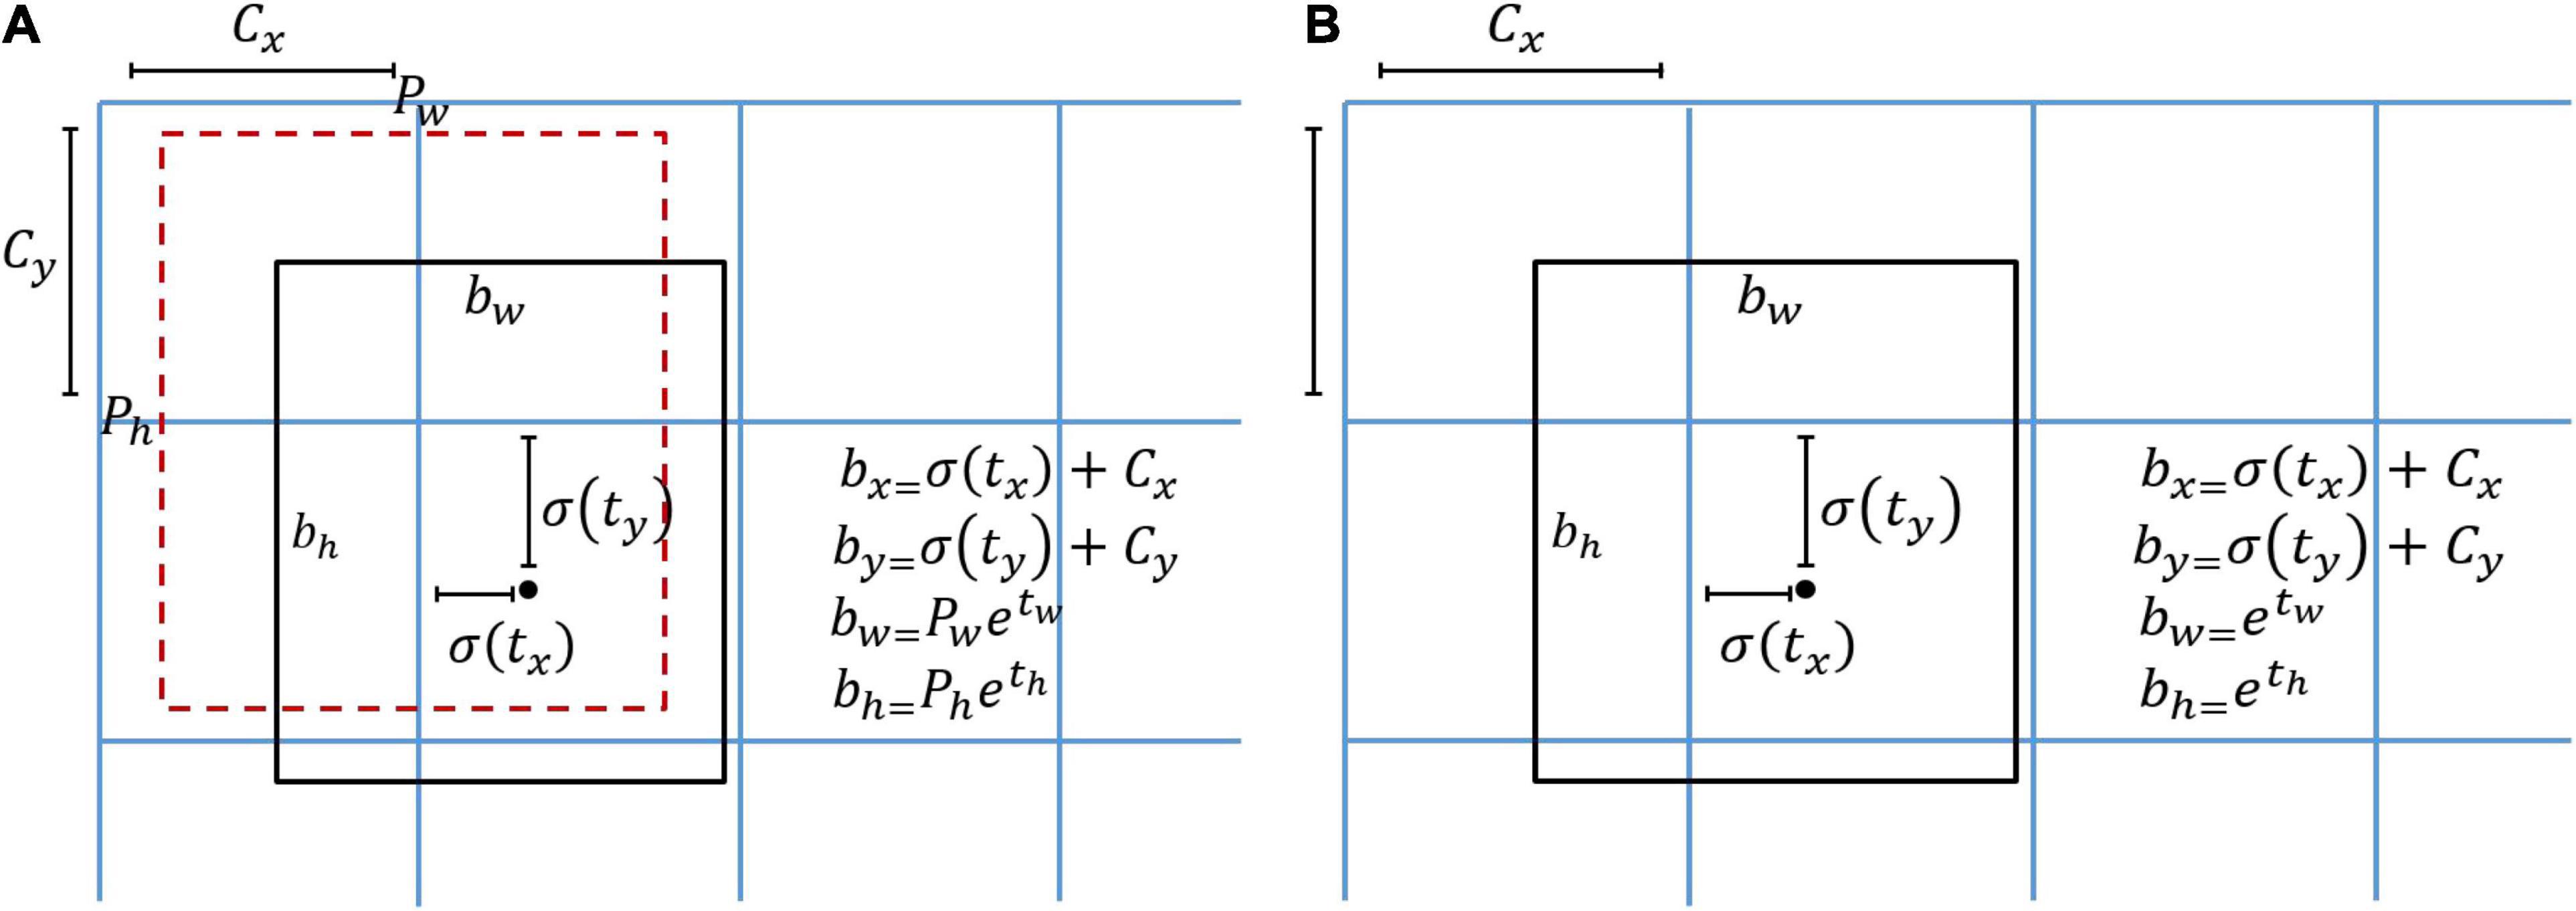
Figure 7. Location encoding of bounding box in YOLO V5 and Light YOLO-Basin. (A) Location encoding of YOLO V5 bounding box. The red box denotes the anchor box and the black box denotes the prediction box. Pw and Ph mean the width and height of the anchor box, respectively; tw and th are the predicted ratio of the width and height between the prediction box and anchor box. (B) Anchor-free location encoding of the bounding box. The black box denotes the prediction box; tw and th directly predicted the width and height. bx and by, respectively represent the coordinates of the center point x and y of the prediction box; bw and bh represent the width and height of the prediction box, respectively. tx and ty are the offsets between the center point of the prediction box and the top left corner of the cell computed by the model; σ is the Sigmoid function; Cx and Cy are the coordinates of the top left corner of the cell.
The lack of the constraint of anchor boxes in the anchor-free method increases the degree of freedom of the model and also increases the difficulty of optimizing the prediction box. Adopting IoU at a certain threshold as positive and negative assignment criterion, which is commonly used in anchor-based detection methods, is usually not suitable for the anchor-free method. For example, the two-stage Faster R-CNN network labels the prediction box with an IoU value greater than 0.7 as a positive sample and less than 0.3 as a negative sample; the one-stage YOLO V3 model labels the prediction box with the highest IoU value as a positive sample, as shown in Figure 8B. Moreover, based on the anchor-free method, using a certain IoU threshold to assign prediction boxes will cause a large number of useful prediction boxes to be discarded. To increase the number of positive samples, the YOLO V5 model expands the selection range of positive samples to the surrounding pixels, reducing the difficulty of model optimization, as shown in Figure 8C. However, the YOLO V5 model still selects a fixed number of positive samples with a certain IoU threshold, and it cannot adaptively determine the number and assignment of hard and easy positive samples. Therefore, we used the OTA (Ge et al., 2021) to model the positive and negative samples assignment as an optimal transmission problem, which selects and balances positive and negative samples in an adaptive manner.
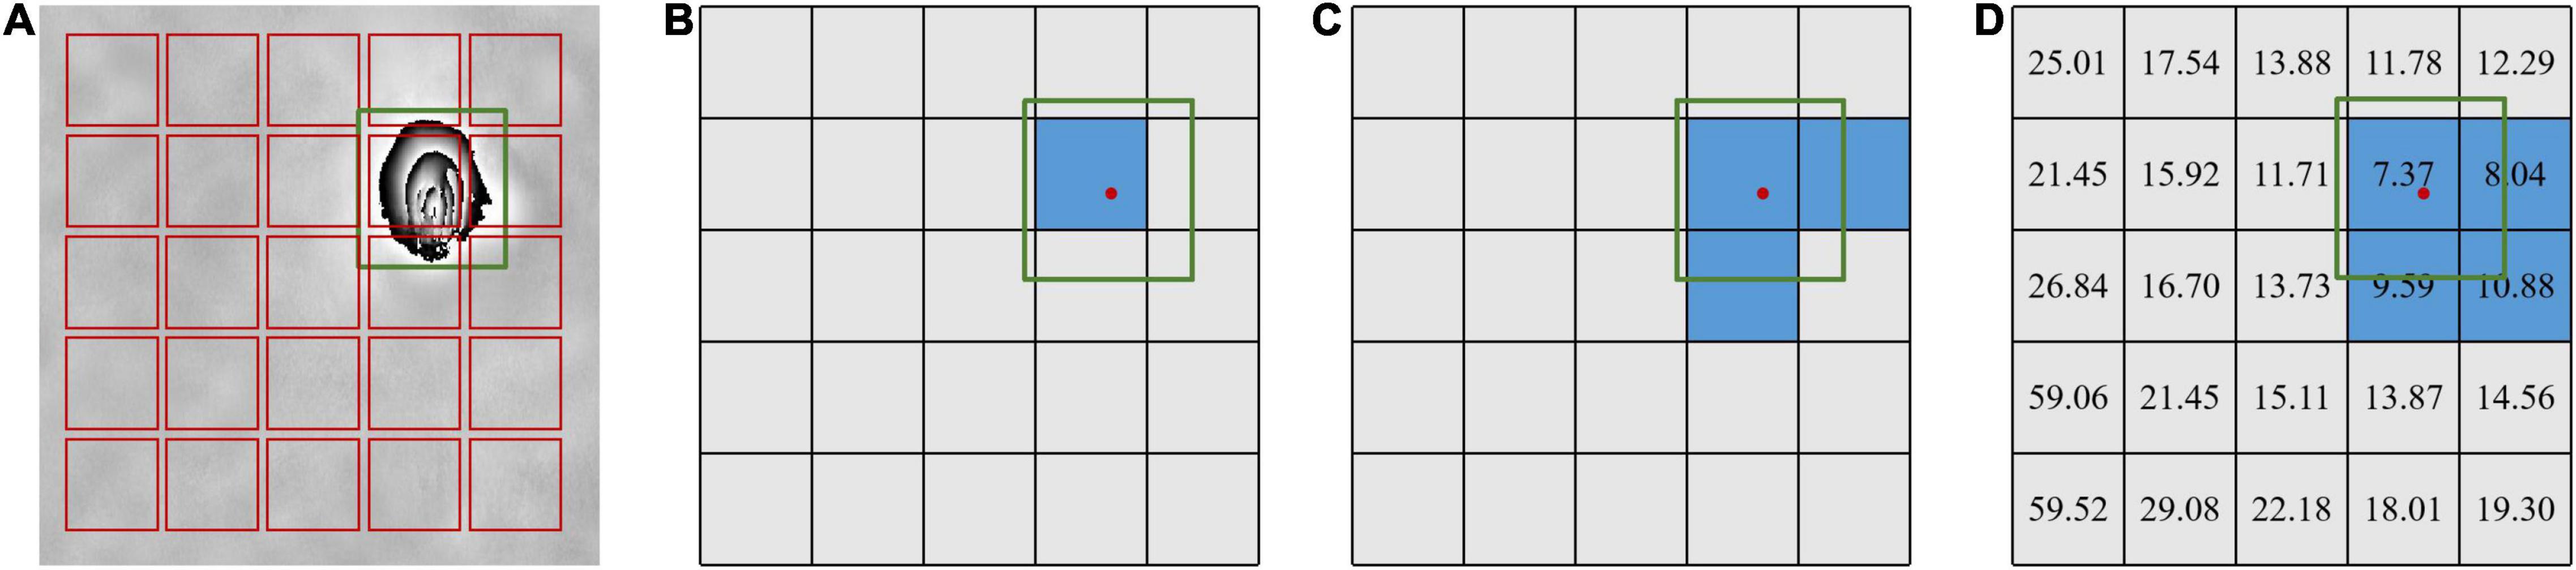
Figure 8. Sample assignment of YOLO V3, YOLO V5, and optimal transport assignment (OTA). Panel (A) is the image with bounding box; panel (B) is the sample assignment of YOLO V3; panel (C) is the sample assignment of YOLO V5; panel (D) is the adaptive sample assignment of OTA. The value is the transporting cost value in panel (D). The blue grid and the green box denote the positive sample and the ground truth box, respectively, and the red point is the center point of the ground truth.
The OTA method treats the ground truth box as the supplier in the optimal transport theory, and the prediction box in the model training as the demander. The unit transportation cost between each demander and supplier is defined as the weighted summation of losses between the ground truth box and prediction box. If a demander receives enough goods from the supplier, this demander becomes one positive sample. The model needs the best positive and negative samples assignment solution to minimize the global transportation cost. Concretely, assuming that there are m ground truth boxes and n prediction boxes for image I, the ground truth box, namely supplier, holds k units of goods, while the prediction box, namely demander, needs d units of goods. ci,j represents the transporting cost of each unit of good from the i-th supplier to the j-th demander. The positive and negative sample assignment problem can be defined as finding an optimal transmission strategy π = {πi,j|i = 1, 2, …, m, j = 1, 2, …, n} to minimize the transportation cost, as shown in Formula (4). The formula behind s.t. is a condition that needs to be satisfied during optimization.
The key of the OTA is how to define the transportation cost. The original OTA method defines transportation cost between the ground truth box and the prediction box as the weighted summation of their regression loss and classification loss. Since there is only the category of subsidence basin in our study, the transporting cost was defined as the weighted summation of confidence loss and bounding box regression loss. The computation equation is as follow:
where Lobj and Lreg represent the binary cross-entropy and bounding box regression loss; and denote the confidence score of the model prediction box and ground truth box, respectively; and , respectively, represent the coordinates of the prediction box and the ground truth box. α is the balanced coefficient with the value of 3. The visualization result of transporting cost value is shown in Figure 8D.
The original OTA method uses Sinkhorn-Knopp Iteration (Cuturi, 2013) to solve the optimal transmission problem, but the multiple iteration optimization of the Sinkhorn-Knopp greatly reduces the training efficiency of the model. Hence, the Light YOLO-Basin adopted an approximate method to solve the optimal transmission problem. The OTA solution mainly consists of two parts: (1) k value, which is the number of positive samples of each ground truth box; (2) the assignment of the k value, that is, how the positive samples are assigned to the prediction box. Since the cost matrix has been determined, the assignment solution of k can be simplified to assign k of each ground truth box to the prediction box with the lowest cost in turn, as shown in the blue grid in Figure 8D. The determination of the value of k for each ground truth box is simplified to a statistical problem: first, sorting all the prediction boxes in the model according to the IoU value, and then adding up the cost value of the prediction box with the top Z (default 10) IoU value to round to get the estimated value of k, as shown in Formula (6).
where ki means the k value of the i-th ground truth box; λ is set to 0.1 derived from experiments.
Results and Analysis
Experimental Setting
Accuracy Evaluation Index
The average precision (AP) and mAP (Li et al., 2017; Sun et al., 2021) were used to evaluate the performance of the Light YOLO-Basin model proposed in this study. The detection results mainly include four categories: true-positive (TP) and false-positive (FP)are the numbers of positive samples that are correctly predicted and incorrectly predicted, respectively; true-negative (TN) and false-negative (FN) mean the number of negative samples that are correctly predicted and incorrectly predicted, respectively. Precision refers to the proportion of all detected samples that are correct, and recall refers to the proportion of the objects recognized by the model among all the objects that require to be recognized. The precision (P) and recall (R) are defined in Formula (7). The P-R curve takes the precision as the ordinate and the recall as the abscissa.
The AP measures the detection performance of a single category, as shown in Formula (8). The evaluation indicators of the Light YOLO-Basin model proposed in this paper are AP50 : AP95. AP50 : AP95 is the value of AP at different IoU thresholds that the IoU ranges from 0.5 to 0.95 and the step size is 0.05. The mAP measures the detection performance of all the categories. Since there is only the category of subsidence basin in this paper, mAP is defined as the average AP at different IoU thresholds, as shown in Formula (9).
Training Settings
The experiment was conducted using the Microsoft Windows, 64-bit operating system. The central processing unit (CPU) is Intel Core i5-8300H. The graphics processing unit (GPU) is NVIDIA GeForce GTX 1050 Ti (4GB video memory). The deep learning framework is Facebook PyTorch 1.8. In this study, all subsidence basin detection models in this paper were trained by the adaptive moment estimation (Adam) optimization method (Kingma and Ba, 2014). The initial learning rate is set to 0.001 and decayed according to the formula 0., where iter is the current number of iterations and the maximum number of iterations (maxiter) is set to 60,000.
Results
According to the standard of the YOLO V5 model, we divided the Light YOLO-Basin into three versions: Large (L), Middle (M), and Small (S). The three versions are distinguished by three scaling ratios of the depth (the number of convolutional layers) and the width (the number of channels of the convolution kernel), which are (1.0, 1.0), (0.67, 0.75), and (0.33, 0.50), respectively. The model that does not introduce depthwise separable convolution in this paper is called YOLO-Basin. Examples of the qualitative comparison results of the Light YOLO-Basin model and the YOLO V5 model are shown in Figure 9. It can be seen that the Light YOLO-Basin model can detect the subsidence basin misdetected by the YOLO V5 model. Importantly, in order to verify the performance of the Light YOLO-Basin model in the actual scene, we selected two representative InSAR interferograms with the size of 7,636 × 8,205 and 8,127 × 10,338, respectively. We first cut the whole images regularly to obtain a large number of sub-images with a size of 416 × 416, then used the Light YOLO-Basin model to detect the subsidence basins for each sub-image, and finally stitched the detection results of each sub-image. Figure 10 exhibits part of the detection results of subsidence basins using the Light YOLO-Basin model. It can be seen that most subsidence basins have been correctly detected. 42 and 40 subsidence basins were detected in Jining and Huaibei mining areas, respectively. Regardless of the time consumption on image segmenting and stitching, the Light YOLO-Basin model only consumed 16.28 s to detect the whole image. We made statistics on the deformation values of the detected subsidence basins from the Jining and Huaibei mining areas, among which, the deformation value of the subsidence basin with the smallest deformation is 1.5 cm.
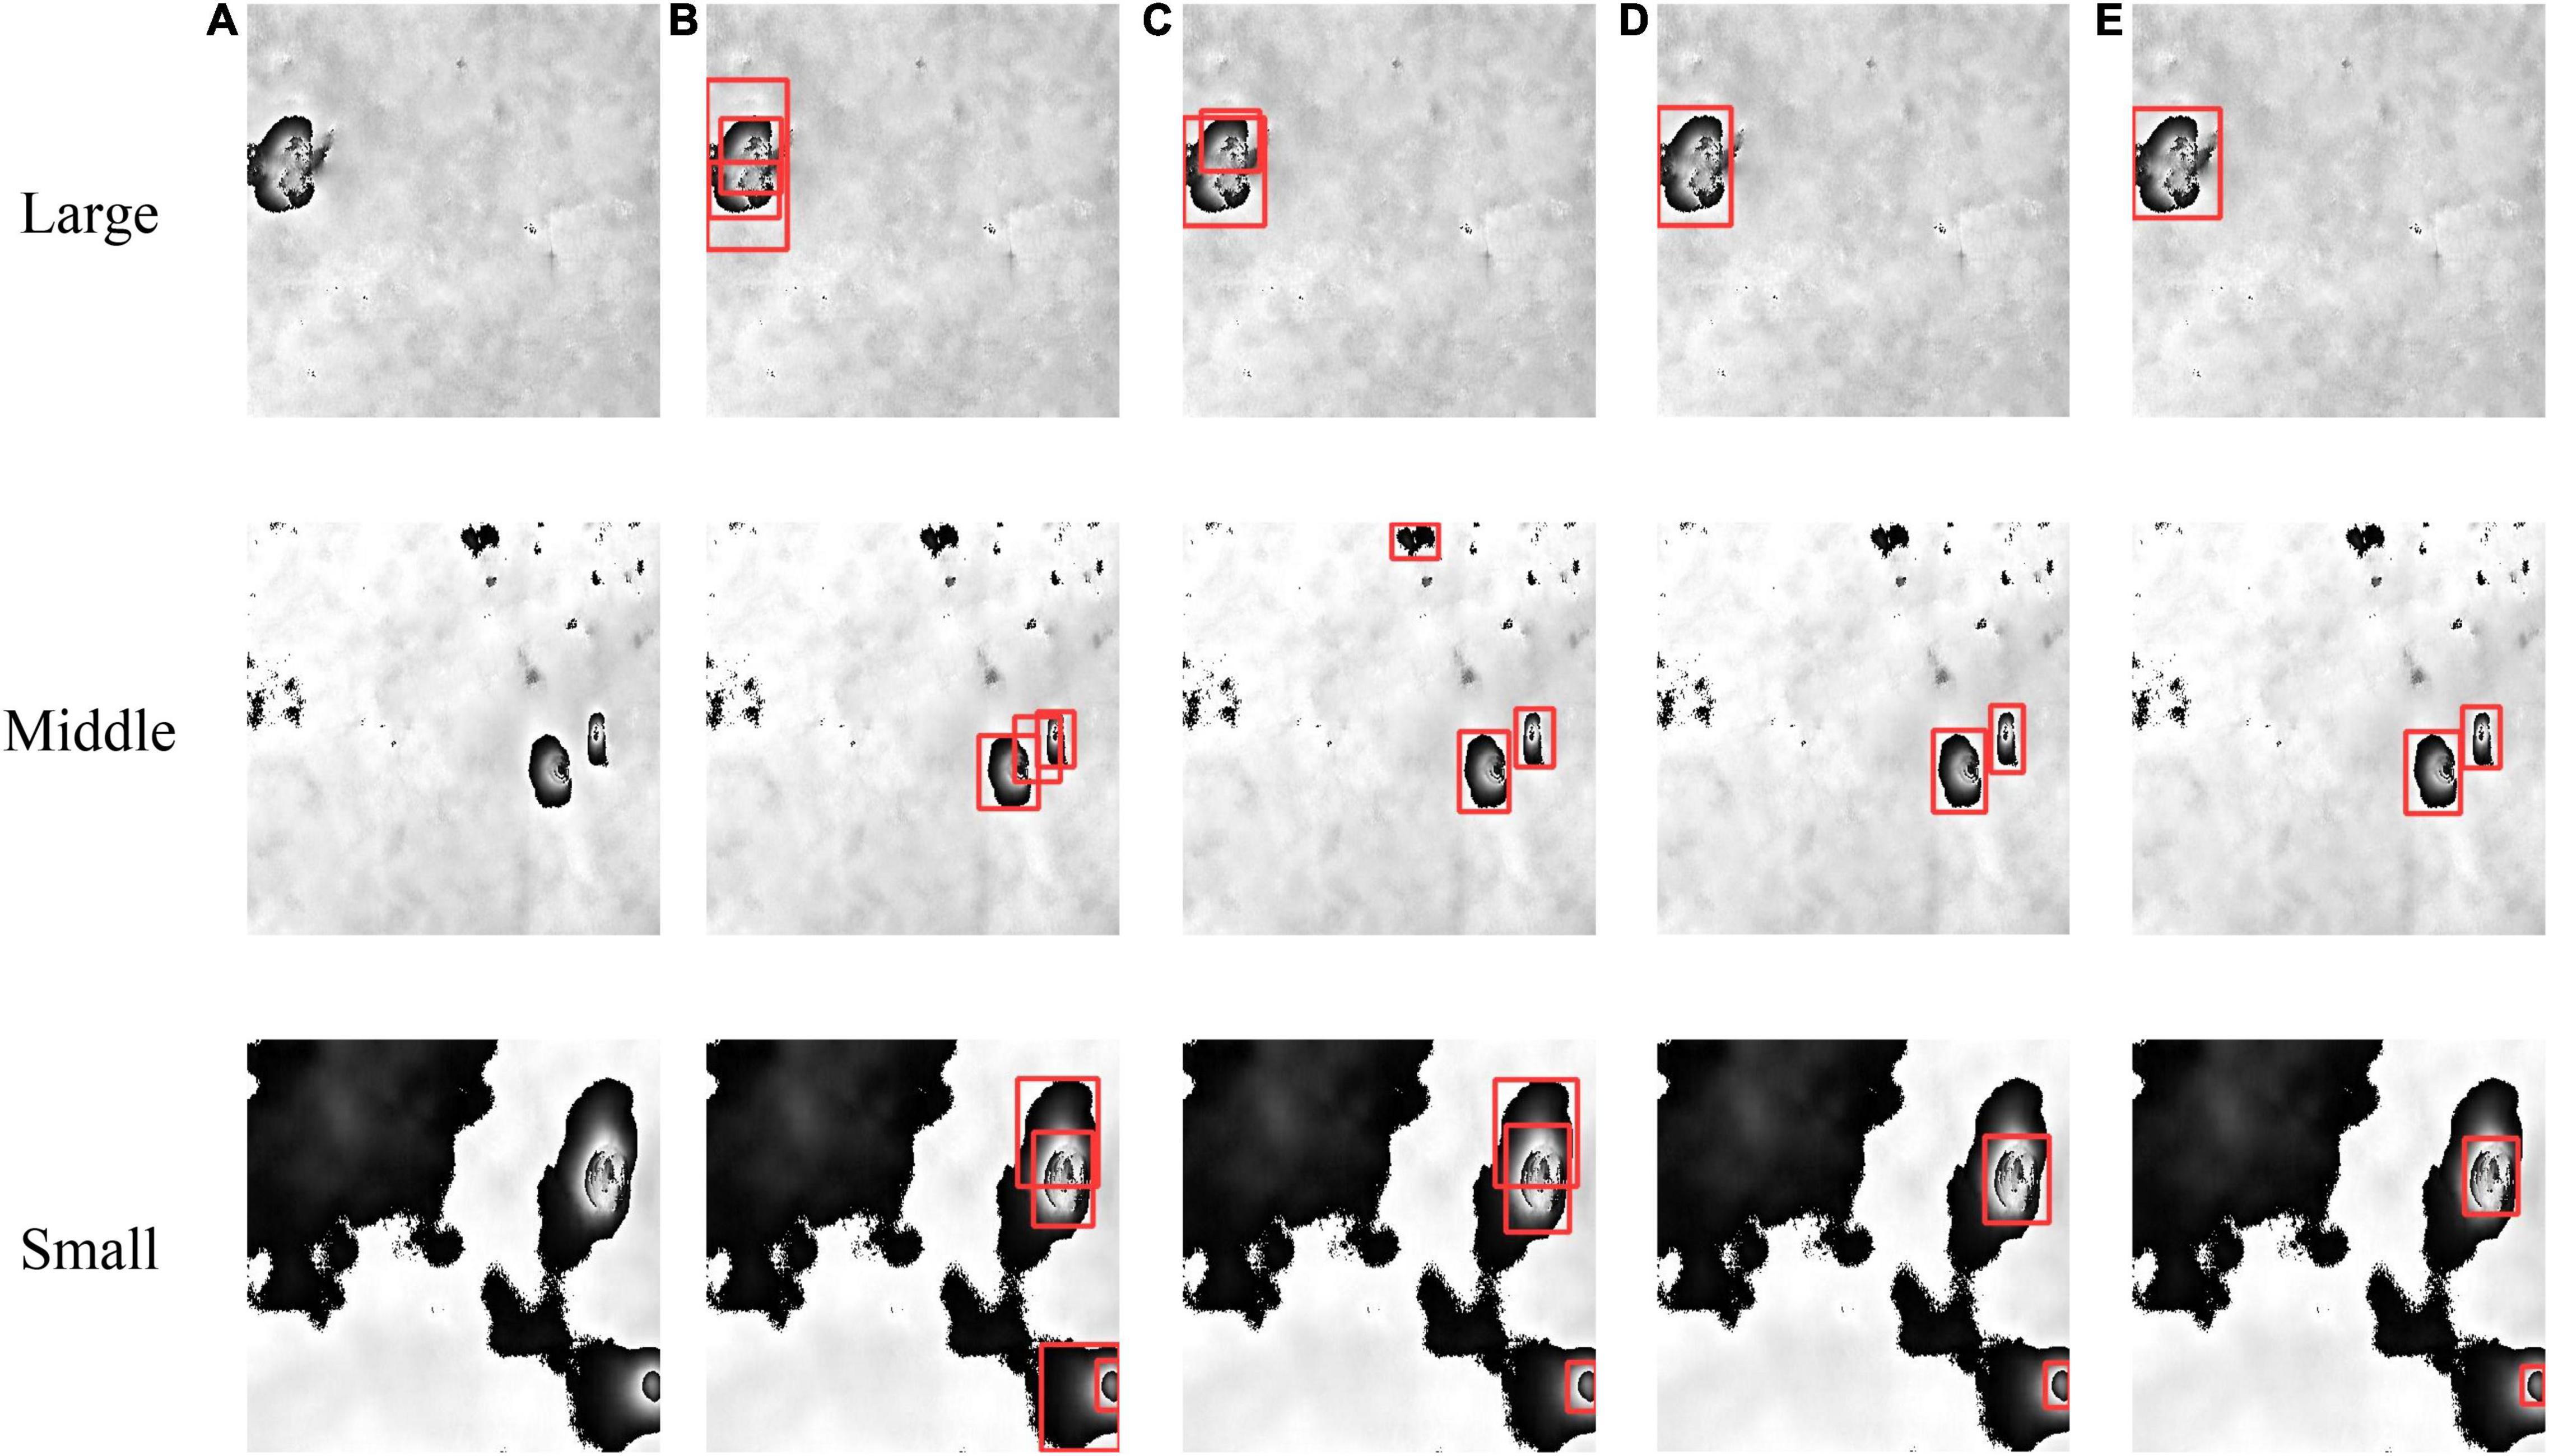
Figure 9. Results of qualitative comparison experiment. Large, Middle, and Small mean the three models produced by scaling, respectively. (A) Cropped original image; (B) detection results of subsidence basins using YOLO V5 model; (C) detection results of subsidence basins using YOLO-Basin model; (D) detection results of subsidence basins using Light YOLO-Basin. (E) Ground truth box.

Figure 10. Detection results of partial subsidence basins in the Interferometric synthetic aperture radar (InSAR) interferogram with wide swath. We select two differential interferograms obtained from the experimental data in Table 1 to test the performance of the Light YOLO-Basin model. Panels (A,B) are representative areas selected from the detection results of the Jining mining area; panels (C,D) are representative areas selected from the detection results of the Huaibei mining area.
Quantitative Evaluation
The detection accuracy of the Light YOLO-Basin model and the YOLO V5 model are shown in Table 2. The experimental results demonstrate: (1) with the same experimental method, the smaller the scaling ratio of the model is, the higher the detection accuracy is. The value of mAP increased from 45.92% of the YOLO V5-L model to 47.65% of the YOLO V5-S model. This further verified the hypothesis proposed above that the detection of subsidence basins does not require a heavy network. (2) Benefiting from the introduction of the anchor-free detection box encoding method and OTA, the mAP value of the YOLO-Basin-S model has greatly improved compared to the YOLO V5-L model which was 6% higher than that of the original YOLO V5-L model. By comparing the detection accuracy in Table 2, it can be found that the improvement of the YOLO-Basin model detection accuracy is mainly manifested by the strict evaluation indicators such as AP70 and AP80. The AP70 value increased from 65.70 to 71.24%, and the AP80 value increased by 15.20%. (3) The detection accuracy of the Light YOLO-Basin model is further improved, benefiting from the introduction of the depthwise separable convolution. Similarly, the improvement of the Light YOLO-Basin model detection accuracy is also mainly manifested by the evaluation indicators such as AP70 and AP80. The AP70 value improved from 71.24 to 75.20%, and the AP80 value increased by 7.85% compared to the non-lightweight model. In summary, on the one hand, the experimental results prove the effectiveness of anchor-free and OTA methods in detecting the subsidence basins. On the other hand, depthwise separable convolution can improve the detection accuracy of the Light YOLO-Basin model with less model parameters.
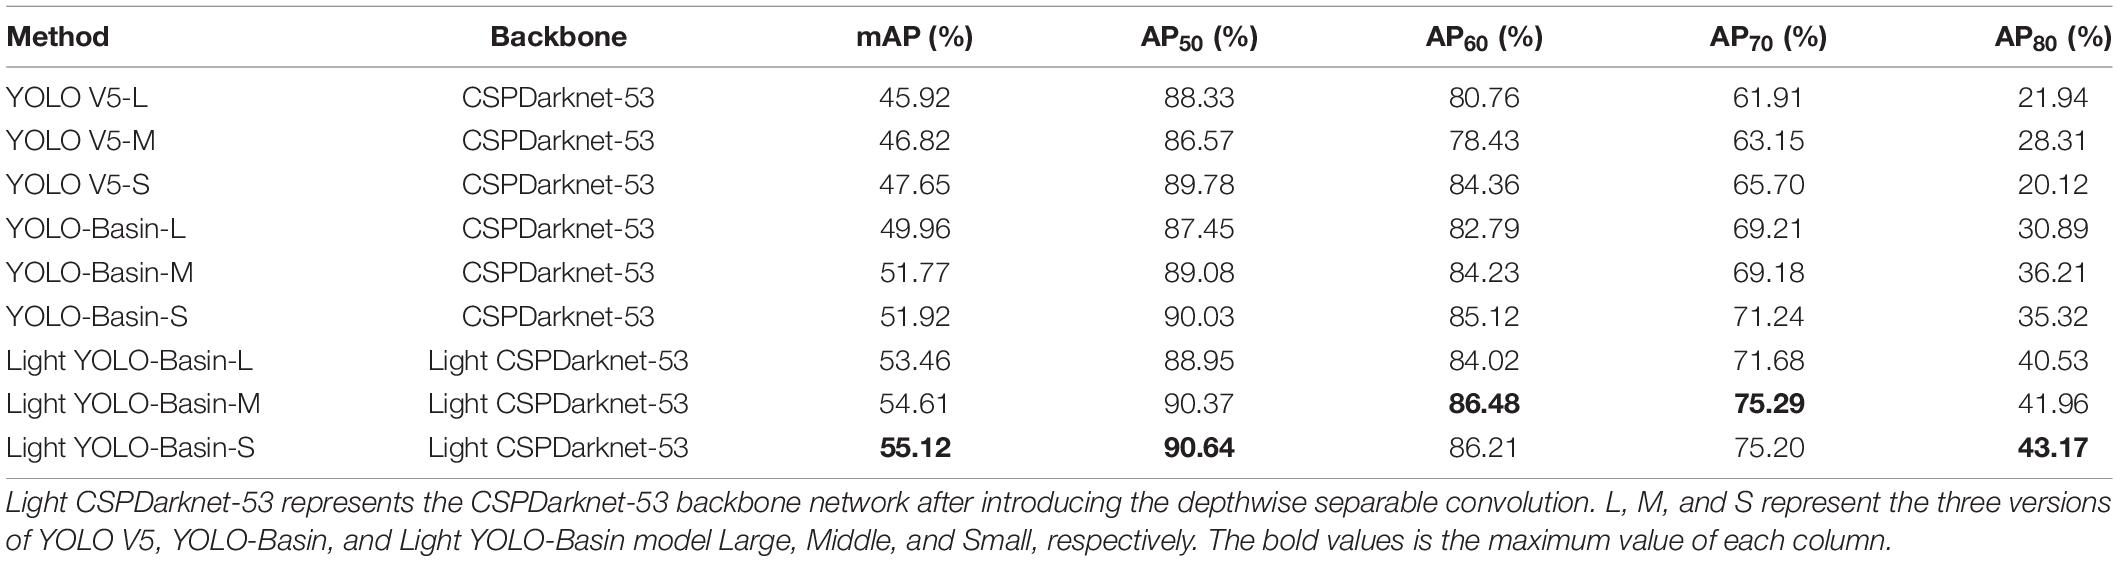
Table 2. Quantitative experiment comparison between the Light YOLO-Basin model and the YOLO V5 model.
Discussion
Efficiency Experiment of the Lightweight Module
The lightweight module of the Light YOLO-Bain model mainly includes scaling and depthwise separable convolution. The lightweight detection model needs to pay attention to two aspects: (1) whether the lightweight module can improve model computing efficiency and reduce memory utilization; (2) whether the lightweight module affects detection accuracy. We used network parameters, GFLOPs, and inference memory as the evaluation indicators of model efficiency and mAP as the evaluation indicator of model accuracy. The results are shown in Table 3. The image size is set to 416 × 416 and the batch size is set to 1 when training the model.
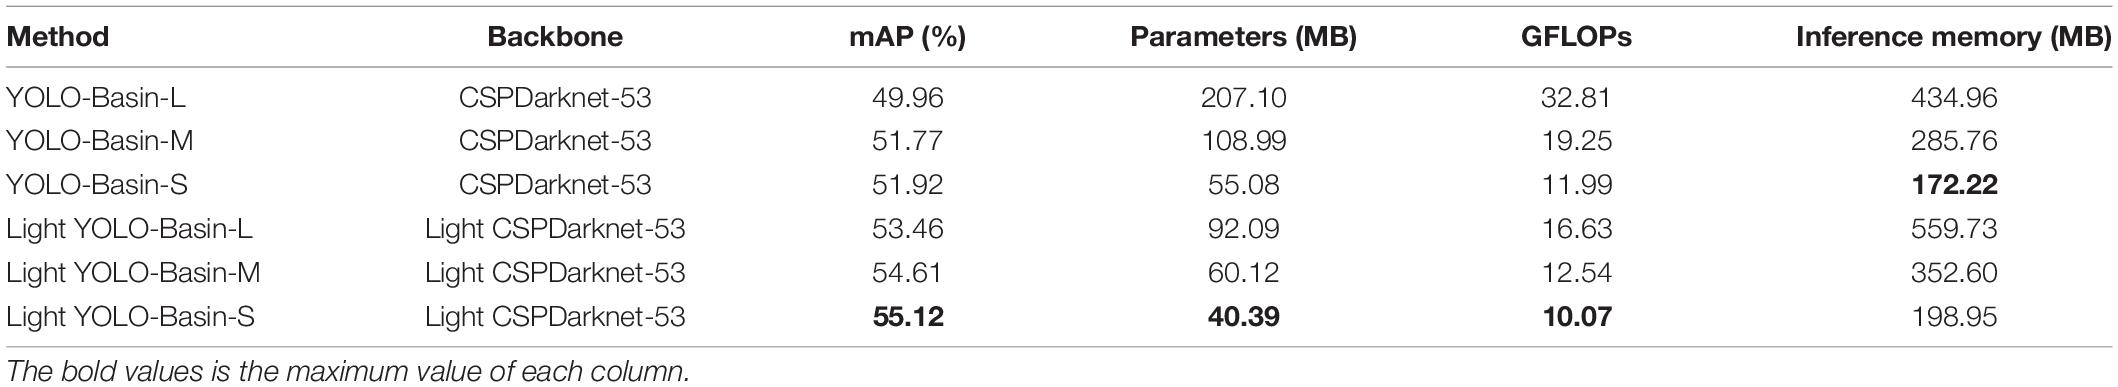
Table 3. The experiment for test the accuracy and efficiency of lightweight module.
Firstly, by analyzing the values of the evaluation indicators of model efficiency in Table 3, introducing depthwise separable convolution and scaling can exponentially decrease the number of model parameters and speed up model training. The improvement of model efficiency by depthwise separable convolution is mainly reflected in the number of model parameters and detection speed. Note that the smaller the model is, the smaller the effect of the depthwise separable convolution is. In addition, since the depthwise separable convolution factorizes a standard convolution into two parts, the computation memory utilization of the model increases. Table 3 indicates the use of scaling and depthwise separable convolution has a better lightweight effect on the model. Secondly, observing the model accuracy evaluation indicators data in Table 3, compared with the detection method of natural images, the lightweight of the model can improve the accuracy of the detection of subsidence basins rather than reducing the accuracy. Compared with the YOLO-Basin-S model, the Light YOLO-Basin-S model increases the mAP value from 51.92 to 55.12%.
Ablation Study for Detection Head and Loss Function
To address the problem caused by the anchor boxes, the Light YOLO-Basin model introduces the anchor-free method and the OTA method. In addition, we also changed the neck network and loss function of the YOLO V5 model, as seen in Section “YOLO V5 Network.” We used mAP and AP50 : AP95 as the evaluation indicators of model accuracy in Table 4, showing the accuracy changes of the modules added to the YOLO V5-S model.
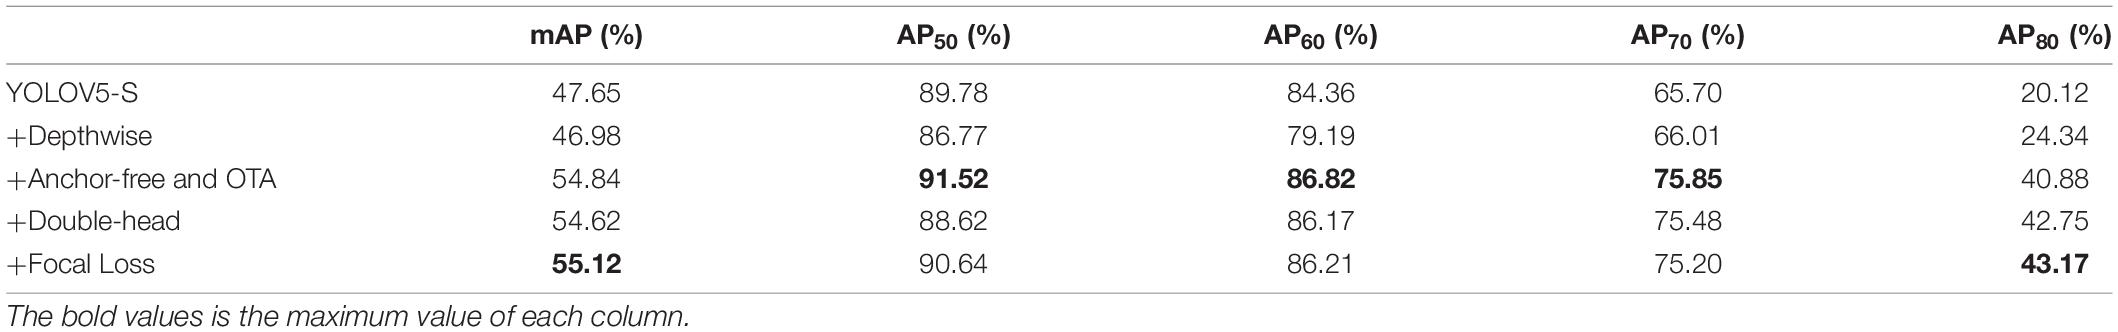
Table 4. Roadmap of the Light YOLO-Basin model in terms of mAP and average precision (AP) (%).
It visually shows the change of model accuracy with added different modules in Table 4. By analyzing the changes in model accuracy, we can draw the following three conclusions: (1) The anchor-free detection box encoding method and OTA have the greatest effect on improving the detection accuracy of the model, greatly increasing the value of AP70 and AP80. The accuracy evaluation indicators mAP has also been significantly improved, increasing from 47.65 to 55.12%. (2) The introduction of depthwise separable convolution did not improve the detection accuracy of the YOLO V5 model. However, it can improve the accuracy of the Light YOLO-Basin model, perhaps benefiting from the combined effects of depthwise separable convolution and OTA. (3) Compared with the OTA, the double-head and Focal loss only less improve the accuracy.
We also analyzed the influence of different IoU loss functions on the Light YOLO-Bain model accuracy, as shown in Table 5. It can be seen from Table 5 that the detection accuracy is the highest when we used the DIoU loss function. Hence, we used DIoU loss as the bounding box regression loss function.
Table 5. Ablation study for loss function.
Ablation Study for Optimal Transport Assignment
To avoid the inefficient iterative computation of Sinkhorn-Knopp Iteration, we used statistical methods to estimate the k value corresponding to the ground truth box in the Light YOLO-Bain model, each of which represents the number of corresponding positive samples. The k value is obtained by adding up the cost value of the prediction box of the top Z in the IoU value and rounding it. Hence, the number of Z determines the size of the k value to a certain extent. According to Formula (6), the larger the value of Z is, the larger the corresponding k value is. That is, each ground truth box is assigned more positive samples. However, too many positive samples will divide the poorly optimized prediction boxes into positive samples, resulting in incorrect detection of the Light YOLO-Bain model. Too few positive samples will cause the imbalance of positive and negative samples, increasing the difficulty of model optimization. Therefore, it is important to choose a suitable Z. Table 6 shows the effect of different values of Z on the accuracy of the Light YOLO-Basin model. It can be seen that the detection accuracy of the model is highest when the value of Z is 10.
Table 6. Ablation study of Z in optimal transport assignment (OTA).
Robustness of Light YOLO-Basin Model
To test the robustness of the model, we, respectively, tested the effects of DEM, decorrelation noise, and the number of interferogram multi looking on detection. We first conducted a set of comparative experiments using DEM with a spatial resolution of 30 and 90 m. The detection results of subsidence basins using different levels of DEM are shown in Figure 11. Since the DEM does not affect the features of the subsidence basins, it has little influence on the detection results where 14 and 13 subsidence basins were detected using DEM with a spatial resolution of 30 and 90 m, respectively. Note that the spatial resolution of DEM used in this paper is 30 m. Then, to test the effect of decorrelation noise on detection, the Gaussian complex noise was used to simulate the decorrelation noise. Figure 12 gives the influence of noise on the detection results. It can be seen that noise has a greater influence on the detection results. Hence, we used the Goldstein filtering method to remove image noise in this paper. Finally, we conducted a set of comparative experiments with different numbers of multi-looking. The comparison of the detection results is shown in Figure 13. It can be seen that the number of interferogram multi-looking changes the aspect ratio of the subsidence basin but has little effect on the detection result of the subsidence basin. We adopted a more appropriate ratio of multi looking is 1: 5.
Figure 11. The detection results using different spatial resolutions of DEM. Panel (A) is the result using DEM data with a spatial resolution of 30 m; panel (B) is the result using DEM data with a spatial resolution of 90 m.
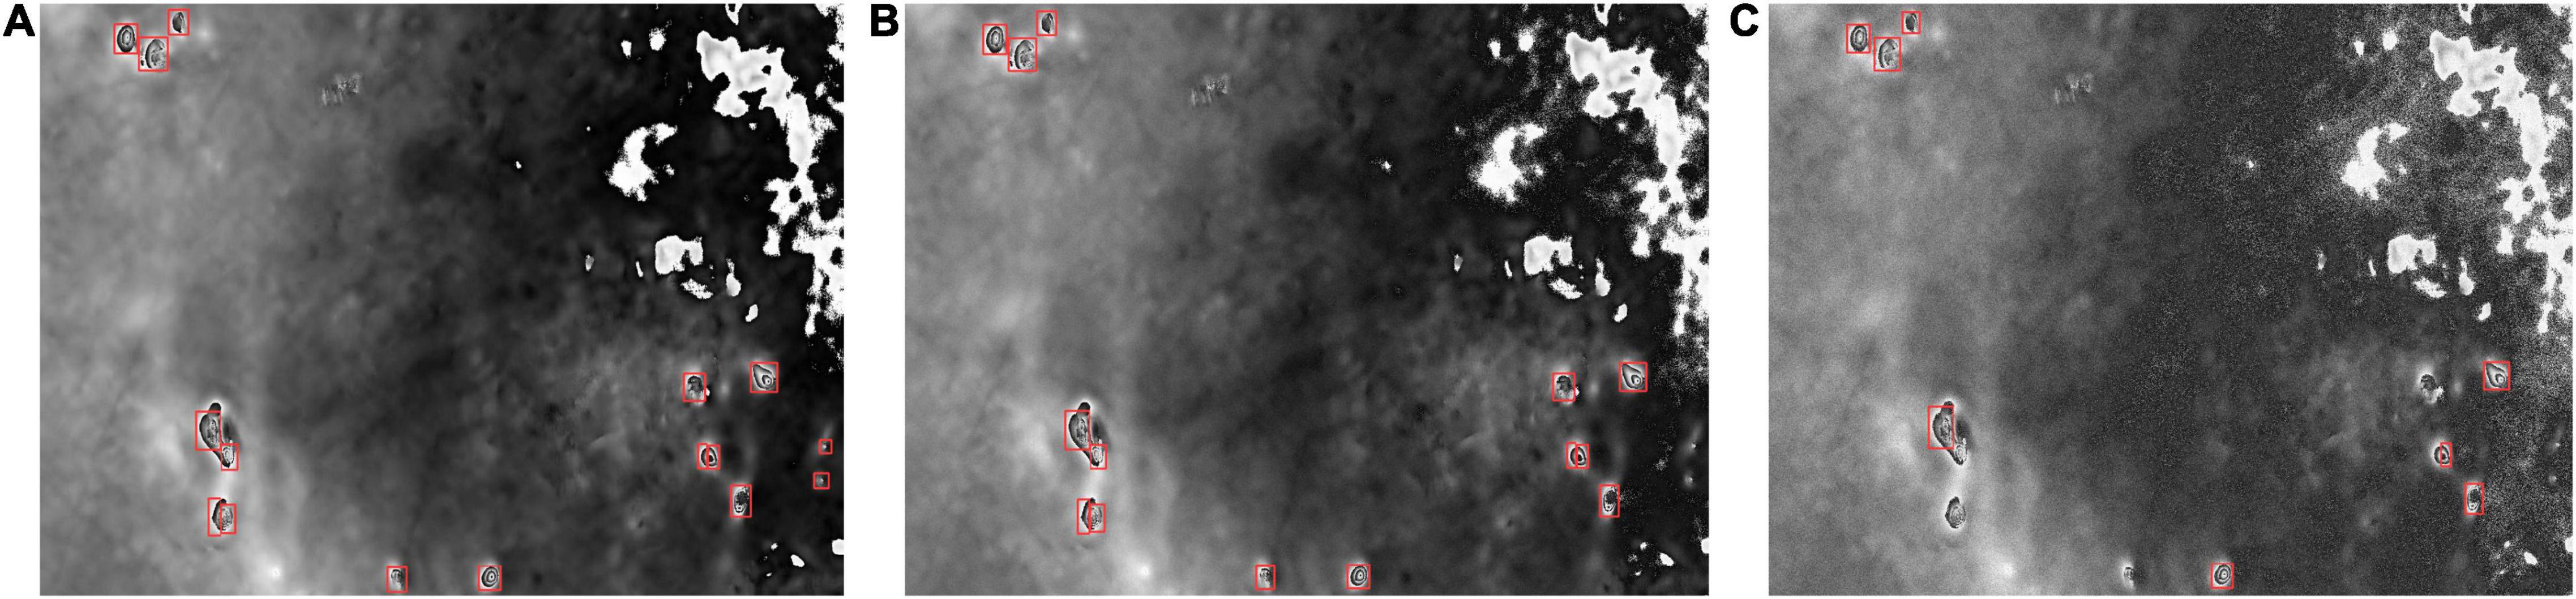
Figure 12. The influence of noise on the detection results. Panel (A) is the detection result of this paper to remove noise; panels (B,C) are the detection results under Gaussian complex noise with the variance of 0.001 and 0.01, respectively.
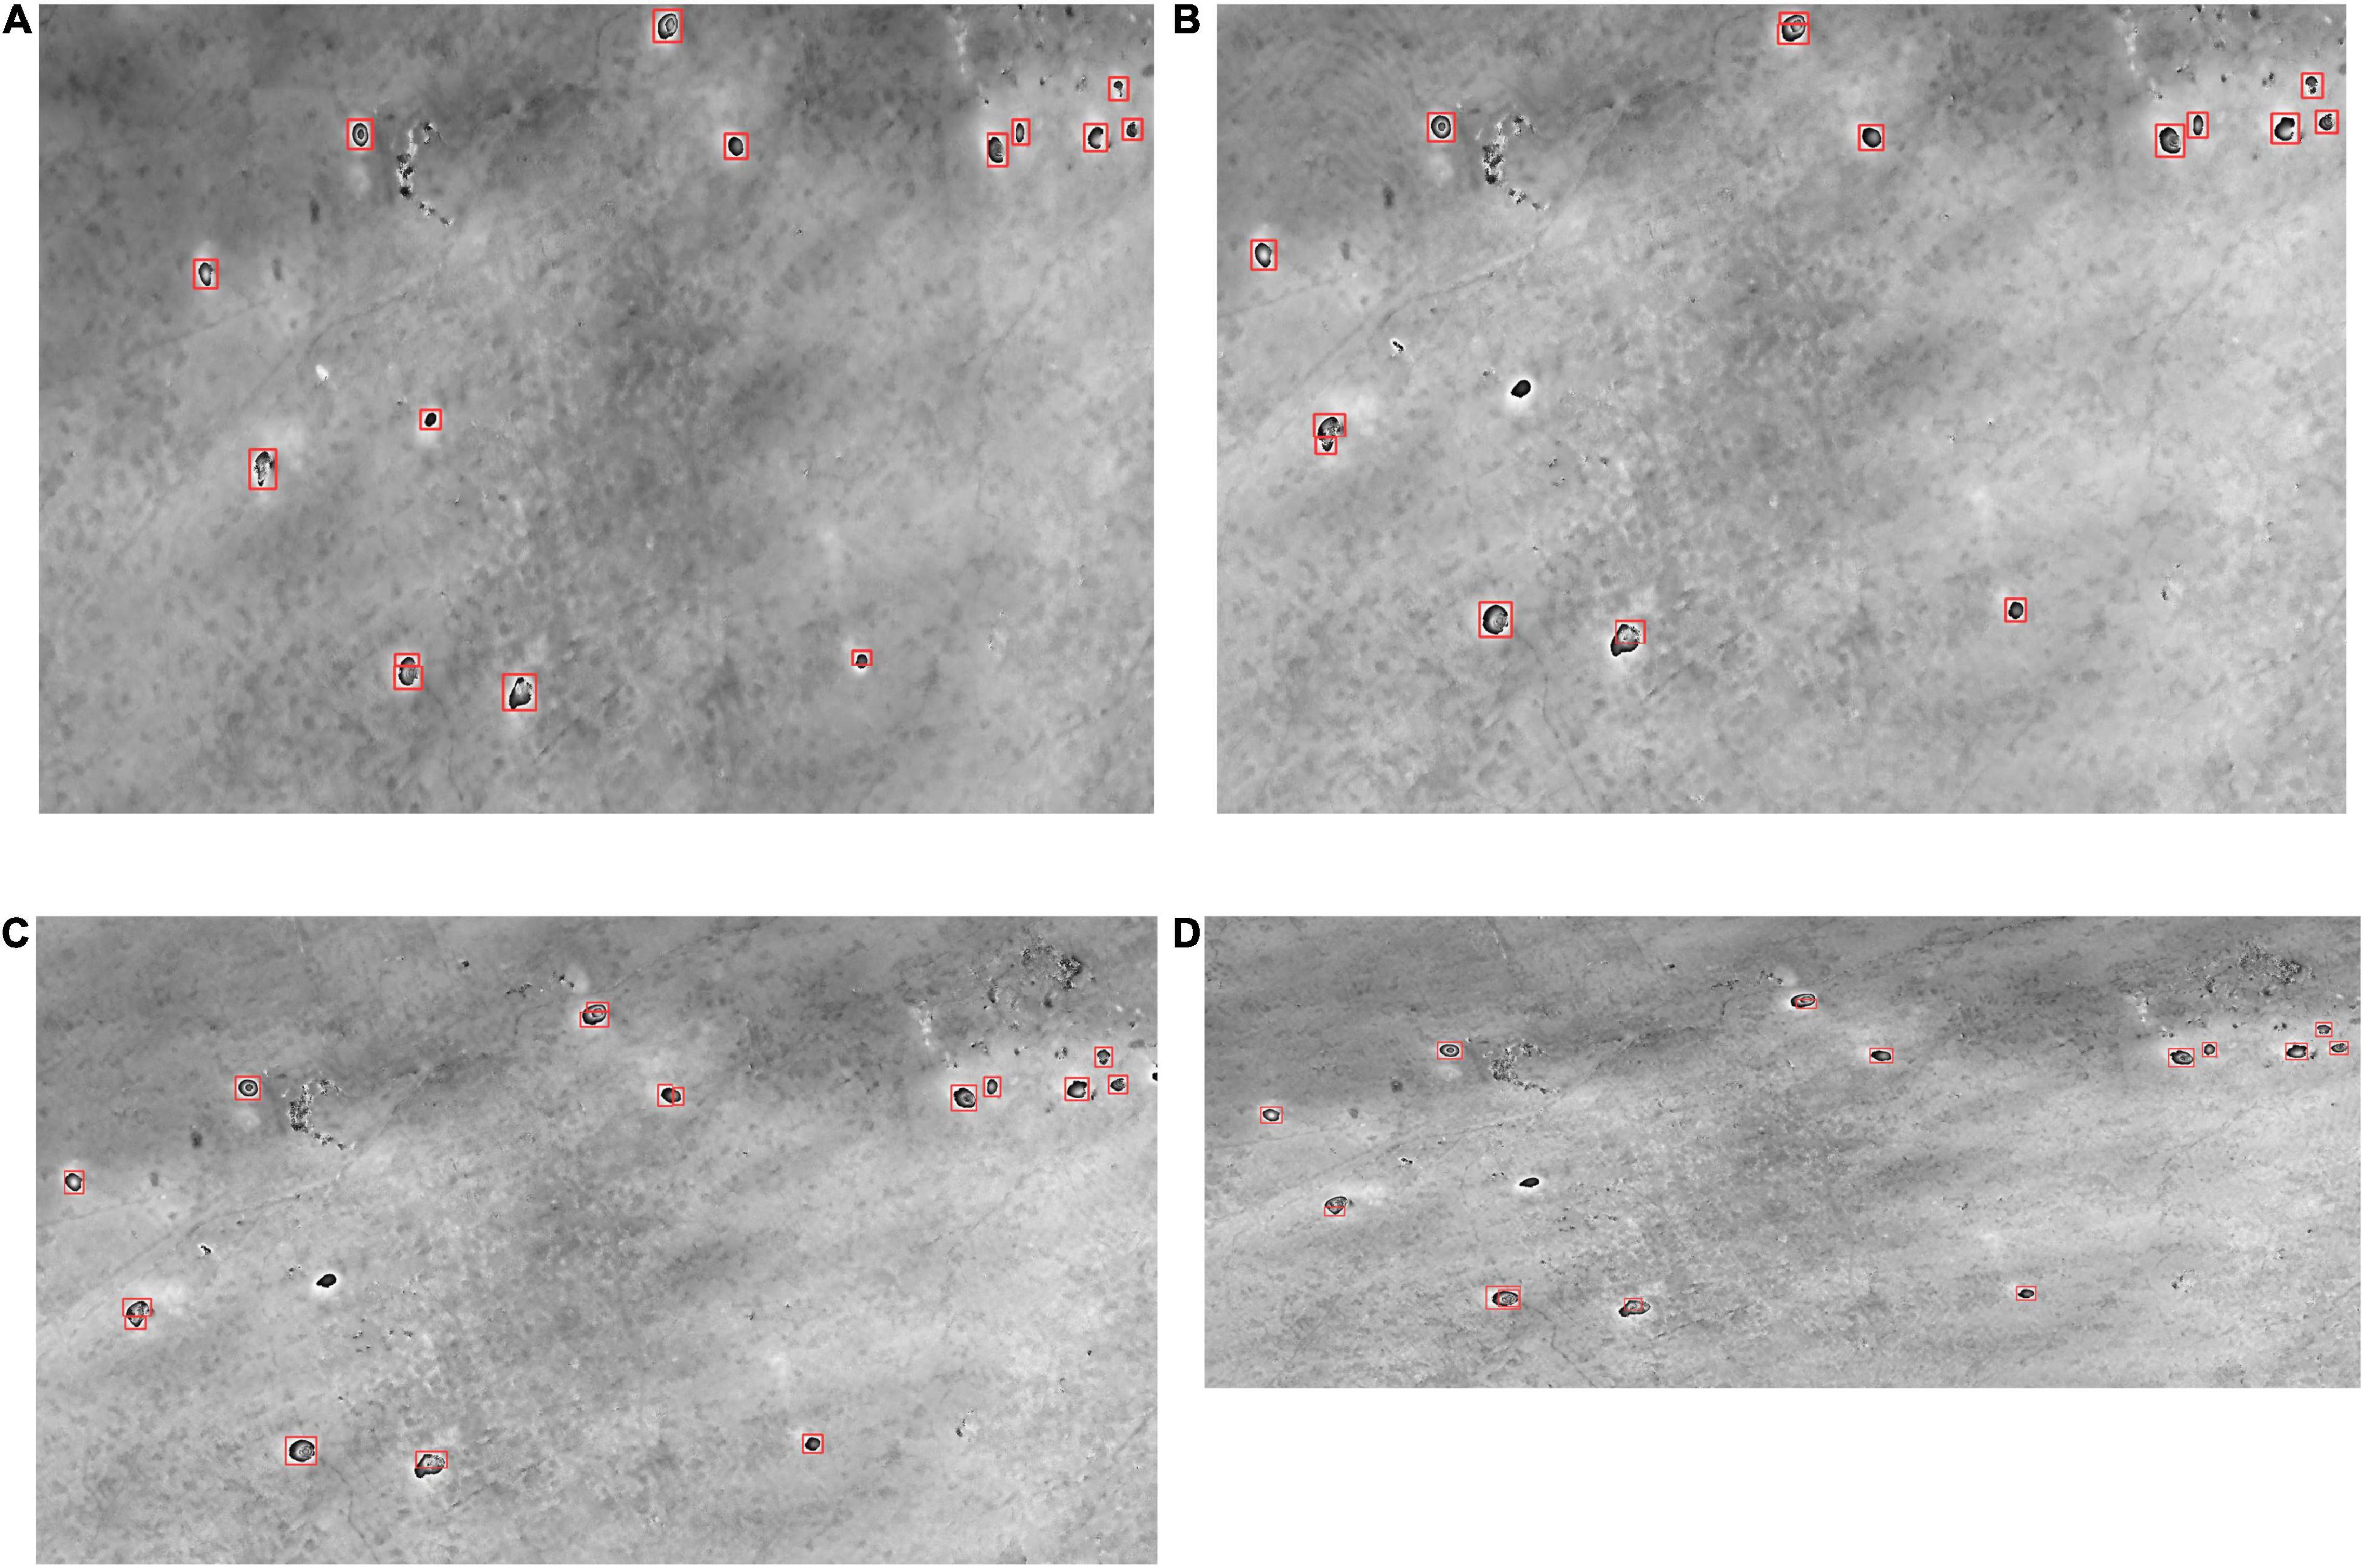
Figure 13. Detection results of different multi looking numbers of the interferogram. Panels (A–D) are the detection results with multi looking ratios of 1:5, 1:4, 1:3, and 1:2, respectively.
Conclusion
Based on the YOLO V5 network architecture, the Light YOLO-Basin model for automatically detecting subsidence basins from interferograms was proposed in this paper. The Light YOLO-Basin model uses depthwise separable convolution as the lightweight module and introduces the anchor-free detection box encoding method and OTA to solve the problem caused by fixed anchor boxes. Through experiment, the valuable conclusions can be obtained as follows:
1. Depthwise separable convolution generally sacrifices a small amount of accuracy to improve the detection efficiency. The depthwise separable convolution of the Light YOLO-Basin model can improve the detection speed and reduce the model parameters from 207.10 to 40.39 MB. More importantly, the detection accuracy of the Light YOLO-Basin model has also been significantly improved. The value of mAP is increased by 3.2% compared with the non-lightweight model, which verifies the assumption that it does not require a heavy network when detecting the subsidence basins from interferograms.
2. It can effectively detect the subsidence basins through combined anchor-free and OTA adaptive sample assignment methods. The ablation experiments in this study indicate that anchor-free and OTA methods in the Light YOLO-Basin model increase the value of mAP from 46.98 to 54.84%, and the value of AP50, AP60, and AP70 increase by 4.75, 7.63, and 9.84%, respectively.
3. We introduce the Focal Loss function in the Light YOLO-Basin model when computing the confidence loss to balance the weight of the hard and easy samples during model training, increasing the value of mAP from 54.62 to 55.12% and AP50 from 88.62 to 90.64%.
The Light YOLO-Basin model proposed in this paper has good performance to detect subsidence basins from InSAR interferograms with wide swaths. This study also has some limitations. When making sample datasets, the labeling of training samples has a greater impact on the detection accuracy of the model. For subsidence basins with poor visual interpretation, the Light YOLO-Basin model also has false detection or missing detection in the poor interferogram. In addition, the reason why the depthwise separable convolution improves the detection accuracy of the subsidence basin may be related to the shape of the subsidence basin on the InSAR interferogram. We will solve these above problems in future works. We will propose a better detection model by analyzing the difference in morphological characteristics between the subsidence basin on the InSAR interferogram and the object in the natural image.
Data Availability Statement
The original contributions presented in the study are included in the article/supplementary material, further inquiries can be directed to the corresponding author.
Author Contributions
YY collected and analyzed the data, and wrote the manuscript. ZYW proposed the method, designed its structure, and revised the manuscript. ZL and KY helped in collecting and analyzing the data. HL and ZHW critically revised the manuscript. All authors contributed to the article and approved the submitted version.
Funding
This research was funded by the Major Science and Technology Innovation Projects of Shandong Province (No. 2019JZZY020103). This research was supported by funding from the National Natural Science Foundation of China (No. 41876202).
Conflict of Interest
The authors declare that the research was conducted in the absence of any commercial or financial relationships that could be construed as a potential conflict of interest.
Publisher’s Note
All claims expressed in this article are solely those of the authors and do not necessarily represent those of their affiliated organizations, or those of the publisher, the editors and the reviewers. Any product that may be evaluated in this article, or claim that may be made by its manufacturer, is not guaranteed or endorsed by the publisher.
Acknowledgments
We thank the European Space Agency (ESA) for providing the Sentinel-1A remote sensing data. We also thank NASA for providing the SRTM DEM data. We want to thank the reviewers for their valuable suggestions and comments which improved the quality of the manuscript.
References
Bala, J., Dwornik, M., and Franczyk, A. (2021). Automatic subsidence troughs detection in SAR interferograms using circlet transform. Sensors 21:1706. doi: 10.3390/s21051706
Bochkovskiy, A., Wang, C. Y., and Liao, H. Y. M. (2020). Yolov4: optimal speed and accuracy of object detection. arXiv [Preprint] arXiv: 2004.10934,
Chang, Y. L., Anagaw, A., Chang, L. N., Wang, Y. C., Hsiao, C. Y., and Lee, W. H. (2019). Ship detection based on YOLOv2 for SAR imagery. Remote Sens. 11:786. doi: 10.3390/rs11070786
Chen, B. Q., Deng, K. Z., Fan, H. D., and Yu, Y. (2015). Combining SAR interferometric phase and intensity information for monitoring of large gradient deformation in coal mining area. Eur. J. Remote Sens. 48, 701–717. doi: 10.5721/EuJRS20154839
Chen, B. Q., Li, Z. H., Yu, C., Fairbairn, D., Kang, J. R., Hu, J. S., et al. (2020). Three-dimensional time-varying large surface displacements in coal exploiting areas revealed through integration of SAR pixel offset measurements and mining subsidence model. Remote Sens. Environ. 240:111663. doi: 10.1016/j.rse.2020.111663
Chen, B. Q., Mei, H., Li, Z. H., Wang, Z. S., Yu, Y., and Yu, H. (2021). Retrieving three-dimensional large surface displacements in coal mining areas by combining SAR pixel offset measurements with an improved mining subsidence model. Remote Sens. 13:2541. doi: 10.3390/rs13132541
Chen, D. H., Chen, H. E., Zhang, W., Cao, C., Zhu, K. X., Yuan, X. Q., et al. (2020). Characteristics of the residual surface deformation of multiple abandoned mined-out areas based on a field investigation and SBAS-InSAR: a case study in Jilin, China. Remote Sens. 12, 3752. doi: 10.3390/rs12223752
Chen, Q. S., Fan, C., Jin, W. Z., Zou, L., Li, F. Y., Li, X. P., et al. (2020). EPGNet: enhanced point cloud generation for 3D object detection. Sensors 20:6927. doi: 10.3390/s20236927
Chen, Y., Tong, Y. X., and Tan, K. (2020). Coal mining deformation monitoring using SBAS-InSAR and offset tracking: a case study of yu county, china. IEEE J. Sel. Topics Appl. Earth Observ. 13, 6077–6087. doi: 10.1109/JSTARS.2020.3028083
Cuturi, M. (2013). Sinkhorn distances: lightspeed computation of optimal transport. Adv. Neural Inf. Process. Syst. 26, 2292–2300.
Dai, Y. W., Ng, A. H. M., Wang, H., Li, L. Y., and Tao, T. Y. (2020). Modeling-assisted InSAR phase-unwrapping method for mapping mine subsidence. IEEE Geosci. Remote Sens. Lett. 18, 1059–1063. doi: 10.1109/LGRS.2020.2991687
Dong, L. K., Wang, C., Tang, Y. X., Tang, F. Q., and Duan, W. (2021). Time series InSAR three-dimensional displacement inversion model of coal mining areas based on symmetrical features of mining subsidence. Remote Sens. 13, 2143–2159. doi: 10.3390/rs13112143
Du, S., Wang, Y. J., Zheng, M. N., Zhou, D. W., and Xia, Y. P. (2019). Goaf locating based on InSAR and probability integration method. Remote Sens. 11:8. doi: 10.3390/rs11070812
Duan, K. W., Bai, S., Xie, L. X., Qi, H. G., Huang, Q. M., and Tian, Q. (2019). “Centernet: keypoint triplets for object detection,” in Proceedings of the 2019 IEEE International Conference on Computer Vision (ICCV), Seoul, 6569–6578.
Fan, H. D., Lu, L., and Yao, Y. H. (2018). Method combining probability integration model and a small baseline subset for time series monitoring of mining subsidence. Remote Sens. 10:1444. doi: 10.3390/rs10091444
Fan, H. D., Wang, L., Wen, B. F., and Du, S. (2021). A new model for three-dimensional deformation extraction with single-track InSAR based on mining subsidence characteristics. Int. J. Appl. Earth Obs. 94:102223. doi: 10.1016/j.jag.2020.102223
Fu, J. M., Sun, X., Wang, Z. R., and Fu, K. (2020). An anchor-free method based on feature balancing and refinement network for multiscale ship detection in SAR images. IEEE Trans. Geosci. Remote Sens. 59, 1331–1344. doi: 10.1109/TGRS.2020.3005151
Fu, K., Chang, Z. H., Zhang, Y., Xu, G. L., Zhang, K. S., and Sun, X. (2020). Rotation-aware and multi-scale convolutional neural network for object detection in remote sensing images. ISPRS J. Photogramm. 161, 294–308. doi: 10.1016/j.isprsjprs.2020.01.025
Ge, Z., Liu, S. T., Li, Z. M., Yoshie, O., and Sun, J. (2021). “OTA: optimal transport assignment for object detection,” in Proceedings of the 2021 IEEE Conference on Computer Vision and Pattern Recognition (CVPR), Nashville, TN, 303–312.
Girshick, R. (2015). “Fast R-CNN,” in Proceedings of the 2015 IEEE International Conference on Computer Vision (ICCV), Santiago, 1440–1448. doi: 10.1109/ICCV.2015.169
Girshick, R., Donahue, J., Darrell, T., and Malik, J. (2014). “Rich feature hierarchies for accurate object detection and semantic segmentation,” in Proceedings of the 2014 IEEE Conference on Computer Vision and Pattern Recognition (CVPR), Columbus, OH, 580–587. doi: 10.1109/cvpr.2014.81
He, K., Zhang, X., Ren, S., and Sun, J. (2016). “Deep residual learning for image recognition,” in Proceedings of the 2016 IEEE Conference on Computer Vision and Pattern Recognitionn (CVPR), Las Vegas, NV, 770–778. doi: 10.1109/CVPR.2016.90
Howard, A. G., Zhu, M., Chen, B., Kalenichenko, D., Wang, W., Weyand, T., et al. (2017). Mobilenets: efficient convolutional neural networks for mobile vision applications. arXiv [Preprint] arXiv: 1704.04861,
Hu, Z., Ge, L. L., Li, X. J., Zhang, K., and Zhang, L. (2013). An underground-mining detection system based on DInSAR. IEEE Trans. Geosci. Remote Sens. 51, 615–625. doi: 10.1109/TGRS.2012.2202243
Ilieva, M., Polanin, P., Borkowski, A., Gruchlik, P., Smolak, K., Kowalski, A., et al. (2019). Mining deformation life cycle in the light of InSAR and deformation models. Remote Sens. 11:745. doi: 10.3390/rs11070745
Jiang, J. H., Fu, X. J., Qin, R., Wang, X. Y., and Ma, Z. F. (2021). High-speed lightweight ship detection algorithm based on YOLO-V4 for three-channels RGB SAR image. Remote Sens. 13:1909. doi: 10.3390/rs13101909
Kingma, D. P., and Ba, J. (2014). Adam: a method for stochastic optimization. arXiv [Preprint] arXiv: 1412.6980,
Law, H., and Deng, J. (2018). “Cornernet: detecting objects as paired keypoints,” in Proceedings of the 2018 European Conference on Computer Vision (ECCV), Munich, 734–750. doi: 10.1007/s11263-019-01204-1
LeCun, Y., Bengio, Y., and Hinton, G. (2015). Deep learning. Nature 2015, 436–444. doi: 10.1038/nature14539
Li, K., Cheng, G., Bu, S. H., and You, X. (2017). Rotation-insensitive and context-augmented object detection in remote sensing images. IEEE Trans. Geosci. Remote Sens. 56, 2337–2348. doi: 10.1109/TGRS.2017.2778300
Lin, T. Y., Dollár, P., Girshick, R., He, K. M., Hariharan, B., and Belongie, S. (2017a). “Feature pyramid networks for object detection,” in Proceedings of the 2017 IEEE Conference on Computer Vision and Pattern Recognition (CVPR), Honolulu, HI, 2117–2125. doi: 10.1109/CVPR.2017.106
Lin, T. Y., Goyal, P., Girshick, R., He, K. M., and Dollar, P. (2017b). “Focal loss for dense object detection,” in Proceedings of the 2017 IEEE International Conference on Computer Vision (ICCV), Venice, 2980–2988. doi: 10.1109/TPAMI.2018.2858826
Liu, W., Anguelov, D., Erhan, D., Szegedy, C., Reed, S., Fu, C. Y., et al. (2016). “SSD: single shot multibox detector,” in Proceedings of the 2016 European Conference on Computer Vision (ECCV), Amsterdam, 21–37. doi: 10.1007/978-3-319-46448-0_2
Luo, Z., Yu, H. L., and Zhang, Y. Z. (2020). Pine cone detection using boundary equilibrium generative adversarial networks and improved YOLOv3 model. Sensors 20:4430. doi: 10.3390/s20164430
Ng, A. H. M., Ge, L. L., Du, Z. Y., Wang, S. R., and Ma, C. (2017). Satellite radar interferometry for monitoring subsidence induced by longwall mining activity using Radarsat-2, Sentinel-1 and ALOS-2 data. Int. J. Appl. Earth Obs. 61, 92–103. doi: 10.1016/j.jag.2017.05.009
Ou, D. P., Tan, K., Du, Q., Chen, Y., and Ding, J. W. (2018). Decision fusion of D-InSAR and pixel offset tracking for coal mining deformation monitoring. Remote Sens. 10:1055. doi: 10.3390/rs10071055
Purkait, P., Zhao, C., and Zach, C. (2017). SPP-Net: deep absolute pose regression with synthetic views. arXiv [Preprint]. arXiv: 1712.03452.
Redmon, J., and Farhadi, A. (2017). “YOLO9000: better, faster, stronger,” in Proceedings of the 2017 IEEE Conference on Computer Vision and Pattern Recognition (CVPR), Honolulu, HI, 7263–7271. doi: 10.1109/CVPR.2017.690
Redmon, J., and Farhadi, A. (2018). Yolov3: an incremental improvement. arXiv [Preprint] arXiv: 1804.02767,
Redmon, J., Divvala, S., Girshick, R., and Farhadi, A. (2016). “You only look once: unified, real-time object detection,” in Proceedings of the 2016 IEEE Conference on Computer Vision and Pattern Recognition (CVPR), Las Vegas, NV, 779–788. doi: 10.1109/CVPR.2016.91
Ren, C. J., Jung, H. J., Lee, S. H., and Jeong, D. W. (2021). Coastal waste detection based on deep convolutional neural networks. Sensors 21:7269. doi: 10.3390/s21217269
Ren, S. Q., He, K. M., Girshick, R., and Sun, J. (2015). Faster R-CNN: towards real-time object detection with region proposal networks. IEEE Trans. Pattern Anal. Mach. Intell. 39:6. doi: 10.1109/TPAMI.2016.2577031
Shi, G., Zhang, J., Liu, J., Zhang, C., and Yang, S. (2020). Global context-augmented objection detection in VHR optical remote sensing images. IEEE Trans. Geosci. Remote Sens. 59, 10604–10617. doi: 10.1109/tgrs.2020.3043252
Shi, M. Y., Yang, H. L., Wang, B. C., Peng, J. H., and Zhang, B. (2021). Improving boundary constraint of probability integral method in SBAS-InSAR for deformation monitoring in mining areas. Remote Sens. 13:1497. doi: 10.3390/rs13081497
Shi, P. F., Jiang, Q. G., Shi, C., Xi, J., Tao, G. F., Zhang, S., et al. (2021). Oil well detection via large-scale and high-resolution remote sensing images based on improved YOLO v4. Remote Sens. 13:3243. doi: 10.3390/rs13163243
Song, G. L., Liu, Y., and Wang, X. G. (2020). “Revisiting the sibling head in object detector,” in Proceedings of the 2020 IEEE Conference on Computer Vision and Pattern Recognition (CVPR), Seattle, WA, 11563–11572.
Sun, X., Wang, P. J., Wang, C., Liu, Y. F., and Fu, K. (2021). PBNet: Part-based convolutional neural network for complex composite object detection in remote sensing imagery. ISPRS J. Photogramm. 173, 50–65. doi: 10.1016/j.isprsjprs.2020.12.015
Tian, Z., Shen, C. H., Chen, H., and He, T. (2019). “Fcos: Fully convolutional one-stage object detection,” in Proceedings of the in 2019 IEEE International Conference on Computer Vision (ICCV), Seoul, 9627–9636. doi: 10.1109/ICCV.2019.00972
Wang, L. Y., Deng, K. Z., and Zheng, M. N. (2020). Research on ground deformation monitoring method in mining areas using the probability integral model fusion D-InSAR, sub-band InSAR and offset-tracking. Int. J. Appl. Earth Obs. 85:101981. doi: 10.1016/j.jag.2019.101981
Wang, Z. Y., Li, L., Yu, Y. R., Wang, J., Li, Z. J., and Liu, W. (2021a). A novel phase unwrapping method used for monitoring the land subsidence in coal mining area based on U-Net convolutional neural network. Front. Earth Sci. 9:761653. doi: 10.3389/feart.2021.761653
Wang, Z. Y., Li, L., Wang, J., and Liu, J. (2021b). A method of detecting the subsidence basin from InSAR interferogram in mining area based on HOG features. J. China Univ. Mining Technol. 50, 404–410. doi: 10.13247/j.cnki.jcumt.001264
Wu, W., Liu, H., Li, L., Long, Y., Wang, X., Wang, Z., et al. (2021). Application of local fully convolutional neural network combined with YOLO v5 algorithm in small target detection of remote sensing image. PLoS One 16:e0259283. doi: 10.1371/journal.pone.0259283
Wu, Y., Chen, Y. P., Yuan, L., Liu, Z. C., Wang, L. J., Li, H. Z., et al. (2020). “Rethinking classification and localization for object detection,” in Proceedings of the 2020 IEEE Conference on Computer Vision and Pattern Recognition (CVPR), Seattle, WA, 10186–10195. doi: 10.1109/CVPR42600.2020.01020
Wu, Z. T., Hou, B., Ren, B., Ren, Z. L., Wang, S., and Jiao, L. C. (2021). A deep detection network based on interaction of instance segmentation and object detection for SAR images. Remote Sens. 13:2582. doi: 10.3390/rs13132582
Xia, Y., Wang, Y., Du, S., Liu, X., and Zhou, H. (2018). Integration of D-InSAR and GIS technology for identifying illegal underground mining in Yangquan District, Shanxi Province, China. Environ. Earth Sci. 77, 1–19.
Xie, S. N., Girshick, R., Dollár, P., Tu, Z. W., and He, K. M. (2017). “Aggregated residual transformations for deep neural networks,” in Proceedings of the 2017 IEEE Conference on Computer Vision and Pattern Recognition (CVPR), Honolulu, HI, 1492–1500. doi: 10.1109/CVPR.2017.634
Yan, B., Fan, P., Lei, X. Y., Liu, Z. J., and Yang, F. Z. (2021). A real-time apple targets detection method for picking robot based on improved YOLOv5. Remote Sens. 13:1619. doi: 10.3390/rs13091619
Yang, Z. F., Li, Z. W., Zhu, J. J., Feng, G. C., Wang, Q. J., Hu, J., et al. (2018a). Deriving time-series three-dimensional displacements of mining areas from a single-geometry InSAR dataset. J. Geodesy 92, 529–544. doi: 10.1007/s00190-017-1079-x
Yang, Z. F., Li, Z. W., Zhu, J. J., Preusse, A., Hu, J., Feng, G. C., et al. (2018b). An InSAR-based temporal probability integral method and its application for predicting mining-induced dynamic deformations and assessing progressive damage to surface buildings. IEEE J. Sel. Topics Appl. Earth Observ. 11, 472–484. doi: 10.1109/JSTARS.2018.2789341
Yang, Z. F., Li, Z. W., Zhu, J. J., Feng, G. C., Hu, J., Wu, L. X., et al. (2018c). Locating and defining underground goaf caused by coal mining from space-borne SAR interferometry. ISPRS J. Photogramm. 135, 112–126. doi: 10.1016/j.isprsjprs
Yang, Z. F., Li, Z. W., Zhu, J. J., Preusse, A., Yi, H. W., Wang, Y. J., et al. (2017a). An extension of the InSAR-based probability integral method and its application for predicting 3-D mining-induced displacements under different extraction conditions. IEEE Trans. Geosci. Remote Sens. 55, 3835–3845. doi: 10.1109/TGRS.2017.2682192
Yang, Z. F., Li, Z. W., Zhu, J. J., Yi, H. W., Hu, J., and Feng, G. C. (2017b). Deriving dynamic subsidence of coal mining areas using InSAR and logistic model. Remote Sens. 9, 125–143. doi: 10.3390/rs9020125
Yuan, M. Z., Li, M., Liu, H., Lv, P. Y., Li, B., and Zheng, W. B. (2021). Subsidence monitoring base on SBAS-InSAR and slope stability analysis method for damage analysis in mountainous mining subsidence regions. Remote Sens. 13:3107. doi: 10.3390/rs13163107
Zhao, J. Q., Zhang, X. H., Yan, J. W., Qiu, X. L., Yao, X., Tian, Y. C., et al. (2021). A wheat spike detection method in UAV images based on improved YOLOv5. Remote Sens. 133095. doi: 10.3390/rs13163095
Keywords: InSAR, subsidence basin detecting, YOLO V5, depthwise separable convolution, anchor-free, optimal transport assignment (OTA)
Citation: Yu Y, Wang Z, Li Z, Ye K, Li H and Wang Z (2022) A Lightweight Anchor-Free Subsidence Basin Detection Model With Adaptive Sample Assignment in Interferometric Synthetic Aperture Radar Interferogram. Front. Ecol. Evol. 10:840464. doi: 10.3389/fevo.2022.840464
Received: 21 December 2021; Accepted: 08 February 2022;
Published: 08 March 2022.
Edited by:
Yu Chen, China University of Mining and Technology, ChinaReviewed by:
Tao Li, Ministry of Natural Resources of the People’s Republic of China, ChinaHongyu Liang, Tongji University, China
Copyright © 2022 Yu, Wang, Li, Ye, Li and Wang. This is an open-access article distributed under the terms of the Creative Commons Attribution License (CC BY). The use, distribution or reproduction in other forums is permitted, provided the original author(s) and the copyright owner(s) are credited and that the original publication in this journal is cited, in accordance with accepted academic practice. No use, distribution or reproduction is permitted which does not comply with these terms.
*Correspondence: Zhiyong Wang, c2tkOTk0MTc3QHNkdXN0LmVkdS5jbg==