 Terri Lacourse
 Matthew A. Adeleye
95% of researchers rate our articles as excellent or good
Learn more about the work of our research integrity team to safeguard the quality of each article we publish.
Find out more
ORIGINAL RESEARCH article
Front. Ecol. Evol. , 08 March 2022
Sec. Paleoecology
Volume 10 - 2022 | https://doi.org/10.3389/fevo.2022.838545
This article is part of the Research Topic Advances in Reconstructing Biotic and Abiotic Interactions in Forest Ecosystems, Volume II View all 6 articles
Projected changes in climate are expected to shift the ranges of many tree species poleward and to higher elevations. Here, we examine past changes in forest composition in Pacific Canada using a paleoecological approach and investigate the role of past changes in climate and differences in species traits in changing forest compositions. We present a new pollen record from a mid-elevation fen on central Vancouver Island, British Columbia that shows (1) Pinus contorta-dominated communities starting 14,000 cal yr BP, (2) an abrupt transition to Pseudotsuga menziesii and Tsuga heterophylla forests by 10,600 cal yr BP, and (3) a gradual transition to Tsuga heterophylla-dominated forests in the mid-Holocene. We combine this mid-elevation record with nearby pollen records along a 1,400-m elevation gradient to assess sorting of dominant woody plant taxa and their life history and stress tolerance traits over the last 14,000 years. Multivariate time series confirm elevational sorting of woody plant taxa through time with the modern elevational zonation of tree taxa established by 6,000 cal yr BP. Some taxa have consistently occupied low and middle elevations (P. menziesii, Alnus rubra) or high elevations (Tsuga mertensiana), whereas other taxa (P. contorta, T. heterophylla) have occurred at a wider range of elevations. Three-table statistical techniques reveal significant relationships among forest composition, independent paleoclimate records, and species traits. Tree species with similar traits tend to be most abundant at similar times and those that are functionally dissimilar are separated in time. For example, species with “fast” life history strategies (e.g., P. contorta, Alnus viridis) are most abundant in late-glacial plant communities, while those with “slow” life history strategies (e.g., T. heterophylla, T. mertensiana) are most abundant in mid-late Holocene forests. This research highlights that woody plant taxa and their functional traits are sorted on long timescales in association with environmental change. Turnover in forest composition is driven primarily by changes in climate, which acts as a filter on species traits to direct changes in forest dynamics.
Current changes in climate are expanding the ranges of many species poleward and to higher elevations (Chen et al., 2011; Gottfried et al., 2012; Lenoir and Svenning, 2015; Fadrique et al., 2018). Along the Pacific coast of Canada, year-round increases in temperature accompanied by decreased summer precipitation and related lengthening and increased severity of fire seasons (Rodenhuis et al., 2009; Mote and Salathé, 2010; Wotton et al., 2010; Abatzoglou and Williams, 2016; Wang et al., 2016) are predicted to have major consequences for the region’s conifer-dominated ecosystems (Hamann and Wang, 2006; Gray and Hamann, 2013; Halofsky et al., 2018; MacKenzie and Mahony, 2021). Climate change over the Quaternary provides potential analogs for understanding forest responses to current and future changes in climate and guiding conservation and reforestation management practices (Fordham et al., 2020). During the early Holocene in western North America, summers were warmer and drier than present, and wildfires were more frequent (Renssen et al., 2012; Gavin and Brubaker, 2015; Routson et al., 2021). Although early Holocene rates of climate change were slower (Clark et al., 2016) and winter temperatures were likely cooler due to lower solar insolation (Berger and Loutre, 1991), species responses to past changes in climate as recorded in paleoecological records can still provide useful insights to complement modeling approaches that predict climate-driven redistribution of species.
It is well established that species respond individualistically to changes in environmental conditions resulting in large differences in the rates, magnitude and direction of responses among taxa (Jackson and Overpeck, 2000; Williams et al., 2004; Lenoir and Svenning, 2015). How species respond to changes in climate depends on each species’ unique combination of life-history and ecological performance traits that collectively facilitate or hinder their establishment and persistence as environmental conditions change. Birks (2020) recently underscored the long history of considering differences in ecological attributes and traits in the interpretation of paleoecological data and inferences about plant responses to past environmental change. However, there are still relatively few studies that explicitly incorporate species traits into numerical analyses of fossil pollen data (Lacourse, 2009; Reitalu et al., 2015; Brussel et al., 2018; Carvalho et al., 2019; van der Sande et al., 2019). Collectively, these studies show that inclusion of species traits provides important insights into mechanisms that govern species responses to environmental change and ecosystem dynamics on long timescales. However, inclusion of species traits in numerical analyses of fossil pollen data is impeded by the low taxonomic resolution of many records, often restricting consideration of traits to family and genus-level means of simple functional types. This constraint is overcome in Pacific Canada because the pollen of most dominant woody taxa can either be identified to species or reasonably assigned to species based on pollen morphology and phytogeography.
Here, we investigate the effects of past changes in climate on the abundances of dominant woody plant taxa in Pacific Canada and consider the role that interspecific differences in life-history and stress tolerance traits play in mediating past changes in forest composition. Forests in Pacific Canada are dominated by conifers and steep environmental gradients generate high species turnover that results in elevational bands of different forest zones, making this an ideal setting for examining elevational sorting of species through time. We start by presenting a new paleoecological record spanning the last 14,000 years from Anderson Fen, a mid-elevation wetland in Pacific Canada (Figure 1). We compare changes in these fossil pollen assemblages to independent paleoclimate records to identify drivers of changes in forest composition. We then combine this mid-elevation pollen record with other pollen records along an elevation gradient of sites spanning ∼1,400 m to assess temporal and spatial sorting of dominant woody plant taxa. Multivariate time series and three-table statistical techniques are used to relate paleoenvironmental conditions to the life-history and stress tolerance traits of these taxa, by way of their changing pollen abundances through time.
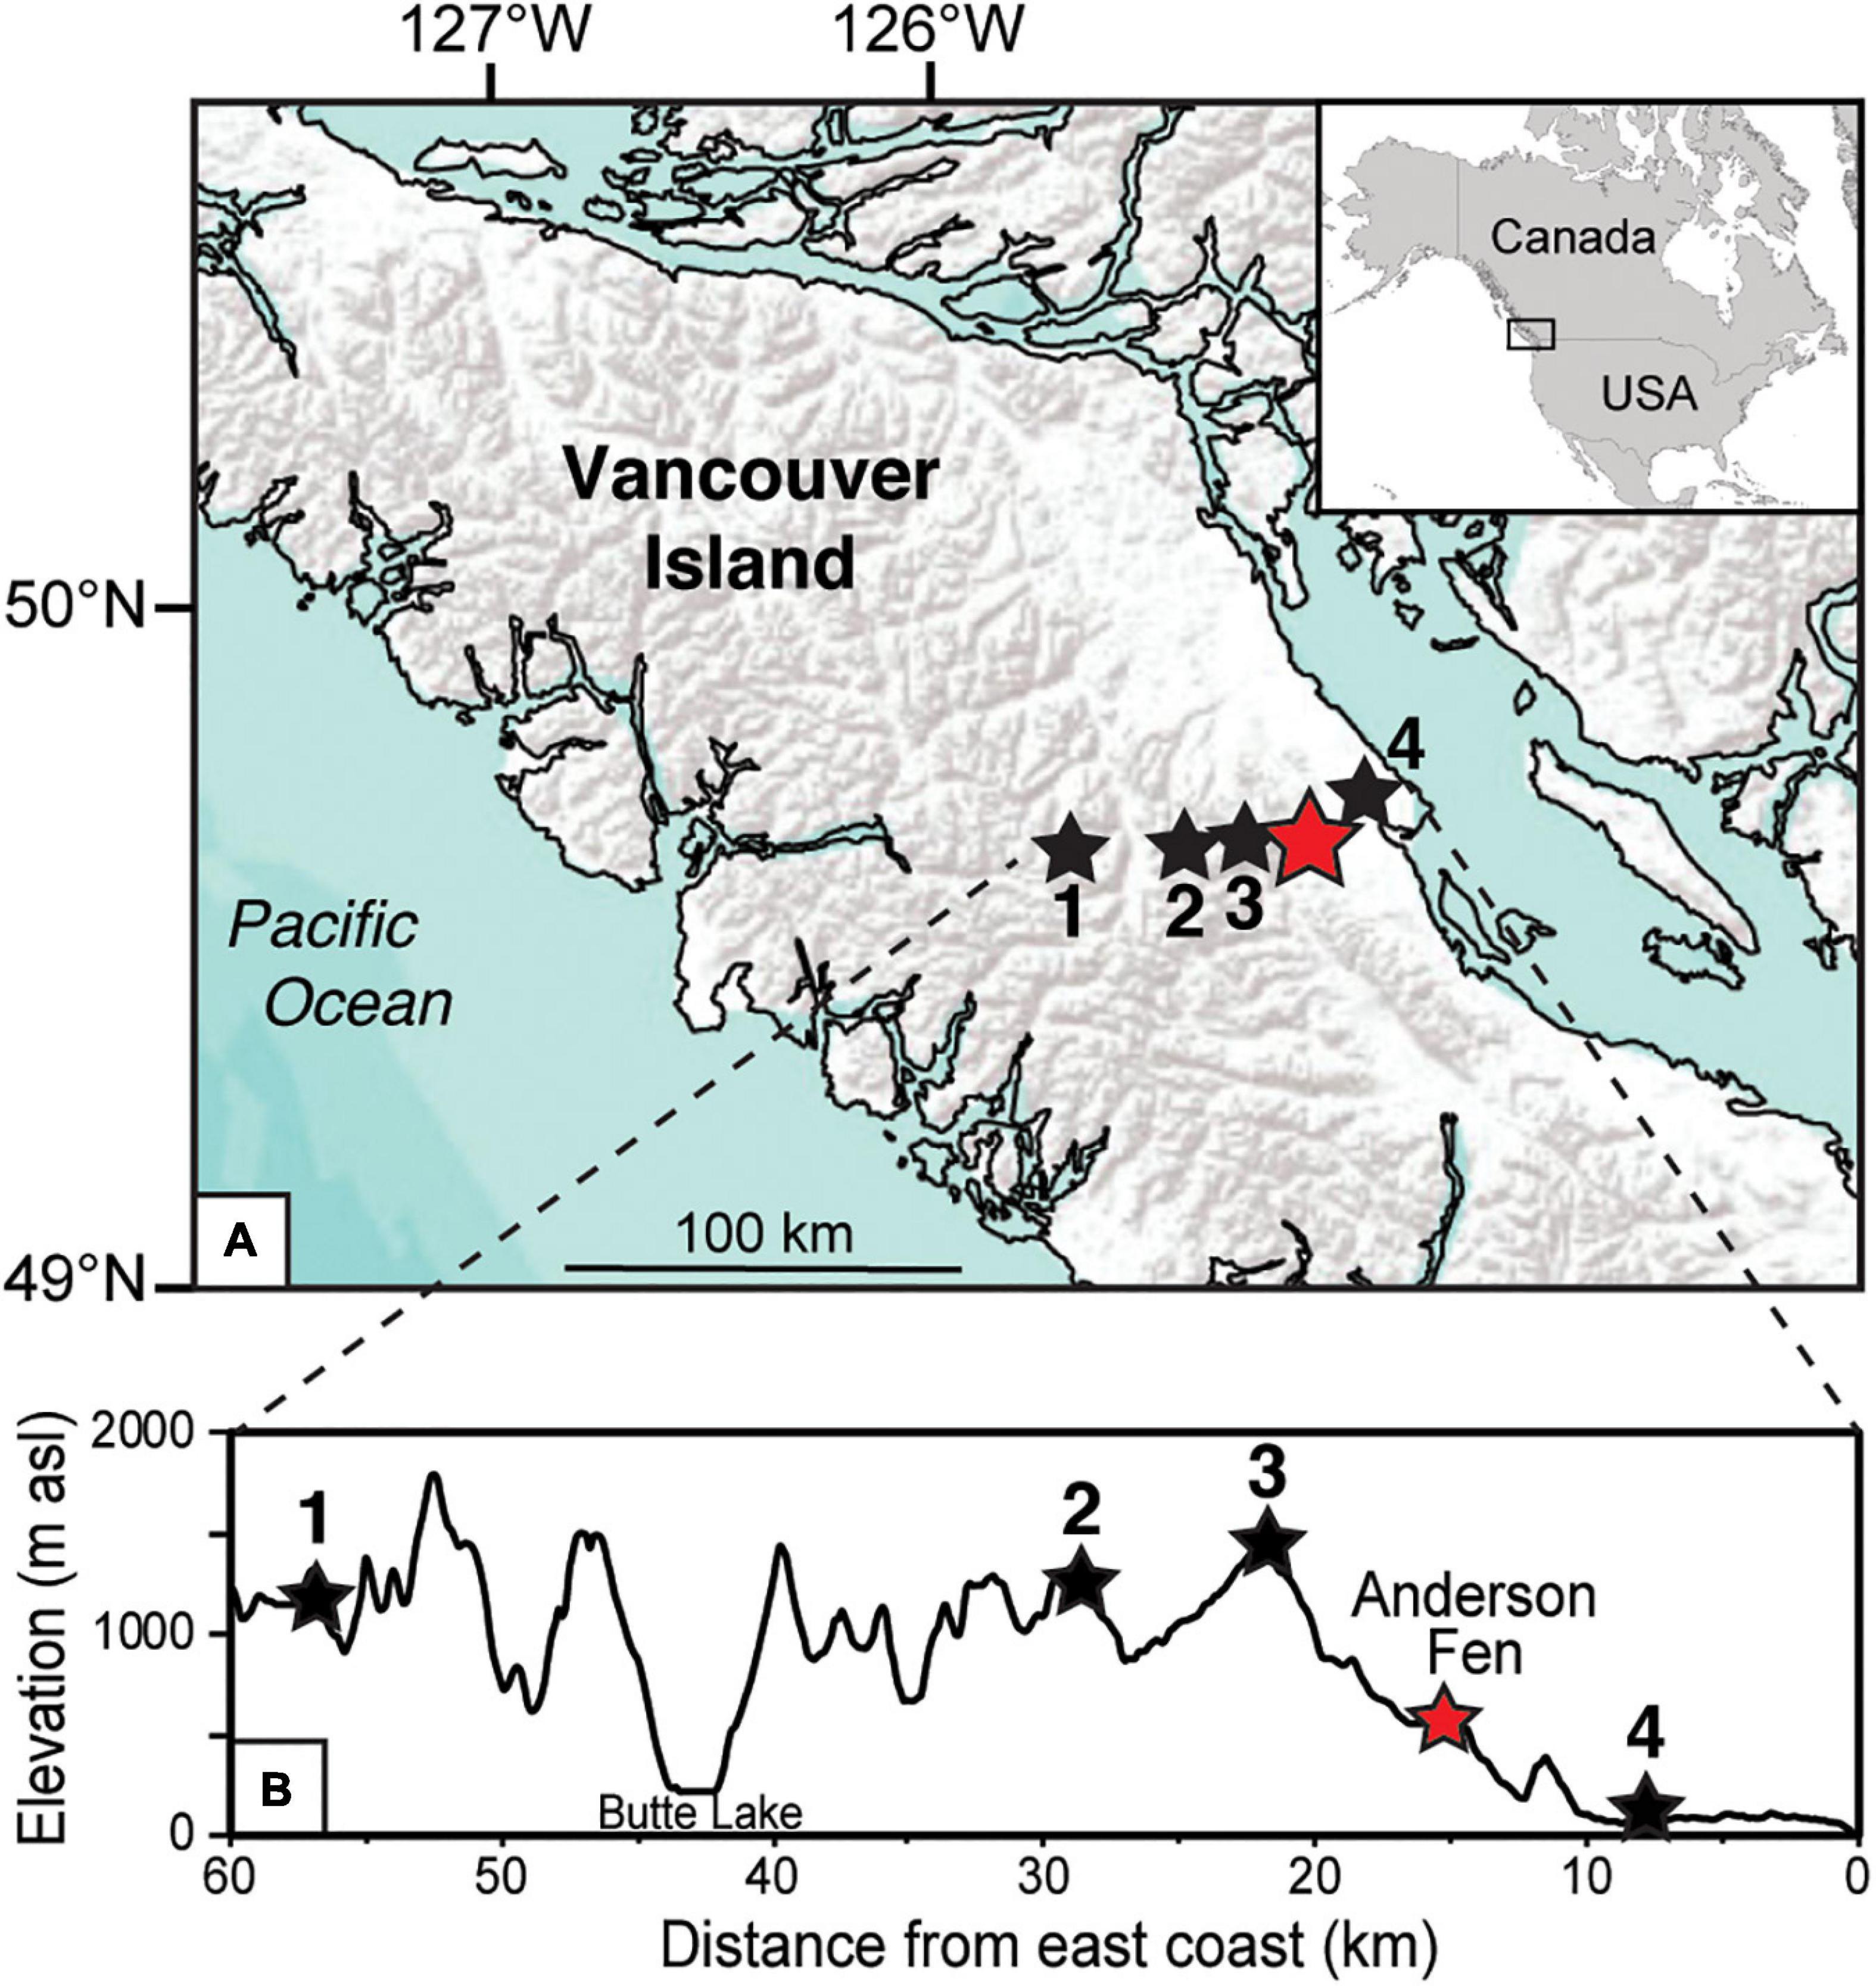
Figure 1. (A) Map of central Vancouver Island in coastal British Columbia, Canada showing location of Anderson Fen (red star). Sites in the elevational transect are shown as black stars: (1) Burman Pond, (2) Harris Ridge Bog, (3) Mt. Washington and (4) Grant’s Bog. (B) Elevation profile, from west to east, for the transect of sites in A.
A 4.7 m peat and sediment core was collected from Anderson Fen in August 2016. The site is a mid-elevation poor fen (49° 44.1′ N, 125° 11.6′ W; 550 m asl) located on central Vancouver Island, British Columbia (BC), Canada (Figure 1) in the Leeward Island Mountain Ecosection. Modern climate is temperate maritime characterized by cool, dry summers and mild, wet winters. Mean annual temperature is 6.9°C with monthly means ranging from a low of −0.2°C in December to a high of 15.1°C in August (Wang et al., 2016). Most precipitation falls as rain between October and March. Mean annual precipitation is 2,270 mm/year.
Anderson Fen has a surface area of 5.5 ha and is connected to Anderson Lake and other nearby wetlands through a small amount of surface flow. Surface plant cover is dominated by Sphagnum spp. mosses (e.g., Sphagnum angustifolium, S. papillosum, S. fuscum), but also includes sedges (Eriophorum angustifolium, Carex spp.) and low ericaceous shrubs (e.g., Vaccinium oxycoccos, Kalmia microphylla var. occidentalis). Anderson Fen is located within the Coastal Western Hemlock biogeoclimatic zone (Meidinger and Pojar, 1991), which occurs at low to middle elevations on the BC coast. Forests are dominated by Tsuga heterophylla. Other common conifers are Thuja plicata, Pseudotsuga menziesii especially on drier sites, and Abies amabilis on wetter sites and at mid-elevations. Pinus contorta tends to be common on disturbed, very dry and very wet sites. Anderson Fen sits near the elevational limit of this western hemlock forest zone, resulting in local forests that are transitional in composition and include Tsuga mertensiana, A. amabilis, and Chamaecyparis nootkatensis, which are common in higher-elevation forests. Above ∼1,000 m, forests are open-canopy and dominated by T. mertensiana with scattered C. nootkatensis, A. amabilis, and Abies lasiocarpa.
The peat and sediment core was collected from the center of Anderson Fen using a 50-cm long “Russian” D-corer using two boreholes 60 cm apart, with 10 cm of overlap for each 50-cm section. This core was used in a previous study to reconstruct wetland succession and long-term carbon accumulation (Lacourse et al., 2019a). AMS radiocarbon ages were obtained on plant macrofossils or bulk peat/organic lake sediment (Table 1) and calibrated to calendar years using the IntCal20 dataset (Reimer et al., 2020). An age-depth model was built using an age of −66 calendar years before present (yr BP) for the top of the core and the calendar age probability distributions for the eight 14C ages. The model was fit with 10,000 iterations of a smooth spline (Lacourse and Gajewski, 2020) in the “clam” package (Blaauw, 2010) in R (R Core Team, 2021). Loss-on-ignition (LOI) was conducted on 1–3 cm3 samples at 2–3 cm intervals following Heiri et al. (2001), i.e., samples were dried at 105°C for 20 h and ignited at 550°C for 4 h.

Table 1. AMS radiocarbon and calibrated ages from Anderson Fen on Vancouver Island, British Columbia.
Pollen analysis was conducted on 1 or 2 cm3 samples treated with warm 10% KOH for 8 min and acetolysis for 2.5 min. Samples below 455 cm that consisted of clay were also treated with hydrofluoric acid. Prior to chemical treatment, one Lycopodium tablet of 18,584 ± 829 spores (Batch 177745) was added to each sample to estimate pollen concentrations. Pollen accumulation rates were not calculated because of substantial changes in downcore sedimentation rates. A minimum of 400 pollen and spores, not including Sphagnum, was identified in each sample except four samples from the basal clays where a minimum sum of 100 was used due to low pollen concentrations. Pollen and spores were identified to the lowest possible taxonomic level using published keys (e.g., McAndrews et al., 1973; Bassett et al., 1978; Kapp et al., 2000) and modern reference material. Alnus pollen morphotypes were differentiated following May and Lacourse (2012). Botanical nomenclature follows the Flora of North America Editorial Committee (1993).
Pollen percentages were calculated using a base sum of tree, shrub and herb pollen. Percentages for obligate aquatics, ferns and Sphagnum were calculated by adding the base sum to the sum of each group. Hierarchical clustering by sum-of-squares (Bennett, 1996) was used to identify pollen zones i.e., groups of similar assemblages. Principal component analysis (PCA) was used to reduce the major trends in the Anderson Fen dataset to only a few dimensions. Redundancy analysis (RDA) was used to relate changes in community composition to nearby records of paleoclimatic conditions, i.e., summer insolation at 50°N (Berger and Loutre, 1991), alkenone-inferred sea surface temperature (Kienast and McKay, 2001) and pollen-inferred mean annual precipitation (Heusser et al., 1985). Statistical significance was tested using 9999 Monte Carlo permutations. In all numerical analyses, the dataset was limited to pollen types accounting for ≥ 5% of the sum in at least one sample, and Sphagnum spores and pollen from obligate aquatics were excluded. Pollen data were standardized prior to multivariate analyses using the Hellinger transformation (Legendre and Gallagher, 2001) in the “vegan” package (Oksanen et al., 2020) in R.
The pollen record from Anderson Fen was compared to four nearby records from lower and higher elevations to assess sorting of common woody taxa through time and space. The five sites (Supplementary Table 1) form an elevation transect that runs approximately 55 km east-west at ∼49.7°N with Grant’s Bog at 80 m asl (Lacourse et al., 2019b), Anderson Fen at 550 m (this study; Lacourse et al., 2019a), Burman Pond at 1,310 m (Mazzucchi, 2010), Harris Ridge Bog at 1,320 m (Fitton, 2003) and Mt. Washington at 1,425 m (Mazzucchi, 2010). For each site, the age-depth model (Supplementary Figure 1) was updated to the IntCal20 calibration dataset (Reimer et al., 2020) and pollen percentages were calculated in the same manner i.e., using the same base sum. Multivariate time series plots of pollen percentage data were produced using global normalization in the “mvtsplot” package (Peng, 2012) in R. The pollen records for the low and middle elevation sites span the last 14,000 years. The high elevation records begin after 12,700 yr BP, due to later deglaciation of alpine areas (Mazzucchi, 2010).
We follow the approach of Lacourse (2009) to relate changes in forest composition to environmental conditions and interspecific differences in species traits. RLQ analysis, a three-table ordination technique (Dolédec et al., 1996), was used to relate paleoenvironmental variables (table R) to life history and stress tolerance traits of the dominant woody taxa (table Q), using median pollen percentages from the transect of sites (table L) as the link between these two datasets. The rows of table L (time) correspond to the rows of table R and the columns of table L (species) correspond to the columns of table Q. Species traits (maturity or minimum seed-bearing age, seed mass, seed dissemination capacity, relative growth rate, shade tolerance, waterlogging tolerance, drought tolerance, frost tolerance, fire adaptation, typical adult height and lifespan) were compiled from the literature (Supplementary Table 2). We use species-level means, relying on intraspecific trait variability being smaller than interspecific variability. Trait values for Abies are either mean values for A. amabilis and A. lasiocarpa or are the same for both species. The same applies to Cupressaceae (Chamaecyparis nootkatensis and Thuja plicata). Seed mass and lifespan were log-transformed prior to statistical analysis. RLQ analysis was conducted on the cross-matrix of tables R, L, and Q. This technique maximizes the covariance between tables R and Q (Dolédec et al., 1996). Statistical significance of the co-structure between tables R and Q was determined by comparing 9999 Monte Carlo permutations of the rows of tables R and Q with the total inertia in the RLQ analysis. A separate fourth-corner analysis (Dray and Legendre, 2008) was used to quantify and test the correlation between paleoenvironmental variables and species traits. P-values were adjusted for multiple testing using Holm’s correction. RLQ and fourth-corner analyses were conducted using the “ade4” package (Dray et al., 2007) in R.
The age-depth model (Figure 2) predicts an age of 14,025 yr BP (13,390–14,190 yr BP) for the base of the 4.7 m core. Modeled sedimentation rates are ∼0.03 cm/yr for much of the core, but exceed 0.15 cm/yr in the upper 33 cm and between 332 and 357 cm. Mean deposition time is 30 yr/cm and ranges between 2.2 and 51.5 year/cm. The core from Anderson Fen begins in gray clay with a minor sand fraction and 3–6% LOI (Supplementary Figure 2). Basal clays are sharply overlain by organic lake sediments (454–411 cm) containing Potamogeton and Nuphar polysepala seeds with LOI that increases from 20 to 50%. The remainder of the core consists of various types of peat with LOI generally above 90% (Supplementary Figure 2).
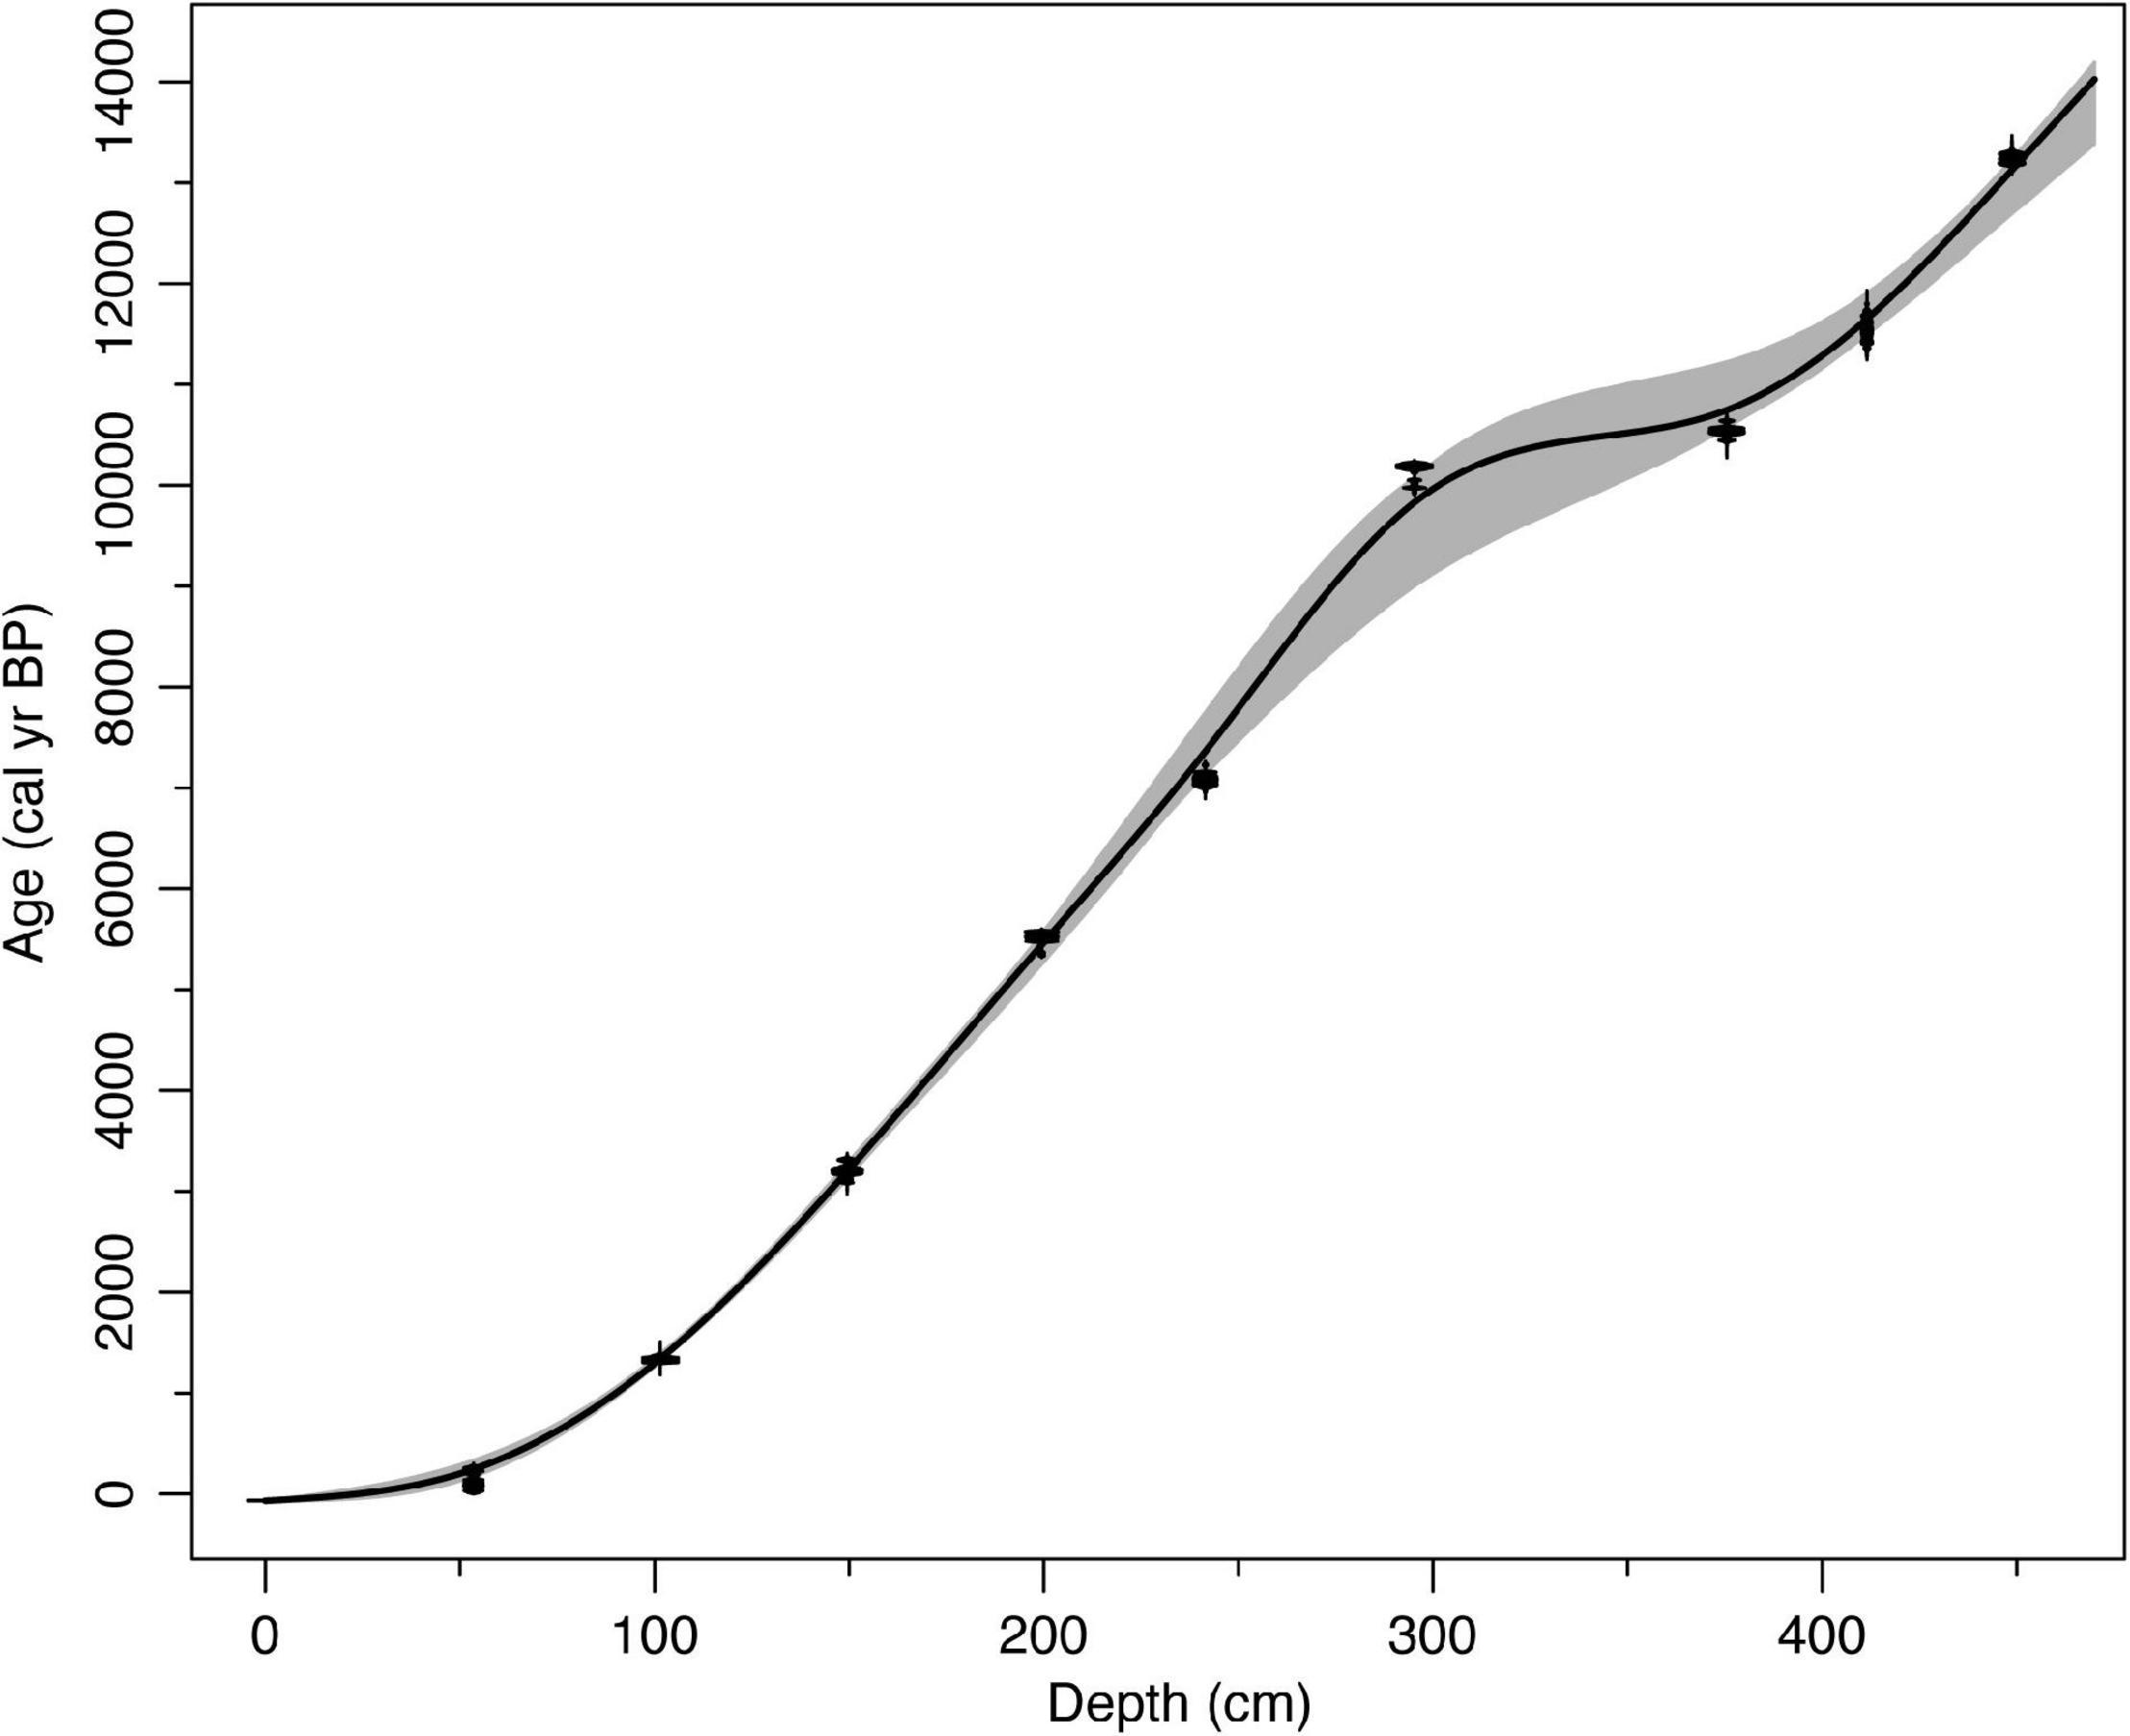
Figure 2. Age-depth model for the core from Anderson Fen, British Columbia, Canada. Gray bands are 95% confidence intervals based on 10,000 iterations of a smooth spline model. Model has been updated to IntCal20 from Lacourse et al. (2019a).
In total, 55 different pollen and spore taxa were identified in the Anderson Fen record. Only the most frequent taxa are shown in Figure 3. The mean temporal resolution of the pollen record is 126 cal yr.
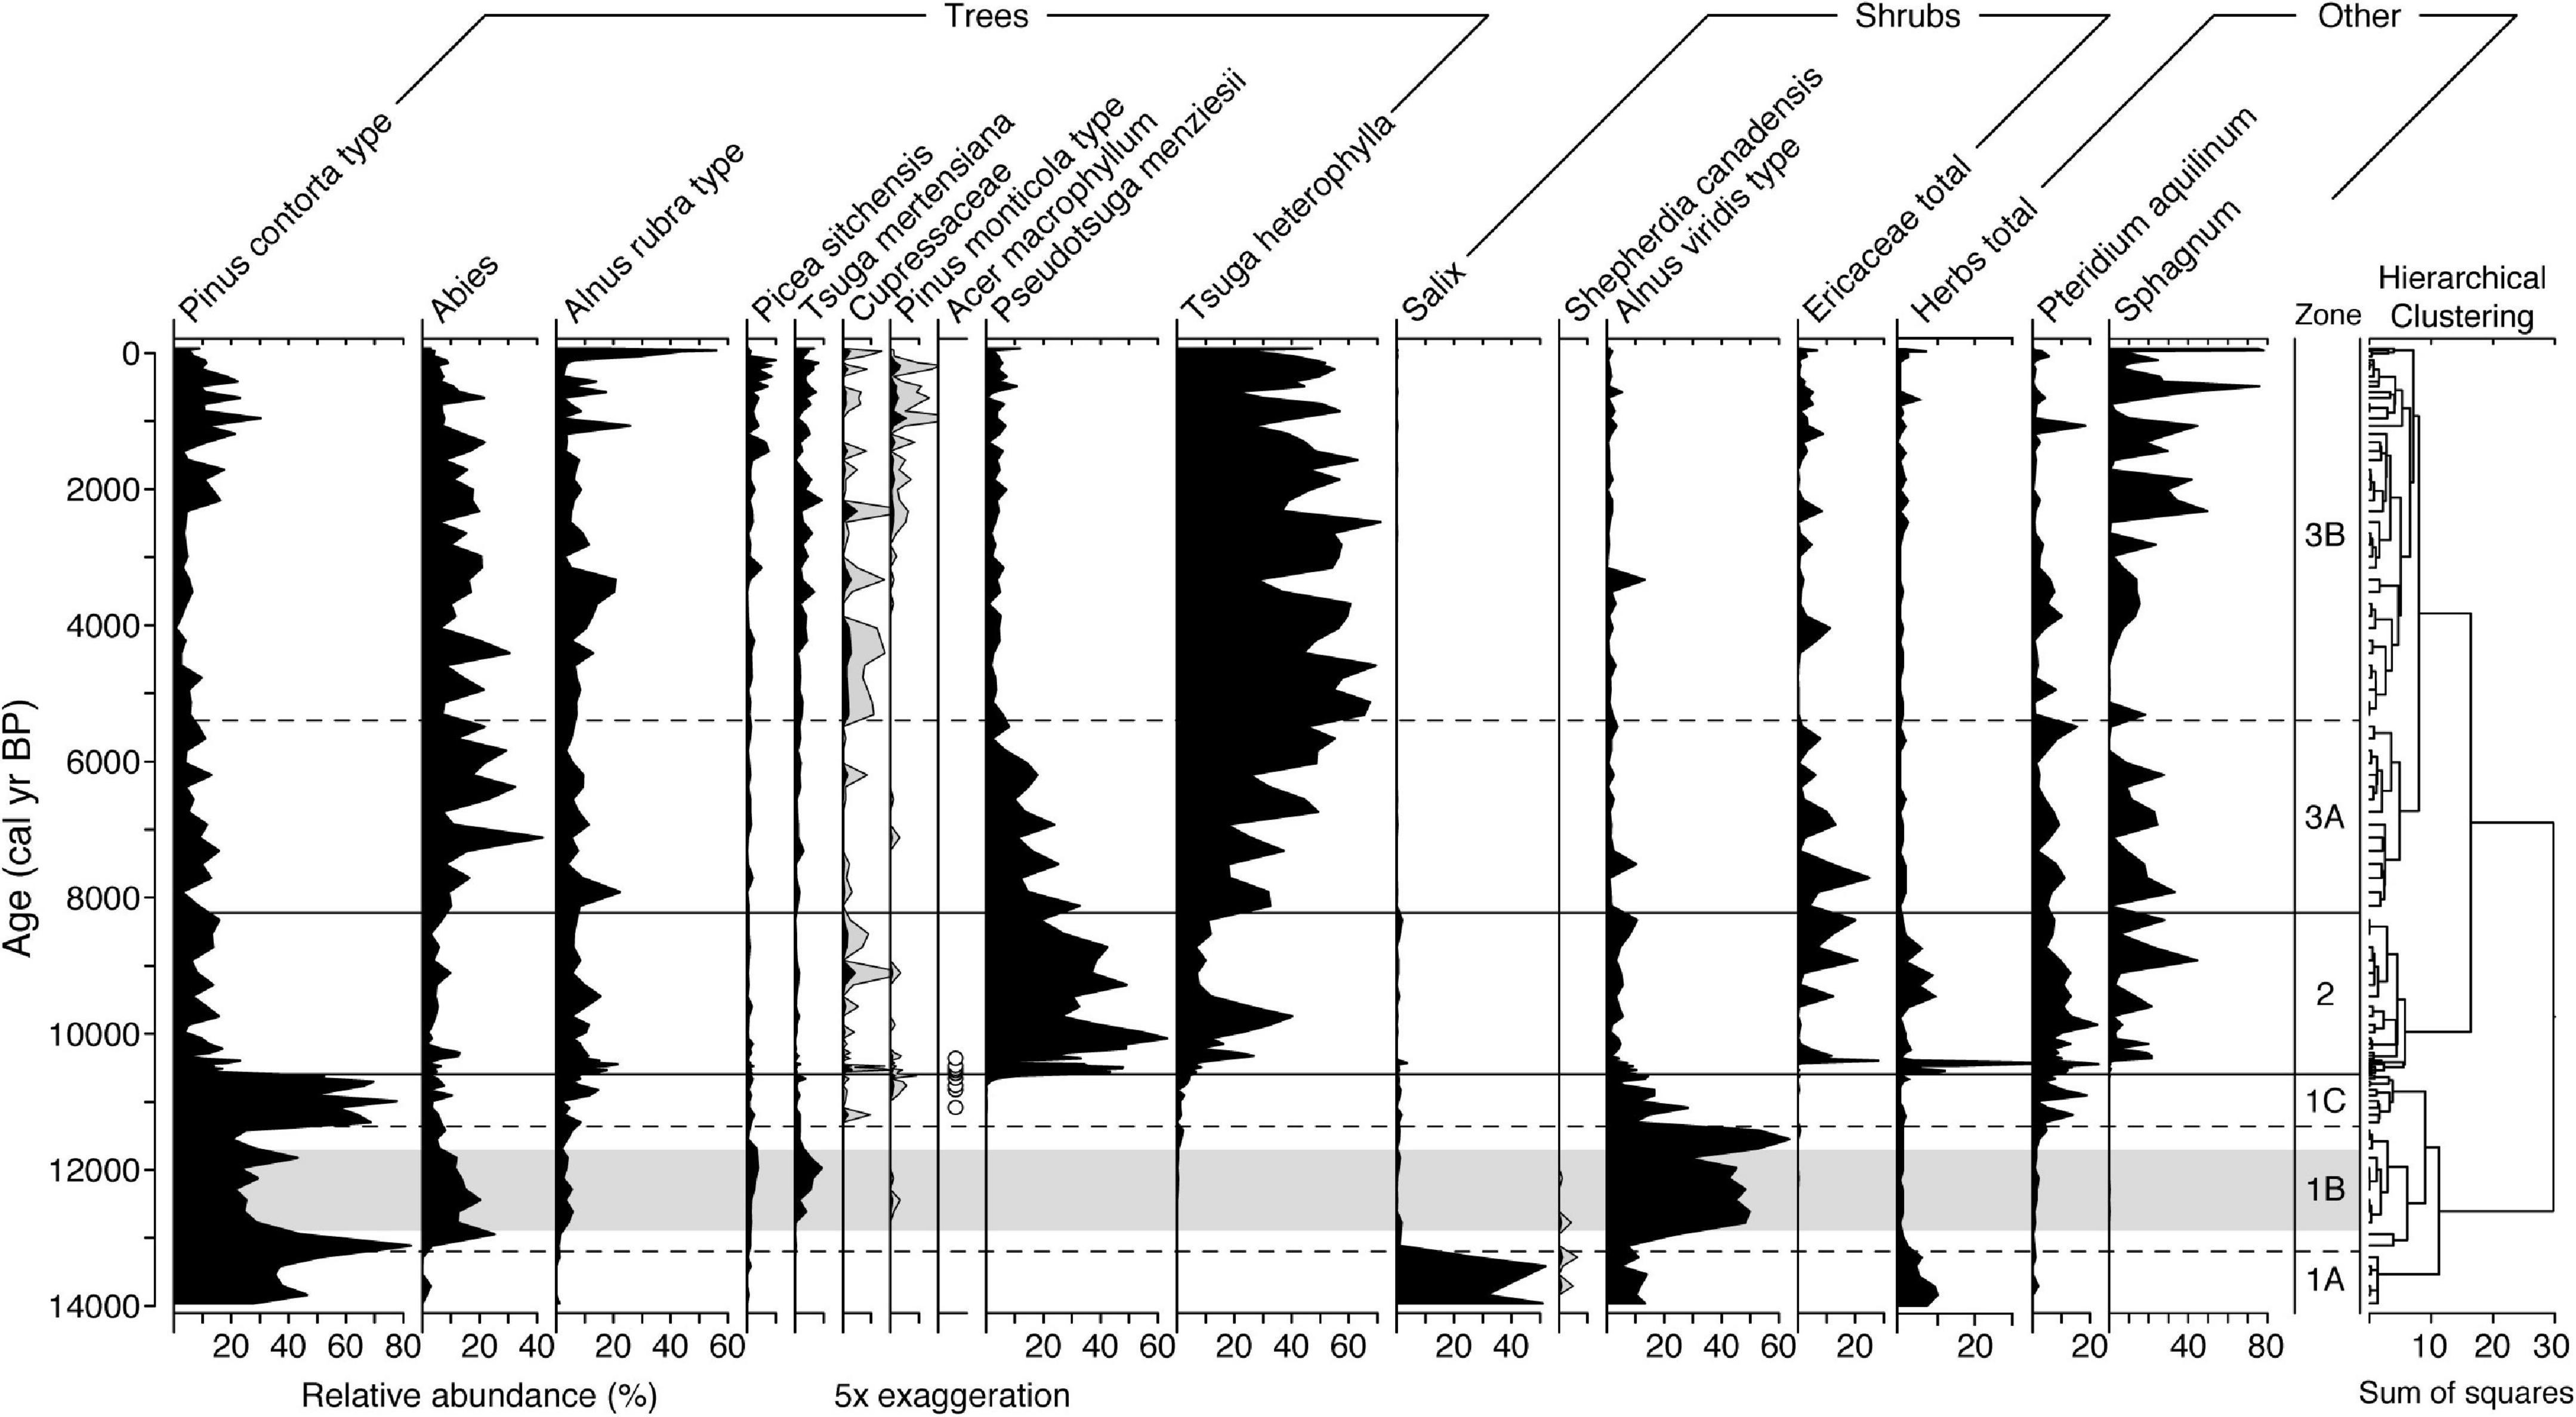
Figure 3. Pollen and spore percentages of major taxa at Anderson Fen. Infrequent taxa are shown with 5× exaggeration (gray silhouettes). Presence of rare Acer macrophyllum pollen is shown as open circles. Total herbs consists mostly of Cyperaceae pollen. Taxon order in the three groups is based on weighted averages. Gray horizontal band marks the Younger Dryas chronozone.
Pollen Zone 1A (14,025–13,200 yr BP) corresponds with clay at the base of the core. This pollen zone is dominated by Salix and Pinus contorta, with each accounting for 30–50% of the total sum (Figure 3). Alnus viridis reaches up to ∼10% and low levels (< 5%) of Abies and Shepherdia canadensis also occur. Pollen from herbaceous plants, mostly Cyperaceae and Artemisia, account for up to 10%. Pinus contorta accounts for 80% at the beginning of Zone 1B (13,200–11,360 yr BP), before decreasing to ∼30% as A. viridis increases to 40–60%. Other conifers in Zone 1B include Abies (10–20%), Tsuga mertensiana (up to 10%) and Picea sitchensis (up to 5%). Zone 1C is a 750-year interval (11,360–10,600 yr BP) of high P. contorta percentages (50–75%), with a corresponding decrease in most other taxa, except Pteridium aquilinum, which reaches up to ∼20%. Pinus concentrations are similar to Zone 1B (Supplementary Figure 3), which suggests that the high pine percentages of Zone 1C are a statistical artifact rather than an indication of increasing pine populations.
There is a large turnover of taxa at the beginning of Zone 2 (10,600–8,230 yr BP), with Pseudotsuga menziesii and Tsuga heterophylla accounting for up to 60 and 40%, respectively (Figure 3). Alnus rubra ranges between 10 and 20% and P. aquilinum accounts for up to ∼20%. Increases in Ericaceae, Cyperaceae and Sphagnum at ∼10,400 yr BP correspond with terrestrialization of the lake basin to a Sphagnum-dominated peatland (Lacourse et al., 2019a).
Zone 3A (8,230–5,400 yr BP) is characterized by the decreasing relative abundance of P. menziesii (30–5%) and increasing abundances of T. heterophylla (25–50%) and Abies (10–30%). A large increase in T. heterophylla pollen concentrations suggests it was more abundant on the landscape after 8,000 yr BP (Supplementary Figure 3). Pinus contorta, A. rubra and Pteridium account for up to 10%. Zone 3B (< 5,400 yr BP) is dominated by T. heterophylla (∼40–60%) with 10–20% Abies, ∼10% A. rubra and ∼5% T. mertensiana. Pinus contorta shows a notable increase to ∼20% over the last 2,200 cal yr coincident with minor increases in Pinus monticola and Picea sitchensis. Alnus rubra increases to 56% of the total pollen sum over the last 100 years.
Axes 1 and 2 of the PCA explain 47.5 and 19.9% of the total variation, respectively, that is present in the pollen record from Anderson Fen. PC axis 1 separates taxa abundant in the late Pleistocene such as Pinus contorta, Alnus viridis, Salix and Athyrium, which have positive loadings, from most other taxa, including most notably Tsuga heterophylla (Figure 4). PC axis 2 effectively separates Holocene assemblages: Pseudotsuga menziesii and Pteridium aquilinum, which are most abundant during the early Holocene, have positive loadings, and mid- and late Holocene Tsuga heterophylla-dominated assemblages generally have negative loadings. The ordination of pollen samples (Figure 4) corresponds closely with pollen zones identified independently through optimal splitting (Figure 3). In general, late Pleistocene and late Holocene samples are more tightly clustered, which reflects higher compositional similarity of pollen assemblages at these times relative to the early Holocene, when assemblages are more diverse.
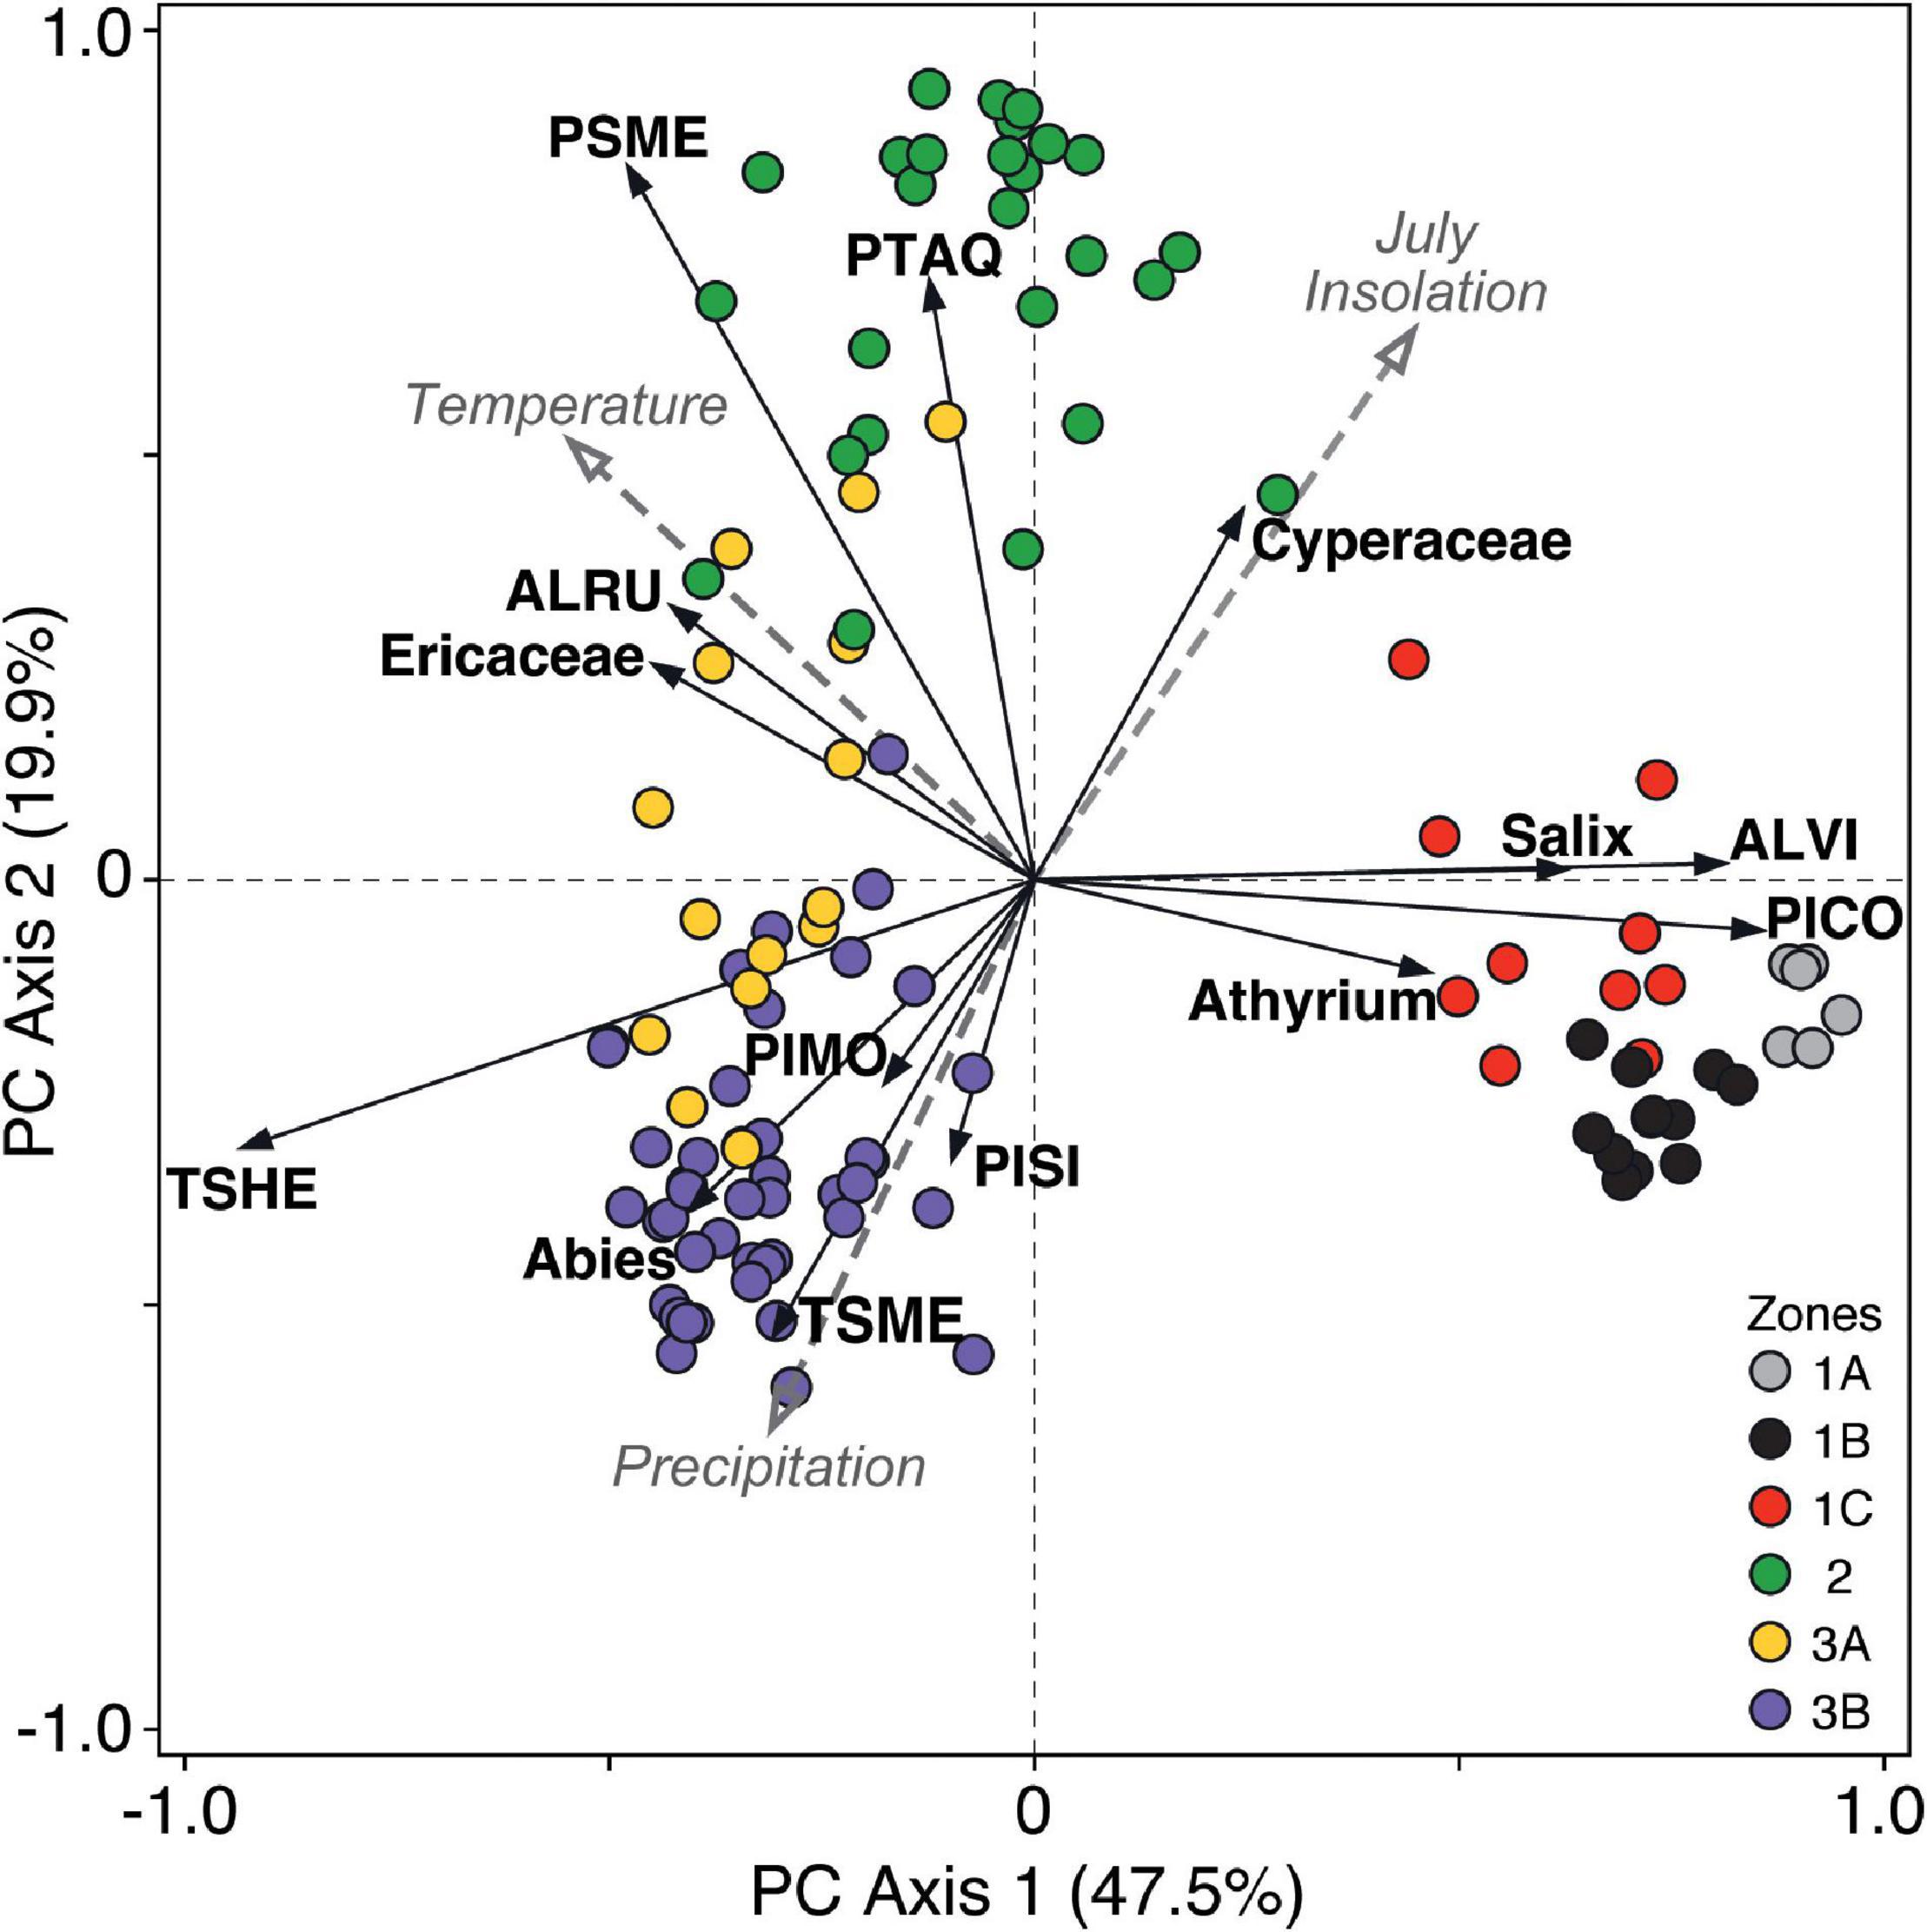
Figure 4. Principal component analysis biplot of pollen taxa loadings and sample scores from Anderson Fen. Samples are color-coded by the pollen assemblage zones identified by optimal splitting in Figure 3. Taxa are labeled by family, genus, or using the first two letters of the genus and specific epithets (ALRU, Alnus rubra; ALVI, Alnus viridis; PICO, Pinus contorta; PIMO, Pinus monticola; PISI, Picea sitchensis; PSME, Pseudotsuga menziesii; PTAQ, Pteridium aquilinum; TSHE, Tsuga heterophylla; TSME, Tsuga mertensiana). Paleoenvironmental variables (gray dashed arrows) used in redundancy analysis are plotted passively in the PCA ordination space (Temperature = sea-surface temperatures; Precipitation = mean annual precipitation; July Insolation = July insolation at 50°N).
Redundancy analysis revealed that the paleoenvironmental variables explain a significant amount of variation (43.6%, p < 0.0001) in the pollen data. Temperature and summer insolation are correlated strongly with axes 1 and 2, whereas precipitation shows a stronger correlation with axis 2 (Figure 4). Late Pleistocene samples dominated by P. contorta, A. viridis and Salix are associated primarily with low temperatures. Early Holocene Pseudotsuga-dominated assemblages are associated with relatively high temperature and summer insolation, and relatively low precipitation. Late Holocene samples dominated by T. heterophylla and Abies are associated primarily with high precipitation. These relationships suggest that PC axis 1 represents a gradient in temperature, whereas PC axis 2 represents variation in precipitation and summer insolation, which are negatively correlated (r = −0.62, p < 0.01).
The multivariate time series plots reveal clear differences in temporal changes in woody plant taxa along the elevational transect of sites (Figure 5 and Supplementary Figure 4). At low and middle elevations, forest composition changes from being dominated by P. contorta in the late Pleistocene, to P. menziesii in the early Holocene, and to T. heterophylla and A. rubra in the mid-late Holocene. At high elevations, plant communities are dominated by P. contorta, Abies and Alnus viridis before ∼8,000 yr BP, followed by T. mertensiana and Abies in the mid-late Holocene. The high-elevation record from Burman Pond provides macrofossil evidence that the Abies time series is composed of both A. lasiocarpa and A. amabilis (Figure 5E; Mazzucchi, 2010). There is also a noticeable, though subtle increase in P. contorta across all elevations over the last 2,000 years (Figure 5A). The boxplots associated with each time series shows that some taxa have been largely confined to low and middle elevations (e.g., P. menziesii, A. rubra) or to high elevations (T. mertensiana) for the duration of the records (Figure 5 and Supplementary Figure 4). Other taxa such as P. contorta, T. heterophylla and Abies have occurred at a wider range of elevations.
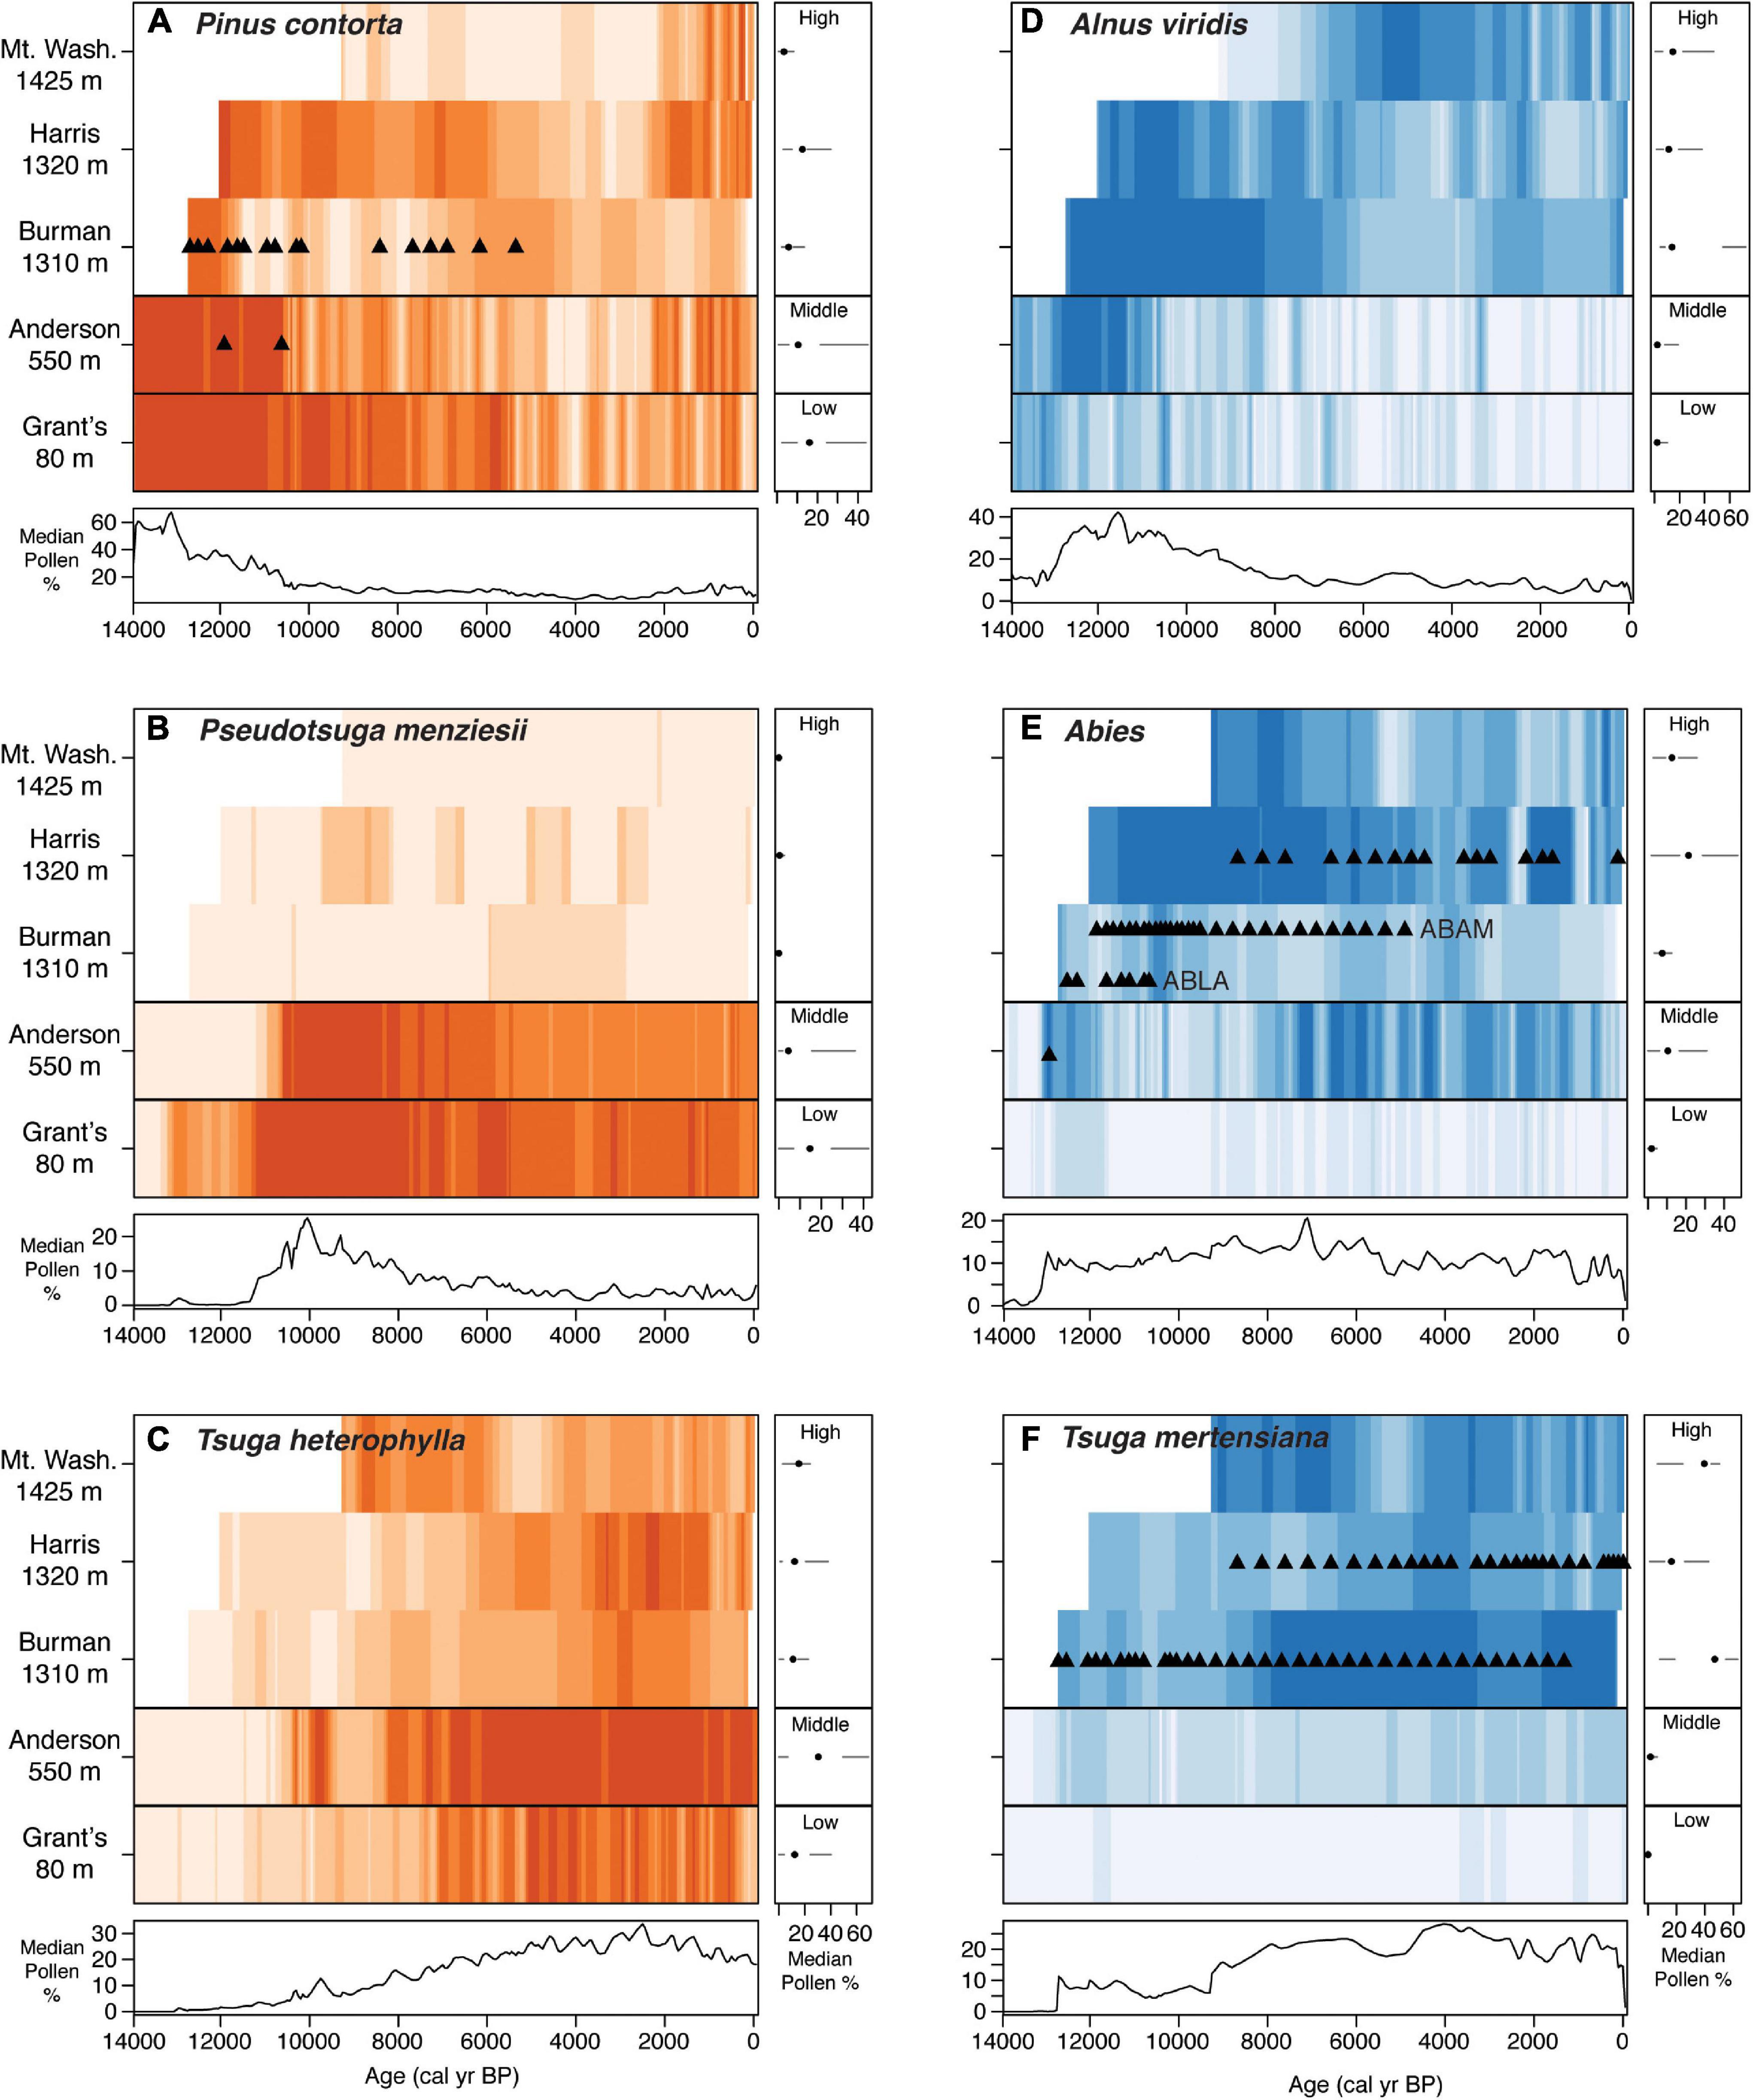
Figure 5. Multivariate time series plots of pollen percentage data for taxa common at low and middle elevations in orange (A–C) and high elevations in blue (D–F). Black horizontal lines separate the three high elevation sites at the top of each figure from Anderson Fen at mid-elevation and Grant’s Bog at low elevation. Darker colors indicate higher percentages. Colors are comparable across series within taxa, but not among taxa. In each, panels to the right show boxplots of the time series for each site. Bottom panels show the median percentage through time for all sites combined. In (D), Alnus pollen was not differentiated at Harris Ridge Bog; the percentages in that case are total Alnus pollen, likely dominated by Alnus viridis. Plant macrofossils confirming local presence are shown as triangles. ABAM, Abies amabilis; ABLA, Abies lasiocarpa.
RLQ and fourth-corner analyses were used to assess the roles of paleoenvironmental change and species traits in directing changes in forest composition as recorded in the pollen percentages. RLQ axes 1 (94.2) and 2 (5.5%) explained almost all the covariance (i.e., cross matrix) between the paleoenvironmental variables and species traits (Figure 6). Permutation testing indicates a significant relationship between paleoenvironmental variables and species traits (p < 0.0001), although the correlation with the pollen matrix for both axes is low (0.204 and 0.122). The variance of the paleoenvironmental scores is captured effectively on the first two RLQ axes (99%), as is the variance in species traits (79%). Paleotemperature has the largest contribution to total inertia (43%), followed by insolation (34%), which provides a proxy for seasonality in temperature and therefore growing season length. Among species traits, shade tolerance, maturity (i.e., minimum seed-bearing age), relative growth rate and waterlogging tolerance contribute most to total inertia (14, 14, 12, and 12%, respectively). We focus on RLQ axis 1 as it explains 94.2% of the co-variance of the three tables. RLQ axis 1 is correlated most strongly with paleotemperature (Figure 6A) and traits such as relative growth rate, waterlogging tolerance and frost tolerance in the positive direction and traits such as shade tolerance, maturity and height in the negative direction (Figure 6B). This axis separates “cool” late-glacial pollen assemblages with abundant P. contorta and A. viridis with positive loadings from “warm” late Holocene assemblages with abundant T. heterophylla and T. mertensiana with negative loadings (Figures 6C,D). Early Holocene assemblages with abundant P. menziesii plot along RLQ axis 2 in association with warm temperatures, high seasonality (represented by insolation), and low precipitation, and traits such as adaptation to fire and large seeds.
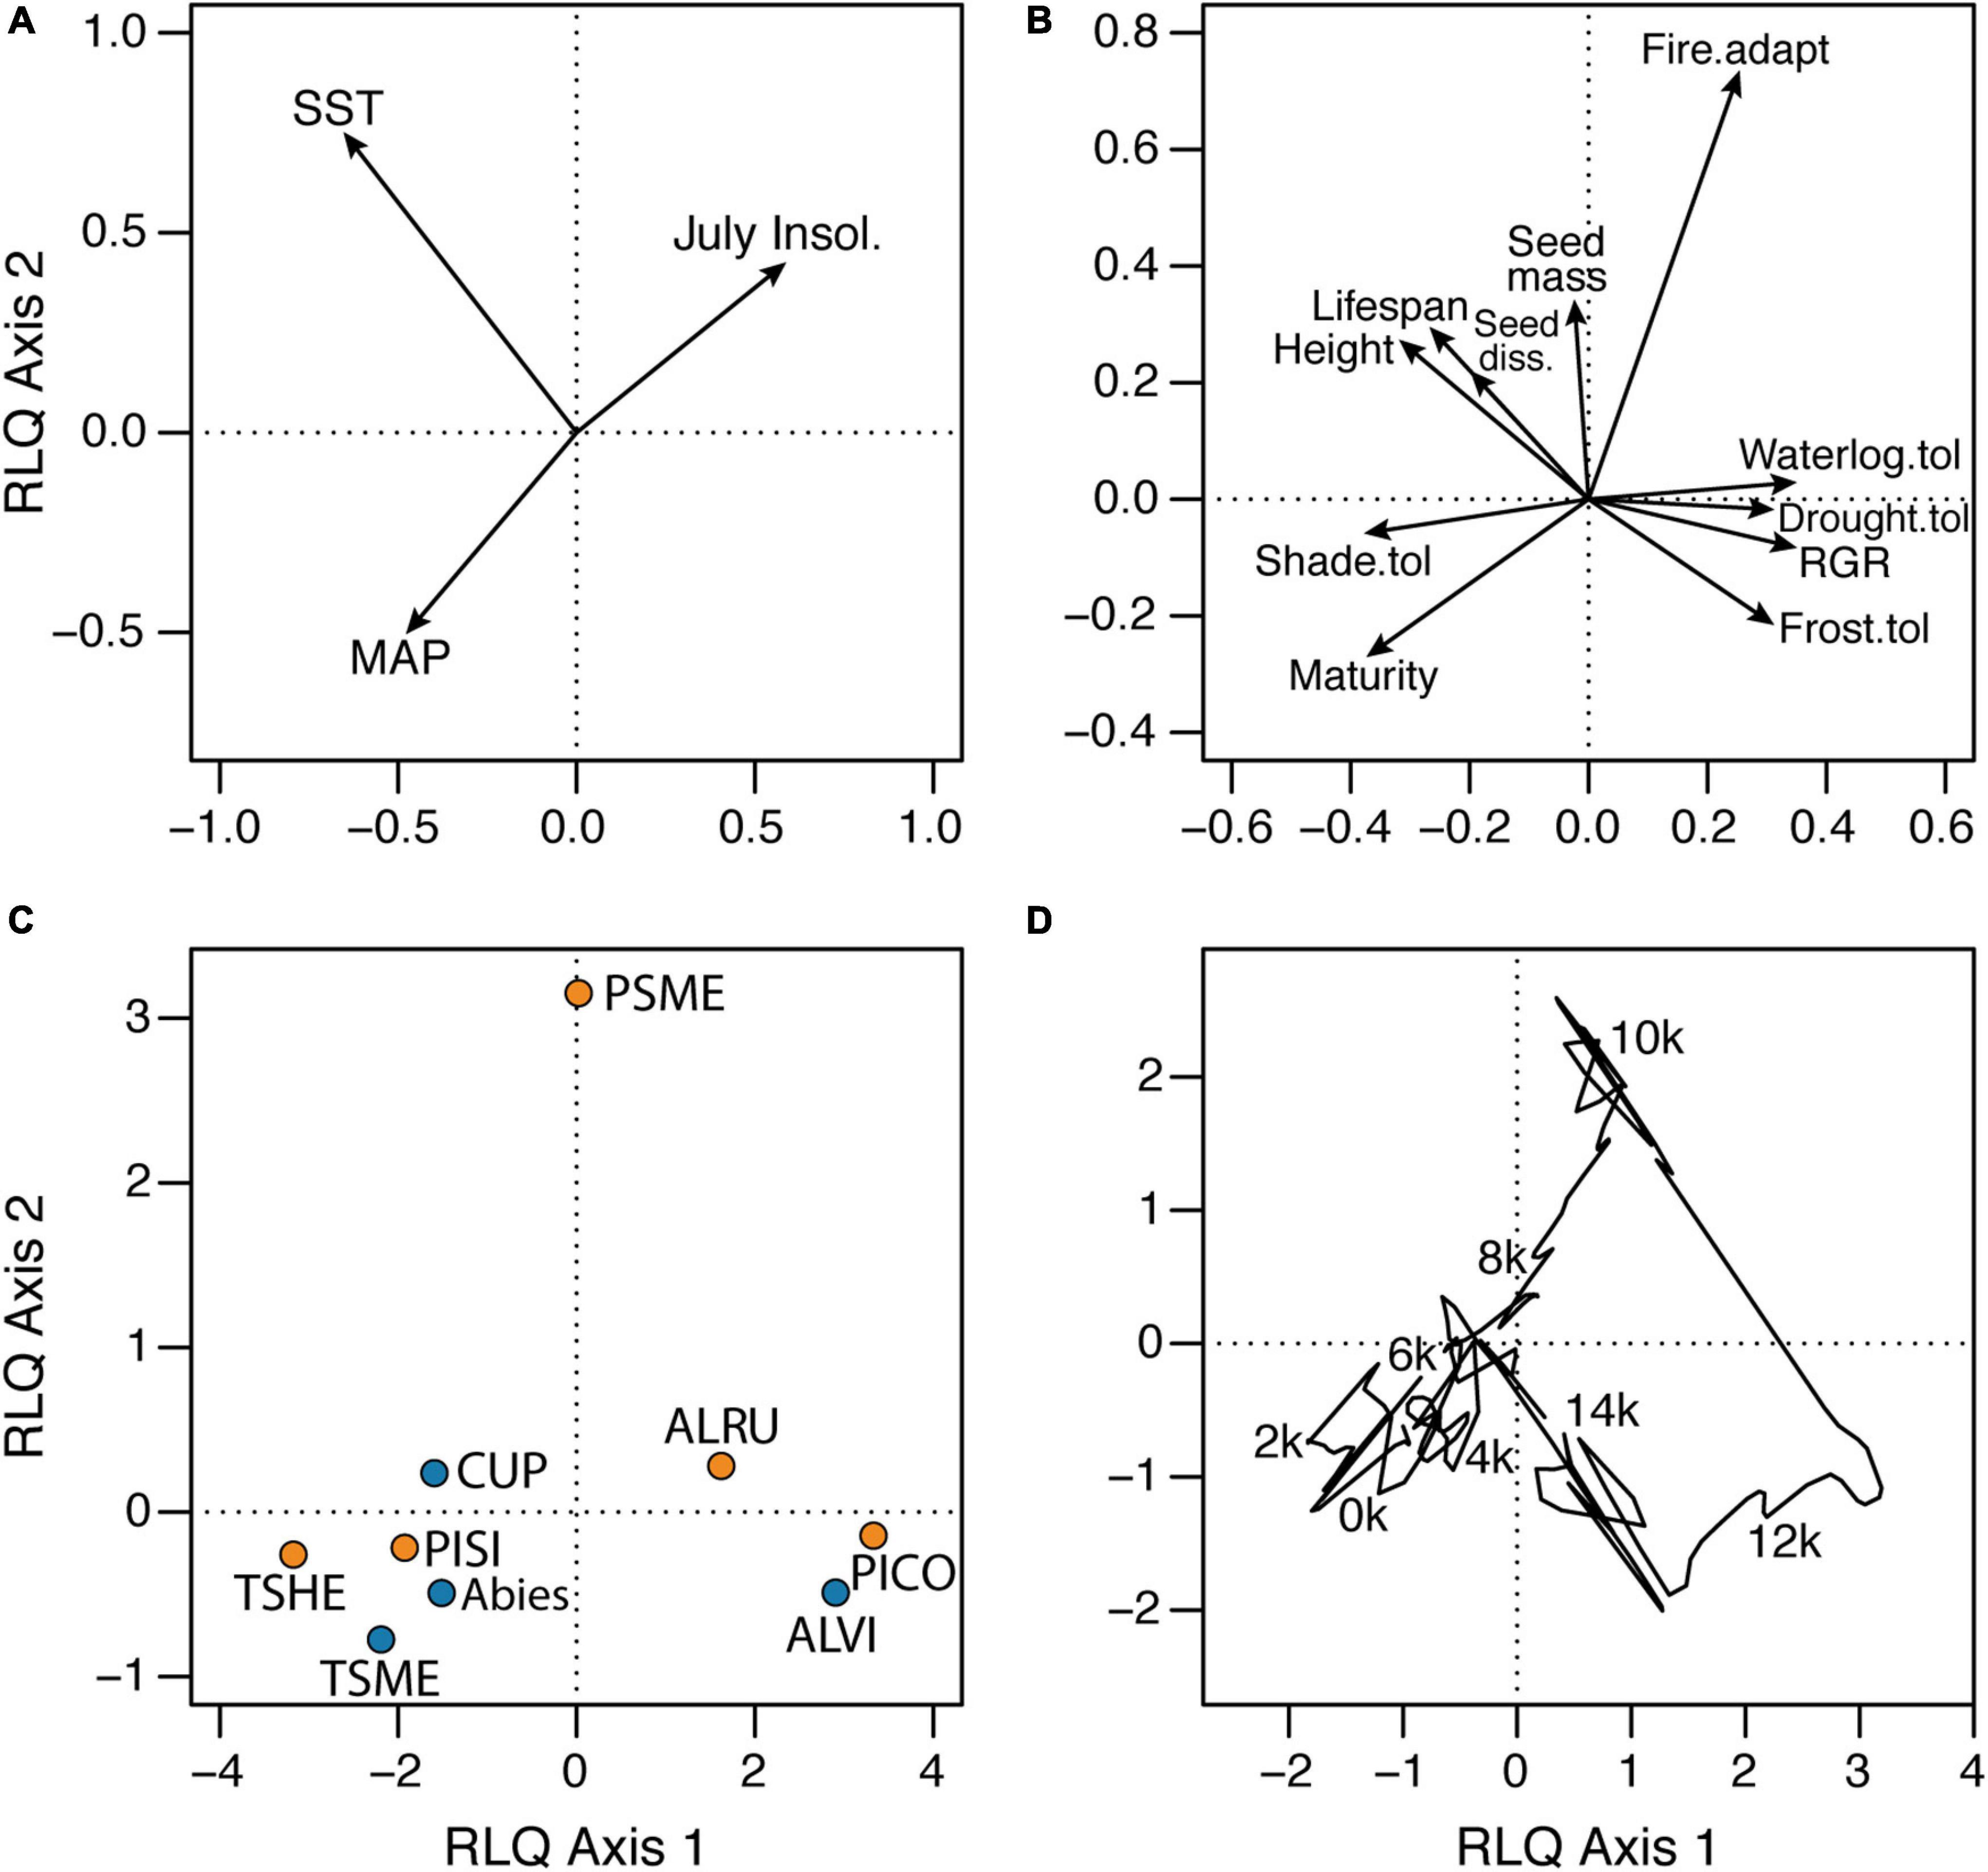
Figure 6. RLQ ordination of (A) paleoenvironmental variables, (B) species traits, (C) species and (D) samples for the elevational transect of sites on central Vancouver Island. RLQ axes 1 and 2 explained 94.2 and 5.5%, respectively, of the covariance between the paleoenvironmental variables and species traits. See Figure 4 caption for taxon abbreviations in (C). In (D), sample scores are joined in stratigraphic order to show the trajectory of assemblages, with labels for every 2,000 years (e.g., 2 k = 2,000 cal yr BP). SST = sea surface temperatures; MAP = mean annual precipitation; RGR = relative growth rate; Seed diss. = seed dissemination capacity.
Fourth-corner analysis identified significant correlations between almost all pair-wise comparisons of paleoenvironmental variables and species traits (Table 2). However, all environment-trait correlations were weak i.e., r < 0.2. These weak but significant correlations highlight that interspecific differences in a suite of traits are important in regulating long-term forest community assembly. The strongest positive correlations occurred between paleotemperature and typical adult height, shade tolerance, and lifespan. The strongest negative correlations occurred between temperature and relative growth rate and frost tolerance, and between summer insolation and maturity. Temperature was the only environmental variable with a significant correlation to seed mass.
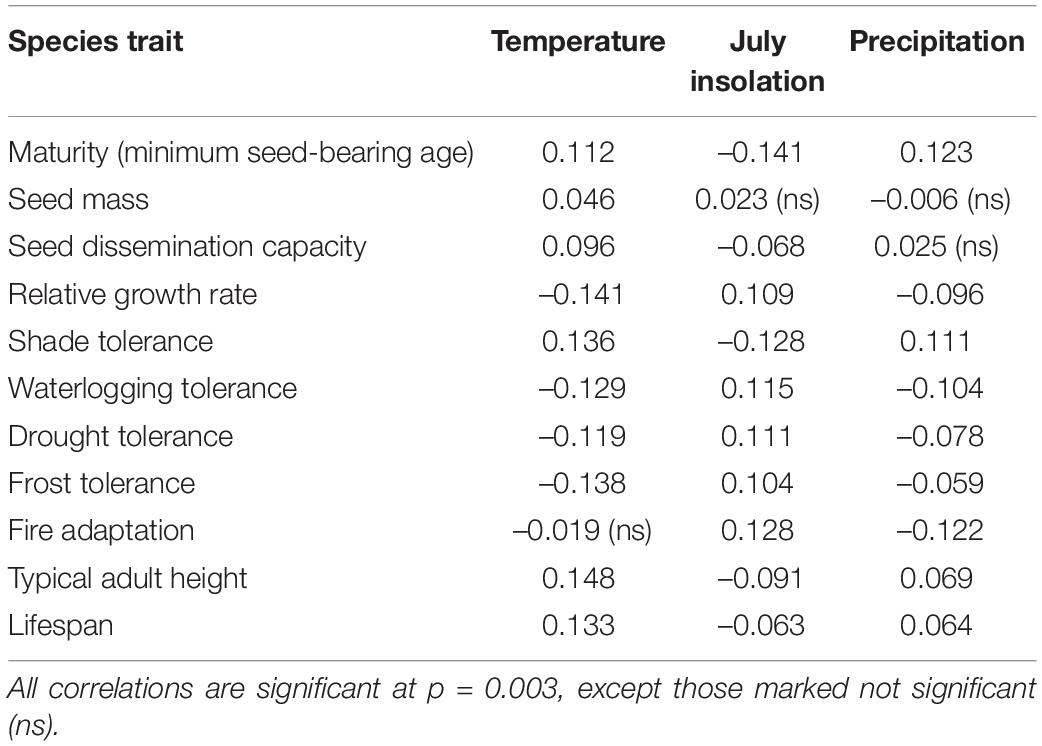
Table 2. Correlations (r) between paleoenvironmental variables and species traits from fourth-corner analysis.
The pollen record from Anderson Fen (Figure 3) is similar to records from both lower and higher elevations on Vancouver Island, both in the immediate vicinity (Figure 5) and further afield (Brown and Hebda, 2003; Lacourse, 2005; Lacourse and Davies, 2015), revealing an ecotonal sequence of changing forest compositions as one would expect. Forests between 14,000 and 10,600 yr BP were dominated by P. contorta with local presence confirmed by needles at 11,920 and 10,670 yr BP. Abundant shrubs during this pine-dominated interval include A. viridis, and Salix and the insect-pollinated Shepherdia canadensis before 13,000 yr BP. These early forests occurred under cool climatic conditions (Figure 4). Several other conifers (Abies, T. mertensiana, P. sitchensis) increase in abundance during the particularly cool Younger Dryas chronozone (12,900–11,700 yr BP). Tsuga mertensiana is a well-established marker of the Younger Dryas cooling on the Northeast Pacific Coast (Mathewes, 1993; Lacourse, 2009; Gavin and Brubaker, 2015).
Forest composition near Anderson Fen changes rapidly at ∼10,600 yr BP with the establishment of P. menziesii and T. heterophylla forests (Figure 3). The transition from pine-dominated forests is also accompanied by increases in Cupressaceae, although it is not clear whether this is T. plicata and/or Chamaecyparis nootkatensis, due to the inability to differentiate their pollen. Acer macrophyllum, a low to mid-elevation species that is regularly found in association with P. menziesii on southeastern Vancouver Island, is usually poorly represented in fossil pollen records because it is mostly insect-pollinated, but it is also locally present during the transition (11,100–10,300 yr BP). The transition to P. menziesii forests was facilitated by increased temperature and seasonality and decreased precipitation (Figure 4). More frequent wildfires in the early Holocene would have also favored P. menziesii (Gavin and Brubaker, 2015). Over the remainder of the Holocene as precipitation increased, forests became increasingly dominated by T. heterophylla and Abies with the abundance of P. menziesii decreasing especially after 5,400 yr BP, although it continued to be present, as even low levels of its pollen indicate local presence (Heusser, 1985). The last 2,200 years is marked by increases in P. contorta and Pinus monticola, both of which are present in low abundance at Anderson Fen today. The large increase in Alnus rubra pollen percentages over the last 100 years (Figures 3, 7) primarily reflects disturbance in the region due to widespread logging.
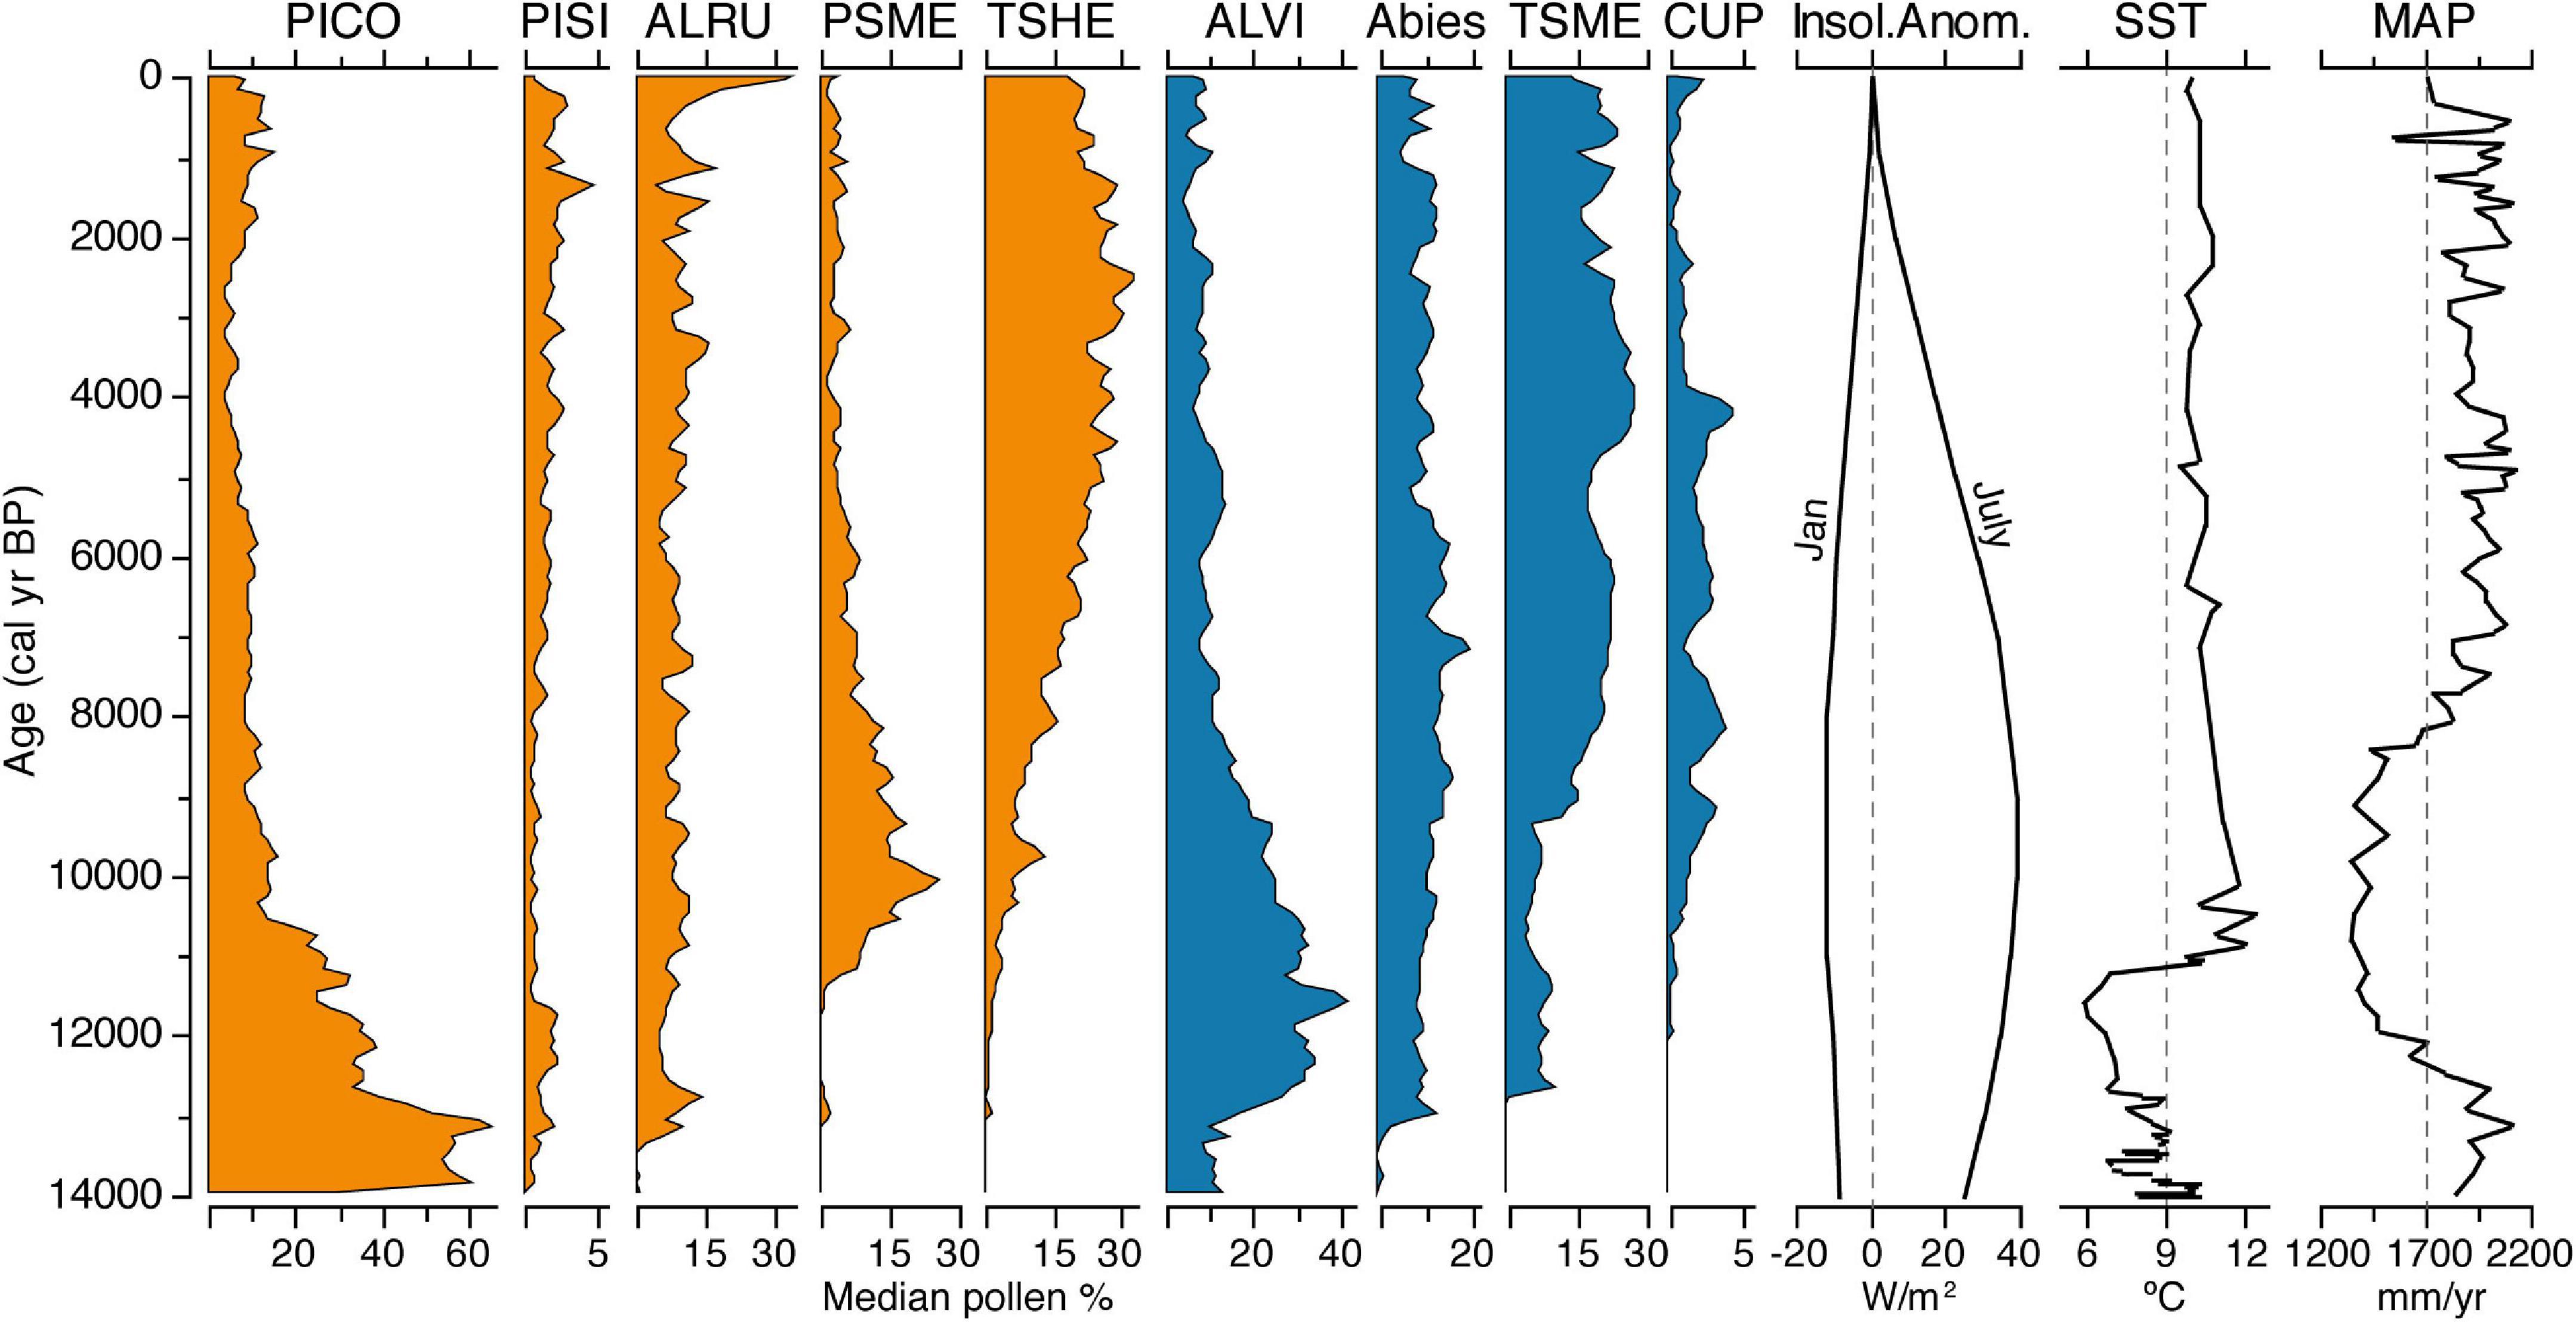
Figure 7. Median pollen percentages over the last 14,000 years from the elevational transect of sites on central Vancouver Island. Taxa in orange and blue were most abundant at low-medium and high elevations, respectively. Note changes in scale on the x-axes. See Figure 4 caption for taxon abbreviations. Also shown are January and July insolation anomalies at 50°N (Berger and Loutre, 1991), alkenone-inferred sea surface temperatures (SST) from near Vancouver Is. at 49°N (Kienast and McKay, 2001), and pollen-inferred mean annual precipitation (MAP) for coastal BC (Heusser et al., 1985).
There are few other mid-elevation paleoecological records in the region to compare to Anderson Fen. The record from Rhamnus Lake (Allen, 1995), which sits at 320 m elevation approximately 160 km southeast, is notably similar to Anderson Fen. Forests there transition from being dominated by Pinus 14,000–12,000 yr BP, to P. menziesii in the early Holocene, and then co-dominated by P. menziesii and T. heterophylla forests by 7,000 yr BP. Mid-elevation pollen records from sites on the adjacent mainland of British Columbia (Mathewes, 1973) show a similar sequence of changing forest composition, although P. menziesii is less common and T. plicata plays an important secondary role in mid-late Holocene forests, reflecting the overall wetter climate of that area. Further south on the Olympic Peninsula in Washington, United States, pollen and plant macrofossil records from Yahoo Lake at 710 m (Gavin et al., 2013) are also similar, reflecting the overarching control that macroscale climate plays in driving changes in forest composition. Differences of note relative to coastal BC are the prominent roles of P. sitchensis in late-glacial forests and A. rubra in early Holocene forests as well as earlier expansion of T. heterophylla by a few thousand years.
Comparison of changes in forest composition along the elevation gradient shows clear sorting of woody plant species through time and by elevation (Figure 5 and Supplementary Figure 4). It is also clear that temporal changes in climatic conditions interact significantly with life-history and stress tolerance traits to direct long-term patterns in forest community assembly (Figures 6, 7). Species with similar functional traits tend to be most abundant at similar times, whereas species that are functionally dissimilar are separated in time (Lavorel and Garnier, 2002; Swenson et al., 2011). Below, we focus on woody plant taxa that are well-represented by pollen records on central Vancouver Island to describe elevational sorting of species through time and the role species traits in changing forest composition.
Pinus contorta is most abundant at low to mid-elevations, especially during the relatively cold interval 14,000–10,000 yr BP (Figures 5–7). This is consistent with numerous studies along the northwest coast of North America that have documented the expansion of P. contorta populations following deglaciation with its presence on the North Pacific coast predating the records from central Vancouver Island (e.g., Heusser, 1960; Lacourse, 2009; Gavin and Brubaker, 2015). The life history and stress tolerance traits of P. contorta allowed this species to be among the first conifers to establish widespread presence and continue to facilitate its establishment on disturbed, rocky and waterlogged sites today. Relative to other trees, it has a “fast” life history (Charnov, 1993; Franco and Silvertown, 1996): early sexual maturity, high relative growth rate, low shade tolerance, and short life span (Supplementary Table 2). It has wide ecological amplitude and high tolerance to waterlogging, drought and frost, relative to other trees in this region, and as a result, it often occurs in habitats that are unfavorable to potential competitors. For example, P. contorta is often present in a stunted form in ombrotrophic bogs on the North Pacific coast, where high water tables preclude the establishment of other trees. There is an increase in P. contorta over the last 2,000 years across elevations on central Vancouver Island (Figure 5A) as well as at several other paleoecological sites in the wider region (e.g., Heusser, 1960; Cwynar, 1987; Lacourse, 2009; Lacourse and Davies, 2015). This region-wide increase in P. contorta is likely linked to the late-Holocene expansion of peatlands that support shrubby P. contorta var. contorta. With future changes in climate, P. contorta is likely to continue to expand on disturbed, xeric and waterlogged sites and to benefit from increased wildfire, although at regional scales its overall abundance may change little in the decades ahead due to losses in some areas and gains in others (Hamann and Wang, 2006; MacKenzie and Mahony, 2021).
Pseudotsuga menziesii is also most abundant at low to mid-elevations on central Vancouver Island, reaching its maximum abundance after P. contorta, between 11,000 and 8,000 yr BP. Previous studies have documented the northward migration of P. menziesii from the south (e.g., Heusser, 1960; Lacourse, 2009; Gavin and Brubaker, 2015). Pseudotsuga arrived first at low elevations and migrated upslope in the early Holocene as temperature and seasonality increased and precipitation decreased (Figures 5B, 7). More frequent fire in the early Holocene would have favored fire-resistant P. menziesii over most other conifers (Brown and Hebda, 2002; Gavin and Brubaker, 2015; Halofsky et al., 2018). Pseudotsuga then decreased in abundance at mid-elevations to become most abundant at low elevations, as it is today especially to the south in drier, rainshadow forests on southern Vancouver Island and in Washington state. In combination, these studies demonstrate both northward and upslope migration of P. menziesii in response to early Holocene warming, followed by contraction as temperatures cooled after 6,000 yr BP. In the RLQ analysis, P. menziesii plots away from all other species in association with traits such as adaptation to fire, high seed mass and dispersal capacity, large height, and long lifespans as well as early Holocene climatic conditions of relatively high temperatures, low precipitation, and lengthened growing seasons as reflect by high insolation seasonality (Figures 6, 7). This combination of traits gives P. menziesii a competitive advantage in dispersal, establishment and persistence (Weiher et al., 1999; Leishman, 2001). Given responses of P. menziesii to past climate change, northward and upslope range expansion is likely given projected future warming and increases in wildfires. Bioclimate-envelope and process-based models similarly predict that changes in climate and increased wildfires will expand coastal P. menziesii northward and upslope with a net increase in abundance and area occupied (Hamann and Wang, 2006; Gray and Hamann, 2013; Halofsky et al., 2018; MacKenzie and Mahony, 2021).
There are two common species of hemlock in temperate rainforests on the North Pacific coast and their long-term paleoecological histories on central Vancouver Island are similar. Both Tsuga species are most abundant after ∼8,000 yr BP, with increasing abundance since then at most sites; however, T. heterophylla has occurred primarily at low and mid-elevations and T. mertensiana is almost exclusively confined to high elevation forests (Figures 5C,F). The expansion of hemlocks over the mid-late Holocene was facilitated by higher precipitation over this interval (Figure 7). This similar paleoecological history is reflected in the RLQ analysis with both hemlocks plotting close to each other in the ordination space (Figure 6C), close to mean annual precipitation (Figure 6A) and with similar life history and stress tolerance traits (Figure 6B). For example, both hemlocks reach sexual maturity at about 20 year, and have the same or similar seed mass, dispersal capacity, relative growth rate, lifespan, and tolerance to shade, drought and waterlogging (Supplementary Table 2). Relative to P. contorta, both species are characterized by a “slow” life history. However, T. mertensiana has substantially higher frost tolerance, which accounts for its abundance at high elevations where temperatures are cooler, snow cover persists longer, and growing seasons are shorter. This also helps explain its presence in low and mid-elevation forests during the cool late-glacial period (Figures 3, 7; Mathewes, 1993; Gavin and Brubaker, 2015). Climate models predict increases in year-round temperatures and winter precipitation for much of Pacific Canada (Wang et al., 2016) that are likely to facilitate expansion of T. heterophylla northward and to higher elevations in response (Hamann and Wang, 2006; Gray and Hamann, 2013; Halofsky et al., 2018; MacKenzie and Mahony, 2021). For T. mertensiana, increases in temperature are likely to override any benefit of increased available moisture and potentially lead to contraction of its overall range. Indeed, Hamann and Wang (2006) and MacKenzie and Mahony (2021) note that T. mertensiana forests are particularly vulnerable to ongoing changes in climate. Northward and upslope shifts for the species are expected to be accompanied by substantial decreases in total area occupied, especially on Vancouver Island where T. mertensiana forests could be eliminated altogether within the next 50 years (Hamann and Wang, 2006; MacKenzie and Mahony, 2021).
The two deciduous nitrogen-fixing species, A. viridis and A. rubra, are also generally sorted by elevation through time. Alnus viridis occurs mostly at mid- to high elevations, reaching its highest abundance during the cool late-glacial period in association with P. contorta, and then moving upslope to occupy higher elevations almost exclusively for much of the last 10,000 years (Figures 5D, 7). In contrast, A. rubra has been an almost exclusively low-elevation species that increases in abundance over the Holocene (Supplementary Figure 4), along with species such as T. heterophylla and increases in available moisture (Figure 7). Both species of alder are characterized by a relatively “fast” life history and have similar shade, drought and waterlogging tolerances (Figure 5 and Supplementary Table 2). However, as with the two species of hemlock, they differ most notably in their tolerance of frost with the higher frost tolerance of A. viridis explaining its abundance at higher elevations. Based on their paleoecological histories and stress tolerance traits, A. viridis is likely to decrease in frequency on the North Pacific coast, whereas A. rubra is likely to increase. Bioclimate-envelope models support these inferences (Hamann and Wang, 2006; MacKenzie and Mahony, 2021). Increased disturbance from wildfire and human activities such as logging is likely to continue to benefit Alnus rubra in particular, as it readily invades open sites with bare soil.
Abies is most abundant at middle and high elevations but is more variable through time than other taxa (Figure 5). This variability is undoubtedly linked to the current inability to identify Abies pollen to species. On the North Pacific coast, Abies pollen derives from up to three different species, making it difficult to untangle their paleoecological histories. Abies amabilis is most common today at middle elevations, A. lasiocarpa is found in present-day high elevation forests, and A. grandis is present at low-middle elevations but is generally infrequent. Many paleoecological records in the region, including the Anderson Fen record (Figure 3), show an increase in Abies pollen in the cool late-glacial period between ∼13,000 and 12,000 yr BP, coincident with an increase in T. mertensiana. The late-glacial increase in Abies likely represents expansion of cool-adapted A. lasiocarpa (Heinrichs et al., 2002). In contrast, it is likely that expansion of A. amabilis populations occurred later, especially at mid-elevations (Gavin and Brubaker, 2015). The record from Burman Pond (Mazzucchi, 2010) provides macrofossil evidence for this species turnover at high elevations between 12,000 and 11,000 yr BP (Figure 5E). Changing pollen abundances at Anderson Fen (Figures 3, 5E) and Grant’s Bog (Lacourse et al., 2019b) suggest a similar turnover of species at lower elevations with Abies pollen in the late-glacial period likely deriving from A. lasiocarpa and Abies pollen after ∼8,000 yr BP likely deriving from A. amabilis. Abies has low loadings on both axes of the RLQ analysis (Figure 6C), which may be to some extent an artifact of being composed of two different species that are most abundant at different times. Overall, Abies is associated most strongly with high precipitation (Figure 6A), reflecting the overall preference of both Abies species for relatively high available moisture. Abies amabilis and A. lasiocarpa have similar life history and stress tolerance traits, although A. lasiocarpa has notably smaller seeds and higher frost tolerance (Supplementary Table 2). The latter explains its success in the late-glacial period and at high elevations, as is the case with T. mertensiana. Additional Abies macrofossil records or methods to differentiate Abies pollen to species are needed to resolve species dynamics of true firs throughout northwestern North America.
On a regional scale, forests on central Vancouver Island were dominated by P. contorta in the cool late-glacial interval, P. menziesii in the warm and dry early Holocene, and T. heterophylla and T. mertensiana in the warm and wet mid- to late Holocene. There is also evidence of elevational sorting of dominant woody taxa over the last 14,000 years. Some taxa have consistently occupied low and middle elevations (P. menziesii, A. rubra) or high elevations (T. mertensiana), whereas others (P. contorta, T. heterophylla) have occurred at a wider range of elevations. The modern elevational zonation of tree taxa was established by ∼6,000 yr BP, with contraction of P. menziesii at mid-elevations and expansion of T. heterophylla and T. mertensiana populations at middle and high elevations, respectively. Projected changes in climate and increases in wildfire are likely to bring a reversal of this turnover, with abundance increases and upslope and northward expansion of P. menziesii, at the expense of T. heterophylla and especially T. mertensiana at higher elevations. Pinus contorta is also likely to benefit from projected changes, given its wide ecological amplitude and adaptation to disturbance, at least initially and at fine spatial scales. In general, increases in both summer and winter temperature are likely to have a more prominent effect, as most taxa in the region already occur under a range of precipitation levels. Nonetheless, decreases in summer precipitation and lengthening of wildfire seasons are also likely to be key drivers of future changes in forest composition and structure.
Changing abundances of species through time on central Vancouver Island highlight their individualistic responses to environmental change (Williams et al., 2004). It is also the case that functionally similar species make comparable contributions to forest community assembly (Lavorel and Garnier, 2002; Swenson et al., 2011). In general, species with similar life history traits tend to be most abundant at similar times and species that are functionally dissimilar are separated in time. For example, on central Vancouver Island, species with “fast” life history strategies (e.g., P. contorta, A. viridis) are most abundant in late-glacial plant communities, while those with “slow” life history strategies (e.g., T. heterophylla, T. mertensiana) are generally most abundant in mid-late Holocene forests. Within those time periods, sorting by elevation appears governed most strongly by differences in ecological performance and stress tolerance traits. This highlights that not only are species sorted through time as environmental changes occur but that species traits are also sorted on long timescales (Lacourse, 2009; Reitalu et al., 2015; Brussel et al., 2018; Benito et al., 2020). Environmental change is the main driver of temporal turnover in forest composition, with this filtering acting on species traits to direct community assembly and dynamics (McGill et al., 2006).
The raw data supporting the conclusions of this article will be made available by the authors, without undue reservation.
TL designed the research. MA analyzed the Anderson Fen core. TL conducted data analysis and was the primary author of the text with contributions from MA. Both authors approved the final manuscript.
This research was supported by grants to TL from the Natural Sciences and Engineering Research Council of Canada (Grant No. 342003) and the Canada Foundation for Innovation (Grant No. 17214).
The authors declare that the research was conducted in the absence of any commercial or financial relationships that could be construed as a potential conflict of interest.
All claims expressed in this article are solely those of the authors and do not necessarily represent those of their affiliated organizations, or those of the publisher, the editors and the reviewers. Any product that may be evaluated in this article, or claim that may be made by its manufacturer, is not guaranteed or endorsed by the publisher.
We are grateful to D. Canil and K. Beer for field assistance, Beta Analytic for radiocarbon dating services and support, D. Mazzucchi for sharing data, and K. Gajewski for sharing R code. Many thanks to the two reviewers for their comments. Original data from Andersen Fen and Grant’s Bog are available from TL or the Neotoma database Paleoecology Database.
The Supplementary Material for this article can be found online at: https://www.frontiersin.org/articles/10.3389/fevo.2022.838545/full#supplementary-material
Abatzoglou, J. T., and Williams, A. P. (2016). Impact of anthropogenic climate change on wildfire across western US forests. Proc. Natl. Acad. Sci. U.S.A. 113, 11770–11775. doi: 10.1073/pnas.1607171113
Allen, G. B. (1995). Vegetation and Climate History of Southeast Vancouver Island, British Columbia. M. Sc. Thesis. Victoria, BC: University of Victoria.
Bassett, I. J., Crompton, C. W., and Parmelee, J. A. (1978). An Atlas of Airborne Pollen Grains and Common Fungus Spores of Canada. Research Branch, Agriculture Canada. Monograph No. 18. Ottawa, ON: Research Branch, Canada Dept. of Agriculture, 321.
Benito, B. M., Gil-Romera, G., and Birks, H. J. B. (2020). Ecological memory at millennial time-scales: the importance of data constraints, species longevity and niche features. Ecography 43, 1–10. doi: 10.1111/ecog.04772
Bennett, K. D. (1996). Determination of the number of zones in a biostratigraphical sequence. New Phytol. 132, 155–170. doi: 10.1111/j.1469-8137.1996.tb04521.x
Berger, A., and Loutre, M. F. (1991). Insolation values for the climate of the last 10 million of years. Quat. Sci. Rev. 10, 297–317. doi: 10.1016/0277-3791(91)90033-Q
Birks, H. J. B. (2020). Reflections on the use of ecological attributes and traits in Quaternary botany. Front. Ecol. Evol. 8:166. doi: 10.3389/fevo.2020.00166
Blaauw, M. (2010). Clam: Classical Age-Depth Modelling of Cores from Deposits. R Package Vers. 2.4.0.
Brown, K. J., and Hebda, R. J. (2002). Origin, development, and dynamics of coastal temperate conifer rainforests of southern Vancouver Island, Canada. Can. J. For. Res. 32, 353–372. doi: 10.1139/x01-197
Brown, K. J., and Hebda, R. J. (2003). Coastal rainforest connections disclosed through a late Quaternary vegetation, climate, and fire history investigation from the mountain hemlock zone, on southern Vancouver Island, British Columbia, Canada. Rev. Palaeobot. Palynol. 123, 247–269. doi: 10.1016/S0034-6667(02)00195-1
Brussel, T., Minckley, T. A., Brewer, S. C., and Long, C. J. (2018). Community-level functional interactions with fire track long-term structural development and fire adaptation. J. Veg. Sci. 29, 450–458. doi: 10.1111/jvs.12654
Carvalho, F. A., Brown, K. A., Waller, M. P., Bunting, M. J., Boom, A., and Leng, M. J. (2019). A method for reconstructing temporal changes in vegetation functional trait composition using Holocene pollen assemblages. PLoS One 14:e0216698. doi: 10.1371/journal.pone.0216698
Chen, I. C., Hill, J. K., Ohlemüller, R., Roy, D. B., and Thomas, C. D. (2011). Rapid range shifts of species associated with high levels of climate warming. Science 333, 1024–1026. doi: 10.1126/science.1206432
Clark, P. U., Shakun, J. D., Marcott, S. A., Mix, A. C., Eby, M., Kulp, S., et al. (2016). Consequences of twenty-first-century policy for multi-millennial climate and sea-level change. Nat. Clim. Chang. 6, 360–369. doi: 10.1038/nclimate2923
Cwynar, L. C. (1987). Fire and forest history of the North Cascade Range. Ecology 68, 791–802. doi: 10.2307/1938350
Dolédec, S., Chessel, D., ter Braak, C. J. F., and Champely, S. (1996). Matching species traits to environmental variables: a new three-table ordination method. Environ. Ecol. Stat. 3, 143–166. doi: 10.1007/BF02427859
Dray, S., Dufour, A., and Thioulouse, J. (2007). Ade4: Analysis of Ecological Data - Exploratory and Euclidean Methods in Environmental Sciences. R package vers. 1.7-18.
Dray, S., and Legendre, P. (2008). Testing the species traits–environment relationships: the fourth-corner problem revisited. Ecology 89, 3400–3412. doi: 10.1890/08-0349.1
Fadrique, B., Báez, S., Duque, Á, Malizia, A., Blundo, C., Carilla, J., et al. (2018). Widespread but heterogeneous responses of Andean forests to climate change. Nature 564, 207–212. doi: 10.1038/s41586-018-0715-9
Fitton, R. J. (2003). Late Quaternary History of Vegetation, Climate, and Fire on South Central Vancouver Island, British Columbia, Canada. M. Sc. thesis. Victoria, BC: University of Victoria.
Flora of North America Editorial Committee (eds). (1993). Flora of North America North of Mexico, Vol. 22. New York, NY: Oxford University Press.
Fordham, D. A., Jackson, S. T., Brown, S. C., Huntley, B., Brook, B. W., Dahl-Jensen, D., et al. (2020). Using paleo-archives to safeguard biodiversity under climate change. Science 369:eabc5654. doi: 10.1126/science.abc5654
Franco, M., and Silvertown, J. (1996). Life history variation in plants: an exploration of the fast-slow continuum hypothesis. Philos. Trans. R. Soc. B 351, 1341–1348. doi: 10.1098/rstb.1996.0117
Gavin, D. G., and Brubaker, L. B. (2015). Late Pleistocene and Holocene Environmental Change on the Olympic Peninsula, Washington. Ecological Studies. Cham: Springer, 222. doi: 10.1007/978-3-319-11014-1
Gavin, D. G., Brubaker, L. B., and Greenwald, D. N. (2013). Postglacial climate and fire-mediated vegetation change on the western Olympic Peninsula, Washington (USA). Ecol. Monogr. 83, 471–489.
Gottfried, M., Pauli, H., Futschik, A., Akhalkatsi, M., Barančok, P., Benito Alonso, J. L., et al. (2012). Continent-wide response of mountain vegetation to climate change. Nat. Clim. Chang. 2, 111–115. doi: 10.1038/nclimate1329
Gray, L. K., and Hamann, A. (2013). Tracking suitable habitat for tree populations under climate change in western North America. Clim. Chang. 117, 289–303. doi: 10.1007/s10584-012-0548-8
Halofsky, J. S., Conklin, D. R., Donato, D. C., Halofsky, J. E., and Kim, J. B. (2018). Climate change, wildfire, and vegetation shifts in a high-inertia forest landscape: western Washington, U.S.A. PLoS One 13:e0209490. doi: 10.1371/journal.pone.0209490
Hamann, A., and Wang, T. (2006). Potential effects of climate change on ecosystem and tree species distribution in British Columbia. Ecology 87, 2773–2786. doi: 10.1890/0012-9658(2006)87[2773:PEOCCO]2.0.CO;2
Heinrichs, M. L., Antos, J. A., Hebda, R. J., and Allen, G. B. (2002). Abies lasiocarpa (Hook.) Nutt. in the late-glacial and early-Holocene vegetation of British Columbia, Canada, and adjacent regions in Washington, USA. Rev. Palaeobot. Palynol. 120, 107–122. doi: 10.1016/S0034-6667(01)00145-2
Heiri, O., Lotter, A. F., and Lemcke, G. (2001). Loss on ignition as a method for estimating organic and carbonate content in sediments: reproducibility and comparability of results. J. Paleolimnol. 25, 101–110. doi: 10.1023/A:1008119611481
Heusser, C. J. (1960). Late-Pleistocene Environments of North Pacific North America. New York, NY: American Geographical Society. doi: 10.1097/00010694-196111000-00015
Heusser, C. J. (1985). “Quaternary pollen records from the Pacific Northwest coast: aleutians to the Oregon-California boundary,” in Pollen Records of Late-Quaternary North American Sediments, eds V. M. Bryant and Jr. R. G. Holloway (Dallas, TE: American Association of Stratigraphic Palynologists), 141–165.
Heusser, C. J., Heusser, L. E., and Peteet, D. M. (1985). Late-Quaternary climatic change on the American North Pacific coast. Nature 315, 485–487. doi: 10.1038/315485a0
Jackson, S. T., and Overpeck, J. T. (2000). Responses of plant populations and communities to environmental changes of the late Quaternary. Paleobiology 26, 194–220. doi: 10.1017/S0094837300026932
Kapp, R. O., Davies, O. K., and King, J. E. (2000). Pollen and Spores, 2nd Edn. Dallas, TX: The American Association of Stratigraphic Palynologists Foundation, 279.
Kienast, S. S., and McKay, J. L. (2001). Sea surface temperatures in the subarctic northeast Pacific reflect millennial-scale climate oscillations during the last 16 kyrs. Geophys. Res. Lett. 28, 1563–1566. doi: 10.1029/2000GL012543
Lacourse, T. (2005). Late Quaternary dynamics of forest vegetation on northern Vancouver Island, British Columbia, Canada. Quat. Sci. Rev. 24, 105–121. doi: 10.1016/j.quascirev.2004.05.008
Lacourse, T. (2009). Environmental change controls postglacial forest dynamics through interspecific differences in life-history traits. Ecology 90, 2149–2160. doi: 10.1890/08-1136.1
Lacourse, T., Adeleye, M. A., and Stewart, J. R. (2019a). Peatland formation, succession and carbon accumulation at a mid-elevation poor fen in Pacific Canada. Holocene 29, 1694–1707. doi: 10.1177/0959683619862041
Lacourse, T., Beer, K. W., Craig, K. B., and Canil, D. (2019b). Postglacial wetland succession, carbon accumulation and forest dynamics on the east coast of Vancouver Island, British Columbia, Canada. Quat. Res. 92, 232–245. doi: 10.1017/qua.2018.146
Lacourse, T., and Davies, M. A. (2015). A multi-proxy peat study of Holocene vegetation history, bog development, and carbon accumulation on northern Vancouver Island, Pacific coast of Canada. Holocene 25, 1165–1178. doi: 10.1177/0959683615580201
Lacourse, T., and Gajewski, K. (2020). Current practices in building and reporting age-depth models. Quat. Res. 96, 28–38. doi: 10.1017/qua.2020.47
Lavorel, S., and Garnier, E. (2002). Predicting changes in community composition and ecosystem functioning from plant traits: revisiting the Holy Grail. Funct. Ecol. 16, 545–556. doi: 10.1046/j.1365-2435.2002.00664.x
Legendre, P., and Gallagher, E. D. (2001). Ecologically meaningful transformations for ordination of species data. Oecologia 129, 271–280. doi: 10.1007/s004420100716
Leishman, M. R. (2001). Does the seed size/number trade-off model determine plant community structure? An assessment of the model mechanisms and their generality. Oikos 93, 294–302. doi: 10.1034/j.1600-0706.2001.930212.x
Lenoir, J., and Svenning, J. C. (2015). Climate-related range shifts – a global multidimensional synthesis and new research directions. Ecography 38, 15–28. doi: 10.1111/ecog.00967
MacKenzie, W. H., and Mahony, C. R. (2021). An ecological approach to climate change-informed tree species selection for reforestation. For. Ecol. Manag. 481:118705. doi: 10.1016/j.foreco.2020.118705
Mathewes, R. W. (1973). A palynological study of postglacial vegetation in the University Research Forest, southwestern British Columbia. Can. J. Bot. 51, 2085–2103. doi: 10.1139/b73-271
Mathewes, R. W. (1993). Evidence for Younger Dryas-age cooling on the North Pacific coast of America. Quat. Sci. Rev. 12, 321–331. doi: 10.1016/0277-3791(93)90040-S
May, L., and Lacourse, T. (2012). Morphological differentiation of Alnus (alder) pollen from western North America. Rev. Palaeobot. Palynol. 180, 15–24. doi: 10.1016/j.revpalbo.2012.04.007
Mazzucchi, D. (2010). Postglacial Vegetation History of Mountainous Landscapes on Vancouver Island, British Columbia, Canada. Ph. D Dissertation. Victoria, BC: University of Victoria.
McAndrews, J. H., Berti, A. A., and Norris, G. (1973). Key to the Quaternary Pollen and Spores of the Great Lakes Region. Toronto, ON: Royal Ontario Museum Life Sciences Miscellaneous Publication, 64. doi: 10.5962/bhl.title.60762
McGill, B. J., Enquist, B. J., Weiher, E., and Westoby, M. (2006). Rebuilding community ecology from functional traits. Trends Ecol. Evol. 21, 178–185. doi: 10.1016/j.tree.2006.02.002
Meidinger, D. V., and Pojar, J. (1991). Ecosystems of British Columbia. Special Report Series 6. Victoria, BC: British Columbia Ministry of Forests, 342.
Mote, P. W., and Salathé, E. P. Jr. (2010). Future climate in the Pacific Northwest. Clim. Chang. 102, 29–50. doi: 10.1007/s10584-010-9848-z
Oksanen, J., Blanchet, F. G., Friendly, M., Kindt, R., Legendre, P., McGlinn, D., et al. (2020). Vegan: Community Ecology Package. R package version 2.5-7.
R Core Team (2021). R: A Language and Environment for Statistical Computing. Vienna: R Foundation for Statistical Computing.
Reimer, P., Austin, W. E. N., Bard, E., Bayliss, A., Blackwell, P. G., Bronk Ramsey, C., et al. (2020). The IntCal20 Northern Hemisphere radiocarbon age calibration curve (0-55 cal kBP). Radiocarbon 62, 725–757. doi: 10.1017/RDC.2020.41
Reitalu, T., Gerhold, P., Poska, A., Pärtel, M., Väli, V., and Veski, S. (2015). Novel insights into post-glacial vegetation change: functional and phylogenetic diversity in pollen records. J. Veg. Sci. 26, 911–922. doi: 10.1111/jvs.12300
Renssen, H., Seppä, H., Crosta, X., Goosse, H., and Roche, D. M. (2012). Global characterization of the Holocene thermal maximum. Quat. Sci. Rev. 48, 7–19. doi: 10.1016/j.quascirev.2012.05.022
Rodenhuis, D. R., Bennett, K. E., Werner, A. T., Murdock, T. Q., and Bronaugh, D. (2009). Hydro-Climatology and Future Climate Impacts in British Columbia. Pacific Climate Impacts Consortium. Victoria, BC: University of Victoria, 132.
Routson, C. C., Kaufman, D. S., McKay, N. P., Erb, M. P., Arcusa, S. H., Brown, K. J., et al. (2021). A multiproxy database of western North American Holocene paleoclimate records. Earth Syst. Sci. Data 13, 1613–1632. doi: 10.5194/essd-13-1613-2021
Swenson, N. G., Anglada-Cordero, P., and Barone, J. A. (2011). Deterministic tropical tree community turnover: evidence from patterns of functional beta diversity along an elevational gradient. Proc. R. Soc. B Biol. Sci. 278, 877–884. doi: 10.1098/rspb.2010.1369
van der Sande, M. T., Gosling, W. D., Correa-Metrio, A., Prado-Junior, J., Poorter, L., Oliveira, R. S., et al. (2019). A 7000-year history of changing plant trait composition in an Amazonian landscape; the role of humans and climate. Ecol. Lett. 22, 925–935. doi: 10.1111/ele.13251
Wang, T., Hamann, A., Spittlehouse, D., and Carroll, C. (2016). Locally downscaled and spatially customizable climate data for historical and future periods for North America. PLoS One 11:e0156720. doi: 10.1371/journal.pone.0156720
Weiher, E., van der Werf, A., Thompson, K., Roderick, M., Garnier, E., and Eriksson, O. (1999). Challenging Theophrastus: a common core list of plant traits for functional ecology. J. Veg. Sci. 10, 609–620. doi: 10.2307/3237076
Williams, J. W., Shuman, B. N., Webb, T. I. I. I., Bartlein, P. J., and Leduc, P. L. (2004). Late-Quaternary vegetation dynamics in North America: scaling from taxa to biomes. Ecol. Monogr. 74, 309–334. doi: 10.1890/02-4045
Keywords: pollen analysis, forest composition, plant species traits, climate change, multivariate timeseries, RLQ analysis, fourth corner analysis, trait-environment relationships
Citation: Lacourse T and Adeleye MA (2022) Climate and Species Traits Drive Changes in Holocene Forest Composition Along an Elevation Gradient in Pacific Canada. Front. Ecol. Evol. 10:838545. doi: 10.3389/fevo.2022.838545
Received: 17 December 2021; Accepted: 14 February 2022;
Published: 08 March 2022.
Edited by:
Miguel Montoro Girona, Université du Québec en Abitibi Témiscamingue, CanadaReviewed by:
Inger Greve Alsos, UiT The Arctic University of Norway, NorwayCopyright © 2022 Lacourse and Adeleye. This is an open-access article distributed under the terms of the Creative Commons Attribution License (CC BY). The use, distribution or reproduction in other forums is permitted, provided the original author(s) and the copyright owner(s) are credited and that the original publication in this journal is cited, in accordance with accepted academic practice. No use, distribution or reproduction is permitted which does not comply with these terms.
*Correspondence: Terri Lacourse, dGxhY291cnNAdXZpYy5jYQ==
†ORCID: Terri Lacourse, orcid.org/0000-0002-7559-5374; Matthew A. Adeleye, orcid.org/0000-0002-6034-5807
‡Present address: Matthew A. Adeleye, Centre of Excellence for Australian Biodiversity and Heritage, and School of Culture, History and Language, Australian National University, Canberra, ACT, Australia
Disclaimer: All claims expressed in this article are solely those of the authors and do not necessarily represent those of their affiliated organizations, or those of the publisher, the editors and the reviewers. Any product that may be evaluated in this article or claim that may be made by its manufacturer is not guaranteed or endorsed by the publisher.
Research integrity at Frontiers
Learn more about the work of our research integrity team to safeguard the quality of each article we publish.