 Stotra Chakrabarti
 Shawn T. O’Neil3
 Joseph K. Bump
- 1Department of Fisheries, Wildlife and Conservation Biology, University of Minnesota, Saint Paul, MN, United States
- 2Department of Biology, Macalester College, Saint Paul, MN, United States
- 3Independent Researcher, Bemidji, MN, United States
- 4Minnesota Department of Natural Resources, Grand Rapids, MN, United States
Survival is a key determinant of population growth and persistence; computation and understanding of this metric is key to successful population management, especially for recovering populations of large carnivores such as wolves. Using a Bayesian frailty analytical approach, we evaluated information from 150 radio-tagged wolves over a 16-year time period to determine temporal trends and age- and sex-specific survival rates of wolves in Minnesota, United States. Based on our analyses, overall annual survival of wolves during the study was 0.67, with no clear evidence for age- or sex-specific differences in the population. Our model demonstrated statistical support for a temporal trend in annual survival; the highest survival was predicted at the beginning of the time series (0.87), with lowest survival (0.55) during 2018. We did not observe evidence that survival was markedly reduced during years when a regulated hunting and trapping season was implemented for wolves (years 2012–2014). However, cause-specific mortality analysis indicated that most mortality was human-caused. While the estimate for increasing human-caused mortality over time was positive, the evidence was not statistically significant. Anthropogenic causes resulted in ∼66% of known mortalities, including legal and illegal killing, and vehicular collisions. Trends in wolf survival in Minnesota may reflect an expanding distribution; wolf range has spread to areas with more human development during the study, presumably leading to increased hazard and reduced survival. Our results provide foundational information for evaluating and guiding future policy decisions pertaining to the Great Lakes wolf population.
Introduction
Human expansion and persecution have endangered terrestrial carnivores worldwide (Ripple et al., 2014). Some carnivore species or populations however, have recovered to varying degrees from past exploitation, expanding from “refuges” back into parts of their former range. As their populations expand or human populations encroach new areas, large carnivores compete with humans for space or wild prey and may kill or injure pets, livestock and humans, while humans often respond by removing individuals, groups or entire populations (Cardillo et al., 2004; Treves and Bruskotter, 2014). Carnivore conservation in the Anthropocene is thus a challenge, and characterization of key vital rates such as survival is crucial for aiding recovery and understanding population dynamics.
Although the ecological roles of carnivores in their respective ecosystems lack generalities and fuel discourse (reviewed in Ford and Goheen, 2015), large carnivores indisputably remain as flagbearers for conservation of large landscapes (Ritchie et al., 2012). For their conservation roles and their connection to the human psyche, restoration efforts continue to be implemented and evaluated, and have often resulted in optimistic recoveries of carnivore species such as the tiger Panthera tigris (Jhala et al., 2021), puma Puma concolor (Jansen and Logan, 2002), Asian lion P. leo leo (Jhala et al., 2019), brown bear Ursus arctos (Lamb et al., 2018), gray wolf Canis lupus (Wydeven et al., 2009; Mech and Boitani, 2010; Ripple and Beschta, 2012; Nowak and Mysłajek, 2016), African wild dog Lyacon Pictus (Gusset et al., 2010), and black-footed ferret Mustela nigripes (Jachowski et al., 2011).
However, the Anthropocene has disparately affected the persistence and distribution of carnivore populations (Ripple et al., 2014), rendering certain sub-populations more vulnerable than other populations of the same species (Bruskotter et al., 2014). Thus, it is imperative to prioritize management actions for effective conservation. An understanding of population dynamics is necessary for successful management (Caughley, 1994), whether for: (i) increased protection, (ii) supplementation, (iii) reintroduction, and/or (iv) population control. For example, wolf populations in Yellowstone and Isle Royale have been restored through reintroductions, recolonization, and supplementation (Ripple and Beschta, 2012; Hervey et al., 2021) and the Gir lions in India have increased from less than 50 animals to ∼700 in the past 100 years because of committed protection and conservation (Jhala et al., 2019). Some carnivore populations have also been controlled to maintain ecological carrying capacity and to reduce human-carnivore conflict (e.g., American black bears Ursus americanus, Garshelis et al., 2020).
Wolves are iconic predators across their extant range, but perhaps nowhere are their contemporary fates so entwined with human actions as they are in North America. Wolves evoke strong and polarizing reactions of support and persecution, and are thus involved in intense conservation conflicts. Such conflicts are often aggravated because people connect with wolves as symbols of pristine wilderness, reconciliation, invasion, disease, and government overreach. As a consequence, the status of wolves still ranges from complete to no legal protection, resulting in a mosaic of management emphasis across regional to national scales (Bruskotter, 2013). This was recently exemplified in the dialog around the delisting of wolves from the federal Endangered Species Act (ESA)1 in the United States. Historically, the last remaining wolves in the “Lower 48 states” were protected in Minnesota and gradually expanded to repopulate northern Wisconsin and Michigan’s upper peninsula2. Consequently, Minnesota has a long history of successful wolf management aided by scientific monitoring, including intense regional study (e.g., Olson, 1938; Van Ballenberghe et al., 1975; Fuller, 1991; Mech et al., 2000; Erb and Benson, 2004; Gable and Windels, 2018). However, wolves in Minnesota still face threats from habitat alteration, and mortalities from escalating linear infrastructure, roadkill, depredation management, and illegal killing2.
Wolves in North America, with the exception of the Northern Rocky Mountain population, have been re-listed on the Endangered Species Act; the Minnesota population considered as ‘threatened’1. It is therefore imperative to monitor the population for long-term viability. Annual survival rate is a key parameter that informs our understanding of the ecological dynamics and persistence potential of a population. Herein, we determine survival rates for wolves with data from 150 radio- or GPS-collared wolves spanning 16 years (2004–2019) across Minnesota. Although estimates of annual or seasonal survival rate can provide important information for management, awareness of any temporal trend in survival can be crucial for policy formulation. Such a temporal analysis of survival becomes even more necessary when populations are affected by environmental stochasticity, human impacts that vary over time, and socio-biological factors (such as territoriality, competition and density dependence), which often affect group-living carnivores (Cubaynes et al., 2014; O’Neil et al., 2017). Using long-term known-fate data on individuals, we estimate human versus natural mortality while testing for the effect of time on wolf survival with four major questions: (1) how does annual survival vary between years, (2) does survival show a trend over time, (3) is there a particular inflection point or period where survival rates or trends change, and (4) did recreational wolf hunting and trapping (years 2012–2014) affect survival rates of wolves in Minnesota.
Materials and Methods
Study Area
We evaluated wolf survival and mortality within northern Minnesota, United States. Wolf distribution and abundance has expanded south and west within the state since the 1970s2 (Figure 1). The study area was primarily characterized by mixed northern hardwood forest, bog, wetland, and agricultural land cover types (Erb and Sampson, 2013; Erb and Humpal, 2021). Human population and road densities were generally low (typically < 5 humans/km2 and < 2 km of roads/km2; MN DNR unpublished data), with primary land uses being recreation, logging, and some mining, with increasing agriculture in the south and west of wolf range. Prey and food sources for wolves included white-tailed deer (Odocoileus virginianus), beaver (Castor canadensis), moose (Alces alces), and sometimes fish and berries (Gable et al., 2016, 2018; Homkes et al., 2020).
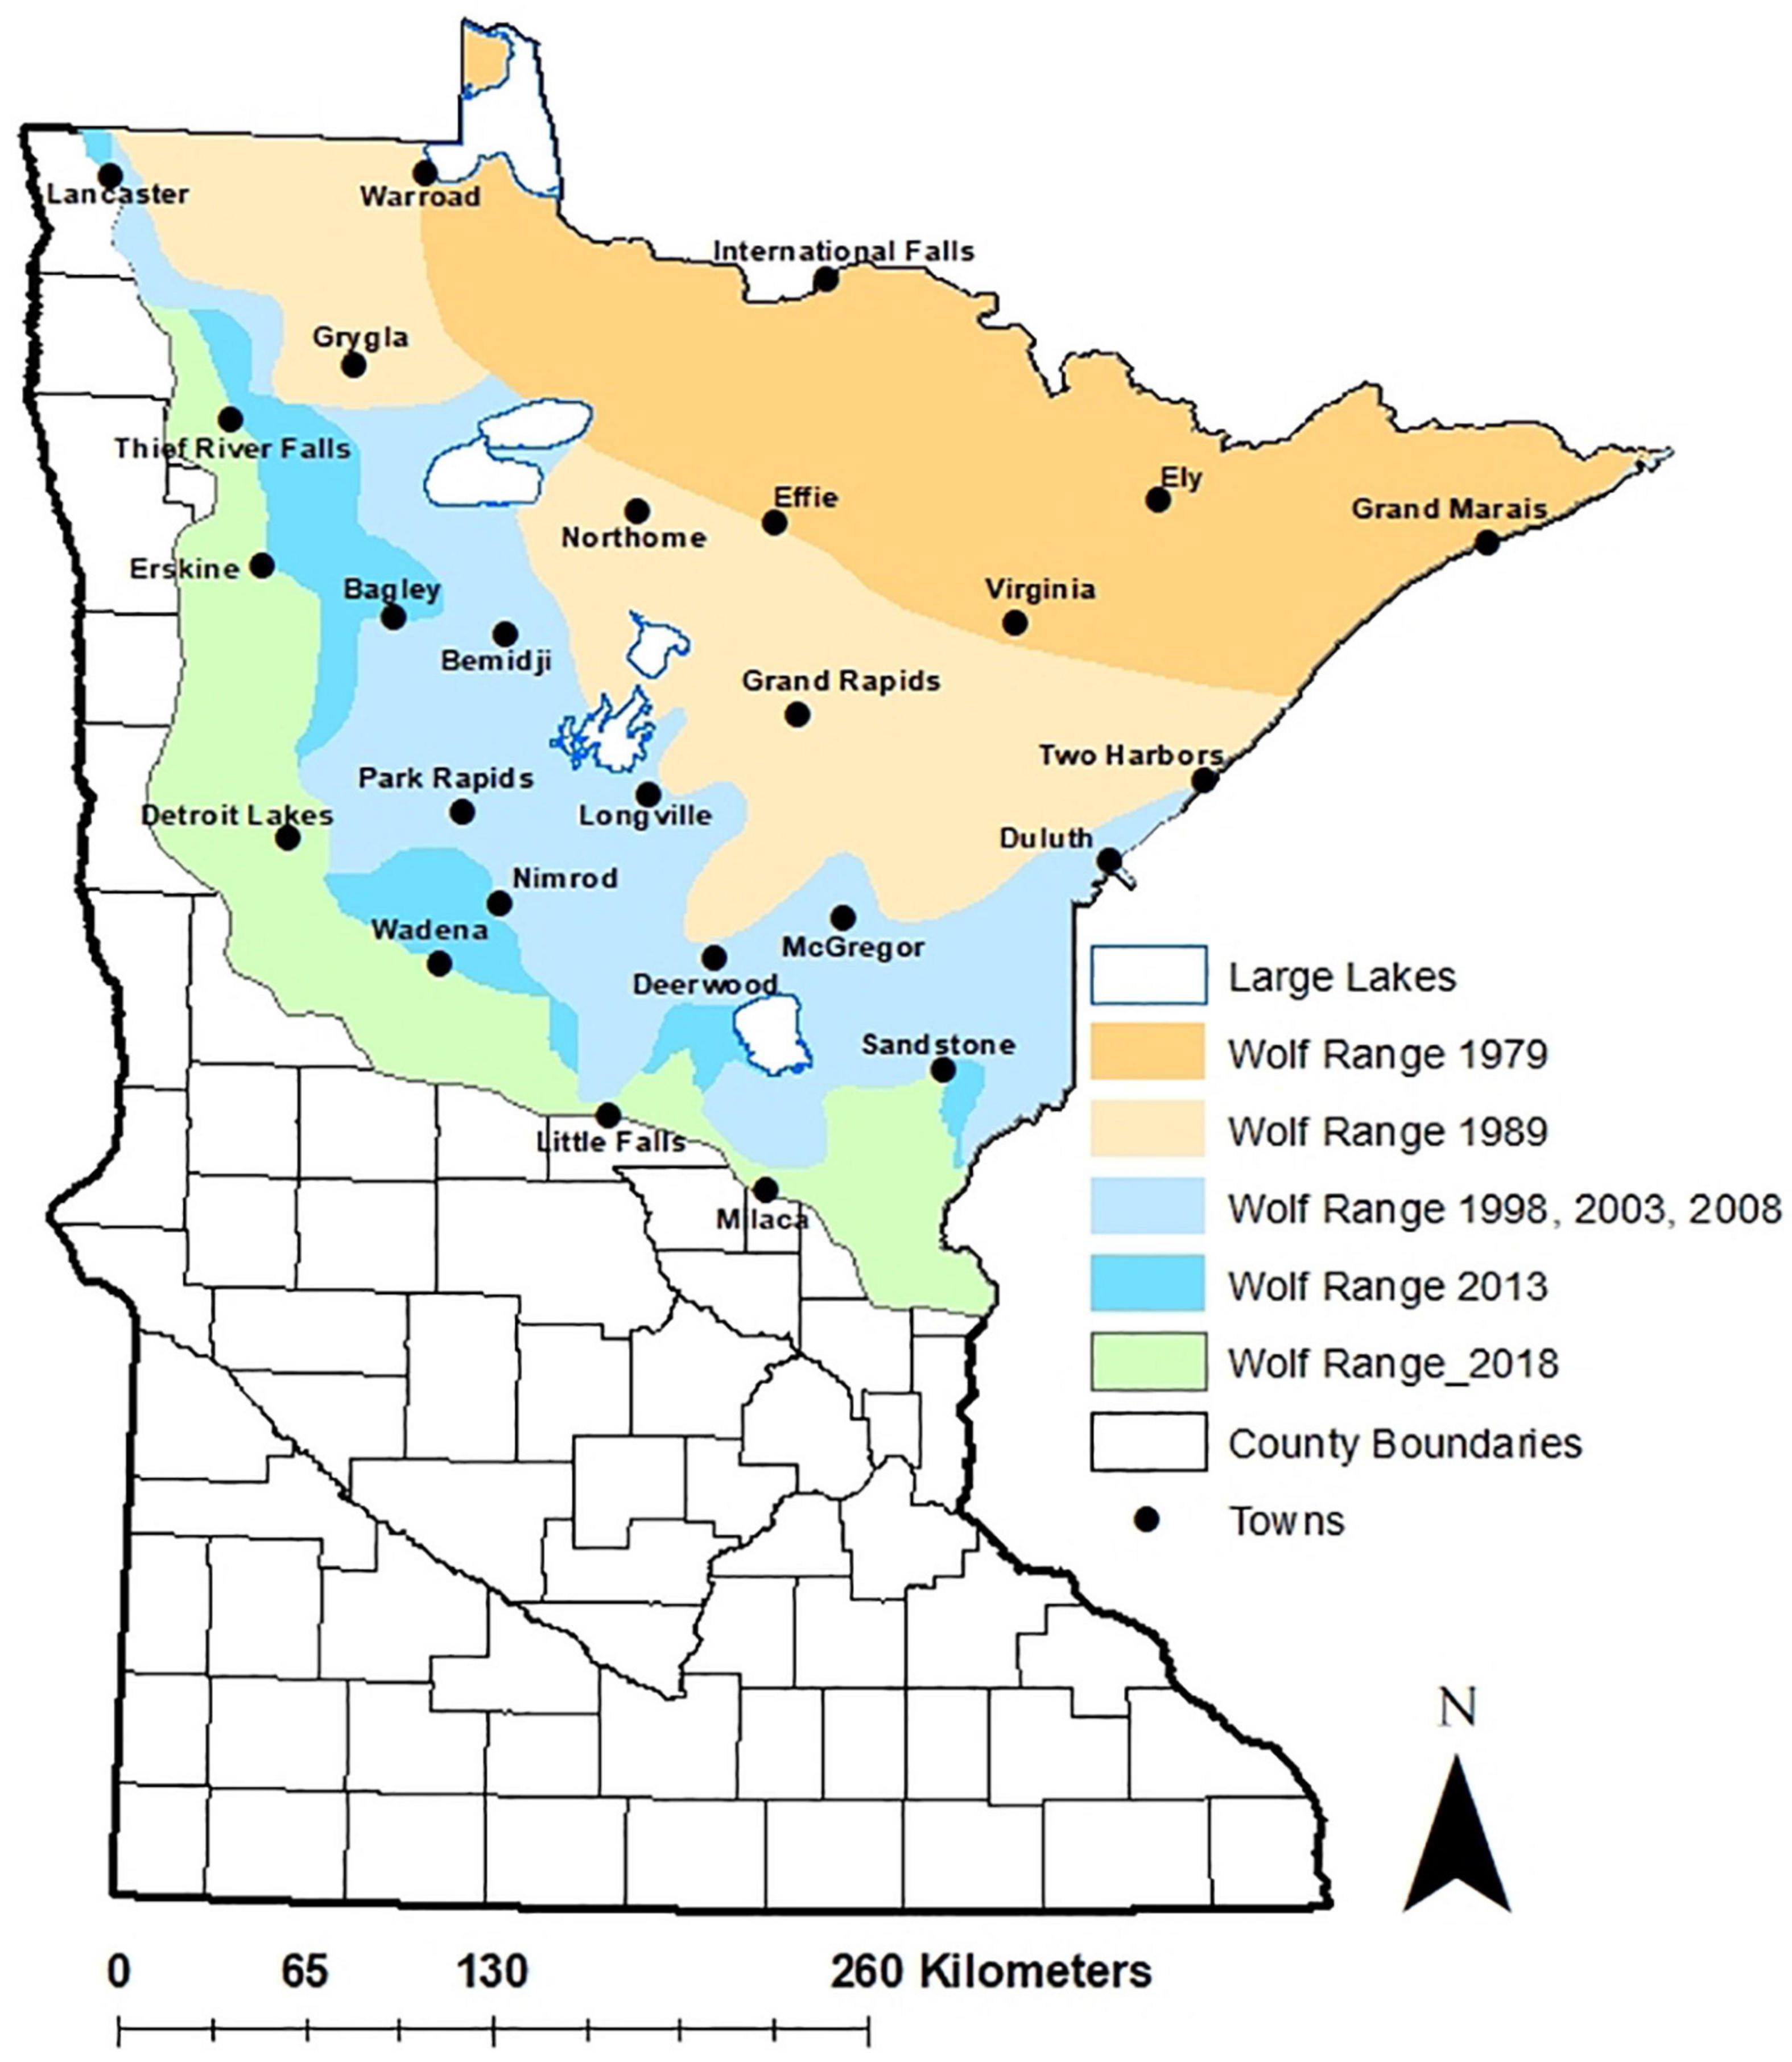
Figure 1. Distribution and expansion of gray wolves (Canis lupus) in Minnesota, United States, from 1978 to 2018, from Minnesota Department of Natural Resources (https://www.dnr.state.mn.us/wolves).
After ESA protections were established in the 1970s, public harvest of wolves was prohibited until their delisting in 2012. However, lethal control of wolves in response to livestock depredation was permitted throughout the study period and region (available reporting indicates that the annual number of wolves killed ranged from 95 to 216 for 2011–2020). During 2012–2014, state law permitted a regulated, public harvest of wolves. These hunting and trapping seasons occurred in the late fall and early winter months, with a total of 915 wolves killed (Erb and Sampson, 2013). Federal (ESA) protection of wolves has varied during the period of our analysis, but public harvest has not been allowed since 20142.
Data Collection
For radiotelemetry, most wolves were captured using foothold traps (Erb and Humpal, 2021). Some wolves were also captured with the use of live-restraining neck snares (Gese et al., 2019), and a few by aerial darting from a helicopter. Wolves captured with foothold traps were captured between May-October and live-snared wolves were caught between December-March, however, winter live-snaring only started from 2013. Upon capture, each individual was weighed, sexed, and aged prior to release. Based on tooth- wear and color, coupled with appearance and behavior, individuals were aged into three categories: pups (<1 year), juveniles (1–2 years) and adults (>2 years). Post-mortem aging of some of the tagged wolves from tooth cross sections aligned with our initial assessments. Telemetry equipment ranged from VHF-only (20%) to VHF/GPS collars (remaining 80%). Most GPS radio-collars were programmed to take 3–6 locations per day, and wolves fitted with VHF-only radio-collars were relocated at approximately 7 to 10-day intervals throughout the year, and in some cases, primarily from early winter through spring (Erb and Humpal, 2021). All captures were done as per regulations and guidelines from the Minnesota Department of Natural Resources.
Statistical Analysis
We used a Bayesian shared frailty model (Halstead et al., 2012; Heisey, 2012) to capture variation in annual survival of wolves from 2004 to 2019, and as a function of sex and estimated age at capture. In addition, we partitioned the hazard rate from the frailty model into cause-specific mortality rates over the same time period (Heisey and Patterson, 2006). For each individual wolf, we created encounter histories that reflected the time period (number of days) between initial date of capture and date last known alive. Individuals that were characterized by “loss to follow-up” had undetermined fates and were right censored with an encounter history endpoint being the last alive date (DeCesare et al., 2016; Moore, 2016). Individual collars that were detected in mortality mode were located in the field, where fate was determined. The time period between last known alive and date confirmed dead was interval censored, such that date of death was considered unknown and was imputed by the frailty model (i.e., fate could have occurred any time between last date known alive and date confirmed death). Known fate mortality was classified as human (e.g., legally or illegally killed, vehicle collision), natural (e.g., disease, starvation, intraspecific strife), or unknown (cause undetermined). We generated time-varying covariates to estimate temporal effects and age. Specifically, we set the initial day of season, year, and age for each individual encounter history. As encounter histories progressed, the corresponding covariates for year and age were updated in alignment with each individual encounter history across time. Age was classified as either adult or non-adult (pup or juvenile) due to uncertainty in age estimation. As such, pups and juveniles graduated to adults after 2 and 1 years, respectively, with the date of graduation set to the 15th of April to correspond with the approximate wolf biological year.
We identified five a priori candidate models to test relative support for each of our research questions, specifically whether survival changed over time, whether a change in survival (e.g., an inflection point) was evident during the study, and whether years with legal hunting and trapping resulted in lower survival. The shared frailty model infers survival across a specified encounter history interval via a hazard function, expressed as
where UH represents the unit hazard, with the unit defined as length of interval (daily, weekly, monthly). In this model, γ0 is the intercept, providing a constant baseline hazard that can be offset by any number of fixed covariates X, or random effects κ. We specified the following models to evaluate evidence for temporal and/or hunting effects on survival:
Each model represented a different hypothesis about the temporal trend in wolf survival, including a linear trend (Equation 2), a hyperbolic trend (survival rises and then falls, or falls and then rises; Equation 3), a log-linear threshold trend (Equation 4), a change in survival only during years of regulated public harvest (harvest effect; Equation 5), and a linear time trend as well as a harvest effect (Equation 6). For each model, time was treated as a continuous variable (t = 1:16 for years 2004–2019, respectively). For models including a harvest effect, the years associated with public harvest were represented by a binary indicator covariate for harvest (xhunt = 1) vs. no harvest (xhunt = 0). We included sex and age (time-varying) in all models, which were also treated as binary fixed covariates, where the respective coefficients, β1 and β2, modeled the influence of being male (xmale = 1) vs. female (xmale = 0), and adult (xadult = 1) vs. pup or juvenile (xadult = 0), respectively. We did not include a separate parameter for pups due to sample size, as very few pups with known fates were included in the dataset. We ranked models using the Bayesian widely applicable information criterion (WAIC; Vehtari et al., 2017). We also included results of leave-one-out (LOO) cross-validation and deviance information criterion (DIC) to check for consistency across evaluation metrics (Spiegelhalter et al., 2014; Vehtari et al., 2017).
Following identification of the top performing model, we refit the model with an additional parameter to capture residual variation across years (e.g., year effects are not assumed independent of one another) and added a component to evaluate competing mortality sources. For each known mortality, cause was assigned as k ∈ {1 = human, 2 = natural, 3 = unknown}, using a categorical distribution with cause probabilities (p1, p2, p3), where (Cross et al., 2015; Stenglein et al., 2018). We tested evidence for the following mortality cause effects by relating covariates (α) to cause probabilities via the logit link function (Stenglein et al., 2018): first, human cause changes over time (relative to other causes), second, a difference in human vs. natural cause for adults relative to sub-adults, and third, a difference in unknown cause vs. other causes for adults relative to sub-adults.
Following estimation of the unit hazard, we calculated annual survival as
where CH represents the annual, cumulative hazard and S represents the annual, cumulative survival rate.
For reporting, we derived estimates of annual hazard and survival from the final model under the condition that ratios of male to female and adult to non-adult were equivalent to those observed during the study. In addition, we derived estimates of annual survival for each of the four age and sex classes (adult-male, adult-female, juvenile-male, juvenile-female) assuming an average year during the study.
We specified uninformative Normal prior distributions (μ = 0, τ = 1/σ2 = 0.01) for all fixed covariate effects, as well as the residual year effects. For the baseline hazard, we specified a weakly informative prior, γ0 ∼ N(μ, σ2), based on a comprehensive literature review of wolf survival (annual estimates ranging from 0.24–0.91), and used moment matching to appropriately place the hyperparameters on the UH scale (μ = −7.47, σ = 1.12). We estimated all model parameters for the frailty model using the Gibbs MCMC sampler in JAGS 4.2.0 (Plummer, 2003), by way of the jagsUI package (Kellner, 2019) implemented in R 4.0.3 (R Core Team, 2020). We ran three chains of 50,000 iterations and retained every 10th sample following a burn-in phase of 20,000. We calculated DIC using the jagsUI package and WAIC and LOOIC from the model’s posterior predictive distribution using the loo package (Vehtari et al., 2020). We visually examined chains and calculated Gelman-Rubin statistics to verify chain convergence (r < 1.05). We report median values of posterior distributions and 95% credible intervals (CRI) for each parameter, unless otherwise stated.
Results
We evaluated annual hazard and subsequent survival for 150 individual wolves during 2004–2019. Of these, 84 were females (56.0%) and 66 were males (44.0%). At the time of capture, 91 wolves were estimated to be adults (≥2 years; 60.6%), 44 were yearlings (∼1 year old; 29.3%), and 15 were pups (<1 year old; 10.0%). Mortality information (known fate) was obtained for 59 individuals. Of these mortalities, 39 were attributed to anthropogenic causes (66.1%), 14 were natural deaths (23.7%), and 6 had undetermined causes (10.2%).
Our top frailty model was based on Eq. 4, with temporal change in the hazard represented by a log-transformation on the continuous year variable. This model indicated a curvilinear relationship between the hazard and time (Table 1 and Figure 2). The linear time trend model was also competitive (e.g., within 2 WAIC units of top model; Table 1), with less support for models representing an effect of regulated public harvest on the hazard rate. Our model demonstrated statistical support for a temporal trend in annual survival [β3 = 0.54, 95% CRI = (0.07, 1.04), p > 0 = 0.99], with greatest survival generally occurring in the early years of the time series and lower survival during the later years (Table 2 and Figure 3), though the rate of change slowed over time (Figure 3). The highest survival was predicted at the beginning of the time series [0.87, 95% CRI = (0.68,0.97)], with lowest survival during 2018 [0.55, 95% CRI = (0.39,0.68)]. From all Bayesian information criteria rankings, we did not observe evidence that survival was markedly reduced during years when a public harvest was allowed on wolves (years 2012–2014; Table 1).
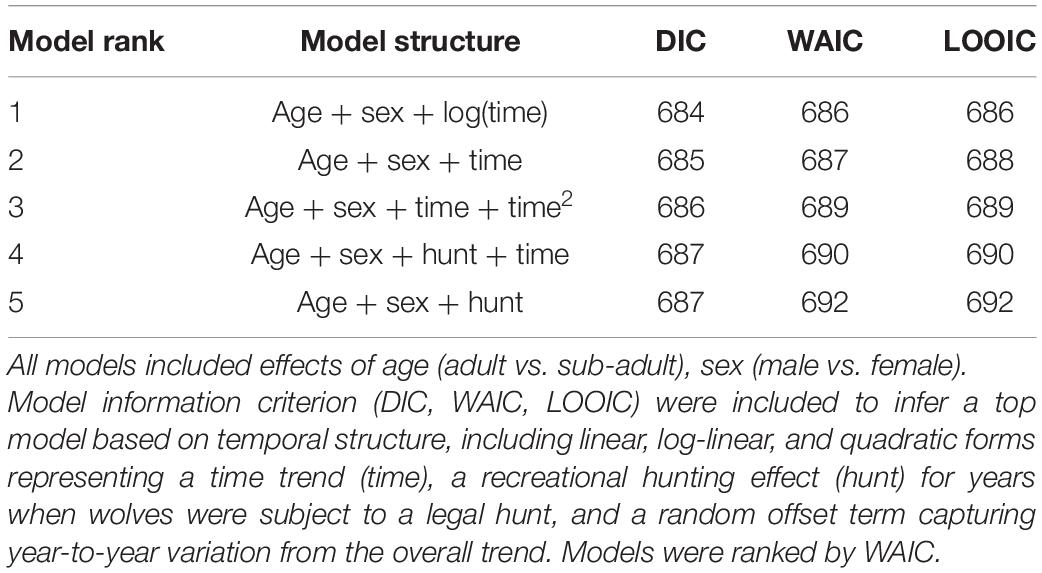
Table 1. Model rankings for five Bayesian shared frailty models of gray wolf (Canis lupus) mortality and survival in Minnesota, United States, from 2004 to 2019.
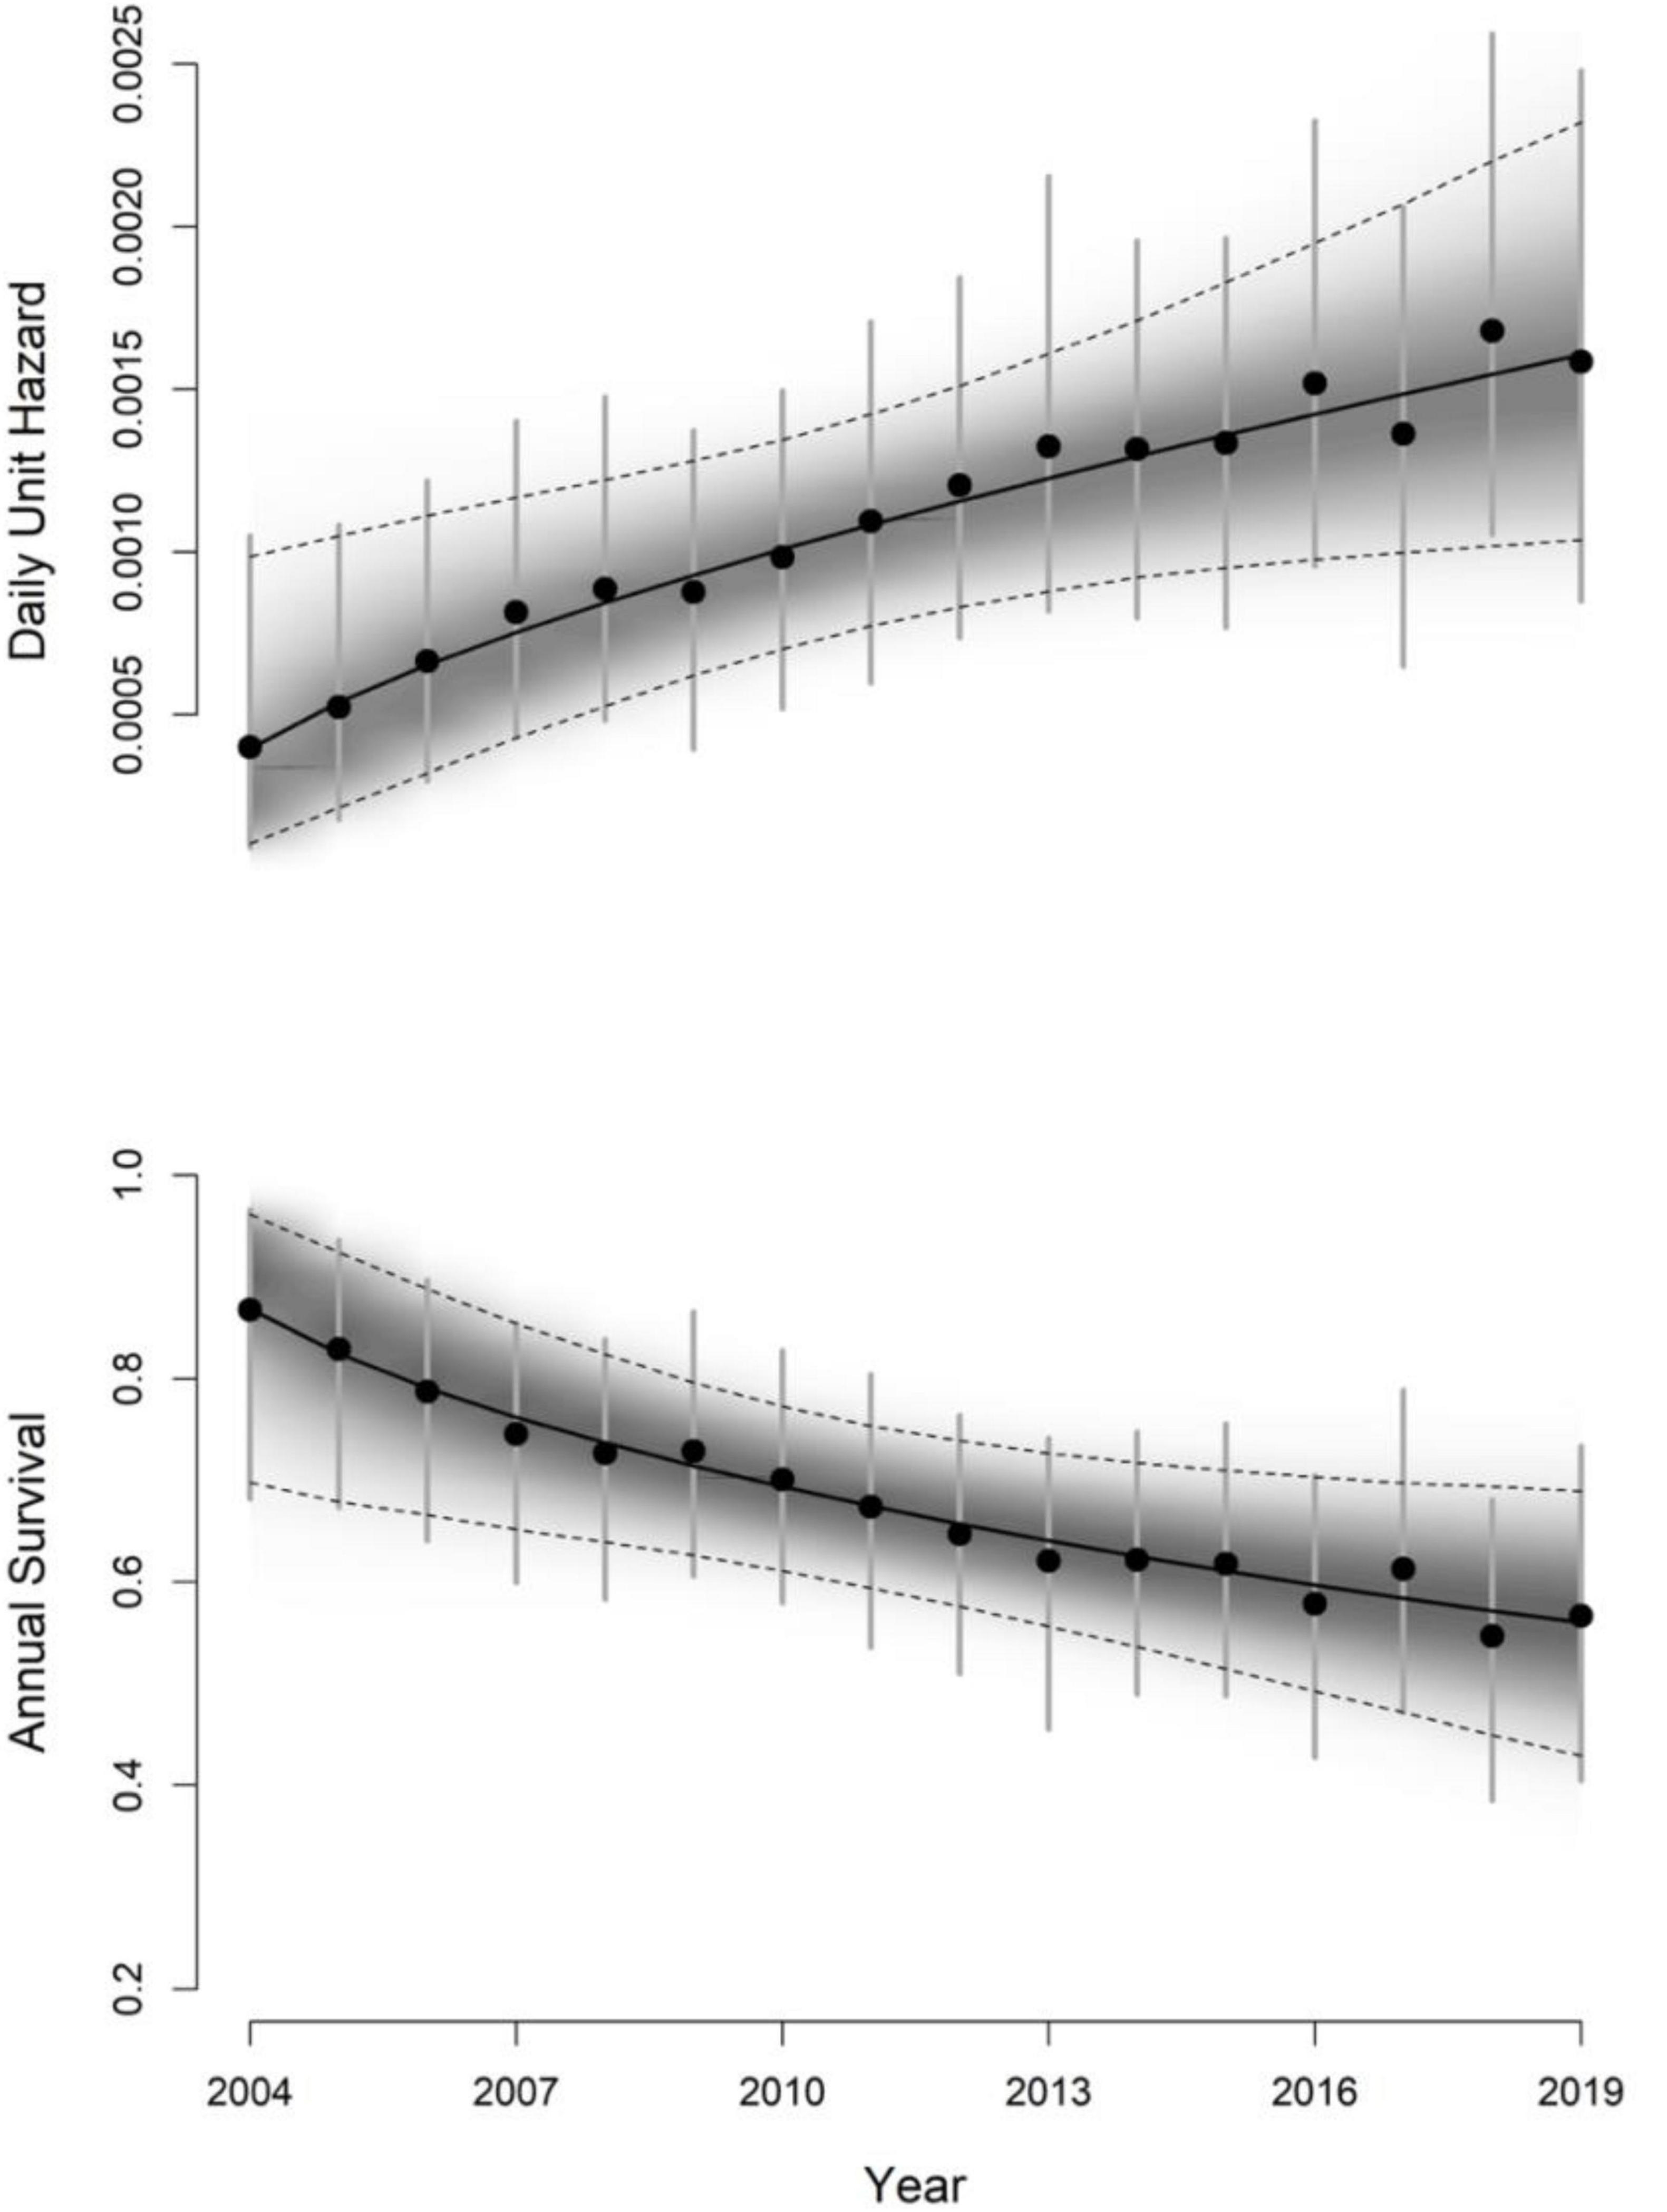
Figure 2. Daily unit hazard (mortality risk) and annual survival estimates of gray wolves (Canis lupus) in Minnesota, United States, 2004–2019. Survival parameters were estimated with respect to the daily unit hazard (UH) from a selected Bayesian shared frailty and cause-specific model of wolf mortality and survival, and all estimates were obtained from Gibbs MCMC sampling. Year effects were based on the modeled time trend, and deviation away from the trend was represented by random normally distributed residual offsets. Annual means and upper and lower credible intervals are represented by black dots and vertical error bars respectively. The trend is represented by the black regression line with shaded distribution, and dotted lines indicating upper and lower 95% credible intervals.

Table 2. Estimates of model parameters for a Bayesian shared frailty model of gray wolf (Canis lupus) mortality and survival in Minnesota, United States, 2004–2019.
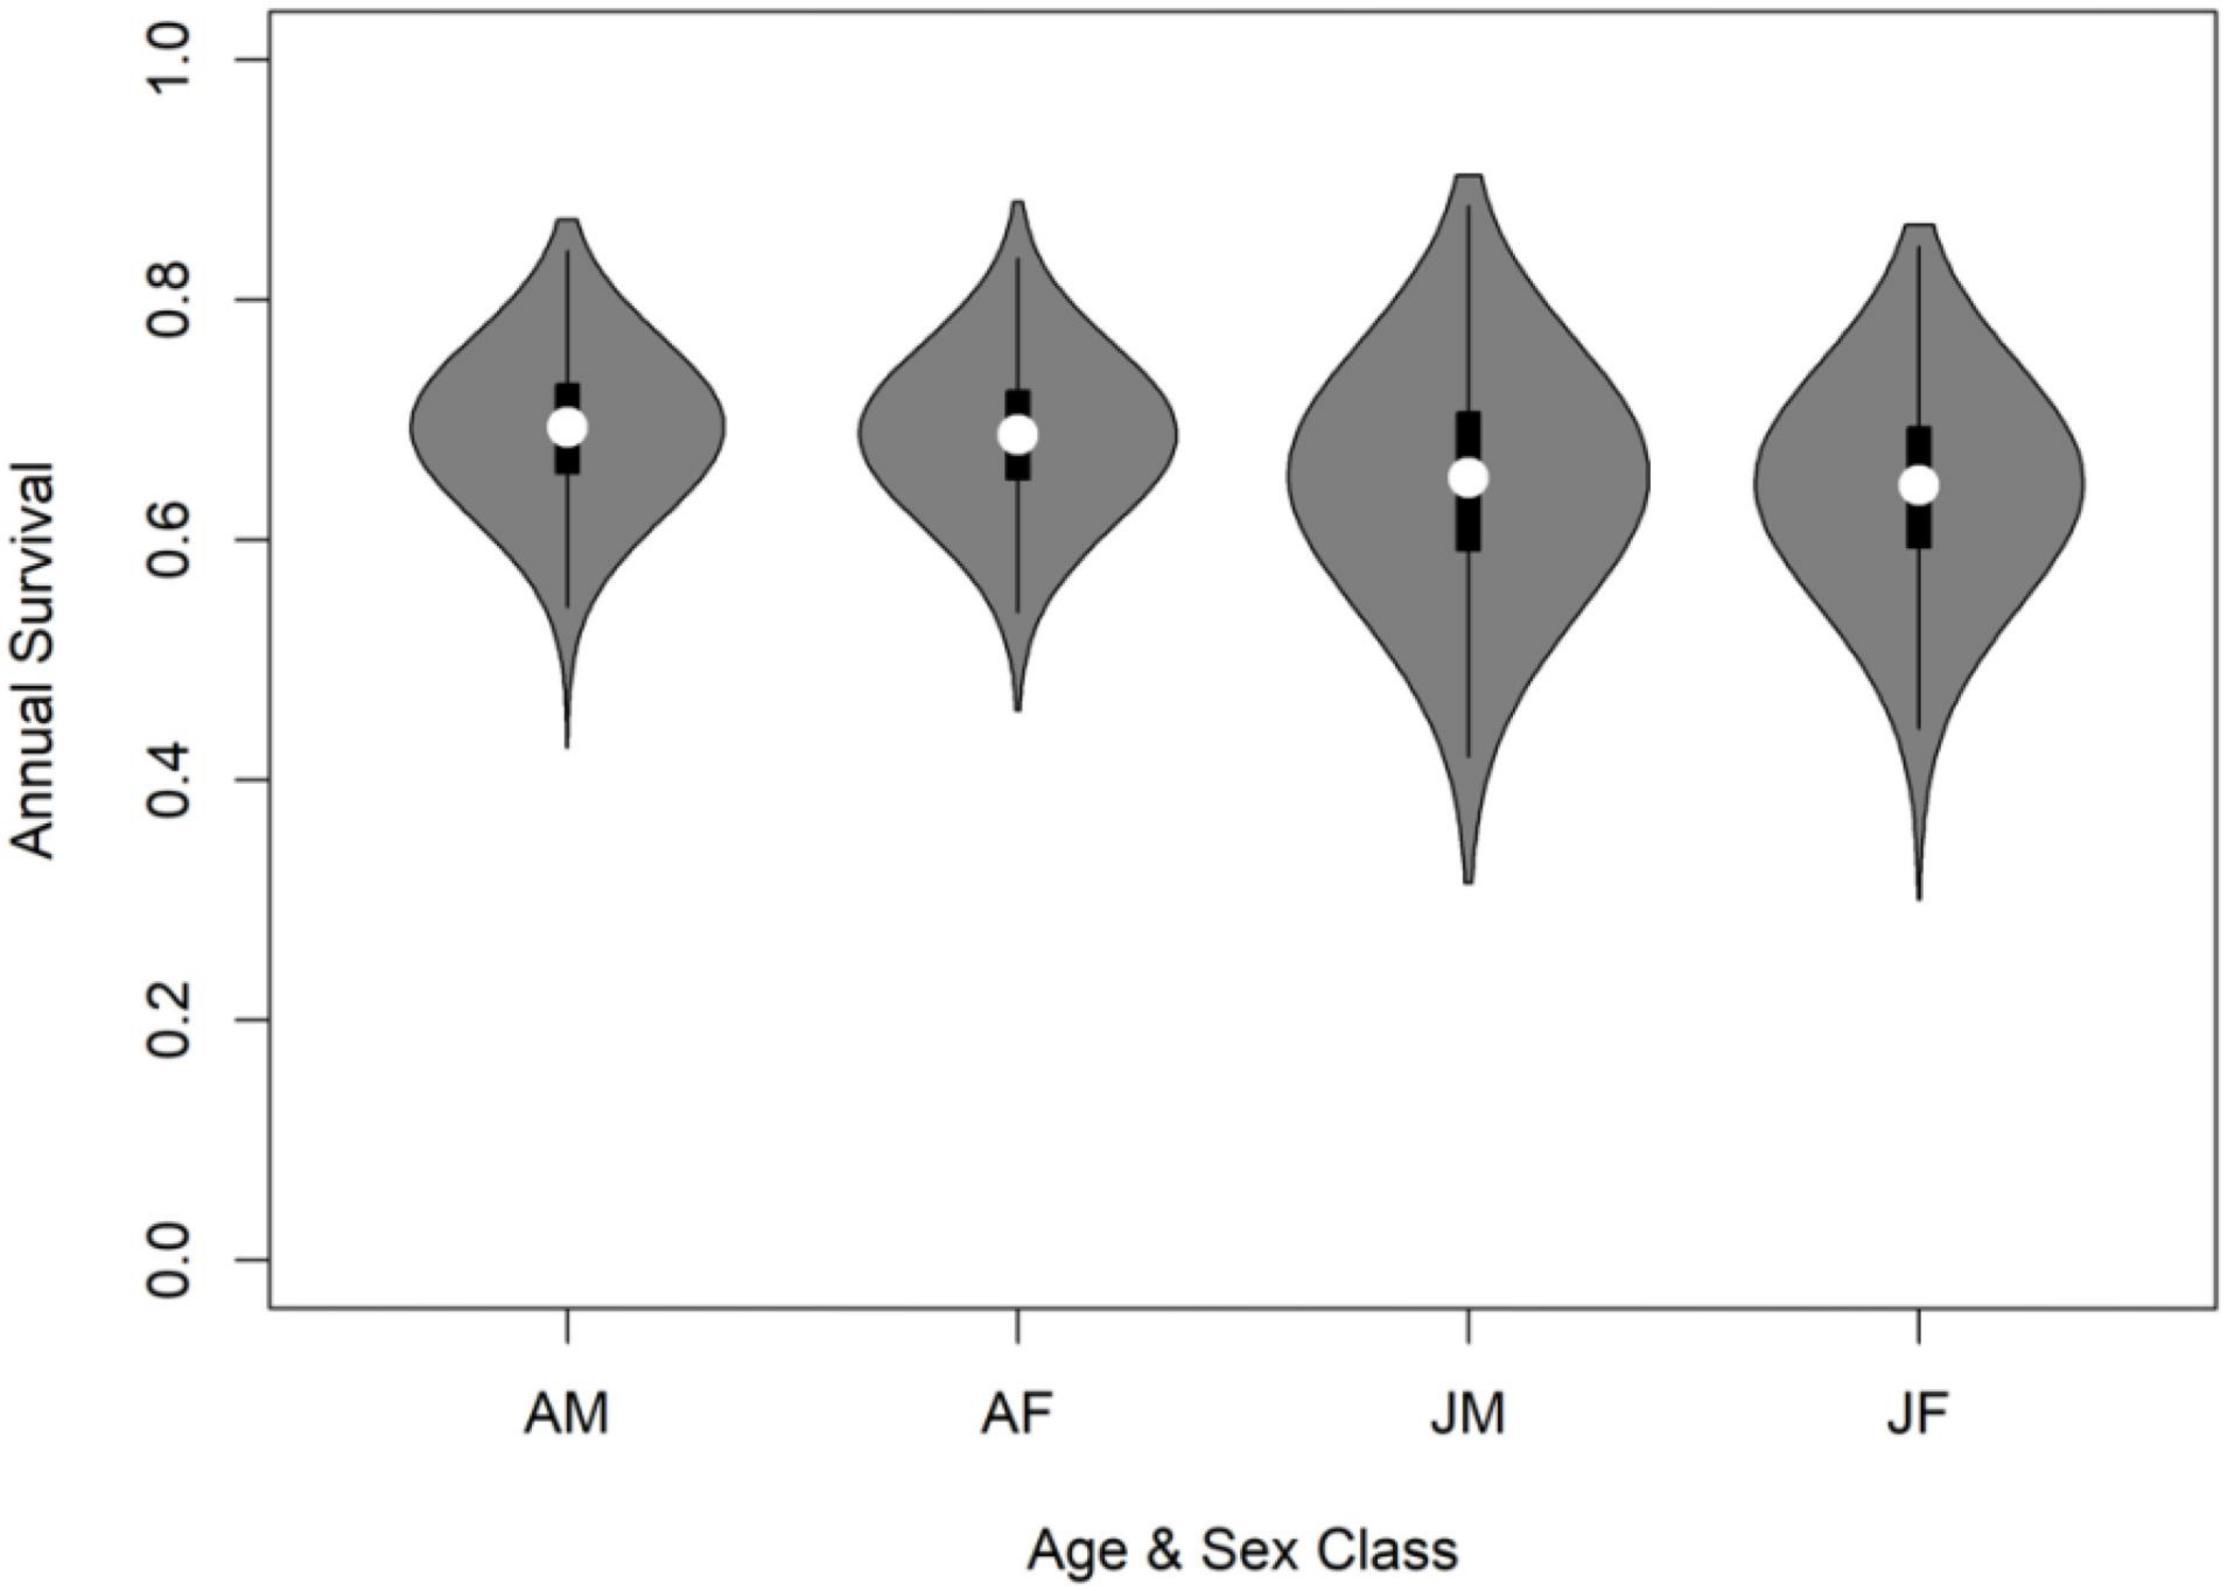
Figure 3. Summary statistics of annual survival estimates of gray wolves (Canis lupus) in Minnesota, United States, 2004–2019, where wolves were categorized according to age class and sex (AM = adult-male, AF = adult-female, JM = pup/juvenile male, JF = pup/juvenile female). Open circle indicates median estimate from posterior distribution, thick line indicates interquartile range, thin line indicates 95% Credible Intervals, shaded area indicates kernel density estimation to show the distributional shape of the data.
Based on observed sex and age ratios and inference from our final model, overall annual survival during the study was estimated to be 0.67 (95% CRI: 0.54, 0.79). Our model did not indicate strong evidence that mortality varied by sex [β1 = −0.03, 95% CRI = (−0.55, 0.49), p < 0 = 0.54], or that adults exhibited reduced mortality relative to non-adults [β1 = −0.16, 95% CRI = (−0.71, 0.41), p < 0 = 0.72]. Thus, on average, our model predicted annual survival ranging from 0.65 (95% CRI = 0.49, 0.78) for non-adult females to 0.69 (95% CRI = 0.58, 0.80) for adult males (Table 2 and Figure 3).
Cause-specific mortality analysis reflected the observed data, indicating that most mortality was human-caused. The estimate for increasing human-caused mortality over time was positive, but evidence was not clear, with 95% CRI’s overlapping zero [α = 0.04, 95% CRI = (−0.12, 0.189), Figure 4]. Similarly, the estimate for greater natural mortality in adults was positive, but evidence was unclear [α = 0.44, 95% CRI = (−1.05, 2.10)]. Derived model estimates for mortality causes across age classes were p1 human causes = 0.63 (95% CRI = 0.45, 0.78), p2 natural mortality = 0.27 (95% CRI = 0.14, 0.43), and p3 unknown causes = 0.10 (95% CRI = 0.03, 0.21) for adults; and p1 = 0.68 (95% CRI = 0.37, 0.88), p2 = 0.20 (95% CRI = 0.14, 0.43), and p3 = 0.12 (95% CRI = 0.02, 0.36) for sub-adults, respectively. The cumulative incidence function revealed the contributions of different mortality sources, as a proportion of total mortality, where the hazard increased over time according to our top model (Figure 4).
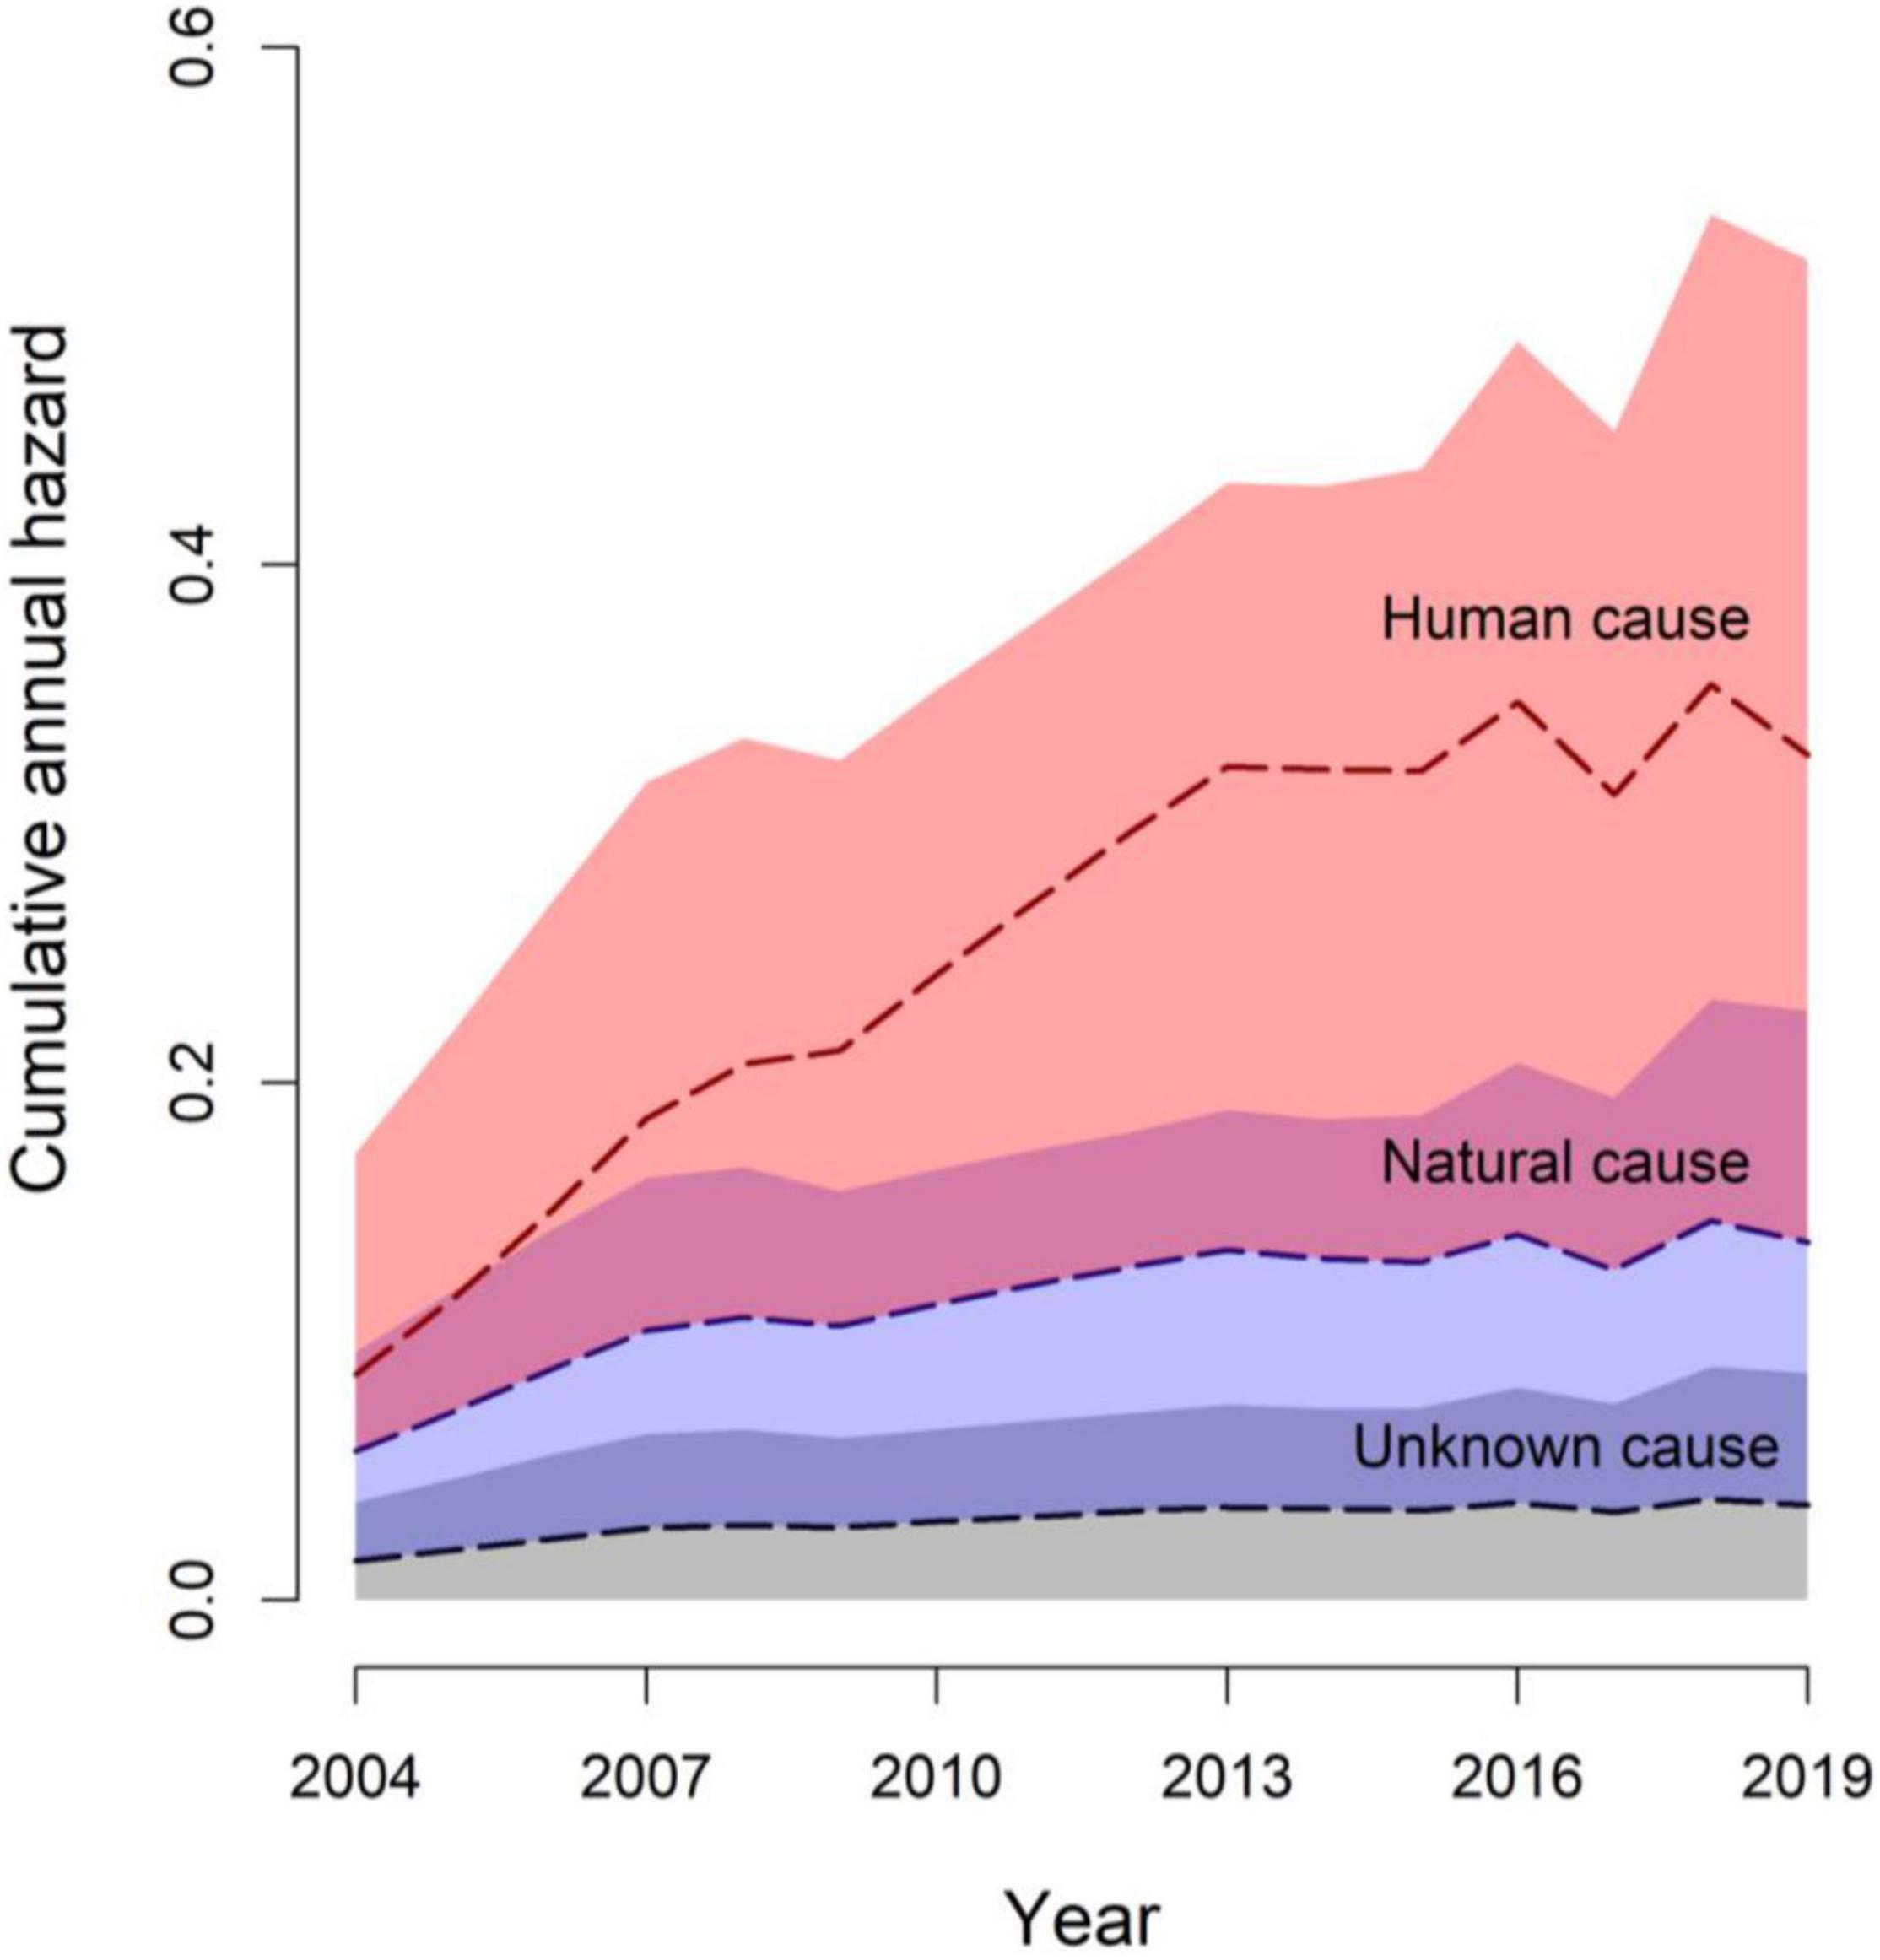
Figure 4. Cumulative incidence function representing proportion of total annual gray wolf (Canis lupus) mortality (cumulative annual hazard) from unknown (gray shade), natural (lavender shade), and human (apricot shade) causes over 16 years in Minnesota, United States, 2004–2019. Overlapping shades represent uncertainty in mortality sources as well as the estimated cumulative annual hazard.
Discussion
Survival is a key determinant of population growth and persistence, and computation and understanding of this metric is key to successful population management (e.g., O’Neil et al., 2017) and understanding our relationship with wolves (Treves and Bruskotter, 2014). Foremost, our results indicate a gradual increase in hazard and associated decline in median annual wolf survival in Minnesota over 16 years (Figure 2). While our results likely hint toward lower overall survival in Minnesota’s wolves during the study period than the contiguous populations in Wisconsin and Michigan (Table 3), populations in those two states over our study timeframe were growing rapidly as wolves recolonized and recovered (Stenglein et al., 2015; O’Neil et al., 2020). In contrast, the Minnesota wolf population was not in a consistent growth phase during most of the period of our analysis. Carnivore species often show higher survival in years when the population expands into new range or is recovering, while the rate diminishes as it nears carrying capacity because of density dependent factors such as competition and territoriality (Banerjee and Jhala, 2012; Cubaynes et al., 2014; O’Neil et al., 2017). The temporal trajectory of our study possibly mirrors a similar trend where higher survival rates were documented in the earlier periods of the time series (first 8–9 years) than the later (last 6–7 years) (Figure 2). The higher mortality in the later part of the time series might be because of intra-specific competition for food and space, density dependent population regulation, as well as human-induced causes. Wolf survey counts indicate that the population in Minnesota increased until 2007–2008 to about 2,500–3,000 individuals, reaching relative stability thereafter (Erb and Humpal, 2021), potentially corroborating density dependence as a mechanism that likely dampened annual survival and population growth. In addition, this population has expanded its distribution into areas with greater human population density and development (Figure 1).
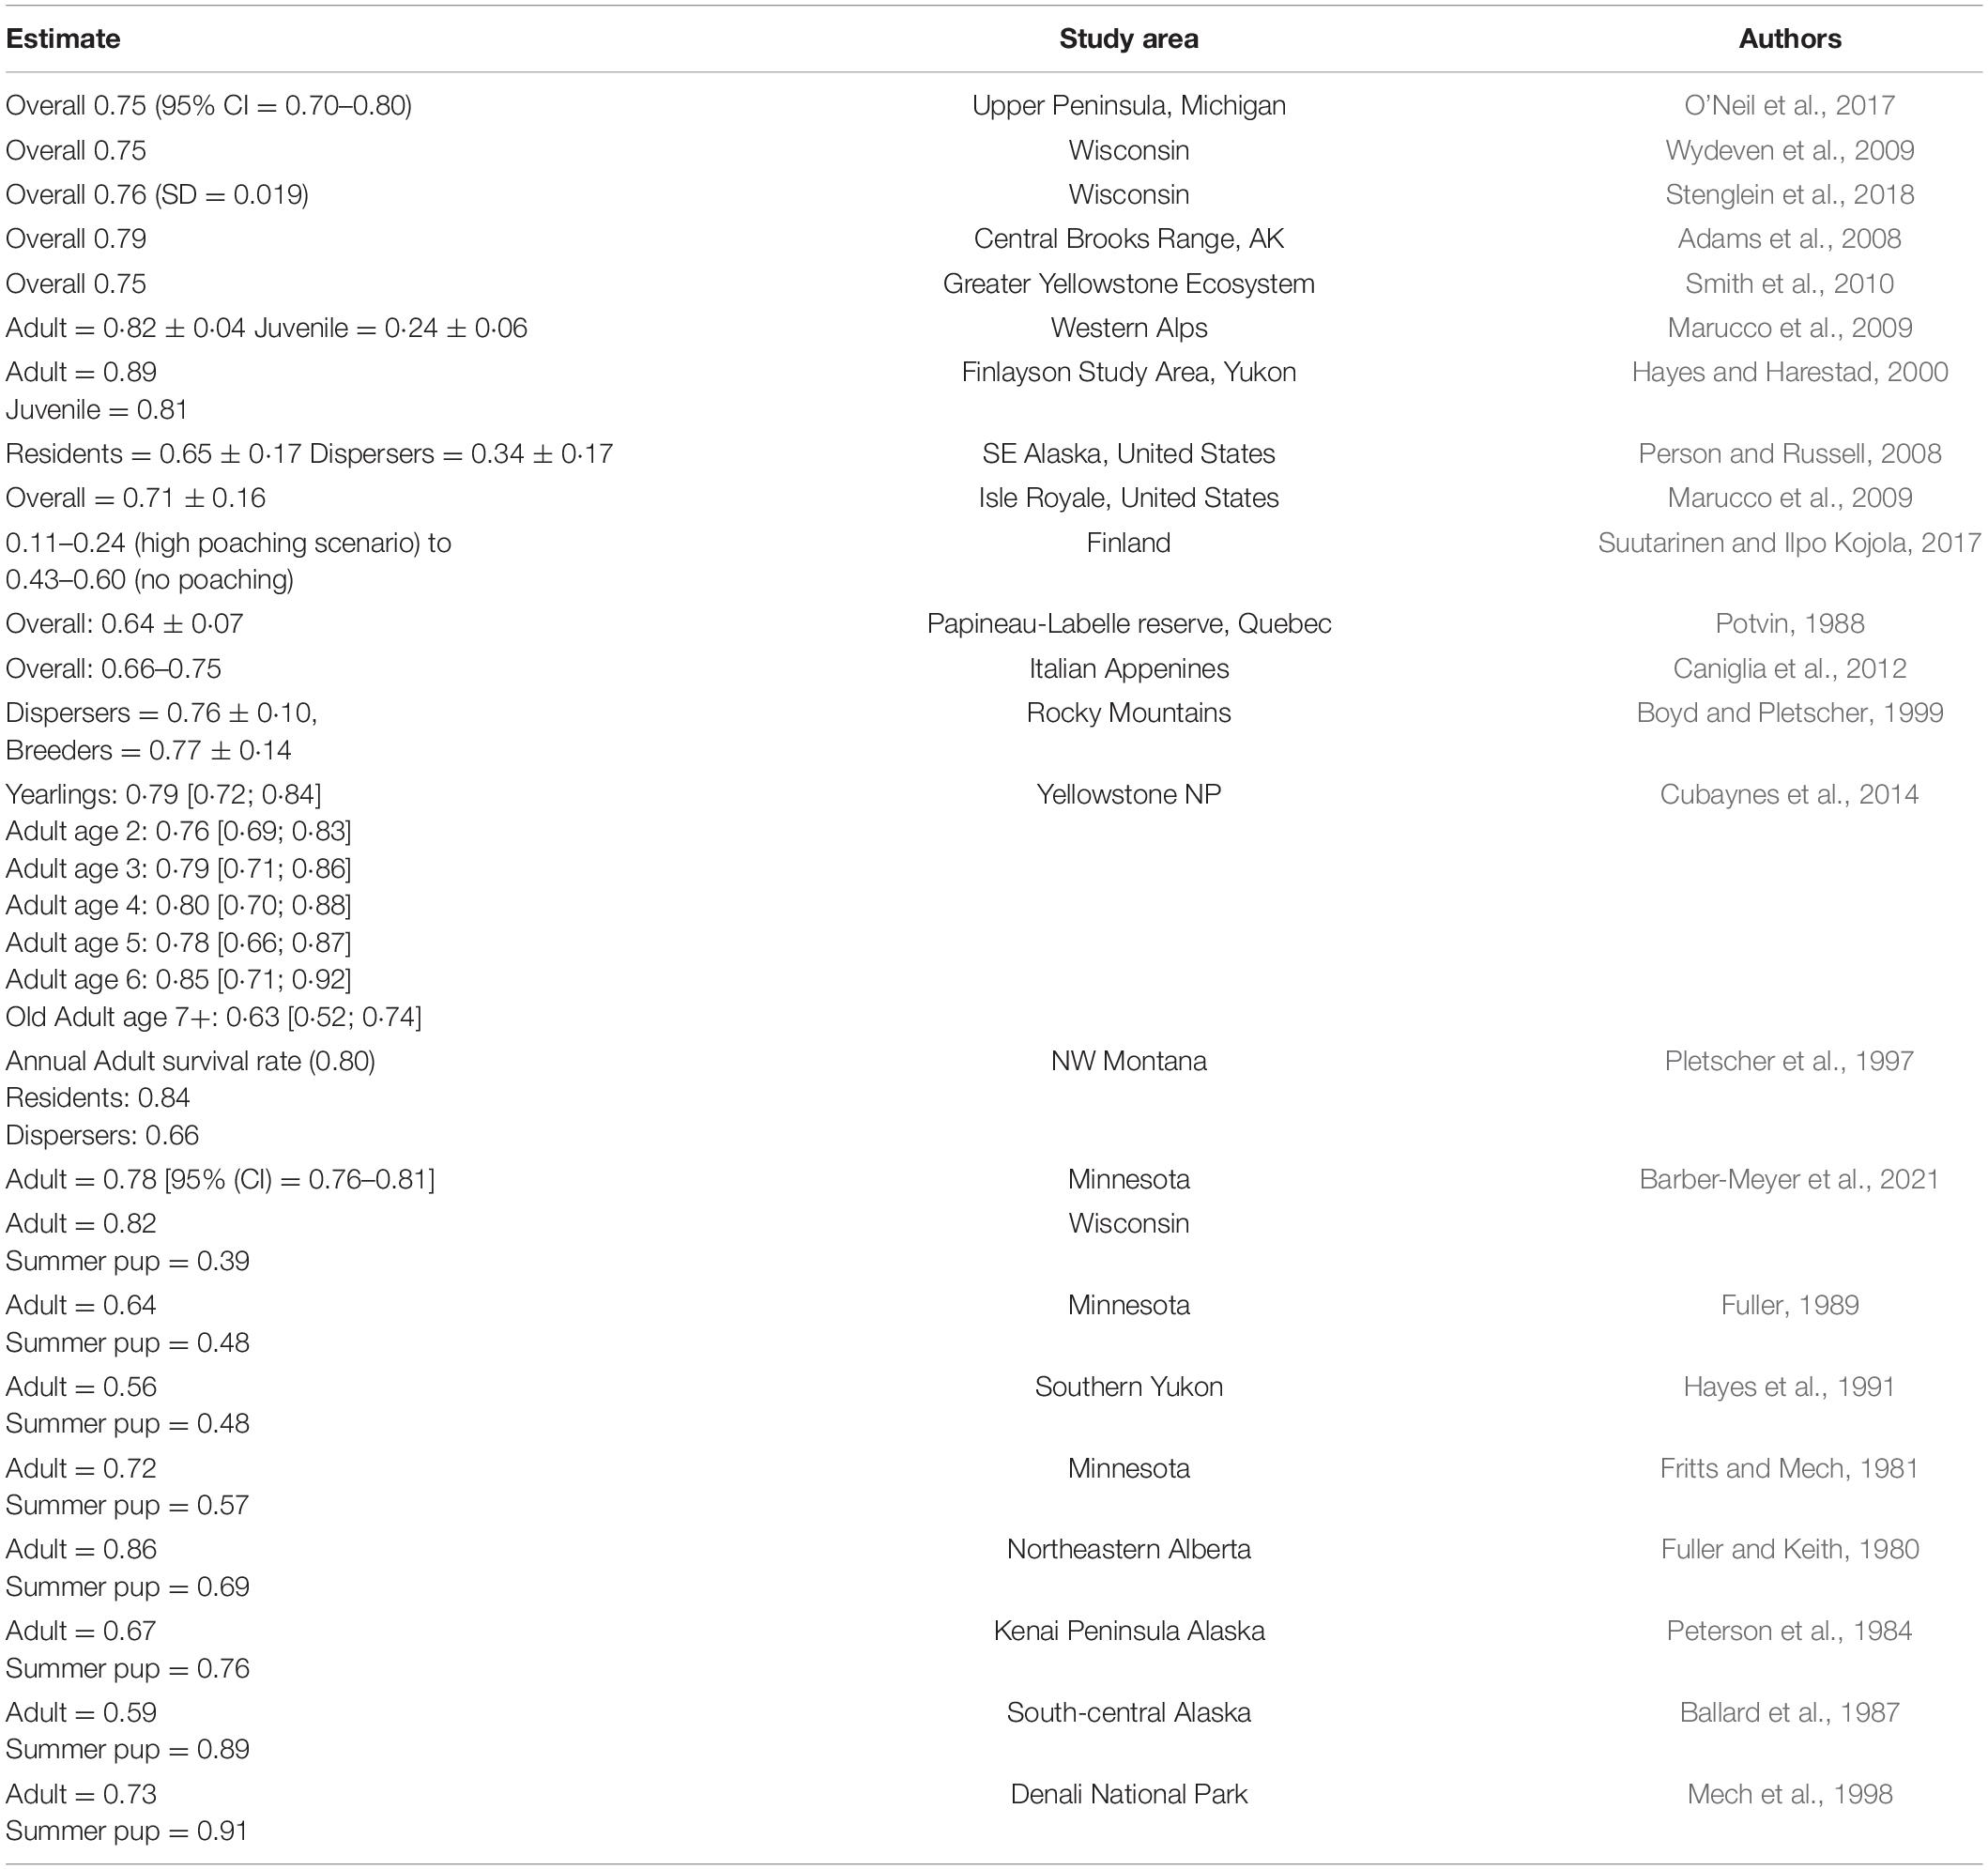
Table 3. Survival estimates of wolf populations from contemporary literature (not necessarily exhaustive).
Although the most recent years when legal public harvest was allowed (2012–2014) were not characterized by significant alteration in survival rates, human-induced mortalities were the most common reason for wolf deaths in Minnesota, as was the case in adjoining populations in Michigan’s Upper Peninsula (O’Neil et al., 2017) and Wisconsin (Stenglein et al., 2015). Human-caused mortality also showed a positive temporal trend, but we recommend caution in interpreting this owing to the lack of statistical strength. Anthropogenic causes resulted in ∼66% of known mortalities, which includes legal and illegal killing, and vehicular collisions. The road and highway network have expanded in Minnesota over the past 50 years and the state governance has committed to further increase this network till 2040 (Minnesota Transport Alliance, 2011). Vehicular collisions continue to cause wolf deaths in Minnesota, and they likely can increase because of increase in road networks.
Although we did not detect any significant age- or sex-specific differences in annual survival rates of wolves, wolf behavior suggests younger dispersing wolves are often more vulnerable to mortality (Mech and Boitani, 2010). Dispersal events often compel young wolves to navigate around or across risky unfamiliar wolf territories and human-dominated landscapes and roads, thereby reducing their survival chances (Barber-Meyer et al., 2021). More information from younger/dispersing wolves is necessary to confirm such patterns.
While we evaluated extensive and long-term data on collared wolves, we acknowledge that fate could only be confirmed for ∼40% of the collared wolves. Data from the remaining individuals had to be censored owing to the lack of information following endpoints when either the collar failed or contact was lost. It is possible that censoring and mortality could be confounded in some cases, i.e., if censored wolves died and collars failed in such a way that the mortality went undetected (Liberg et al., 2012; Stenglein et al., 2018), but we found no evidence or reason to indicate that to be of concern here. First, the author team included those who work directly with collared wolves within the study area, with experiences indicating that known collar loss and failure has been extremely common among marked individuals. Further, there is little reason to believe that the circumstances (e.g., illegal killing followed by destruction of the transmitter) causing such misclassification are common in our study region; illegal kills are commonly detected as a mortality cause. Second, most prevailing literature from neighboring regions with similar socio-political environments suggests that the percentage of wolves with lost collars that may have confounded the detection of dead wolves has been quite low (< 1%, Stenglein et al., 2015b), thereby reducing any significant positive survival biases in our interpretations. Finally, in the Bayesian shared frailty model that we have used to analyze survival, the censored endpoint for a given wolf does not depend on a survival assumption beyond the endpoint. Instead, the assumption is that the wolf continues to exhibit the expected survival rate (given the model) beyond the point of censoring. While misclassification of a large number of dead wolves as censored could ultimately result in optimistic survival estimates, all indications suggest this type of error is rare. Having incorporated these checks and balances, we are confident in the survival estimates from our analysis.
Our results provide baseline information on the recent trend in annual survival rate of and cause specific mortality of wolves in Minnesota. These demographic parameters would be helpful to inform policy decisions for wolves in the Great Lakes population. Future research exploring site-specific variability in these demographic parameters can provide spatial contexts to the trends that we have reported here and augment our current understanding of the Great Lakes wolf population. Studies have revealed that spatially varying survival rates can be crucial for prioritizing management actions within a landscape, wherein certain areas can be “riskier” for carnivores (characterized by lower survival) and act as population sinks (Robinson et al., 2008; Stenglein et al., 2015a; O’Neil et al., 2017; Barber-Meyer et al., 2021). Identification of such source-sink dynamics through the characterization of area-specific variation in population parameters is important to successful monitoring and management, especially where the population is or has been increasing in number and distribution, and human-caused mortality is a significant contributor to annual survival. Such analyses would also provide fine-scale patterns of survival in protected and non-protected areas (e.g., Barber-Meyer et al., 2021), within core wolf areas versus expanding frontiers, and on tribal lands where cultural differences toward wolf recovery manifest. Additionally, an increase in number and distribution of wolves expands the human-wolf interface, thereby increasing risk of conflicts. Hence, we recommend continued monitoring of collared wolves to further investigate temporal and spatial patterns of mortality and survival amidst shifting management authority (e.g., state, federal, tribal), landscape conditions, and public attitudes.
Data Availability Statement
The original contributions presented in this study are included in the article/supplementary material, further inquiries can be directed to the corresponding author.
Ethics Statement
All research protocols were undertaken by the Minnesota Department of Natural Resources (MN DNR) as per their guidelines and regulations.
Author Contributions
JE, SO, and JB conceptualized the study. SO and SC performed the analysis with guidance from JE, CH, and JB. SC prepared the manuscript with critical feedback from SO, JE, CH, and JB. All authors contributed to the article and approved the submitted version.
Funding
Funding for data collection was provided by the Minnesota Department of Natural Resources [funded in part by the Wildlife Restoration Program (Pittman-Robertson)]. Support for the analysis and manuscript preparation was provided by the University of Minnesota. This research was also supported by grants from the National Science Foundation to JB (NSF ID#1545611, NSF ID#1556676).
Conflict of Interest
The authors declare that the research was conducted in the absence of any commercial or financial relationships that could be construed as a potential conflict of interest.
Publisher’s Note
All claims expressed in this article are solely those of the authors and do not necessarily represent those of their affiliated organizations, or those of the publisher, the editors and the reviewers. Any product that may be evaluated in this article, or claim that may be made by its manufacturer, is not guaranteed or endorsed by the publisher.
Acknowledgments
We would like to thank the Minnesota Department of Natural Resources personnel for collecting and sharing data, the Fond du Lac and Red Lake Tribal Resource Departments and the 1854 Treaty Authority for assistance with capturing or monitoring some wolves used in the analysis, and the University of Minnesota for support. Since the manuscript was written (in most part) during the pandemic lockdown, SC wants to specifically thank his family and friends for the mental support through the long periods of solitude.
Footnotes
References
Adams, L. G., Stephenson, R. O., Dale, B. W., Ahgook, R. T., and Demma, D. J. (2008). Population dynamics and harvest characteristics of wolves in the central Brooks Range, Alaska. Wildl. Monogr. 170, 1–25. doi: 10.2193/2008-012
Ballard, W. B., Whitman, J. S., and Gardner, C. L. (1987). Ecology of an exploited wolf population in south-central Alaska. Wildl. Monogr. 3–54.
Banerjee, K., and Jhala, Y. V. (2012). Demographic parameters of endangered Asiatic lions (Panthera leo persica) in Gir forests, India. J. Mammal. 93, 1420–1430. doi: 10.1644/11-MAMM-A-231.1
Barber-Meyer, S. M., Wheeldon, T. J., and Mech, L. D. (2021). The importance of wilderness to wolf (Canis lupus) survival and cause-specific mortality over 50 years. Biol. Conserv. 258:109145. doi: 10.1016/j.biocon.2021.109145
Boyd, D. K., and Pletscher, D. H. (1999). Characteristics of dispersal in a colonizing wolf population in the central Rocky Mountains. J. Wildl. Manage. 63, 1094–1108.
Bruskotter, J. T. (2013). The predator pendulum revisited: social conflict over wolves and their management in the western United States. Wildl. Soc. 37, 674–679. doi: 10.1002/wsb.293
Bruskotter, J. T., Vucetich, J. A., Enzler, S., Treves, A., and Nelson, M. P. (2014). Removing protections for wolves and the future of the US Endangered Species Act (1973). Conserv. Lett. 7, 401–407. doi: 10.1111/conl.12081
Caniglia, R., Fabbri, E., Cubaynes, S., Gimenez, O., Lebreton, J. D., and Randi, E. (2012). An improved procedure to estimate wolf abundance using non-invasive genetic sampling and capture-recapture mixture models. Conserv. Genet. 13, 53–64. doi: 10.1007/s10592-011-0266-1
Cardillo, M., Purvis, A., Sechrest, W., Gittleman, J. L., Bielby, J., Mace, G. M., et al. (2004). Human population density and extinction risk in the world’s carnivores. PLoS Biol. 2:e197. doi: 10.1371/journal.pbio.0020197
Caughley, G. (1994). Directions in conservation biology. J. Anim. Ecol. 63, 215–244. doi: 10.2307/5542
Cross, P. C., Maichak, E. J., Rogerson, J. D., Irvine, K. M., and Scurlock, B. M. (2015). Estimating the phenology of elk brucellosis transmission with hierarchical models of cause-specific and baseline hazards. J. Wild. Manage. 79, 739–748. doi: 10.1002/jwmg.883
Cubaynes, S., MacNulty, D. R., Stahler, D. R., Quimby, K. A., Smith, D. W., and Coulson, T. (2014). Density-dependent intraspecific aggression regulates survival in northern Yellowstone wolves (Canis lupus). J. Anim. Ecol. 83, 1344–1356. doi: 10.1111/1365-2656.12238
DeCesare, N. J., Hebblewhite, M., Lukacs, P. M., and Hervieux, D. (2016). Evaluating sources of censoring and truncation in telemetry-based survival data. J. Wildl. Manage. 80, 138–148. doi: 10.1002/jwmg.991
Erb, J., and Benson, S. (2004). Distribution and Abundance of Wolves in Minnesota, 2003-04. Saint Paul, MN: Minnesota Department of Natural Resources.
Erb, J., and Humpal, C. (2021). Minnesota wolf Population Update 2020. Saint Paul, MN: Minnesota Department of Natural Resources.
Erb, J., and Sampson, B. (2013). Distribution and Abundance of Wolves in Minnesota, 2012-13. Saint Paul, MN: Minnesota Department of Natural Resources.
Ford, A. T., and Goheen, J. R. (2015). Trophic cascades by large carnivores: a case for strong inference and mechanism. Trends Ecol. Evol. 30, 725–735. doi: 10.1016/j.tree.2015.09.012
Fritts, S. H., and Mech, L. D. (1981). Dynamics, movements, and feeding ecology of a newly protected wolf population in northwestern Minnesota. Wildl. Monogr. 80, 3–79.
Fuller, T. K. (1989). Population dynamics of wolves in north-central Minnesota. Wildl. Monogr. 3–41.
Fuller, T. K. (1991). Effect of snow depth on wolf activity and prey selection in north central Minnesota. Can. J. Zool. 69, 283–287. doi: 10.1139/z91-044
Fuller, T. K., and Keith, L. B. (1980). Wolf population dynamics and prey relationships in northeastern Alberta. J. Wildl. Manage. 583–602. doi: 10.7939/R36D5PC1F
Gable, T. D., and Windels, S. K. (2018). Kill rates and predation rates of wolves on beavers. J. Wildl. Manage. 82, 466–472. doi: 10.1002/jwmg.21387
Gable, T. D., Windels, S. K., Bruggink, J. G., and Homkes, A. T. (2016). Where and how wolves (Canis lupus) kill beavers (Castor canadensis). PLoS One 11:e0165537. doi: 10.1371/journal.pone.0165537
Gable, T. D., Windels, S. K., and Homkes, A. T. (2018). Do wolves hunt freshwater fish in spring as a food source? Mamm. Biol. 91, 30–33. doi: 10.1016/j.mambio.2018.03.007
Garshelis, D. L., Noyce, K. V., and St-Louis, V. (2020). Population reduction by hunting helps control human–wildlife conflicts for a species that is a conservation success story. PLoS One 15:e0237274. doi: 10.1371/journal.pone.0237274
Gusset, M., Stewart, G. B., Bowler, D. E., and Pullin, A. S. (2010). Wild dog reintroductions in South Africa: a systematic review and cross-validation of an endangered species recovery programme. J. Nat. Conserv. 18, 230–234. doi: 10.1016/j.jnc.2009.11.001
Halstead, B. J., Wylie, G. D., Coates, P. S., Valcarcel, P., and Casazza, M. L. (2012). Regional inference for wildlife survival. Anim. Conserv. 15, 117–124. doi: 10.1111/j.1469-1795.2011.00495.x
Hayes, R. A., and Harestad, A. S. (2000). Demography of a recovering wolf population in the Yukon. Can. J. Zool. 78, 36–48. doi: 10.1139/z99-186
Hayes, R. D., Baer, A. M., and Larsen, D. G. (1991). Population Dynamics and Prey Relationships of an Exploited and Recovering Wolf Population in the Southern Yukon. (Whitehorse: Yukon Fish and Wildlife Branch Rep.).
Heisey, D. M. (2012). Frailty models for wildlife survival inference. Anim. Conserv. 15, 127–128. doi: 10.1002/bimj.201800280
Heisey, D. M., and Patterson, B. R. (2006). A review of methods to estimate cause-specific mortality in presence of competing risks. J. Wild. Manage. 70, 1544–1555. doi: 10.2193/0022-541X(2006)70[1544:AROMTE]2.0.CO;2
Hervey, S. D., Rutledge, L. Y., Patterson, B. R., Romanski, M. C., Vucetich, J. A., Belant, J. L., et al. (2021). A first genetic assessment of the newly introduced Isle Royale gray wolves (Canis lupus). Conserv. Gen. 22, 913–926. doi: 10.1007/s10592-021-01373-y
Homkes, A. T., Gable, T. D., Windels, S. K., and Bump, J. K. (2020). Berry important? Wolf provisions pups with berries in northern Minnesota. Wildl. Soc. 44, 221–223. doi: 10.1002/wsb.1065
Jachowski, D. S., Gitzen, R. A., Grenier, M. B., Holmes, B., and Millspaugh, J. J. (2011). The importance of thinking big: large-scale prey conservation drives black-footed ferret reintroduction success. Biol. Conserv. 144, 1560–1566. doi: 10.1016/j.biocon.2011.01.025
Jansen, D., and Logan, T. (2002). Improving Prospects for the Florida Panther.” Endangered Species Update, vol. 19, no. 2, Mar.-Apr. 2002, pp. S16+. Farmington Hills, MI: Gale Academic.
Jhala, Y., Gopal, R., Mathur, V., Ghosh, P., Negi, H. S., Narain, S., et al. (2021). Recovery of tigers in India: critical introspection and potential lessons. People Nat. 3, 281–293. doi: 10.1002/pan3.10177
Jhala, Y. V., Banerjee, K., Chakrabarti, S., Basu, P., Singh, K., Dave, C., et al. (2019). Asiatic lion: ecology, economics, and politics of conservation. Front. Ecol. Evol. 7:312. doi: 10.3389/fevo.2019.00312
Kellner, K. (2019). jagsUI: A Wrapper Around ‘rjags’ to Streamline ‘JAGS’ Analyses. R Package Version 1.5.1.
Lamb, C. T., Mowat, G., Reid, A., Smit, L., Proctor, M., McLellan, B. N., et al. (2018). Effects of habitat quality and access management on the density of a recovering grizzly bear population. J. Appl. Ecol. 55, 1406–1417. doi: 10.1111/1365-2664.13056
Liberg, O., Chapron, G., Wabakken, P., Pedersen, H. C., Hobbs, N. T., and Sand, H. (2012). Shoot, shovel and shut up: cryptic poaching slows restoration of a large carnivore in Europe. Proc. R. Soc. B 279, 10–915. doi: 10.1098/rspb.2011.1275
Marucco, F., Pletscher, D. H., Boitani, L., Schwartz, M. K., Pilgrim, K. L., and Lebreton, J. D. (2009). Wolf survival and population trend using non-invasive capture-recapture techniques in the Western Alps. J. Appl. Ecol. 46, 1003–1010. doi: 10.1111/j.1365-2664.2009.01696.x
Mech, L. D., Adams, L. G., Meier, T. J., Burch, J. W., and Dale, B. W. (1998). The Wolves of Denali. Minneapolis, Min: University of Minnesota.
Mech, L. D., and Boitani, L. (2010). “Wolf social ecology,” in Wolves, eds L. D. Mech and L. Boitani (Chicago, IL: University of Chicago Press), 1–34.
Mech, L. D., Harper, E. K., Meier, T. J., and Paul, W. J. (2000). Assessing factors that may predispose Minnesota farms to wolf depredations on cattle. Wildl. Soc. Bull. 28, 623–629.
Moore, D. F. (2016). Applied Survival Analysis Using R. New York, NY: Springer. doi: 10.1007/978-3-319-31245-3
Nowak, S., and Mysłajek, R. W. (2016). Wolf recovery and population dynamics in Western Poland, 2001–2012. Mamm. Res. 61, 83–98. doi: 10.1007/s13364-016-0263-3
O’Neil, S. T., Bump, J. K., and Beyer, D. E. Jr. (2017). Spatially varying density dependence drives a shifting mosaic of survival in a recovering apex predator (Canis lupus). Ecol. Evol. 7, 9518–9530. doi: 10.1002/ece3.3463
O’Neil, S. T., Vucetich, J. A., Beyer, D. E. Jr., Hoy, S. R., and Bump, J. K. (2020). Territoriality drives preemptive habitat selection in recovering wolves: implications for carnivore conservation. J. Anim. Ecol. 89, 1433–1447. doi: 10.1111/1365-2656.13199
Person, D. K., and Russell, A. L. (2008). Correlates of mortality in an exploited wolf population. J. Wildl. Manage. 72, 1540–1549. doi: 10.2193/2007-520
Peterson, R. O., Woolington, J. D., and Bailey, T. N. (1984). Wolves of the Kenai peninsula, Alaska. Wildl. Monogr. 3–52.
Potvin, F. (1988). Wolf movements and population dynamics in Papineau-Labelle reserve, Quebec. Can. J. Zool. 66, 1266–1273. doi: 10.1139/z88-185
Pletscher, D. H., Ream, R. R., Boyd, D. K., Fairchild, M. W., and Kunkel, K. E. (1997). Population dynamics of a recolonizing wolf population. J. Wildl. Manage. 61, 459–465. doi: 10.2307/3802604
Plummer, M. (2003). “JAGS: “a program for analysis of Bayesian graphical models using Gibbs sampling,” in Proceedings of the 3rd International Workshop on Distributed Statistical Computing, Vol. 124, eds K. Hornik, F. Leisch, and A. Zeileis (Vienna: Vienna University of Technology), 125.
R Core Team (2020). R: A Language and Environment for Statistical Computing. Vienna: R Foundation for Statistical Computing.
Ripple, W. J., and Beschta, R. L. (2012). Trophic cascades in Yellowstone: the first 15 years after wolf reintroduction. Biol. Conserv. 145, 205–213. doi: 10.1016/j.biocon.2011.11.005
Ripple, W. J., Estes, J. A., Beschta, R. L., Wilmers, C. C., Ritchie, E. G., Hebblewhite, M., et al. (2014). Status and ecological effects of the world’s largest carnivores. Science 343:1241484. doi: 10.1126/science.1241484
Ritchie, E. G., Elmhagen, B., Glen, A. S., Letnic, M., Ludwig, G., and McDonald, R. A. (2012). Ecosystem restoration with teeth: what role for predators? Trends Ecol. Evol. 27, 265–271. doi: 10.1016/j.tree.2012.01.001
Robinson, H. S., Wielgus, R. B., Cooley, H. S., and Cooley, S. W. (2008). Sink populations in carnivore management: cougar demography and immigration in a hunted population. Ecol. Appl. 18, 1028–1037. doi: 10.1890/07-0352.1
Smith, D. W., Bangs, E. E., Oakleaf, J. K., Mack, C., Fontaine, J., Boyd, D., et al. (2010). Survival of colonizing wolves in the northern Rocky Mountains of the United States, 1982-2004. J. Wildl. Manage. 74, 620–634. doi: 10.2193/2008-584
Spiegelhalter, D. J., Best, N. G., Carlin, B. P., and van der Linde, A. (2014). The deviance information criterion: 12 years on. J. R. Stat. Soc. B 76, 485–493. doi: 10.1111/rssb.12062
Stenglein, J. L., Van Deelen, T. R., Wydeven, A. P., Mladenoff, D. J., Wiedenhoeft, J. E., Businga, N. K., et al. (2015b). Mortality patterns and detection bias from carcass data: an example from wolf recovery in Wisconsin. J. Wildl. Manage. 79, 1173–1184. doi: 10.1002/jwmg.922
Stenglein, J. L., Wydeven, A. P., and Van Deelen, T. R. (2018). Compensatory mortality in a top recovering carnivore: wolves in Wisconsin, USA (1979-2013. Oecologia 187, 99–111. doi: 10.1007/s00442-018-4132-4
Suutarinen, J., and Kojola, I. (2017). Poaching regulates the legally hunted wolf population in Finland. Biol. Conserv. 215, 11–18. doi: 10.1016/j.biocon.2017.08.031
Treves, A., and Bruskotter, J. (2014). Tolerance for predatory wildlife. Science 344, 476–477. doi: 10.1126/science.1252690
Van Ballenberghe, V., Erickson, A. W., and Byman, D. (1975). Ecology of the timber wolf in northeastern Minnesota. Wildl. Monogr. 43, 3–43.
Vehtari, A., Gabry, J., Magnusson, M., Burkner, P., Paananen, T., and Gelman, A. (2020). Loo: Efficient Leave-One-Out Cross-validation and WAIC for Bayesian Models. R Package Version 2.4.1. Available online at: https://mc-stan.org/loo/
Vehtari, A., Gelman, A., and Gabry, J. (2017). Practical Bayesian model evaluation using leave-one-out cross-validation and WAIC. Stat. Comput. 27, 1413–1432. doi: 10.1007/s11222-016-9696-4
Keywords: carnivore management, demography, Endangered Species Act, known-fate, long-term monitoring, radiotelemetry
Citation: Chakrabarti S, O’Neil ST, Erb J, Humpal C and Bump JK (2022) Recent Trends in Survival and Mortality of Wolves in Minnesota, United States. Front. Ecol. Evol. 10:826358. doi: 10.3389/fevo.2022.826358
Received: 30 November 2021; Accepted: 19 May 2022;
Published: 21 June 2022.
Edited by:
Timothy Van Deelen, University of Wisconsin-Madison, United StatesReviewed by:
Jennifer Stenglein, Wisconsin Department of Natural Resources, United StatesMark Hebblewhite, University of Montana, United States
Brenna Cassidy, University of Montana, United States, in collaboration with reviewer MH
Copyright © 2022 Chakrabarti, O’Neil, Erb, Humpal and Bump. This is an open-access article distributed under the terms of the Creative Commons Attribution License (CC BY). The use, distribution or reproduction in other forums is permitted, provided the original author(s) and the copyright owner(s) are credited and that the original publication in this journal is cited, in accordance with accepted academic practice. No use, distribution or reproduction is permitted which does not comply with these terms.
*Correspondence: Stotra Chakrabarti, c2NoYWtyYWJAbWFjYWxlc3Rlci5lZHU=, c3RvdHJhY2hha3JhYmFydGlAZ21haWwuY29t