 Esther Githumbi1,2*
 Behnaz Pirzamanbein3
 Johan Lindström4
 Anneli Poska5
 Ralph Fyfe6
 Florence Mazier7
 Anne Brigitte Nielsen8
 Shinya Sugita9Anna-Kari Trondman10Jessie Woodbridge6
 Marie-José Gaillard1
- 1Department of Biology and Environmental Science, Linnaeus University, Kalmar, Sweden
- 2Department of Physical Geography and Ecosystem Science, University of Lund, Lund, Sweden
- 3Department of Statistics, University of Lund, Lund, Sweden
- 4Centre for Mathematical Sciences, University of Lund, Lund, Sweden
- 5Division of Quaternary Geology, Department of Geology, Tallin University of Technology, Tallin, Estonia
- 6School of Geography, Earth and Environmental Sciences, University of Plymouth, Plymouth, United Kingdom
- 7Environmental Geography Laboratory, Université de Toulouse Jean Jaurès, GEODE UMR-CNRS 5602, Toulouse, France
- 8Department of Geology, University of Lund, Lund, Sweden
- 9School of Natural Sciences and Health, Institute of Ecology, Tallinn University, Tallinn, Estonia
- 10Division of Education Affairs, Swedish University of Agricultural Science (SLU), Alnarp, Sweden
Realistic and accurate reconstructions of past vegetation cover are necessary to study past environmental changes. This is important since the effects of human land-use changes (e.g. agriculture, deforestation and afforestation/reforestation) on biodiversity and climate are still under debate. Over the last decade, development, validation, and application of pollen-vegetation relationship models have made it possible to estimate plant abundance from fossil pollen data at both local and regional scales. In particular, the REVEALS model has been applied to produce datasets of past regional plant cover at 1° spatial resolution at large subcontinental scales (North America, Europe, and China). However, such reconstructions are spatially discontinuous due to the discrete and irregular geographical distribution of sites (lakes and peat bogs) from which fossil pollen records have been produced. Therefore, spatial statistical models have been developed to create continuous maps of past plant cover using the REVEALS-based land cover estimates. In this paper, we present the first continuous time series of spatially complete maps of past plant cover across Europe during the Holocene (25 time windows covering the period from 11.7 k BP to present). We use a spatial-statistical model for compositional data to interpolate REVEALS-based estimates of three major land-cover types (LCTs), i.e., evergreen trees, summer-green trees and open land (grasses, herbs and low shrubs); producing spatially complete maps of the past coverage of these three LCTs. The spatial model uses four auxiliary data sets—latitude, longitude, elevation, and independent scenarios of past anthropogenic land-cover change based on per-capita land-use estimates (“standard” KK10 scenarios)—to improve model performance for areas with complex topography or few observations. We evaluate the resulting reconstructions for selected time windows using present day maps from the European Forest Institute, cross validate, and compare the results with earlier pollen-based spatially-continuous estimates for five selected time windows, i.e., 100 BP-present, 350–100 BP, 700–350 BP, 3.2–2.7 k BP, and 6.2–5.7 k BP. The evaluations suggest that the statistical model provides robust spatial reconstructions. From the maps we observe the broad change in the land-cover of Europe from dominance of naturally open land and persisting remnants of continental ice in the Early Holocene to a high fraction of forest cover in the Mid Holocene, and anthropogenic deforestation in the Late Holocene. The temporal and spatial continuity is relevant for land-use, land-cover, and climate research.
1. Introduction
Anthropogenically-induced climate change has been at the center of global interest for several decades. The reduction of fossil carbon emissions and mitigation of greenhouse gas effects on Earth's climate is currently one of the major challenges faced by human kind (Jia et al., 2019). Many mitigation strategies involve considerable changes in global land use, such as large-scale afforestation of former agrarian lands as well as natural and semi-natural grasslands in order to increase the carbon uptake and storage capacity of terrestrial land cover (Law et al., 2018; Forster et al., 2021). Due to the complex biogeophysical and -chemical processes and interactions between the Earth's surface and atmosphere, changes in natural and/or anthropogenic land-cover can lead to positive (enhancing) or negative (reducing) feedback on climate systems (Strandberg et al., 2014; Davin et al., 2020). Examples of expected land cover and climate changes can be found by studying the interactions of the vegetation and environment during the last interglacial period (the Holocene). The quantitative reconstructions of past land cover are therefore an important information source for disentangling natural and anthropogenic components of land cover change, which in turn help determine the effects of long-term land use on Earth's climate and predict the possible implications of the intended large-scale afforestation effort (Roberts et al., 2018).
Model-based simulations have demonstrated that the amplitude and direction of estimated climate change due to changes in land cover is spatially highly heterogeneous, but can have a considerable impact on temperature and precipitation in some regions (Cherubini et al., 2018). Changes in bio-geophysical forcings due to large-scale de/re-forestation alter the radiation balance by changing the albedo of the Earth's surface (Strandberg et al., 2014; Strandberg and Kjellström, 2019; Davin et al., 2020). In addition to the effect on the carbon cycle and CO2 emissions, other biogeochemical forcings, such as emissions of biogenic volatile organic compounds, derived from land cover, can also have a considerable impact on the Earth's radiation balance by changing the amount of secondary organic aerosols in the atmosphere and hence the reflective properties of cloud cover (Sporre et al., 2019).
Modern observations or potential natural vegetation descriptions derived from climate-driven model simulations have been the main source of the land-cover estimates used in climate models while simulating past or future climate (Strandberg et al., 2014). These choices often lead to over-estimations when modern heavily deforested land cover is applied to past climate simulations. It can also lead to underestimations of forest cover when potential natural land cover is used for simulating future climates without including anthropogenic land cover. Further, past land-cover descriptions in climate models vary greatly due to differences in estimation methods. Studies comparing estimates of past land-cover composition derived using different methods and data sources reveal discrepancies across space and time (Gaillard et al., 2010; Kaplan et al., 2017; Zanon et al., 2018; Chevalier et al., 2020).
Global land use is recognized as an important feature of land-climate interaction. Historically land use is estimated to account for 35% of the anthropogenic atmospheric CO2 (Foley, 2005; Ward and Mahowald, 2015). Studies, such as Strandberg et al. (2014) and Cherubini et al. (2018), have demonstrated regional climate sensitivity to land-use activity. Spatially and temporally continuous data are needed to investigate the interactions between land-use/land-cover change and climate. Regional to continental scale land-use data has mainly been in the form of model-derived anthropogenic land-cover change scenarios (ALCCs), based on estimates of per capita land use and past population density (Kaplan et al., 2011; Klein Goldewijk et al., 2017). Efforts to produce past land-use estimates based on archaeological and historical data have led to the development of a new land-use classification for global syntheses (Morrison et al., 2021). The latter is part of the Past Global Change (PAGES) LandCover6k working group initiative to upscale archaeological information on land use across the world and produce land-use maps for selected time slices of the Holocene, which has previously not been possible due to large differences in terminology. These archaeology-based land-use maps, with the addition of per capita land-use estimates, are used together with pollen-based REVEALS estimates of land cover to evaluate and improve ALCCs (Gaillard et al., 2018; Harrison et al., 2020).
Reliable reconstructions of past land cover are crucial for improving our understanding of past land cover interactions with climate, forming a robust basis for reliable palaeoclimate simulations and future scenario testing. However, developing reliable reconstructions of past vegetation has been a major challenge. Pollen-based quantitative land-cover reconstructions utilize data sources directly linked to actual plant cover and can therefore be considered the most reliable sources of information regarding past vegetation dynamics across the globe. Efforts to improve our understanding of past vegetation using pollen have led to the development of models that can compensate for plant species-specific differences in pollen production, dispersal, and deposition.
The landscape reconstruction algorithm (LRA) with its two models REVEALS (Regional Estimates of Vegetation Abundance from Large Sites) and LOVE (LOcal Vegetation Estimates) was developed by Sugita (2007b) and Sugita (2007a) to translate pollen counts to vegetation cover proportions at both regional and local scales. REVEALS is a generalized form of the R-value model (Davis, 1963) and estimates the mean regional vegetation composition of plant taxa in proportions (dimensionless) for a large region using pollen records from large lakes (> ca. 50 ha). Both REVEALS and LOVE models reduce biases due to inter-taxonomic differences in pollen productivity and basin size (Sugita, 2007a). The REVEALS model was tested and validated in Europe (Hellman et al., 2008a,b; Soepboer et al., 2010; Mazier et al., 2012) and northern America (Sugita et al., 2010). The REVEALS model was used by Trondman et al. (2015) to produce the first generation of gridded pollen-based estimates of plant cover for five selected time slices of the Holocene between 6 k BP and present in a large part of Europe. Recently, Githumbi et al. (ESSD, in review) achieved a new (second generation) set of gridded pollen-based REVEALS plant-cover estimates for 31 taxa, 12 PFTs (Plant Functional Types) and 3 LCTs, at a spatial scale of 1° × 1° (ca. 100 × 100 km) across 30°–75°N, 25°W–50°E (Europe and a part of the Eastern Mediterranean Black Sea Caspian corridor) including reconstructions for 25 time windows covering the Holocene (last 11700 years) at 500-year-steps (Fyfe et al., 2021). The effects of uneven spatial coverage of pollen-based reconstructions can be reduced by using complementary datasets related to land-cover composition with full spatial coverage. We have used a combination of the above-described pollen-based reconstructions and a set of auxiliary variables describing geographic position (latitude, longitude, and elevation) and land-use history (ALCCs from the KK10 model). REVEALS and KK10 were used as inputs as inputs of a Bayesian statistical model developed by Pirzamanbein et al. (2018) in order to produce a set of spatially continuous reconstructions of past land cover applicable as inputs to climate models. KK10 estimates deforestation of Europe using a GIS-based model driven by human population growth according to McEvedy and Jones (1978, p. 368) back to 3,000 years before present and Lemmen (2009) earlier in the Holocene, and constrained by environmental factors that limit suitability of areas for agriculture (Kaplan et al., 2009, 2011). Possible error sources include uncertainty in population and environmental condition estimations since the main assumption is that land is primarily cleared for agriculture.
2. Data
Altogether 1,128 pollen records containing over 16,000 samples were used. These records were collected from several public databases. The databases include the European Pollen Database (Fyfe et al., 2009); the Alpine Palynological database (ALPADABA; Institute of Plant Sciences, now archived in EPD); the Czech Quaternary palynological database (PALYCZ; Kuneš et al., 2009) and PALEOPYR (Lerigoleur et al., 2015). Pollen data archives from research projects in the Mediterranean region (Fyfe et al., 2018; Woodbridge et al., 2018) and the Eastern Mediterranean-Black Sea-Caspian-Corridor (Marinova et al., 2018) and contributions from individuals were also used. Gridded pollen-based REVEALS estimates were grouped into three major land-cover types (LCTs: B, broad-leaved forest; C, coniferous forest; O, open land) for Europe and 25 time-windows covering the last 11700 years (the Holocene, see Figures 4–6). Similarly to Trondman et al. (2015) the samples were grouped into 100–500 year time-windows [present–100, 100–350, 350–700, 700–1200, 1200–1700 until 11700 calibrated years before present (BP = AD 1950)]. Higher total pollen count per time window ensures a higher quality REVEALS estimate. The records are from 29 European countries and the Eastern Mediterranean Black Sea-Caspian corridor. The gridded REVEALS estimates are available from Pangaea (Fyfe et al., 2021).
Data on the current land cover of Europe (cover proportions for coniferous and broad-leaved forests and total forest cover) were obtained from the forest maps compiled by the European Forest Institute (EFI) using the remotely sensed data (NOAA-AVHRR) and statistical data from national inventories (Päivinen et al., 2001; Schuck et al., 2002; Kempeneers et al., 2012). The dataset was downloaded from the EFI webpage1 and thereafter up-scaled by averaging the original 1 × 1 km resolution to 1° × 1° resolution.
2.1. Covariates
For the spatial reconstruction of the REVEALS-based estimates of LCTs we used the spatial structure in the data (see Section 3) together with four auxiliary variables. The auxiliary variables primarily support the reconstructions in regions with few pollen observations and include the following variables, which can be expected to have causal links to the LCTs:
Geographical coordinates longitude (10°W–56°E) and latitude (36°–71°N) of each gridcell.
Elevation average elevation of each gridcell obtained from the Shuttle Radar Topography Mission (SRTM, Farr et al., 2007)2 and
KK10 Data on anthropogenic deforestation in Europe derived from KK10, provides a fraction of agrarian land cover at 5′ × 5′ spatial and annual temporal resolution (Kaplan et al., 2009). Several different estimates of anthropogenic deforestation exist, among these the standard scenario of KK10 was chosen for its good correlation with REVEALS estimates (Kaplan et al., 2017). To achieve temporal and spatial compatibility with REVEALS land-cover estimates, the KK10 derived data was up-scaled by averaging into 1° × 1° spatial resolution and temporal resolution matching the REVEALS time-windows (see above).
Elevation together with the geographical coordinates capture the large scale geographical variability of the LCTs while the KK10 scenarios provide information about the fraction of open land resulting from human land use. Compared to previous spatial interpolations of LCTs (Pirzamanbein et al., 2014, 2018), we have added the geographical coordinates, but excluded output from a dynamic vegetation model (DVM, such as LPJ-GUESS c.f. Smith et al., 2001). A sensitivity study (Pirzamanbein et al., 2020) indicated limited added value from the DVM.
3. Spatial Statistical Model
To model the pollen-based land-cover proportions, a Bayesian hierarchical model developed by Pirzamanbein et al. (2018) was used. Figure 1 shows the empirical forward model where the direction of the arrows imply that unknown parameters affect the unknown latent variables which in turn affect the observations, or data. Reconstructions were obtained by inverting the model and computing the posterior of the latent variables given observations.
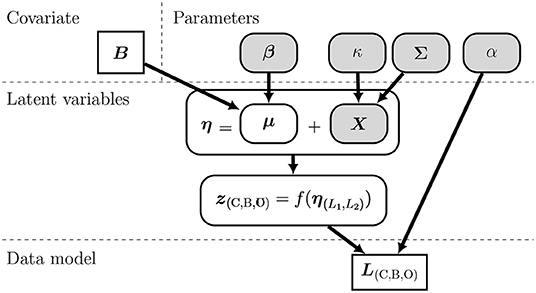
Figure 1. Hierarchical graph describing the conditional dependencies between observations (white rectangle) and parameters (gray rounded rectangles) to be estimated. The white rounded rectangles are computed based on the estimations. In a generalized linear mixed model framework, η is the linear predictor—consisting of a regression term, μ, and a spatial random effect, X. The link function, f(η), transforms between linear predictor and proportions, which are matched to the observed land cover proportions, L(C,B,O), using a Dirichlet distribution.
We model the pollen-based REVEALS estimates of land cover, L = (C, B, O), as a Dirichlet distribution. The advantage of using a Dirichlet distribution is that it directly captures the limits of compositional data, e.g.: (1) all elements are between 0 and 1, 0 < C, B, O < 1, and (2) the sum of all elements is 1, C + B + O = 1; It has been shown that the Dirichlet distribution outperforms reconstructions obtained using transformed Gaussian observations (see, Pirzamanbein et al., 2018, for details.). The Dirichlet distribution,
has two main parameters: a concentration parameter, α, controlling the dispersion of the observations, and a proportion of land cover in each grid cell, z(s). A link function, f : ℝ2 → (0, 1)3, is then used to map between the proportions, z = (zC, zB, zO) and the linear predictor, η = (ηL1, ηL2) as (zC, zB, zO) = f(ηL1, ηL2). Here we used an inverse additive log transformation (alr−1) (Aitchison, 1982) for f. The alr and its inverse are given by:
Note here that the transformation ensures that the proportions, z, were restricted to values between 0 and 1, and sum to 1 (as required by proportions) while leaving the linear predictor, η, free to take any values in ℝ2. Thus, removing any restrictions on the linear predictor, but reducing the dimension from three components in z to two components in η.
The linear predictor,
consist of a mean structure, μ and a spatially dependent random effect, X. The mean structure was modeled as a linear regression; μ = Bβ, that is, a combination of covariates, B, and regression coefficients, β. The covariates consisted of intercept, geographical coordinates (longitude and latitude), elevation and KK10-derived land cover (Section 2.1 for more detail). While the regression coefficients were estimated from REVEALS data, it is this estimation that made the model reasonably robust to different covariate choices (Pirzamanbein et al., 2020).
The random effect was modeled using spatial statistics in the form of a Gaussian Markov random field (GMRF) (Rue and Held, 2004); the GMRF-formulation provides computational advantages drastically reducing the time needed for estimation (Pirzamanbein et al., 2018). The resulting model for X takes the form of a multivariate Gaussian distribution,
where, Q(κ)−1 is the precision matrix (or inverse covariance matrix) of a GMRF (Lindgren et al., 2011) characterizing the spatial dependence between grid-cells; Σ is a 2 × 2 matrix where the diagonal elements represent the variance of each latent field and the off-diagonal elements represent the covariance between the fields; and ⊗ is a Kronecker-product. The spatial range parameter, κ in Q(κ), determines how similar the LCTs are between near by grid-cells, with smaller values indicating stronger similarity (or large spatial homogeneity) (Figure 2).
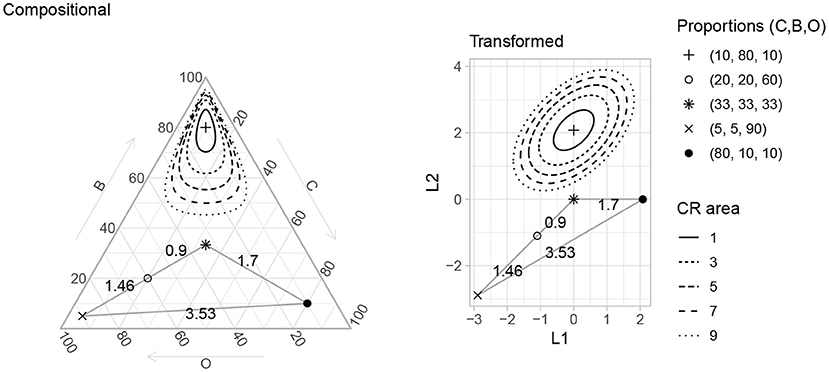
Figure 2. Example of compositional distance (Equation 3) and area of confidence region (CRs) for a few selected points and sizes of CRs. Both the compositional data (left—C, Coniferous; B, Broad-leaved; O, Open land) and transformed [right—L1 and L2 are transformed compositional values from Equation (2)] are shown. Note that distances increase toward the edge of the compositional triangle (e.g., when one component goes to 0) due to the additive log transformation.
All parameters (κ and Σ) as well as the spatially interpolated land-cover maps were estimated from data using a Markov Chain Monte Carlo (MCMC; Brooks et al., 2011) algorithm with 100000 samples of which the first 10000 were omitted as burn-in (for technical and implementation details see Pirzamanbein et al., 2018). Samples from the MCMC were then averaged to compute land-cover reconstructions as the posterior expectations, or E(z(C,B,O)|L(C,B,O)).
To evaluate model performance, we used a 6-fold cross-validation (CV; Hastie et al., 2001, Ch. 7.10). The cross-validation divided the observations into 6 random groups. Each time, we used data from five of the groups to estimate parameters and compute the posterior expectations for the remaining group, which had been excluded from the estimation. Using the posterior expectations, we then computed the reconstruction error between the excluded data and the reconstructions. The process was repeated until all six groups had been excluded. Since the selection of the six groups was random, we repeated the entire process three times to reduce any bias associated with the random groupings.
To evaluate the reconstructed maps, 1) we compared results from the spatial model for the most recent time window (100 BP-present (Figure 3B) with EFI-FM (Figure 3C), and 2) used the 6-fold cross-validation method for five time periods; 100 BP–present, 350–100 BP, 700–350 BP, 3200–2700 BP, and 6200–5700 BP. As previously demonstrated (Pirzamanbein et al., 2018), the difference between reconstructed LCT proportions and observed values (either with the EFI-FM maps or in the cross validation) were measured using average compositional distance (e.g., a root-mean-squared-error appropriate for compositional data, see Aitchison et al., 2000, for details.). The compositional distance between two values are defined using the transformed compositions, ηL1 and ηL2, from equation 2 as
We also computed the area of confidence region (CR) as measure of uncertainties for reconstructions (Figure 3). Both metrics are illustrated for a few selected values in Figure 2.
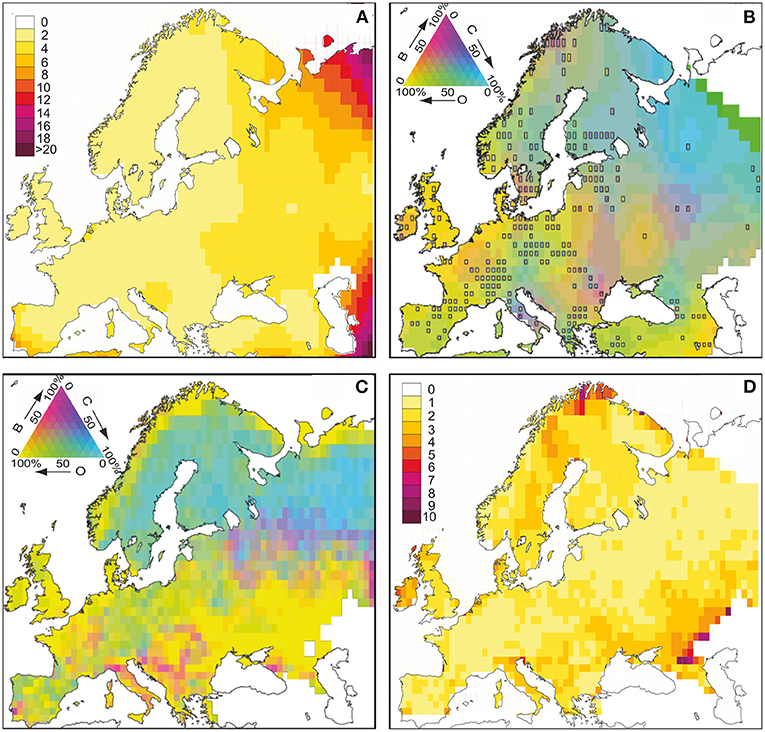
Figure 3. Validation datasets of major land-cover types (LCTs: B, broad-leaved forest; C, coniferous forest; O, open land), area of confidence region (CR) and compositional distance (CD) estimates. (A) CR (100 BP–present): area of confidence regions for 100 BP–present time-window (smaller values are better, see Figure 2 for examples of CRs); (B) 100 BP–present: reconstructed proportions of LCTs in Europe for the most recent time window; (C) EFI-FM: observed modern LCT proportions according to the European forest institute forest map (Päivinen et al., 2001); (D) compositional distance (EFI-FM vs. 100 BP–present): composition distance between EFI-FM and 100 BP–present reconstructions.
4. Results
4.1. Evaluation of Reconstructed Maps
Below (sections 4, 5), the terms “reconstruction” and “reconstructed” refer to the spatial-statistical model-based land cover reconstructions (maps; see Spatial Statistical Model section) unless it is specified that we refer to pollen-based REVEALS land-cover reconstructions. The compositional distance (CD) between the reconstructions for 100 BP–present time-window and the EFI-FM map are shown in Figure 3D. The result shows the highest CD in north Norway and north-west Caspian sea. For the 100 BP–present time window, the average CD between the reconstructed map and EFI-FM is 1.46 which is similar to the 1.47 and 1.48 errors reported for previous reconstructions (Pirzamanbein et al., 2018, 2020). The values of the area of confidence region (CR-smaller values indicate higher confidence, see Figure 2 for an example.) show that the reconstructions of the remote areas in north-eastern and south-eastern Europe where we have no REVEALS data are of considerably lower quality than the rest of Europe. Therefore, the grid cells where the CR > 9 were omitted from the spatial reconstructions (Figure 3B).
The 6-fold cross-validation results are shown in Table 1 for the five time periods. The average compositional distance (CVerror) are small indicating a model with good predictive performance. In addition, the standard deviation (sd) among different cross-validation groups are also small indicating very similar CVerror across all groups, and thus an unbiased selection of the grouping in the 6-fold cross-validation.
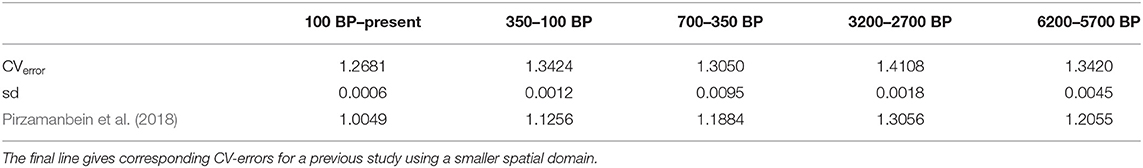
Table 1. Average compositional distance (CVerror) and standard deviation (sd) from three randomly selected six-fold cross-validation for the five time windows; 100 BP–present, 350–100 BP, 700–350 BP, 3200–2700 BP, and 6200–5700 BP.
Most of the available pollen-based REVEALS estimates are located in northern, central, and western Europe (between 42° to 62° N latitude and 10° W to 30° E longitude, see Figures 4–6). This area, due to the high site density, has the lowest compositional errors in the model (Figure 3) and the most reliable reconstructions of land cover.
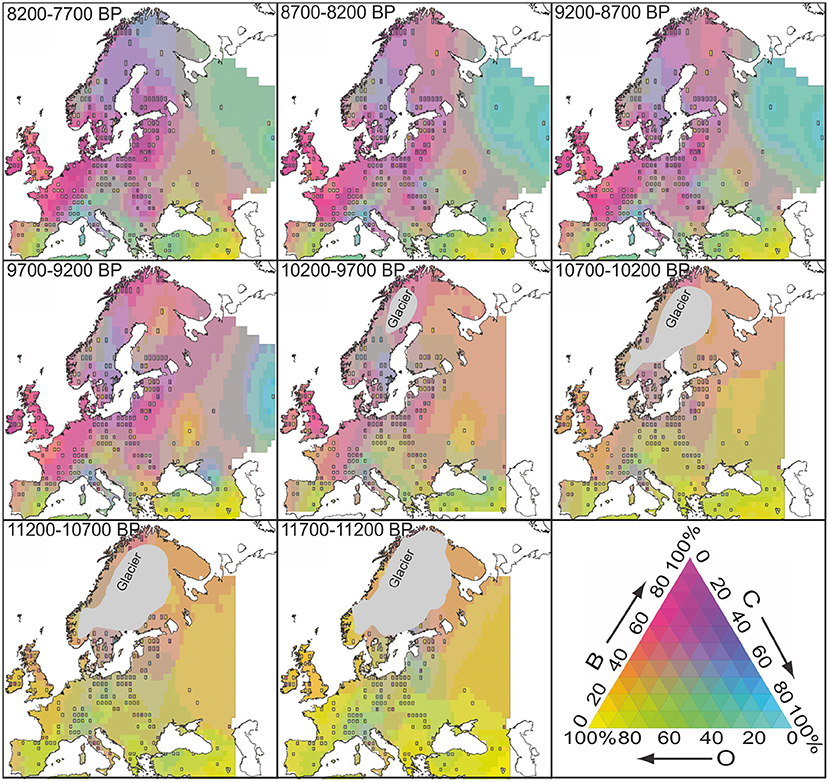
Figure 4. Composite maps of the reconstructed land cover for eight time-windows (11700–7700 BP). The gray area marks the extent of the continental glacier according to Stroeven et al. (2016). The location of REVEALS estimates is marked by squares. The color-key for land-cover composition (C, coniferous forest; B, broad-leaved forest; O, open land) is presented as a triangular color chart.
4.2. Trends in Reconstructed Land-Cover Change 11700 BP to Present
Spatially interpolated reconstructions are available for 25 time-windows from the present to 11700 calibrated years before present as specified in the data section. These reconstructions are available and can be downloaded (details in the Data Availability Statement section). The reconstructed land-cover maps can broadly be divided into three distinct groups, conforming to the climatic tripartite subdivision of the Holocene (Walker et al., 2018): Early Holocene (11700–8200 BP, Figure 4—early interglacial climate amelioration), Middle Holocene (8200–4200 BP, Figures 4, 5—mid interglacial climate optimum), and Late Holocene (4200 BP–present, Figures 5, 6—late interglacial climate deterioration). The first half of the Early Holocene (ca 11700–9700 BP, Figure 3) was characterized by remnants of continental ice in Fennoscandia (Stroeven et al., 2016) and open land cover, with a gradual increase of trees migrating from southern and central Europe. During the second part of the Early Holocene (9700–8200 BP) the afforestation process continued; at the end of this period most of Europe was covered with forests, broad-leaved trees dominated in western Europe and coniferous trees in eastern Europe. Dominance of open land persisted only in steppe areas of south-eastern Europe and the Spanish highlands. The Early Holocene land-cover across Europe was dominated by open land (0.43 open land, 0.33 broad-leaved forest and 0.23 coniferous forest).
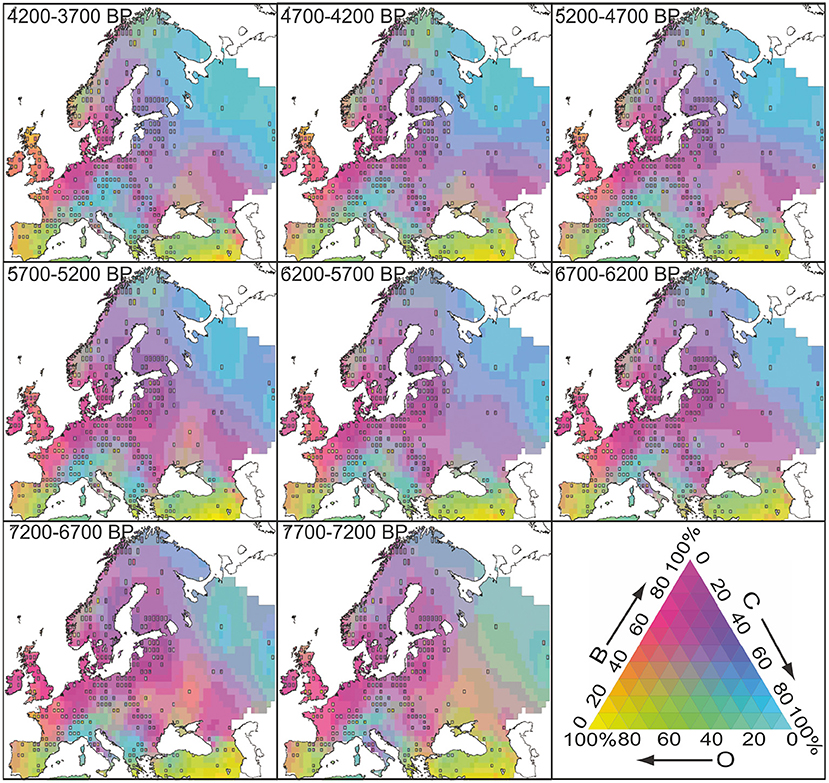
Figure 5. Composite maps of the reconstructed land cover for eight time-windows (7700–3700 BP). The location of REVEALS estimates is marked by squares. The color-key for land-cover composition (C, coniferous forest; B, broad-leaved forest; O, open land) is presented as a triangular color chart.
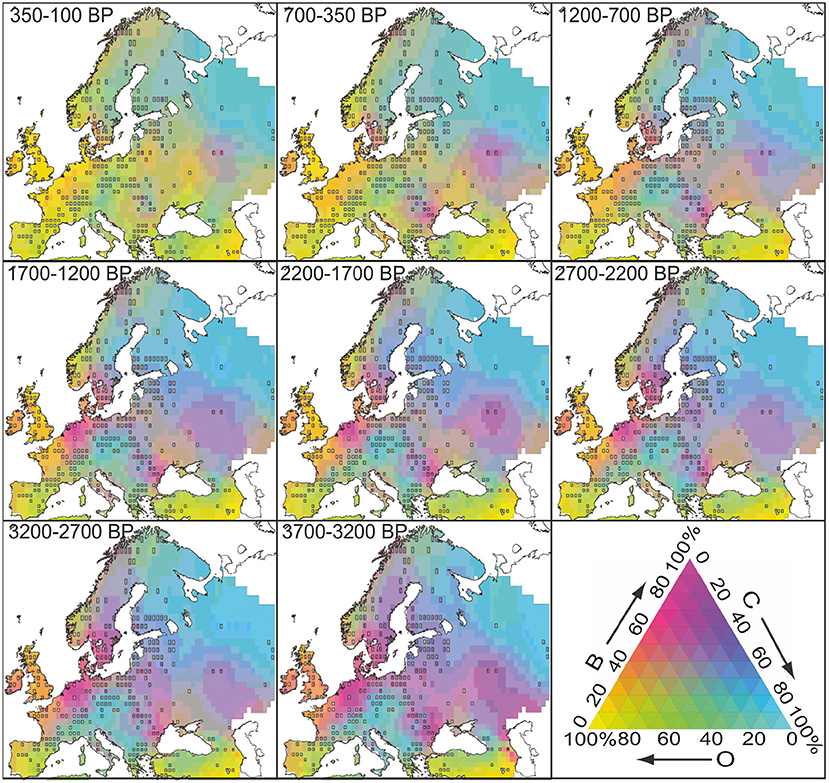
Figure 6. Composite maps of reconstructed land cover for eight time-windows (3700–100 BP). The location of REVEALS estimates is marked by squares. The color-key for land-cover composition (C, coniferous forest; F, broad-leaved forest; O, open land) is presented as a triangular color chart.
The Middle Holocene (8200–4200 BP, Figures 4, 5) was characterized by a large fraction of forest cover. Trees reached higher altitudes/latitudes than today and most of Fennoscandia was forested. The reconstructions suggest that while broad-leaved trees were the major forest component in western and central Europe, coniferous trees were migrating from the south and north-east and began to dominate in north-eastern Europe at the end of the period. Mixed land cover with a higher input of trees developed in the Spanish highlands and the south-east European steppe. An increase in vegetation openness was observable at the end of the Middle Holocene in the UK. Although it is well known from archaeological data, that agriculture expanded through southeastern and southern Europe during this period, the reconstruction suggests that it had relatively little impact on regional scale vegetation openness. The mean values across the Middle Holocene and grid cells are 0.4 broad-leaved forest, 0.3 coniferous forest and 0.3 open land).
During the Late Holocene (4200 BP–present, Figures 5, 6), the replacement of broad-leaved trees with coniferous trees continued. Mixed broad-leaved and coniferous trees were the dominant land-cover type in Europe for the last millennium. The largest change in land cover during the Late Holocene was a major increase in the proportion of open land cover. Most of central Europe lost ca 50% of its former tree cover and large areas of western Europe essentially became treeless. The mean land cover proportions were 0.4 open land, 0.3 broadleaved forest and 0.3 coniferous forest.
5. Discussion
Our discussion focuses on the main factors to consider when using reconstructed land-cover maps that have been interpolated using the Bayesian hierarchical model presented and give examples of potential use.
5.1. Data and Methodology Considerations
The spatial statistical model developed by Pirzamanbein et al. (2014, 2018, 2020) was specifically designed to work with unevenly distributed proportional data. The statistical model is a development of the earlier work and uses REVEALS reconstructions to produce continuous vegetation maps of Europe during the Holocene. The evaluation of the spatial statistical model is similar to that previously used in Pirzamanbein et al. (2018, 2020). The time-periods for cross validation were selected to allow comparison with the results of these studies. Moreover, the cross-validation is extremely computationally-expensive to run, making some limitation a practical necessity.
The major difference from previous reconstructions is the increased spatial domain due to the increase in REVEALS estimates from 636 sites in Trondman et al. (2015) to 1,128 sites used here (Fyfe et al., 2021). The increased temporal and spatial coverage in these reconstructions demonstrates the method's feasibility, as well as minor changes to the choice of covariates (using DVM outputs as a covariate in the previous study and not using them in this study—see Section 2). Despite these differences, both comparison to EFI-FM and to the cross validation (CV) produces results that are similar to the evaluation of previous models. Both these and previous models (Pirzamanbein et al., 2018, 2020) produce LCTs that are close to EFI-FM for the 100 BP-present time-window (Figure 3). Further, the CV results are similar across all tested times-windows (Table 1) indicating that the good performance for 100 BP-present translates to the other time-windows. The regions in north-eastern Europe and south-east of the Caspian Sea were excluded from the final reconstruction. They were identified as areas of low confidence in Figure 3A, by having an area of confidence region above 9. These regions lack REVEALS records, forcing the model to extrapolate far from observations.
The quality and reliability of the REVEALS estimates of plant cover are expressed by the standard errors (SEs) calculated by the model. The SEs take into account the standard deviations of the relative pollen productivity estimates applied in the REVEALS reconstructions and the number of pollen counted per time window in the pollen record used. The SEs do not include other errors occurring in pollen records such as incorrect chronologies (due to errors on 14C dating or erroneous age-depth models), and errors in pollen identifications. The selection of pollen records for continental REVEALS reconstructions such as the one used in this study is based on careful criteria including the quality of chronologies and pollen identifications (Mazier et al., 2012; Trondman et al., 2015). Nevertheless, such errors can never be avoided and/or tracked completely. If oddities in the final product from the spatial statistical reconstruction cannot be explained by large REVEALS SEs or large cross-validation compositional errors and standard deviations in the spatial statistical reconstruction, it is recommended to examine the individual pollen records used in the REVEALS reconstruction.
In order to evaluate the spatial statistical land-cover reconstructions we have used cross validation and comparison with the EFI-FM dataset (Figure 3). Using datasets from different sources in a comparison raises questions related to differences in temporal and spatial resolutions and on whether the EFI-FM dataset is a fair description of the actual woodland cover of Europe over the last few years and is representative of the last 100 years covered by the REVEALS reconstruction. The accuracy of the EFI-FM dataset varies spatially due to the use of different data sources (Kempeneers et al., 2011). Comparison of the dataset with ground observations indicated some over and underestimations of some taxa depending on the source data used; moreover, the dataset includes a mix of source data with high (25 m) and low (1 km) spatial resolutions. This implies that the EFI-FM data is not of the same accuracy and precision across Europe: for instance, high-resolution spatial data imply higher precision and accuracy of the land-cover data than low-resolution spatial data. Therefore, although the EFI-FM dataset has been agglomerated to the spatial scale of the REVEALS reconstructions (one square degree), it still includes differences in accuracy and precision over space. The latter, and the difference in time represented by the EFI-FM dataset (a few years) and the REVEALS reconstruction (ca. 100 years), implies that the compositional distance between EFI-FM and REVEALS (Figure 3D) is a mixture of (a) differences between REVEALS estimates (and their spatial statistical interpolations) and actual vegetation, and (b) differences due to both errors in the EFI-FM, and different time lengths represented in the two datasets.
The relationship between pollen proportions and vegetation cover is complex: for instance, inter taxonomic differences in plants' pollen production and pollen size and shape imply inter taxonomic differences in number and dispersion distance of pollen (Parsons and Prentice, 1981; Prentice, 1985; Sugita, 1993, 1994). Other factors influencing the pollen-vegetation relationship are the type of the accumulation basin (lake or bog) and its size, wind speed and direction, and local to regional-scale plant composition. This makes wider usage of existing country to continental scale isopollen maps (Huntley and Birks, 1983; Brewer et al., 2017; Birks, 2019) as proxies of land-cover difficult. The Landscape Reconstruction Algorithm and its two models REVEALS and LOVE (Sugita, 2007a,b) is to date the only way to translate pollen assemblages into cover of single plant taxa (species, genus, family and groups of those). The REVEALS model makes it possible to achieve pollen-based reconstructions of plant cover at a regional spatial scale (ca. 100 × 100 km; Hellman et al., 2008a; Li et al., 2020) relevant for environmental and climate studies at the continental to global scales.
Other methods (Modern Analogue Technique (MAT), biomization, and pseudobiomization) have provided estimates of pollen-based woodland cover for the Holocene (e.g., Roberts et al., 2018). But they do not provide detailed reconstruction of past plant cover, for instance for groups of plant functional types such as summer-green trees and evergreen trees, or land-use types such as cultivated land and grazing land (e.g., Trondman et al., 2015). Moreover, a comparison of the results (in terms of woodland cover in Europe through the Holocene) from those methods and REVEALS indicate significant differences for several periods of the Holocene (Roberts et al., 2018). For these reasons, the REVEALS model has the best potential so far to provide reconstructions of past plant cover relevant for palaeoclimate modeling (Gaillard et al., 2010, 2018; Strandberg et al., 2014), and palaeoenvironmental modeling that requires more detailed descriptions of past plant cover, such as the abundance of individual plant species, genus, families, or groups of those. However, to be used in modeling, REVEALS reconstructions achieved at continental scales need to be interpolated into temporally and spatially continuous datasets. The interpolation presented in this paper is one of many possible solutions that can be used (Pirzamanbein et al., 2014, 2018, 2020), and the selected methodology will depend on the type of research question posed (Strandberg et al., 2014; Harrison et al., 2020).
5.2. Relevance of the Interpolated Land-Cover Reconstructions
The availability of rich palaeoecological and archaeological data from Europe covering the Holocene provides a record of vegetation development and human occupation across the continent. These factors and their interactions across space and time have implications for environmental and climatic change (Gaillard et al., 2018; Harrison et al., 2020). The presented land-cover reconstructions (Figures 4–6) show large-scale land-cover changes across Europe during the Holocene, including the reforestation of largely open post-glacial landscapes during the Early Holocene, a maximum of woodland cover and dominance of broadleaved trees during the climate optimum of the Middle Holocene, and large-scale anthropogenic deforestation combined with an increasing share of coniferous trees during the Late Holocene.
Similar general trends in past vegetation change have been inferred from pollen records expressed in pollen percentages or pollen accumulation rates in numerous studies, or using other methods such as biomization and the modern analogue technique (Huntley and Birks, 1983; Davis et al., 2015; Fyfe et al., 2015; Kuneš et al., 2015). However, these reconstructions either do not reconstruct the cover of individual plant taxa or land-cover units, or reconstruct exclusively woodland cover (or its mirror in percentage cover, open land cover (all grasses, herbs, and low shrubs). The ability to quantify the cover of a large number of plant taxa and groups of taxa is the advantage and strong potential of the REVEALS model. It allows us to quantify changes, which is a necessity to study past interactions between vegetation on Earth, anthropogenic impact and climate over long periods and large spatial scales. The dataset of reconstructed Holocene land-cover quantitative changes in Europe presented in this paper is particularly relevant for use in palaeoclimate modeling. Similar reconstructions based on the same dataset of REVEALS land-cover estimates are currently used in a palaeoclimate modeling project studying the biogeophysical forcing of past anthropogenic land-cover change on climate at 6000 and 2500 BP (Githumbi et al., 2019). These land-cover reconstructions will also serve in the detailed study of Holocene dynamics in plant and vegetation cover through time and space for new insights on the factors and processes involved, e.g., disentangling human and climate impacts (Marquer et al., 2017). This can be achieved for instance by using spatial statistical analyses of the land-cover dataset together with independent datasets of archaeology-based land-use and palaeoclimatic changes. Further, the land-cover dataset will be useful for the study of other palaeoenvironmental changes related to plant-cover transformations, such as past changes in biodiversity at a regional spatial scale. It can finally inform on landscape/vegetation characteristics that will help interpreting archaeological findings and their syntheses (Gaillard et al., 2018).
6. Conclusion
The need for spatially continuous pollen-based maps of Holocene land cover in Europe is essential for the study of past vegetation-climate interactions at regional and global scales. In this study we applied spatial statistical modeling and REVEALS-based reconstructions of plant cover from pollen data together with information on anthropogenic deforestation from the KK10 scenarios. There is currently no alternative methodology to the REVEALS model to obtain as detailed reconstructions of vegetation cover. Cross validation and comparison of the reconstructed maps for present time with modern forest data (EFI-FM) confirm the reliability and robustness of the spatial statistical model. Comparison with earlier, similar land cover reconstructions using the same model confirms that it can be used and tested in further applications using the same REVEALS dataset but alternative covariates, or REVEALS datasets from other regions and similar or alternative covariates. Such spatially and temporally continuous land-cover data will be invaluable for palaeoclimate modeling and any palaeoenvironmental analyses of causes, effects and processes operating over long time scales and regional to global scales.
Data Availability Statement
The datasets presented in this study can be found in online repositories. The names of the repository/repositories and accession number(s) can be found below: https://github.com/BehnazP/SpatioCompo_entireHolocene. REVEALS datasets used for this study can be found in Pangaea Fyfe et al. (2021)—https://doi.org/10.1594/PANGAEA.931856.
Author Contributions
EG, BP, JL, and M-JG contributed to conception and design of the study. EG and BP organized the database and wrote the first draft of the manuscript. BP performed the statistical analysis. AP developed most of the figures. JL, AP, and M-JG wrote sections of the manuscript. All authors contributed to manuscript revision, read, and approved the submitted version.
Funding
This study was funded by a research project financed by the Swedish Research Council VR (Vetenskapsrådet) on Quantification of the bio-geophysical and biogeochemical forcings from anthropogenic de-forestation on regional Holocene climate in Europe, LandClim II. Financial support from the Linnaeus University's Faculty of Health and Life Science is acknowledged for M-JG, A-KT, and EG. The MERGE short Project funding supported EG, BP, and JL. AP was supported by the ESF Project Number PRG323. This is a contribution to the strategic research areas MERGE (ModElling the Regional and Global Earth system) and the Past Global Change (PAGES) project and its working group LandCover6k (http://pastglobalchanges.org/landcover6k), which is funded by the Swiss National Science Foundation, the Swiss Academy of Sciences, the US National Science Foundation, and the Chinese Academy of Sciences.
Conflict of Interest
The authors declare that the research was conducted in the absence of any commercial or financial relationships that could be construed as a potential conflict of interest.
The reviewer AD declared past co-authorships with the authors EG, BP, JL, AP, RF, FM, AN, SS, A-KT, JW, and M-JG and the absence of any ongoing collaboration with any of the authors to the handling editor.
Publisher's Note
All claims expressed in this article are solely those of the authors and do not necessarily represent those of their affiliated organizations, or those of the publisher, the editors and the reviewers. Any product that may be evaluated in this article, or claim that may be made by its manufacturer, is not guaranteed or endorsed by the publisher.
Footnotes
1. ^https://efi.int/knowledge/maps/forest
2. ^Downloaded from https://topex.ucsd.edu/pub/srtm30_plus/srtm30/data/ on 2011-09-03.
References
Aitchison, J. (1982). The statistical analysis of compositional data. J. R. Stat. Soc. Series B Stat. Methodol. 44, 139–160. doi: 10.1111/j.2517-6161.1982.tb01195.x
Aitchison, J., Barceló-Vidal, C., Martin-Fernández, J., and Pawlowsky-Glahn, V. (2000). Logratio analysis and compositional distance. Math. Geol. 32, 271–275. doi: 10.1023/A:1007529726302
Birks, H. (2019). Contributions of quaternary botany to modern ecology and biogeography. Plant Ecol. Divers. 12, 189–385. doi: 10.1080/17550874.2019.1646831
Brewer, S., Giesecke, T., Davis, B. A. S., Finsinger, W., Wolters, S., Binney, H., et al. (2017). Late-glacial and holocene European pollen data. J. Maps 13, 921–928. doi: 10.1080/17445647.2016.1197613
Brooks, S., Gelman, A., Jones, G., and Meng, X.-L. (2011). Handbook of Markov Chain Monte Carlo. New York, NY: CRC Press. doi: 10.1201/b10905
Cherubini, F., Huang, B., Hu, X., Tölle, M. H., and Strømman, A. H. (2018). Quantifying the climate response to extreme land cover changes in Europe with a regional model. Environ. Res. Lett. 13, 074002. doi: 10.1088/1748-9326/aac794
Chevalier, M., Davis, B. A., Heiri, O., Seppä, H., Chase, B. M., Gajewski, K., et al. (2020). Pollen-based climate reconstruction techniques for late quaternary studies. Earth Sci. Rev. 210, 103384. doi: 10.1016/j.earscirev.2020.103384
Davin, E. L., Rechid, D., Breil, M., Cardoso, R. M., Coppola, E., Hoffmann, P., et al. (2020). Biogeophysical impacts of forestation in Europe: first results from the LUCAS (Land Use and Climate across Scales) regional climate model intercomparison. Earth Syst. Dyn. 11, 183–200. doi: 10.5194/esd-11-183-2020
Davis, B. A. S., Collins, P. M., and Kaplan, J. O. (2015). The age and post-glacial development of the modern European vegetation: a plant functional approach based on pollen data. Veget. History Archaeobot. 24, 303–317. doi: 10.1007/s00334-014-0476-9
Davis, M. B. (1963). On the theory of pollen analysis. Am. J. Sci. 261, 897–912. doi: 10.2475/ajs.261.10.897
Farr, T. G., Rosen, P. A., Caro, E., Crippen, R., Duren, R., Hensley, S., et al. (2007). The shuttle radar topography mission. Rev. Geophys. 45, RG2004. doi: 10.1029/2005RG000183
Foley, J. A. (2005). Global consequences of land use. Science 309, 570–574. doi: 10.1126/science.1111772
Forster, E. J., Healey, J. R., Dymond, C., and Styles, D. (2021). Commercial afforestation can deliver effective climate change mitigation under multiple decarbonisation pathways. Nat. Commun. 12, 3831. doi: 10.1038/s41467-021-24084-x
Fyfe, R., de Beaulieu, J.-L., Binney, H., Bradshaw, R. H. W., Brewer, S., Le Flao, A., et al. (2009). The European Pollen Database: past efforts and current activities. Veget. History Archaeobot. 18, 417–424. doi: 10.1007/s00334-009-0215-9
Fyfe, R., Woodbridge, J., and Roberts, N. (2015). From forest to farmland: pollen-inferred land cover change across Europe using the pseudobiomization approach. Glob. Change Biol. 21, 1197–1212. doi: 10.1111/gcb.12776
Fyfe, R. M., Githumbi, E., Trondmann, A.-K., Mazier, F., Nielsen, A. B., Poska, A., et al. (2021). Fyfe, RM et al. (2021): A Full Holocene Record of Transient Gridded Vegetation Cover in Europe. Pangaea.
Fyfe, R. M., Woodbridge, J., and Roberts, C. N. (2018). Trajectories of change in Mediterranean Holocene vegetation through classification of pollen data. Veget. History Archaeobot. 27, 351–364. doi: 10.1007/s00334-017-0657-4
Gaillard, M.-J., Morrison, K. D., Madella, M., and Whitehouse, N. (2018). Past land-use and land-cover change: the challenge of quantification at the subcontinental to global scales. Past Glob. Changes Mag. 26, 3. doi: 10.22498/pages.26.1.3
Gaillard, M.-J., Sugita, S., Mazier, F., Trondman, A.-K., Broström, A., Hickler, T., et al. (2010). Holocene land-cover reconstructions for studies on land cover-climate feedbacks. Climate Past 6, 483–499. doi: 10.5194/cp-6-483-2010
Githumbi, E., Fyfe, R., Kjellström, E., Lindström, J., Lu, Z., Mazier, F., et al. (2019). “Holocene quantitative pollen-based vegetation reconstructions in europe for climate modelling: Landclim II,” in INQUA 2019: Life on the Edge (Dublin).
Harrison, S. P., Gaillard, M.-J., Stocker, B. D., Vander Linden, M., Klein Goldewijk, K., Boles, O., et al. (2020). Development and testing scenarios for implementing land use and land cover changes during the holocene in earth system model experiments. Geosci. Model Dev. 13, 805–824. doi: 10.5194/gmd-13-805-2020
Hastie, T., Tibshirani, R., and Friedman, J. (2001). The Elements of Statistical Learning. New York, NY : Springer. doi: 10.1007/978-0-387-21606-5
Hellman, S., Gaillard, M.-J., Broström, A., and Sugita, S. (2008a). The REVEALS model, a new tool to estimate past regional plant abundance from pollen data in large lakes: validation in southern Sweden. J. Q. Sci. 23, 21–42. doi: 10.1002/jqs.1126
Hellman, S. E., Gaillard, M.-J., Broström, A., and Sugita, S. (2008b). Effects of the sampling design and selection of parameter values on pollen-based quantitative reconstructions of regional vegetation: a case study in southern Sweden using the REVEALS model. Veget. History Archaeobot. 17, 445–459. doi: 10.1007/s00334-008-0149-7
Huntley, H., and Birks, H. (1983). An Atlas of Past and Present Pollen Maps for Europe, 0-13,000 years ago. Cambridge: Cambridge University Press.
Jia, G., Shevliakova, E., Artaxo, P., Noblet-Ducoudré, N. D., Houghton, R. J., et al. (2019). Special Report on Climate Change and Land–IPCC site. Technical report, IPCC.
Kaplan, J., Krumhardt, K., Gaillard, M.-J., Sugita, S., Trondman, A.-K., Fyfe, R., et al. (2017). Constraining the deforestation history of Europe: evaluation of historical land use scenarios with pollen-based land cover reconstructions. Land 6, 91. doi: 10.3390/land6040091
Kaplan, J. O., Krumhardt, K. M., Ellis, E. C., Ruddiman, W. F., Lemmen, C., and Goldewijk, K. K. (2011). Holocene carbon emissions as a result of anthropogenic land cover change. Holocene 21, 775–791. doi: 10.1177/0959683610386983
Kaplan, J. O., Krumhardt, K. M., and Zimmermann, N. (2009). The prehistoric and preindustrial deforestation of Europe. Quat. Sci. Rev. 28, 3016–3034. doi: 10.1016/j.quascirev.2009.09.028
Kempeneers, P., Sedano, F., Pekkarinen, A., Seebach, L., Strobl, P., and San-Miguel-Ayanz, J. (2012). Pan-European forest maps derived from optical satellite imagery. IEEE Earthzine 5. Available online at: https://earthzine.org/pan-european-forest-maps-derived-from-optical-satellite-imagery/
Kempeneers, P., Sedano, F., Seebach, L., Strobl, P., and San-Miguel-Ayanz, J. (2011). Data fusion of different spatial resolution remote sensing images applied to forest-type mapping. IEEE Trans. Geosci. Remote Sens. 49, 4977–4986. doi: 10.1109/TGRS.2011.2158548
Klein Goldewijk, K., Beusen, A., Doelman, J., and Stehfest, E. (2017). Anthropogenic land use estimates for the holocene-hyde 3.2. Earth Syst. Sci. Data 9, 927–953. doi: 10.5194/essd-9-927-2017
Kuneš, P., Abraham, V., Kovářík, O., Kopecký, M., Brizová, E., Dudová, L., et al. (2009). Czech quaternary palynological database - Palycz: review and basic statistics of the data. Preslia 81, 209–238. Available online at: http://www.preslia.cz/P093Kunes.pdf
Kuneš, P., Svobodová-Svitavská, H., Kolár, J., Hajnalová, M., Abraham, V., Macek, M., et al. (2015). The origin of grasslands in the temperate forest zone of east-central Europe: long-term legacy of climate and human impact. Quat. Sci. Rev. 116, 15–27. doi: 10.1016/j.quascirev.2015.03.014
Law, B. E., Hudiburg, T. W., Berner, L. T., Kent, J. J., Buotte, P. C., and Harmon, M. E. (2018). Land use strategies to mitigate climate change in carbon dense temperate forests. Proc. Natl. Acad. Sci. U.S.A. 115, 3663–3668. doi: 10.1073/pnas.1720064115
Lemmen, C. (2009). World distribution of land cover changes during pre- and protohistoric times and estimation of induced carbon releases. Geomorphol. Relief Processus Environ. 15, 303–312. doi: 10.4000/geomorphologie.7756
Lerigoleur, E., Mazier, F., Jégou, L., Perret, M., and Galop, D. (2015). Paleopyr: un systéme d'information pour la gestion et l'exploitation de données palaeoenvironnementales sur le massif nord-pyrénéen. Ingénierie des systémes d information 20, 63–87. doi: 10.3166/isi.20.3.63-87
Li, F., Gaillard, M. J., Cao, X., Herzschuh, U., Sugita, S., Tarasov, P. E., et al. (2020). Towards quantification of Holocene anthropogenic land-cover change in temperate China: a review in the light of pollen-based REVEALS reconstructions of regional plant cover. Earth Sci. Rev. 203, 103119. doi: 10.1016/j.earscirev.2020.103119
Lindgren, F., Rue, H., and Lindström, J. (2011). An explicit link between Gaussian fields and Gaussian Markov random fields: the stochastic partial differential equation approach. J. R. Stat. Soc. Stat. Methodol. Ser. B 73, 423–498. doi: 10.1111/j.1467-9868.2011.00777.x
Marinova, E., Harrison, S. P., Bragg, F., Connor, S., Laet, V., Leroy, S. A., et al. (2018). Pollen-derived biomes in the Eastern Mediterranean–Black Sea–Caspian-Corridor. J. Biogeogr. 45, 484–499. doi: 10.1111/jbi.13128
Marquer, L., Gaillard, M.-J., Sugita, S., Poska, A., Trondman, A.-K., Mazier, F., et al. (2017). Quantifying the effects of land use and climate on holocene vegetation in europe. Quat. Sci. Rev. 171, 20–37. doi: 10.1016/j.quascirev.2017.07.001
Mazier, F., Gaillard, M.-J., Kuneš, P., Sugita, S., Trondman, A.-K., and Broström, A. (2012). Testing the effect of site selection and parameter setting on REVEALS-model estimates of plant abundance using the Czech quaternary palynological database. Rev. Palaeobot. Palynol. 187, 38–49. doi: 10.1016/j.revpalbo.2012.07.017
Morrison, K. D., Hammer, E., Boles, O., Madella, M., Whitehouse, N., Gaillard, M.-J., et al. (2021). Mapping past human land use using archaeological data: a new classification for global land use synthesis and data harmonization. PLoS ONE 16, e0246662. doi: 10.1371/journal.pone.0246662
Päivinen, R., Lehikoinen, M., Schuck, A., Häme, T., Väätäinen, S., Kennedy, P., et al. (2001). Combining Earth Observation Data and Forest Statistics. European Forest Institute Research Report 14. EUR 19911 EN (Joensuu: European Forest Institute).
Parsons, R., and Prentice, I. (1981). Statistical approaches to r-values and the pollen-vegetation relationship (article). Rev. Palaeobot. Palynol. 32, 127–152. doi: 10.1016/0034-6667(81)90001-4
Pirzamanbein, B., Lindström, J., Poska, A., and Gaillard, M.-J. (2018). Modelling spatial compositional data: reconstructions of past land cover and uncertainties. Spat. Stat. 24, 14–31. doi: 10.1016/j.spasta.2018.03.005
Pirzamanbein, B., Lindström, J., Poska, A., Sugita, S., Trondman, A.-K., Fyfe, R., et al. (2014). Creating spatially continuous maps of past land cover from point estimates: a new statistical approach applied to pollen data. Ecol. Complex. 20, 127–141. doi: 10.1016/j.ecocom.2014.09.005
Pirzamanbein, B., Poska, A., and Lindström, J. (2020). Bayesian reconstruction of past land cover from pollen data: model robustness and sensitivity to auxiliary variables. Earth Space Sci. 7, e2018EA00057. doi: 10.1029/2018EA000547
Prentice, I. (1985). Pollen representation, source area, and basin size: toward a unified theory of pollen analysis. Quat. Res. 23, 76–86. doi: 10.1016/0033-5894(85)90073-0
Roberts, N., Fyfe, R. M., Woodbridge, J., Gaillard, M.-J., Davis, B. A. S., Kaplan, J. O., et al. (2018). Europe's lost forests: a pollen-based synthesis for the last 11,000 years. Sci. Rep. 8, 716. doi: 10.1038/s41598-017-18646-7
Rue, H., and Held, L. (2004). Gaussian Markov Random Fields: Theory and Applications, 1st Edn. New York, NY: Chapman and Hall/CRC Press. doi: 10.1201/9780203492024
Schuck, A., van Brusselen, J., Päivinen, R., Häme, T., Kennedy, P., and Folving, S. (2002). Compilation of a Calibrated European Forest Map Derived from NOAA-AVHRR Data. EFI Internal Report 13, EuroForIns.
Smith, B., Prentice, I. C., and Sykes, M. T. (2001). Representation of vegetation dynamics in the modelling of terrestrial ecosystems: comparing two contrasting approaches within European climate space. Global Ecol. Biogeogr. 10, 621–637. doi: 10.1046/j.1466-822X.2001.t01-1-00256.x
Soepboer, W., Sugita, S., and Lotter, A. F. (2010). Regional vegetation-cover changes on the Swiss Plateau during the past two millennia: a pollen-based reconstruction using the REVEALS model. Quat. Sci. Rev. 29, 472–483. doi: 10.1016/j.quascirev.2009.09.027
Sporre, M. K., Blichner, S. M., Karset, I. H., Makkonen, R., and Berntsen, T. K. (2019). BVOC-aerosol-climate feedbacks investigated using NorESM. Atmos. Chem. Phys. 19, 4763–4782. doi: 10.5194/acp-19-4763-2019
Strandberg, G., and Kjellström, E. (2019). Climate impacts from afforestation and deforestation in Europe. Quat. Res. 23, 1–27. doi: 10.1175/EI-D-17-0033.1
Strandberg, G., Kjellström, E., Poska, A., Wagner, S., Gaillard, M.-J., Trondman, A.-K., et al. (2014). Regional climate model simulations for Europe at 6 and 0.2 k bp: sensitivity to changes in anthropogenic deforestation. Clim. Past 10, 661–680. doi: 10.5194/cp-10-661-2014
Stroeven, A. P., Hattestrand, C., Kleman, J., Heyman, J., Fabel, D., Fredin, O., et al. (2016). Deglaciation of fennoscandia. Quat. Sci. Rev. 147, 91–121. doi: 10.1016/j.quascirev.2015.09.016
Sugita, S. (1993). A model of pollen source area for an entire lake surface. Quat. Res. 39, 239–244. doi: 10.1006/qres.1993.1027
Sugita, S. (1994). Pollen representation of vegetation in quaternary sediments: theory and method in patchy vegetation. J. Ecol. 82, 881. doi: 10.2307/2261452
Sugita, S. (2007a). Theory of quantitative reconstruction of vegetation I: pollen from large sites REVEALS regional vegetation composition. Holocene 17, 229–241. doi: 10.1177/0959683607075837
Sugita, S. (2007b). Theory of quantitative reconstruction of vegetation II: all you need is love. Holocene 17, 243–257. doi: 10.1177/0959683607075838
Sugita, S., Parshall, T., Calcote, R., and Walker, K. (2010). Testing the landscape reconstruction algorithm for spatially explicit reconstruction of vegetation in northern Michigan and Wisconsin. Quat. Res. 74, 289–300. doi: 10.1016/j.yqres.2010.07.008
Trondman, A.-K., Gaillard, M.-J., Mazier, F., Sugita, S., Fyfe, R., Nielsen, A. B., et al. (2015). Pollen-based quantitative reconstructions of holocene regional vegetation cover (plant-functional types and land-cover types) in Europe suitable for climate modelling. Global Change Biol. 21, 676–697. doi: 10.1111/gcb.12737
Walker, M., Head, M. J., Berkelhammer, M., Björk, S., Cheng, H., Cwynar, L., et al. (2018). Formal ratification of the subdivision of the Holocene series/epoch (Quaternary system/period): two new global boundary stratotype sections and points (GSSPs) and three new stages/subseries. Int. Union Geol. Sci. 41, 213–223. doi: 10.18814/epiiugs/2018/018016
Ward, D. S., and Mahowald, N. M. (2015). Local sources of global climate forcing from different categories of land use activities. Earth Syst. Dyn. 6, 175–194. doi: 10.5194/esd-6-175-2015
Woodbridge, J., Fyfe, R., Roberts, C., Trondman, A., Mazier, F., and Davis, B. (2018). European forest cover since the start of Neolithic agriculture: a critical comparison of pollen-based reconstructions. Past Global Change Mag. 26, 10–11. doi: 10.22498/pages.26.1.10
Keywords: land-cover maps, Holocene, reveals, land use, spatial interpolation
Citation: Githumbi E, Pirzamanbein B, Lindström J, Poska A, Fyfe R, Mazier F, Nielsen AB, Sugita S, Trondman A-K, Woodbridge J and Gaillard M-J (2022) Pollen-Based Maps of Past Regional Vegetation Cover in Europe Over 12 Millennia—Evaluation and Potential. Front. Ecol. Evol. 10:795794. doi: 10.3389/fevo.2022.795794
Received: 15 October 2021; Accepted: 28 January 2022;
Published: 24 February 2022.
Edited by:
Olga Solomina, Institute of Geography (RAS), RussiaReviewed by:
Morteza Djamali, Centre National de la Recherche Scientifique (CNRS), FranceJohn Dodson, Institute of Earth Environment (CAS), China
Andria Dawson, University of California, Berkeley, United States
Copyright © 2022 Githumbi, Pirzamanbein, Lindström, Poska, Fyfe, Mazier, Nielsen, Sugita, Trondman, Woodbridge and Gaillard. This is an open-access article distributed under the terms of the Creative Commons Attribution License (CC BY). The use, distribution or reproduction in other forums is permitted, provided the original author(s) and the copyright owner(s) are credited and that the original publication in this journal is cited, in accordance with accepted academic practice. No use, distribution or reproduction is permitted which does not comply with these terms.
*Correspondence: Esther Githumbi, ZXN0aGVyLmdpdGh1bWJpQGxudS5zZQ==