 Kukka Kyrö
 Tuomas Kankaanpää
 Eero J. Vesterinen
 Susanna Lehvävirta1,6
 David Johannes Kotze
95% of researchers rate our articles as excellent or good
Learn more about the work of our research integrity team to safeguard the quality of each article we publish.
Find out more
ORIGINAL RESEARCH article
Front. Ecol. Evol. , 24 February 2022
Sec. Urban Ecology
Volume 10 - 2022 | https://doi.org/10.3389/fevo.2022.785448
This article is part of the Research Topic Socio-Ecological Dynamics of Green Roof Ecosystems View all 8 articles
Vegetated roofs are human-manufactured ecosystems and potentially promising conservation tools for various taxa and habitats. Focussing on arthropods, we conducted a 3 year study on newly constructed vegetated roofs with shallow substrates (up to 10 cm) and vegetation established with pre-grown mats, plug plants and seeds to describe pioneer arthropod communities on roofs and to compare them with ground level communities. We vacuum sampled arthropods from the roofs and nearby ground level sites with low, open vegetation, i.e., potential source habitats. We showed that the roofs and ground sites resembled each other for ordinal species richness but differed in community composition: with time the roofs started to resemble each other rather than their closest ground level habitats. Species richness increased with time on roofs and at ground level, but the roofs had consistently less species than the ground sites and only a few species were unique to the roofs. Also, the proportion of predators increased on roofs, while not at ground level. We conclude that vegetated roofs established with similar substrates and vegetation, filter arthropods in a way that produces novel communities that are different from those at ground level but similar to one another. The role of these insular communities in species networks and ecosystem function remains to be investigated.
Urbanization shrinks and fragments the living space for animals and plants by replacing natural habitats with artificial impervious surfaces, such as roads and buildings, with a pace that is projected to accelerate in the coming decades (Seto et al., 2012; McDonald et al., 2020). To halt or even reverse this trend, there is an urgent call to dampen the connection between the growth of cities and the loss of vegetated areas (Maes and Jacobs, 2017; Garrard et al., 2018). Vegetated roofs (see Kotze et al., 2020), also called green roofs, are urban greening tools that preserve and restore vegetation in built areas. They mitigate a wide range of environmental problems related to urbanization, as they, e.g., reduce the urban heat island effect, contribute to stormwater management and have a positive effect on air quality (Oberndorfer et al., 2007). In addition, vegetated roofs provide an opportunity to address biodiversity loss (Williams et al., 2014).
A common type of vegetated roof is created on a relatively thin substrate layer (depth of up to ∼30 cm) using vegetation that consists of drought tolerant succulents, mosses and/or forbs and grasses. Based on characteristics of the vegetation, dry open environments, such as dry and rocky meadows, are considered as the closest habitat analogies to these roofs (Lundholm and Marlin, 2006; Madre et al., 2014; Gabrych et al., 2016). While composition of the original roof vegetation is often known and succession in plant communities has received a considerable amount of research attention (Emilsson, 2008; Thuring and Dunnett, 2014; Ksiazek-Mikenas et al., 2018; Aloisio et al., 2019; Jauni et al., 2020), the pioneer arthropod fauna and its origins are poorly understood. Yet, Ksiazek-Mikenas et al. (2018) suggested in their space-for-time-substitution study—where they applied a 1–93 year old vegetated roof chronosequence for predicting temporal patterns in roof fauna and flora—that the arthropod community established within the first years, may be an important driver of arthropod richness and community composition on vegetated roofs. Thus, describing the arthropod fauna of new roofs and their sources can be critical to understand patterns in arthropod richness and community composition in these artificial habitats.
Ecological communities are assembled by spatial variables that contribute to dispersal limitation, such as connectivity to source habitats, and by environmental and biotic filters plus their interactions (Chase and Myers, 2011; Kraft et al., 2015; Cadotte and Tucker, 2017). In the case of vegetated roofs, vertical isolation (roof height) and horizontal distance to local and regional source habitats at ground level and on other vegetated roofs, and roof size are identified as important spatial features to assemble arthropod communities (Braaker et al., 2014, 2017; Blank et al., 2017). Relevant environmental and biotic filters include microclimate, substrate and vegetation cover, structure and plant richness (Schindler et al., 2011; Madre et al., 2013; Braaker et al., 2014, 2017; Pétremand et al., 2018; Dromgold et al., 2020), accompanied with mutualistic and antagonistic interactions between roof fauna. Yet, we know little about their role in arthropod communities on recently established (0–3 year old) roofs.
For arthropods, vegetated roofs resemble both habitat fragments and true islands surrounded by an anthropogenic matrix (Blank et al., 2017). Similar to fragments, permeability of the matrix between roofs varies, but analogous to oceanic islands, roofs are habitat patches that lack initial contact with arthropod source populations. Newly established vegetated roofs are still not empty from arthropods, because the construction materials carry soil microfauna onto the roofs (Rumble et al., 2018; McKinney et al., 2019), and are likely to also introduce epigeal arthropods (Kadas, 2006; Páll-Gergely et al., 2014; Kyrö et al., 2020). However, new roofs have high amounts of ecologically open space compared to habitat fragments, and are ecologically very different from the landscape within which they are placed, thus natural colonization is expected to play a key role in shaping communities on new roofs (Gillespie and Roderick, 2002). Based on dispersal traits of species collected from rooftops, arthropods colonize vegetated roofs by traveling passively in the air or by actively flying onto roofs, while even low roofs seem inaccessible for those arthropods that are poor aerial dispersers (Colla et al., 2009; Braaker et al., 2014; Vergnes et al., 2017; Bergeron et al., 2018; Kyrö et al., 2018).
Arthropod colonization of habitat patches that have vegetation, but are empty from arthropods, is rapid. Most species may even arrive during the first year (Simberloff and Wilson, 1970; Chen et al., 2020) and these first arrivals can have an important role in defining the future community composition via priority effect (Chase, 2003; Fukami, 2015). A few studies have successfully described low abundance and richness of arthropods on recently established (0–1 year old) vegetated roofs (Kadas, 2006; Dromgold et al., 2020), pointing out that the colonization of new roofs may not be as fast as in natural environments. The explanation could be a combination of the effects of vertical isolation as a dispersal barrier, the low plant biomass on newly established roofs and the dissimilarity between roof vegetation and that at ground level.
New roofs have been shown to accumulate species richness for at least the first 3 years after roof establishment (Brenneisen, 2006). Yet, we lack descriptions of the pioneer arthropod fauna of vegetated roofs and their potential sources have remained poorly understood. We also know very little about temporal dynamics on new roofs (but see Salman and Blaustein, 2018) and about the roles of stochastic and deterministic processes in the early phase of community assembly. Also, while chronosequence data of Ksiazek-Mikenas et al. (2018) provided valuable information from temporal community patterns on older roofs, longitudinal data are required to evaluate whether species that arrive on roofs are able to persist and establish viable populations, or if roof communities are highly dynamic and depend on yearly recolonization. In climates with four distinct seasons this is particularly interesting, because for a species to persist, the roof habitat also needs to meet its requirements during variable seasonal conditions.
Finally, published studies on epigeal arthropods of vegetated roofs mostly deal with a few commonly surveyed arthropod taxa with experts available to identify species from morphological characteristics, i.e., carabid beetles (Carabidae), spiders (Araneae), true bugs (Heteroptera), ants (Formicidae), and bees (Apidae), or use group level data when describing community patterns (Colla et al., 2009; Tonietto et al., 2011; Madre et al., 2013; Braaker et al., 2017; Bergeron et al., 2018; Pétremand et al., 2018; Dromgold et al., 2020). Consequently, we have an incomplete picture of arthropod fauna in these artificial habitats, particularly of taxa that are small but abundant and have an essential role in food webs, such as flies (Diptera).
In this study, we investigate spatial and temporal arthropod community patterns on new vegetated roofs and adjacent ground level sites that we expect to function as sources for the roof communities. We use DNA metabarcoding of suction sampling catches (using a D-vac vacuum sampling device, see section “Materials and Methods”) to characterize the species composition of arthropod communities. We then use the resolved species identities to assign feeding characteristics to community members, and to examine their role in arthropod community assembly on different roofs compared to ground level open habitats. Furthermore, we follow patterns in community assembly on the roofs and in ground sites for the first 3 years after roof establishment. Specifically, we ask the following questions: (i) Does the composition of arthropod communities differ between roofs and adjacent ground level sites, and (ii) do patterns in yearly variation in species richness and community composition differ between roofs and ground habitats, and (iii) between roofs?
Open urban green spaces function as a source of propagules for vegetated roofs. Thus, the roofs should share species with their reference ground level habitats. However, we expect the roof communities to differ from the ground level ones, because roof habitats filter taxa from ground level based on mobility and biotic and abiotic requirements and tolerances, and because we expect the roofs to also be colonized by taxa not found in the ground level samples, as they arrive in construction materials or from source habitats further away. We expect species richness to increase with time in the roof communities, given the ample open ecological space of new roofs and the increase in roof vegetation cover, biomass and plant richness with time, which allows for new arthropod species to establish populations during the first years after roof construction. We expect species richness in ground level sites to be rather stable or fluctuate randomly.
The study was conducted in the Helsinki metropolitan area, southern Finland. During the years 2013–2015, we collected arthropod samples with a D-vac vacuum sampling device (Dietick et al., 1959) from seven vegetated roofs that were all built in 2012 (Table 1). We also collected reference samples from the two closest ground level open habitats per roof. All roofs and ground level plots were sampled twice per growing season, in June and late August/beginning of September. Samples from the second sampling of 2013 were lost during storage for six out of seven roofs, and from the first sampling of 2013 for one of the studied roofs. Also, we treated thrips (Thysanoptera) in the 2013 data as NA, because they had already been removed from the samples prior to DNA extraction.
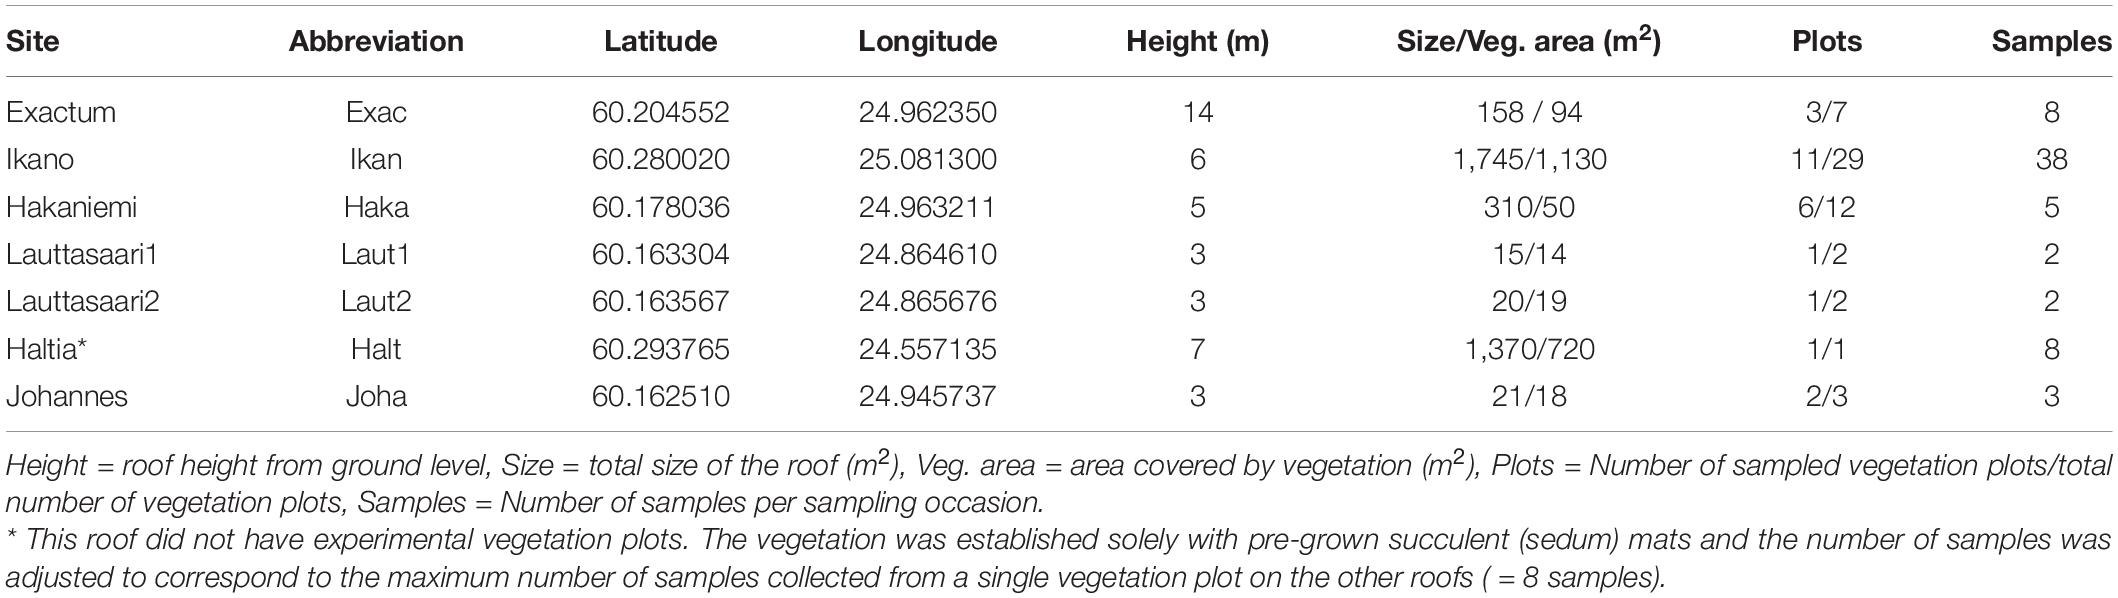
Table 1. Coordinate locations (latitude and longitude) of the sampled roofs and the number of samples per roof per sampling occasion (Samples).
Six of the studied roofs had vegetation that consisted of experimental vegetation plots established with pre-grown vegetation mats and seeds, or with plug plants and seeds (Figure 1). The pre-grown vegetation mats came from the same producer and were produced and transported similarly, yet they contain the natural variation of living systems. Each roof had two types of mats: mats with vegetation dominated by herbs and grasses and mats with sedum and moss dominated vegetation. Also, seed and plug plant content and density was standardized across all six roofs. Size of the vegetation plots varied from 2 to 80 m2 (median size = 5.13 m2) and all plots were separated by gravel strips that were at least 0.5 m wide. One of the studied roofs was established only with pre-grown sedum-moss mats, without gravel strips. Substrate depth varied from 3 to 13 cm. The roofs were irrigated right after installation, but since then received little management.
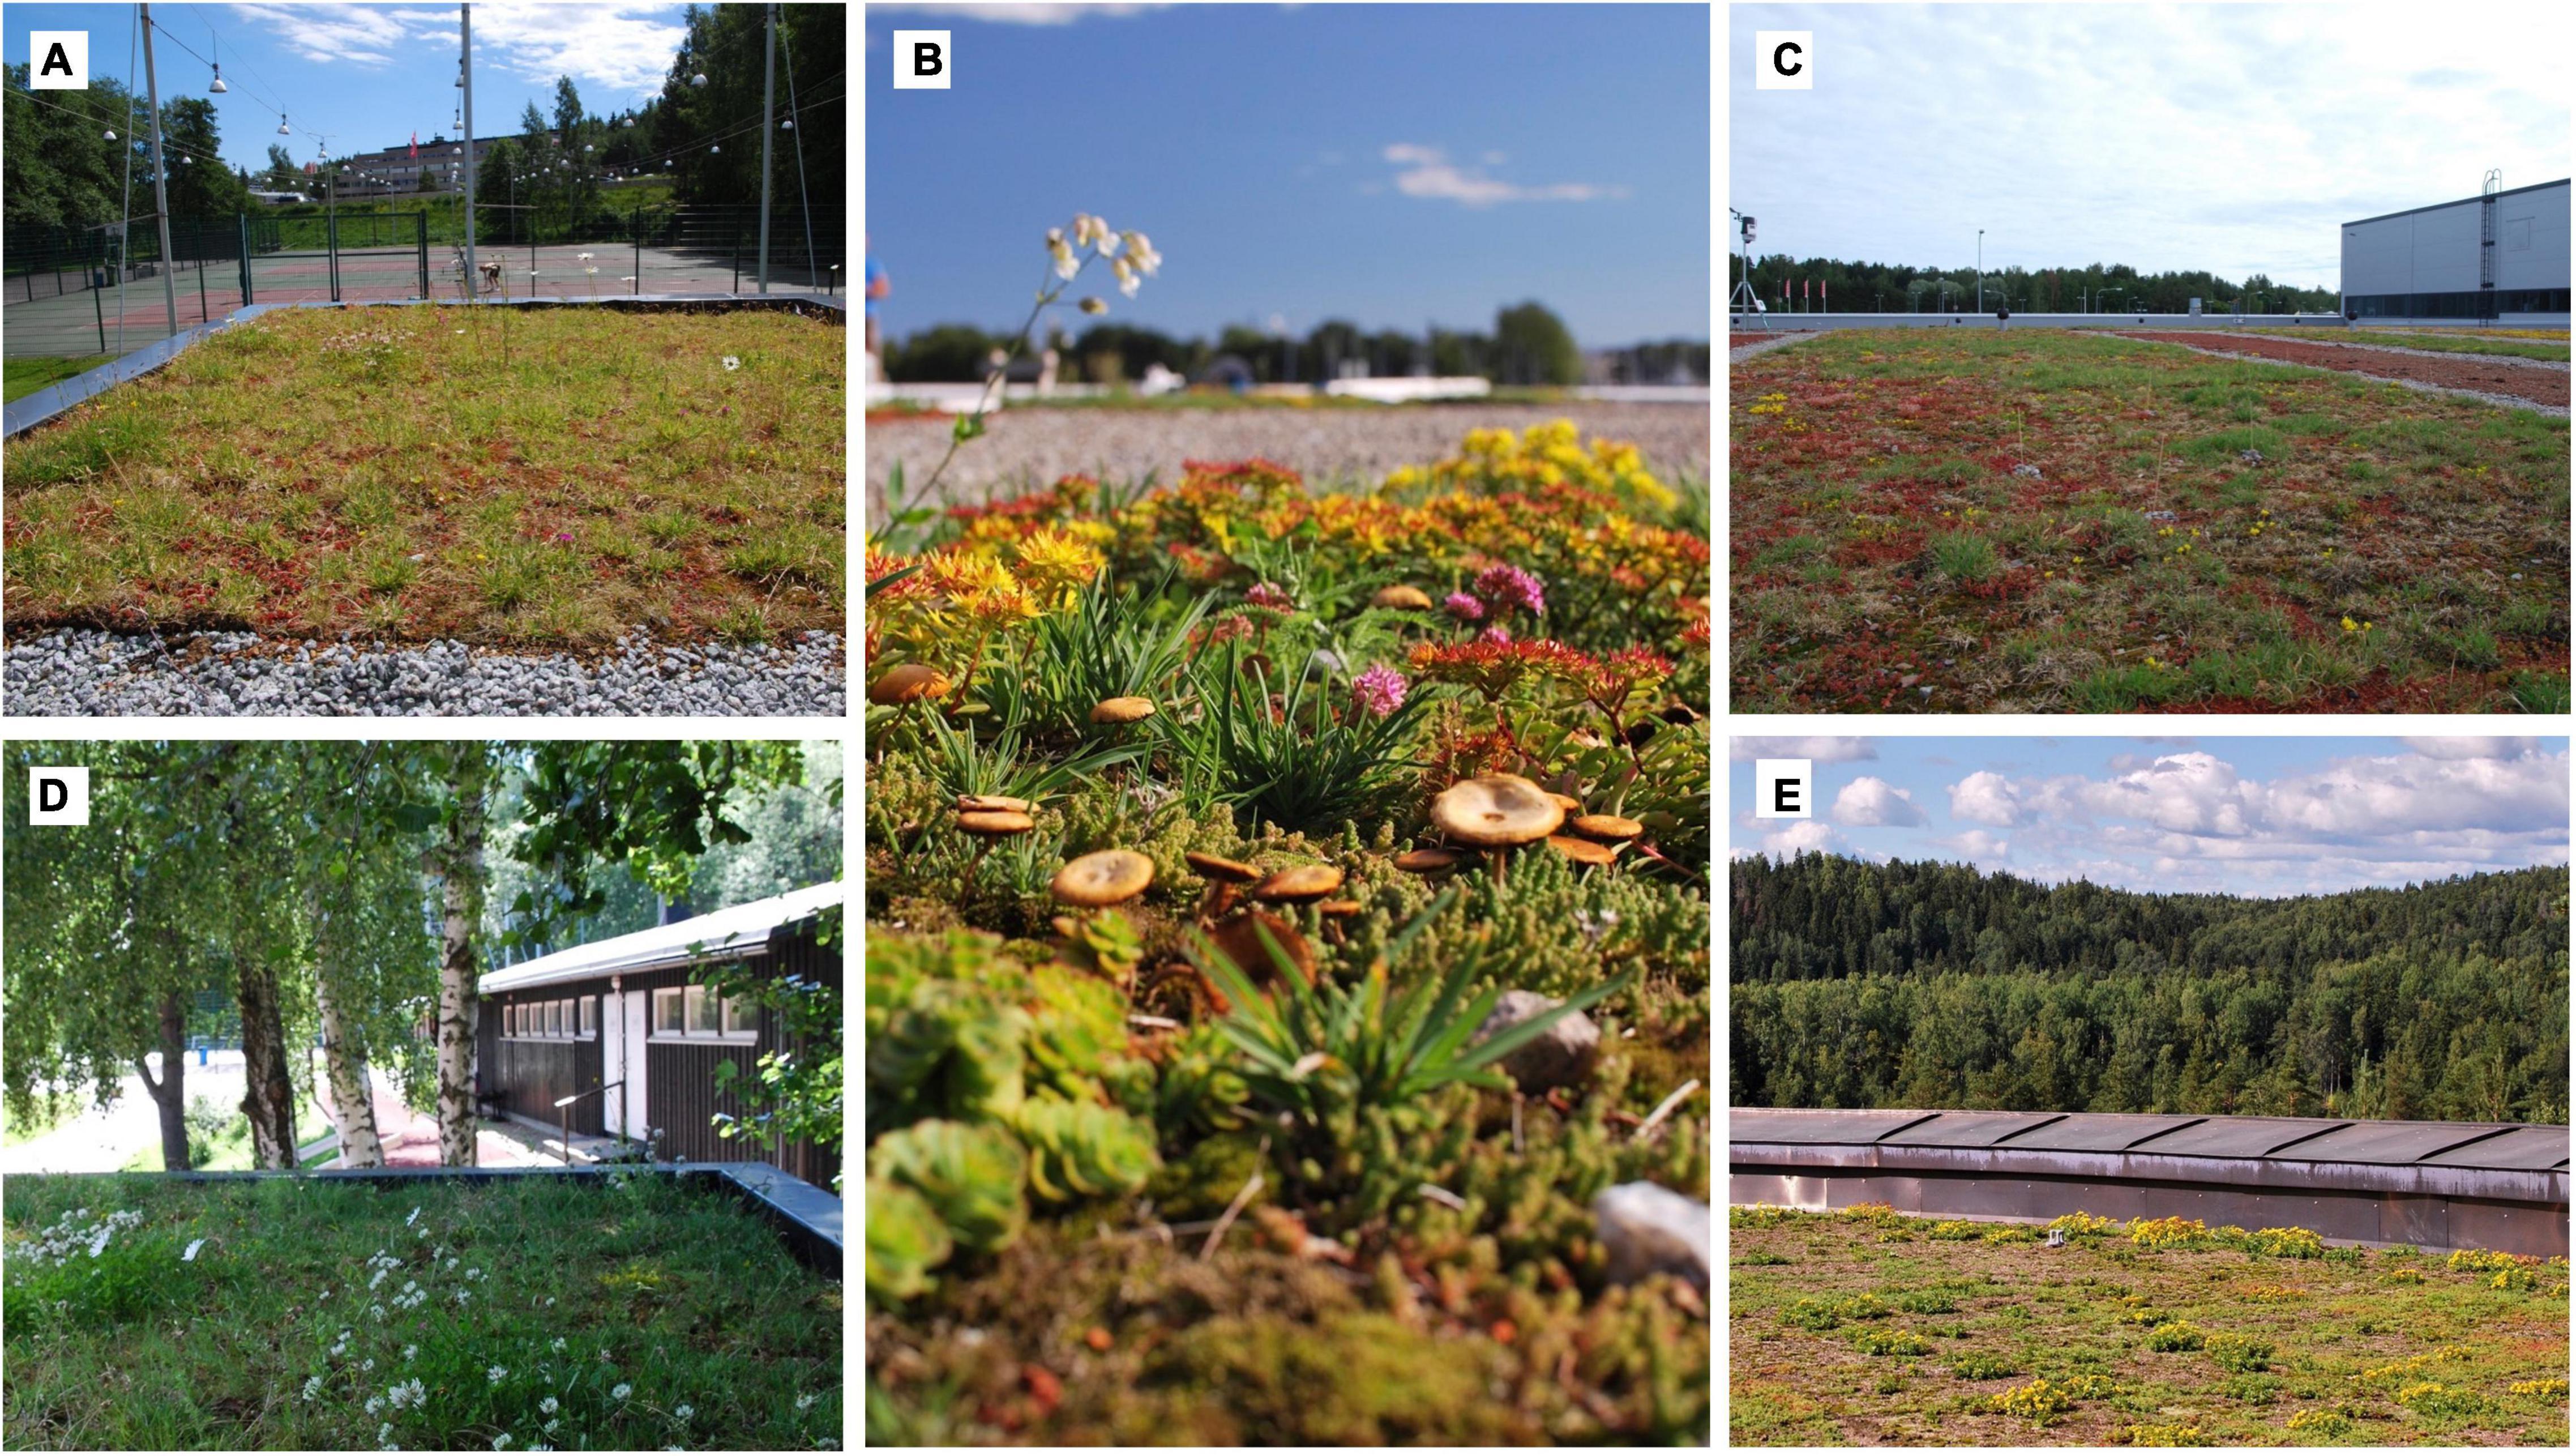
Figure 1. Vegetation on experimental roofs (A–D) consisted of experimental plots that were established with pre-grown vegetation mats and seeds or with plug plants and seeds. The plots were separated from each other with gravel. On one roof included in the study, the vegetation was created with pre-grown sedum mats and the roof had no gravel (E). Photos: Kukka Kyrö.
We only sampled the vegetation plots that were established with mats to avoid vacuuming loose substrate in the plots established with plug plants and seeds. Similarly to Kyrö et al. (2020), the number of samples was adjusted to vegetation plot size following the formula (a = vegetation plot area, m2), resulting in one to eight samples per plot and 2–38 samples per roof (Table 1). Close to each roof we chose two ground level habitat patches with low open vegetation, where we took four reference samples. Each sample consisted of vacuuming a “sampling spot” of 0.79 m2 (a circle with a radius of 0.5 m) for 30 s. All sampling spots were placed at least 1 m apart and from the edge of the roof or habitat patch. The vacuumed samples were stored at –20°C as soon as possible after sampling. Later, we sorted the arthropods from vacuumed plant material, and stored all arthropods in 80% ethanol before DNA extractions. Soil fauna, which consisted mostly of Collembola and Acari, were not included in the samples.
We extracted DNA from our arthropod suction samples using a modified non-destructive salt extraction protocol (Aljanabi, 1997; Vesterinen et al., 2016; Supplementary Material 1). In addition to the actual samples, we ran six purification controls that contained 100 μl of sterile water and were otherwise treated similarly to the arthropod samples but contained no animals. We measured DNA concentrations from all extracted DNA samples using a NanoDrop device (Thermo Fisher Scientific Inc., Waltham, United States). Samples that were outside the optimal measuring range of NanoDrop (above 1,500 ng μl–1), were diluted to ∼50 ng μl–1, after which measuring was repeated. Finally, all samples were diluted to the same concentration: 50 ng μl–1. Samples where the original DNA concentrations were less than 50 ng μl–1, were not diluted.
We used the mitochondrial cytochrome c oxidase subunit I gene (COI) as a marker in molecular identification in metabarcoding of arthropod samples (Hebert et al., 2003; Koskinen et al., 2018; Vesterinen et al., 2018; Kaunisto et al., 2020). We used two non-overlapping complementary primer pairs to reduce primer-induced bias. The choice of primers was based on the recent literature and our own previous work and experience. We amplified a 313 bp COI fragment with the primer pair mlCOIintF: 5′-GGWACWGGWTGAACWGTWTAYCCYCC-3′ (Leray et al., 2013) and jgHCO2198: 5′-TAIACYTCIGGRT GICCRAARAAYCA-3′ (Geller et al., 2013). Another COI fragment of 180 bp was amplified with the primer pair LCO1-1490: 5′-GGTCAACAAATCATAAAGATATTGG-3′ (Folmer et al., 1994) and CO1-CFMRa: 5′-GGWACWRGWT GRACWITITAYCCYCC-3′ (Jusino et al., 2019). The mlCOIintF-0/jgHCO2198-0 primer pair is hereafter referred to as Leray and LCO1-1490/CO1-CFMRa as ANML. We used a reaction volume of 10 μl for all primer pairs. The reaction volume included 5 μl of 2 × MyTaq HS Red Mix (Bioline, United Kingdom), 1.4 μl of H2O, 0.3 μl of each primer and 3 μl of DNA extract per each sample. The polymerase chain reaction (PCR) cycling protocols were: Leray: 5 min at 95°C, then 16 cycles at 95°C for 40 s, 54–46°C for 60 s and 72°C for 30 s, followed by 14 cycles at 46°C for 60 s and 72°C for 30 s, followed by 72°C for 10 min. ANML: 60 s at 95°C, then 5 cycles at 95°C for 60 s, 45°C for 90 s and 72°C for 90 s, followed by 35 cycles at 95°C for 60 s, 50°C for 90 s and 72°C for 60 s, followed by 72°C for 10 min.
For library construction, we used a dual indexing approach where we tagged both forward and reverse primers with different indexing tags (Shokralla et al., 2015). Each sample included a unique index combination to identify the reads after sequencing. These index combinations differed at the minimum of 4 bases for forward indices, and with a minimum of 5 bases between reverse indices. Library preparation followed Vesterinen et al. (2016) with small modifications: for a reaction volume of 10 μl, we mixed 5 μl of 2 × MyTaq HSRedMix, 1.8 μl of sterile H2O, 0.3 μM of each primer and 2.6 μl of a locus−specific PCR product. For PCR cycling, we used the following protocol: 5 min at 95°C, then 15 cycles of 20 s at 95°C, 15 s at 60°C and 30 s at 72°C, followed by 5 min at 72°C.
After library construction, we pooled all indexed samples into equal volumes, separately for the two primer pairs (Leray and ANML), purified the pools following Vesterinen et al.’s (2016) dual-SPRI-purification protocol. The purified pools (Leray and ANML) were sequenced at the Helsinki Functional Genomics Unit (FuGU) in one Illumina MiSeq v3 300 bp run.
The Illumina sequencing yielded 20,354,345 paired-end reads identified to samples with unique dual-index combinations. The reads were uploaded directly from the sequencing facility to CSC servers (IT Center for Science)1 for trimming and further analysis. Trimming and quality control of the sequences were conducted according to Vesterinen et al. (2018). Consequently, paired-end reads were merged (> 96% reads successfully merged) using the program USEARCH (Edgar, 2010) and trimmed (∼91%) for quality using the software VSEARCH “fastx_filter” algorithm with “fastq_maxee_rate” threshold 1 (Rognes et al., 2016). Primers were removed using the Python program cutadapt (∼98% reads passed), which also separated reads into primer-specific sets: Leray (7,487,152 reads) and ANML (10,574,871 reads) (Martin, 2011). We then dereplicated reads using the USEARCH “fastx_uniques” algorithm with option “minuniquesize 10,” and then we applied the USEARCH UNOISE3 algorithm to denoise these unique reads (Leray 54,440 uniques; ANML 64,531 uniques) (Edgar, 2016). Then, denoised reads were clusters into OTUs using a 95% threshold using the USEARCH ‘‘cluster_fast’’ algorithm (Leray 1,357 OTUs; ANML 1,526 OTUs). We first checked that both datasets were comparable and contained the target taxa (Arthropods), and then combined all OTUs into a single file for convenience. Note that OTUs originating from the two primer pairs still remained separate at this stage. Finally, combined OTUs were mapped back to the original trimmed reads to establish the total number of reads in each sample using the USEARCH ‘‘otutab’’ algorithm (16,825,912 reads successfully mapped). We assigned the OTUs to species as accurately as possible with the help of a large reference sequence collection orchestrated by the Finnish Barcode of Life campaign (FinBOL)2 and BOLD database (Ratnasingham and Hebert, 2007). We used a custom-made script, which retrieved the taxonomic identity, BIN code, and taxonomy from BOLD systems utilizing BOLD APIs.
We removed non-targeted taxa, such as Acari, Collembola (although they were not included in the data, individuals likely ended up in the OTU reads in the gut contents of predators and stuck on other insects), Nematoda and Fungi. We continued filtering the data for tag jumping, i.e., sequences with sequencing errors in tag bases. To eliminate sample cross talk (tag jumping), we filtered out a sum of (i) < 0.1% of the maximum OTU read count between shared forward indices (same plate wells on different plates), (ii) < 0.2% of maximum OTU read count between shared reverse indices (within a plate), and iii) 0.01% of total OTU read sum (from mixed sources) off of the read count of each OTU in each sample. Finally, we combined OTUs likely representing the same species but generated by different primers, i.e., Leray and ANML. First, we combined all OTUs from different primers that mapped to the same BIN (barcode index number) (Ratnasingham and Hebert, 2013) or species name. Then, if closely related OTUs were present in the same samples with one having systematically lower read numbers, we considered the OTU with lower read numbers to be generated by sequencing error, and manually merged the closely related OTUs.
Some samples were processed in several (2–3) parts, but we merged molecular data originating from the same suction samples and summed the read count. This is one of the largest sources for variation in the total sample read count in the final data. Also, some of the samples including only species belonging to Heteroptera (n = 28) or Coccinellidae (n = 12) were morphologically identified, because the original research plan included the use of morphological identifications. For these samples, we assessed the number of reads to 30,000, which was roughly the median of the read count of all DNA extracted samples. After the above trimming, we were able to identify and retain 93% of all the species reads. A table detailing OTU read counts in samples and a FASTA file containing all consensus sequences corresponding to each OTU are available in the Dryad Digital Repository (Kyrö et al., 2022).
We collected juvenile or larval feeding guild data for each of the identified species from the literature (Rintala and Rinne, 2011), websites3 ,4 and expert knowledge. We applied juvenile feeding data because many of the species belonging to Diptera, i.e., the most frequent taxon in the data, do not feed as adults or adult feeding is based on supplementing larval diet.
All statistical analyses were performed using R version 3.6.1 (R Core Team, 2019). We applied Hierarchical Modeling of Species Communities (HMSC) to reveal community level patterns in the arthropod data (Ovaskainen and Abrego, 2020). The method can model the occurrences of arthropod species in the suction samples simultaneously as a function of environmental conditions, species traits and the spatio-temporal structure of the data.
Using the Hmsc R software (Tikhonov et al., 2019), we built two models. First, to investigate the properties of roof assemblages as compared to those at ground level, we fitted a model with all the samples from roofs and their respective ground level counterparts. We call this the roof vs. ground model. Secondly, to analyze how roof properties shaped rooftop arthropod assemblages during the early phase of succession, we fitted a model only with samples from the vegetated roofs. We call this the roof model.
The joint species models were built as follows. As response data for the roof vs. ground model, we used a presence-absence matrix of the arthropod species detected in each suction sample either from molecular data or from morphological identifications. To ensure that the statistical power of the analyses was sufficient and to run the model in a reasonable timeframe (ca. 10 days), we included only those species with at least 10 occurrences in the data (Ovaskainen and Abrego, 2020). As explanatory data, we included: (1) Plot as categorical variable with two levels (roof or ground level) (2) year as a three-level factor (2013, 2014, and 2015), because with the interaction between year and plot, the model performed poorly if year was continuous, (3) interaction between plot and year, (4) sampling period as a categorical variable with two levels (early or late summer), and (5) logarithm of the total read count of the sample as a continuous variable to handle sample level variation in sequencing depth. For the roof model, the response data included a presence-absence matrix of arthropod species detected in each suction sample from the vegetated roofs. We included only species with at least five occurrences in the roof data to ensure statistical power. As explanatory data, we included (1) year as a continuous variable (2013–2015), (2) roof height (m), (3) roof size (m2) including only the vegetated area on a roof, (4) sampling period as a categorical variable with two levels (early or late summer), and (5) logarithm of the total read count of the sample as a continuous variable. We also considered including number of plant species on a roof as explanatory variable in the roof model, but since plant richness correlated closely with vegetated area (r = 0.76) and positively with year (r = 0.22), we excluded it.
For both models, we included a species trait: juvenile or larval diet of the species as a categorical variable with three levels: herbivore, predator (including parasitoids) or other, the last category combining groups that were not frequent enough to be analyzed separately, i.e., fungivory, detritivory, sanguivory, and xylophagy. Additionally, to explore whether species’ responses carry a phylogenetic signal, we included a rough taxonomic tree that included seven levels ranging from species to phylum. This tree was then converted to a phylogenetic (taxonomic) distance matrix. The spatial structure of the data was accounted for by including a random effect at the level of the seven study sites. The random effects structure was the same for both models.
We applied a probit regression to model the occurrences from presence-absence data and assumed the default priors and Markov chain Monte Carlo (MCMC) setting of the Hmsc software (Tikhonov et al., 2019; Ovaskainen and Abrego, 2020). We performed 300,000 MCMC iterations with four chains and discarded the first 200,000 iterations as burn-in. The remaining iterations were thinned by 100 resulting in 1,000 posterior samples in total (i.e., 250 posterior samples in each chain). We assessed the convergence of the MCMC chains through the potential scale reduction factors of the estimated parameters, increasing thinning until satisfactory convergence was observed (Tikhonov et al., 2019) and used AUC (area under the curve) statistics to measure explanatory power of the models (Fielding and Bell, 1997). To determine how the fixed explanatory variables and random effects in the HMSC models contributed to variation in the arthropod communities, we applied variance partitioning (Ovaskainen et al., 2017). In addition, we quantified how much of the species responses were explained by their feeding trait from HMSC model parameters linking species traits to explanatory variables. Because of the data gap in 2013, we also run both roof vs. ground and roof models without data from 2013s second sampling occasion to inspect how the data we had from one site for that particular sampling occasion affected the results. Our expectation was that because model predictions are made at the level of an individual suction sample and the sampling occasion is only a correction in the model intercept for each species, the results should not differ much between models with or without data from 2013s second sampling occasion.
We visualized patterns in arthropod community composition on roofs and at ground level using non-metric multidimensional scaling (NMDS). Similarly to HMSC, we excluded species with < 10 occurrences. We applied the function metaMDS in the vegan package with two dimensions and the Raup-Crick distance matrix for presence-absence data (Oksanen et al., 2018) pooled at the study site level separately for roofs and ground level plots.
Altogether 782 OTUs occurred in 3 suction samples (Supplementary Material 2). We removed OTUs with fewer occurrences because they consisted of untraceable assignations, singletons and taxa with non-matching geographical distributions. From the 782 OTUs (referred as species from here on) 514 were removed from all statistical analyses because of low (< 10) occurrences. Low-prevalence species in a large dataset add little information for Hmsc models but slow down the analysis considerably and decrease the reliability of the outcome (see above). Of the 268 remaining species, 89.6% were found both at ground level and on the roofs, 9.7% only at ground level, while 0.7% were caught only on roofs. For species with ≥ 5 occurrences in the whole data (503 species) the proportions were 74.4, 23.5, and 2.2%, respectively. Roofs and ground level sites were similar in the proportions of species belonging to different orders, the majority of which are good dispersers: Diptera was the most species rich order in every sampling occasion, followed by Hymenoptera, Hemiptera, Araneae, Coleoptera and Thysanoptera (Figure 2A). On roofs, the proportion of Hemiptera decreased with time, while the proportion of Hymenoptera increased. Most of the species that colonized the roofs were first or simultaneously found in the ground level sites (Figure 2B and Supplementary Material 3). The dataset including species with 10 occurrences in the whole data showed that even the smallest roofs had species that were collected from the same roof in at least three sampling occasions (Table 2), i.e., they either have established viable populations on roofs or recolonize them frequently. On the three smallest roofs, species that were collected four or five times out of five sampling occasions were frit flies (Diptera: Chloropidae) or small fruit flies (Diptera: Drosophilidae), whereas on the largest roof, species collected during every sampling occasion included frit flies and true bugs.
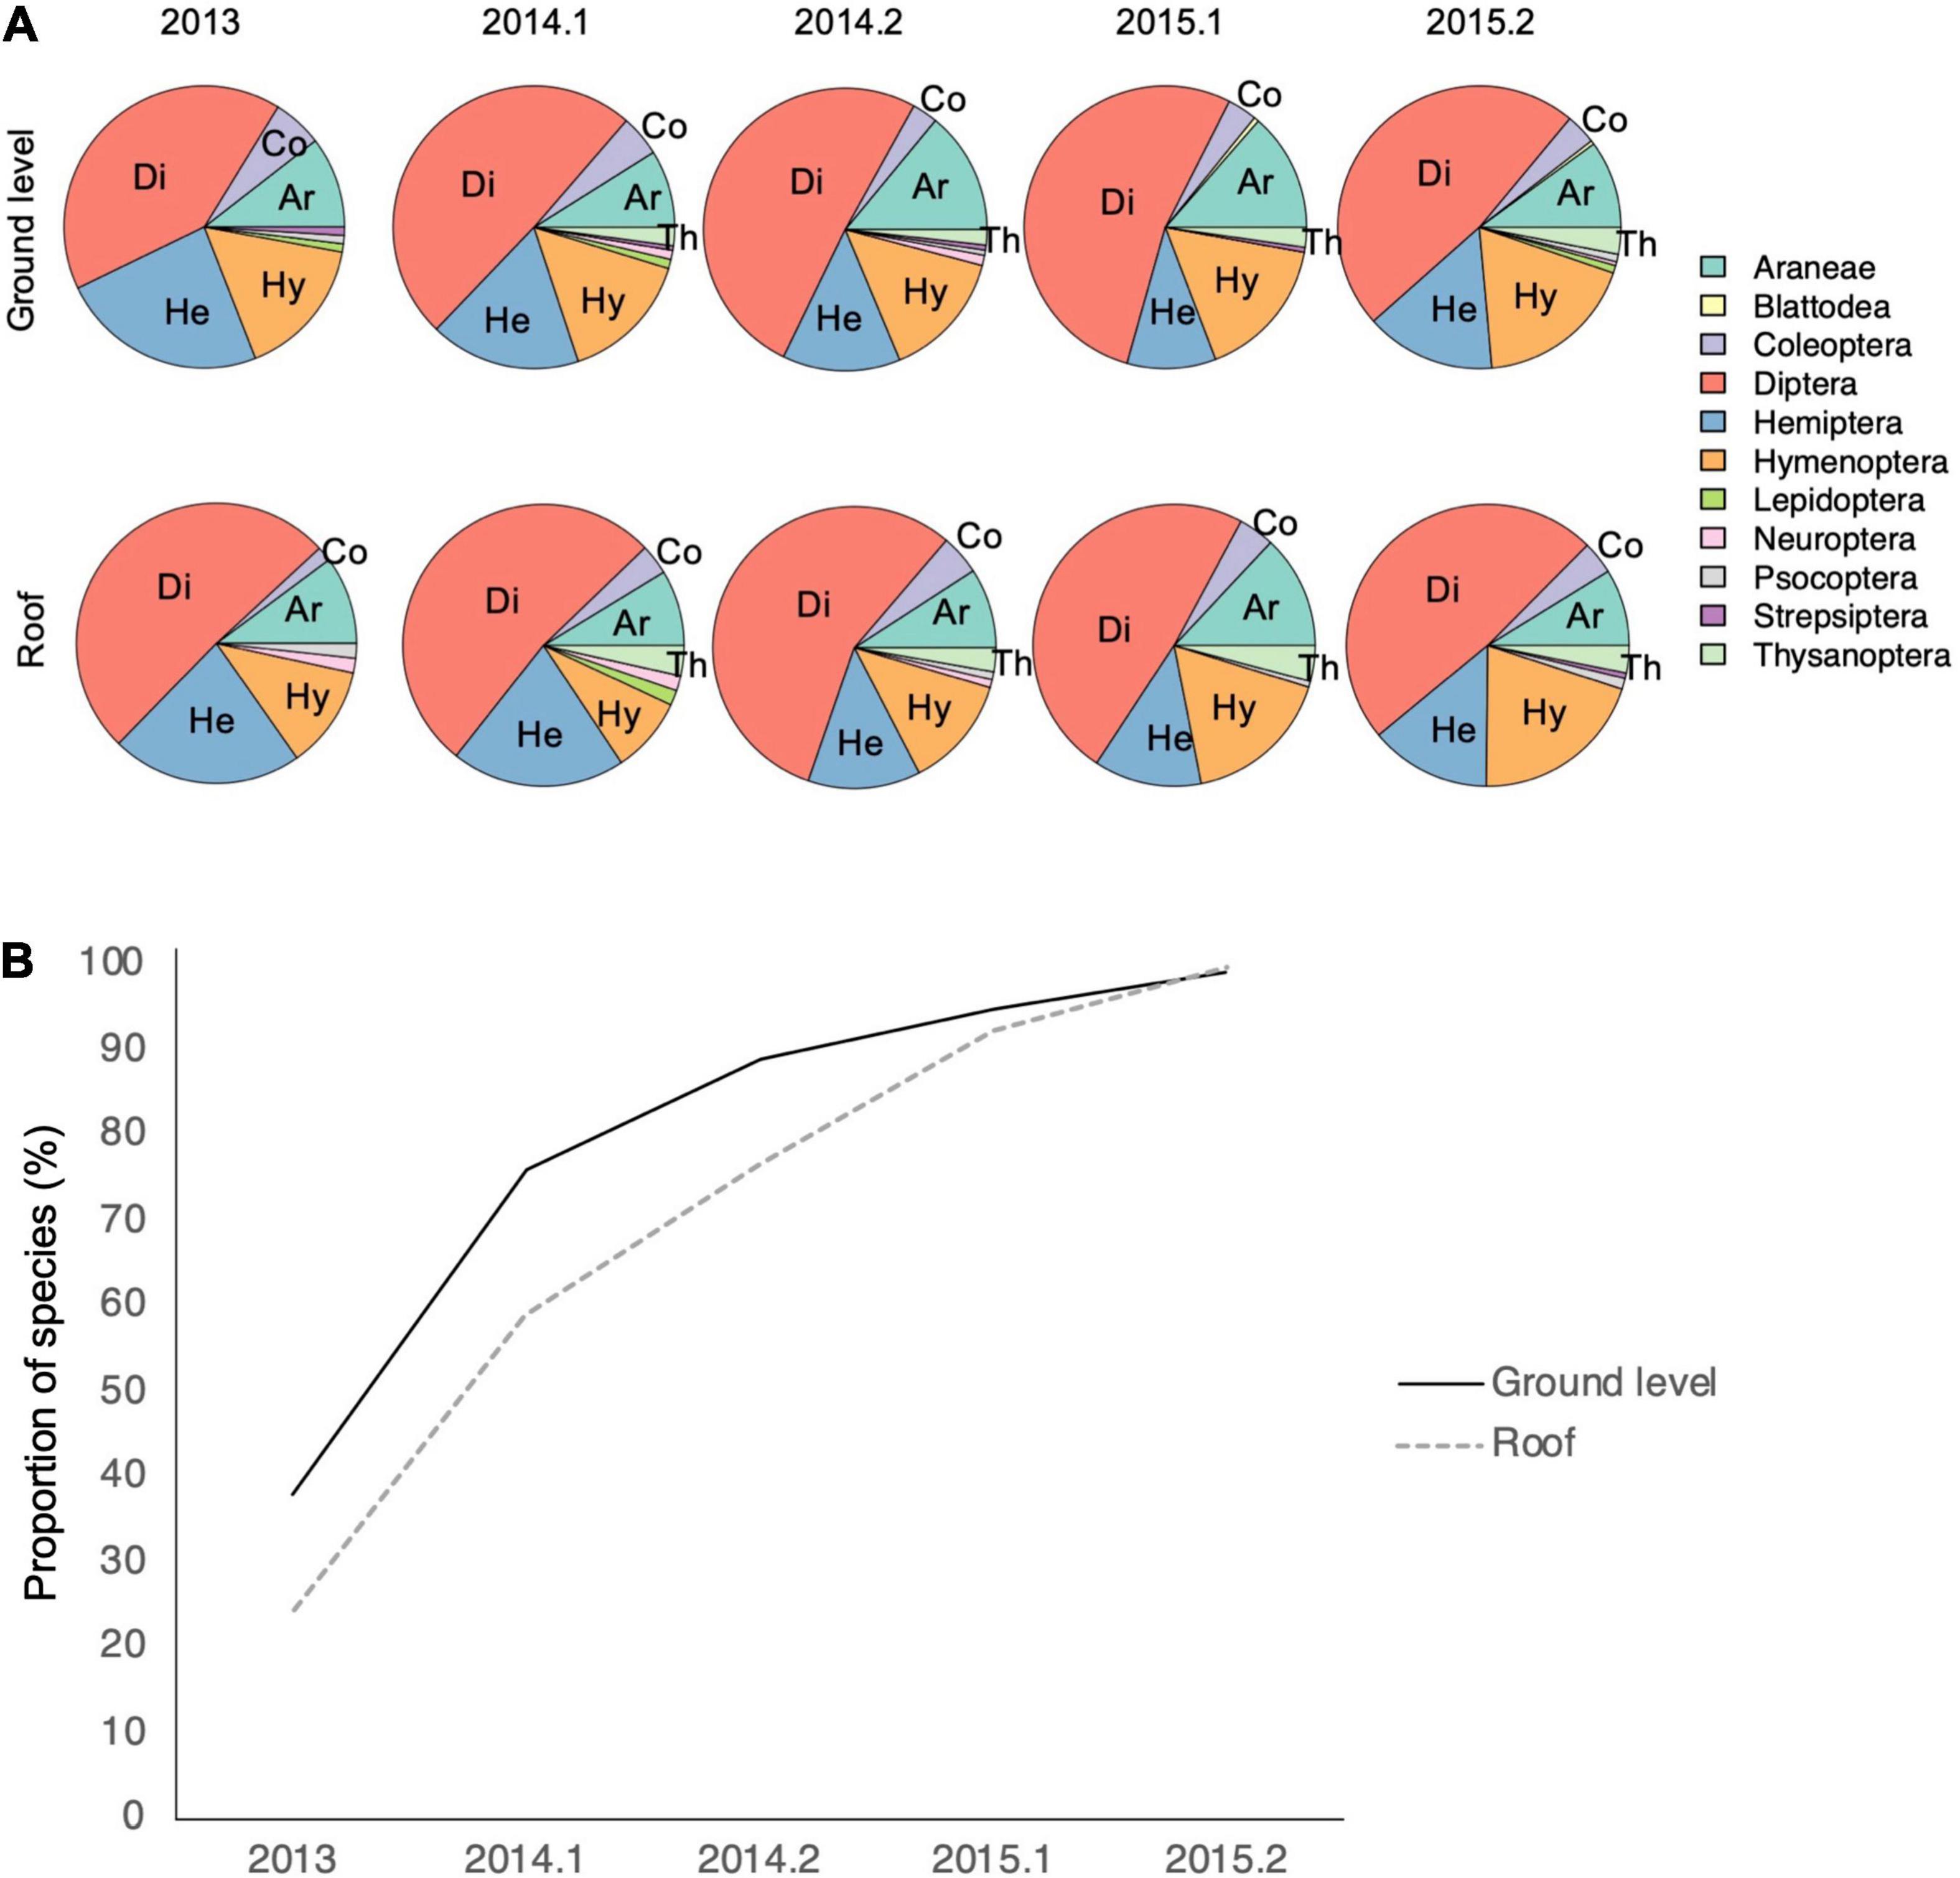
Figure 2. Proportions of OTUs by order on the roofs and in ground level sites (A) and the accumulation of OTUs in our roof data at the ground level reference sites and on roofs (B). Abbreviations of the most species rich orders are marked in the figure: Ar, Araneae; Co, Coleoptera; Di, Diptera; He, Hemiptera; Hy, Hymenoptera; Th, Thysanoptera. The y-axis in panel (B) shows the proportion of species, which were collected from roofs, by sampling occasion (x-axis: 0.1 = early summer, 0.2 = late summer) in the ground level sites (solid line) and on roofs (dashed line). Data from the two sampling occasions in 2013 are combined (A,B). Data for Thysanoptera are missing from 2013.
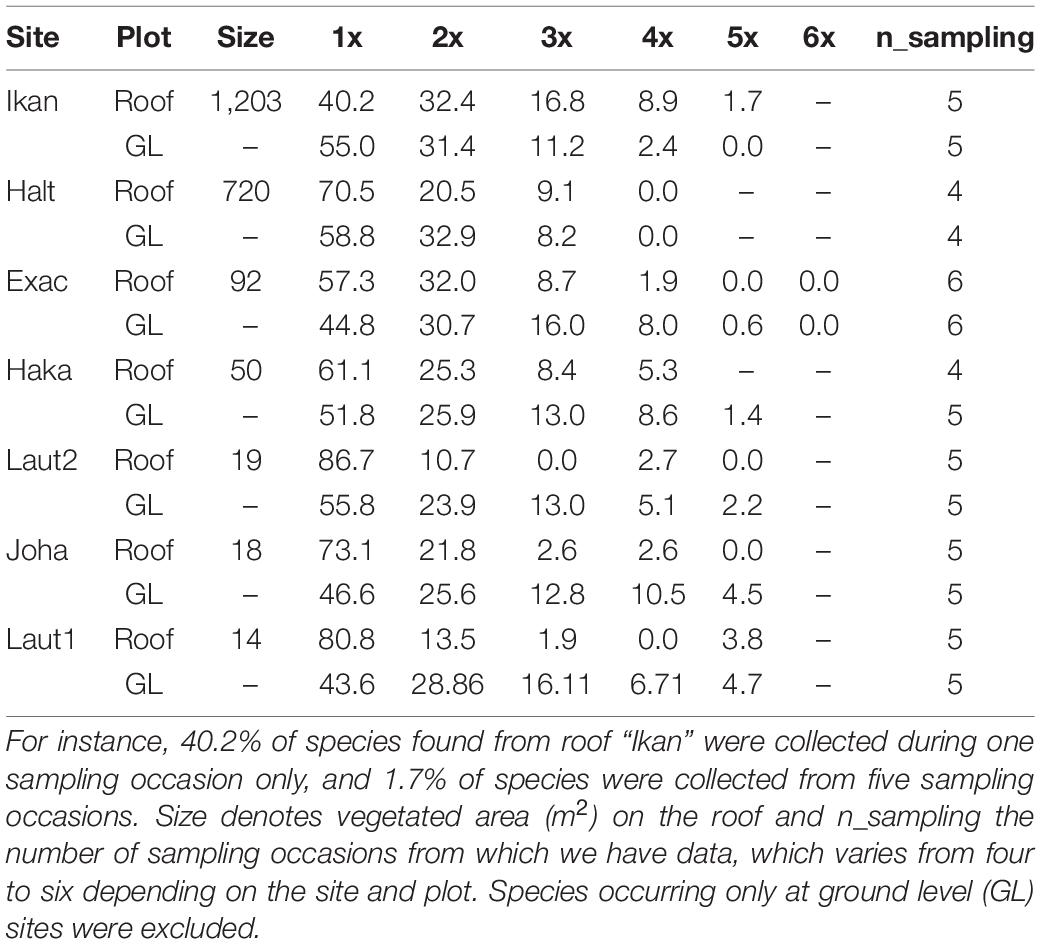
Table 2. Proportion (%) of species collected from the same site and plot during one sampling occasion (1x), two sampling occasions (2x), …, six occasions (6x, which is the maximum number of sampling occasions).
The AUC value describing the overall explanatory power of the roof vs. ground level model was 0.88. Variance partitioning of this model showed that arthropod communities differed between the roof and the ground, as the plot variable (i.e., whether sampled on the roof or at ground level) accounted for 21.6% of the total variance (Figure 3). Yet, the importance of the plot variable varied considerably depending on the taxon. For some groups, such as ants (Hymenoptera: Formicidae), plot typically explained > 50% of the variation, suggesting high occurrence either on roofs or on the ground, whereas for most chironomid species (Diptera: Chironomidae), the proportion explained by plot was < 10%, suggesting similar occurrence on the roofs and at ground level (Figure 3A). Sampling year and occasion accounted for 37% (year = 24.4%, sampling = 12.6%) of the variation, with an additional 10.9% variation due to differing effects of time on ground level and roof samples. Site, which was treated as a random term, explained 23.1% of the variation captured by the model.
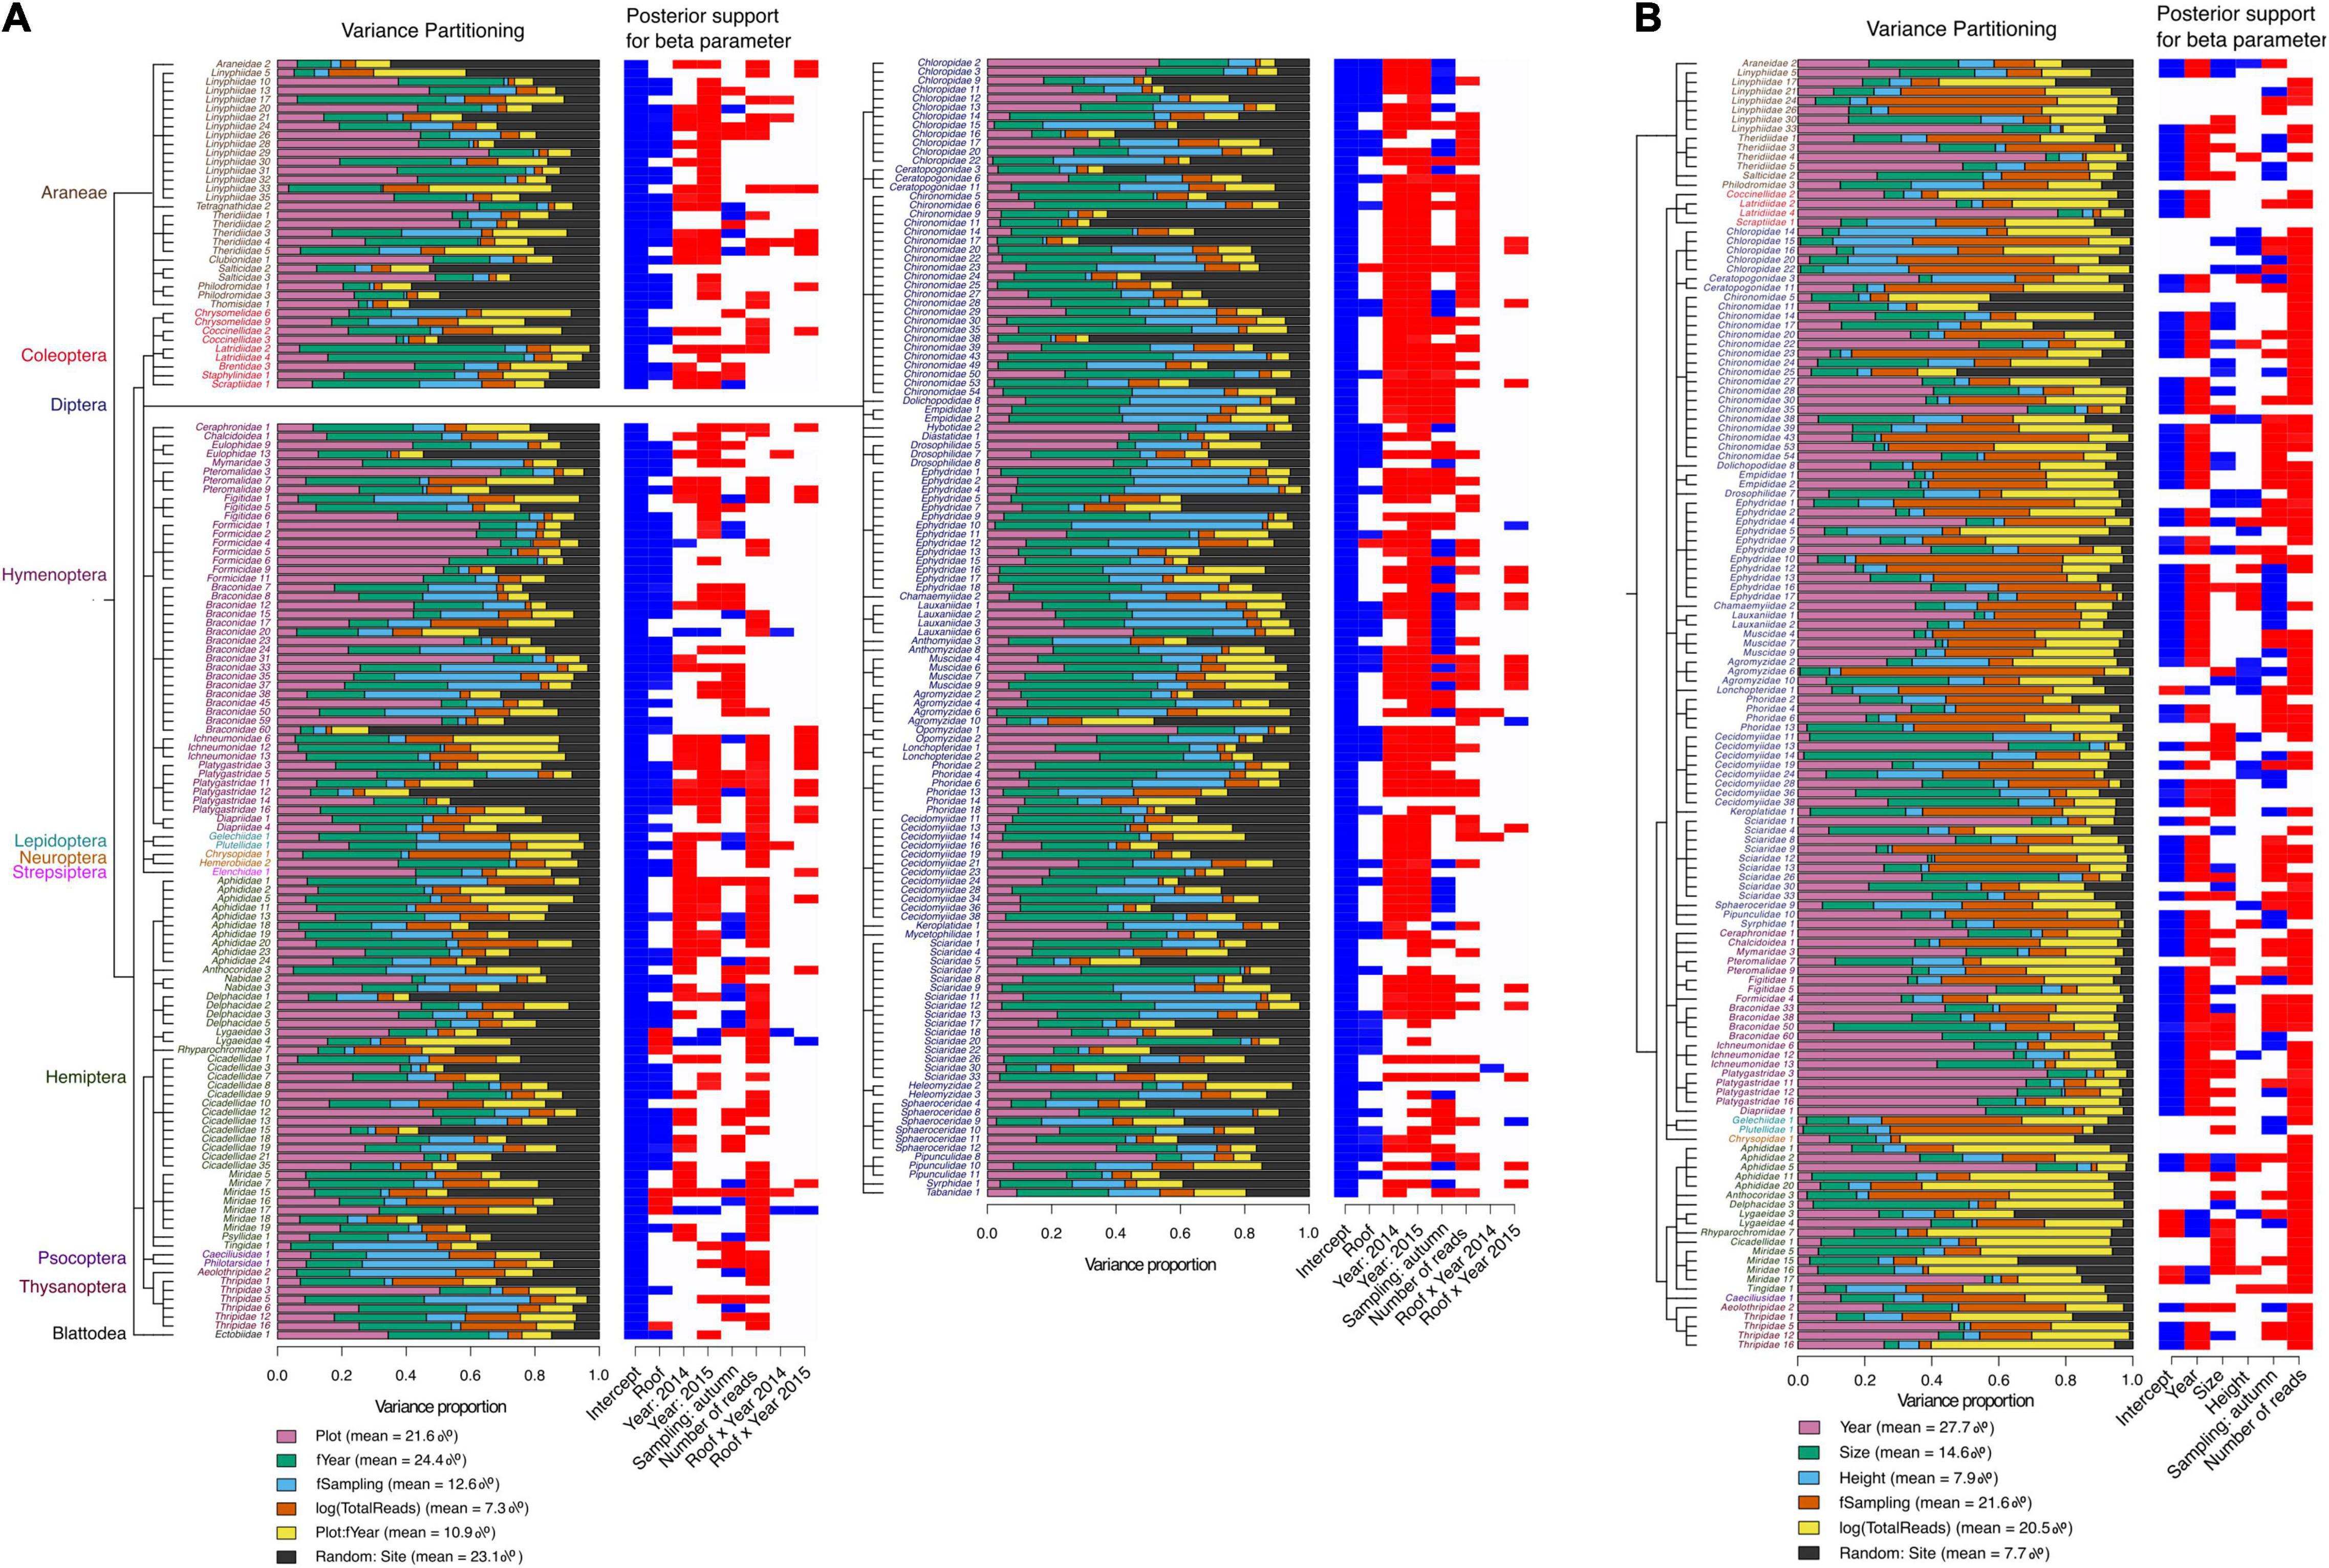
Figure 3. Proportion of variance explained by fixed and random effects (Variance partitioning, panels on the left) and posterior regression parameter values (Posterior support for beta parameter, panels on the right) showing species responses to model covariates. Model covariates are plotted in columns and species in rows. Fixed effects in the roof vs. ground model (A) include plot (roof or ground level), year as a three-level factor (2013, 2014, or 2015), sampling as a two-level factor (early or late summer), logarithm of the total number of reads (i.e., sequencing depth) and the plot x year interaction. Fixed effects of the roof model (B) include year as continuous variable, roof size, height, sampling and logarithm of read count. Random variation is at site level in both models. In the posterior regression parameter values, blue indicates negative responses and red positive with ≥ 0.95 posterior probability. Species order in A and B follows their phylogenetic relationships and IDs for species belonging to the same order have matching font colors. Diptera species are shown separately from other taxa for the roof vs. ground model (A). The roof vs. ground model data included 268 species (at least 10 occurrences in the whole data) and roof model data had 138 species (those with at least five occurrences in the roof data).
AUC of the roof model was 0.87. Time, i.e., year and sampling occasion (early summer and late summer), was an important predictor in the model as it accounted for 49.3% of the explained variance (year = 27.7%, sampling = 21.6%), while roof size and height explained 22.5% of the variance (14.6, and 7.9%, respectively) (Figure 3B). Site, included as a random term, explained 7.7% of the variation captured by the model.
Most species occurred more often in ground level habitats than on roofs, as shown by their negative responses (blue columns) with ≥ 0.95 posterior probability to the plot variable in the roof vs. ground model (Figure 3A). Similar year to year variation in species occurrences were observed in both roof vs. ground and roof models. With time (year, modeled either as a factor or a continuous variable), the majority of species increased in occurrence (red columns) regardless of their association with roofs in the roof vs. ground model (Figure 3A). However, some species increased more on the roofs than at ground level, i.e., showed a positive response to the interaction between roof plot and time. Furthermore, species association with early or late summer sampling varied in both the roof vs. ground and roof models (Figure 3), meaning that both roofs and ground level sites had some species that were collected only in early summer and some species that were caught only in late summer, i.e., species with different phenologies. In addition, the roof model showed that among the responses with posterior probability ≥ 0.95, there were both positive and negative responses to roof size and height, with more species responding to size (Figure 3B). Residual variation in species niches described as spearman rho-values, suggested moderate phylogenetic signals for both models: E[rho] = 0.6 for the roof vs. ground model and E[rho] = 0.55 for the roof model.
The roof vs. ground model showed an increase in species richness with time both on roofs and at ground level, and that species richness was higher at ground level compared to roofs at every sampling occasion (Figures 4A,B). The proportion of herbivores decreased and predators increased with time on roofs (Figures 4D,F). Ground level data showed different patterns: there was no difference in the proportion of herbivores between the first 2 years and only a small decrease occurred in the third year, whereas the proportion of predators first decreased and then increased (Figures 4C,E). Comparisons between roofs and ground sites showed that in 2013 and 2014 the proportion of herbivores was higher and the proportion of predators was lower on roof communities compared to ground sites, but in 2015 the proportion of herbivores was similar between roof and ground communities and the mean proportion of predators was only slightly higher in ground sites compared to roofs (Figures 4C–F).
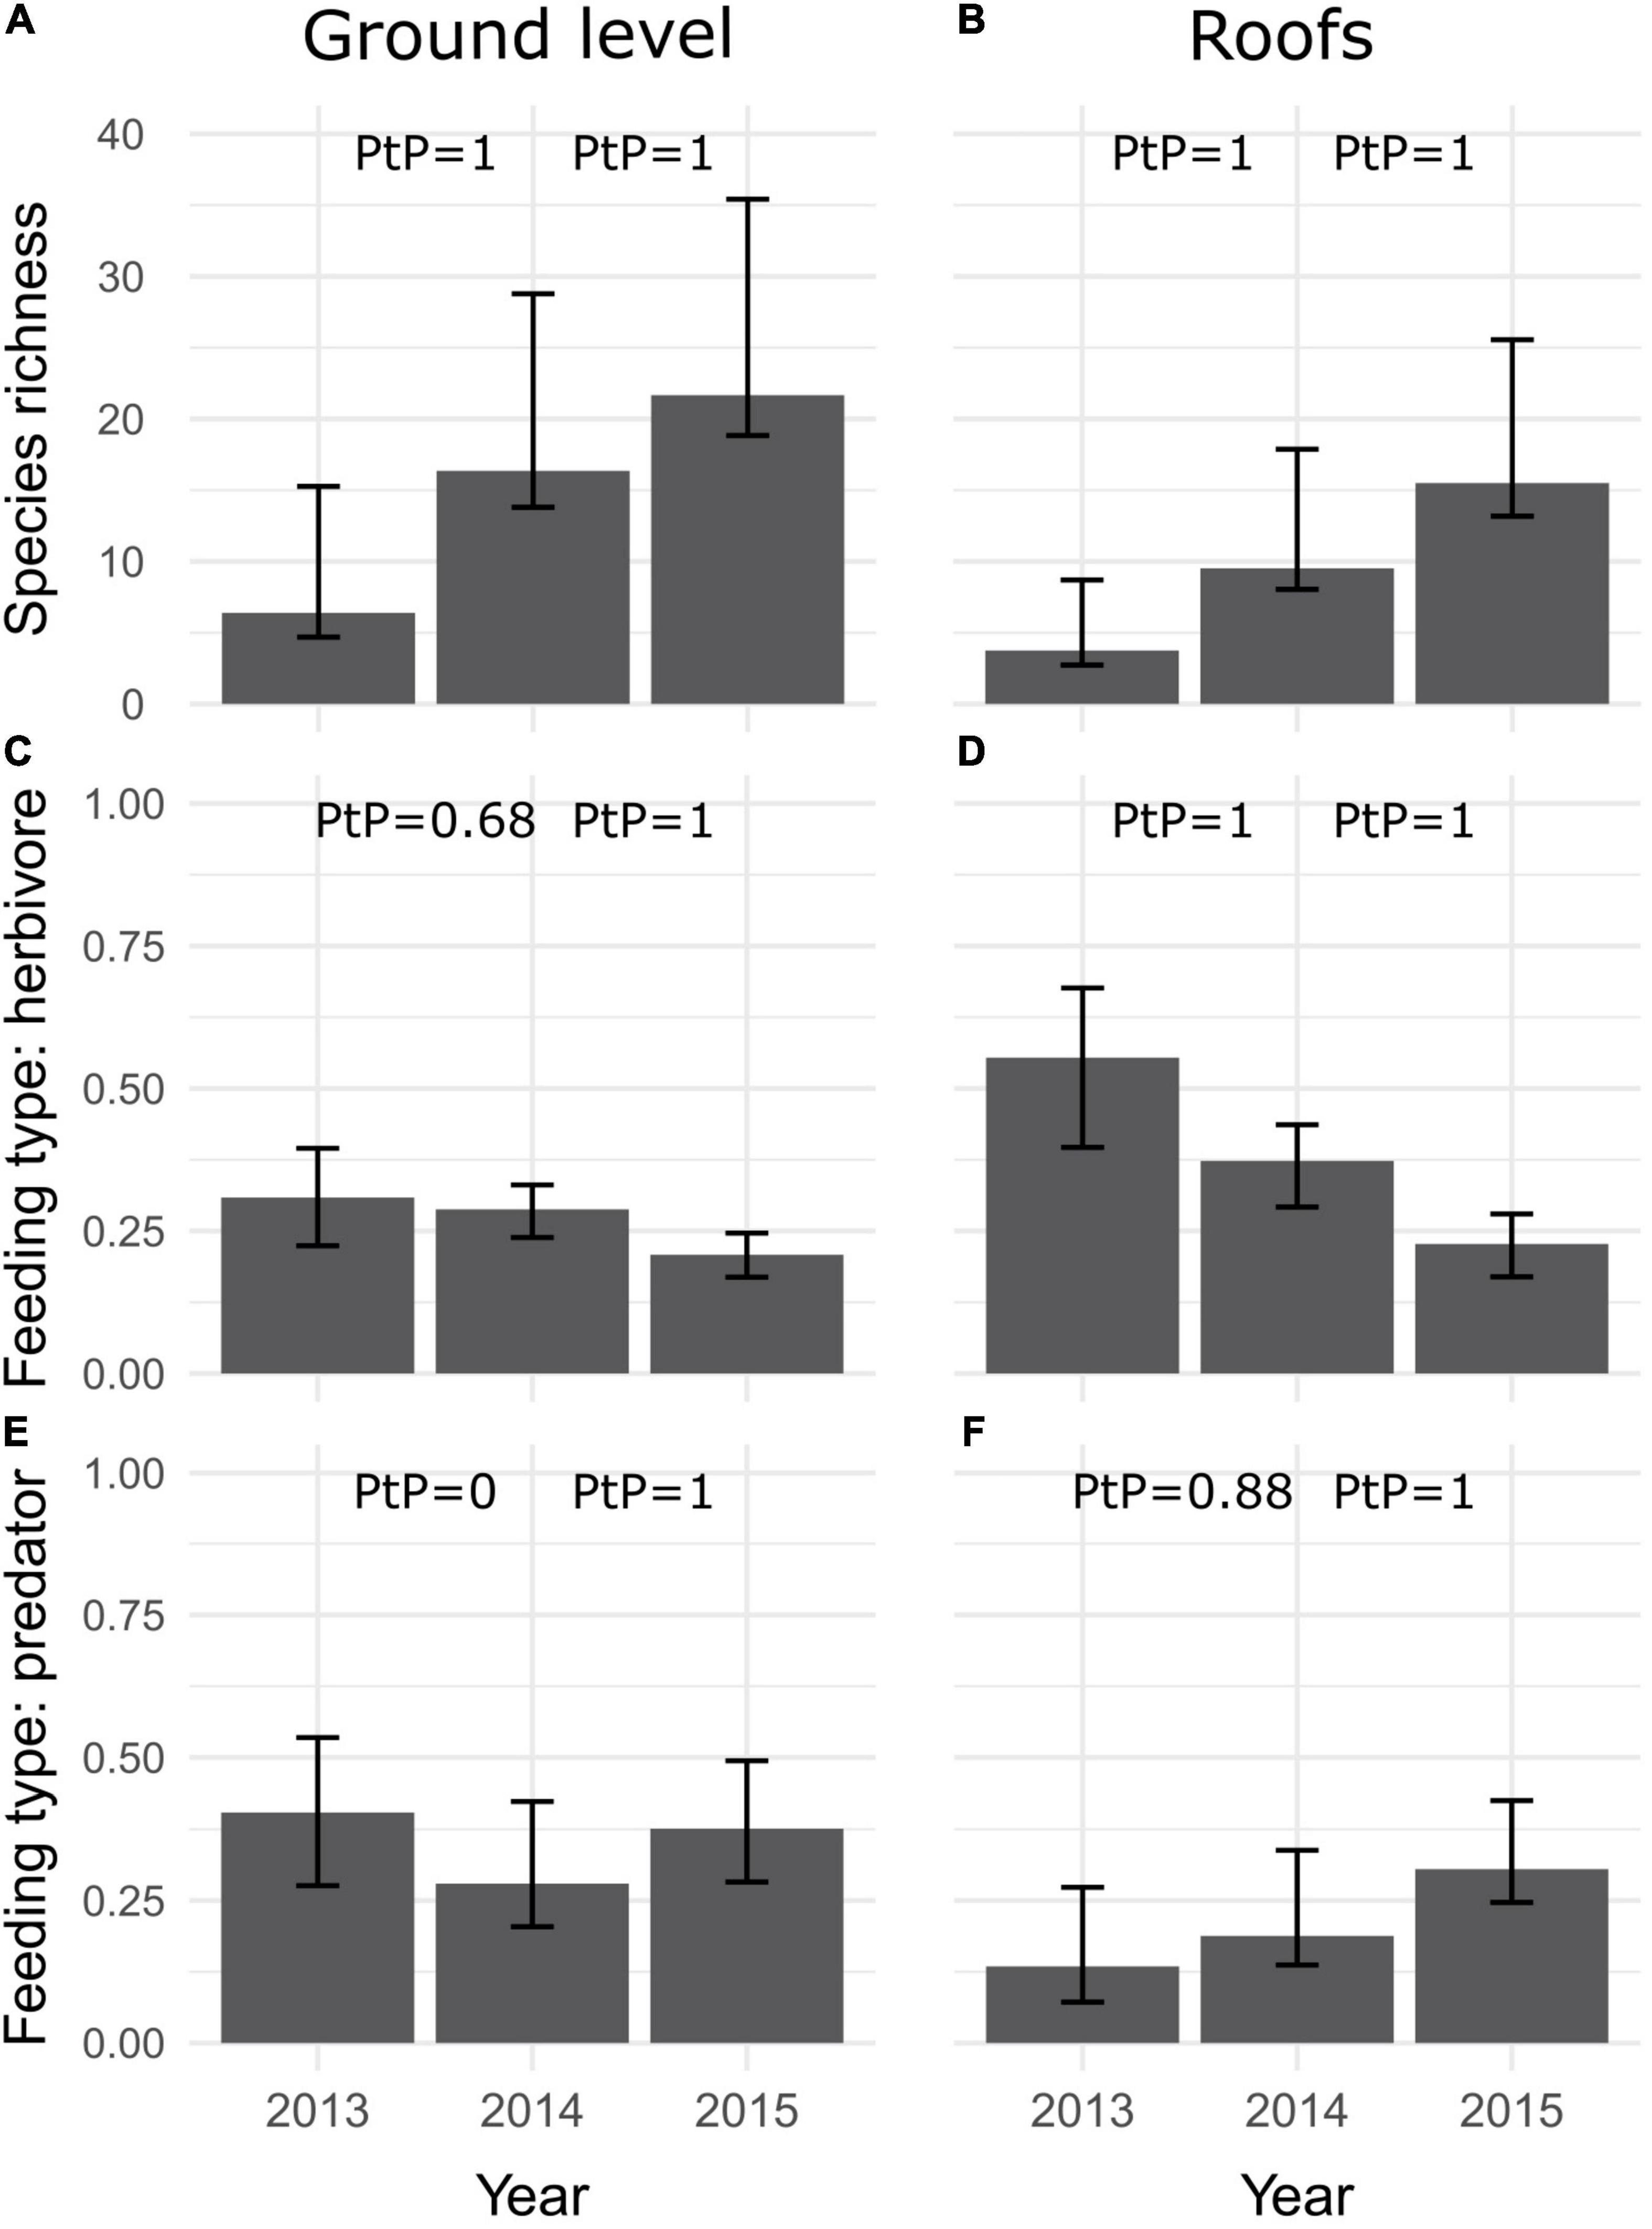
Figure 4. Prediction from the roofs vs. ground model for species richness (mean ± SE) (A,B), proportion of herbivores (C,D) and proportion of predators (E,F) across years. Plots on the left represent ground level sites and plots on the right, roofs. PtP = Posterior probability, where each value is for adjacent prediction scenarios being either larger (A,B,E,F) or smaller (C,D) in the latter year.
Predictions from the roof model showed an increase in species richness with time (a continuous variable in the roof model), but richness varied regardless of roof height and size (Figures 5A–C). The proportion of herbivores decreased with time and roof height but showed no response to roof size (Figures 5D–F), while predators increased with time, roof height and size (Figures 5G–I).
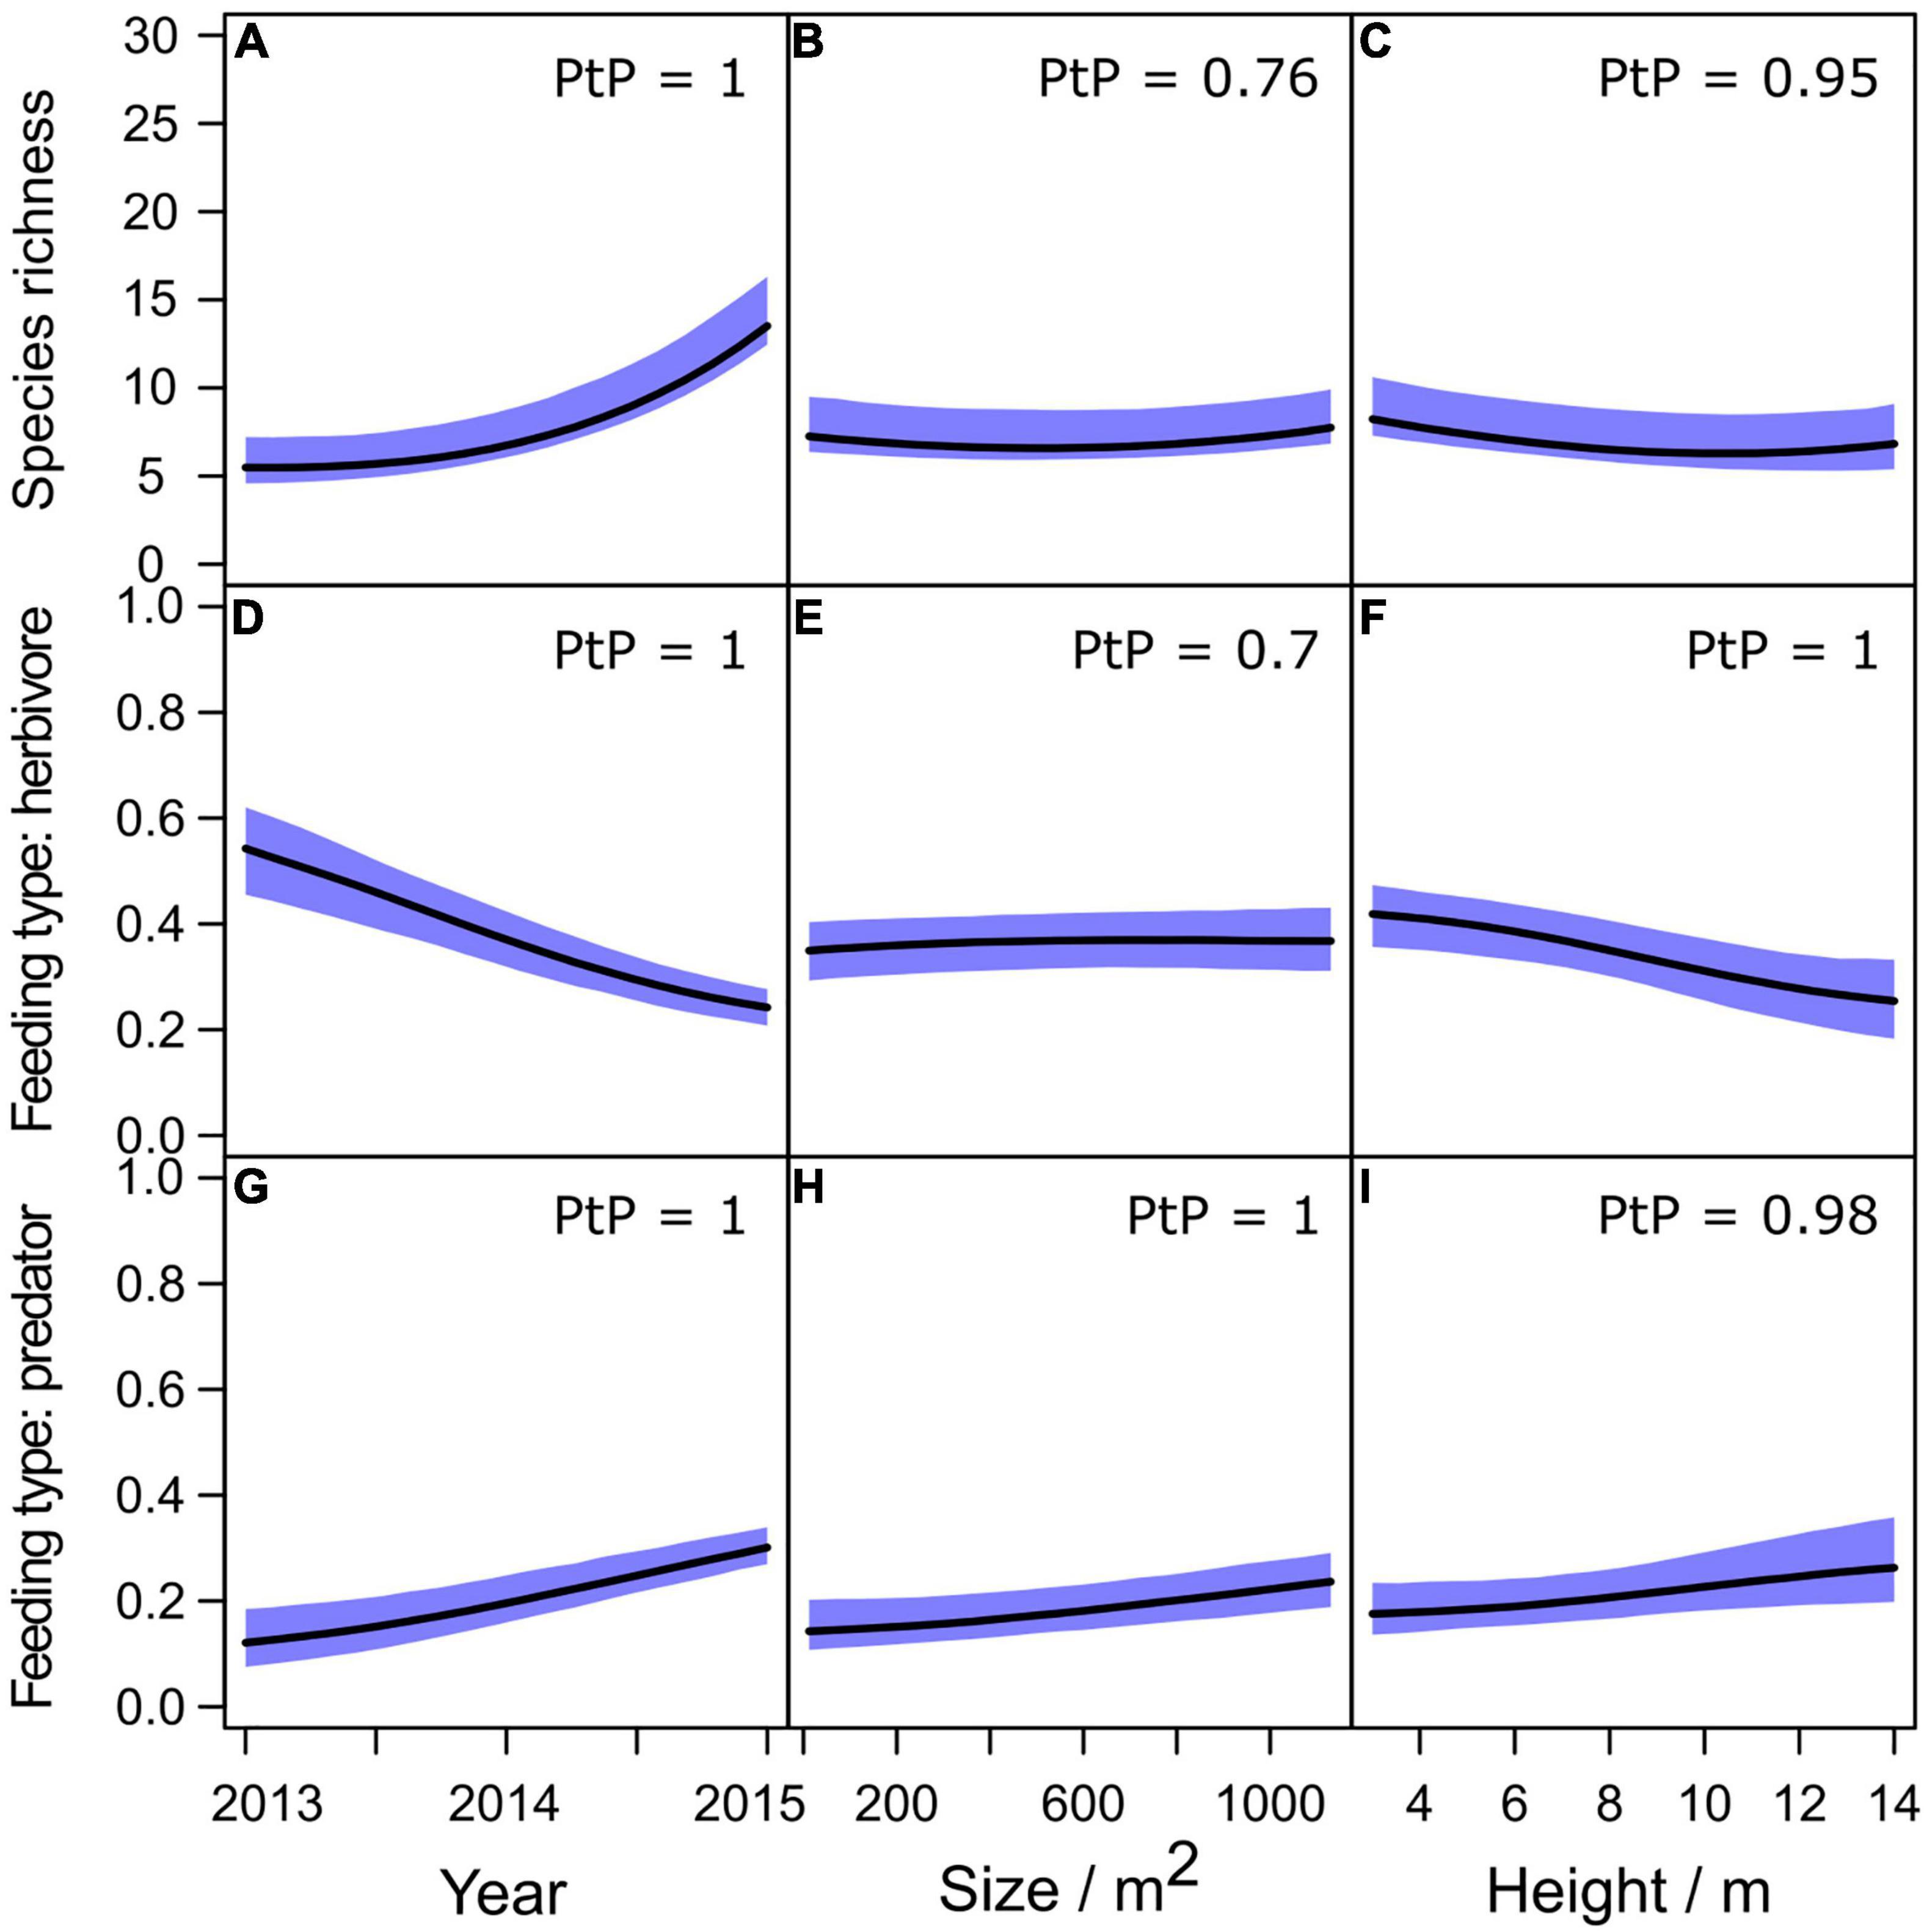
Figure 5. Predictions from the roof model showing patterns in expected species richness (A–C) and fractions of juvenile feeding types (D–I) with time (first column), roof size (second column) and roof height (third column). We set the sampling period to late summer and used the mean value of the logarithm of read count in all predictions. Confidence intervals for the predictions are plotted as colored areas. PtP = Posterior probability. The values are for prediction scenarios differing at the minimum and maximum covariate values.
Exclusion of data from 2013s second sampling (which we did to evaluate the effects of data that existed only for a single site for that particular sampling occasion) had only minor impacts on the results and all patterns reported above remained the same. The most notable difference was that the mean predicted species richness for the site that we had data was slightly higher for the second sampling in the models without late summer data from 2013 compared to models with all data. This indicates that our species richness predictions may be underestimates for 2013. However, since the difference in the predictions of mean species richness was small (1.5 species), the consistent increase in species richness with time appears valid.
Non-metric multidimensional scaling showed that roof arthropod communities may resemble their closest ground level habitats in the early phase of community assembly (1st year), but later the roof communities increase in similarity and start to resemble each other rather than ground habitats (Figures 6A,C). Ground habitats, in turn, showed an increase in variation in community composition (Figure 6B). In addition, the sampling sites formed two groups along the second ordination axis: brown (Haka, Joha, Laut1, and Laut2) vs. blue and green (Exac, Halt, and Ikan) symbols in Figures 6A–C, particularly for ground level plots (Figure 6B). These groups share similar ground level habitats: in the blue and green sites at least one of the ground level reference plots was a rocky meadow, whereas in the brown sites the ground level plots were frequently cut lawns or roadsides.
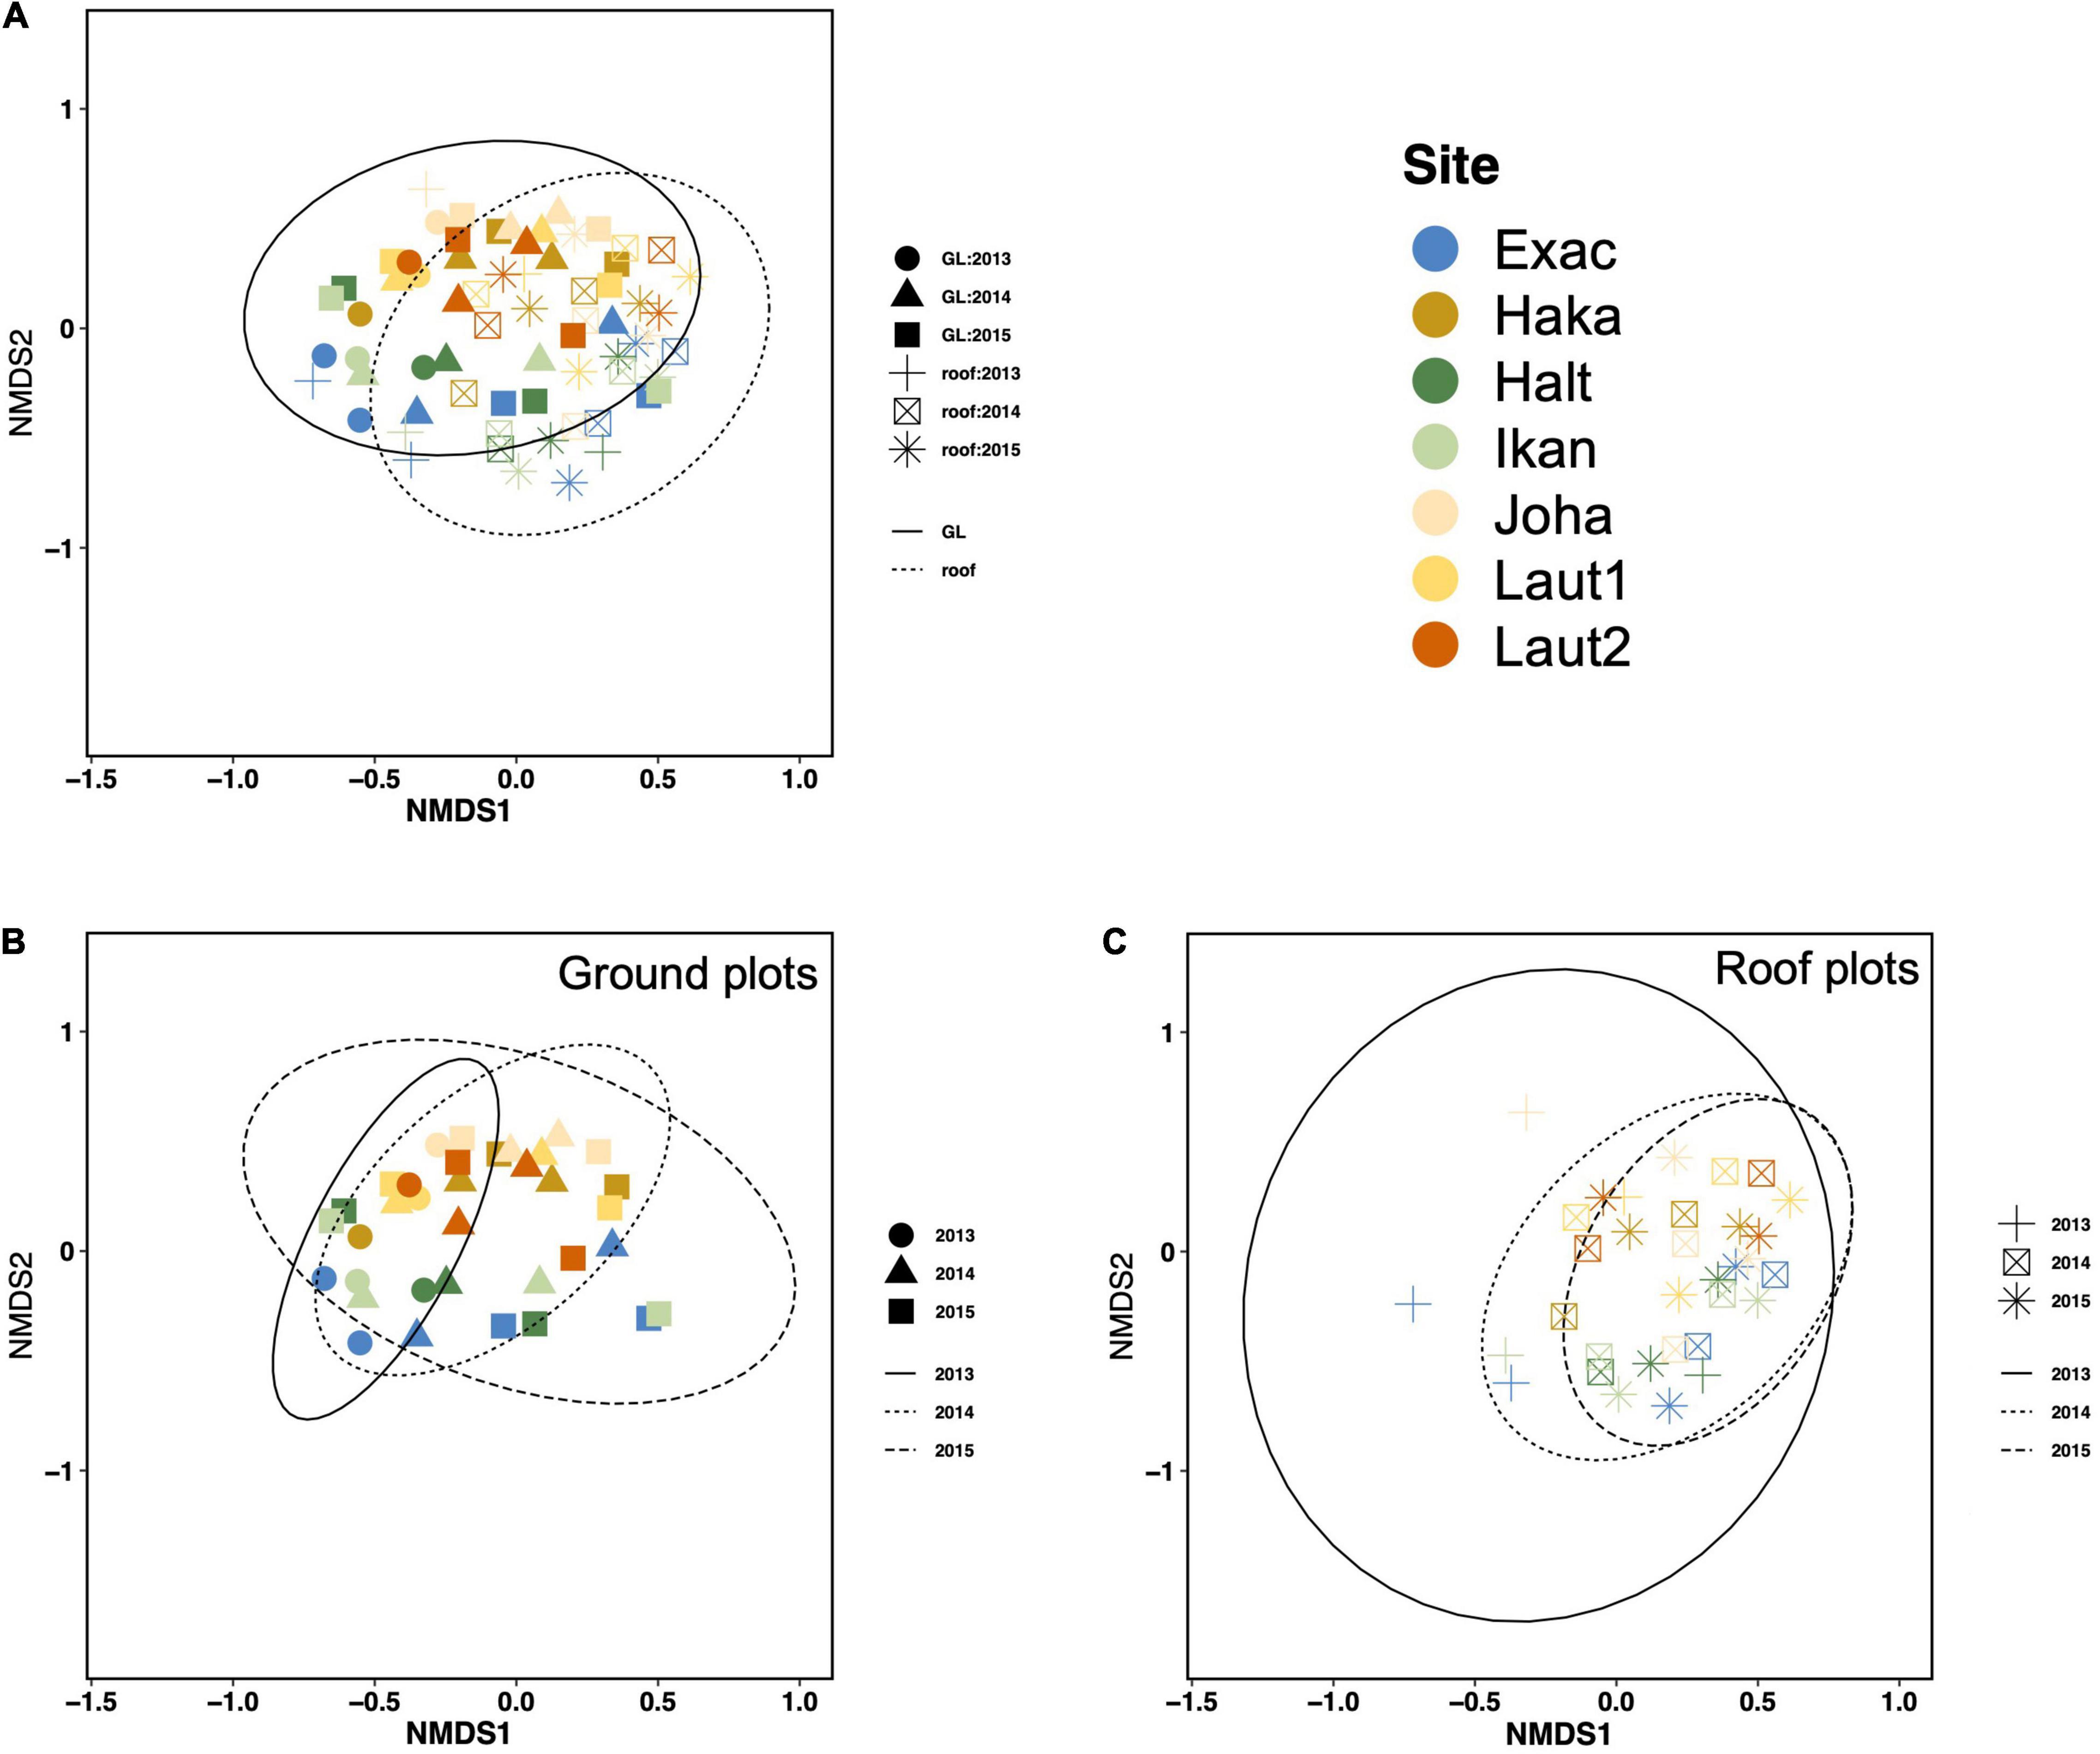
Figure 6. Non-metric multidimensional scaling (NMDS) of arthropod communities at ground level and on vegetated roofs (A). Plot (B) shows the results for ground sites only and plot (C) for roofs only. The 95% CI ellipses are drawn for plot type (A) or year (B,C). Different colors present different sites and the sampling occasions of the same year (early and late summer) are plotted with similar symbols. One observation (Laut2 roof, 2013 1st sampling event) was removed as an outlier from the NMDS data.
Arthropod communities and their temporal patterns on new vegetated roofs and in open ground level green space showed both similarities and differences. Species richness increased with time in both roof and ground level habitats, and most species that occurred on roofs were also found at ground level. The proportions of different orders were also similar at ground and roof habitats. Yet, species richness remained lower on the roofs compared to ground level. Furthermore, while on 1 year old roofs some of the communities showed similarity with those of their closest ground habitats, later on, the communities on roofs started to resemble each other rather than their ground level reference habitats. Also, yearly variation in the proportions of taxa assorted by their feeding traits differed between roof and ground level communities: the proportion of herbivores decreased with time and the proportion of predators increased on the roofs, while the proportions of feeding groups at ground level showed stochastic variation rather than any temporal trend. In addition, the initial arthropod assemblage on the studied roofs was dominated by herbivores compared to any point in time at ground level.
The fauna of vegetated roofs shared more species with ground level fauna than expected. Almost 90% of all the species with 10 occurrences occurred both on the roofs and at ground level. Therefore, for common species the dispersal barrier from vertical isolation of 3–14 m appeared of minor importance. Yet, suction sampling is biased toward smaller and lighter species, (Doxon et al., 2011) many of which may also be readily dispersed by air currents. Furthermore, we assume that species that were positively associated with roofs and negatively with time in the roof vs. ground model, arrived with roof materials (see Kyrö et al., 2020), but disappeared later from these roofs. Later on, some species started to thrive on the roofs (taxa responding positively to the interaction between roof and time) and their parasitoids became common.
Rooftop arthropod communities resembled those of nearby ground level habitats when described at the order level, but species data revealed roofs to differ from ground habitats, underlining problems related to the use of coarse level taxonomic data in studying community responses. Different taxonomic resolutions likely explain why our results contradict Dromgold et al. (2020), who suggested arthropod communities on vegetated roofs and at ground level to be similar, since they investigated communities at the family level. The roofs we studied seemed to filter arthropods in a similar way as the roof communities became more similar with time, while at ground level community variance increased with time. The strength of this roof filter was taxon specific, as there were species that occurred similarly at ground level and on roofs, i.e., the proportion of variance explained by plot variable was small (e.g., most Diptera), and species that were found on roofs only if they were abundant at ground level, i.e., the proportion of variance explained by the plot variable was large and they were negatively associated with roofs (e.g., ants) (Figure 3A). The high variation in community composition between roofs in the first year’s data is likely a consequence of strong random processes, like stochastic dispersal, at the beginning of community assembly. With time, the effect of random colonization events decreases and the importance of deterministic assembly processes increase (del Moral, 2009). We suggest that the increase in community similarity between roofs reflects a deterministic process where only certain species that share similar traits (see e.g., Braaker et al., 2017; Kyrö et al., 2018) are able to survive and reproduce on roofs, and thus, increase in occurrence in roof habitats with time more than species that occur on the roofs due to random colonization.
These deterministic processes are likely driven by both abiotic and biotic filters but identifying them and evaluating their relative roles require further studies, preferably including experimental data (Chase and Myers, 2011; Kraft et al., 2015). However, as all the roofs had shallow substrates and little shading, we hypothesize substrate moisture to be an important filter (Hansen et al., 2016; Prather et al., 2020) and encourage the inclusion of substrate moisture data in research on vegetated roof arthropod communities. It is highly likely that species with poor drought tolerance will fail to establish viable populations on roofs that have easily drying substrates. Observations that the arthropod fauna of such roofs typically consists of species associated with dry and xeric habitats and of tolerant habitat generalists (Brenneisen, 2006; Madre et al., 2013; Kyrö et al., 2018, 2020; Pétremand et al., 2018) supports this assumption. As vegetation was also more similar between roofs than between roof and ground level plots, we consider it as another likely important filter for the roof fauna (Siemann et al., 1999; Langellotto and Denno, 2004; Haddad et al., 2009). Another potential environmental variable that affects arthropods is plant biomass that tends to be low on new roofs and particularly on roofs that have shallow substrate. Low plant biomass may have hampered herbivores from establishing on the roofs we studied (Prather and Kaspari, 2019). We suggest the decrease in the proportion of herbivores in our data to be explained by both low plant biomass and an increase in predation pressure, possibly accompanied with poor tolerance to abiotic conditions on roofs.
Supporting our predictions on temporal patterns in species richness, new roofs accumulated species with time. Yet, as species richness predictions were, to some extent, extrapolated for 2013, the increase in the number of species from 2013 to 2014 could be less steep than shown in our predictions (Figures 4A,B). The increase in proportion of predators in roof communities was partly explained by an increase in parasitoids. As parasitoids are able to establish only after suitable host species have colonized the roofs, we interpret that these patterns, an increase in both total species richness and occurrences of parasitoids with time, point to true succession of the arthropod fauna on roofs. The low species richness at ground level in the first year’s data (2013) can partly be explained by the lack of late summer data as the late summer samples had, in general, more species than the early summer samples. Yet, as the early summer samples also had less species in 2013, compared to 2014 and 2015, it is likely a consequence of weather conditions. Spring (from March to May) and the first two summer months (June and July) of 2013 were exceptionally dry, accompanied by exceptionally warm summer (June to August) temperatures.5 This may have decelerated arthropod colonization of new roofs via two mechanisms: (1) by hindering the growth and succession of roof vegetation and (2) by decreasing source populations at ground level. The growing seasons of 2014 and 2015 were also exceptionally warm, but with more precipitation, particularly in 2015. Consequently, conditions were better for plants, as shown by an increase in both vegetation cover and plant species richness with time (Müllner et al., unpublished data) with likely positive effects on arthropods.
The low number of replicates and limited building height range may explain, at least partly, why we failed to find support for predictions derived from the classical Island Biogeography Theory (IBT) (MacArthur and Wilson, 1967) that predicts species richness to increase with patch size (here roof size) and connectivity to source habitat (here building height). Yet, as suggested by Kyrö et al. (2020), the low utility of predictions derived from IBT on vegetated roofs may also relate to the small-island effect: in small habitat patches variation in species richness is no longer connected to patch size, but e.g., effects of habitat quality are more important (Lomolino, 2000; Wang et al., 2018). Yet, roof size may be important in shaping temporal patterns in the vegetated roof arthropod fauna. Frequent drought stress that is typical for vegetated roofs with shallow substrates (Köhler and Poll, 2010) should decrease stability of arthropods communities (Tsafack et al., 2019), but we suggest that the importance of stochasticity in species occurrences and in temporal community patterns of new vegetated roofs is also connected to roof size. Excluding the largest roofs, more than half of the 240 species with at least 10 occurrences in the whole data were collected from a particular roof only once. On the three very small roofs, species that were collected several times were all small herbivorous flies, while on the largest roof species that were collected during every sampling occasion included both small flies and herbivorous true bugs. Similarly to the three smallest roofs, the second largest roof had > 70% of the species collected only once, but this roof had no additional substrate under the succulent-moss mats and, thus, suffered from high drought stress.
Although small size and/or high environmental stress may decrease the stability of roof communities, even the smallest roofs had arthropods that were collected in consecutive years. Without direct observations or experiments, we cannot be certain whether these species overwinter or recolonize the same roofs every year. Yet, we agree with Bergeron et al. (2018), who suggested based on seasonal data from spiders and carabid beetles that vegetated roofs are suitable for overwintering of arthropods, at least for species that do not burrow in the soil. A minimal level of maintenance of roof vegetation may even promote the overwintering success in roof habitats compared to urban ground level habitats that are, e.g., still mown in the autumn (Schmidt et al., 2008; Unterweger et al., 2018), but further studies are required for a proper evaluation of overwintering success.
Despite the increase in species richness with time on roofs, the number of species remained lower on roofs compared to ground level plots throughout the study. The lower arthropod richness compared to ground level habitats with low open vegetation is a well-documented feature of roofs with roughly corresponding vegetation types (Colla et al., 2009; Tonietto et al., 2011; Braaker et al., 2017; Sánchez Domínguez et al., 2020), but its effects on community dynamics and ecological networks of such roofs are poorly understood. The low species richness on roofs does not, however, seem to lead to a lower functional diversity of roofs compared to ground level (Braaker et al., 2017). Yet, Braaker et al. (2017) also found that the trait composition of arthropod assemblages on roofs with minimal maintenance is distinct from their reference open ground level habitats, which may point to differences in the ecological functioning of roofs compared to ground level habitat (Hooper et al., 2005). Moreover, even if ecological functioning of these roofs corresponded to ground level habitats, low species richness accompanied with high environmental stress from frequently occurring droughts, strong winds and high levels of UV-radiation, is likely to decrease the stability of arthropod communities on vegetated roofs (Jiang and Pu, 2009; Campbell et al., 2011).
Spiders, true bugs and ants that were collected from the roofs in every sampling occasion included several species that were previously found to be common on 3–21 year old vegetated roofs in the study area (Supplementary Material 2; Kyrö et al., 2020), supporting the assumption that vegetated roofs are mainly colonized by species that are common and abundant in local ground level habitats. According to molecular identifications, one of the true bug species with positive roof association was Chlamydatus evanescens—a species that has earlier been suggested to arrive on roofs with imported vegetation mats in Helsinki (Finland) (Kyrö et al., 2020) and London (United Kingdom) (Kadas, 2006). The species was collected from the roofs in every sampling occasion, but was first found at ground level in the second sampling of the second year. Vegetated roofs are expected to sometimes create sink habitats for arthropods (Rumble et al., 2018), but assuming that C. evanescens has arrived on roofs with construction materials, roofs also appear to be able to function as sources, or at least, and alarmingly, as agents for exotic species.
Gaps in the 2013 data decrease the credibility of patterns observed in the arthropod communities 1 year after the roofs were established. As we have pointed out, our predictions may underestimate species richness in 2013, but as the difference in species richness between 2013 and 2014 was large, we believe that the pattern of constant increase in species richness is likely correct. Moreover, according to data from the first sampling in 2013, some roof communities resembled their closest ground level habitats, but in 2014 the roof communities started to show similarity with each other rather than their closest source habitats and this pattern persisted in 2015 data. As data from the second sampling in 2013 were missing for all but one site, we do not know whether the roof communities remained as subsets of their closest ground level plots until 2014 or if their successional pathways started to diverge from ground communities already during the growing season of 2013. Also, 3 years is a short time frame and following the study sites for a longer time period, e.g., 5 years, would have decreased the impact of chance effects related to exceptional weather conditions of an individual year. It would be also interesting to determine whether the roofs remained similar as they matured, or if succession of roof vegetation proceeded in different directions and started to cause differences between arthropod communities. Furthermore, molecular identifications also contain potential sources of error. For example, in large samples, the limited sequencing depth may lead to false omissions of taxa that are small or which our primers may amplify insufficiently. Also, our partial barcodes may, in some cases, lead to incorrect assignations for closely related species, but this does not affect ecological interpretations. Finally, as communities on different kinds of vegetated roofs may develop in different directions, our results have limited generalizability, since all the roofs had shallow substrates, roughly similar initial vegetation, and the roofs were mostly very small.
We showed that young vegetated roofs with shallow substrates filter arthropods in a way that produces novel assemblages resembling each other and show successional pathways that lead the roofs to diverge from their closest source habitats. We did not find support for priority effects, as the roof communities should have started to diverge from each other with time if priority effects were important. Also, roof height and size did not seem to be important in shaping vegetated roof arthropod communities. Instead, we suggest a “habitat effect”, or vegetation effect (see Kyrö et al., 2020), to best explain arthropod community assembly on vegetated roofs. Thus, as a practical implication from this study, we underline the importance of roof design, including focusing on the vegetation (see Kotze et al., 2020) when building vegetated roofs to support biodiversity. Also, even though arthropod communities on young vegetated roofs diverge from habitats at ground level, they are connected to green space networks in the city, as shown by the importance of local ground level habitats as sources for the roof fauna. Therefore, we recommend designing roof habitats and open green space at ground level to support each other when possible.
The original contributions presented in the study are publicly available. This data can be found here: doi: 10.5061/dryad.qnk98sfj2 (Kyrö et al., 2022).
KK and SL conceived the original idea and designed the study. KK, DK, and SL conducted the field work. EV supervised the lab work and conducted all bioinformatics. KK and TK conduced the lab work and performed all the statistical analyses. KK, TK, DK, and SL planned the data analyses. KK wrote the first draft of the manuscript. All authors contributed to subsequent versions and revisions.
This study has been funded by the Maj and Tor Nessling Foundation, Kuopion Luonnonystäväin yhdistys, Societas pro Fauna et Flora Fennica, Carl Tryggers Stiftelse för Vetenskaplig Forskning (grant CTS 17:383), Jane and Aatos Erkko Foundation, Suomen Hyönteistieteellinen Seura, Uudenmaan liitto, TA Companies and Arkta Reponen Oy.
The authors declare that the research was conducted in the absence of any commercial or financial relationships that could be construed as a potential conflict of interest.
All claims expressed in this article are solely those of the authors and do not necessarily represent those of their affiliated organizations, or those of the publisher, the editors and the reviewers. Any product that may be evaluated in this article, or claim that may be made by its manufacturer, is not guaranteed or endorsed by the publisher.
We thank to Marja Mesimäki and Taina Suonio, for negotiations of study sites, and all those who kindly provided the study sites. We are grateful to Ferenc Vilisics for his contribution to planning of this study and to field work. We also thank Henri Järvisalo, Jesse Grothe, Giulia Cappelletto, and Elina Laurén for valuable assistance in the field and the lab, and Előd Kondorosy for identifications of those true bugs that were morphological identified.
The Supplementary Material for this article can be found online at: https://www.frontiersin.org/articles/10.3389/fevo.2022.785448/full#supplementary-material
Aljanabi, S. (1997). Universal and rapid salt-extraction of high quality genomic DNA for PCR- based techniques. Nucleic Acids Res. 25, 4692–4693. doi: 10.1093/nar/25.22.4692
Aloisio, J. M., Palmer, M. I., Tuininga, A. R., and Lewis, J. D. (2019). Plant colonization of green roofs is affected by composition of established native plant communities. Front. Ecol. Evol. 6:238. doi: 10.3389/fevo.2018.00238
Bergeron, J. A. C., Pinzon, J., and Spence, J. R. (2018). Carabid and spider population dynamics on urban green roofs. Zoosymposia 12:69. doi: 10.11646/zoosymposia.12.1.8
Blank, L., Vasl, A., Schindler, B. Y., Kadas, G. J., and Blaustein, L. (2017). Horizontal and vertical island biogeography of arthropods on green roofs: a review. Urban Ecosyst. 20:4. doi: 10.1007/s11252-016-0639-9
Braaker, S., Ghazoul, J., Obrist, M. K., and Moretti, M. (2014). Habitat connectivity shapes urban arthropod communities: the key role of green roofs. Ecology 95, 1010–1021. doi: 10.1890/13-0705.1
Braaker, S., Obrist, M. K., Ghazoul, J., and Moretti, M. (2017). Habitat connectivity and local conditions shape taxonomic and functional diversity of arthropods on green roofs. J. Anim. Ecol. 86, 521–531. doi: 10.1111/1365-2656.12648
Brenneisen, S. (2006). Space for Urban wildlife: designing green roofs as habitats in Switzerland. Urban Habit. 4, 27–36.
Cadotte, M. W., and Tucker, C. M. (2017). Should environmental filtering be abandoned? Trends Ecol. Evol. 32, 429–437. doi: 10.1016/j.tree.2017.03.004
Campbell, V., Murphy, G., and Romanuk, T. N. (2011). Experimental design and the outcome and interpretation of diversity-stability relations. Oikos 120, 399–408. doi: 10.1111/j.1600-0706.2010.18768.x
Chase, J. M. (2003). Community assembly: when should history matter? Oecologia 136, 489–498. doi: 10.1007/s00442-003-1311-7
Chase, J. M., and Myers, J. A. (2011). Disentangling the importance of ecological niches from stochastic processes across scales. Philos. Trans. R. Soc. B Biol. Sci. 366, 2351–2363. doi: 10.1098/rstb.2011.0063
Chen, X., Adams, B. J., Platt, W. J., and Hooper-Bùi, L. M. (2020). Effects of a tropical cyclone on salt marsh insect communities and post-cyclone reassembly processes. Ecography 43, 834–847. doi: 10.1111/ecog.04932
Colla, S., Willis, E., and Packer, L. (2009). Can green roofs provide habitat for urban bees (Hymenoptera: Apidae)? Cities Environ. 2, 1–12.
del Moral, R. (2009). Increasing deterministic control of primary succession on Mount St. Helens, Washington. J. Veg. Sci. 20, 1145–1154. doi: 10.1111/j.1654-1103.2009.01113.x
Dietick, E. J., Schlinger, E. I., and Van Den Bosch, R. (1959). A new method for sampling arthropods using a suction collecting machine and modified berlese funnel separator1. J. Econ. Entomol. 52, 1085–1091. doi: 10.1093/jee/52.6.1085
Doxon, E. D., Davis, C. A., and Fuhlendorf, S. D. (2011). Comparison of two methods for sampling invertebrates: vacuum and sweep-net sampling: methods of sampling invertebrates. J. Field Ornithol. 82, 60–67. doi: 10.1111/j.1557-9263.2010.00308.x
Dromgold, J. R., Threlfall, C. G., Norton, B. A., and Williams, N. S. G. (2020). Green roof and ground-level invertebrate communities are similar and are driven by building height and landscape context. J. Urban Ecol. 6:juz024. doi: 10.1093/jue/juz024
Edgar, R. C. (2010). Search and clustering orders of magnitude faster than BLAST. Bioinformatics 26, 2460–2461. doi: 10.1093/bioinformatics/btq461
Edgar, R. C. (2016). UNOISE2: Improved Error-Correction for Illumina 16S and ITS Amplicon Sequencing. Available onlne at: http://biorxiv.org/lookup/doi/10.1101/081257 (accessed November 14, 2016).
Emilsson, T. (2008). Vegetation development on extensive vegetated green roofs: influence of substrate composition, establishment method and species mix. Ecol. Eng. 33, 265–277. doi: 10.1016/j.ecoleng.2008.05.005
Fielding, A. H., and Bell, J. F. (1997). A review of methods for the assessment of prediction errors in conservation presence/absence models. Environ. Conserv. 24, 38–49. doi: 10.1017/S0376892997000088
Folmer, O., Black, M., Hoeh, W., Lutz, R., and Vrijenhoek, R. (1994). DNA primers for amplification of mitochondrial cytochrome c oxidase subunit I from diverse metazoan invertebrates. Mol. Mar. Biol. Biotechnol. 3, 294–299.
Fukami, T. (2015). Historical contingency in community assembly: integrating niches, species pools, and priority effects. Annu. Rev. Ecol. Evol. Syst. 46, 1–23. doi: 10.1146/annurev-ecolsys-110411-160340
Gabrych, M., Kotze, D. J., and Lehvävirta, S. (2016). Substrate depth and roof age strongly affect plant abundances on sedum-moss and meadow green roofs in Helsinki, Finland. Ecol. Eng. 86, 95–104. doi: 10.1016/j.ecoleng.2015.10.022
Garrard, G. E., Williams, N. S. G., Mata, L., Thomas, J., and Bekessy, S. A. (2018). Biodiversity sensitive urban design: biodiversity sensitive urban design. Conserv. Lett. 11:e12411. doi: 10.1111/conl.12411
Geller, J., Meyer, C., Parker, M., and Hawk, H. (2013). Redesign of PCR primers for mitochondrial cytochrome c oxidase subunit I for marine invertebrates and application in all-taxa biotic surveys. Mol. Ecol. Resour. 13, 851–861. doi: 10.1111/1755-0998.12138
Gillespie, R. G., and Roderick, G. K. (2002). Arthropods on islands: colonization, speciation, and conservation. Annu. Rev. Entomol. 47, 595–632. doi: 10.1146/annurev.ento.47.091201.145244
Haddad, N. M., Crutsinger, G. M., Gross, K., Haarstad, J., Knops, J. M. H., and Tilman, D. (2009). Plant species loss decreases arthropod diversity and shifts trophic structure. Ecol. Lett. 12, 1029–1039. doi: 10.1111/j.1461-0248.2009.01356.x
Hansen, R. R., Hansen, O. L. P., Bowden, J. J., Treier, U. A., Normand, S., and Høye, T. (2016). Meter scale variation in shrub dominance and soil moisture structure Arctic arthropod communities. PeerJ 4:e2224. doi: 10.7717/peerj.2224
Hebert, P. D. N., Ratnasingham, S., and de Waard, J. R. (2003). Barcoding animal life: cytochrome c oxidase subunit 1 divergences among closely related species. Proc. R. Soc. Lond. B Biol. Sci. 270, S96–S99. doi: 10.1098/rsbl.2003.0025
Hooper, D. U., Chapin, F. S., Ewel, J. J., Hector, A., Inchausti, P., Lavorel, S., et al. (2005). Effects of biodiversity on ecosystem functioning: a consensus of current knowledge. Ecol. Monogr. 75, 3–35. doi: 10.1890/04-0922
Jauni, M., Kuoppamäki, K., Hagner, M., Prass, M., Suonio, T., Fransson, A.-M., et al. (2020). Alkaline habitat for vegetated roofs? Ecosystem dynamics in a vegetated roof with crushed concrete-based substrate. Ecol. Eng. 157:105970. doi: 10.1016/j.ecoleng.2020.105970
Jiang, L., and Pu, Z. (2009). Different effects of species diversity on temporal stability in single-trophic and multitrophic communities. Am. Nat. 174, 651–659. doi: 10.1086/605961
Jusino, M. A., Banik, M. T., Palmer, J. M., Wray, A. K., Xiao, L., Pelton, E., et al. (2019). An improved method for utilizing high-throughput amplicon sequencing to determine the diets of insectivorous animals. Mol. Ecol. Resour. 19, 176–190. doi: 10.1111/1755-0998.12951
Kaunisto, K. M., Roslin, T., Forbes, M. R., Morrill, A., Sääksjärvi, I. E., Puisto, A. I. E., et al. (2020). Threats from the air: damselfly predation on diverse prey taxa. J. Anim. Ecol. 89, 1365–1374. doi: 10.1111/1365-2656.13184
Köhler, M., and Poll, P. H. (2010). Long-term performance of selected old Berlin greenroofs in comparison to younger extensive greenroofs in Berlin. Ecol. Eng. 36, 722–729. doi: 10.1016/j.ecoleng.2009.12.019
Kotze, D. J., Kuoppamäki, K., Niemikapee, J., Mesimäki, M., Vaurola, V., and Lehvävirta, S. (2020). A revised terminology for vegetated rooftops based on function and vegetation. Urban For. Urban Green. 49:126644. doi: 10.1016/j.ufug.2020.126644
Koskinen, J., Roslin, T., Nyman, T., Abrego, N., Michell, C., and Vesterinen, E. J. (2018). Finding flies in the mushroom soup: host specificity of fungus-associated communities revisited with a novel molecular method. Mol. Ecol. 28, 190–202. doi: 10.1111/mec.14810
Kraft, N. J. B., Adler, P. B., Godoy, O>O., James, E. C., Fuller, S., and Levine, J. M. (2015). Community assembly, coexistence and the environmental filtering metaphor. Funct. Ecol. 29, 592–599. doi: 10.1111/1365-2435.12345
Ksiazek-Mikenas, K., Herrmann, J., Menke, S., and Köhler, M. (2018). If you build it, will they come? plant and arthropod diversity on urban green roofs over time. Urban Nat. Spec. Issue 1, 52–72.
Kyrö, K., Brenneisen, S., Kotze, D. J., Szallies, A., Gerner, M., and Lehvävirta, S. (2018). Local habitat characteristics have a stronger effect than the surrounding urban landscape on beetle communities on green roofs. Urban For. Urban Green. 29, 122–130. doi: 10.1016/j.ufug.2017.11.009
Kyrö, K., Kankaanpää, T., Vesterinen, E. J., Lehvävirta, S., and Kotze, D. J. (2022). Data for: Arthropod Communities on Young Vegetated Roofs are more Similar to Each Other than to Communities at Ground Level. Dryad [Dataset].
Kyrö, K., Kotze, D. J., Müllner, M. A., Hakala, S., Kondorosy, E., Pajunen, T., et al. (2020). Vegetated roofs in boreal climate support mobile open habitat arthropods, with differentiation between meadow and succulent roofs. Urban Ecosyst. 23, 1239–1252. doi: 10.1007/s11252-020-00978-4
Langellotto, G. A., and Denno, R. F. (2004). Responses of invertebrate natural enemies to complex-structured habitats: a meta-analytical synthesis. Oecologia 139, 1–10. doi: 10.1007/s00442-004-1497-3
Leray, M., Yang, J. Y., Meyer, C. P., Mills, S. C., Agudelo, N., Ranwez, V., et al. (2013). A new versatile primer set targeting a short fragment of the mitochondrial COI region for metabarcoding metazoan diversity: application for characterizing coral reef fish gut contents. Front. Zool. 10:34. doi: 10.1186/1742-9994-10-34
Lomolino, M. V. (2000). Ecology’s most general, yet protean 1 pattern: the species-area relationship. J. Biogeogr. 27, 17–26. doi: 10.1046/j.1365-2699.2000.00377.x
Lundholm, J. T., and Marlin, A. (2006). Habitat origins and microhabitat preferences of urban plant species. Urban Ecosyst. 9, 139–159. doi: 10.1007/s11252-006-8587-4
MacArthur, R. H., and Wilson, E. O. (1967). The Theory of Island Biogeography. Princeton, NJ: Princeton University Press.
Madre, F., Vergnes, A., Machon, N., and Clergeau, P. (2013). A comparison of 3 types of green roof as habitats for arthropods. Ecol. Eng. 57, 109–117. doi: 10.1016/j.ecoleng.2013.04.029
Madre, F., Vergnes, A., Machon, N., and Clergeau, P. (2014). Green roofs as habitats for wild plant species in urban landscapes: first insights from a large-scale sampling. Landsc. Urban Plan. 122, 100–107. doi: 10.1016/j.landurbplan.2013.11.012
Maes, J., and Jacobs, S. (2017). Nature-based solutions for Europe’s sustainable development: Europe’s sustainable development. Conserv. Lett. 10, 121–124. doi: 10.1111/conl.12216
Martin, M. (2011). Cutadapt removes adapter sequences from high-throughput sequencing reads. EMBnet.J. 17:10. doi: 10.14806/ej.17.1.200
McDonald, R. I., Mansur, A. V., Ascensão, F., Colbert, M., Crossman, K., Elmqvist, T., et al. (2020). Research gaps in knowledge of the impact of urban growth on biodiversity. Nat. Sustain. 3, 16–24. doi: 10.1038/s41893-019-0436-6
McKinney, M. L., Gladstone, N. S., Lentz, J. G., and Jackson, F. A. (2019). Land snail dispersal, abundance and diversity on green roofs. PLoS One 14:e0221135. doi: 10.1371/journal.pone.0221135
Oberndorfer, E., Lundholm, J., Bass, B., Coffman, R. R., Doshi, H., Dunnett, N., et al. (2007). Green roofs as urban ecosystems: ecological structures, functions, and services. Bioscience 57:823. doi: 10.1641/B571005
Oksanen, J., Blanchet, G., Friendly, M., Kindt, R., Legendre, P., McGlinn, D., et al. (2018). vegan: Community Ecology Package. R Package Version 2.5-2. Available online at: https://CRAN.R-project.org/package=vegan.
Ovaskainen, O., and Abrego, N. (2020). Joint Species Distribution Modelling: With Applications in R. Cambridge: Cambridge University Press.
Ovaskainen, O., Tikhonov, G., Norberg, A., Guillaume Blanchet, F., Duan, L., Dunson, D., et al. (2017). How to make more out of community data? A conceptual framework and its implementation as models and software. Ecol. Lett. 20, 561–576. doi: 10.1111/ele.12757
Páll-Gergely, B., Kyrö, K., Lehvävirta, S., and Vilisics, F. (2014). Green roofs provide habitat for the rare snail (Mollusca, Gastropoda) species Pseudotrichia rubiginosa and Succinella oblonga in Finland. Memo. Soc. Fauna Flora Fenn. 90, 13–15.
Pétremand, G., Chittaro, Y., Braaker, S., Brenneisen, S., Gerner, M., Obrist, M. K., et al. (2018). Ground beetle (Coleoptera: Carabidae) communities on green roofs in Switzerland: synthesis and perspectives. Urban Ecosyst. 21, 119–132. doi: 10.1007/s11252-017-0697-7
Prather, R. M., Castillioni, K., Welti, E. A. R., Kaspari, M., and Souza, L. (2020). Abiotic factors and plant biomass, not plant diversity, strongly shape grassland arthropods under drought conditions. Ecology 101:e03033. doi: 10.1002/ecy.3033
Prather, R. M., and Kaspari, M. (2019). Plants regulate grassland arthropod communities through biomass, quality, and habitat heterogeneity. Ecosphere 10:e02909. doi: 10.1002/ecs2.2909
R Core Team (2019). R: A Language and Environment for Statistical Computing. R Foundation for Statistical Computing. Vienna: R Core Team.
Ratnasingham, S., and Hebert, P. (2007). BOLD: the barcode of life data system (www.barcodinglife.org). Mol. Ecol. Notes 7, 355–364. doi: 10.1111/j.1471-8286.2006.01678.x
Ratnasingham, S., and Hebert, P. D. N. (2013). A DNA-based registry for all animal species: the Barcode Index Number (BIN) system. PLoS One 8:e66213. doi: 10.1371/journal.pone.0066213
Rognes, T., Flouri, T., Nichols, B., Quince, C., and Mahé, F. (2016). VSEARCH: a versatile open source tool for metagenomics. PeerJ 4:e2584. doi: 10.7717/peerj.2584
Rumble, H., Finch, P., and Gange, A. C. (2018). Green roof soil organisms: anthropogenic assemblages or natural communities? Appl. Soil Ecol. 126, 11–20. doi: 10.1016/j.apsoil.2018.01.010
Salman, I., and Blaustein, L. (2018). Vegetation cover drives arthropod communities in mediterranean/subtropical green roof habitats. Sustainability 10:4209. doi: 10.3390/su10114209
Sánchez Domínguez, M. V., González, E., Fabián, D., Salvo, A., and Fenoglio, M. S. (2020). Arthropod diversity and ecological processes on green roofs in a semi-rural area of Argentina: similarity to neighbor ground habitats and landscape effects. Landsc. Urban Plan. 199:103816. doi: 10.1016/j.landurbplan.2020.103816
Schindler, B. Y., Griffith, A. B., and Jones, K. N. (2011). Factors influencing arthropod diversity on green roofs. Cities Environ. 4, 1–20.
Schmidt, M. H., Rocker, S., Hanafi, J., and Gigon, A. (2008). Rotational fallows as overwintering habitat for grassland arthropods: the case of spiders in fen meadows. Biodivers. Conserv. 17, 3003–3012. doi: 10.1007/s10531-008-9412-6
Seto, K. C., Guneralp, B., and Hutyra, L. R. (2012). Global forecasts of urban expansion to 2030 and direct impacts on biodiversity and carbon pools. Proc. Natl. Acad. Sci. U.S.A. 109, 16083–16088. doi: 10.1073/pnas.1211658109
Shokralla, S., Porter, T. M., Gibson, J. F., Dobosz, R., Janzen, D. H., Hallwachs, W., et al. (2015). Massively parallel multiplex DNA sequencing for specimen identification using an Illumina MiSeq platform. Sci. Rep. 5:9687. doi: 10.1038/srep09687
Siemann, E., Haarstad, J., and Tilman, D. (1999). Dynamics of plant and arthropod diversity during old field succession. Ecography 22, 406–414. doi: 10.1111/j.1600-0587.1999.tb00577.x
Simberloff, D. S., and Wilson, E. O. (1970). Experimental zoogeography of islands. A two-year record of colonization. Ecology 51, 934–937. doi: 10.2307/1933995
Thuring, C. E., and Dunnett, N. (2014). Vegetation composition of old extensive green roofs (from 1980s Germany). Ecol. Process. 3:4. doi: 10.1186/2192-1709-3-4
Tikhonov, G., Opedal, Ø. H., Abrego, N., Lehikoinen, A., Jonge, M. M. J., Oksanen, J., et al. (2019). Joint species distribution modelling with the R-package Hmsc. Methods Ecol. Evol. 11, 442–447. doi: 10.1111/2041-210X.13345
Tonietto, R., Fant, J., Ascher, J., Ellis, K., and Larkin, D. (2011). A comparison of bee communities of Chicago green roofs, parks and prairies. Landsc. Urban Plan. 103, 102–108. doi: 10.1016/j.landurbplan.2011.07.004
Tsafack, N., Di Biase, L., Xie, Y., Wang, X., and Fattorini, S. (2019). Carabid community stability is enhanced by carabid diversity but reduced by aridity in Chinese steppes. Acta Oecol. 99:103450. doi: 10.1016/j.actao.2019.103450
Unterweger, P. A., Klammer, J., Unger, M., and Betz, O. (2018). Insect hibernation on urban green land: a winter-adapted mowing regime as a management tool for insect conservation. Biorisk 13, 1–29. doi: 10.3897/biorisk.13.22316
Vergnes, A., Saux, E. L., and Clergeau, P. (2017). Preliminary data on low aerial plankton in a large city center, Paris. Urban For. Urban Green. 22, 36–40. doi: 10.1016/j.ufug.2017.01.012
Vesterinen, E. J., Puisto, A. I. E., Blomberg, A., and Lilley, T. M. (2018). Table for five, please: dietary partitioning in boreal bats. Ecol. Evol. 8, 10914–10937. doi: 10.1002/ece3.4559
Vesterinen, E. J., Ruokolainen, L., Wahlberg, N., Peña, C., Roslin, T., Laine, V. N., et al. (2016). What you need is what you eat? Prey selection by the bat Myotis daubentonii. Mol. Ecol. 25, 1581–1594. doi: 10.1111/mec.13564
Wang, Y., Chen, C., and Millien, V. (2018). A global synthesis of the small-island effect in habitat islands. Proc. R. Soc. B Biol. Sci. 285:1889. doi: 10.1098/rspb.2018.1868
Keywords: green roof, arthropod, community assembly, early succession, urban ecology
Citation: Kyrö K, Kankaanpää T, Vesterinen EJ, Lehvävirta S and Kotze DJ (2022) Arthropod Communities on Young Vegetated Roofs Are More Similar to Each Other Than to Communities at Ground Level. Front. Ecol. Evol. 10:785448. doi: 10.3389/fevo.2022.785448
Received: 29 September 2021; Accepted: 19 January 2022;
Published: 24 February 2022.
Edited by:
Jason M. Aloisio, Independent Researcher, New York, NY, United StatesReviewed by:
Lior Blank, Agricultural Research Organization (ARO), IsraelCopyright © 2022 Kyrö, Kankaanpää, Vesterinen, Lehvävirta and Kotze. This is an open-access article distributed under the terms of the Creative Commons Attribution License (CC BY). The use, distribution or reproduction in other forums is permitted, provided the original author(s) and the copyright owner(s) are credited and that the original publication in this journal is cited, in accordance with accepted academic practice. No use, distribution or reproduction is permitted which does not comply with these terms.
*Correspondence: David Johannes Kotze, am9oYW4ua290emVAaGVsc2lua2kuZmk=
Disclaimer: All claims expressed in this article are solely those of the authors and do not necessarily represent those of their affiliated organizations, or those of the publisher, the editors and the reviewers. Any product that may be evaluated in this article or claim that may be made by its manufacturer is not guaranteed or endorsed by the publisher.
Research integrity at Frontiers
Learn more about the work of our research integrity team to safeguard the quality of each article we publish.