- 1School of Life Sciences, Arizona State University, Tempe, AZ, United States
- 2United States Navy/Naval Hospital, Okinawa, Japan
- 3Biology Department, Siena College, Loudonville, NY, United States
Cooperation in nature is usually between relatives, but unrelated individuals can also cooperate, requiring significant benefits to outweigh the costs of helping non-kin. Unrelated queens of the ant, Pogonomyrmex californicus, work together to found a new colony, a phenomenon known as pleometrosis. While previous studies have shown that pleometrosis improves queen survival and worker production, little is known of the behavioral interactions within nests that explain these advantages. We aimed to determine how the optimal group size for a small, simple social group is related to group productivity and the organization of work. Collecting queens from a known pleometrotic population, we established nests with either one, three, six, or nine foundresses and observed the resulting nascent colonies for 50 days. We found that queens in social founding groups survived longer and had higher productivity. While all social groups were equally successful in producing workers, intermediate-sized groups were most successful in terms of per capita production. Inactivity increased with group size. In addition, the proportion of essential colony growth tasks performed (such as foraging and brood care) was lowest in both solitary-founded groups and in groups of nine queens. As a result, intermediate sized groups outperformed both solitary queens and groups of nine in the efficiency with which they converted eggs into workers. These results emphasize the benefits of cooperation and the ways in which group size can influence fitness and the allocation of labor in social groups.
Introduction
A central question in social biology is that of why groups form. Group membership should ultimately enhance an individual’s inclusive fitness. However, cooperation introduces costs. By contributing to the group, individual members may sacrifice some “market share” of direct fitness. In many contexts, these costs can be offset by indirect gains, particularly in groups with significant relatedness. The question of group formation becomes particularly interesting, however, when cooperators are not relatives (Dugatkin, 2002; Clutton-Brock, 2009; Taborsky et al., 2016). In such cases, indirect fitness moves toward zero, and direct fitness becomes the primary focus of selection.
The fitness costs and benefits of cooperation are also tied to group size (Dornhaus et al., 2012). Animal societies range widely in size, with important effects on survival and reproduction. For example, social grouping can influence thermoregulation (Cook and Breed, 2013). For animals that hunt in groups, optimum group size must balance the benefit of collective prey capture with the cost of more mouths to feed (Caraco and Wolf, 1975; Yip et al., 2008). Resource defense and interspecific competition can also be important factors shaping the optimum group size (Adams and Tschinkel, 1995). Group size can also limit the benefits of cooperation, for example in increased vulnerability to predators or pathogens (Côté and Poulinb, 1995). Thus, natural selection may ultimately act to “tune” social organisms toward an optimum group size and associated fitness-maximizing behaviors (Avilés and Tufino, 1998; Yip et al., 2008).
Cooperative nest founding among unrelated ant queens is a useful context to study the interplay between group size and individual fitness, because queens of some populations form small cooperative groups that are readily studied (Hölldobler and Wilson, 1977; Strassmann, 1989). In many species of social insect, independently founding reproductives can form cooperative associations. Known as pleometrosis, this phenomenon has been documented in ants (Sommer and Hoelldobler, 1995; Choe and Crespi, 1997; Bernasconi and Strassmann, 1999; Johnson, 2004; Izzo et al., 2009; Offenberg et al., 2012; Eriksson et al., 2019), bees (Schwarz et al., 1998), wasps (Rau, 1931; Itô, 1986), termites (Hacker et al., 2005; Chiu et al., 2017), mites (Saito, 2009), aphids (Miller<suffix>III</suffix>, 1998a; Miller, 1998b; Michaud and Belliure, 2000), and thrips (Crespi et al., 1997; Gilbert and Simpson, 2013). When cooperation persists throughout the life of the colony, it is called primary polygyny—as in the case described in this paper (Ostwald et al., 2021).
A number of benefits from pleometrosis have been found in ants, including: (1) decreased foundress mortality (Waloff, 1957; Tibbetts, 2003; Johnson, 2004), (2) earlier production of workers, (3) larger nascent colony size, which may be of benefit in interspecific competition or against predators (Gamboa, 1978; Bartz and Hölldobler, 1982; Tschinkel and Howard, 1983; Thorne, 1984; Rissing and Pollock, 1987; Adams and Tschinkel, 1995; Jerome et al., 1998; Tierney et al., 2000), (4) protection from predators and parasites during brood development (Abrams and Eickwort, 1981; Soucy and Giray, 2003), (5) and in intraspecific competition (Izzo et al., 2009). However, cooperative colony foundation can be costly for the same reasons as outlined for other social groups, including loss of reproductive opportunities and pathogen and parasite transmission risks (Cahan and Julian, 1999). In spite of these challenges, pleometrosis has evolved frequently in ants and other taxa.
In several species of pleometrotic ants, the success is not a simple multiple of the number of queens, but instead peaks at foundress numbers between 4 and 7 (Bartz and Hölldobler, 1982; Tschinkel and Howard, 1983). While these studies showed that mid-sized foundress groups have a survival and production advantage, the exact behavioral causes of this phenomenon remain to be investigated.
The seed harvester ant, Pogonomyrmex californicus, is haplometrotic (single queen founding) through much of its range. However, several populations of pleometrotic colony foundation have been identified (Johnson, 2004). Although P. californicus has become a model system for questions surrounding the evolution of cooperation and division of labor (Cahan and Julian, 1999; Jeanson and Fewell, 2008; Waters et al., 2010; Dolezal et al., 2012; Clark and Fewell, 2014), the majority of studies of P. californicus have focused on foundress pairs. Field studies indicate that the number of nest foundresses and stable matrilines in mature colonies tends to an average of four per nest (Overson et al., 2014, 2016). In spite of the artificial conditions of these previous studies (which utilized ant farms and/or buckets of dirt as a nesting substrate), fitness effects of different group sizes and pairing combinations have often been demonstrated. For colonies in a natural setting, most of the life of the queens takes place in the confines of small nests (besides foraging)—making the ant farm method a reasonable proxy for early colony life.
Using ants from the same population described by Overson et al. (2014, 2016), we created groups of foundresses ranging in size from 1 to 9 queens and observed them for 50 days in ant farms. Our study posed a set of three related questions: (i) How does group size influence foundress survival? (ii) Does foundress number influence nest productivity? (iii) How does foundress number influence individual activity levels and task performance? By answering these questions, we explore the behavioral factors contributing to group success or failure across group sizes below and above the mean field number. We also examine the regulatory mechanisms, in terms of behavior and allocation of labor, that underlie the success of pleometrotic foundress groups.
Materials and Methods
We collected newly mated Pogonomyrmex californicus foundresses from the Pine Valley area in San Diego, California (32.821 N, 116.529 W) between July 2 and 4, 2009. This population is known to be pleometrotic (Rissing et al., 2000; Cahan and Fewell, 2004; Johnson, 2004; Overson et al., 2016). Queens were collected from the ground after they had removed their wings but before they began to excavate nests.
In the lab, we weighed individual foundresses and assigned each one to a group of one, three, six or nine queens by haphazard selection. After group assignment, each queen was paint-marked on the abdomen for individual identification and then placed into observation nests. We created 30 nests per treatment for a total of 120 nests and 570 foundresses.
Observation nests were composed of two 15 × 20 cm glass plates (2 mm thick) separated by 3.5 mm thick plastic siding on all four sides. The top piece of siding acted as a lid to slow down soil drying and prevent ant escapes. We filled nests with sifted soil from the foundress retrieval site. Nests were soaked before use by submersing the bottom in water until the soil was evenly moist. Initial moisture levels were high enough that regular watering was not necessary; those nests that became dry over the course of the experiment were provided with additional moisture at day 35 by watering above the nest surface. Food for each nest was provided (approximately 3 Kentucky bluegrass seeds per foundress) every 3 days. The laboratory was maintained at a constant 30°C throughout the experiment, with natural summer day/night light cycles. The foundresses excavated tunnels that spanned the entire width of the ant farm, such that ants and brood were always visible. Brood counts were performed by temporarily laying the ant farm flat on a table and observing with a binocular microscope, with bright light provided by a 150-Watt halogen fiber optic light source.
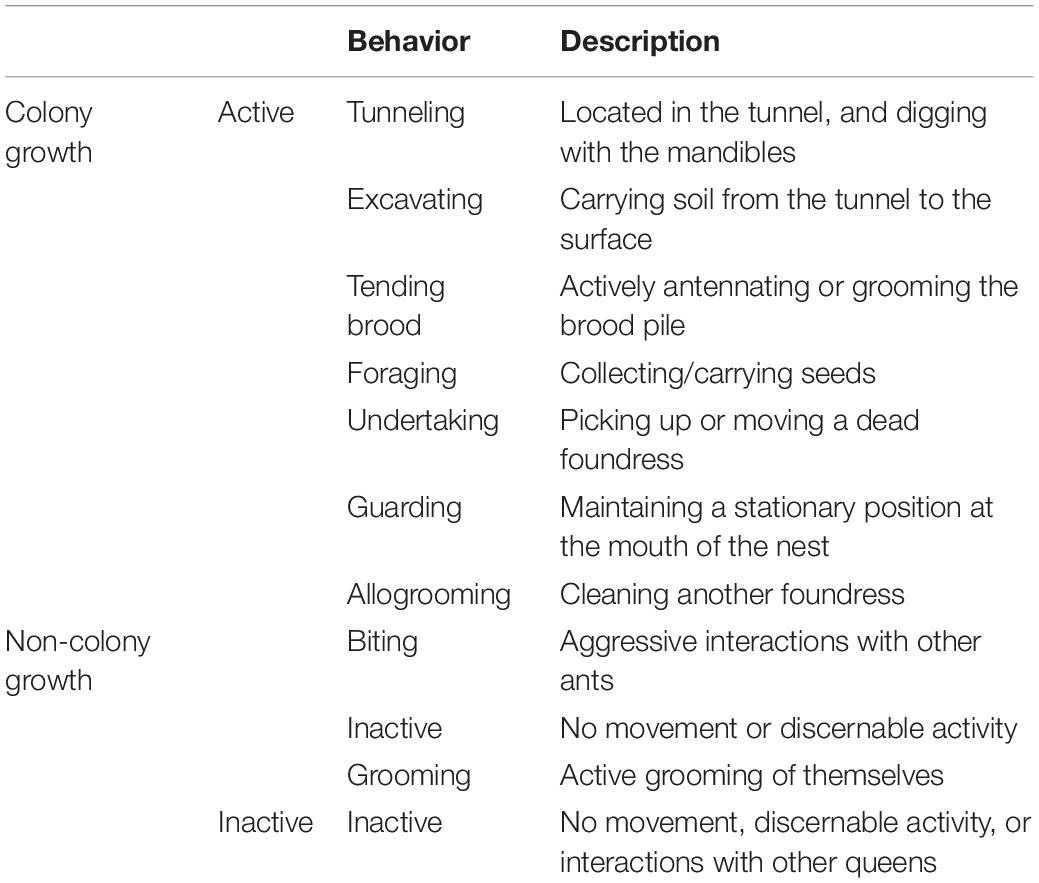
We began behavioral observations at 8:00 a.m. on July 6, the day following nest creation. Over Days 1–4, nests were observed approximately five times per day with scan sampling to note task performance and locations for each foundress. From Days 5 to 50, the behavior of each queen was monitored and recorded once per day. To monitor task performance and social interactions, we recorded each behavior performed. Table 1 shows the full list of behaviors that were recorded, along with their definitions and classification with regards to whether or not each behavior was considered as contributing toward “colony growth work.”
Nests were monitored for queen and nest survival each day throughout the experiment. A nest was considered alive if at least one living queen remained. Only two instances of aggression (biting) were documented between foundresses: one event in a group of three and another event in a group of nine. Neither event resulted in mortality. Production of eggs, larvae, and pupae was tracked for each nest every 3 days, starting at Day 3. The date of first worker eclosion for each nest was also recorded, and following worker eclosion, the number of workers also counted following the 3-day schedule. In measuring brood production, we aimed to quantify not only the overall output of brood per nest, but also brood production per starting foundress. In addition, we calculated brood conversion efficiency by dividing the number of eggs (or other brood items) at a given stage (eggs, larvae, pupae) by the subsequent number of individual items produced at later stages (larvae, pupae, new workers). Conversion efficiencies were calculated at each developmental transition (eggs to larvae, larvae to pupae, and pupae to worker) to pinpoint the precise timing of the success or failure (developmentally speaking) of nascent colonies. Finally, the overall egg-to-worker conversion efficiency was calculated.
We classified behaviors as active (any identifiable nest task or motion) or inactive (motionless and not engaged in any interaction with a nestmate) (Table 1). To characterize work directed toward nest construction and colony growth, we measured incidents of the following tasks: tunneling, excavating, foraging, and tending brood. Although likely relevant to colony function, walking, self-grooming, inactivity, and biting were excluded from the task analysis. We first considered the total number of growth tasks performed per nest, summed over the 50 days of observation. Then, to obtain an index of how many colony growth tasks each individual queen performed while alive, the total colony growth tasks performed by each ant was divided by the number of days the ant was present/alive (“ant days”). To get a picture of how each queen’s overall activity budget depended on nest context, the proportional activity of each queen was found by dividing the total of that category by the total number of observations across the following five categories: walking, digging, foraging, brood care, and inactivity. In social groups, these proportions were averaged in each nest. Finally, each proportion was averaged across all 30 replicates to compare the typical activity budgets for groups of one, three, six, and nine foundresses.
To obtain a measure of fitness that takes into account both per capita production and survival (Shen et al., 2017), we calculated the product of per capita worker production at day 50 and the proportion of foundresses surviving to day 50.
Statistical Analysis
To assess differences in mortality we performed a Log Rank Mantel-Cox survival analysis on foundresses. The same method was used to examine nest survival. The timing of brood emergence was compared across treatments with Kruskal-Wallis tests. These analyses were performed with IBM SPSS Statistics for Macintosh, Version 25.
For comparisons of count data (numbers of brood, workers, queens, and behavioral acts), we fit generalized linear models using R version 4.0.3. To compare brood conversion rates (e.g., workers produced per egg), we used the counts of the earlier brood stage as an offset in the regression model. Similarly, to analyze per capita worker and brood production, we used foundress number as an offset. For activity rates, we used the total number of ant-days in each nest as an offset. Ant-days were calculated by summing the number of days each foundress was present in the nest (i.e., the number of days until she died or escaped). For most of these analyses, we used negative binomial regression, because Poisson regression models fit poorly due to overdispersion. Post hoc pairwise comparisons among groups were evaluated with Z-tests after Holm-Bonferroni correction of p-values to avoid alpha inflation.
To test for differences among foundress group sizes in the overall fitness metric (the product of survival and worker production), we fit a linear model in R. Adherence to the normality and equal variance assumptions of linear models was confirmed by inspecting residual plot and a normal probability plot of the model residuals.
Results
Influence of Group Size on Foundress Survival Probability
Single foundresses experienced much higher mortality rates than did foundresses in groups of any size (Log Rank Mantel-Cox: χ2 = 85.3; df = 3; p < 0.001; Figure 1). Mean survival time for solitary foundresses was 15.8 ± 1.2 days, with none surviving past day 33. In contrast, mortality rates were similar across all social group sizes (Log Rank Mantel-Cox: χ2 = 4.3; df = 2; p = 0.117; Figure 1). Mean survival times in groups of three, six, and nine were 36.6 ± 1.9 days, 38.1 ± 1.3 days, and 39.5 ± 1.0 days, respectively.
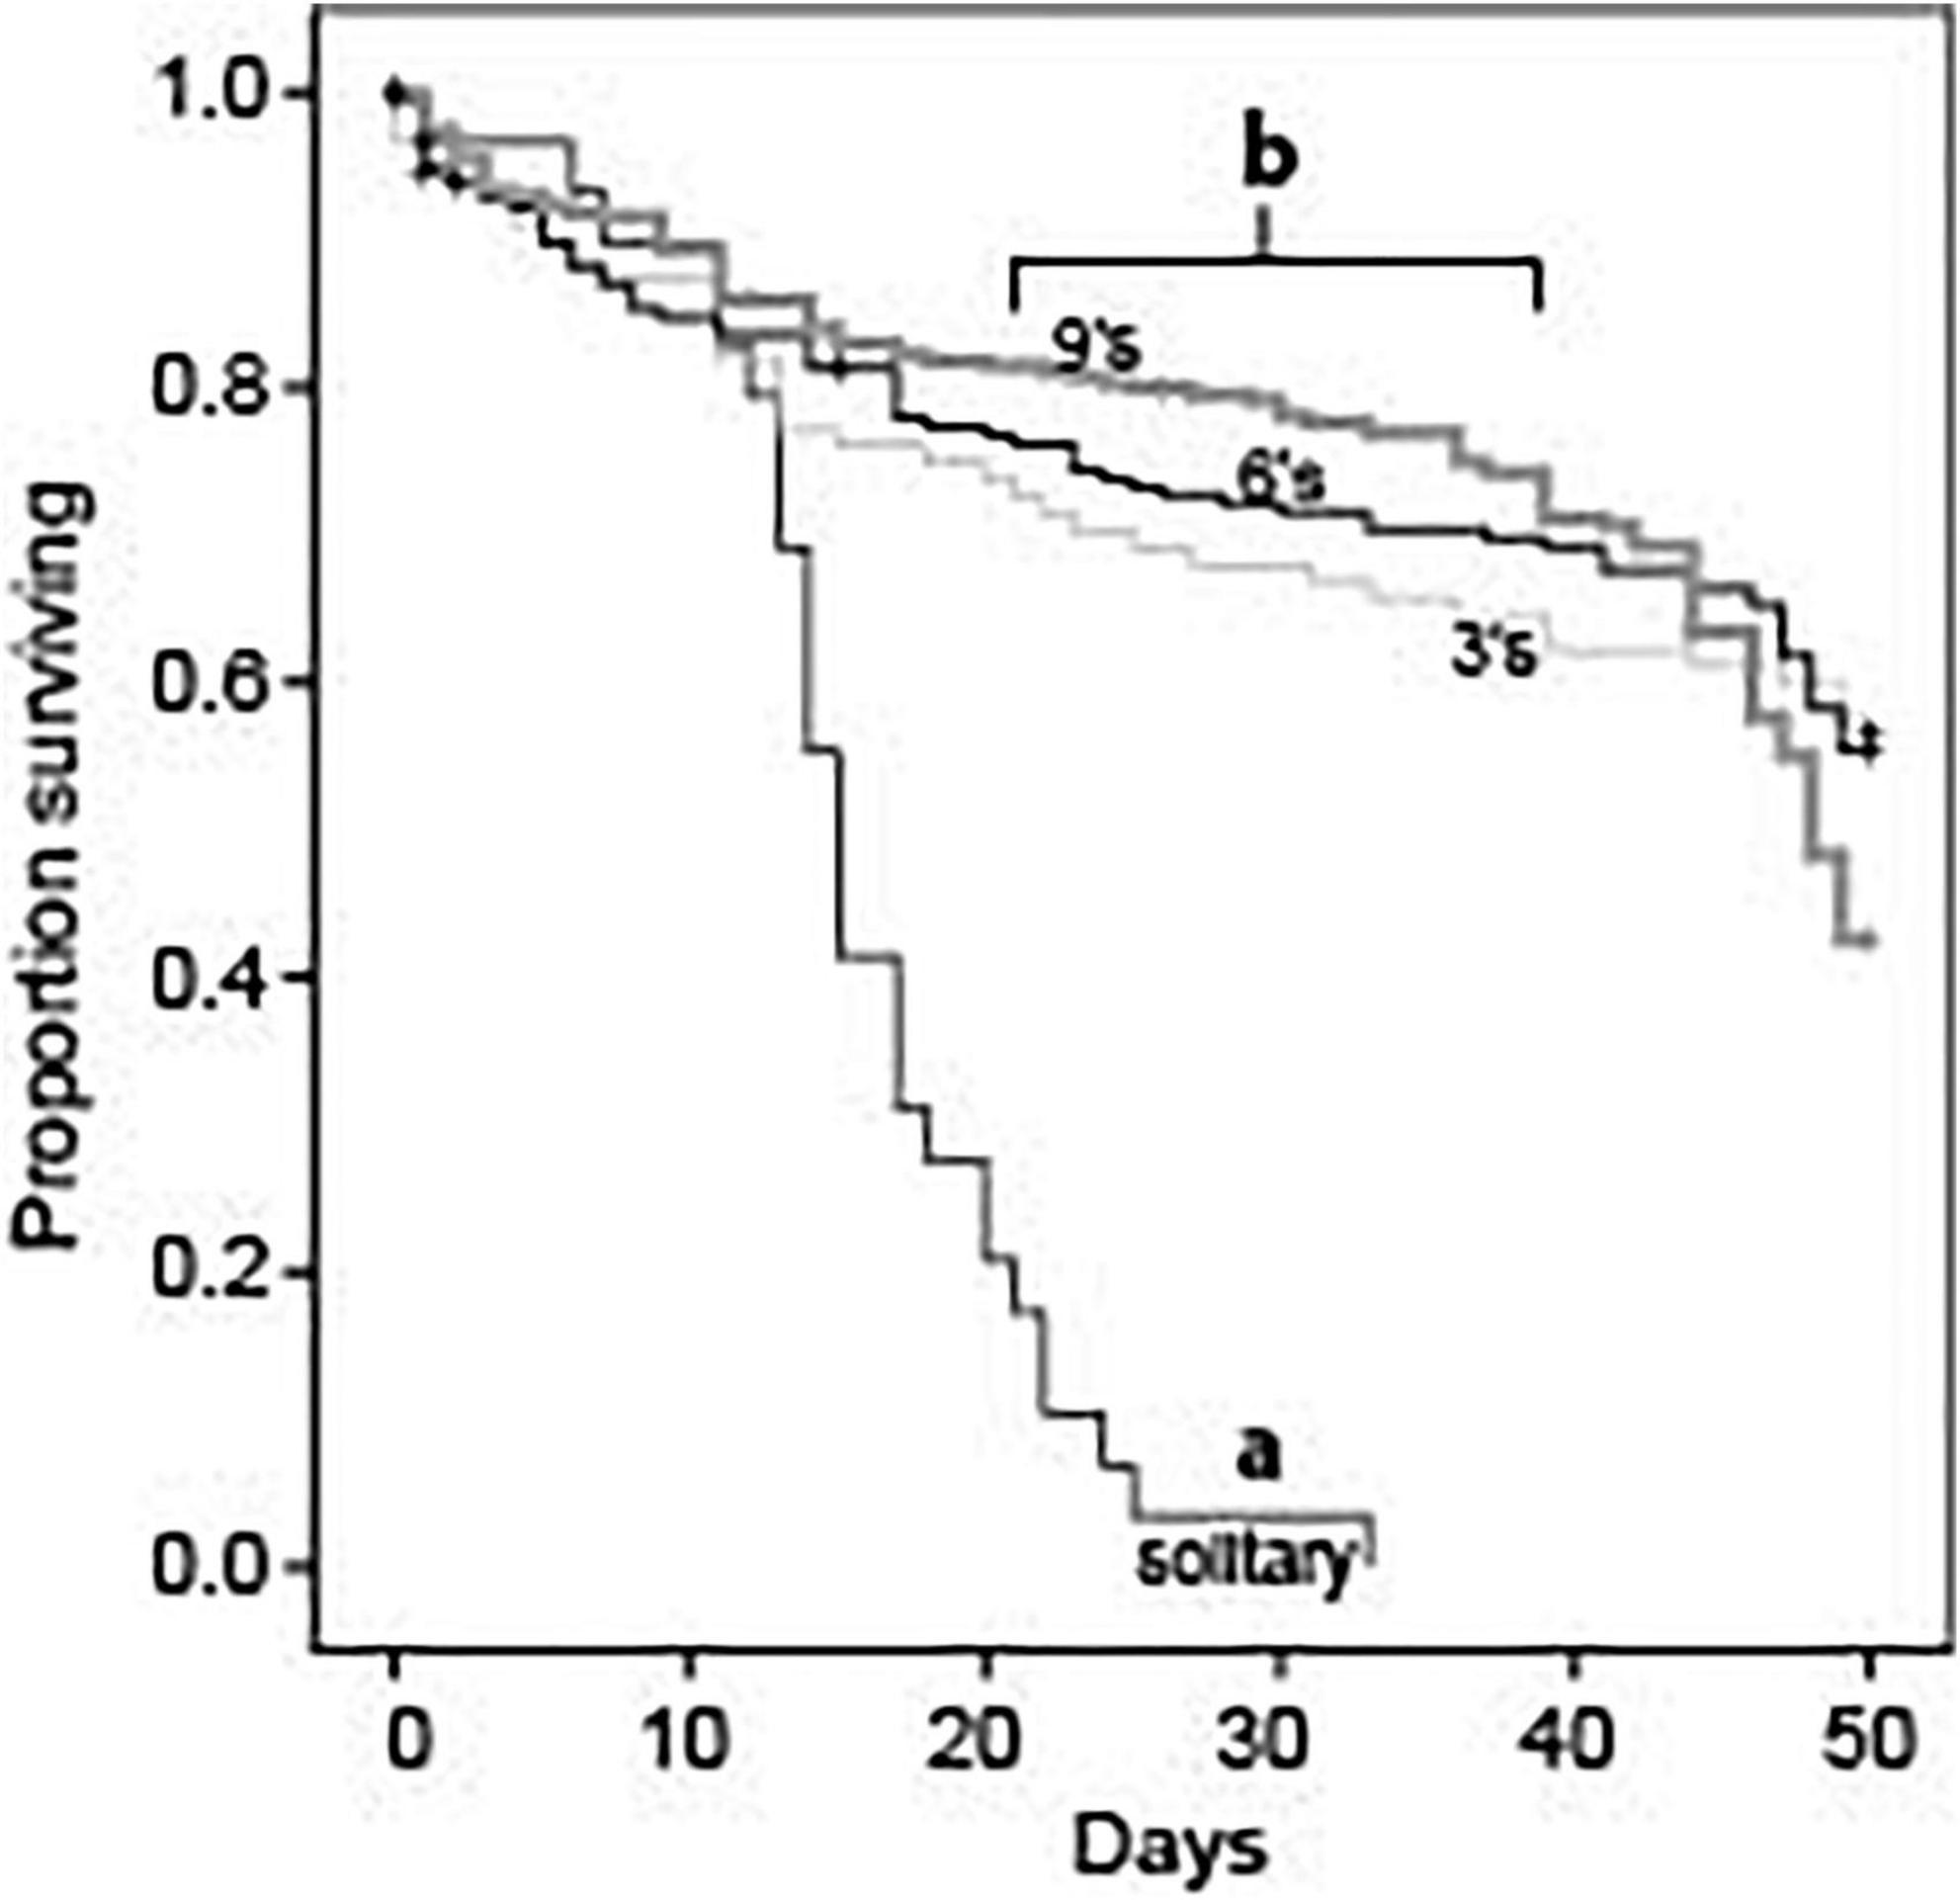
Figure 1. Survival rates for queens in foundress groups established with 1, 3, 6, or 9 queens. Solitary queens had significantly lower survival rates compared to queens in groups (Log Rank Mantel-Cox, chi-square = 85.286, df = 3, P < 0.001). However, individual survival rates did not differ across groups that contained 3, 6, or 9 queens (Log Rank Mantel-Cox, chi-square = 4.291, df = 2, P = 0.117).
Nest survival patterns mirrored those for individuals: solitary foundresses had significantly shorter survival times than nests founded by three, six, or nine queens (Log Rank Mantel-Cox: χ2 = 133.2; df = 3; p < 0.001). Social groups were similar to one another in nest survival (Log Rank Mantel-Cox: χ2 = 0.6; df = 2; p = 0.733).
By the conclusion of the study at day 50, single queens had suffered 100% mortality, but most nests in social treatments still had survivors. Among the social groups, foundress number significantly affected the number of survivors (Negative binomial regression: χ2 8.87; df = 2; p = 0.012). For three-queen groups, the 95% confidence interval for mean number of survivors was 1.1–2.5. For six- and nine-queen groups, the confidence intervals were 1.1–3.4 and 1.3–3.8, respectively. The mean was significantly less for groups of three than for groups of six (Z-test: p = 0.015) or nine (Z-test: p = 0.003). Groups of six and nine were similar to each other (Z-test: p = 0.59).
Influence of Group Size on Brood Production and Efficiency of Worker Production
Group size did not influence the timing of development; all treatments were similar in the number of days necessary for egg production and the time required to transition to larvae, pupae, and workers (Figure 2). Production of eggs peaked at day 9, larvae at day 19, pupae at day 34, and workers at the end of the experiment (Figure 2). Averages (± SE) for peak values are provided in Table 2 and per-capita brood production at each peak are provided in Table 3.
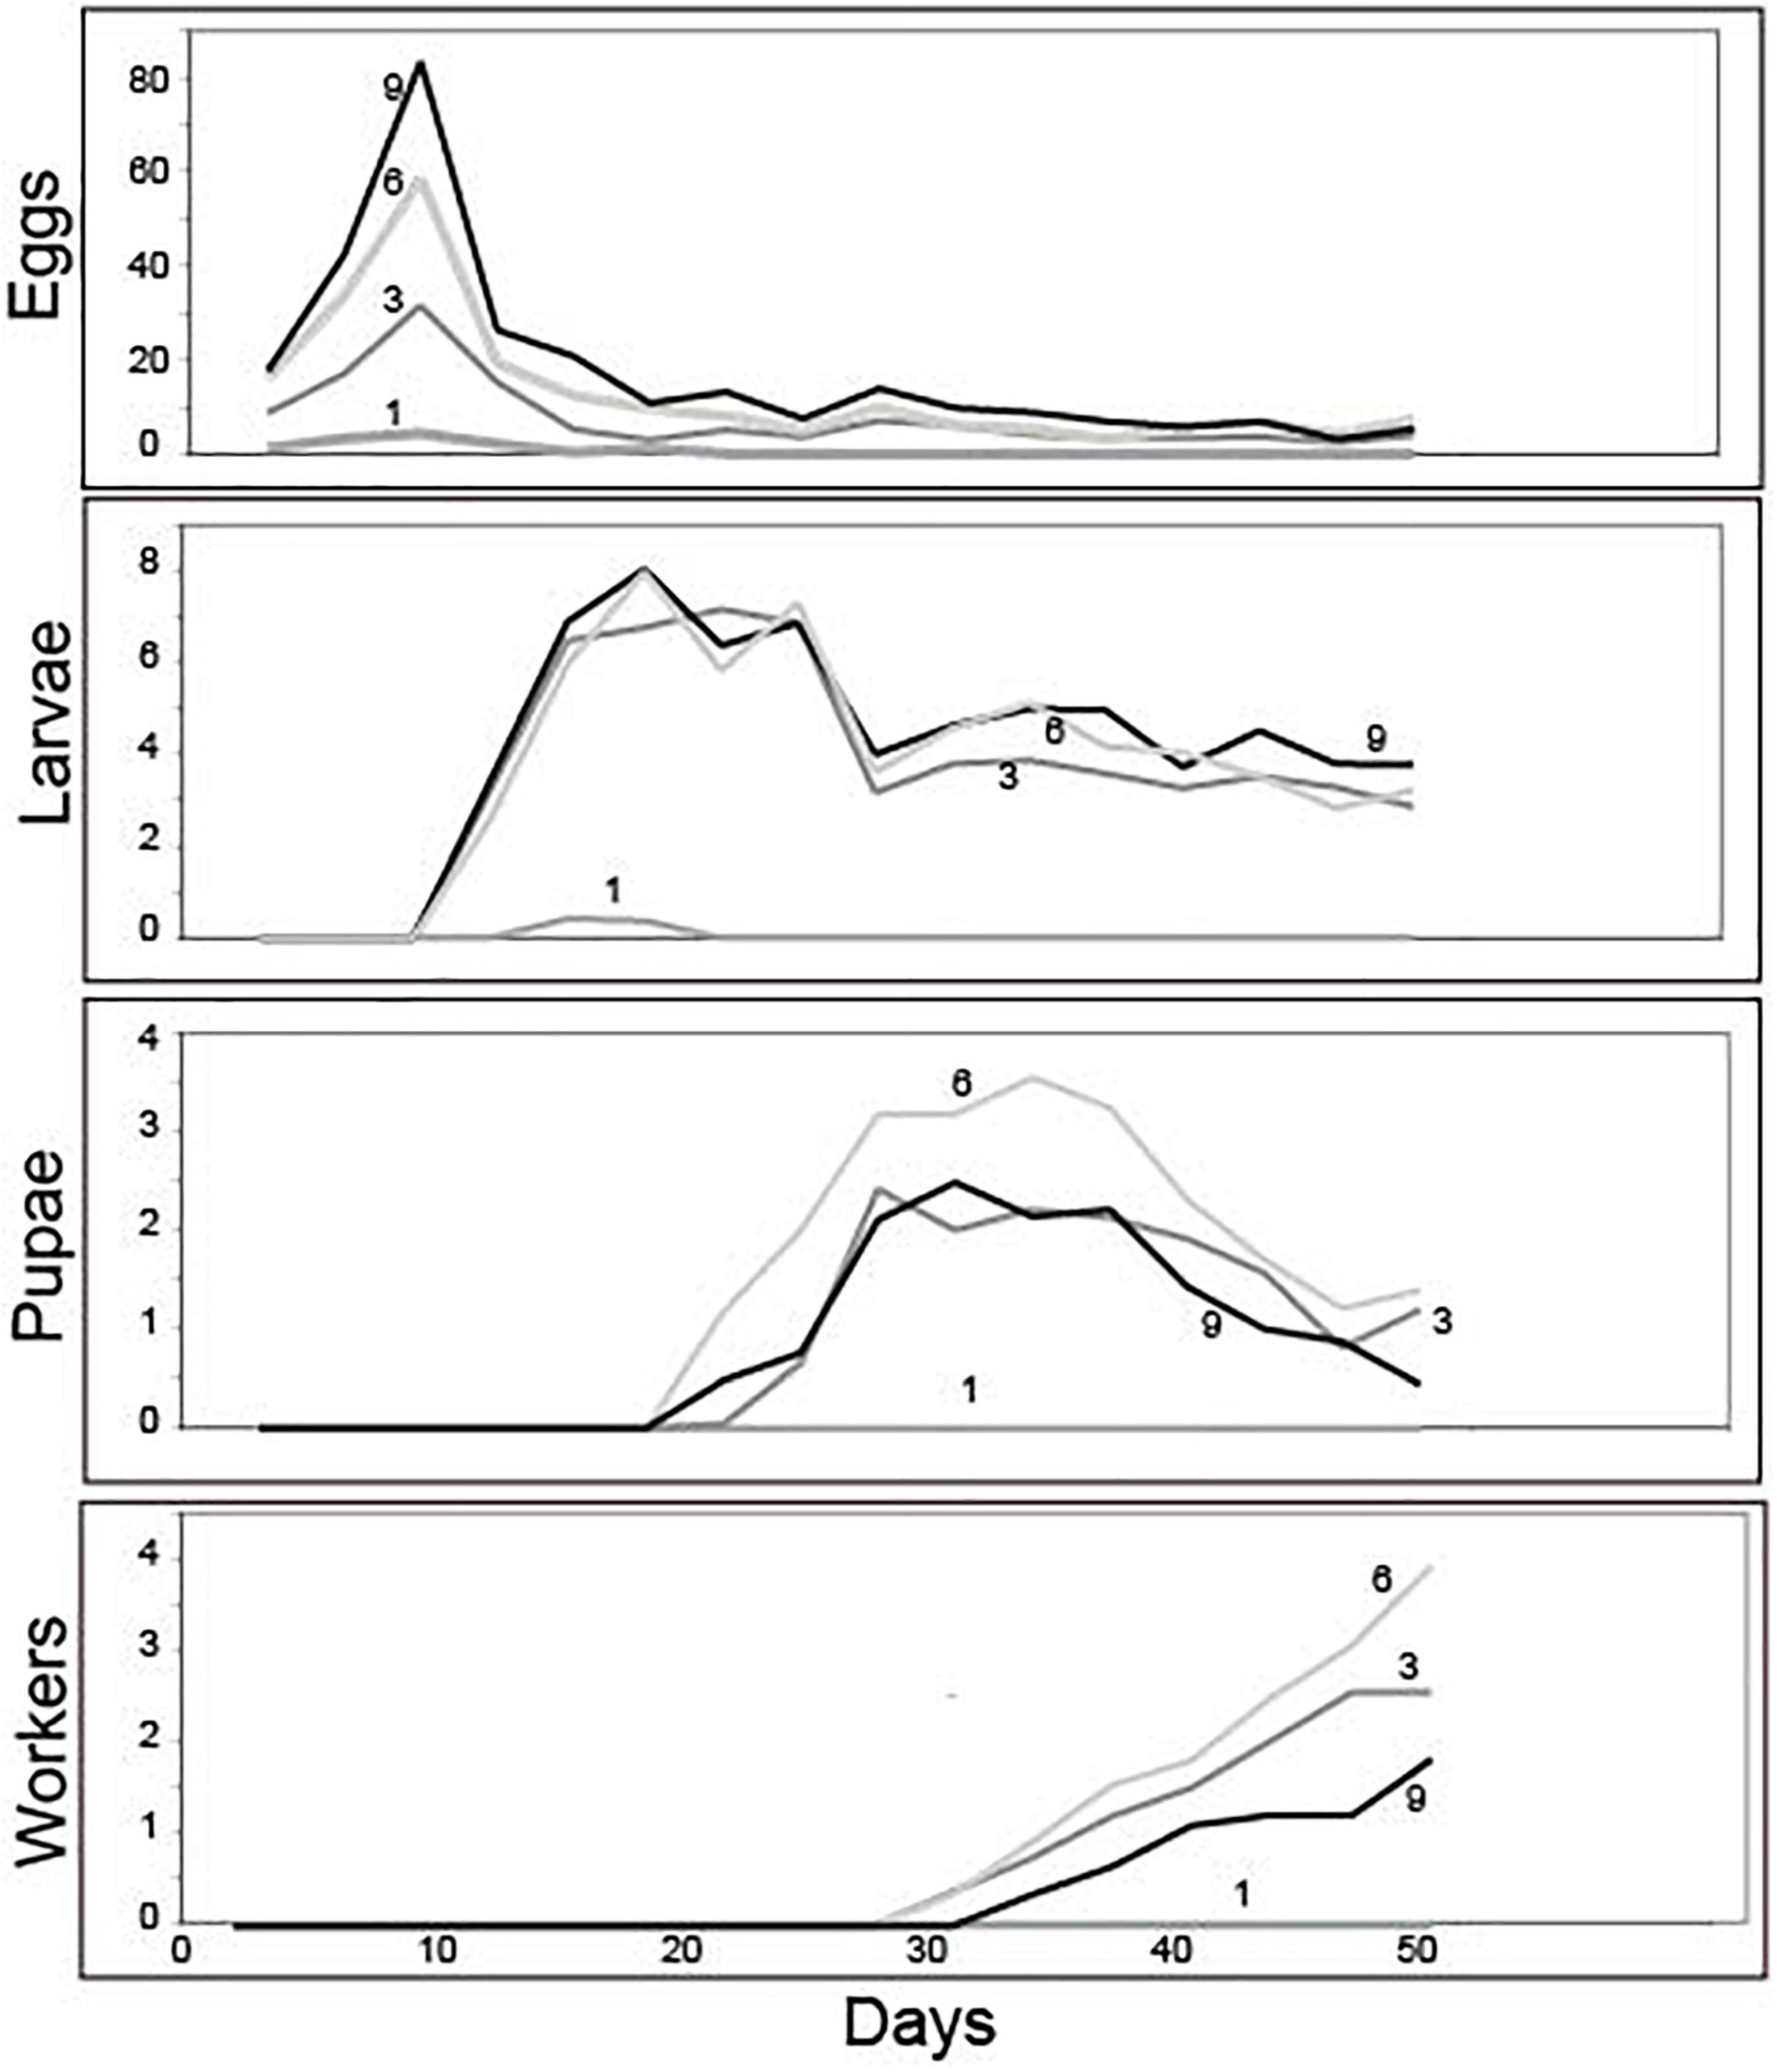
Figure 2. Mean brood development trajectories over the 50-day experiment for groups founded by 1, 3, 6, or 9 queens. While the trajectory and timing of brood development was similar across groups, their success in transitioning between stages of development and ultimately producing workers depended on foundress group size (see text for statistics).
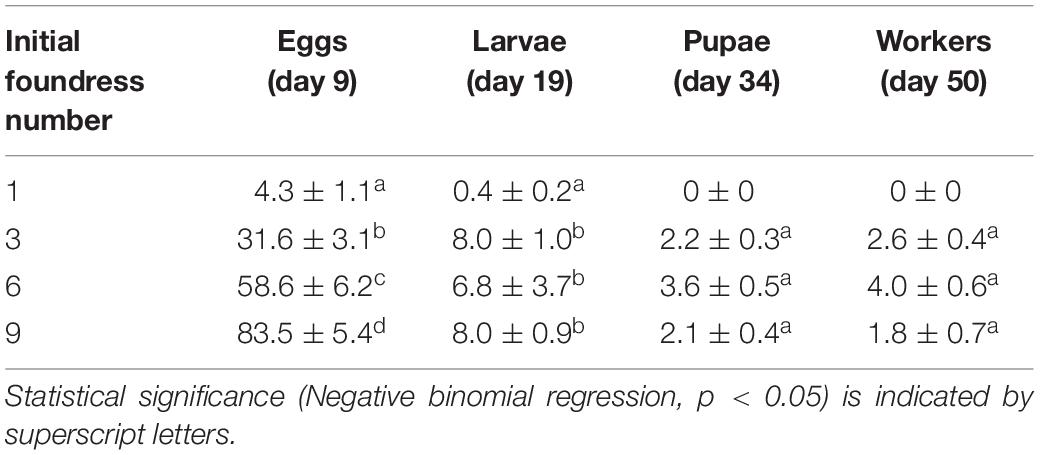
Table 2. Absolute mean brood production (± SE) at peaks of development for groups founded by 1, 3, 6, and 9 queens.
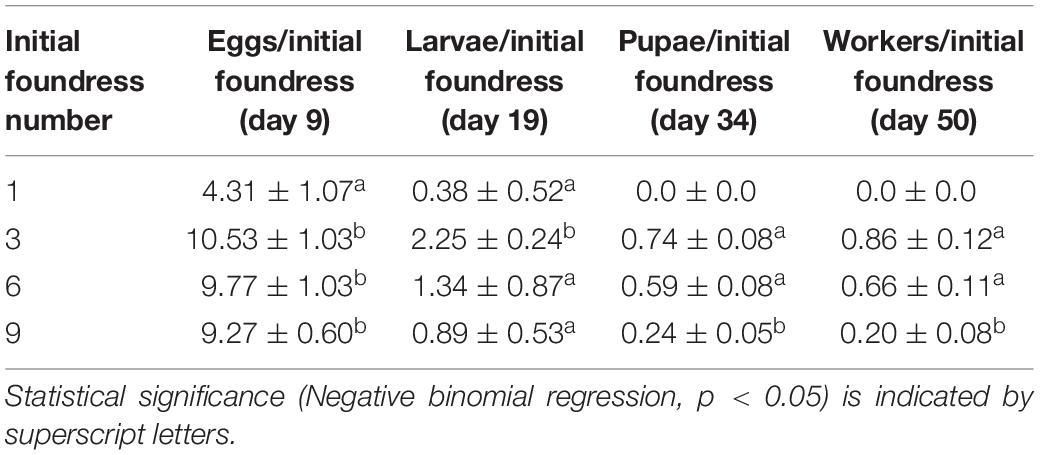
Table 3. Mean per capita brood production (± SE; per initial foundress) at peaks of development for groups of 1, 3, 6, and 9 queens.
Treatments differed in peak egg production at Day 9 [Negative binomial regression: χ2 = 100.6; df = 3; p < < 0.0001; Z-tests: p < 0.01 in all pairwise comparisons except for six foundresses vs. nine foundresses (p = 0.052)]. Larger groups produced correspondingly more eggs (Figure 2 and Table 2). On a per capita basis, however, peak egg numbers per starting foundress were significantly lower for solitary foundresses compared to foundresses in groups, but similar across the three group sizes (Negative binomial regression: χ2 = 18.0; df = 3; p < 0.001; Z-tests: p < 0.01 for solitary compared with all other foundress numbers; p > 0.5 for all other pairwise comparisons;, Table 3).
Foundress number also significantly influenced the peak production of larvae at Day 19 (Negative binomial regression: χ2 = 38.7; df = 3; p < 0.001; Table 2), such that groups founded by solitary queens produced significantly fewer larvae than any of the groups (Z-test: p < 0.001 in all pairwise comparisons). Only three nests founded by solitary foundresses succeeded in producing any larvae at all. Among the group treatments, peak larvae numbers were similar regardless of nest size (Z-test: p > 0.35 in all pairwise comparisons).
In contrast to egg production, per capita larval production differed according to group size (Negative binomial regression: χ2 = 28.4; df = 3; p < 0.001; Table 3), such that three-foundress groups produced significantly more larvae per initial queen than the other three treatment groups (Z-test: p < 0.003 in all three pairwise comparisons). Solitary foundresses had lower per capita production than three-foundress groups (Z-test: p = 0.02), but were similar to groups founded by six (p = 0.08) or nine queens (p = 0.17). Six- and nine-queen groups had intermediate and similar per capita larva production (Z-test: p = 0.052).
Solitary queens never produced pupae or workers, so these stages were analyzed only for the social group treatments. The treatments differed significantly in peak pupae numbers at day 34 (Negative binomial regression: χ2 = 6.6; df = 2; p = 0.036). Although none of the pairwise comparisons were significantly different, six-queen groups had the highest average number of pupae (Figure 2 and Table 2). On a per capita basis, groups of three and six queens showed significantly greater production of pupae than the groups of nine (Negative binomial regression: χ2 = 22.2; df = 2; p < 0.0001; Z-tests: p < 0.0001; Table 3), while groups of three and six were similar to each other (Z-test: p = 0.34).
The median date for worker emergence was similar among the social group treatments (Kruskal-Wallis: H2 = 2.9; p = 0.24). For three-, six-, and nine-foundress treatments, workers emerged on Day 34.7 ± 5.2, 33.3 ± 3.7, and 35.8 ± 5.1, respectively (). Workers steadily accumulated in number until the conclusion of the study on Day 50, by which time workers were present in 73.3% of three-queen groups 76.6% of six-queen groups, and 60% of nine-queen groups. On Day 50, worker production clearly differed across treatments, in that no solitary foundresses produced any workers while the social groups produced one to three workers, on average. There was no significant difference among social groups in worker production (Negative binomial regression: χ2 = 5.62; df = 2; P = 0.06; Z-tests of pairwise differences: P > 0.05). Due to the lack of variance in one-foundress nests (all had zero workers), they could not be included in the statistical analysis. However, their difference from the social groups is clear in that none of the latter’s 95% confidence intervals for mean number of workers included zero. Per capita worker production differed significantly among the social groups (Negative binomial regression: χ2 = 15.7; df = 2; P < 0.001) with higher levels in three- and six-queen groups than in nine-queen groups (Z-tests: p < 0.001). There was no significant difference between groups of three and six (Z-test; p = 0.377; Table 3).
The net worker-per-egg conversion efficiency was estimated by using counts from the respective days of peak production, and differed across the three social group treatments (Negative binomial regression: χ2 12.5; df = 2; p < 0.01; Figure 3 and Table 4). Groups founded by three and six queens had similar efficiencies (Z-test, p = 0.69), but were significantly greater than groups founded by nine queens (Z-tests, p < 0.01 for both comparisons). Three-queen groups produced 0.08 ± 0.06 workers per egg () while six- and nine-queen groups produced only 0.07 ± 0.05 and 0.02 ± 0.04 workers per egg, respectively. For all three social group sizes, the 95% confidence intervals for mean worker-per-egg conversion rate excluded zero, indicating a significant advantage over one-foundress nests, none of which produced any workers.
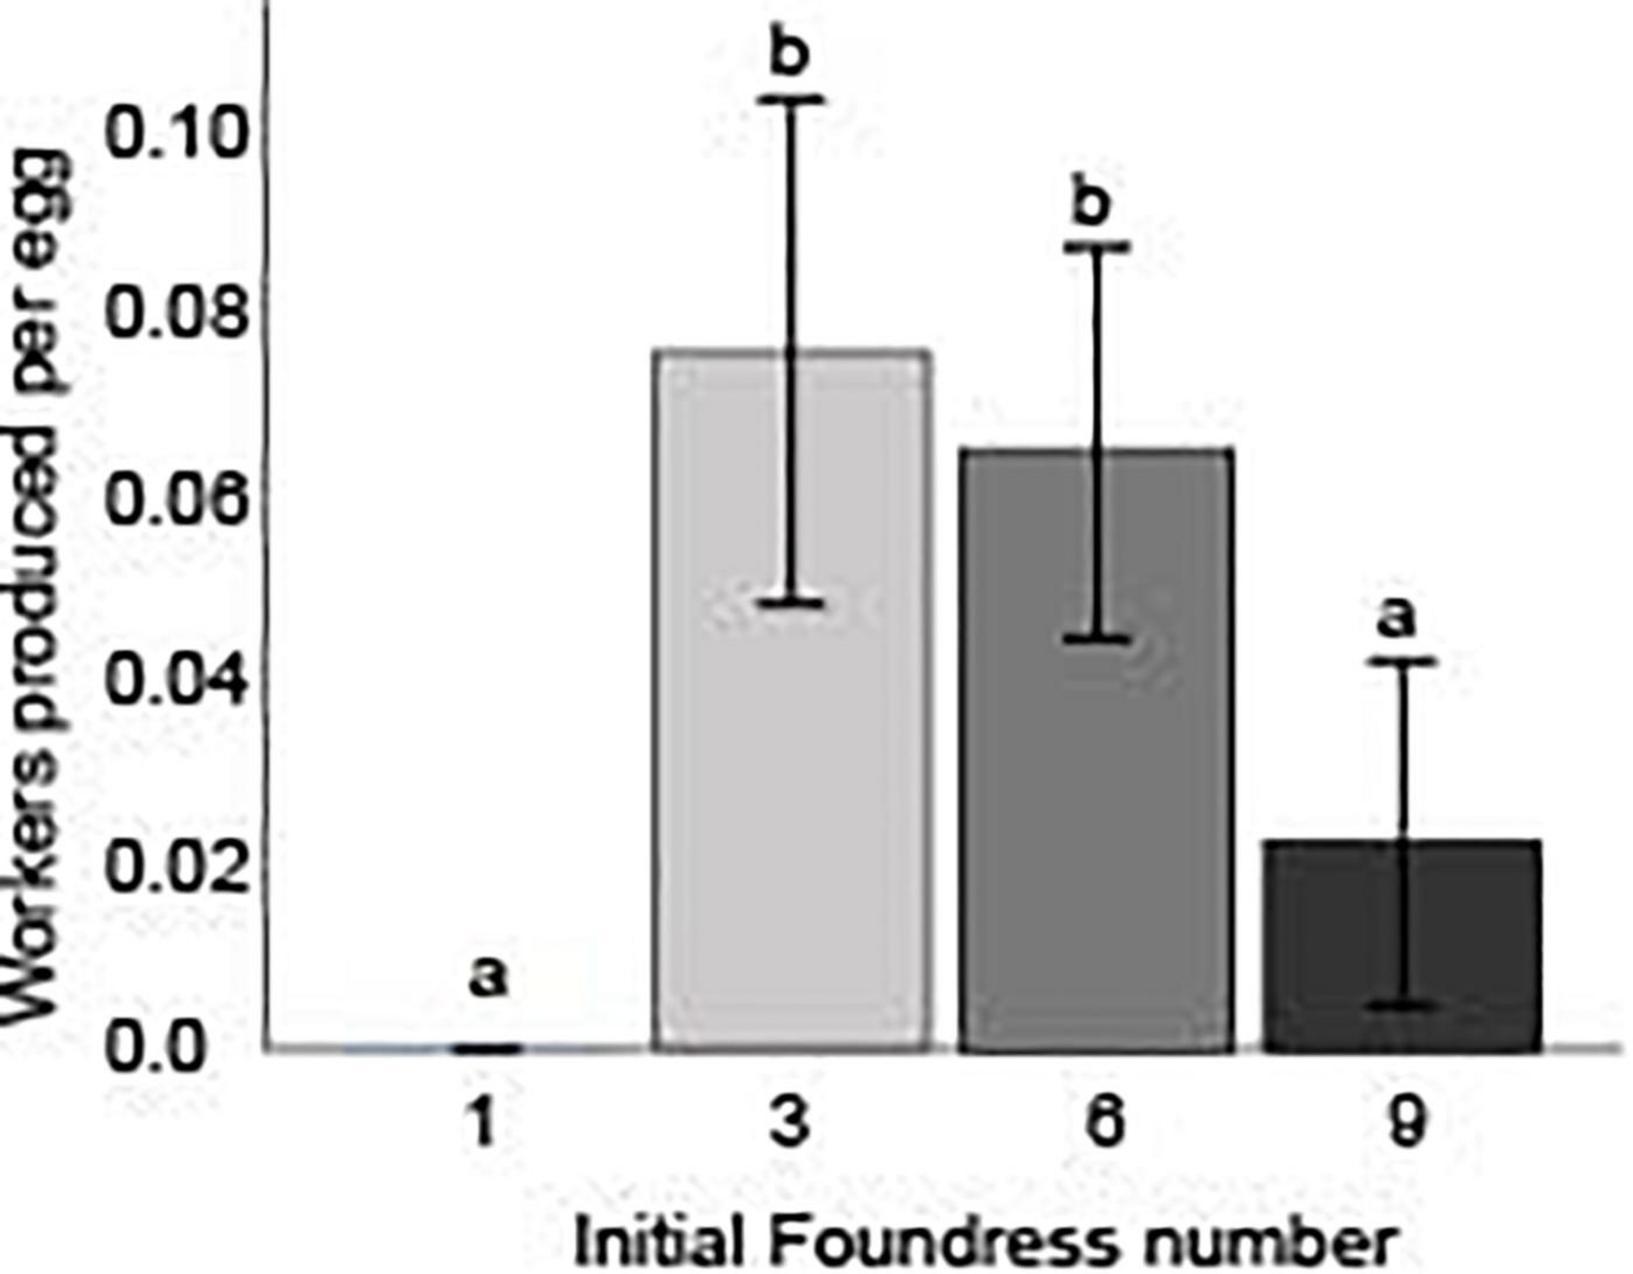
Figure 3. Initial foundress number influenced the efficiency with which founding groups ultimately converted eggs into workers. The worker/egg ratio was calculated by taking the number of eclosed workers in the nest on day 50 and dividing that by the number of eggs in the nest on the day of peak egg production, day 9. Different letters above bars indicate significant differences between groups after post hoc analysis (Z-tests following negative binomial regression, p < 0.05).
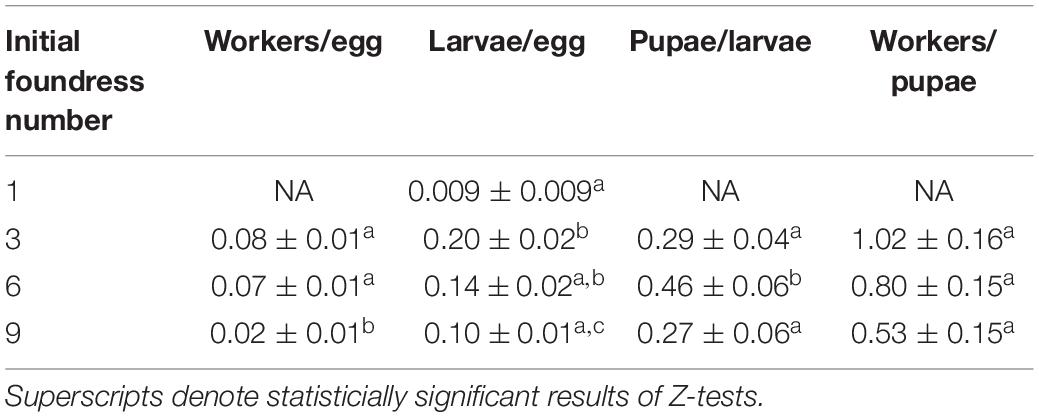
Table 4. The conversion efficiency in brood development was estimated by using counts from the days of peak production.
The transition that contributed most strongly to differences in the conversion of eggs to workers was the transition from eggs to larvae (Negative binomial regression: χ2 = 26.5; df = 3; p < 0.001). Groups founded by three queens averaged more larvae per egg than groups founded by 1 queen or nine queens (0.2, 0.02, and 0.1, respectively; both Z-tests: p < 0.05). Groups of six queens produced an intermediate 0.14 larvae per egg, which was not statistically distinguishable from groups founded by one queen (Z-test, p = 0.12) or 3 queens (p = 0.06), but was significantly different from 9-queen groups (Z-test: p = 0.05). Finally, larvae-per-egg conversion efficiency was similar for groups founded by 1 queen compared to groups founded by 9 queens (Z-test, p = 0.09). At the other transitions (larvae to pupae and pupae to workers), the solitary queen group was excluded from analysis due to failure to produce pupae. The three group treatments had significantly different conversion efficiencies of larvae to pupae (Poisson regression: χ2 = 11.1; df = 2; p = 0.004), with six-foundress groups having greater efficiency than three- and nine-queen groups (Z-test: p < 0.05), which did not differ from each other (Z-test: p = 0.54). All social groups had similar conversion efficiencies of pupae to workers (Poisson regression: χ2 = 4.87; df = 2; p = 0.088).
Influence of Foundress Number on the Allocation of Labor
Queen activity budgets for different-sized foundress groups are shown in Figure 4. Foundress number significantly influenced the per capita performance of active behaviors, including walking, digging, foraging, and brood care (Negative binomial regression: χ2 = 125.6; df = 3; p < < 0.0001, Figure 5). Solitary foundresses were significantly more active than foundresses in groups of three, six, or nine (Z-test; p < 0.0001). Furthermore, groups of three were significantly more active than larger groups (Z-test: p < 0.0001), but groups of six were not significantly more active than groups of nine (Z-test: p = 0.135).
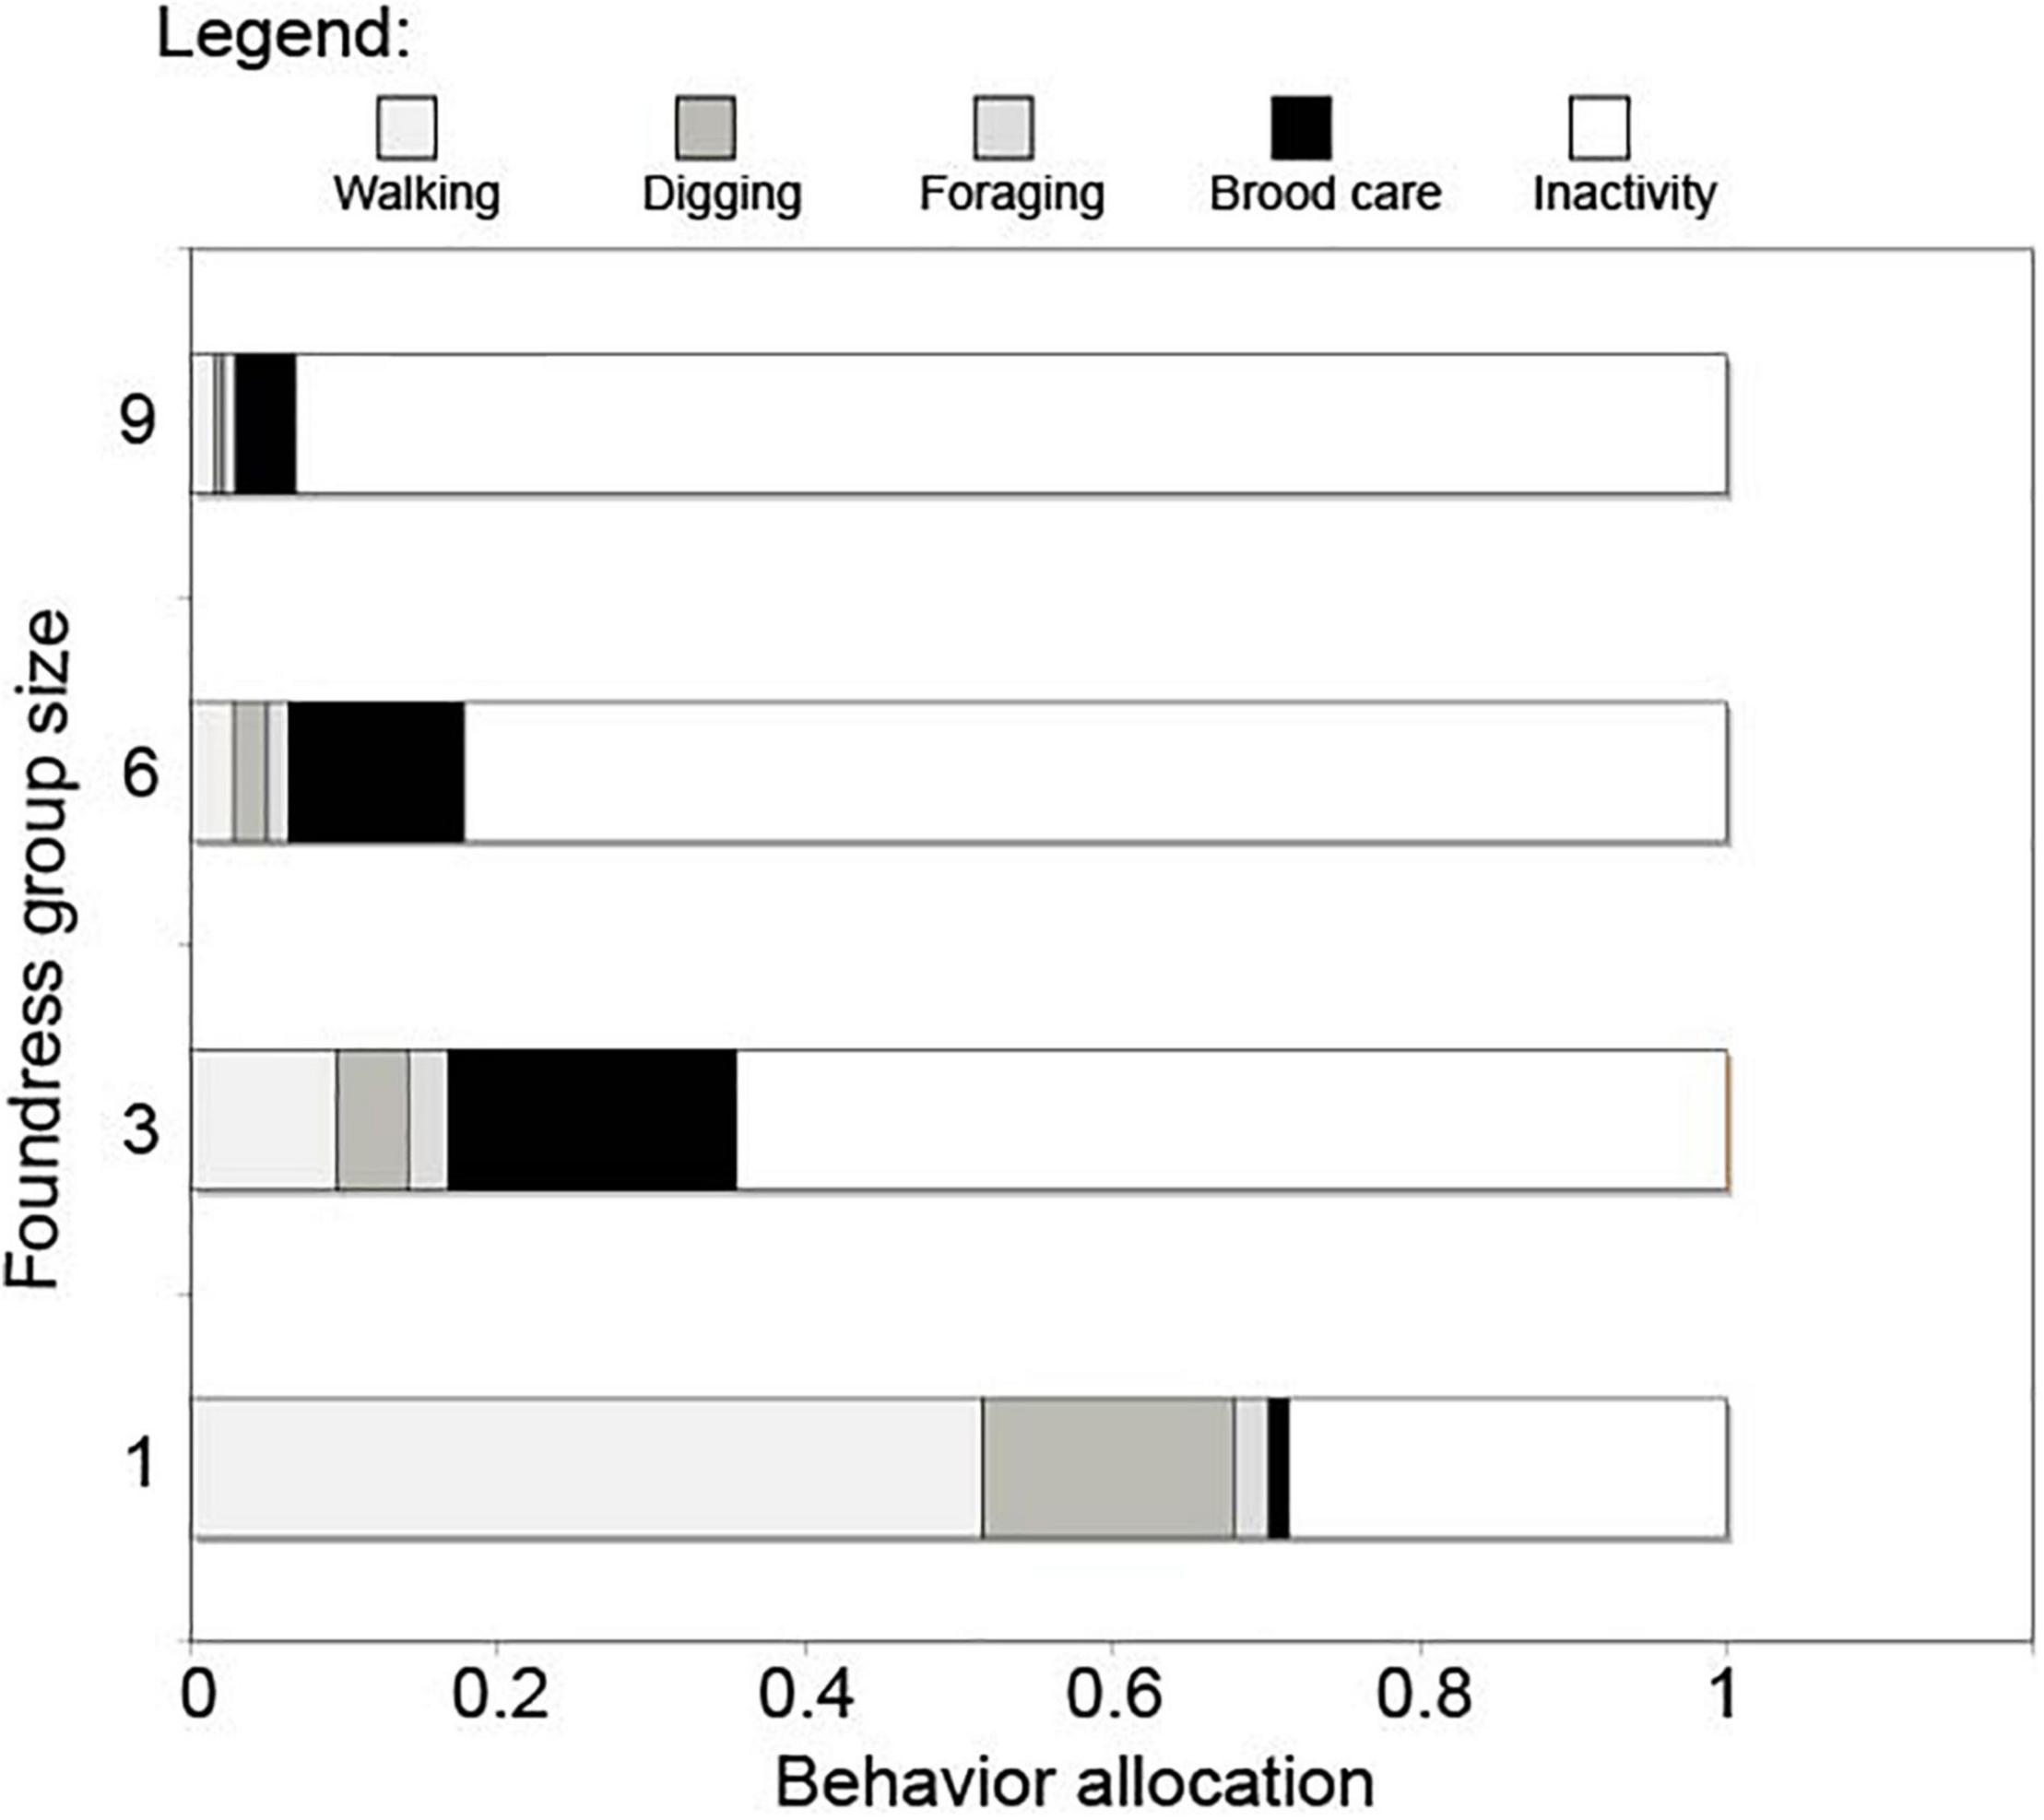
Figure 4. The overall allocation of behavior in groups of foundresses. Behaviors were assigned to one of the 5 broad categories shown in the figure legend. The proportional activity of each queen was found by dividing the total of that category by the total number of observations across all five categories. This was averaged across nests and replicates. A broad pattern across behaviors can be seen where the overall activity levels decreased as foundress number increased.
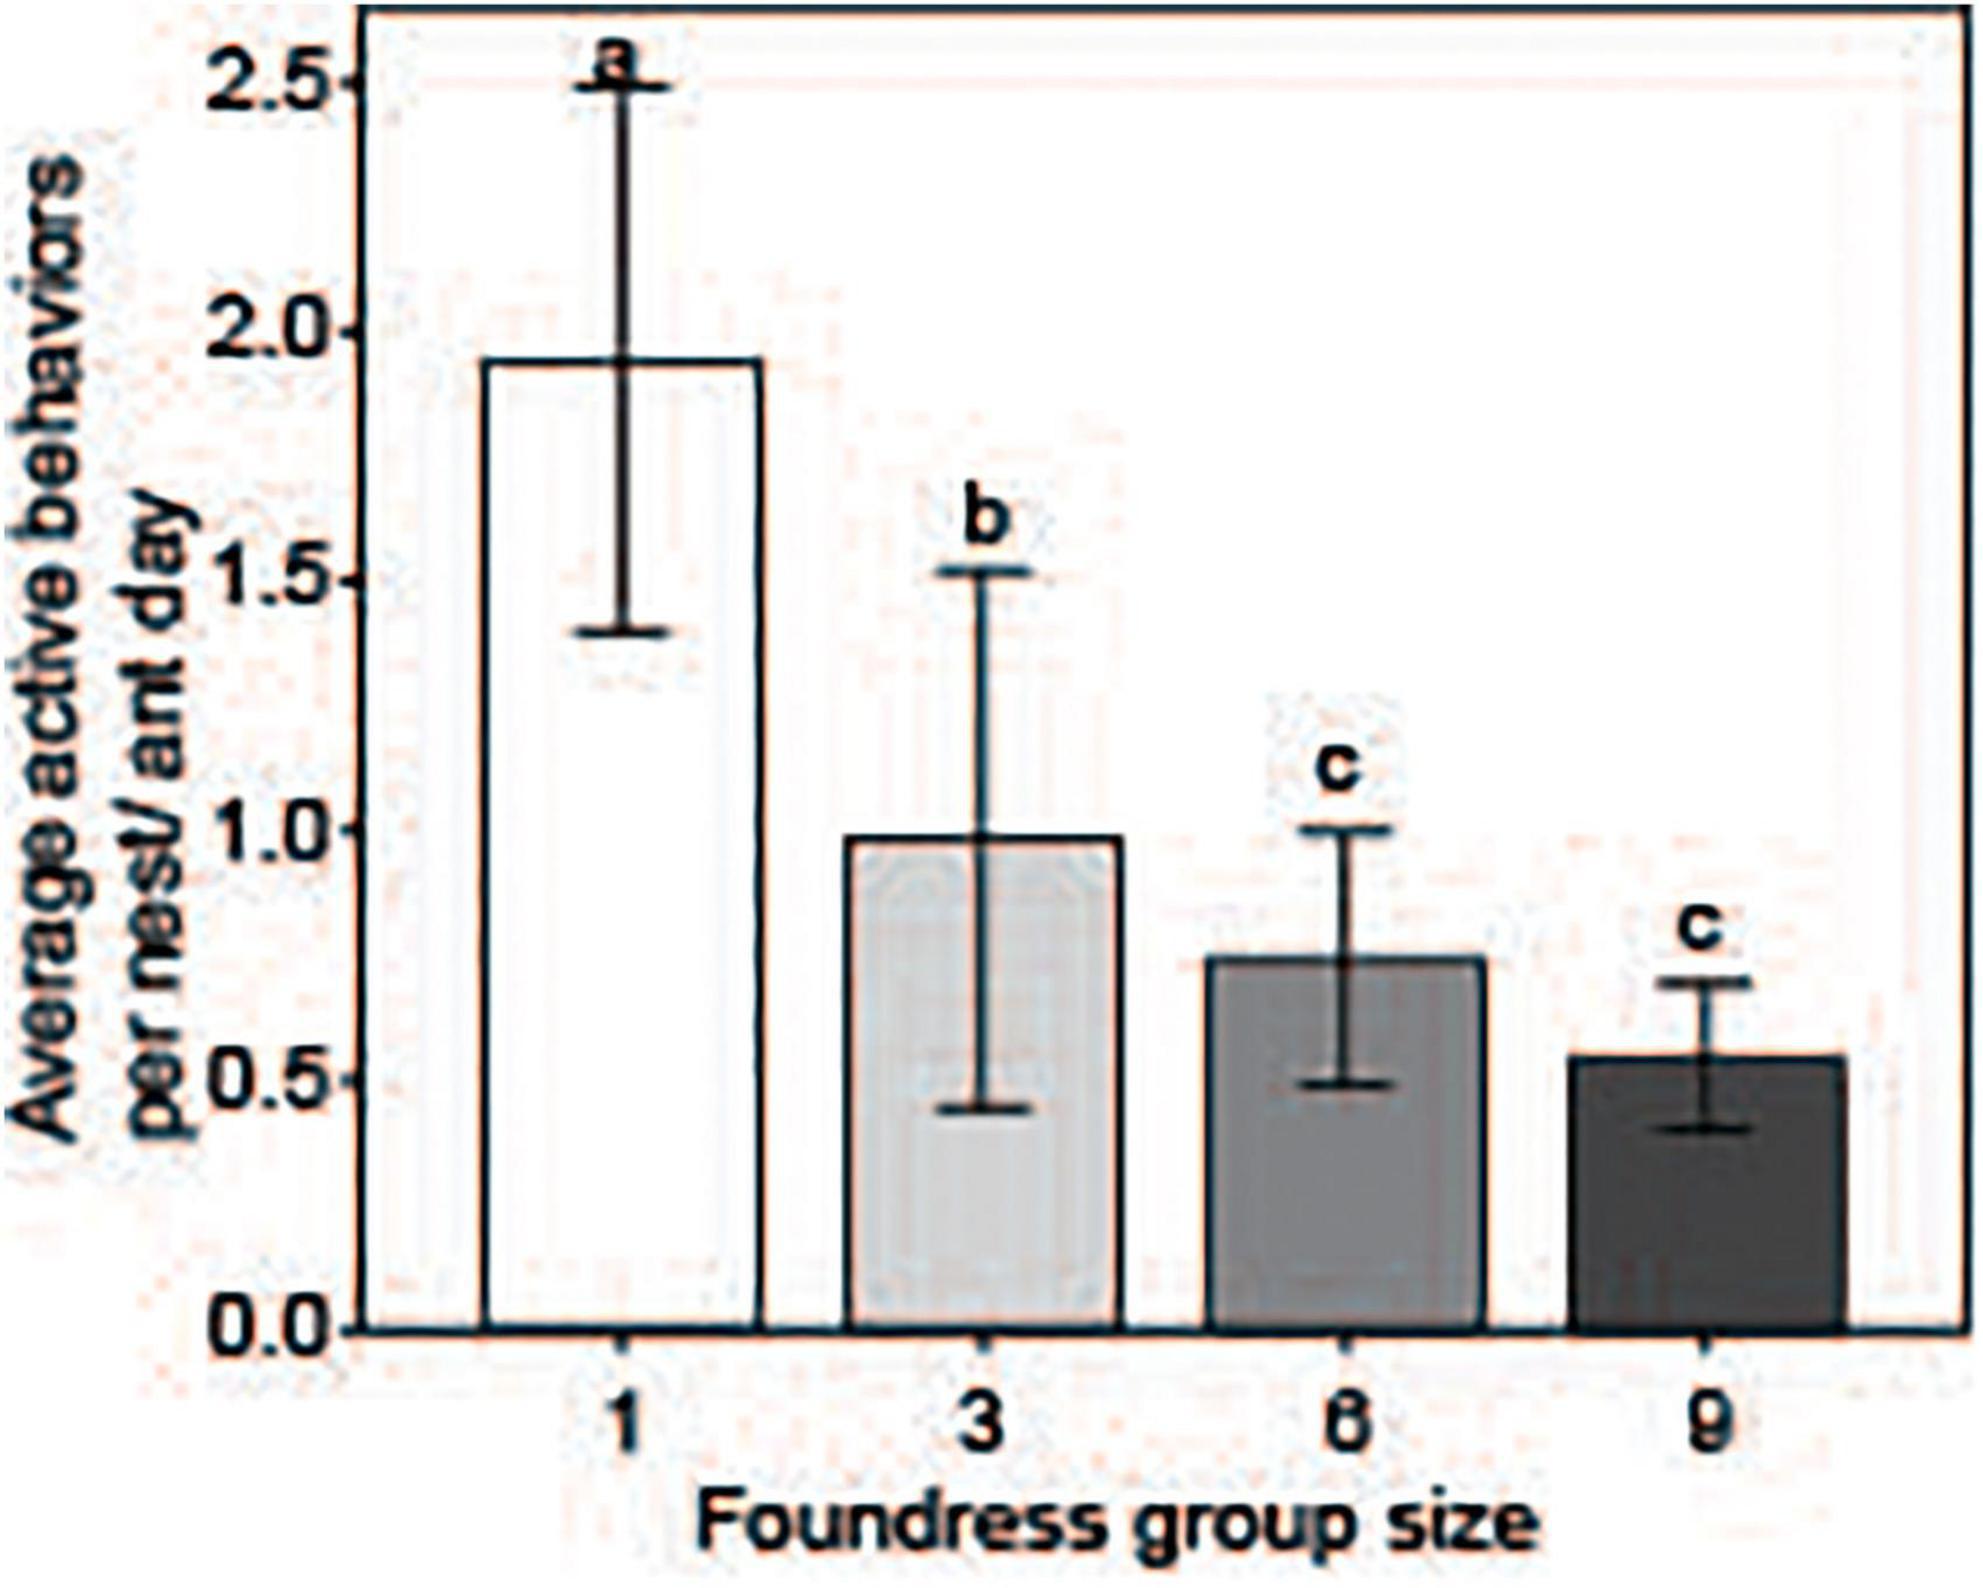
Figure 5. Per-capita activity was assessed by summing the number of active behaviors performed by all ants in the nest (which included: Walking, grooming, excavating, foraging, as well as any other active engagement or behavior; see Table 1). This value was divided by the sum of the number of days each ant was alive and present in the study nest. The result was a metric of activity, the average behaviors performed per ant-day. Social groups of all sizes had significantly lower per-capita activity than groups founded by one queen. Different letters above bars indicate significant differences between groups after post hoc analysis (Z-tests following negative binomial regression, p < 0.05).
Foundress number influenced the total performance of colony growth tasks within a nest in a different fashion than for overall activity (Negative binomial regression: χ2 = 81.1; df = 3; p < < 0.0001; Figure 6). Solitary foundresses and groups of nine performed significantly fewer total colony growth tasks than groups founded by three or six foundresses (Z-tests: p < 0.01). Groups of three and six did not differ from one another (Z-test: p = 0.38), but groups of nine performed significantly more colony growth tasks than solitary foundresses (Z-test: p < 0.001). The pattern was different when ant days were taken into account. There was an overall significant difference across nest treatments (Negative binomial regression: χ2 = 87.9; df = 3; p < < 0.0001), such that per capita activity declined steadily with larger group size. Groups founded by one and three queens had the highest activity and did not significantly differ from one another (Z-test; p = 0.47). Groups of six queens performed significantly fewer tasks per capita than either one- or three-queen nests (Z-tests: p < 0.001); nine-queen groups performed significantly fewer than any of the other groups (Z-tests: p < < 0.0001).
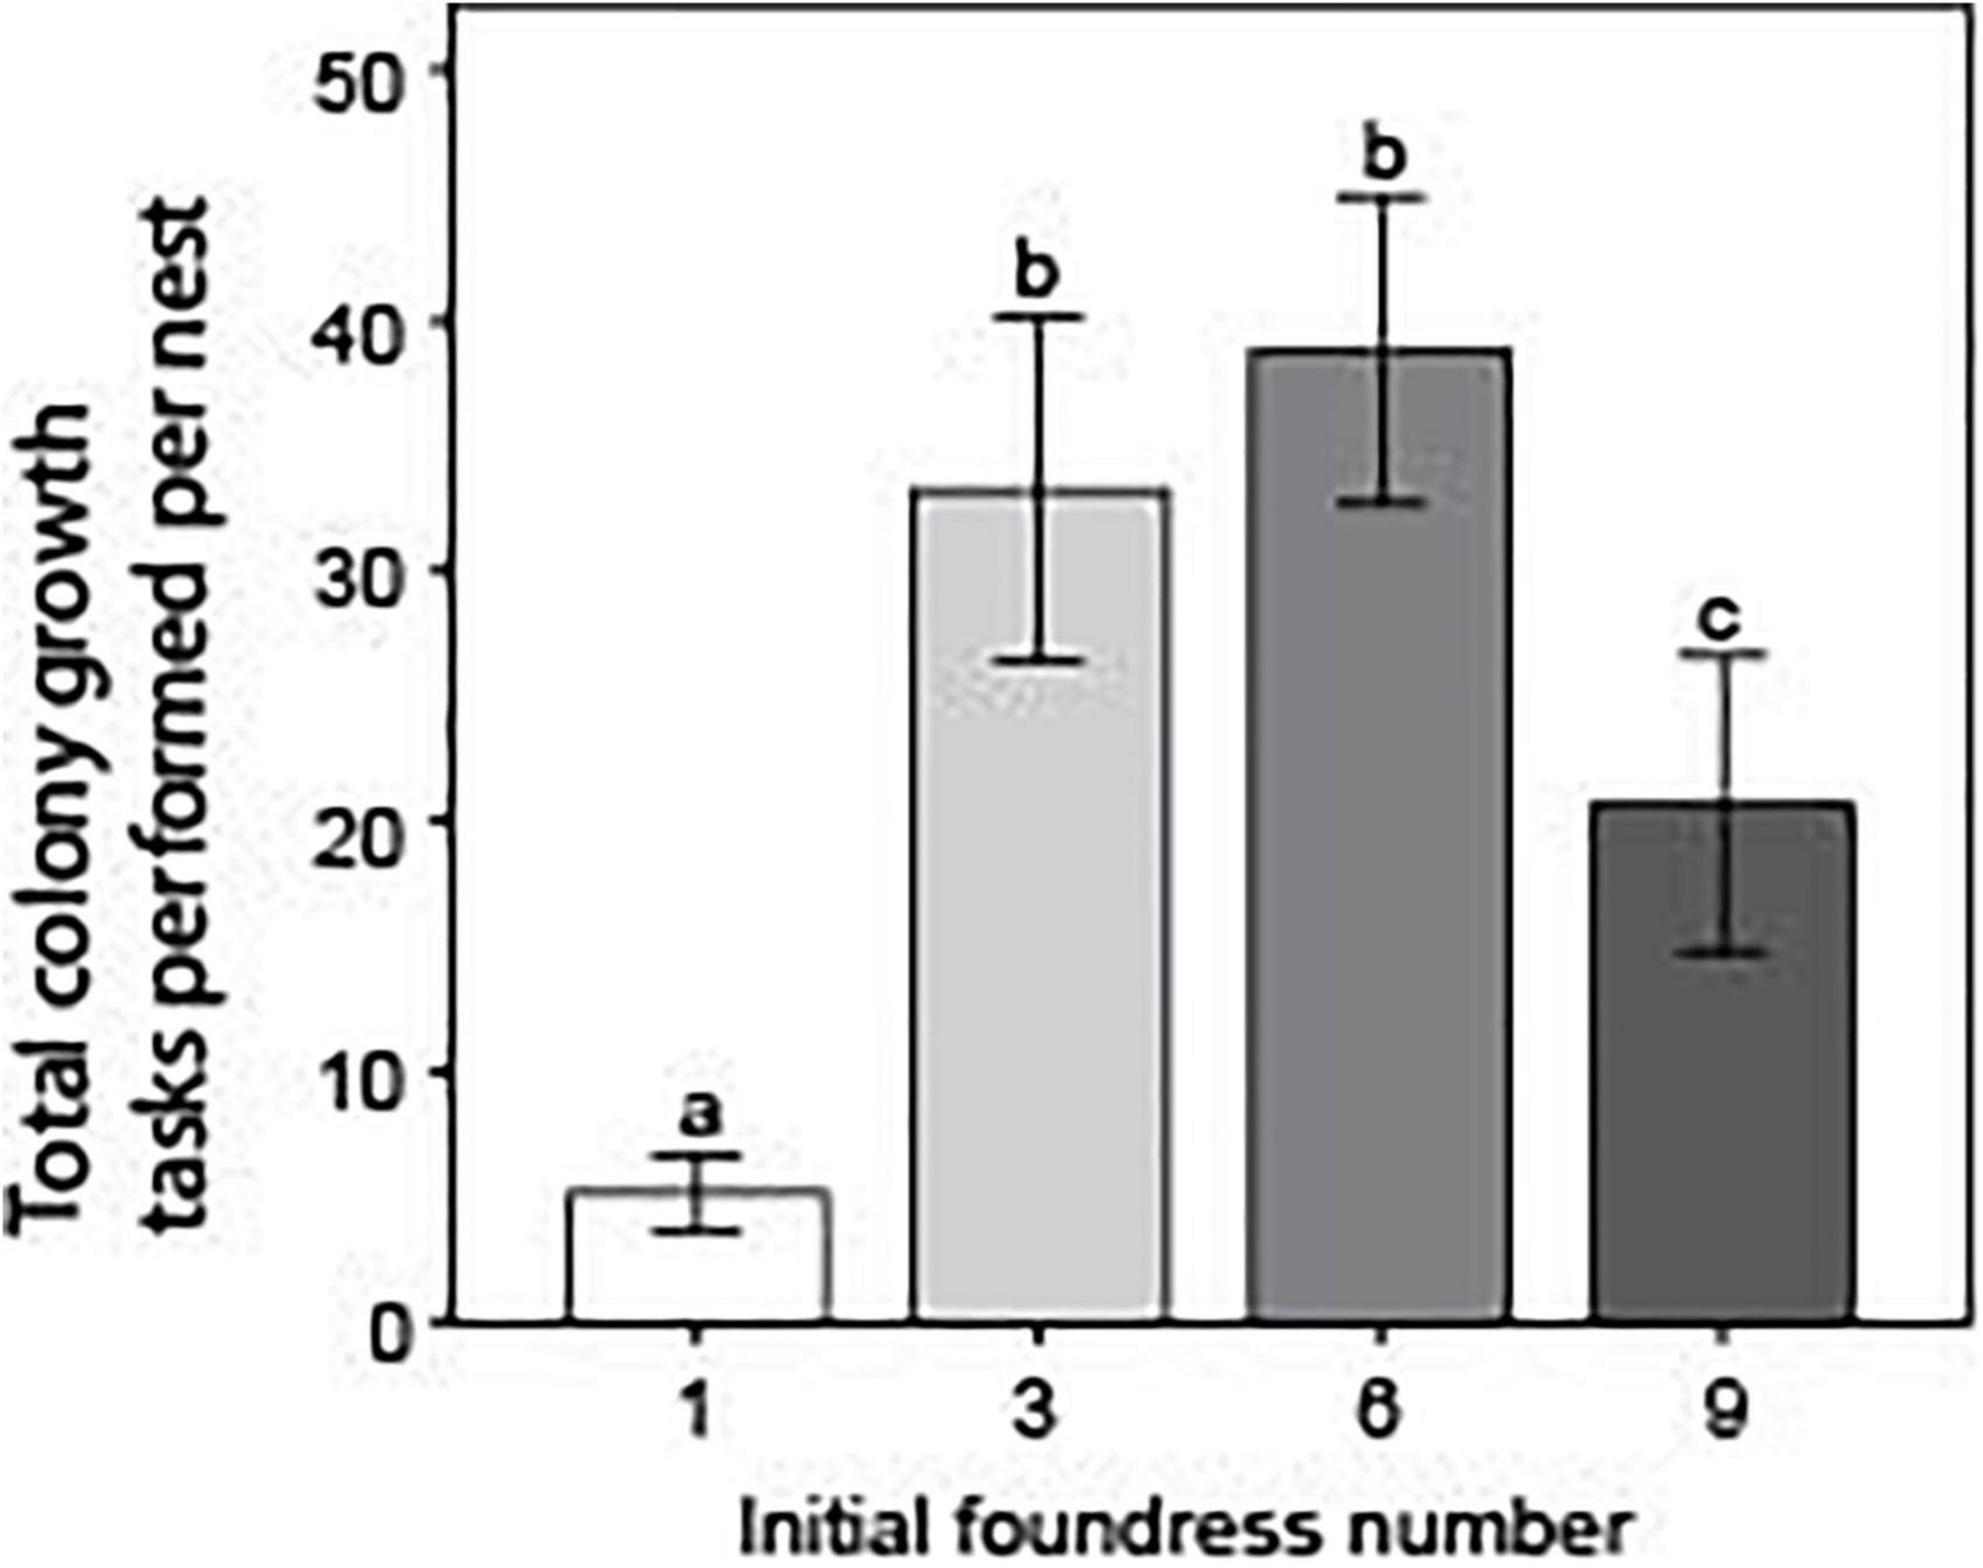
Figure 6. Foundress number significantly influenced the total performance of colony growth tasks. Colony growth tasks included only tunneling, excavating, foraging, and tending brood. Without correcting for ant survival, the total number of tasks was summed up per nest and averaged across each treatment. Different letters above bars indicate significant differences between groups after post hoc analysis (Z-tests following negative binomial regression, p < 0.05).
Focusing even more specifically on brood care, foundress number significantly influenced the absolute number of brood-tending acts, with social groups far outstripping single-foundress nests (Figure 7). There were also some significant differences among social groups (Negative binomial regression: χ2 = 9.0; df = 2; p = 0.011). Groups of three and six queens performed the most brood care and did not differ from one another (Z-test: p = 0.234). Groups of nine performed significantly less brood care than groups of six (Z-test; p = 0.002) but did not significantly differ from groups of three (Z-test: p = 0.056).
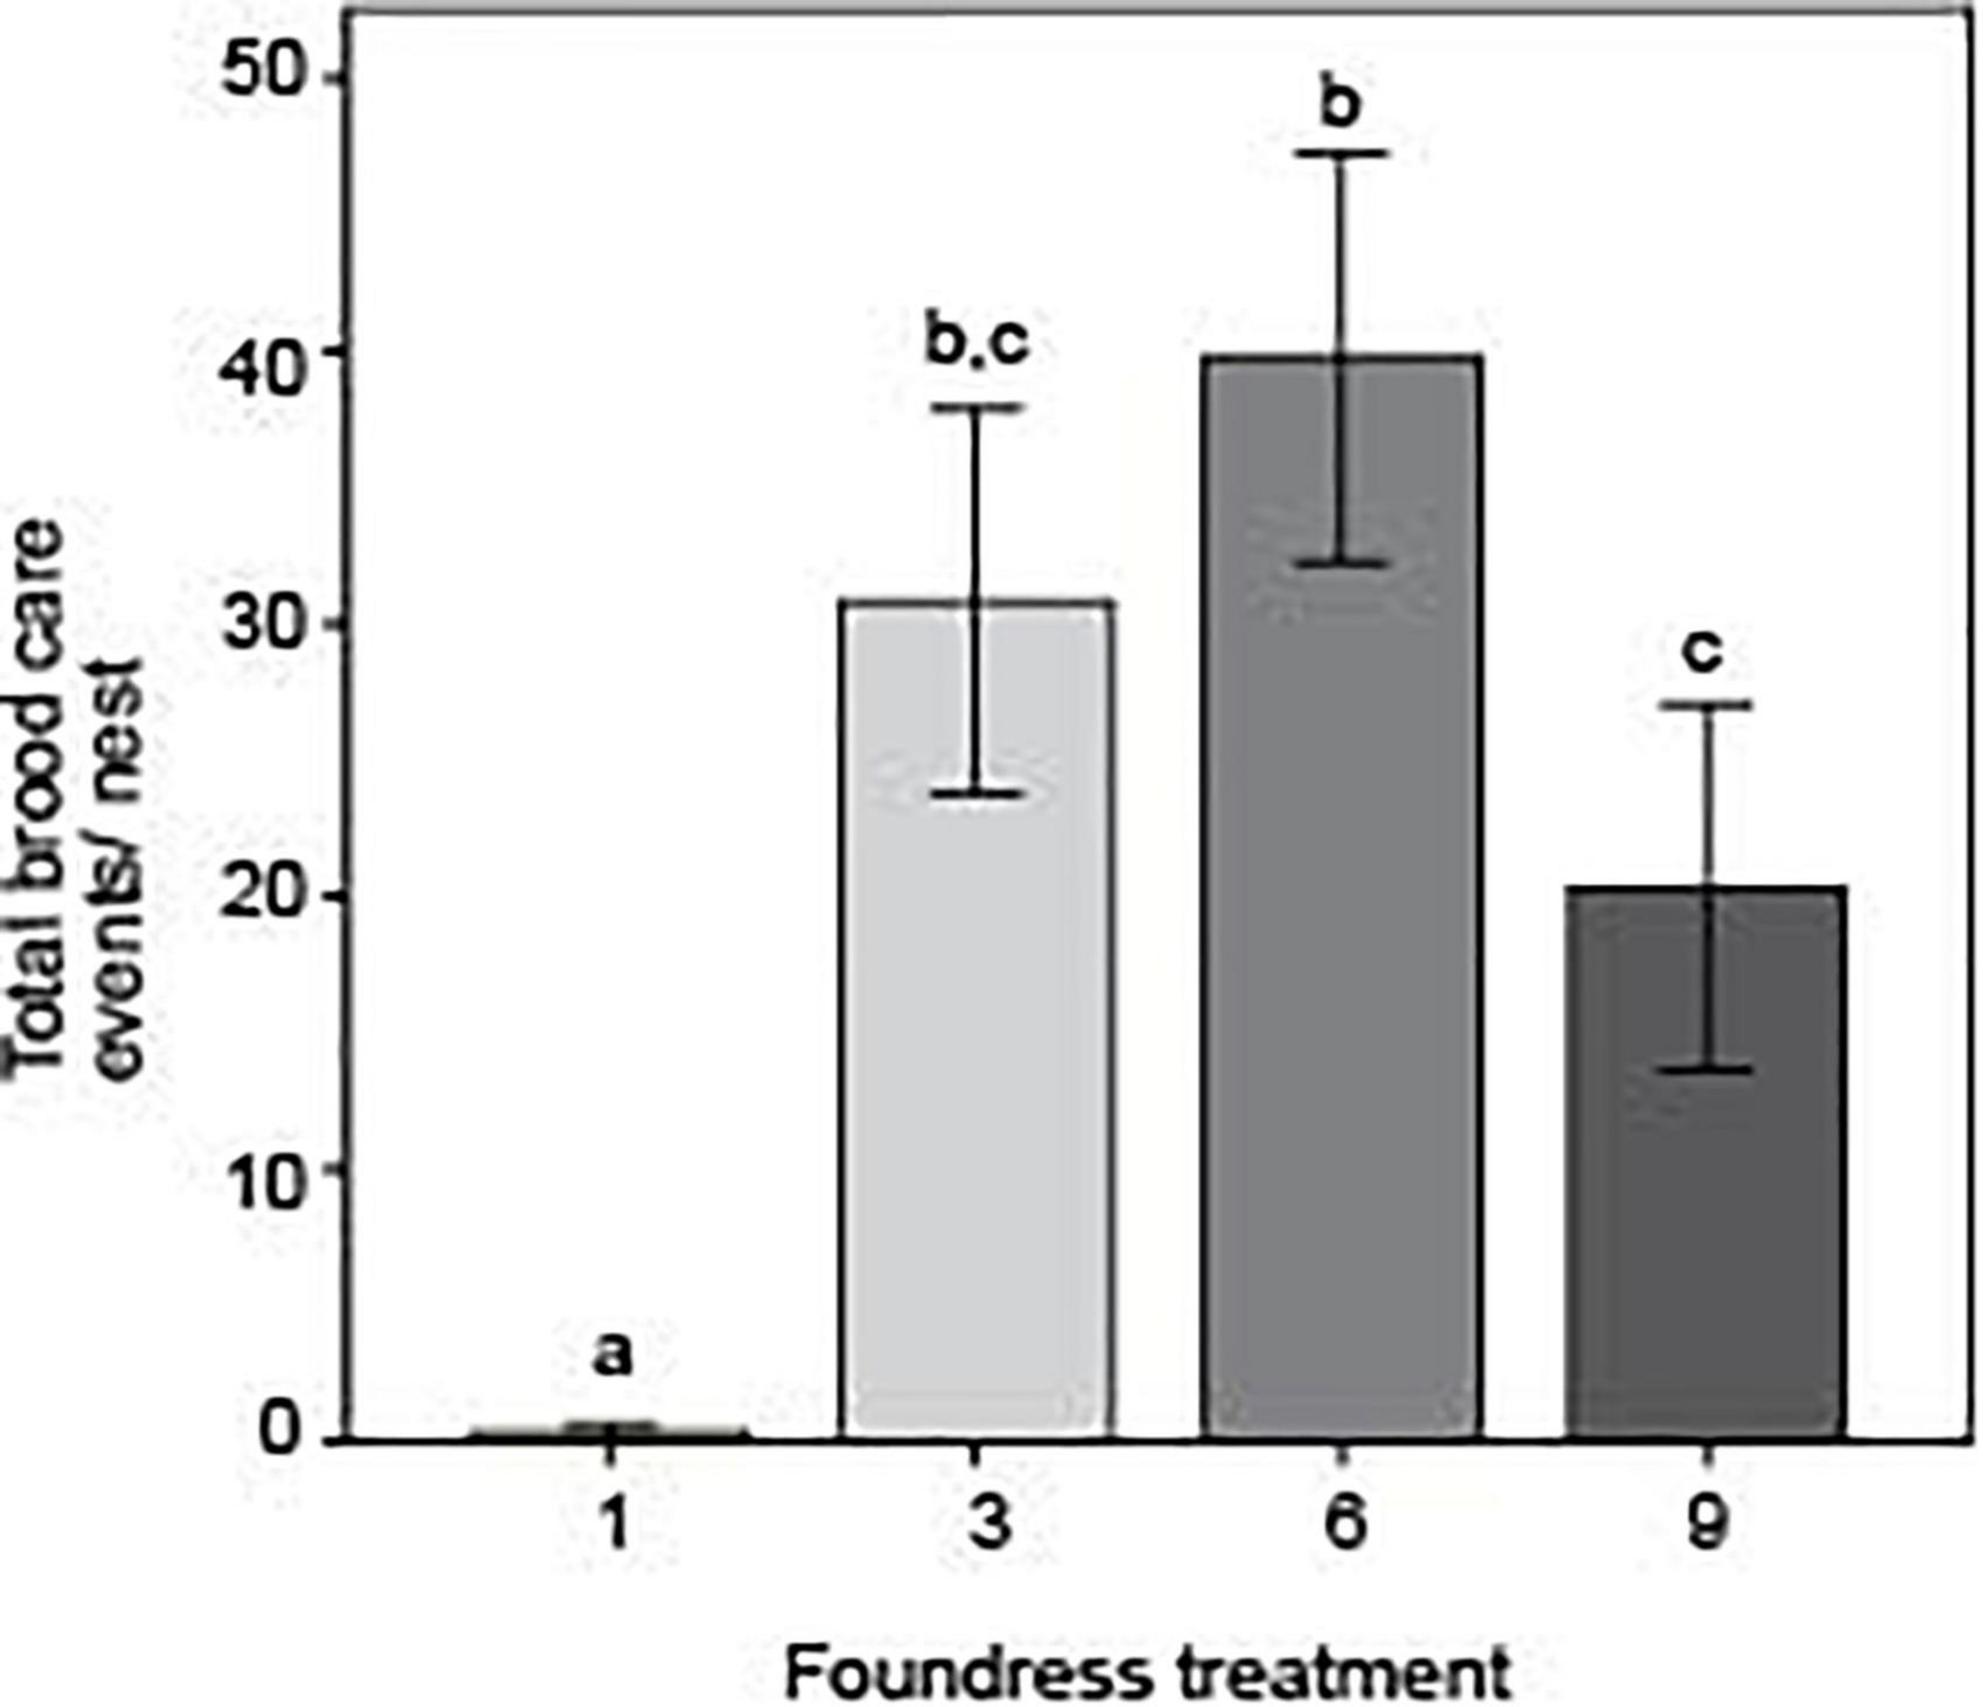
Figure 7. Foundress number significantly influenced the absolute number of brood-tending events with groups of 3 and 6 caring most for their brood. Different letters above bars indicate significant differences between groups after post hoc analysis (Z-tests following negative binomial regression, p < 0.05).
Overall Fitness Metric
An overall fitness metric was calculated as the product of per capita worker production at day 50 and the proportion of foundresses surviving to day 50. This metric was 0.67 ± 0.10 for group size three, 0.57 ± 0.10 for group size six, and 0.16 ± 0.11 for group size nine (). The three social groups differed significantly (ANOVA: F = 6.24; df = 2, 59; p = 0.0035), with groups of nine having significantly lower values than groups of three or six (Tukey tests: p = 0.004 and 0.022, respectively), which were similar to each other (Tukey test: p = 0.744). Because no queens or workers survived from the solitary foundress treatment, they were excluded from this calculation.
Discussion
Our results show strong concordance with observed typical queen numbers in field populations for the polygynous population of Pogonomyrmex californicus. Single queens had higher mortality—which suggests benefits of sociality. Interestingly, nests converged to the number of queens seen in the wild when they start in larger groups. All social groups were equally successful in producing workers, but intermediate groups were more efficient in their ability to convert eggs into workers. We were able to show that, mechanistically, this advantage was tied to increased efficiency at every brood transition stage (from egg to worker). This seems to have resulted from the allocation of work effort toward increased brood care at intermediate nest sizes. Out of the potential benefits of cooperative nest initiation, we found clear support for decreased queen mortality in groups and the ability for specific intermediate group sizes to produce the first workers more efficiently, but larger groups were ultimately similar to intermediate-sized ones in terms of queen survival and workers produced.
Enhanced Foundress Survival in Groups Regardless of Size
In our study, foundress number influenced survival—with foundresses in social groups surviving longer than solitary foundresses, regardless of group size. In several earlier studies of this population, a similar survival advantage was reported for groups of between two and six queens (Johnson, 2004; Clark and Fewell, 2014; Shaffer et al., 2016; Ostwald et al., 2021), along with some suggestions that larger group sizes can facilitate enhanced survival rates. By founding in groups, queens may enhance their own survival by sharing the work of colony foundation, which can involve costly and dangerous tasks and includes excavation, brood care, and foraging (Bernasconi and Strassmann, 1999). Foundress groups of P. californicus have been shown to develop a division of labor during colony foundation (Cahan and Fewell, 2004). This synergistic sharing of work may be responsible for survival benefits. For example, cooperative nest excavation may reduce water loss rate (Johnson and Gibbs, 2004) or allow allogrooming (Theis et al., 2015). Since the size of the group did not scale positively with individual queen survival probabilities in our nest context, survival benefits alone are unlikely to be the sole determining factor favoring group nest initiation for this species. If survival benefits were all that mattered, we would expect smaller group sizes (e.g., 2–3 queens) because of the longer-term reproductive advantage they would provide over the larger group sizes actually observed in the wild population. Thus, other advantages must be present as well.
Influence of Group Size on Brood Production and Efficiency of Worker Production
We found that, irrespective of founding group size, the timing of egg laying followed a similar trajectory. For example, all of the founding groups produced eggs during the first week of nest foundation and peaked in egg production on the same day, suggesting that individual physiological constraints limit egg production rates during nest initiation. Meanwhile, nests with social groups contained a similar number of eggs per queen, while solitary queens produced fewer—a result similar to that reported by Johnson (2004). While the groups of nine foundresses produced the most eggs, this initial advantage increasingly faded with each stage of metamorphosis. Where did the missing eggs go? Two non-mutually exclusive hypotheses are that some eggs may have succumbed to disease due to inadequate hygiene, or that eggs may have been eaten—as in trophic egg production (Brian and Rigby, 1978; Gobin and Ito, 2000; Perry and Roitberg, 2005).
Optimal Allocation of Labor at Intermediate Group Sizes
Foundress number influenced two key measures of fitness for incipient colonies: queen survival and the per-capita production of workers—suggesting an “optimal” intermediate group size. In addition to these measures, we more closely examined the allocation of labor and the efficiency of brood development in different-sized foundress groups, to allow us to pinpoint the mechanisms that determine optimal group size. Specifically, group size influenced both the overall activity levels of the groups as well as the allocation of labor. Small groups were most active, and as the founding groups grew larger, activity decreased. But while solitary queens were the most active of all, they performed fewer actual colony growth tasks than social groups. Solitary queens laid eggs, but the relative absence of brood care likely contributed to the increased failure rate of their brood to develop beyond the larval stage. Of all recorded behaviors, these solitary queens were most often observed walking (often at the surface of the sand in their observation nest). We speculate that these queens were searching—perhaps for other nest-founding partners. The Pine Valley population from which the queens were collected is primarily pleometrotic, hence these lone queens may be genetically programmed to search for founding groups to join. There are clear gene expression differences between queens found in predominantly pleometrotic Pine Valley relative to a nearby haplometrotic population (Helmkampf et al., 2016). A searching phenotype may be one manifestation of these genetic differences.
In contrast to the hyperactivity of the solitary queens, large founding groups (nine queens) were characterized by extreme inactivity. Even with an excess queen-ant labor force, fewer total colony growth tasks were performed in groups founded by nine queens relative to groups founded by three or six queens. Groups of nine also performed less brood care than groups founded by six. Thus, while these large foundress groups initially produced the largest number of eggs, the failure to perform colony growth tasks (including foraging, excavating, and brood care) likely contributed to the loss of this initial reproductive advantage.
Why were the largest groups so inactive? We have two hypotheses for why activity decreased as queen number increased. The first hypothesis relates to contact or interaction rate. A number of studies have shown that interaction rate may be an important cue that guides an individual social insect’s response to changing colony conditions (Gordon and Mehdiabadi, 1999; Pratt et al., 2002; Smith et al., 2017). The high density of queens in groups of nine (and resulting increase in interactions) may have thereby triggered a shift in behavior in these queens from a state as active foundresses to a state as quiescent queens.
Our second hypothesis holds that foundress groups regulate their total amount of work to that needed to produce the colony’s first cohort of workers. If we suppose that there is a finite amount of useful work that is necessary to produce this cohort, the inactivity of the large groups may make sense. Consider Figure 4—which shows the allocation of labor for an average queen in the different-sized groups. A queen in a group of three performed the most “useful” work. If there was a finite amount of work to be done we might predict that a queen in a group of six would have performed half as much work as a queen in a group of three. This is indeed what our data show. In turn, an average queen in a group of nine would have needed to do approximately 1/3 as much work as a queen in a group of three in this scenario, and again this is approximately what we see. In other words, the inactivity of the queens in the groups of nine may in fact be a rational response to the availability of work in the nest. With this perspective, the amount of work done by each queen may simply be an emergent social response to conditions in the nest. This could also be described as a kind of social homeostasis that influences the allocation of labor—where there is a finite amount of work to be done and a limit on the number of workers that a nascent colony can produce at that life history stage. While not being particularly efficient, the groups of nine queens got the basic job done: they survived and produced workers at the same rate in this early life history stage as the smaller social groups.
An Overall Metric of Fitness
By multiplying the per capita productivity of different foundress group sizes by the survival rate of those groups, we obtained a single estimate of fitness. With this standard, the intermediate-sized groups far outperformed the solitary queens and groups of nine. Thus, our results present a bit of a paradox. While all social groups performed equally well in terms of absolute numbers of brood production (especially the most important measure: workers), intermediate groups were more efficient in their ability to produce workers and consequently have a far greater cumulative fitness score.
The Socio-Ecological Context of Pleometrosis in Pogonomyrmex californicus
How do our results fit within what is already known of the social and ecological contexts of this and other species? Building upon work by Johnson, Overson reported an average of four queens in the population from which our queens were collected (Pine Valley; Johnson, 2004; Overson et al., 2014). This provides context for our finding that groups of three and six queens performed best in our study. The Pine Valley population probably represents a mixed evolutionarily stable strategy (ESS) where both cooperative and non-cooperative (aggressive) queens are present—but where cooperative (pleometrotic) queens are favored. The likely socio-ecological determinant is the high density and clustering of mature colonies found in Pine Valley—that results in intraspecific competition between clustered natal colonies (Shaffer et al., 2016; Haney and Fewell, 2018). In other species of pleometrotic ants, nest site limitation, highly clustered distribution, and densely located colonies seem to play a key ecological role in fostering cooperative nest founding (Tschinkel, 2006). Young colonies must likely contend with both predation from mature colonies as well as competition with other natal colonies. Our study captured only a narrow window at the beginning of the life of these colonies, but other work has demonstrated that the benefits of cooperative nest founding extend months into the early life of a colony, perhaps explaining why in addition to being pleometrotic, this population maintains primary polygyny in mature colonies, (Ostwald et al., 2021). In such contexts, a multilevel selection approach may be helpful in understanding the evolution of pleometrosis and related phenomena in social insect colonies (Rissing et al., 1989; Tsuji, 1995; Muir, 1996; Korb and Heinze, 2004; Reeve and Hölldobler, 2007; Dobata and Tsuji, 2013; Shaffer et al., 2016).
In spite of the artificial setting (ant farms), our study demonstrated clear fitness effects in terms of survival and production. This and similar ant farm studies are remarkable in this sense –young colonies (removed from the risks of predation and other environmental challenges found in nature) nonetheless demonstrate an influence on fitness and other emergent effects (such as changes in division of labor). This may make sense if we consider that in nature each incipient nest is a microcosm where a young queen (or queens) is generally inactive and stays within the nest as much as possible (besides necessary foraging trips). Most of the real “action” (and necessary work) occurs within the confines of the nest. But there may yet be unaccounted for environmental effects for young colonies in natural settings. Further field-based studies will hopefully shed further light on the adaptive value of pleometrosis. Regardless, our paper shows that selective pressures inside the natal nest favor cooperative group formation. However, such cooperation has limitations that create size constraints under which grouping is truly adaptive.
Data Availability Statement
The raw data supporting the conclusions of this article will be made available by the authors, without undue reservation.
Ethics Statement
Ants were collected with permission of the residents of Pine Valley, California. All ant queens were handled with an eye toward maximizing their survival during collection. Ants were handled according to current laws of animal welfare regulation, and as invertebrates—no institutional approval was required. No ant was deliberately harmed in the course of this study.
Author Contributions
ZS, RC, and SD carried out the experiment. ZS, SP, and SD analyzed the results. ZS wrote the first draft of the manuscript. ZS, RC, SP, and JF designed the experiment and prepared the manuscript. All authors contributed to the article and approved the submitted version.
Funding
This work was supported by the Office of Naval Research grant N00014-08-1-0696.
Conflict of Interest
The authors declare that the research was conducted in the absence of any commercial or financial relationships that could be construed as a potential conflict of interest.
Publisher’s Note
All claims expressed in this article are solely those of the authors and do not necessarily represent those of their affiliated organizations, or those of the publisher, the editors and the reviewers. Any product that may be evaluated in this article, or claim that may be made by its manufacturer, is not guaranteed or endorsed by the publisher.
Acknowledgments
We thank Madeleine Ostwald for helpful editorial suggestions in reading the manuscript.
References
Abrams, J., and Eickwort, G. C. (1981). Nest switching and guarding by the communal sweat bee Agapostemon virescens (Hymenoptera, Halictidae). Insect. Soc. 28, 105–116. doi: 10.1007/BF02223699
Adams, E. S., and Tschinkel, W. R. (1995). Effects of foundress number on brood raids and queen survival in the fire ant Solenopsis invicta. Behav. Ecol. Sociobiol. 37, 233–242. doi: 10.1007/s002650050186
Avilés, L., and Tufino, P. (1998). Colony size and individual fitness in the social spider Anelosimus eximius. Am. Nat. 152, 403–418. doi: 10.1086/286178
Bartz, S. H., and Hölldobler, B. (1982). Colony founding in Myrmecocystus mimicus Wheeler (Hymenoptera: Formicidae) and the evolution of foundress associations. Behav. Ecol. Sociobiol. 10, 137–147. doi: 10.1007/bf00300174
Bernasconi, G., and Strassmann, J. E. (1999). Cooperation among unrelated individuals: the ant foundress case. Trends Ecol. Evol. 14, 477–482. doi: 10.1016/s0169-5347(99)01722-x
Brian, M., and Rigby, C. (1978). The trophic eggs of Myrmica rubra L. Insect. Soc. 25, 89–110. doi: 10.1007/bf02224488
Cahan, S., and Julian, G. E. (1999). Fitness consequences of cooperative colony founding in the desert leaf-cutter ant Acromyrmex versicolor. Behav. Ecol. 10, 585–591. doi: 10.1093/beheco/10.5.585
Cahan, S. H., and Fewell, J. H. (2004). Division of labor and the evolution of task sharing in queen associations of the harvester ant Pogonomyrmex californicus. Behav. Ecol. Sociobiol. 56, 9–17. doi: 10.1007/s00265-003-0746-5
Caraco, T., and Wolf, L. L. (1975). Ecological determinants of group sizes of foraging lions. Am. Nat. 109, 343–352. doi: 10.1086/283001
Chiu, C.-I., Neoh, K.-B., and Li, H.-F. (2017). Colony-founding success of pleometrosis in a fungus-growing termite Odontotermes formosanus. Behav. Ecol. Sociobiol. 72:13. doi: 10.1007/s00265-017-2429-7
Choe, J. C., and Crespi, B. J. (1997). The Evolution of Social Behavior in Insects and Arachnids. Cambridge: Cambridge University Press.
Clark, R. M., and Fewell, J. H. (2014). Social dynamics drive selection in cooperative associations of ant queens. Behav. Ecol. 25, 117–123. doi: 10.1093/beheco/art093
Clutton-Brock, T. (2009). Cooperation between non-kin in animal societies. Nature 462, 51–57. doi: 10.1038/nature08366
Cook, C. N., and Breed, M. D. (2013). Social context influences the initiation and threshold of thermoregulatory behaviour in honeybees. Anim. Behav. 86, 323–329. doi: 10.1016/j.anbehav.2013.05.021
Côté, I. M., and Poulinb, R. (1995). Parasitism and group size in social animals: a meta-analysis. Behav. Ecol. 6, 159–165. doi: 10.1093/beheco/6.2.159
Crespi, B., Carmean, D., and Chapman, T. (1997). Ecology and evolution of galling thrips and their allies. Annu. Rev. Entomol. 42, 51–71. doi: 10.1146/annurev.ento.42.1.51
Dobata, S., and Tsuji, K. (2013). Public goods dilemma in asexual ant societies. Proc. Natl. Acad. Sci. U.S.A. 110, 16056–16060. doi: 10.1073/pnas.1309010110
Dolezal, A. G., Brent, C. S., Hölldobler, B., and Amdam, G. V. (2012). Worker division of labor and endocrine physiology are associated in the harvester ant, Pogonomyrmex californicus. J. Exp. Biol. 215, 454–460. doi: 10.1242/jeb.060822
Dornhaus, A., Powell, S., and Bengston, S. (2012). Group size and its effects on collective organization. Annu. Rev. Entomol. 57, 123–141. doi: 10.1146/annurev-ento-120710-100604
Dugatkin, L. (2002). Animal cooperation among unrelated individuals. Naturwissenschaften 89, 533–541. doi: 10.1007/s00114-002-0379-y
Eriksson, T., Hölldobler, B., Taylor, J., and Gadau, J. (2019). Intraspecific variation in colony founding behavior and social organization in the honey ant Myrmecocystus mendax. Insect. Soc. 66, 283–297. doi: 10.1007/s00040-019-00687-y
Gamboa, G. J. (1978). Intraspecific defense: advantage of social cooperation among paper wasp foundresses. Science 199, 1463–1465. doi: 10.1126/science.199.4336.1463
Gilbert, J. D. J., and Simpson, S. J. (2013). Natural history and behaviour of Dunatothrips aneurae Mound (Thysanoptera: Phlaeothripidae), a phyllode-gluing thrips with facultative pleometrosis. Biol. J. Linn. Soc. 109, 802–816. doi: 10.1111/bij.12100
Gobin, B., and Ito, F. (2000). Queens and major workers of Acanthomyrmex ferox redistribute nutrients with trophic eggs. Naturwissenschaften 87, 323–326. doi: 10.1007/s001140050731
Gordon, D. M., and Mehdiabadi, N. J. (1999). Encounter rate and task allocation in harvester ants. Behav. Ecol. Sociobiol. 45, 370–377. doi: 10.1007/s002650050573
Hacker, M., Kaib, M., Bagine, R. K. N., Epplen, J. T., and Brandl, R. (2005). Unrelated queens coexist in colonies of the termite Macrotermes michaelseni. Mol. Ecol. 14, 1527–1532. doi: 10.1111/j.1365-294X.2005.02507.x
Haney, B. R., and Fewell, J. H. (2018). Ecological drivers and reproductive consequences of non-kin cooperation by ant queens. Oecologia 187, 643–655. doi: 10.1007/s00442-018-4148-9
Helmkampf, M., Mikheyev, A. S., Kang, Y., Fewell, J., and Gadau, J. (2016). Gene expression and variation in social aggression by queens of the harvester ant Pogonomyrmex californicus. Mol. Ecol. 25, 3716–3730. doi: 10.1111/mec.13700
Hölldobler, B., and Wilson, E. O. (1977). The number of queens: an important trait in ant evolution. Naturwissenschaften 64, 8–15. doi: 10.1007/bf00439886
Itô, Y. (1986). On the pleometrotic route of social evolution in the Vespidae. Ital. J. Zool. 20, 241–262. doi: 10.1080/00269786.1986.10736501
Izzo, T. J., Bruna, E. M., Vasconcelos, H. L., and Inouye, B. D. (2009). Cooperative colony founding alters the outcome of interspecific competition between Amazonian plant-ants. Insect. Soc. 56, 341–345. doi: 10.1007/s00040-009-0029-x
Jeanson, R., and Fewell, J. H. (2008). Influence of the social context on division of labor in ant foundress associations. Behav. Ecol. 19, 567–574. doi: 10.1093/beheco/arn018
Jerome, C. A., McInnes, D. A., and Adams, E. S. (1998). Group defense by colony-founding queens in the fire ant Solenopsis invicta. Behav. Ecol. 9, 301–308. doi: 10.1093/beheco/9.3.301
Johnson, R. A. (2004). Colony founding by pleometrosis in the semiclaustral seed-harvester ant Pogonomyrmex californicus (Hymenoptera: Formicidae). Anim. Behav. 68, 1189–1200. doi: 10.1016/j.anbehav.2003.11.021
Johnson, R. A., and Gibbs, A. G. (2004). Effect of mating stage on water balance, cuticular hydrocarbons and metabolism in the desert harvester ant, Pogonomyrmex barbatus. J. Insect Physiol. 50, 943–953. doi: 10.1016/j.jinsphys.2004.07.006
Korb, J., and Heinze, J. (2004). Multilevel selection and social evolution of insect societies. Naturwissenschaften 91, 291–304. doi: 10.1007/s00114-004-0529-5
Michaud, J. P., and Belliure, B. (2000). Consequences of foundress aggregation in the brown citrus aphid Toxoptera citricida. Ecol. Entomol. 25, 307–314. doi: 10.1046/j.1365-2311.2000.00257.x
Miller, D. G. III (1998a). Consequences of communal gall occupation and a test for kin discrimination in the aphid Tamalia coweni (Cockerell) (Homoptera: Aphididae). Behav. Ecol. Sociobiol. 43, 95–103. doi: 10.1007/s002650050471
Miller, D. G. (1998b). Life history, ecology and communal gall occupation in the manzanita leaf-gall aphid, Tamalia coweni (cockerell) (Homoptera: Aphididae). J. Nat. Hist. 32, 351–366. doi: 10.1080/00222939800770181
Muir, W. M. (1996). Group selection for adaptation to multiple-hen cages: selection program and direct responses. Poult. Sci. 75, 447–458. doi: 10.3382/ps.0750447
Offenberg, J., Peng, R., and Nielsen, M. G. (2012). Development rate and brood production in haplo- and pleometrotic colonies of Oecophylla smaragdina. Insect. Soc. 59, 307–311. doi: 10.1007/s00040-012-0221-2
Ostwald, M. M., Guo, X., Wong, T., Malaekeh, A., Harrison, J. F., and Fewell, J. H. (2021). Cooperation among unrelated ant queens provides persistent growth and survival benefits during colony ontogeny. Sci. Rep. 11, 1–10. doi: 10.1038/s41598-021-87797-5
Overson, R., Fewell, J., and Gadau, J. (2016). Distribution and origin of intraspecific social variation in the California harvester ant Pogonomyrmex californicus. Insect. Soc. 63, 531–541. doi: 10.1007/s00040-016-0497-8
Overson, R., Gadau, J., Clark, R. M., Pratt, S. C., and Fewell, J. H. (2014). Behavioral transitions with the evolution of cooperative nest founding by harvester ant queens. Behav. Ecol. Sociobiol. 68, 21–30. doi: 10.1007/s00265-013-1618-2
Perry, J. C., and Roitberg, B. D. (2005). Ladybird mothers mitigate offspring starvation risk by laying trophic eggs. Behav. Ecol. Sociobiol. 58, 578–586. doi: 10.1007/s00265-005-0947-1
Pratt, S. C., Mallon, E. B., Sumpter, D. J., and Franks, N. R. (2002). Quorum sensing, recruitment, and collective decision-making during colony emigration by the ant Leptothorax albipennis. Behav. Ecol. Sociobiol. 52, 117–127. doi: 10.1007/s00265-002-0487-x
Rau, P. (1931). The nesting habits of Polistes rubiginosis, with special referenceto pleometrosis in this and other species of Polistes wasps. Psyche J. Entomol. 38, 129–144. doi: 10.1155/1931/17471
Reeve, H. K., and Hölldobler, B. (2007). The emergence of a superorganism through intergroup competition. Proc. Natl. Acad. Sci. U.S.A. 104, 9736–9740. doi: 10.1073/pnas.0703466104
Rissing, S. W., Johnson, R. A., and Martin, J. W. (2000). Colony founding behavior of some desert ants: geographic variation in metrosis. Psyche J. Entomol. 103, 95–101.
Rissing, S. W., and Pollock, G. B. (1987). Queen aggression, pleometrotic advantage and brood raiding in the ant Veromessor pergandei (Hymenoptera: Formicidae). Anim. Behav. 35, 975–981. doi: 10.1016/s0003-3472(87)80154-9
Rissing, S. W., Pollock, G. B., Higgins, M. R., Hagen, R. H., and Smith, D. R. (1989). Foraging specialization without relatedness or dominance among co-founding ant queens. Nature 338, 420–422. doi: 10.1038/338420a0
Saito, Y. (2009). Plant Mites and Sociality: Diversity and Evolution. Berlin: Springer Science & Business Media.
Schwarz, M. P., Bull, N. J., and Hogendoorn, K. (1998). Evolution of sociality in the allodapine bees: a review of sex allocation, ecology and evolution. Insect. Soc. 45, 349–368. doi: 10.1007/s000400050095
Shaffer, Z., Sasaki, T., Haney, B., Janssen, M., Pratt, S. C., and Fewell, J. H. (2016). The foundress’s dilemma: group selection for cooperation among queens of the harvester ant, Pogonomyrmex californicus. Sci. Rep. 6, 1–9. doi: 10.1038/srep29828
Shen, S., Emlen, S. T., Koenig, W. D., and Rubenstein, D. R. (2017). The ecology of cooperative breeding behaviour. Ecol. Lett. 20, 708–720. doi: 10.1111/ele.12774
Smith, M. L., Koenig, P. A., and Peters, J. M. (2017). The cues of colony size: how honey bees sense that their colony is large enough to begin to invest in reproduction. J. Exp. Biol. 220, 1597–1605. doi: 10.1242/jeb.150342
Sommer, K., and Hoelldobler, B. (1995). Colony founding by queen association and determinants of reduction in queen number in the ant Lasius niger. Anim. Behav. 50, 287–294. doi: 10.1006/anbe.1995.0244
Soucy, S. L., and Giray, T. (2003). Solitary and group nesting in the orchid bee Euglossa hyacinthina (Hymenoptera, Apidae). Insect. Soc. 50, 248–255. doi: 10.1007/s00040-003-0670-8
Strassmann, J. E. (1989). Altruism and relatedness at colony foundation in social insects. Trends Ecol. Evol. 4, 371–374. doi: 10.1016/0169-5347(89)90102-X
Taborsky, M., Frommen, J. G., and Riehl, C. (2016). The evolution of cooperation based on direct fitness benefits. Philos. Trans. R. Soc. B Biol. Sci. 371:20150472. doi: 10.1098/rstb.2015.0472
Theis, F. J., Ugelvig, L. V., Marr, C., and Cremer, S. (2015). Opposing effects of allogrooming on disease transmission in ant societies. Philos. Trans. R. Soc. B Biol. Sci. 370:20140108. doi: 10.1098/rstb.2014.0108
Thorne, B. L. (1984). Polygyny in the Neotropical termite Nasutitermes corniger: life history consequences of queen mutualism. Behav. Ecol. Sociobiol. 14, 117–136. doi: 10.1007/bf00291903
Tibbetts, E. A. (2003). Benefits of foundress associations in the paper wasp Polistes dominulus: increased productivity and survival, but no assurance of fitness returns. Behav. Ecol. 14, 510–514. doi: 10.1093/beheco/arg037
Tierney, S. M., Cronin, A. L., Loussert, N., and Schwarz, M. P. (2000). The biology of Brevineura froggatti and phylogenetic conservatism in Australian allodapine bees (Apidae, Allodapini). Insect. Soc. 47, 96–97. doi: 10.1007/s000400050016
Tschinkel, W. R., and Howard, D. F. (1983). Colony founding by pleometrosis in the fire ant, Solenopsis invicta. Behav. Ecol. Sociobiol. 12, 103–113. doi: 10.1007/bf00343200
Tsuji, K. (1995). Reproductive conflicts and levels of selection in the ant Pristomyrmex pungens: contextual analysis and partitioning of covariance. Am. Nat. 146, 586–607. doi: 10.1086/285816
Waloff, N. (1957). The effect of the number of queens of the ant Lasius flavus (Fab.) (Hym., Formicidae) on their survival and on the rate of development of the first brood. Insect. Soc. 4, 391–408. doi: 10.1007/BF02224159
Waters, J. S., Holbrook, C. T., Fewell, J. H., and Harrison, J. F. (2010). Allometric scaling of metabolism, growth, and activity in whole colonies of the seed-harvester ant Pogonomyrmex californicus. Am. Nat. 176, 501–510. doi: 10.1086/656266
Keywords: ant foundresses, cooperative nest-founding, pleometrosis, Pogonomyrmex californicus, seed-harvester ants
Citation: Shaffer ZJ, Dreyer S, Clark RM, Pratt SC and Fewell JH (2022) Efficient Allocation of Labor Maximizes Brood Development and Explains Why Intermediate-Sized Groups Perform Best During Colony-Founding in the Ant, Pogonomyrmex californicus. Front. Ecol. Evol. 10:768752. doi: 10.3389/fevo.2022.768752
Received: 01 September 2021; Accepted: 19 January 2022;
Published: 10 February 2022.
Edited by:
Leticia Aviles, University of British Columbia, CanadaReviewed by:
Kazuki Tsuji, University of the Ryukyus, JapanSheng-Feng Shen, Biodiversity Research Center, Academia Sinica, Taiwan
Copyright © 2022 Shaffer, Dreyer, Clark, Pratt and Fewell. This is an open-access article distributed under the terms of the Creative Commons Attribution License (CC BY). The use, distribution or reproduction in other forums is permitted, provided the original author(s) and the copyright owner(s) are credited and that the original publication in this journal is cited, in accordance with accepted academic practice. No use, distribution or reproduction is permitted which does not comply with these terms.
*Correspondence: Zachary J. Shaffer, enNoYWZmZUBhc3UuZWR1
 Zachary J. Shaffer
 Sara Dreyer2