 Lisa Maggioli1,2*
 Emilio Rodríguez-Caballero1,2
 Yolanda Cantón1,2
 Borja Rodríguez-Lozano1,2
 Sonia Chamizo1,2*
- 1Agronomy Department, University of Almería, Almería, Spain
- 2Centro de Colecciones Científicas de la Universidad de Almería (CECOUAL), Almería, Spain
Land degradation is one of the main threats to dryland sustainability in the next decades, hence restoration of the degraded land from drylands is an urgent need to maintain ecosystem functionality and their ability to provide ecosystem services. To achieve this goal, restoration practices should pursue the recovery of the main ground components, arranged in an optimal spatial configuration, to mimic undisturbed natural conditions. Drylands function as complex ecohydrologically coupled systems in which interplant source areas, frequently covered by biocrusts, act as sources of runoff and nutrients to adjacent vegetation, which act as sinks for these resources. Thus, one way to increase dryland restoration success is through an optimal spatial configuration of biocrusts and plants that maximizes an efficient use of the limited resources within the system. In this study, we selected a degraded slope from a limestone quarry located in Almería province (SE Spain) and modeled how active restoration of the biocrust through soil inoculation with cyanobacteria and its combination with different spatial configurations of vegetation affected runoff redistribution and erosion. For that, we applied the spatially distributed Limburg Soil Erosion Model (LISEM) which was able to predict the erosion measured on the slope during the study period with low error (RMSE = 17.8%). Modeling results showed that the introduction of vegetation on the degraded slope reduced runoff between 2 and 24% and erosion between 4 and 17% for the scenario with plants compared to the one without restoration management. Of all the vegetation spatial configurations tested, the one that provided better results was the scenario in which plants were located in the areas of higher water accumulation (higher topographic wetness index). Moreover, we found that active biocrust restoration by cyanobacteria inoculation significantly reduced erosion by 70–90%, especially during the first stages of plant development, while maintaining water supply to vegetation. These findings highlight the potential of water redistribution and erosion simulation models to identify the most optimal spatial configuration of ground covers that maximizes water and nutrient supply to vegetation, while minimizes water, sediment, and nutrient losses by erosion, thus serving as an efficient tool to plan restoration actions in drylands.
Introduction
Drylands cover about 41% of the Earth land’s surface (Prãvãlie, 2016) and host 38% of global population (Maestre et al., 2021). Due to intensive agriculture and overgrazing, about 10–20% of drylands are already degraded (FAO, 2019), and this percentage is expected to rise due to population growth and climate change (Reynolds et al., 2007). Land degradation processes in drylands have implications both for ecosystem health and humans, as they reduce water supply and soil fertility, increase soil losses and reduce biodiversity (Ravi et al., 2010; Zhang et al., 2021). Land degradation in drylands can culminate in desertification, i.e., changes in soil properties which reduce its capacity to retain nutrients and water, causing the loss of productivity and serious environmental and socio-economic problems that specially affect people living in developing countries (FAO, 2019).
After the triggering activity of the degradation process has finished, natural recovery of the ecosystem may take a long time (hundreds of years, Weber et al., 2016) or, sometimes, the ecosystem is not capable of recovering by itself (Svejcar and Kildisheva, 2017). Thus, active restoration is needed to facilitate the process, especially in drylands where water scarcity limits plant growth and establishment (Hulvey et al., 2017; Ayangbenro and Babalola, 2021). Dryland restoration is recognized as an urgent need [Food and Agriculture Organization of the United Nations (FAO), 2017; European Environment Agency, 2019], but traditional restoration techniques, such as the introduction of native vascular plants, mostly trees (FAO, 2015) and the increase of water input or nutrient concentration, are often expensive and unsuccessful in drylands (Valdecantos et al., 2014). Thus, there are still numerous limitations to successfully restore degraded drylands (James et al., 2013) and novel efficient methodologies are needed. In this sense, restoration and rehabilitation strategies that are based on natural processes and cycles (nature-based solutions) are receiving a growing attention as they are resource efficient and adapted to systems (Nesshöver et al., 2017). For example, it is well known the substantial impact that spatial organization of bare and vegetated surfaces can have on the retention or loss of resources (water and nutrients) in dryland ecosystems (Boer and Puigdefábregas, 2005; Tang et al., 2021). Thus the installation of resource sinks during the design of the restoration activity can be an effective way to increase restoration success in drylands (Berghuis et al., 2020).
Natural drylands are heterogenous landscapes composed of sparse and patchy vegetation occupying the most favorable positions within the landscape, and biocrusts frequently colonizing the apparently bare open spaces between plants. These are a consortium of different organisms that include cyanobacteria, algae, lichens, mosses, bacteria and fungi, living in intimate association with soil particles, and occupying the first centimeters of soil surface (Weber et al., 2016). Biocrusts possess specific adaptations that provide them with the ability to withstand the high solar radiation and the scarcity of water that characterize dryland regions all over the world (Bowker et al., 2002; Bowker, 2007). By covering the soil surface, biocrusts adhere fine soil particles, stabilizing the soil surface and protecting it from wind and water erosion (Chamizo et al., 2012b; Belnap et al., 2014; Fattahi et al., 2020). They contribute to carbon and nitrogen fixation (Housman et al., 2006), increasing the fertility of dryland soils (Zhang, 2005; Chamizo et al., 2012a). Through their influence on roughness, albedo and porosity, they affect water processes, such as infiltration, runoff, evaporation and soil moisture (Chamizo et al., 2016; Eldridge et al., 2020). Biocrusts are also the support of abundant and diverse microbial and microfauna communities (Darby et al., 2010; Xiao and Veste, 2017). Because of all these functions on soils, they affect the establishment, survival and productivity of vegetation (Havrilla et al., 2019). At the same time, vegetation patches create microenvironments (shade, more humid conditions and less extreme temperatures) that affect biocrust growth and succession (Maestre and Cortina, 2002; Bowker et al., 2005; Bowker, 2007).
Biocrusts are also linked to vegetation survival and productivity in drylands through complex water and nutrient redistribution interactions (Belnap et al., 2005; Rodríguez-Caballero et al., 2018). When a rain event occurs, runoff is generated in the open areas between plants, mostly covered by biocrusts (which, compared to vegetation, act as runoff sources), and redistributed toward adjacent vegetation, which frequently acts as surface obstruction for most of the runoff water and dissolved sediments and nutrients (Belnap et al., 2005; Cantón et al., 2011). This water surplus promotes vegetation productivity and biomass (Rodríguez-Caballero et al., 2018) and increases vegetation capacity to retain more water and nutrients in the next rain events (Belnap et al., 2005; Ludwig et al., 2005). The result of biocrust-vegetation feedback processes is a spatial mosaic in which the coupling between biocrusts (source areas) and vegetation (sinks) determines the spatial arrangement of plants within the landscape (Cantón et al., 2004; Rodríguez-Caballero et al., 2019), in such a way that plants are redistributed to minimize the loss of water, nutrients and sediments in the ecosystem (Rodríguez-Caballero et al., 2015) and to maximize vegetation productivity and coverage (Rodríguez-Caballero et al., 2018).
Taking into account the above-mentioned key roles of biocrusts in dryland ecosystem functioning and their prevalent presence, biocrust restoration after a disturbance has occurred, can be crucial to accomplish the structural and functional recovery of degraded ecosystems (Zhao et al., 2016). Natural biocrust recovery can be slow depending on factors such as climatic and edaphic conditions, and severity and timing of disturbance (Weber and Hill, 2016), as well as biocrust characteristics (Xiao et al., 2019).
Recent papers point to lower biocrust recovery times, ranging from a few years for early successional biocrusts (cyanobacteria) to 10–30 years for later successional biocrusts (lichens and mosses) (Kidron et al., 2020; Phillips et al., 2022). However, even though, initial soil colonization by biocrusts can be greatly retarded or impeded in unstable soils, subjected to high erosion. Soil stabilization and biocrust recovery can be prompted by active restoration through soil inoculation with biocrust organisms. As pioneer colonizers of barren soils and promoters of biocrust succession, cyanobacteria are one of the most interesting organisms to be used as inoculants. Cyanobacteria are able to fix the atmospheric carbon and nitrogen, and stabilize soils surfaces (Mager and Thomas, 2011), improving the habitat for later-successional biocrust organisms such as lichens and mosses (Lázaro et al., 2008; Zhang et al., 2018). Eventually, these more favorable soil conditions will facilitate the establishment and growth of plant species. Recent studies have shown positive effects of soil cyanobacteria inoculation in the reduction of soil erosion and improvement of soil properties (Park et al., 2017; Sadeghi et al., 2017; Chamizo et al., 2018; Muñoz-Rojas et al., 2018; Román et al., 2018; Antoninka et al., 2020; Kheirfam et al., 2020). However, there are no previous studies that evaluate the synergic effects of soil inoculation with cyanobacteria combined with a spatial distribution of native vascular vegetation based on the resource use balance. The positive runoff-runon feedback processes between biocrusts and vegetation is one of the most promising nature-based solutions for dryland restoration (Cortina et al., 2011; Rodríguez-Caballero et al., 2019). An adequate design of biocrusts-vegetation spatial distribution can be key for plants to optimize water availability in these environments, where 90% of rainfall events are less than 10 mm (Martínez-Mena et al., 1998; Puigdefábregas, 2005), thus contributing to vegetation and ecosystem recovery. This would allow designing in advance a restoration action that helps to overcome the difficulties faced during field application for both the cyanobacteria inoculum (Román et al., 2021a) and plants, such as the inoculum loss and the enhancement of erosion rates and further reduction of plant cover (Cantón et al., 2021). For this purpose, the influence of biocrust should be included in runoff and erosion simulation models (see Rodríguez-Caballero et al., 2015) to simulate the hydro-geomorphological response of the target area and identify the best design based on the most efficient use of resources.
The main goal of this work is to present a new methodology to support future dryland restoration activities by selecting the most appropriate spatial configuration of plants and biocrusts that maximizes water and nutrient capture by plants, while reducing erosion. To do this, we will first evaluate different restoration scenarios, through spatially distributed modeling, to identify the most optimal spatial configuration of plants that maximizes runoff-water capture by vegetation. Second, we will compare results obtained in the proposed scenario with another scenario including also active biocrust restoration by means of cyanobacteria inoculation, to evaluate its effect on soil erosion.
Materials and Methods
Study Area
The study was carried out in a limestone rock quarry, located southeast of the Sierra de Gádor, Almería, SE Spain (36° 55′ 20″ N; 2° 30′ 29″ W; Figure 1). The area is 370 m.a.s.l. and has a semi-arid thermo-Mediterranean climate, with an average temperature of 17.6°C and an average annual rainfall of 242 mm. Prior to mining, soils were classified as Epileptic and Endoleptic Leptosols developed over substrates of calcareous sandstones and calcitic-gypsiferous mudstones (marls). The substrate covering the site at present has a loam texture (31.20 ± 4.65% sand, 43.10 ± 2.34% silt and 25.70 ± 2.80% clay) and its fertility is very low with values of total organic carbon and total nitrogen of 0.24 ± 0.21 g kg–1 and 0.17 ± 0.09 g kg–1, respectively (Luna et al., 2016; Román et al., 2018).
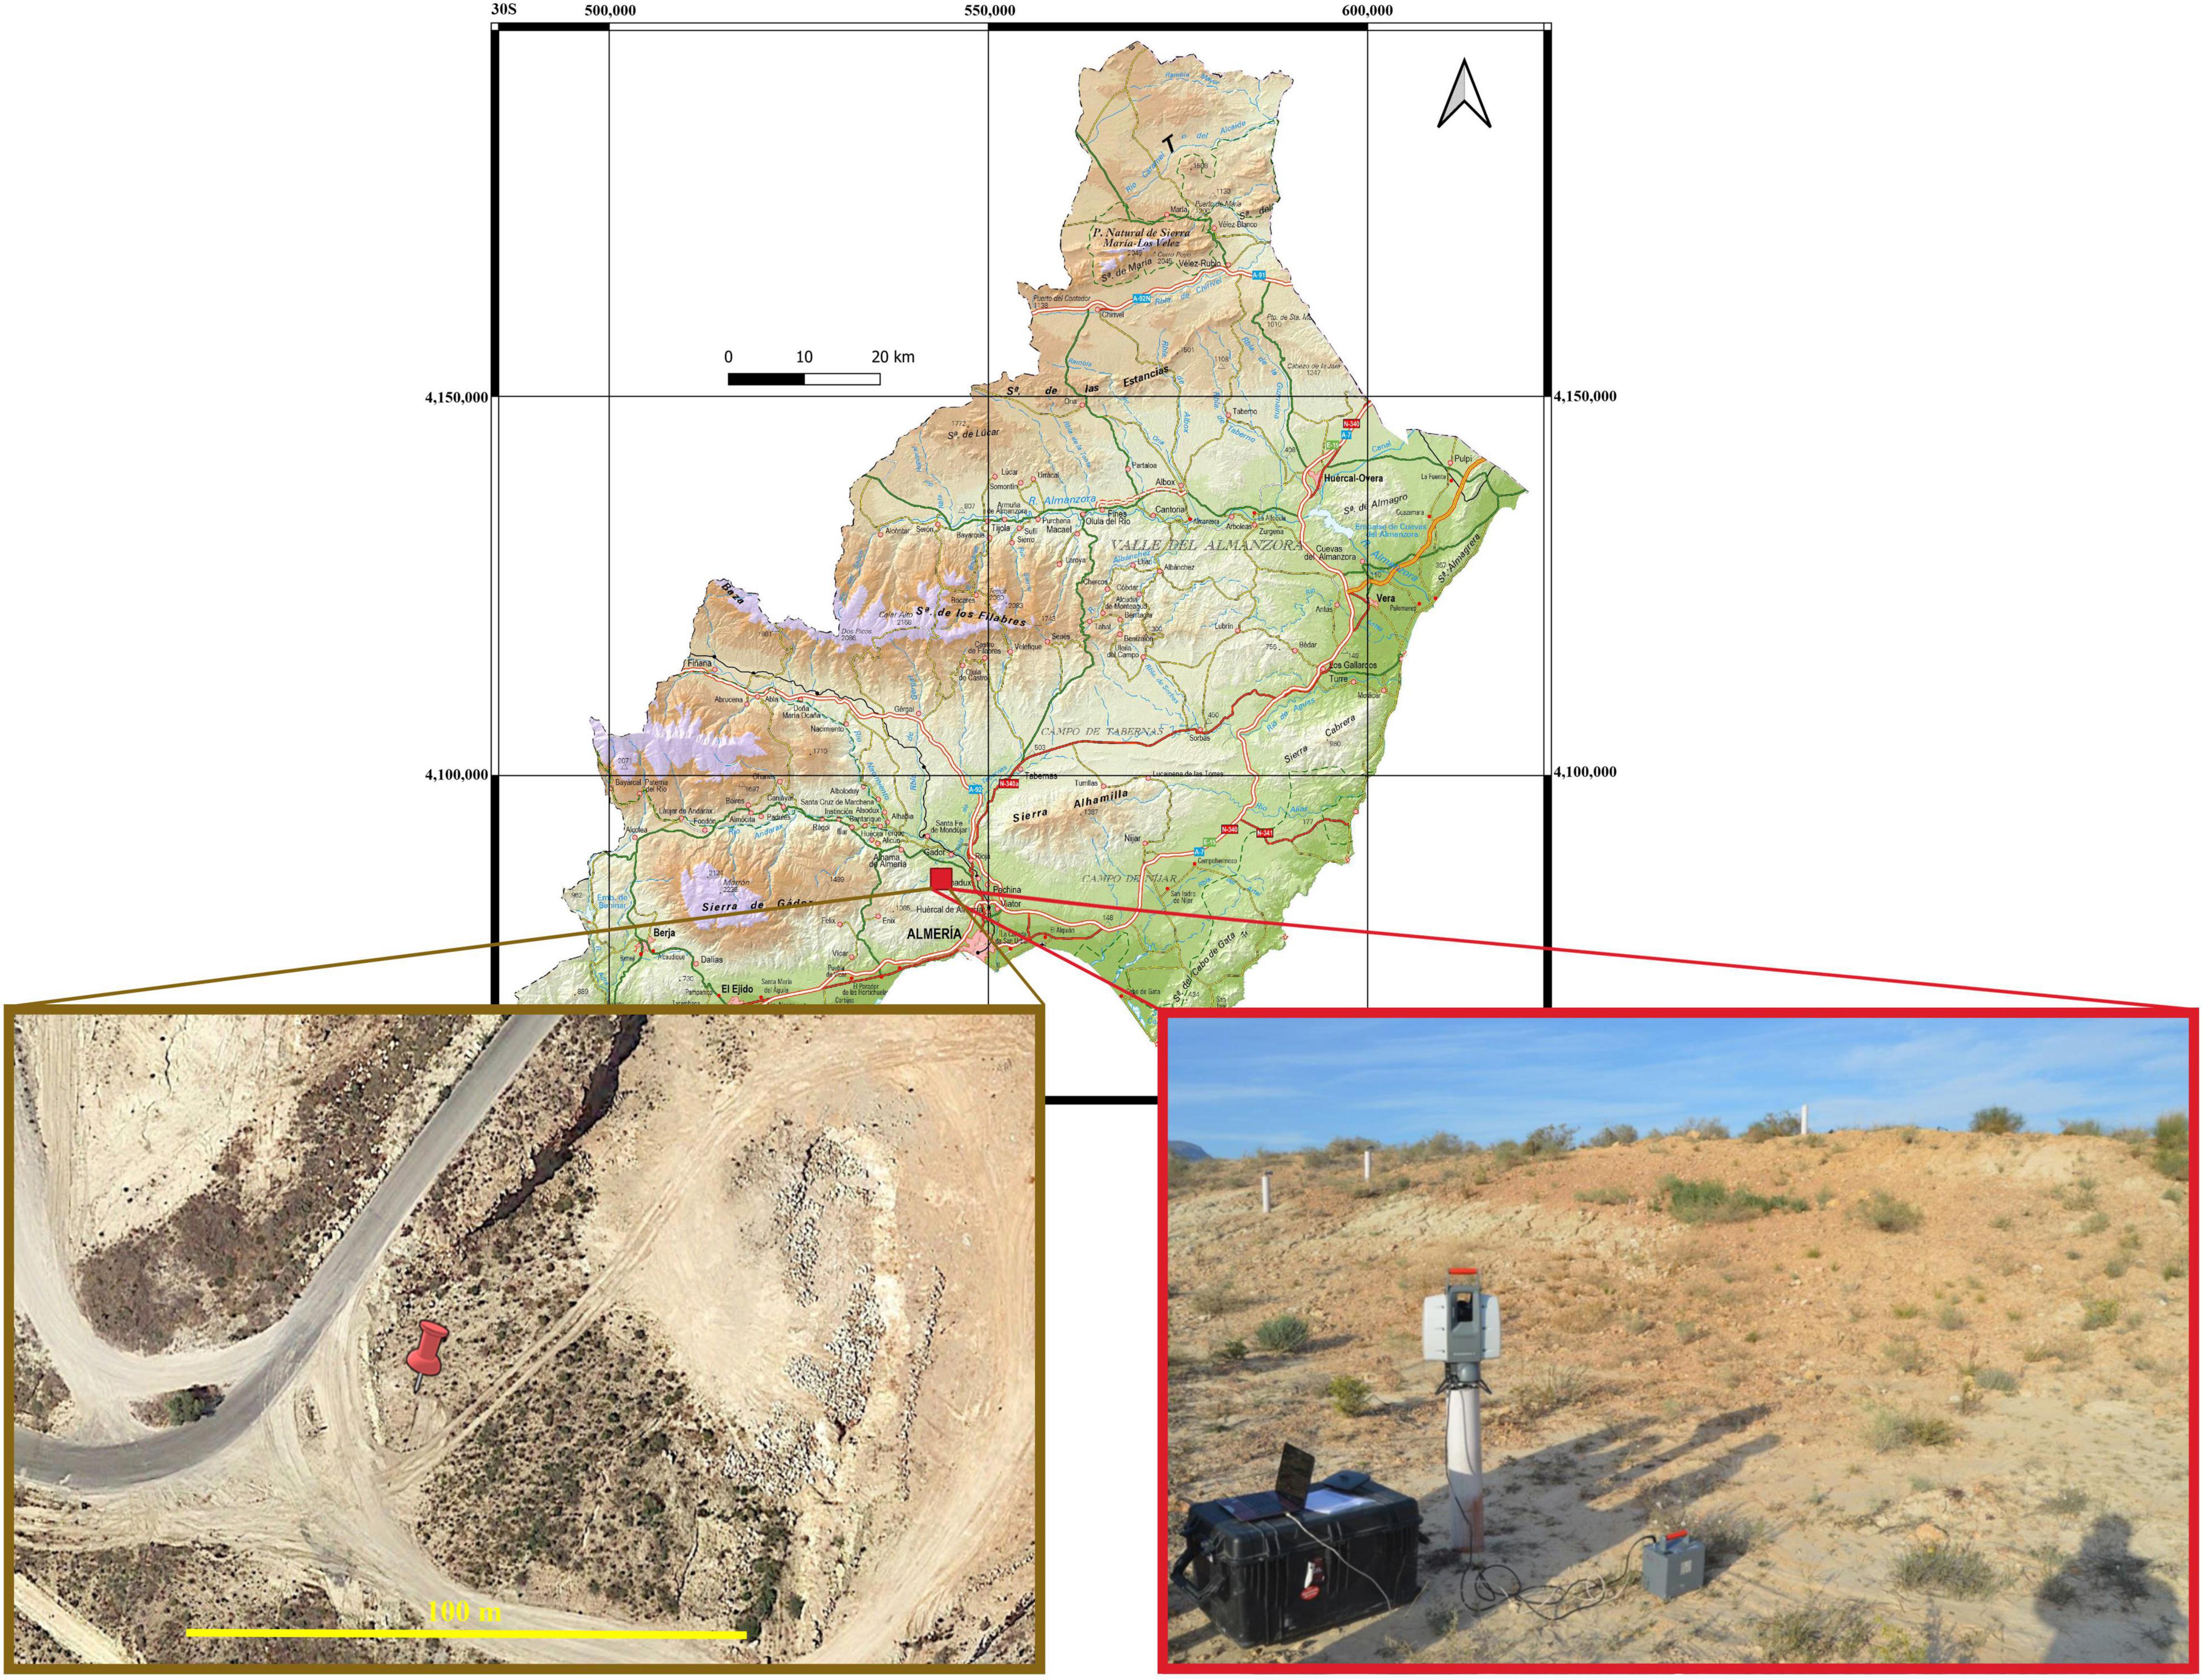
Figure 1. Location of the study area and detailed image of the experimental plot.
The potential vegetation (dominant in nearby areas) is an alpha grass steppe, mainly dominated by Macrochloa tenacissima L. (Kunth), together with other small shrubs and herbaceous species, among which stand out Anthyllis cytisoides L., Anthyllis terniflora (Lag) Pau, Rhamnus lycioides L., Thymus hyemalis Lange. Seasonally, a great diversity of annual plants can be also found [Avena barbata Pott, Rhagadiolus stellatus (L.) Gaertn, Linum strictum L., Moricandia foetida Bourg. Ex Coss, among others], reaching a coverage of 5–10%. In the open spaces between the vegetation, biocrusts dominated by cyanobacteria and/or lichens are very frequent (Luna et al., 2017).
Slope Selection and Topography Characterization
For this work, we selected a disturbed south-facing slope of approximately 375 m2 (25 × 15 m), devoid of soil, biocrust and vegetation (hereafter “experimental hillslope”; Figure 1) because of recent extraction activities. The experimental hillslope was prepared for restoration by smoothing the slope with the help of a backhoe. At the beginning of the experiment (July 2014), we scanned the experimental hillslope with a terrestrial-laser scanner (TLS) LeicaScanStation-2 (LeicaGeosystems). Two scans were carried out to minimize the occlusions produced by the soil surface microtopography and both point clouds were joined by using 4 reference targets common to the two scans. Once the definitive point cloud was obtained, it was used to build a digital terrain model (DTM) at 5 cm spatial resolution. To analyze the erosive response of the hillslope in absence of active restoration activities, this process was repeated 18 months after the establishment of the plot (December 2015). This information was used for comparison and model calibration (see section “Model Calibration and Simulation Scheme”). As no active restoration was performed in the period between plot preparation and the end of the experiment, only some spontaneous vegetation grew during this period. To remove them from the DTM, the point cloud obtained in December 2015 was manually classified into vegetation and bare soil points. Finally, a new DTM was built using only soil points. Total volume of eroded soil during the study period was calculated as the difference between the initial and the final DTMs.
Model Selection and Input Variables
Model Selection
For identifying the spatial configuration of surface components most efficient in reducing water and nutrient losses and erosion, we applied the spatially distributed runoff and erosion model LISEM (Limburg Soil Erosion Model). This is one of the most widely used and accepted physically distributed models, and its principles are well described in the literature (Jetten and De Roo, 2001; Baartman et al., 2011; Sanchez-Moreno et al., 2013). Moreover, it has been already parameterized to simulate the effects of biocrust, calibrated and validated in a close area densely covered by them (see Rodríguez-Caballero et al., 2015). The LISEM calculates different infiltration rates for each surface component within the pixel (e.g., bare soil, biocrusts and vegetation) and combines the water available for runoff into one water layer that is routed with a kinematic wave routine.
Thus, the model allows us to obtain maps of erosion, infiltration, and runoff at 1 s time resolution within the rainy event that we are simulating, with a spatial resolution of 5 cm, according to the resolution of the experimental hillslope DTM.
Input Variables
For running the LISEM model, detailed, and spatially distributed information of rainfall, topography, surface components (vegetation, biocrusts and bare soil), infiltration and soil surface properties is needed. Next sections describe how this information was obtained for the different model configurations used in this study.
Rainfall Data
Since July 2014, the total precipitation over the study area has been recorded every 5 min, with a rain gauge located near the study area. We identified individual rainfall events using a minimum period without rainfall of 6 h (Rodríguez-Caballero et al., 2014). Rainfall was assumed to be uniform along the experimental hillslope.
Vegetation Related Variables
For model calibration, maps of coverage and height of the spontaneous vegetation that grew during the 18 months were obtained from the TLS point cloud. As already described in section “Slope Selection and Topography Characterization,” the point cloud acquired at the end of the experiment was manually classified into soil surface and vegetation, using the images acquired through the TLS integrated camera. Then the vegetation coverage in each pixel of the DTM was calculated as the ratio between vegetation-classified points and the total number of points per pixel. The resting fraction of the pixel was considered as bare soil.
Once the vegetation cover was known, it was used to estimate the leaf area index (LAI), which represents the area of leaves per unit surface area of land, and is used to calculate the water storage capacity of the vegetation cover in the model. For this, we use the equation described by Ramírez et al. (2007) (Equation 1):
where LAI represents the leaf area index (m2 m–2), 1.99 is the leaf area of M. tenacissima per unit of covered surface (m) and C vegetation cover (number of pixels).
Vegetation height was calculated for each pixel as the maximum difference between all the points of the original point cloud, contained within a pixel.
Infiltration Related Variables
The Green and Ampt (1911) equation was chosen to simulate infiltration, as it has been widely used with successful results in semi-arid environments (Boer and Puigdefábregas, 2005; Baartman et al., 2011, among others) and it has been shown to provide good results when applied in scenarios with biocrust (Rodríguez-Caballero et al., 2015). The required information is: (i) Map of saturated hydraulic conductivity (Ksat), (ii) map of maximum soil water content (θs), (iii) map of soil water content at the beginning of the simulation (θi), (iv) map of water suction at the wetting front (PSI) and (v) map of the soil depth or thickness. As soil is homogenous all over the plot, dominant surface component was considered the unique factor influencing soil properties. Ksat of bare soil (where a physical soil crust is developed), soil dominated by biocrusts and vegetation were obtained from rainfall simulation experiments conducted in the area and in a nearby area with the same parent material, soil class, soil texture and hydrological properties (Chamizo et al., 2012a,b; Rodríguez-Caballero et al., 2015; Luna et al., 2016). Maximum soil water content was calculated as the total volume of pores of the soil and varies between open and vegetated areas. Initial soil water content varied from one event to another and was fixed based on humidity sensors installed in a set of experimental hillslopes located less than 500 m from the experimental hillslope, whereas PSI was used as calibration parameter (see section “Model Calibration and Simulation Scheme”). Table 1 contains the values of the hydrological variables used for model parameterization.
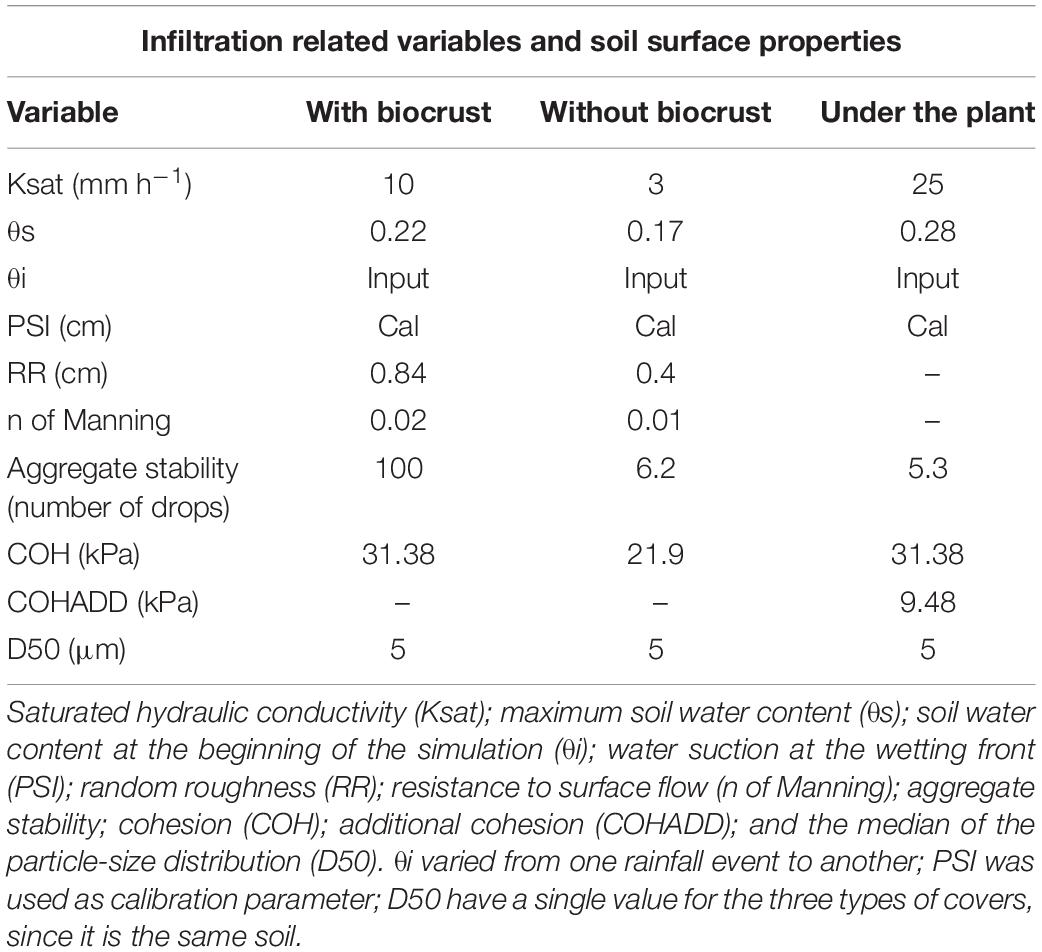
Table 1. Values assigned to the infiltration related variables and soil surface properties involved in the LISEM model.
Soil Surface Properties
The soil surface properties maps used to simulate erosion during a rain event were the random roughness (RR), the resistance to surface flow (n of Manning), aggregate stability, soil surface cohesion (COH) and the median of the particle-size distribution (D50). Each property was measured separately for the different surface components in the field (bare soil, vegetation and soil inoculated with biocrust). For the soil inoculation treatment, we used soils from this area that were already inoculated in previous experiments with a consortium of native N-fixing cyanobacteria species isolated from biocrusts of different semiarid ecosystems in the Almería province (Román et al., 2018, 2021b; Roncero-Ramos et al., 2019a).
The random roughness was obtained as the standard deviation of the soil surface heights (Equation 2) using a point cloud acquired by the TLS with 5 mm spatial resolution (see Rodríguez-Caballero et al., 2012, 2015 for more details).
where RR is the random roughness, N is the number of points, z is the height of each point after removing the effect of the slope, and μ is the average height after removing the effect of the slope.
n of Manning was calculated from the random roughness, according to Rahimy (2012) equation (Equation 3):
where n is the n of Manning and RR is the random roughness.
Aggregates stability was determined on 20 random samples of aggregates (4–5 mm size) of under plant soil, bare open soil and open soil covered by inoculated biocrust aggregates (in total 60 soil aggregates) using the drop test (Imeson and Vis, 1984). Soil surface cohesion was measured with a torvane in the same places where the bare soil and inoculated biocrusts aggregates were sampled. Equation 4 calculates the additional cohesion due to root effects, which torvane test does not consider.
where COHADD is the additional cohesion produced by the root effect (kPa), C is the vegetation cover (pixel area covered by vegetation), COHunder plant is the cohesion obtained under plant (kPa) and COHbare is the cohesion in bare soil (kPa).
Table 1 contains the soil properties values for the three different types of covers.
The final maps for each scenario and configuration (explained below) were calculated as the value of each property and component multiplied by the pixel fraction covered by the respective component (see details about presence of the different surface components in the different simulation schemes below). For the scenario considering active biocrust restoration, the soil profile was divided into two layers: A topsoil layer of 3 cm thick, which represents the biocrust, and a second layer (underlying 3–30 cm soil layer) with the same properties as those measured in bare soil. This is because, according to Chamizo et al. (2012a) and Rodríguez-Caballero et al. (2015), the effect of biocrust in modifying soil properties is significant for the upper soil layer and fades with depth.
Model Calibration and Simulation Scheme
When working with runoff and erosion simulation models, it is necessary to perform a calibration of the model, to adjust the great temporal and spatial variability that characterizes the hydrological and erosive properties of the soil (Jetten et al., 1999). To do this, we used the total erosion measured during the study period (18 months, see section “Slope Selection and Topography Characterization”), calculated as the difference between the DEM obtained at the beginning of the experiment and the one obtained at the end of the experiment, assuming an apparent soil density of 1.3 g cm–3 (Luna Ramos and Solé Benet, 2015). Once the real erosion was determined, we performed individual simulations for each of the identified 18 rainfall events that yielded runoff during the study period, adjusting the values of PSI to 90 and 20 cm for events occurring in dry conditions and on periods of high antecedent precipitation (wet conditions), according to Rodríguez-Caballero et al. (2015). Total erosion obtained with these simulations was validated using based on the total erosion measured of the entire in the experimental plot after the 18 rain events that occurred in the study area during the 18 months of the study period.
The calibrated model was then used to simulate the effects on runoff and erosion of different spatial configurations of the vegetation as well as the effect of the biocrust inoculation in open spaces among plants. Thus, the best result, i.e., the scenario yielding the lowest runoff, sediments and nutrients losses would be the most appropriate to be implemented in future restorations on the same study area or other areas with similar topographic, climate and soil characteristics. For the simulations, three different spatial configurations of vegetation were tested (Table 2), all of them focused on maximizing the capture of runoff water, sediments and nutrients by vegetation: (1) Increasing vegetation cover as moving to the lowest section of the experimental hillslope, to collect upstream runoff (Scenarios 1 and 2, see Figures 2A,B); (2) staggered pattern (García-Ávalos et al., 2018), to reduce the slope length and minimize erosive processes (Scenarios 3 and 4, see Figures 2C,D); and (3) vegetation located in the areas of water flow accumulation and storage (Scenarios 5 and 6, see Figures 2E,F). To identify the mentioned areas, we calculated the topographic Wetness Index described by Beven and Kirkby (1979), as a proxy of water accumulation (Equation 5):
where As is the specific contributing area (in m2 m–1), β is the slope expressed in radians and tn is tangent.
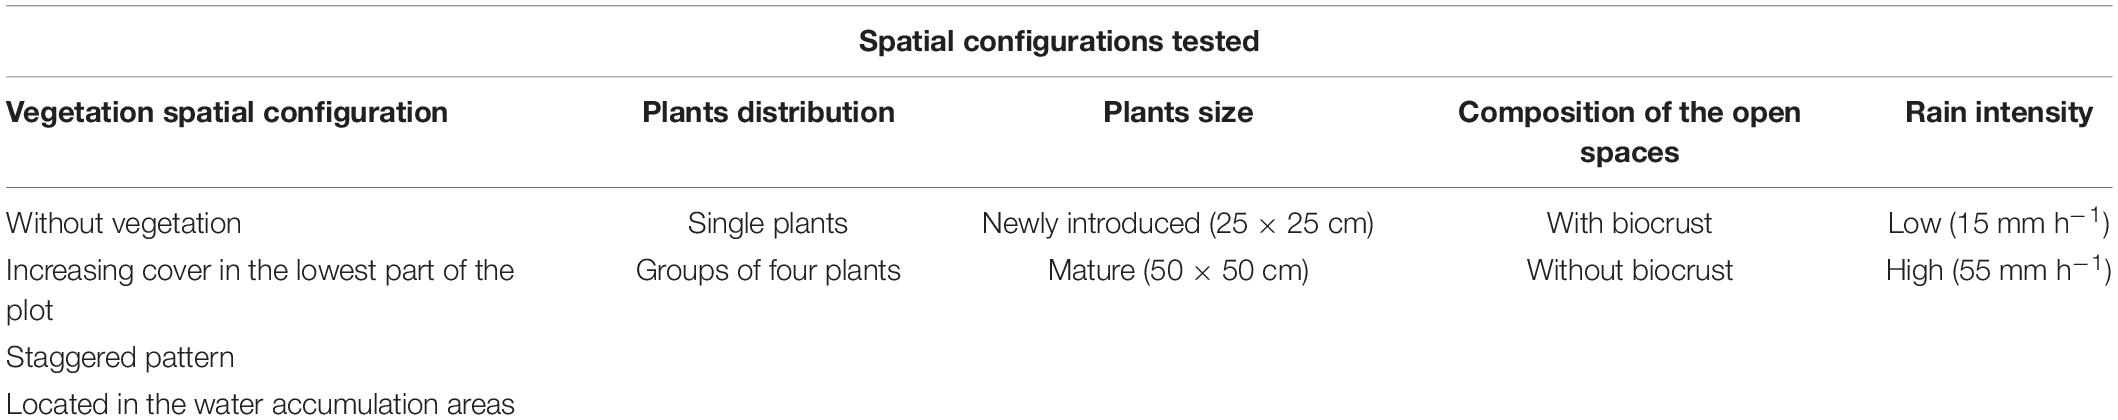
Table 2. Different spatial configurations simulated with the LISEM model.
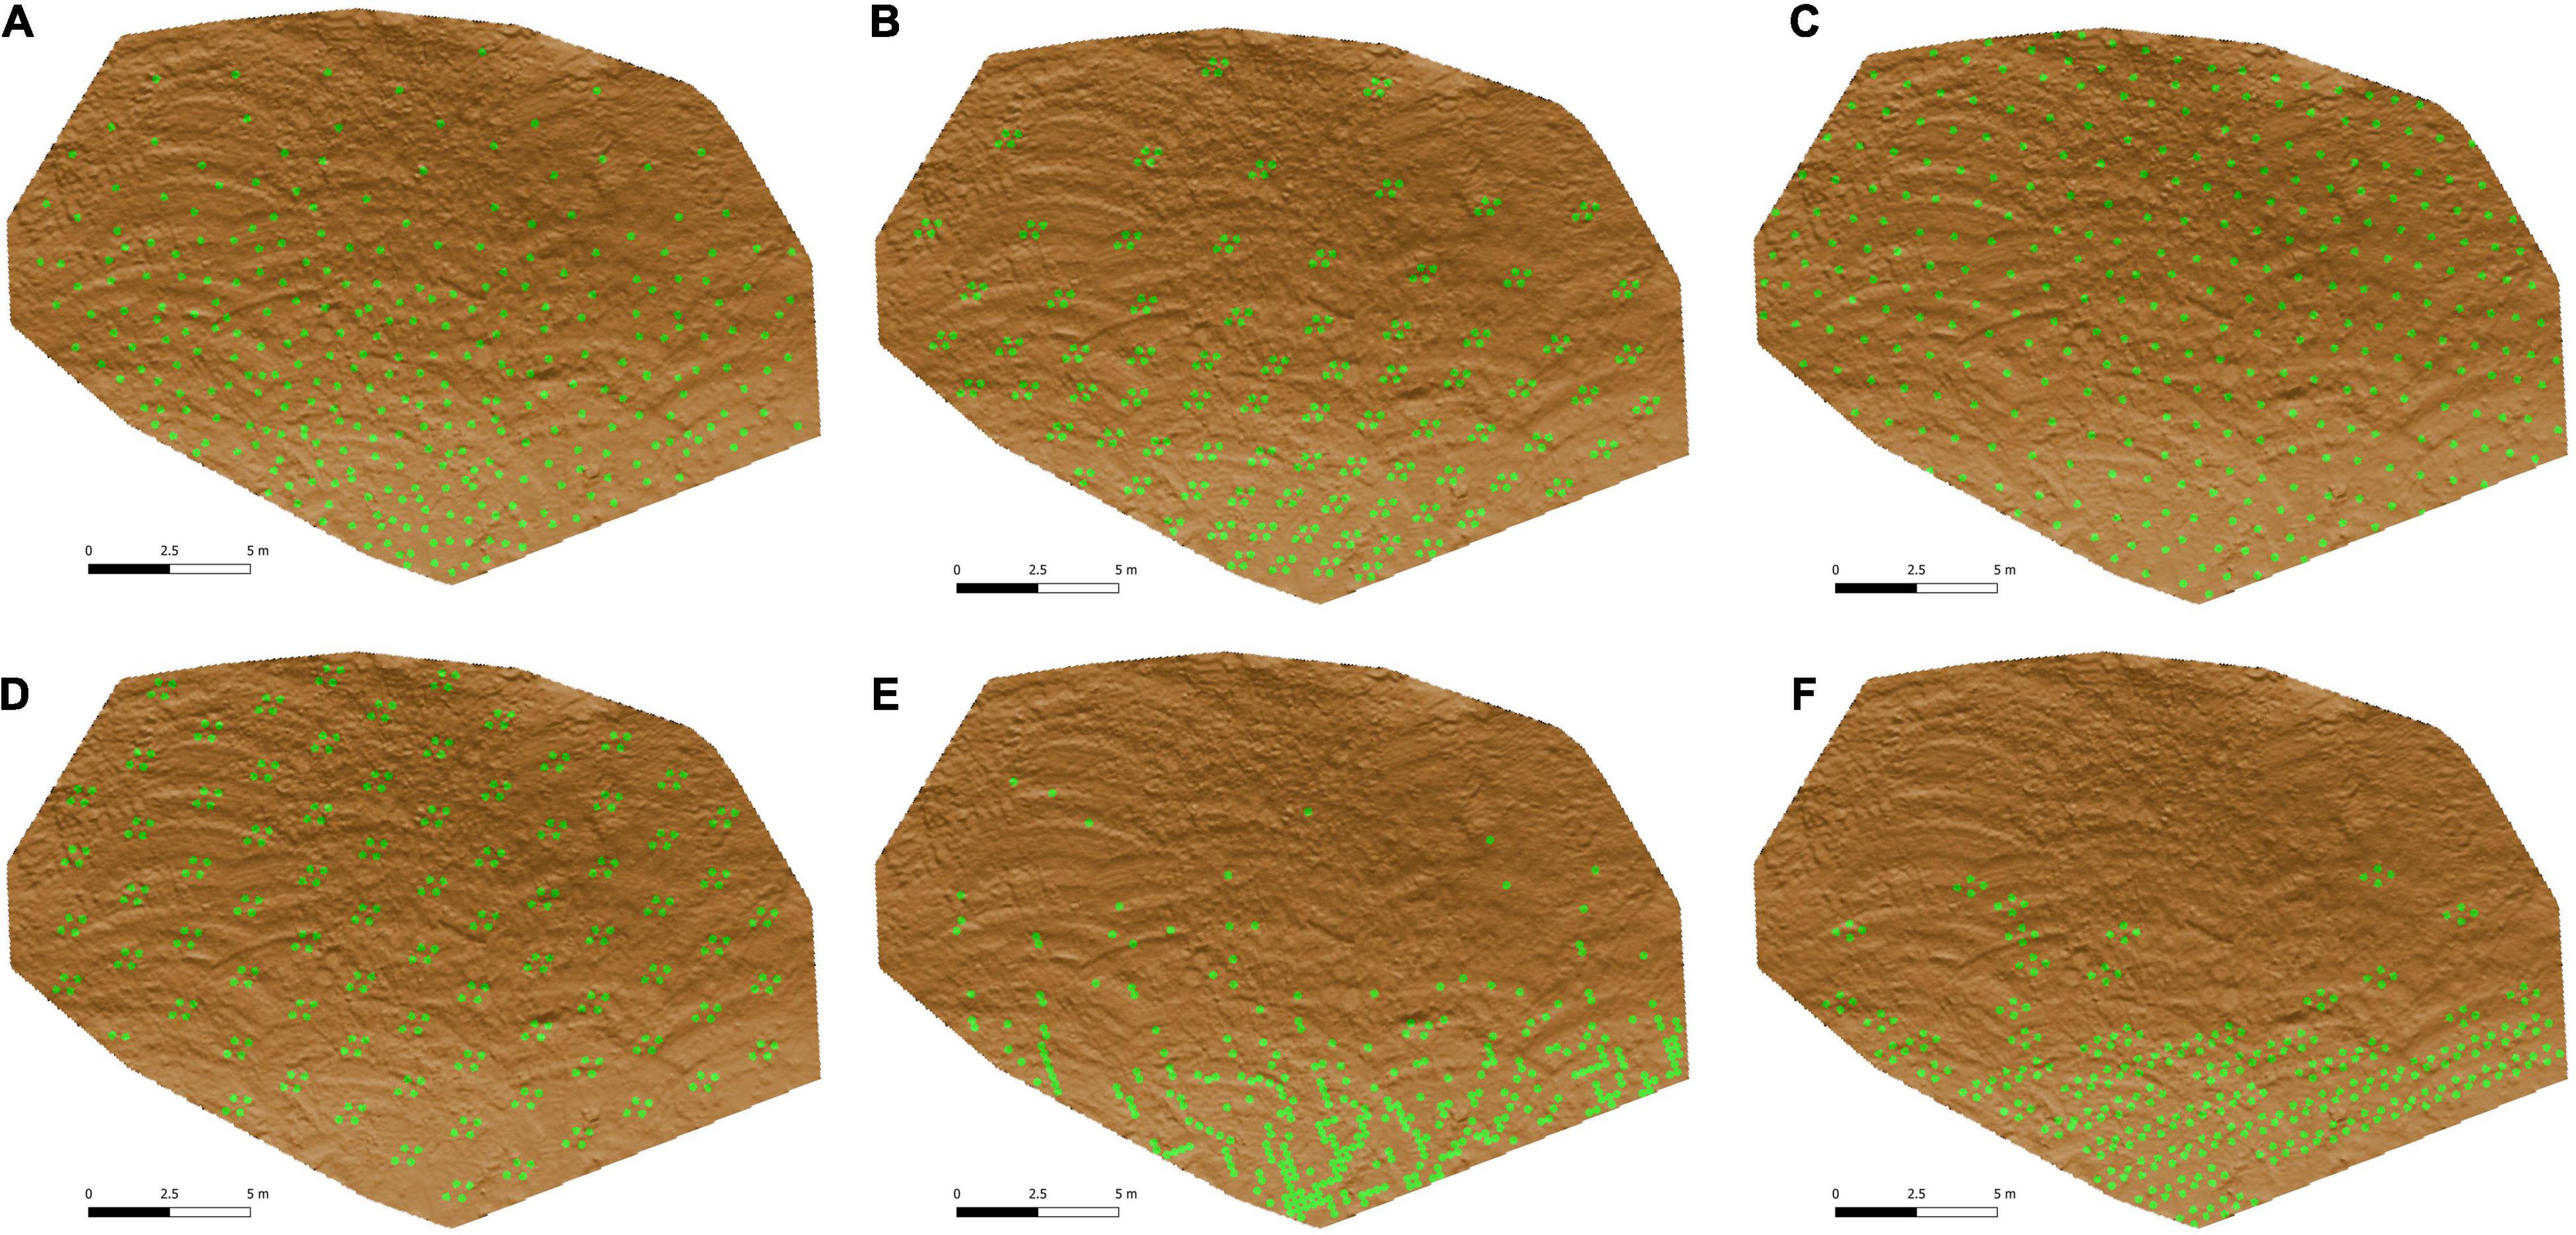
Figure 2. Vegetation configurations selected for the different simulations (25 × 25 cm plants). (A) Scenario 1, single plants in the lower part of the slope; (B) scenario 2, islands of plants in the lower part of the slope; (C) scenario 3, single plants in staggered pattern; (D) scenario 4, islands of plants in staggered pattern; (E) scenario 5, single plants in the areas with higher WI; and (F) scenario 6, islands of plants in the areas with higher WI.
WI has been demonstrated to be useful for predicting the spatial distribution of vascular plants in a close similar area (Cantón et al., 2004; Rodríguez-Caballero et al., 2019).
Each of the above-mentioned spatial configurations was simulated with single plants (scenarios 1, 3, and 5) and groups of four plants forming fertility islands, which occupied an area of 1 × 0.75 m (scenarios 2, 4, and 6). Furthermore, each configuration was simulated with two plant sizes (25 × 25 cm and 50 × 50 cm), reproducing the effect of newly introduced vegetation and mature vegetation after several years since restoration. Finally, all simulations were repeated in two ways: (i) No active biocrust restoration and thus, considering the interplant soil as bare soil, and (ii) active biocrust restoration by cyanobacteria inoculation. In this second scenario, a complete coverage of induced cyanobacterial biocrust (incipient light cyanobacteria biocrust) was considered in the open spaces between plants. Cyanobacteria inoculation has been tested as they are especially interesting from the point of view of restoration for several reasons (Cantón et al., 2020, 2021): (i) They are the pioneer organisms favoring the establishment of later-successional biocrust species, (ii) they can tolerate high temperatures and water and saline stress (Sand-Jensen and Jespersen, 2011); (iii) additionally, they can be isolated from soils and species with key functional traits can be selected (Roncero-Ramos et al., 2019a); (iv) cyanobacteria can be cultivated ex situ, at low cost, to obtain the needed biomass for inoculation on the soil (Roncero-Ramos et al., 2019b), to face large scale restoration projects; (v) their important role in the edaphogenesis (Rossi et al., 2017; Roncero-Ramos et al., 2019c).
To analyze the effect of the spatial distribution of the vegetation and the inoculation with cyanobacteria against different types of rainfall, the model was applied to a low intensity (15 mm h–1 for 30 min) and a high intensity rain event (55 mm h–1 for 30 min), which corresponds to rainfall intensity with a return period of 5 years (Chamizo et al., 2012b) and was large enough to ensure significant runoff and sediment yield rates in a similar and very close area (Cantón et al., 2001). Table 2 resumes all the spatial configurations simulated with the LISEM model.
Results
Limburg Soil Erosion Model Calibration and Validation
During the study period used for model calibration, 48 rain events were registered which resulted in a total amount of 220.41 mm. Maximum rainfall intensity ranged from 2.4 to 81.62 mm h–1 (Table 3). Altogether, these rains led to a total soil loss of 2.81 tons.
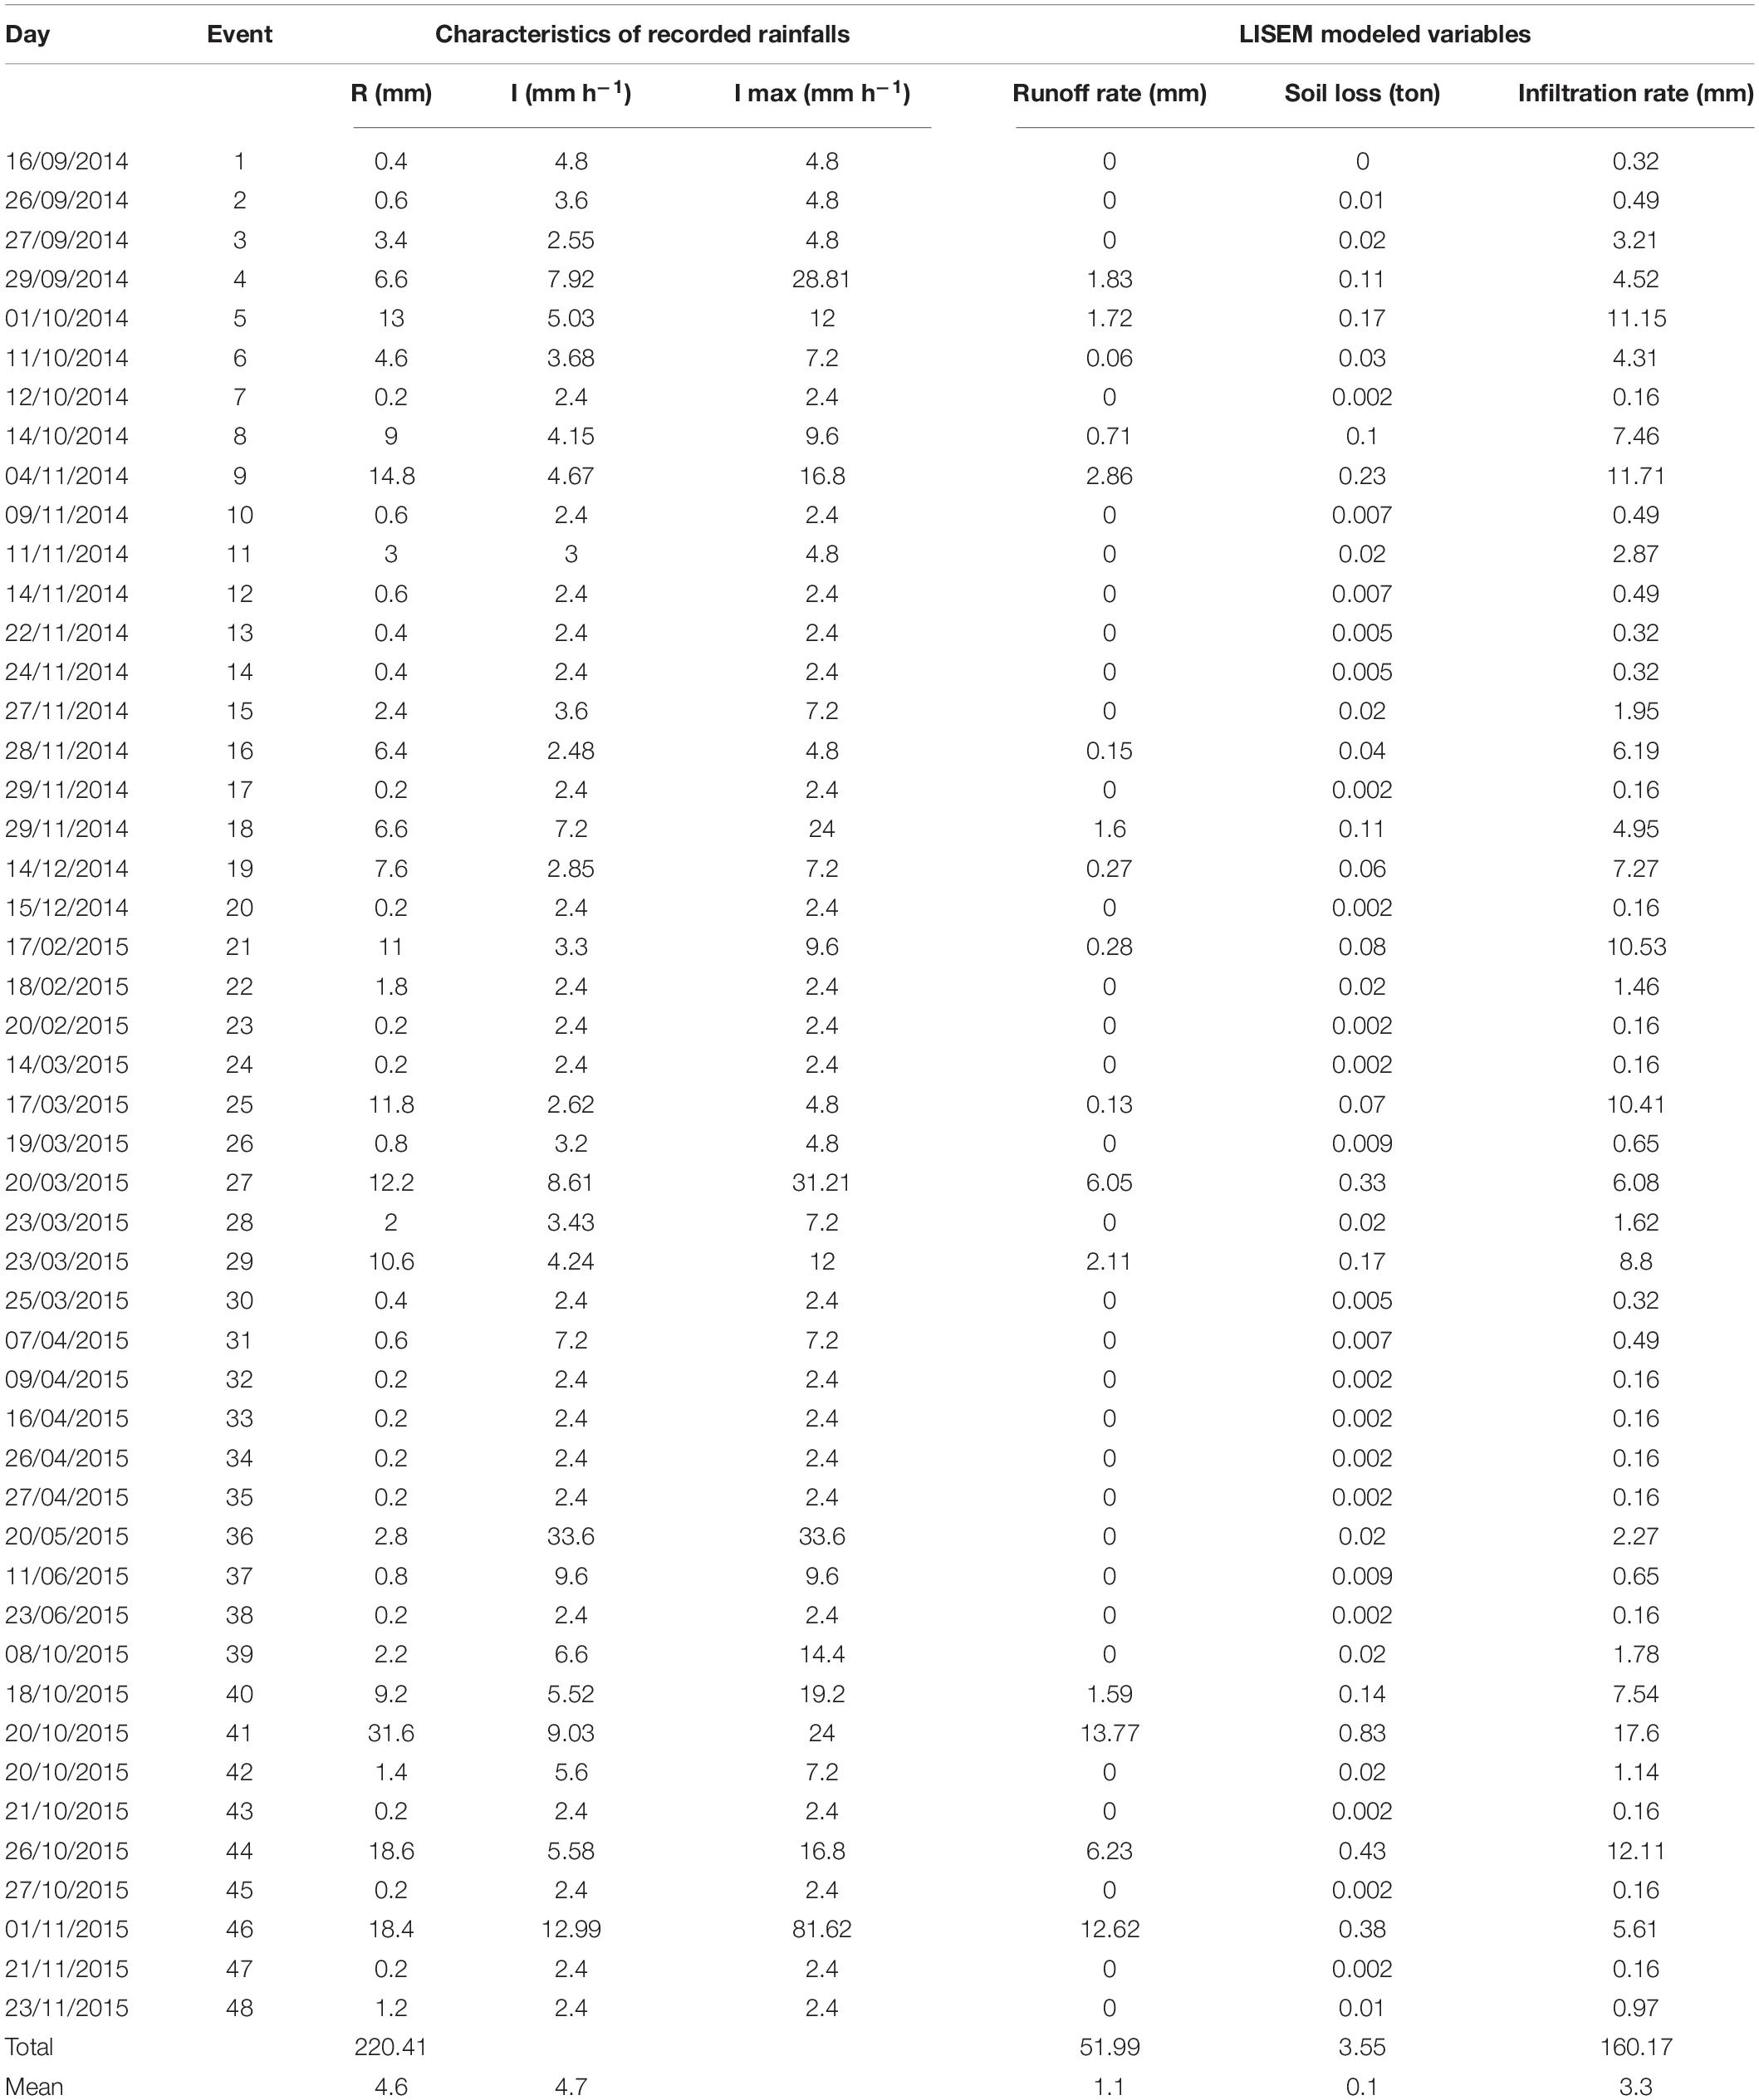
Table 3. Description of rainfall events showing the values of total rainfall volume (R), mean rainfall intensity (I), maximum rainfall intensity (I max) and runoff rate, infiltration rate and total erosion obtained from runoff simulations.
Only rainfall events with more than 3.6 mm of total rainfall produced runoff. The application of the LISEM model to these events led to total runoff and infiltration rate estimates of 51.99 mm (with a mean of 1.1 mm per event) and 160.17 mm, respectively. The modeled soil loss fit well with the measured data and showed a total value of 3.55 tons (Table 3). Compared with the real erosion measured with the terrestrial laser scanner, this value represents an RMSE of 17.79%. When each event was analyzed separately, we found a great variability in runoff and erosion among the different events. The events that registered the highest runoff and erosion values were the ones with the highest intensity and volume of precipitation (Table 3).
Figure 3 shows the spatial distribution of total runoff, infiltration and water erosion predicted by the LISEM model for the study period on the non-restored experimental hillslope. As observed, runoff was lower (Figure 3A) and infiltration higher (Figure 3B) in areas where spontaneous vegetation grew than on bare areas. Erosion was mainly concentrated in bare areas where preferential runoff flows were observed (Figure 3C).
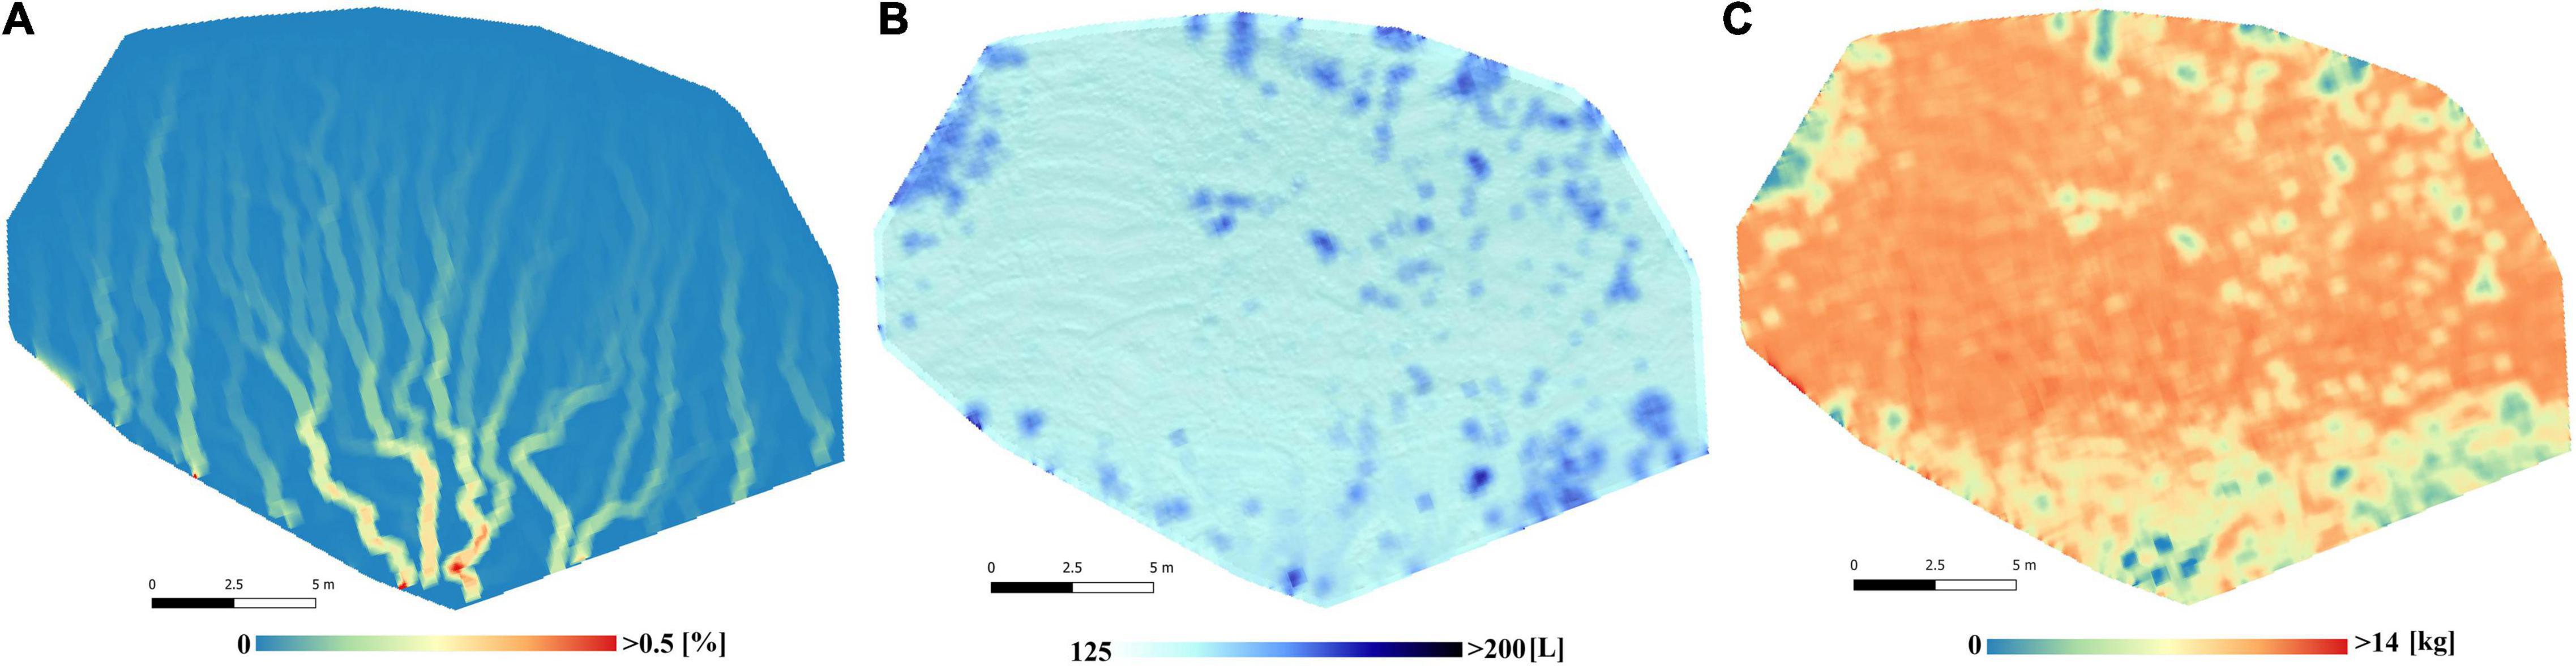
Figure 3. Cumulative values of runoff coefficient (%) (A), total infiltration (L) (B) and total soil loss (kg) (C) obtained by the LISEM simulations during the 18 rainfall events used for model calibration and validation.
Vegetation Spatial Configuration Effects on Runoff and Erosion
The runoff and erosion response of the experimental hillslope predicted by the LISEM considering different spatial configurations (scenarios) of newly introduced vegetation under different rainfall events (low and high intensity) are shown in Table 4. These simulations reveal that modification of soil surface properties and infiltration rates by the reintroduction of vegetation on the degraded hillslope significantly reduced runoff and erosion with respect to the scenario without vegetation, and this effect increased as rainfall intensity did (Table 4). Total runoff coefficient during the high intensity simulated event on the unrestored slope was 93%, with a total soil loss of 253 kg (Table 4) and a total infiltration rate of 3.88 mm (Table 5). The introduction of vegetation with a density of one small plant (25 × 25 cm) per m2 reduced runoff coefficient to 91% and erosion to 241—-243 kg (Table 4). In the different configurations tested, the vegetation infiltration rate ranged from 21.36 to 23.46 mm (Table 5). Although all the simulated configurations led to similar runoff and erosion values, the spatial distribution that promoted a greater increase in infiltration and a greater reduction in runoff and erosion was the scenario 5 (plants located in the areas with high values of WI; Figure 2E), which showed a total runoff coefficient of 91.14% and a total soil loss of 241 kg (Table 4) with and average infiltration rate of 4.87 mm (23.46 mm in vegetated patches; Table 5). The configuration with plants in the lower section of the slope (scenario 1 in Figure 2), conversely, provided the worst results with a runoff coefficient of 91.45%, 243 kg of soil loss (Table 4) and a slight reduction of water infiltration in vegetated patches (Table 5).
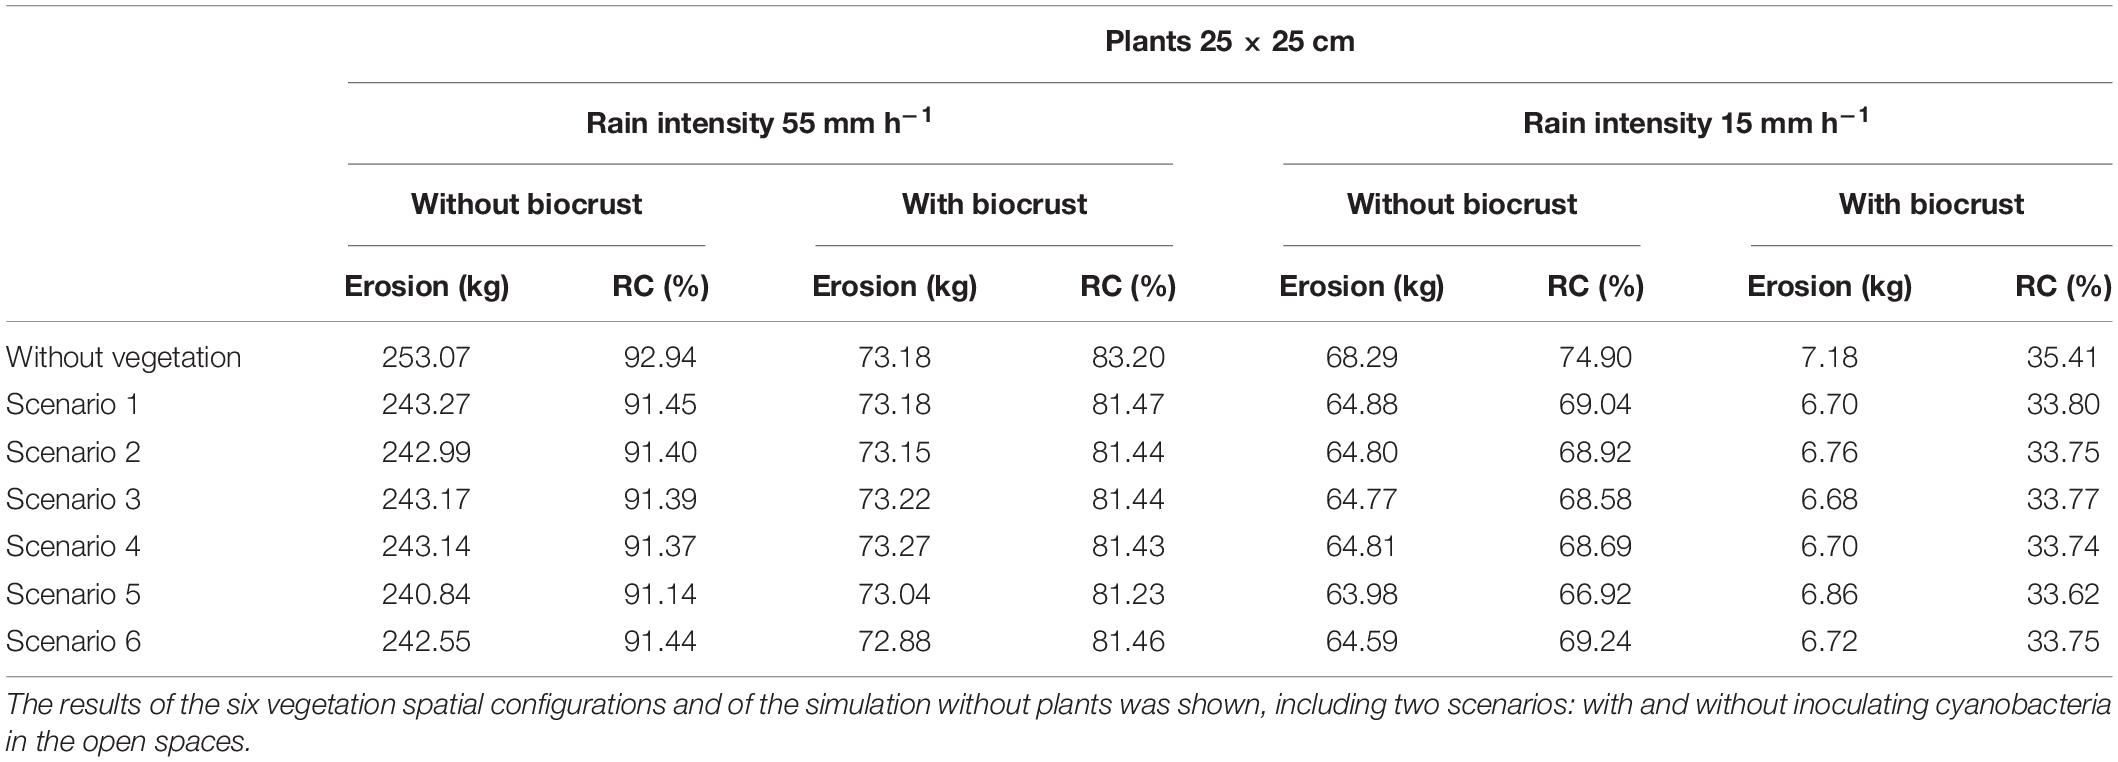
Table 4. Soil loss (kg) and runoff coefficient (%) obtained for the experimental plot after simulating low and high intensity rainfall events, assuming the presence of underdeveloped plants (25 × 25 cm), which represent the first stages after restoration.
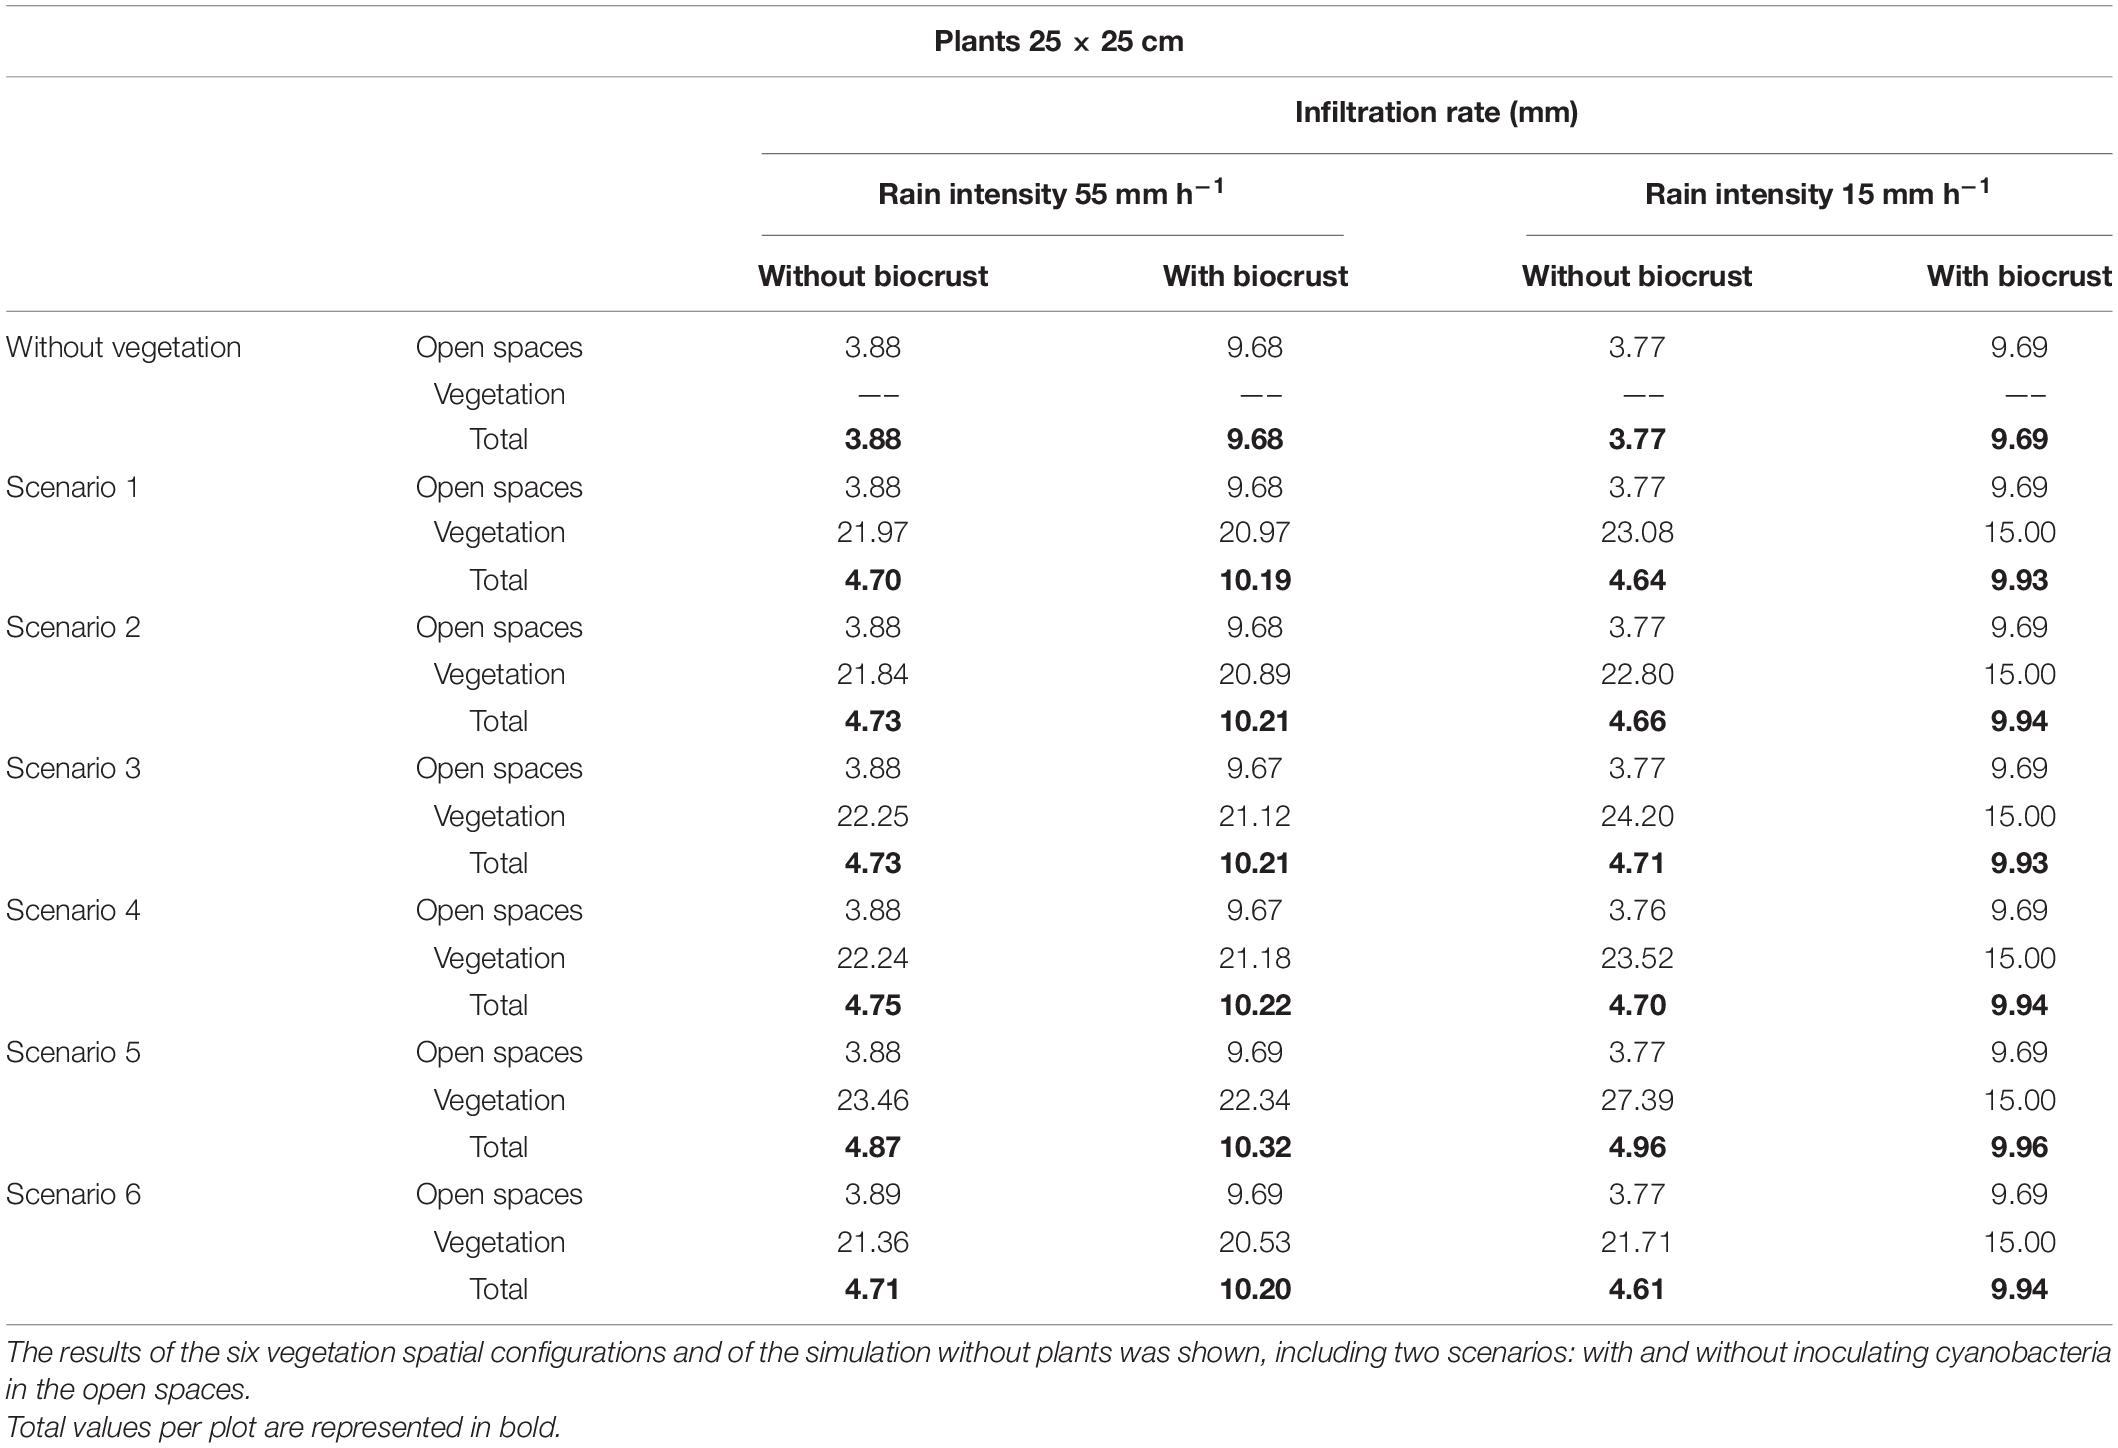
Table 5. Infiltration rates (mm) obtained in the open spaces and in the vegetation patches after simulating low and high intensity rainfall events, assuming the presence of underdeveloped plants (25 × 25 cm), which represent the first stages after restoration.
As expected, during the simulated low-intensity rain, runoff and erosion were lower than the observed during the high intensity event (Table 4). The effect of vegetation was also lower. During the low intensity rain, all scenarios with introduced vegetation showed higher infiltration rates than the unrestored scenario devoid of vegetation (4.61–4.96 mm in the restored hillslope vs. 3.77 mm in the unrestored slope; Table 5). Furthermore, plants presented higher infiltration rates compared to bare soil for all the tested scenarios (21.71–27.39 vs. 3.77 mm of bare soil; Table 5), showing a water infiltration volume between 166 and 228 L. The model also predicted 64–65 kg of soil loss by water erosion in all the vegetation spatial configurations during the low-intensity rain vs. 68 kg of soil loss in the scenario without plants (Table 4). During the low intensity rain, the best spatial configuration was also the scenario 5 (Figure 2E), which showed a runoff coefficient of 67%, a total erosion rate of 63.98 kg (Table 4) and a mean infiltration rate in vegetation patches of 27.39 mm (about 228 L; Table 5).
Detailed analysis of the spatial distribution of infiltration and erosion under the simulated high-intensity (Figure 4) and low-intensity (Figure 5) rains for the restoration with small plants showed that runoff was generated mainly in bare soil areas and the greatest infiltration occurred in vegetated areas. The differences in infiltration rate between open areas and vegetation were more evident during high-intensity rain (Figure 4A) than under low-intensity event (Figure 5A). The highest erosion rates occurred in the areas of preferential runoff flow and decreased notably under the plants, especially during the intense events (Figure 4C), with less marked differences during low-intensity rain (Figure 5C).
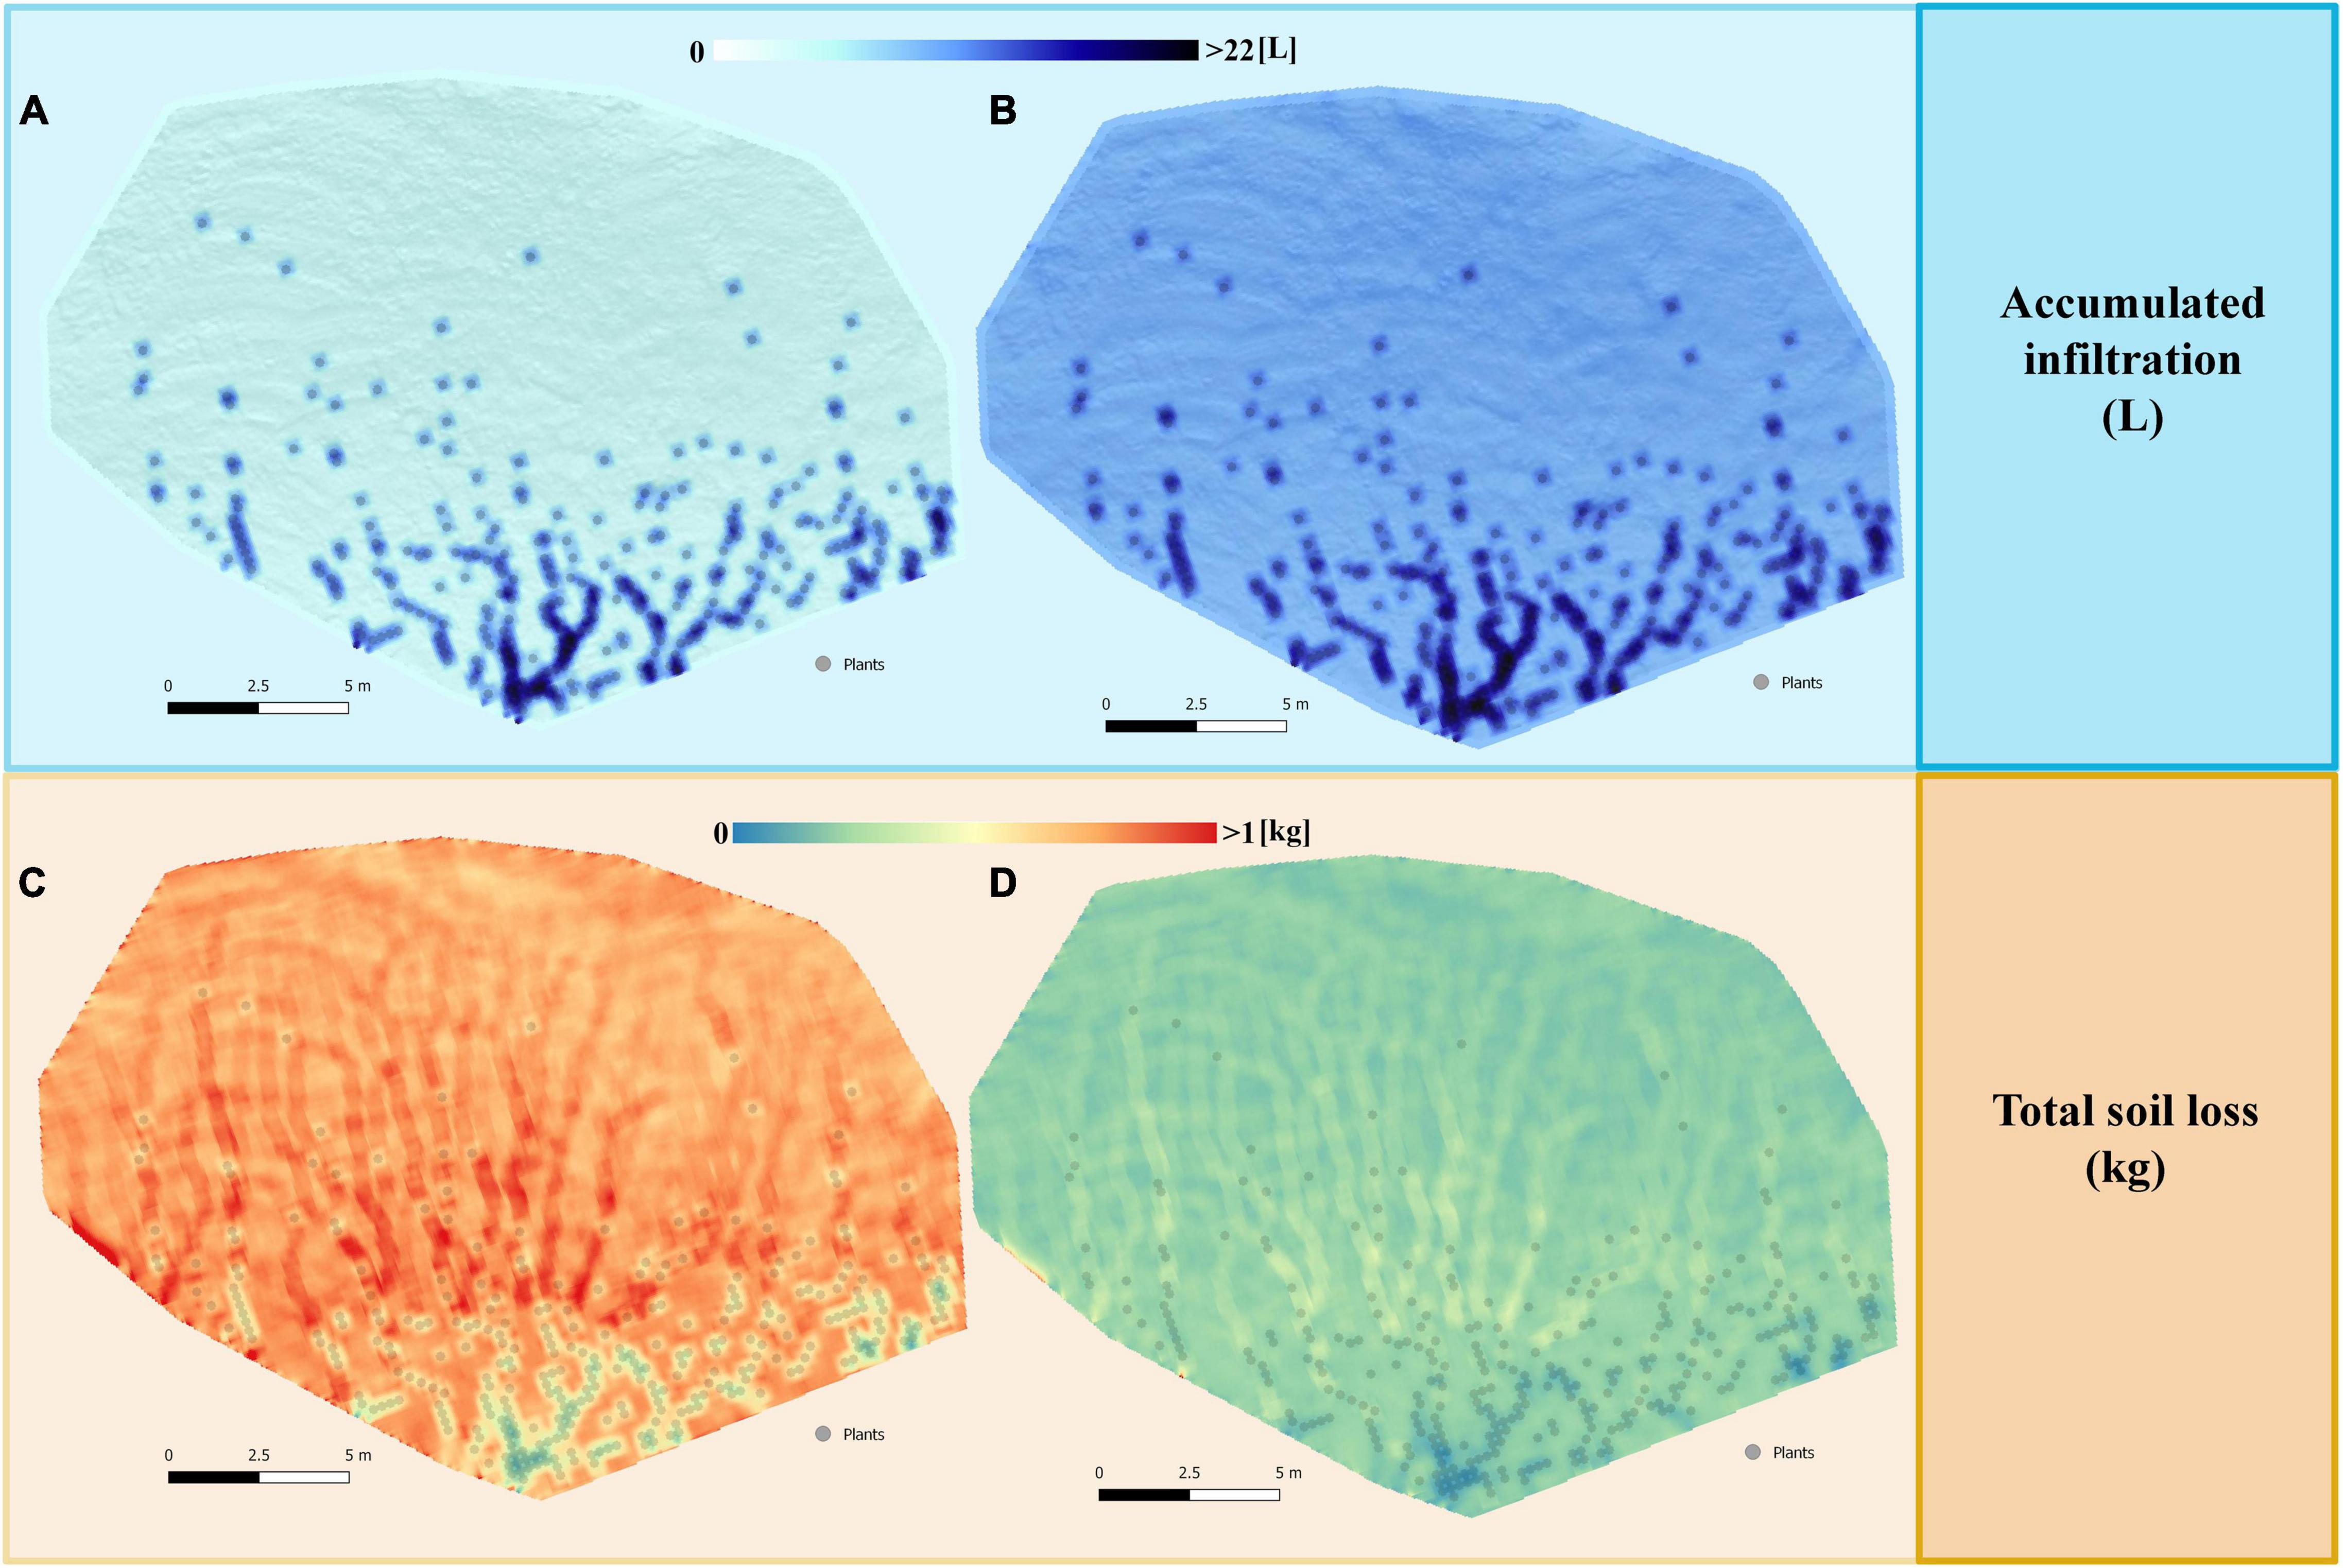
Figure 4. Maps of the spatial distribution of the total accumulated infiltration (L) and total soil loss (kg) obtained after simulating a rain of 55 mm h– 1 for 30 min on the restored slope with low size plants (25 × 25 cm), representing the first stages after restoration. The maps correspond to the scenario 5 with plants located in the areas with higher WI (Figure 2E), which in the simulations gave the best results of: (A) infiltration without cyanobacterial inoculation; (B) infiltration with cyanobacterial inoculation; (C) soil loss without cyanobacterial inoculation; (D) soil loss with cyanobacterial inoculation.
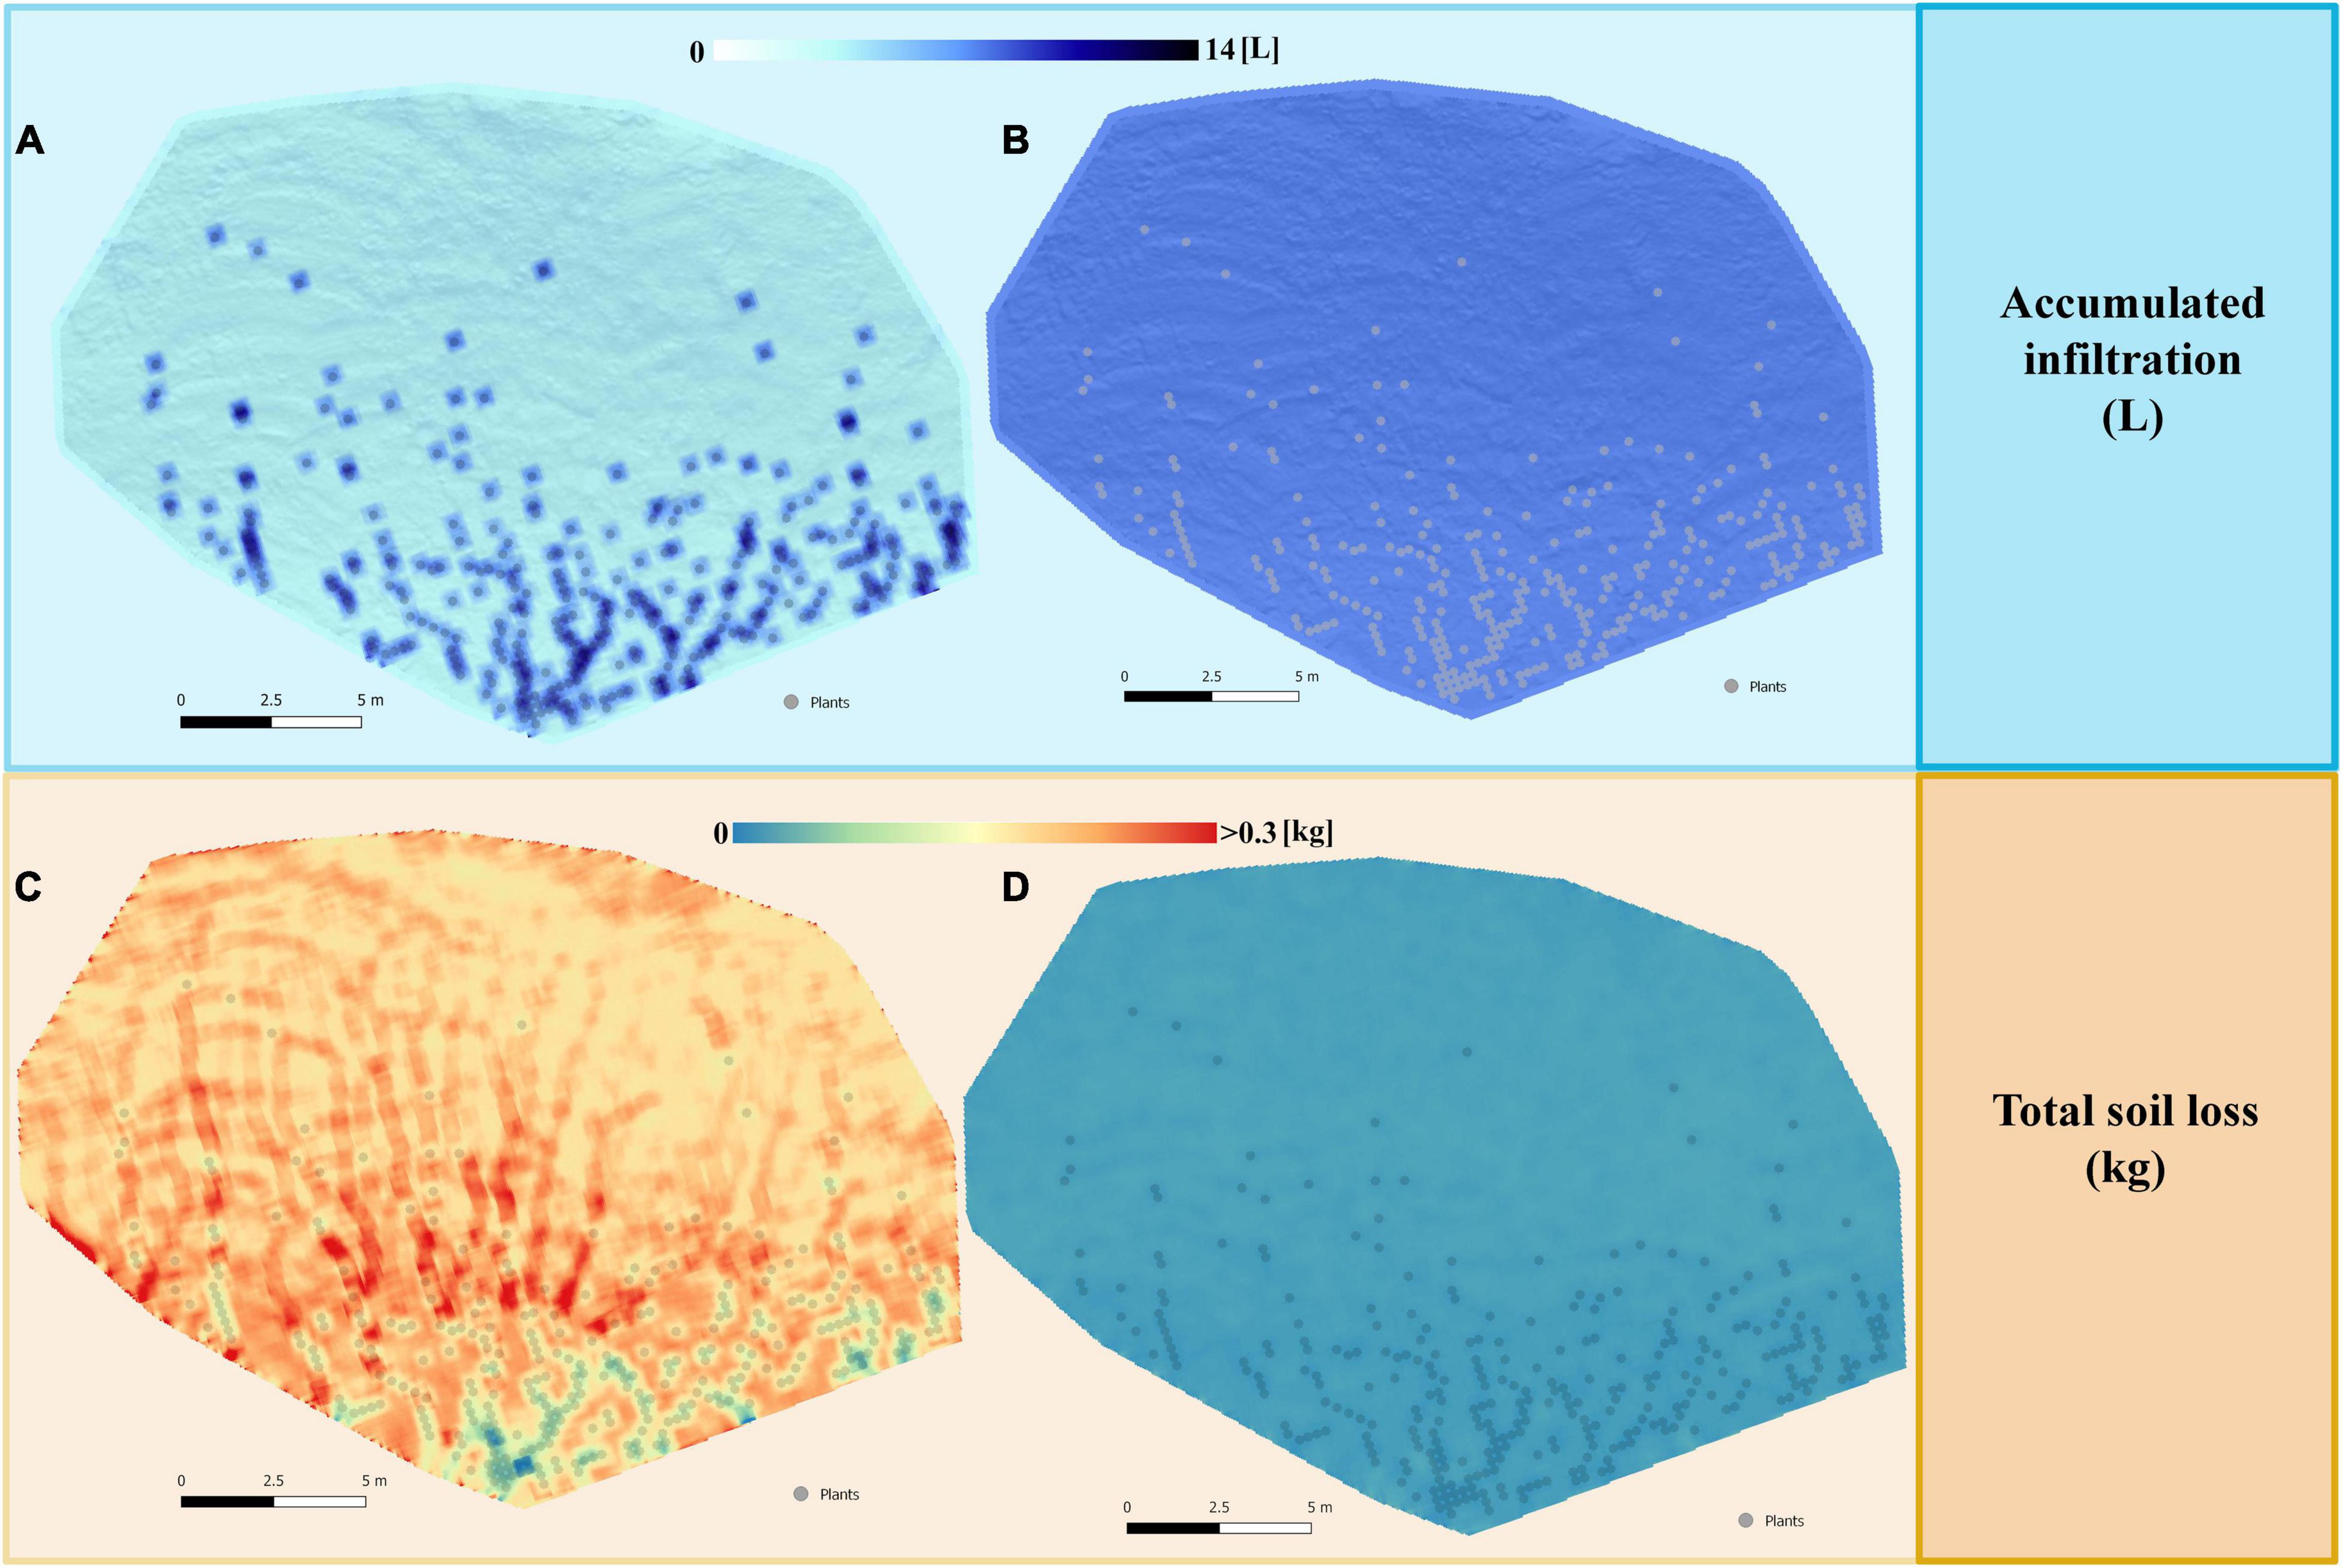
Figure 5. Maps of the spatial distribution of the total accumulated infiltration (L) and total soil loss (kg) obtained after simulating a rain of 15 mm h– 1 for 30 min on the restored slope with low size plants (25 × 25 cm), representing the first stages after restoration. The maps correspond to the scenario 5 with plants located in the areas with higher WI (Figure 2E), which in the simulations gave the best results of: (A) infiltration without cyanobacterial inoculation; (B) infiltration with cyanobacterial inoculation; (C) soil loss without cyanobacterial inoculation; (D) soil loss with cyanobacterial inoculation.
In the simulations with larger plants (50 × 50 cm), representing later stages of the ecosystem restoration, runoff coefficient and erosion showed a higher decrease with respect to the bare soil in both the low-intensity (from 75 to 54–59% and from 68 kg of soil loss to 55–58 kg) and high-intensity rain (from 93 to 87–89% and from 253 kg to 213–220 kg) (Table 6). Thus, water retained in the hillslope increased as plants had higher size. During the heavy rain, total infiltration rate in the scenario with low size plants was ∼4.7 mm (Table 5), whereas the scenario with higher size plants infiltrated ∼7 mm (Table 7).
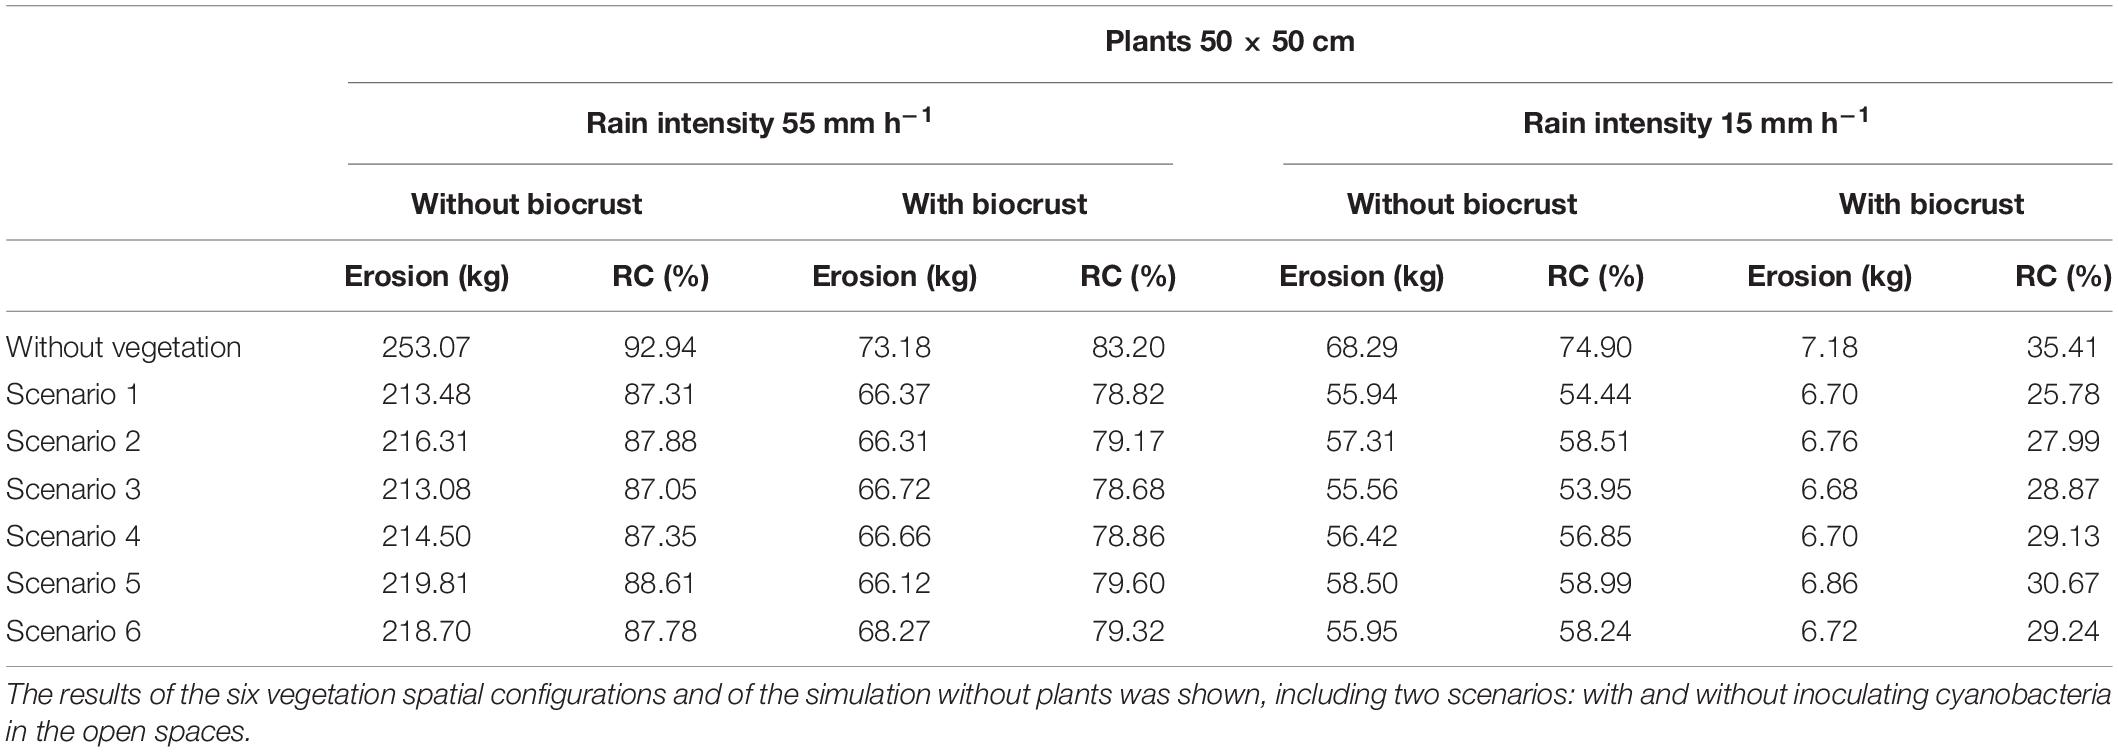
Table 6. Soil loss (kg) and runoff coefficient (%) obtained for the experimental plot after simulating low and high intensity rainfall events, assuming the presence of mature plants (50 × 50 cm), which represent the vegetation after several years since restoration.
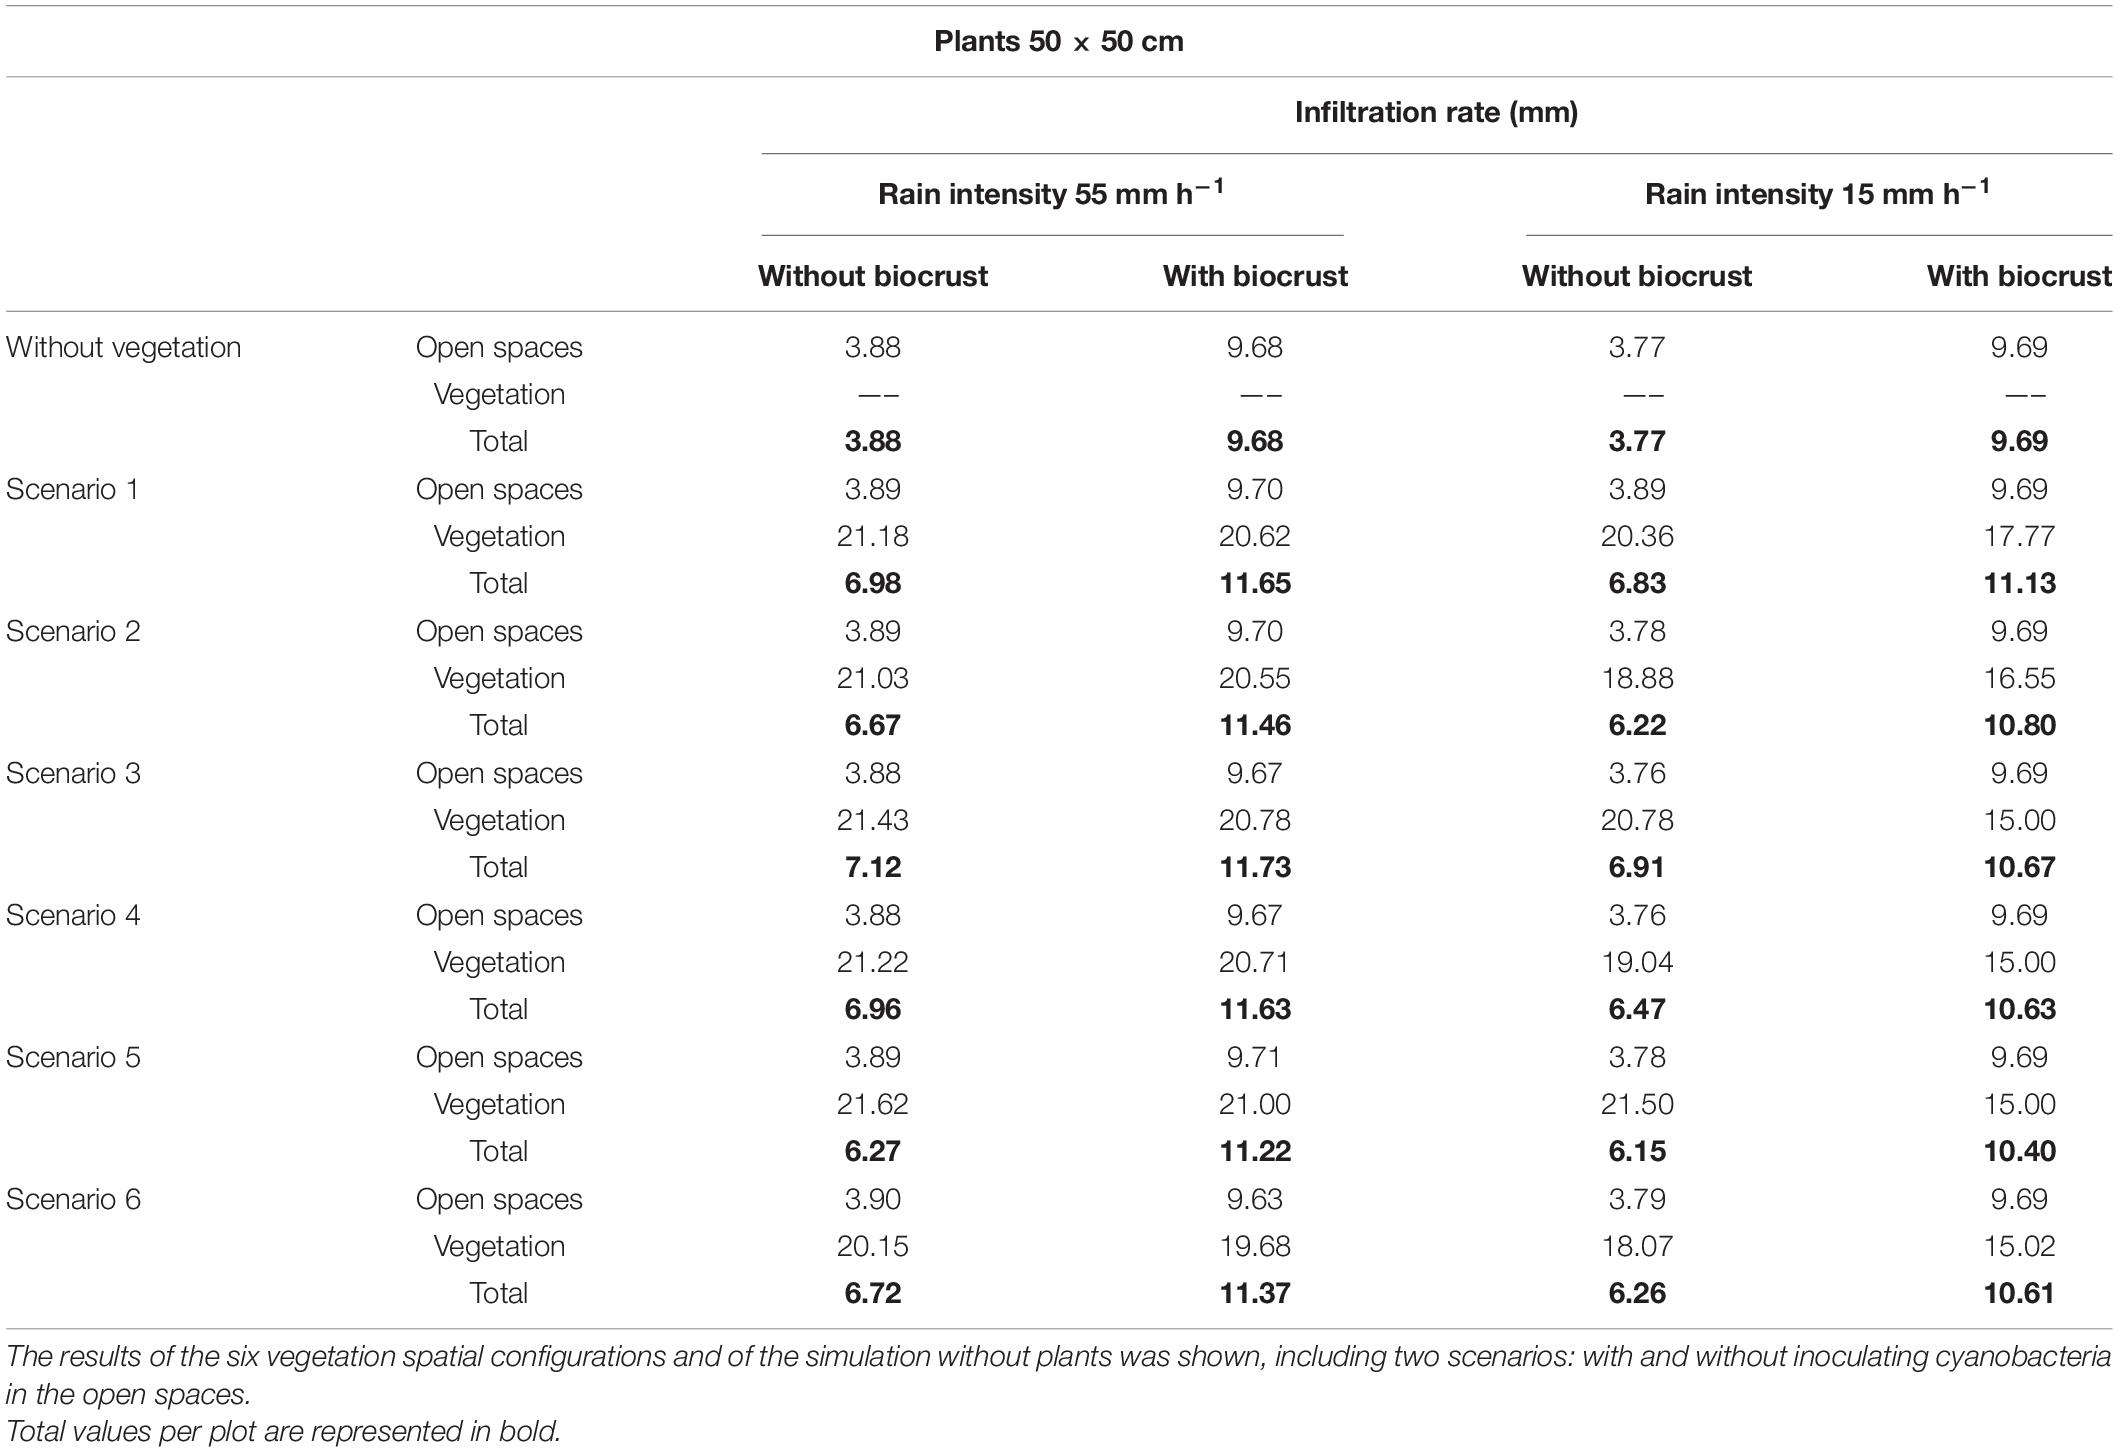
Table 7. Infiltration rates (mm) obtained in the open spaces and in the vegetation patches after simulating low and high intensity rainfall events, assuming the presence of mature plants (50 × 50 cm), which represent the vegetation after several years since restoration.
In contrast to results obtained with small plants, scenario 3 (plants in staggered pattern; Figure 2C) was the one that showed the best results with a total soil loss of 55.56 kg and a runoff coefficient of 54% in the low intense rain, and a total soil loss of 213 kg and a runoff coefficient of 87% in the intense rain (Table 6). Infiltration rate followed the same pattern with values of total infiltration of 7.12 mm during the heavy rain and 6.91 mm in the low intense rain in configuration 3, and 6.27 and 6.15 mm in configuration 5, in the high- and low-intensity rain, respectively (Table 7).
Biocrust Effects on Runoff and Erosion
Simulations considering the positive role of active biocrust recovery by cyanobacteria inoculation in soil physicochemical and hydrological properties led to modifications in the hydrological response of the hillslope, and especially on erosion, which was significantly reduced compared to that obtained for bare soil at the same conditions (Tables 4, 6). During the intense event, the infiltration rate in the open areas between plants was increased by the cyanobacterial cover, going from 3.88 to 9.68 mm (Table 5), while soil loss was considerably reduced from values of 241–243 to 72–73 kg (Table 4). During the low intense event, biocrust inoculation decreased the runoff coefficient from values of 67–69 to 33–34% and soil loss was negligible in all different spatial configuration tested (Table 4). Thus, water infiltration rate increased from 3.77 mm in the soil without biocrust inoculation to 9.69 mm in the inoculated soil (Table 5). As in the simulations without biocrust inoculation, the best configuration was the scenario 5 (plants in areas with high WI values, Figure 2E), which led to a runoff coefficient of 81% and a total soil loss of only 73 kg in the case of heavy rain (Table 4). In addition, this configuration was the one that produced the greatest infiltration in the vegetation patches (22.34 mm), which was very similar to that obtained in the simulation without inoculated biocrust (23.46 mm) (Table 5).
Regarding the configurations with larger plants combined with biocrust inoculation, runoff coefficient, erosion and infiltration rate followed the same pattern as in the simulations with small plants. Furthermore, in the case of the intense rain, soil loss was even lower than its equivalent for smaller plants, with values of 66–68 kg as compared to 72–73 kg (Tables 4, 6). Likewise, total infiltration rate during the heavy rain increased as vegetation was more developed, showing values of 11–12 mm with the larger plants (Table 6) and 10 mm with the smaller plants (Table 4).
The modeled spatial distribution of infiltration and erosion in the configurations including soil inoculation with biocrust followed the same patterns to the configurations without biocrust (Figures 4B,D). However, in this case, differences between the interplant soil and vegetation were much smaller, especially for water erosion.
Discussion
In dryland ecosystems, most runoff and sediments are generated during the sporadic intense rains, which are responsible for water and sediment redistribution along the landscape (Cantón et al., 2011; García-Ruiz et al., 2015). We simulated runoff and erosion in a degraded hillslope during several rain events occurring between July 2014 and December 2015 using the LISEM model. This is challenging due to the difficulty of simulating the hydrological and erosive response in semi-arid areas where ground cover and soil properties are highly heterogeneous and this variability affects infiltration, runoff and sediment yields (Cantón et al., 2002). Despite the lack of detailed information of total erosion and spatial distribution runoff and erosion records to calibrate the model, our model was able to predict the threshold for runoff generation of 3 mm observed in a nearby area with similar hydrological properties (Rodríguez-Caballero et al., 2015) and the real erosion measured on the slope during the study period, with an error of just 17.8%, thus demonstrating its potential as a tool for planning of restoration actions.
The simulations during the calibrating period show how the presence of spontaneous vegetation on the study hillslope effectively reduces the runoff generation and water erosion (Figure 3), as previously obtained by Chen et al. (2018). Vegetation acts as a runoff sink, infiltrating not only the water that falls directly in the form of precipitation, but also the runoff generated upstream (Ludwig et al., 2005; Puigdefábregas, 2005). This effect can be enhanced by the capacity of vegetation to trap wind-borne sediments, which may result in changes in soil properties such as soil coarsening that may also increase soil infiltration (Gonzales et al., 2018). Besides, vegetation increases water storage capacity and organic carbon and nutrient inputs, promotes biological activity and accelerates plant litter decomposition and nutrient turnover rates, thus resulting in the formation of “islands of fertility” that greatly differ from the nearby bare ground areas (Puigdefábregas, 2005).
At the hillslope scale, runoff interception by vegetation produces a decrease in hydrological connectivity, which ultimately reduces the loss of water, soil and nutrients out of the system, increasing ecosystem productivity (Ludwig et al., 2005). However, the hydrological response of the slope is not controlled only by the responses of the different covers (vegetation and bare soil), but it is also affected by the interaction between them, which ultimately depends on their spatial distribution (Peters et al., 2004). Due to the importance of spatial arrangement of source and sink areas, there are differences in the runoff and erosion response of the experimental hillslope under different vegetation spatial distributions tested during the simulation phase (Tables 4, 6). Nevertheless, considering that all these spatial distributions try to maximize water uptake by the vegetation and reduce the hydrological connectivity, differences among the tested spatial configurations are not very marked. As shown in Tables 5, 7, among all the configurations analyzed the one that maximized infiltration and greater reduced erosion was the scenario 5 (Figures 4, 5) with vegetation located in the areas with the greatest water accumulation (higher WI). This is because plants in this configuration are located in the areas where topography favors the runoff redistribution from bare areas and its storage (WI increases as slope gradient decreases) into the vegetated patches, in a similar way as observed in natural drylands where vegetation occupies the most favorable positions within the landscape (Bonachela et al., 2015; Rodríguez-Caballero et al., 2019). This spatial distribution and associated source-sink interactions between open areas and vegetation increases water availability for plants (Ludwig et al., 2005; Magliano et al., 2015). As water scarcity is the main limiting factor for vegetation survival in traditional dryland restoration (Valdecantos et al., 2014), this extra runoff water contribution is expected to favor vegetation growth and may minimize the death of the reintroduced plants during the first years of restoration, as was already observed during field water capture experiments in the same study site (García-Ávalos et al., 2018). Moreover, water redistribution processes promote pulses of plant growth and increase vegetation potential to capture water and nutrients during future rainy events, as we can see when we compare the simulations with 25 cm plants with the one with 50 cm plants (Tables 5, 7). However, the capacity of vegetation to capture and store the extra contribution of water by runoff is limited (Rodríguez-Caballero et al., 2014), especially in the initial stages of the restoration, when the plant is small. Thus, under high intense and high magnitude rain events, infiltration capacity of vegetation could be exceeded, and this may explain the similar infiltration rates obtained in the high and low intensity runoff simulations representing initial stages of plant development (Table 5). This phenomenon gives rise to a threshold in the hydrological and erosive response of the hillslope, which will increase with vegetation development, and above which water and associated sediments and nutrients are no longer retained by vegetation, getting these resources out of the system. Indeed, a rainfall threshold of 20 mm was found in a nearby area with similar soil types and vegetation (Rodríguez-Caballero et al., 2014), but also in more mesic environments (Nadal-Romero et al., 2018).
Results obtained from runoff and erosion simulations (Figures 4, 5) also corroborated the importance of biocrust recovery for water and erosion control (Gao et al., 2020). It is well known the key role that biocrusts play in hydrological and erosion processes in drylands (Rodríguez-Caballero et al., 2013; Chamizo et al., 2016; Eldridge et al., 2020). Biocrusts increase soil aggregation and soil porosity (Menon et al., 2011; Miralles-Mellado et al., 2011; Bowker et al., 2018), surface roughness (Rodríguez-Caballero et al., 2012), water retention capacity (Wu et al., 2013; Chamizo et al., 2016; Eldridge et al., 2020) and soil stability (Chiquoine et al., 2016). Improvement of these soil properties translates into greater infiltration and lower erosion when compared with bare soil areas, which due to the poor soil structure and low organic matter contents of dryland soils, are often prone to physical crusting (Chamizo et al., 2015). Physical crusts are known to reduce hydraulic conductivity and increase runoff and consequent erosion (Nciizah and Wakindiki, 2015). For this reason, biocrust recovery following a disturbance is a key step to improve soil hydraulic properties and above all, to increase soil stability and its resistance to erosive forces by water and wind (Knapen et al., 2007; Zhao et al., 2014; Fick et al., 2019). In this study, we have simulated the effect of biocrust recovery in the interplant soil by artificially promoting biocrust formation through soil inoculation with cyanobacteria. This strategy has provided successful results in biocrust recovery and promotion of vegetation succession in desertified areas from China (Lan et al., 2013). In all the simulations in which biocrust presence was included, there was a decrease in runoff, and especially in water erosion (Tables 4, 6). However, similar to the results found in the simulations where biocrust effect was not considered, there were important differences depending on the properties of the rainy event. During the low intense event, which was close to the infiltration capacity of the recovered biocrust, almost no runoff was generated in the open areas between vegetation, slightly reducing the contribution of water toward downslope vegetation (Table 4). This water is used by biocrust organisms to reactivate their metabolic activity, fixing C and N (Belnap et al., 2005; Aanderud et al., 2018; Miralles et al., 2018; Williams et al., 2018). Fixed nutrients are incorporated into the soil in the form of organic matter and biomass, increasing soil fertility and stability (Ferrenberg et al., 2017; Bao et al., 2019). During rains of similar intensity but greater magnitude, surface saturation of the first centimeters of soil, which is the layer affected by biocrust presence (Chamizo et al., 2012a), is expected (Rodríguez-Caballero et al., 2013). Under this situation, runoff is generated, and the runoff flow will redistribute part of the nutrients fixed by the biocrust along with the water toward the vegetated areas, increasing their productivity and ability to survive (Figure 6). In any case, runoff generation over biocrust-covered soils is more frequent during intense events, in which rainfall intensity exceeds biocrust infiltration capacity, and runoff occurs (Dunkerley, 2011; Rodríguez-Caballero et al., 2013; Zhao et al., 2014). Part of this runoff is reinfiltrated into the vegetation, but most of it runs on downslope, in a similar way to what happens in the scenario without biocrust (Figure 4). However, contrary to the scenario lacking biocrust, when modeling biocrust active restoration, erosion is strongly reduced (Figure 4 and Table 6).
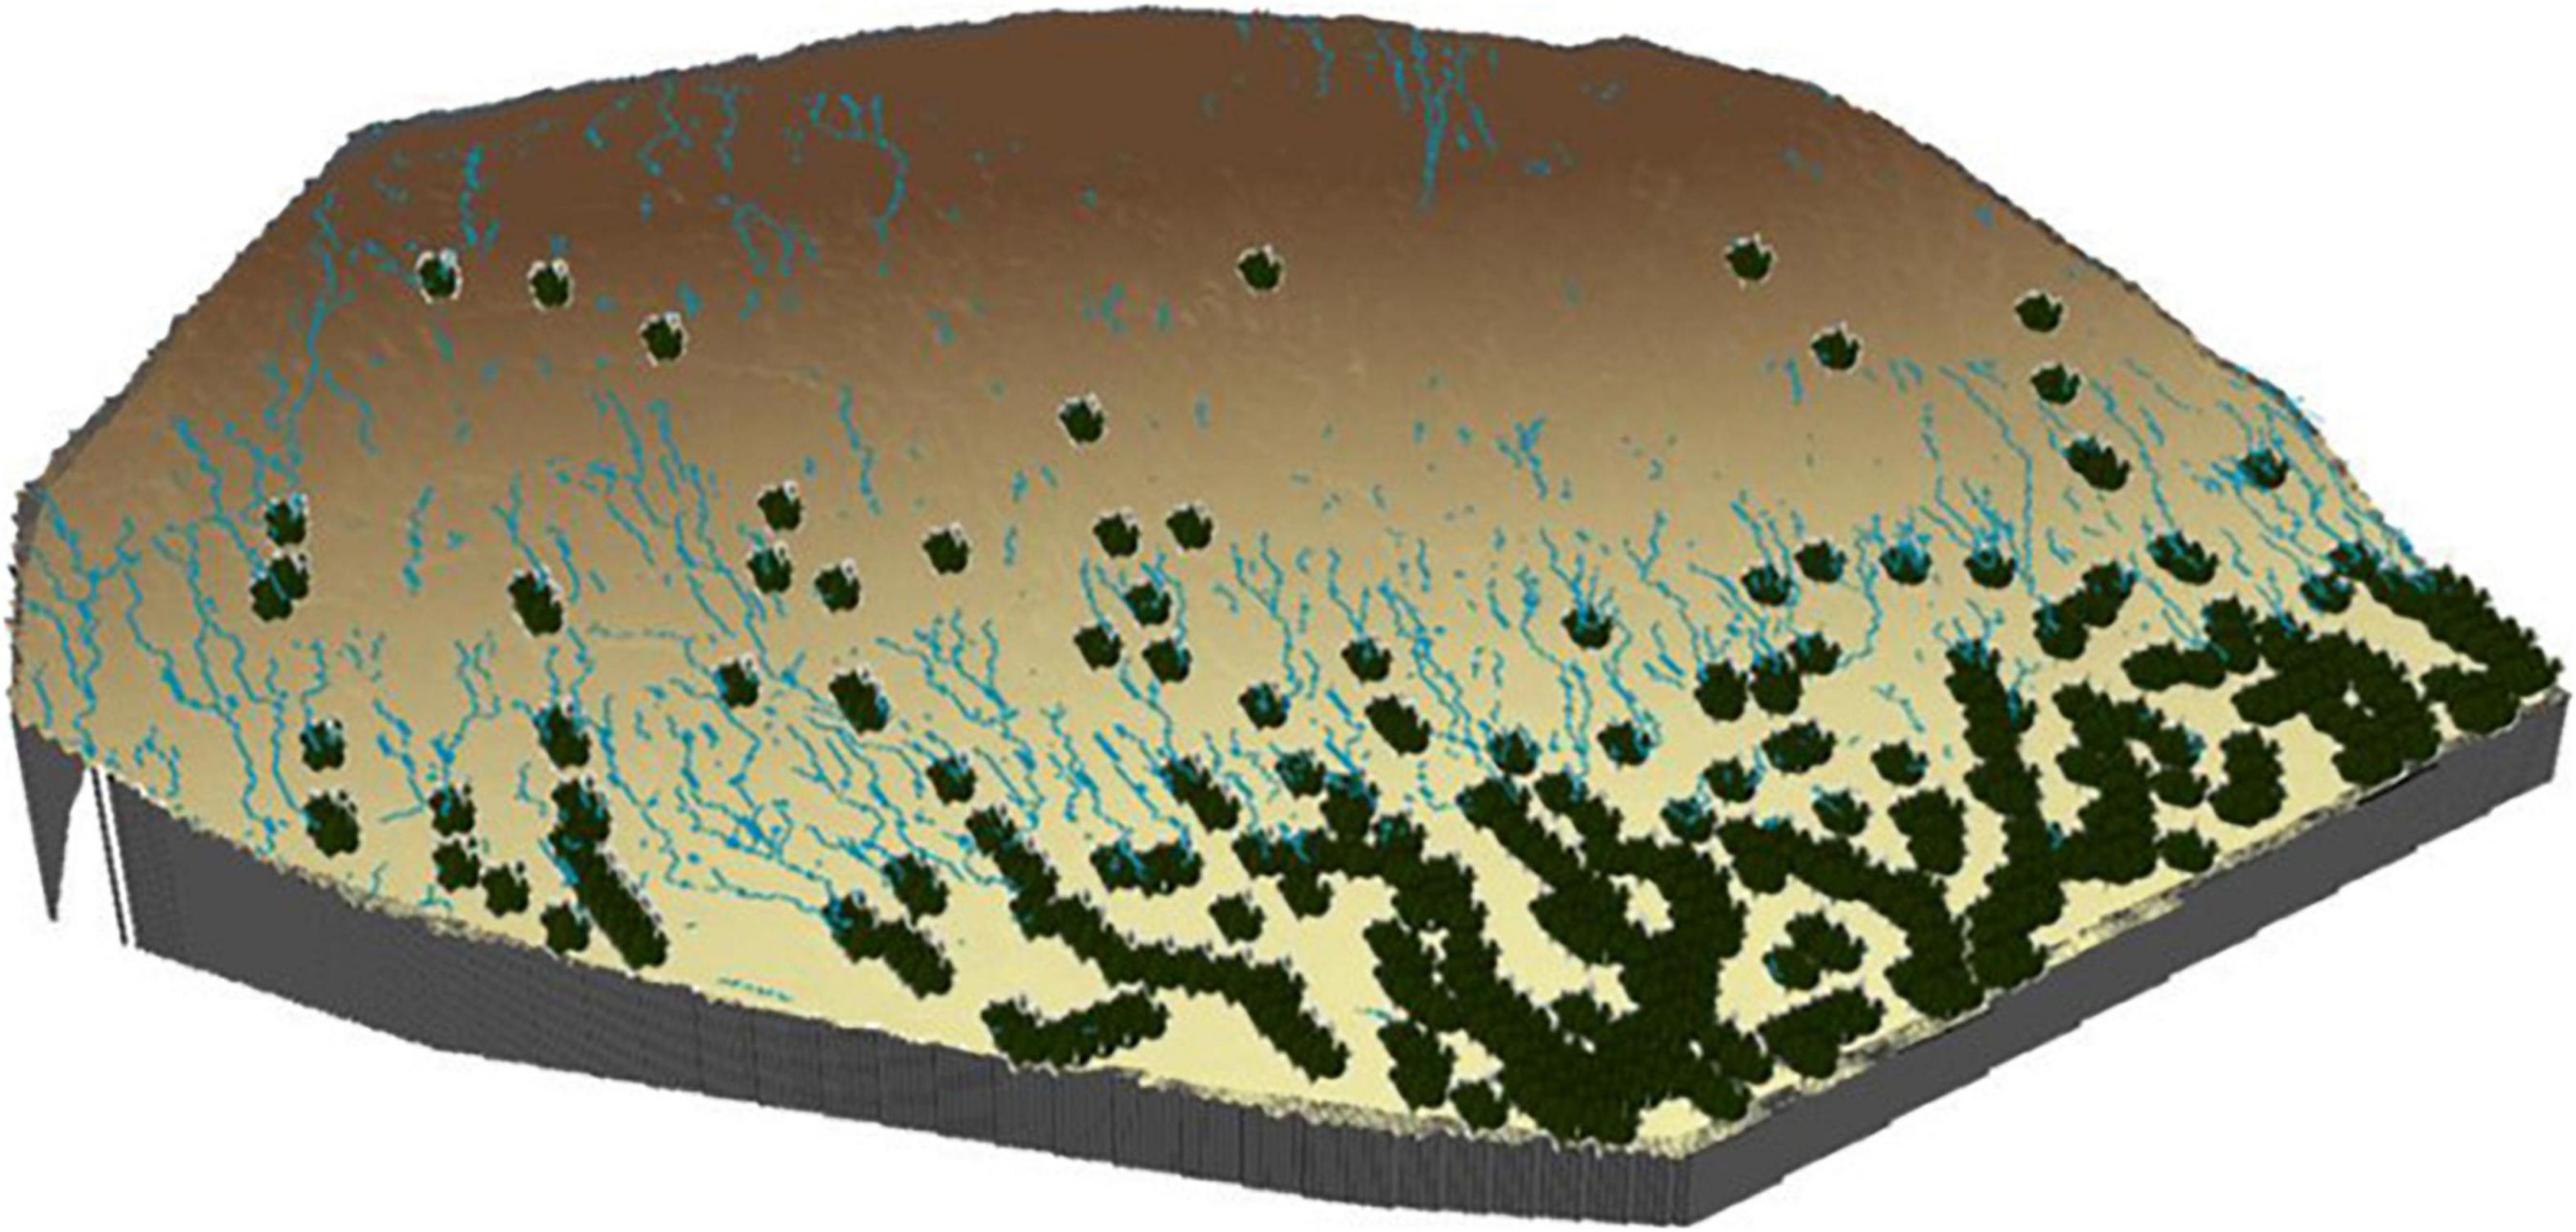
Figure 6. Accumulated runoff of the scenario with vegetation located in the greatest water accumulation areas in a simulation with small plants (25 × 25 cm) and soil covered by biocrust, under low-intensity rain (15 mm h– 1). The vegetation (lower part of the slope) collects the runoff from the soil covered by biocrust.
These findings demonstrate the potential of biocrust inoculation for the restoration of degraded arid and semi-arid areas, where vegetation growth is limited by water availability, and ecosystem recovery to the original stage before disturbance may take a long time (Kidron et al., 2008). Under these conditions, soil inoculation with cyanobacteria to restore the biocrust can prevent erosion during the first stages of soil restoration, while maintaining water supply to downslope vegetation when it is located in strategic positions to maximize water capture coming from biocrust areas. To correctly locate the vegetation, we can rely on runoff and erosion simulation models, which efficiently allow evaluating the effect of different spatial configuration of ground covers, helping optimize restoration practices. Although based on simulated and not real measured data, it is important to highlight the value of this type of exercise prior to a restoration since it will allow us to quickly identify the most efficient strategy before its implementation in the field, being a very useful and low-cost tool for land managers. However, more effort and long-term field measurements on restoration experiments are necessary to calibrate and validate this or similar models in a wide range of environmental conditions.
Conclusion
Application of a spatially distributed runoff and erosion model on a degraded hillslope allowed to identify the most optimal spatial configuration of vegetation to reduce runoff and erosion and increase water availability to the introduced plants. Among all the vegetation spatial configurations analyzed, those that locate the plants in the areas that have a greater contribution area and low to moderate slope gradients were predicted as the most efficient in reducing runoff and erosion and increasing water availability to plants. Although the effect of vegetation in the reduction of runoff and erosion was higher for larger plants, the modeling also foresees an appreciable influence of the recently introduced young plants. Moreover, according to our modeling results, active biocrust restoration by cyanobacteria inoculation reduced runoff and especially erosion. Although runoff decrease reduced the water input to vegetation, the higher amount of water that infiltrates in the interplant soil improves moisture conditions and provides a substantial benefit to the activity of soil microbiota and microfauna, and the activation of biogeochemical cycles, which has also indirect beneficial effects to adjacent vegetation.
Overall, all these results highlight the importance of accounting for the eco-hydrological interactions between biocrust-source areas and vegetation-sink areas when planning restoration strategies in drylands and demonstrates the potential of spatially distributed runoff and erosion models as a powerful tool to design restoration actions in drylands in order to increase its success.
Data Availability Statement
The raw data supporting the conclusions of this article will be made available by the authors, without undue reservation.
Author Contributions
LM acquired data, performed the modeling analyses, and wrote the manuscript. ER-C acquired data, performed the modeling analyses, and improved manuscript editing. SC acquired data and improved manuscript editing. BR-L performed the modeling analyses and improved manuscript editing. YC conceived the idea, designed the experiment, and improved manuscript editing. All authors contributed with constructive comments to the manuscript.
Funding
This study has received funding from the REBIOARID (RTI2018-101921-B-I00) project, funded by the FEDER/Science and Innovation Ministry-National Research Agency through the Spanish National Plan for Research and the European Union including European Funds for Regional Development, and from the RH2O-ARID (P18-RT-5130) project, funded by the Andalusian regional government and the European Union including European Funds for Regional Development. and from the project UAL2020-RNM-A2051, funded by the Programa Operativo FEDER Andalucía 2014-2020 of the University of Almería. SC acknowledges support by the HIPATIA-UAL postdoctoral fellowship funded by the University of Almería. ER-C acknowledges support by the EMERGIA program (EMERGIA20_00337) from the General Secretariat of Universities, Research and Technology of the Council of Economic Transformation, Industry, Knowledge and Universities. BR-L was funded by the FPU predoctoral fellowship from the Educational, Culture, and Sports Ministry of Spain (FPU17/01886).
Conflict of Interest
The authors declare that the research was conducted in the absence of any commercial or financial relationships that could be construed as a potential conflict of interest.
Publisher’s Note
All claims expressed in this article are solely those of the authors and do not necessarily represent those of their affiliated organizations, or those of the publisher, the editors and the reviewers. Any product that may be evaluated in this article, or claim that may be made by its manufacturer, is not guaranteed or endorsed by the publisher.
Acknowledgments
We would like to thank Albert Solé and Lourdes Luna for their field work assistance, and Fernando Fernandez for the collaboration in the data preprocessing.
References
Aanderud, Z. T., Smart, T. B., Wu, N., Taylor, A. S., Zhang, Y., and Belnap, J. E. (2018). Fungal loop transfer of nitrogen depends on biocrust constituents and nitrogen form. Biogeoscience 15, 3831–3840. doi: 10.5194/bg-15-3831-2018
Antoninka, A., Faist, A., Rodriguez-Caballero, E., Young, K. E., Chaudhary, V. B., Condon, L. A., et al. (2020). Biological soil crusts in ecological restoration: emerging research and perspectives. Restor. Ecol. 28, S2–S8. doi: 10.1111/rec.13201
Ayangbenro, A. S., and Babalola, O. O. (2021). Reclamation of arid and semi-arid soils: the role of plant growth-promoting archaea and bacteria. Curr. Plant Biol. 25:100173. doi: 10.1016/j.cpb.2020.100173
Baartman, J. E., Jetten, V. G., Ritsema, C. J., and Vente, J. (2011). Exploring effects of rainfall intensity and duration on soil erosion at the catchment scale using openLISEM: prado catchment, SE Spain. Hydrol. Process. 26, 1034–1049. doi: 10.1002/hyp.8196
Bao, T., Zhao, Y., Gao, L., Yang, Q., and Yang, K. (2019). Moss-dominated biocrusts improve the structural diversity of underlying soil microbial communities by increasing soil stability and fertility in the loess plateau region of China. Eur. J. Soil Biol. 95:103120. doi: 10.1016/j.ejsobi.2019.103120
Belnap, J., Walker, B. J., Munson, S. M., and Gill, R. A. (2014). Controls on sediment production in two U.S. deserts. Aeolian Res. 14, 15–24. doi: 10.1016/j.aeolia.2014.03.007
Belnap, J., Welter, J. R., Grimm, N. B., Barger, N., and Ludwig, J. A. (2005). Linkages between microbial and hydrologic processes in arid and semiarid watersheds. Ecol. 86, 298–307. doi: 10.1890/03-0567
Berghuis, P. M., Mayor, N. G., Rietkerk, M., and Baudena, M. (2020). More is not necessarily better: the role of cover and spatial organization of resource sinks in the restoration of patchy drylands. J. Arid Environ. 183:104282. doi: 10.1016/j.jaridenv.2020.104282
Beven, K. J., and Kirkby, M. J. (1979). A physically based, variable contributing area model of basin hydrology / un modèle à base physique de zone d’appel variable de l’hydrologie du bassin versant. Hydrol. Sci. Bull. 24, 43–69. doi: 10.1080/02626667909491834
Boer, M., and Puigdefábregas, J. (2005). Effects of spatially structured vegetation patterns on hillslope erosion in a semiarid mediterranean environment: a simulation study. Earth Surf. Process. Landf. 30, 149–167. doi: 10.1002/esp.1180
Bonachela, J. A., Pringle, R. M., Sheffer, E., Coverdale, T. C., Guyton, J. A., Caylor, K. K., et al. (2015). Termite mounds can increase the robustness of dryland ecosystems to climatic change. Science 347, 651–655. doi: 10.1126/science.1261487
Bowker, M., Reed, S., Belnap, J., and Phillips, S. (2002). Temporal variation in community composition, pigmentation, and Fv/Fm of desert cyanobacterial soil crusts. Microb. Ecol. 43, 13–25. doi: 10.1007/s00248-001-1013-9
Bowker, M. A. (2007). Biological soil crust rehabilitation in theory and practice: an underexploited opportunity. Restor. Ecol. 15, 13–23. doi: 10.1111/j.1526-100x.2006.00185.x
Bowker, M. A., Belnap, J., Davidson, D. W., and Phillips, S. L. (2005). Evidence for micronutrient limitation of biological soil crusts: importance to arid-lands restoration. Ecol. Appl. 15, 1941–1951. doi: 10.1890/04-1959
Bowker, M. A., Reed, S. C., Maestre, F. T., and Eldridge, D. J. (2018). Biocrusts: the living skin of the earth. Plant Soil 429, 1–7. doi: 10.1007/s11104-018-3735-1
Cantón, Y., Chamizo, S., Rodriguez-Caballero, E., Lázaro, R., Roncero-Ramos, B., Román, J. R., et al. (2020). Water regulation in cyanobacterial biocrusts from drylands: negative impacts of anthropogenic disturbance. Water 12:720. doi: 10.3390/w12030720
Cantón, Y., Del Barrio, G., Solé-Benet, A., and Lázaro, R. (2004). Topographic control on the spatial distribution of ground cover in the Tabernas badlands of SE Spain. Catena 55, 341–365. doi: 10.1016/s0341-8162(03)00108-5
Cantón, Y., Domingo, F., Solé-Benet, A., and Puigdefábregas, J. (2001). Hydrological and erosion response of a badlands system in semiarid SE Spain. J. Hydrol. 252, 65–84. doi: 10.1016/s0022-1694(01)00450-4
Cantón, Y., Domingo, F., Solé-Benet, A., and Puigdefábregas, J. (2002). Influence of soil-surface types on the overall runoff of the Tabernas badlands (south-east Spain): field data and model approaches. Hydrol. Process. 16, 2621–2643. doi: 10.1002/hyp.1052
Cantón, Y., Roncero-Ramos, B., Román Fernández, R., Rodríguez-Caballero, E., and Chamizo, S. (2021). Biocrust restoration: a key tool to recover degraded arid ecosystem functioning. Ecosistemas 30:2236. doi: 10.7818/ECOS.2236
Cantón, Y., Solé-Benet, A., de Vente, J., Boix-Fayos, C., Calvo-Cases, A., Asensio, C., et al. (2011). A review of runoff generation and soil erosion across scales in semiarid south-eastern Spain. J. Arid Environ. 75, 1254–1261. doi: 10.1016/j.jaridenv.2011.03.004
Chamizo, S., Cantón, Y., Lázaro, R., Solé-Benet, A., and Domingo, F. (2012b). Crust composition and disturbance drive infiltration through biological soil crusts in semiarid ecosystems. Ecosystem 15, 148–161. doi: 10.1007/s10021-011-9499-6
Chamizo, S., Cantón, Y., Miralles, I., and Domingo, F. (2012a). Biological soil crust development affects physicochemical characteristics of soil surface in semiarid ecosystems. Soil Biol. Biochem. 49, 96–105. doi: 10.1016/j.soilbio.2012.02.017
Chamizo, S., Cantón, Y., Rodríguez-Caballero, E., and Domingo, F. (2016). Biocrusts positively affect the soil water balance in semiarid ecosystems. Ecohydrol 9, 1208–1221. doi: 10.1002/eco.1719
Chamizo, S., Mugnai, G., Rossi, F., Certini, G., and de Philippis, R. (2018). Cyanobacteria inoculation improves soil stability and fertility on different textured soils: gaining insights for applicability in soil restoration. Front. Environ. Sci. 6:49. doi: 10.3389/fenvs.2018.00049
Chamizo, S., Rodríguez-Caballero, E., Cantón, Y., Asensio, C., and Domingo, F. (2015). Penetration resistance of biological soil crusts and its dynamics after crust removal: relationships with runoff and soil detachment. Catena 126, 164–172. doi: 10.1016/j.catena.2014.11.011
Chen, H., Zhang, X., Abla, M., Lü, D., Yan, R., and Ren, Q. (2018). Effects of vegetation and rainfall types on surface runoff and soil erosion on steep slopes on the loess plateau. China. Catena 170, 141–149. doi: 10.1016/j.catena.2018.06.006
Chiquoine, L. P., Abella, S. R., and Bowker, M. A. (2016). Rapidly restoring biological soil crusts and ecosystem functions in a severely disturbed desert ecosystem. Ecol. Appl. 26, 1260–1272. doi: 10.1002/15-0973
Cortina, J., Amat, B., Castillo, V., Fuentes, D., Maestre, F., Padilla, F., et al. (2011). The restoration of vegetation cover in the semi-arid Iberian southeast. J. Arid Environ. 75, 1377–1384. doi: 10.1016/j.jaridenv.2011.08.003
Darby, B. J., Neher, D. A., and Belnap, J. (2010). Impact of biological soil crusts and desert plants on soil microfaunal community composition. Plant Soil 328, 421–431. doi: 10.1007/s11104-009-0122-y
Dunkerley, D. (2011). Effects of rainfall intensity fluctuations on infiltration and runoff: rainfall simulation on dryland soils, Fowlers Gap, Australia. Hydrol. Process. 26, 2211–2224. doi: 10.1002/hyp.8317
Eldridge, D. J., Reed, S., Travers, S. K., Bowker, M. A., Maestre, F. T., Ding, J., et al. (2020). The pervasive and multifaceted influence of biocrusts on water in the world’s drylands. Glob. Change Biol. 26, 6003–6014. doi: 10.1111/gcb.15232
European Environment Agency. (2019). The European environment-state and outlook 2020. Knowledge for transition to a sustainable Europe. Luxembourg: Publications Office of the European Union.
FAO. (2015). “Global guidelines for the restoration of degraded forests and landscapes,” in Drylands: building resilience and benefiting livelihoods, eds N. Berrahmouni, P. Regato, and M. Parfondry (Rome: FAO Forestry Paper No. 175).
FAO. (2019). Trees, forests and land use in drylands: the first global assessment – Full report. Rome: FAO Forestry Paper No. 184.
Fattahi, S. M., Soroush, A., and Huang, N. (2020). Wind erosion control using inoculation of aeolian sand with cyanobacteria. Land Degrad. Develop. 31, 2104–2116. doi: 10.1002/ldr.3590
Ferrenberg, S., Tucker, C. L., and Reed, S. C. (2017). Biological soil crusts: diminutive communities of potential global importance. Front. Ecol. Environ. 15:160–167. doi: 10.1002/fee.1469
Fick, S. E., Barger, N., Tatarko, J., and Duniway, M. C. (2019). Induced biological soil crust controls on wind erodibility and dust (PM10) emissions. Earth Surf. Process. Landf. 45, 224–236. doi: 10.1002/esp.4731
Food and Agriculture Organization of the United Nations (FAO) (2017). Dryland Restoration Initiative Platform (DRIP). Available online at: http://www.fao.org/in-action/dryland-restoration-initiative-platform/en/ (accessed July 29, 2021)
Gao, L., Bowker, M. A., Sun, H., Zhao, J., and Zhao, Y. (2020). Linkages between biocrust development and water erosion and implications for erosion model implementation. Geoderma 357, 113973. doi: 10.1016/j.geoderma.2019.113973
García-Ávalos, S., Rodriguez-Caballero, E., Miralles, I., Luna, L., Domene, M. A., Solé-Benet, A., et al. (2018). Water harvesting techniques based on terrain modification enhance vegetation survival in dryland restoration. Catena 167, 319–326. doi: 10.1016/j.catena.2018.05.004
García-Ruiz, J. M., Beguería, S., Nadal-Romero, E., González-Hidalgo, J. C., Lana-Renault, N., and Sanjuán, Y. (2015). A meta-analysis of soil erosion rates across the world. Geomorphology 239, 160–173. doi: 10.1016/j.geomorph.2015.03.008
Gonzales, H. B., Ravi, S., Li, J., and Sankey, J. B. (2018). Ecohydrological implications of aeolian sediment trapping by sparse vegetation in drylands. Ecohydrol. 11, e1986. doi: 10.1002/eco.1986
Green, H. W., and Ampt, G. A. (1911). Studies on Soil Physics. J. Agric. Sci. 4, 1–24. doi: 10.1017/s0021859600001441
Havrilla, C. A., Chaudhary, V. B., Ferrenberg, S., Antoninka, A. J., Belnap, J., Bowker, M. A., et al. (2019). Towards a predictive framework for biocrust mediation of plant performance: A meta-analysis. J. Ecol. 107, 2789–2807. doi: 10.1111/1365-2745.13269
Housman, D., Powers, H., Collins, A., and Belnap, J. (2006). Carbon and nitrogen fixation differ between successional stages of biological soil crusts in the Colorado Plateau and Chihuahuan Desert. J. Arid Environ. 66, 620–634. doi: 10.1016/j.jaridenv.2005.11.014
Hulvey, K. B., Leger, E. A., Porensky, L. M., Roche, L. M., Veblen, K. E., Fund, A., et al. (2017). Restoration islands: a tool for efficiently restoring dryland ecosystems? Restor. Ecol 25, S124–S134. doi: 10.1111/rec.12614
Imeson, A., and Vis, M. (1984). Assessing soil aggregate stability by water-drop impact and ultrasonic dispersion. Geoderma 34, 185–200. doi: 10.1016/0016-7061(84)90038-7
James, J. J., Sheley, R. L., Erickson, T., Rollins, K. S., Taylor, M. H., and Dixon, K. W. (2013). A systems approach to restoring degraded drylands. J. Appl. Ecol. 50, 730–739. doi: 10.1111/1365-2664.12090
Jetten, V., de Roo, A., and Favis-Mortlock, D. (1999). Evaluation of field-scale and catchment-scale soil erosion models. Catena 37, 521–541. doi: 10.1016/s0341-8162(99)00037-5
Jetten, V. G., and De Roo, A. P. J. (2001). “Spatial analysis of erosion conservation measures with LISEM,” in Landscape Erosion and Evolution Modeling, eds R. S. Harmon and W. W. Doe (Boston, MA: Springer), 429–445. doi: 10.1007/978-1-4615-0575-4_14
Kheirfam, H., Sadeghi, S. H., and Zarei Darki, B. (2020). Soil conservation in an abandoned agricultural rain-fed land through inoculation of cyanobacteria. Catena 187, 104341. doi: 10.1016/j.catena.2019.104341
Kidron, G. J., Vonshak, A., and Abeliovich, A. (2008). Recovery rates of microbiotic crusts within a dune ecosystem in the Negev Desert. Geomorphology 100, 444–452. doi: 10.1016/j.geomorph.2008.01.012
Kidron, G. J., Xiao, B., and Benenson, I. (2020). Data variability or paradigm shift? Slow versus fast recovery of biological soil crusts-a review. Sci. Total Environ. 721, 137683. doi: 10.1016/j.scitotenv.2020.137683
Knapen, A., Poesen, J., Galindo-Morales, P., Baets, S. D., and Pals, A. (2007). Effects of microbiotic crusts under cropland in temperate environments on soil erodibility during concentrated flow. Earth Surf. Process. Landf. 32, 1884–1901. doi: 10.1002/esp.1504
Lan, S., Zhang, Q., Wu, L., Liu, Y., Zhang, D., and Hu, C. (2013). Artificially accelerating the reversal of desertification: Cyanobacterial inoculation facilitates the succession of vegetation communities. Environ. Sci. Technol. 48, 307–315. doi: 10.1021/es403785j
Lázaro, R., Cantón, Y., Solé-Benet, A., Bevan, J., Alexander, R., Sancho, L., et al. (2008). The influence of competition between lichen colonization and erosion on the evolution of soil surfaces in the Tabernas badlands (SE Spain) and its landscape effects. Geomorphol 102:2, 252–266.
Ludwig, J. A., Wilcox, B. P., Breshears, D. D., Tongway, D. J., and Imeson, A. C. (2005). Vegetation patches and runoff-erosion as interacting ecohydrological processes in semiarid landscapes. Ecol. 86, 288–297. doi: 10.1890/03-0569
Luna, L., Miralles, I., Lázaro, R., Contreras, S., and Solé-Benet, A. (2017). Effect of soil properties and hydrologic characteristics on plants in a restored calcareous quarry under a transitional arid to semiarid climate. Ecohydrol. 11, e1896. doi: 10.1002/eco.1896
Luna, L., Pastorelli, R., Bastida, F., Hernández, T., García, C., Miralles, I., et al. (2016). The combination of quarry restoration strategies in semiarid climate induces different responses in biochemical and microbiological soil properties. Appl. Soil Ecol. 107, 33–47. doi: 10.1016/j.apsoil.2016.05.006
Luna Ramos, L., and Solé Benet, A. (2015). Erosión del suelo acentuada por un acolchado de gravilla en una ladera en restauración en canteras de Almería (sede España). Revista EIA 12, E13–E19. doi: 10.14508/reia.2015.12.E2.13-19
Maestre, F. T., Benito, B. M., Berdugo, M., Concostrina-Zubiri, L., Delgado-Baquerizo, M., Eldridge, D. J., et al. (2021). Biogeography of global drylands. New Phytol. 231:2, 540–558. doi: 10.1111/nph.17395
Maestre, F. T., and Cortina, J. (2002). Spatial patterns of surface soil properties and vegetation in a Mediterranean semi-arid steppe. Plant Soil 241, 279–291.
Mager, D., and Thomas, A. (2011). Extracellular polysaccharides from cyanobacterial soil crusts: A review of their role in dryland soil processes. J. Arid Environ. 75, 91–97. doi: 10.1016/j.jaridenv.2010.10.001
Magliano, P. N., Breshears, D. D., Fernández, R. J., and Jobbágy, E. G. (2015). Rainfall intensity switches ecohydrological runoff/runon redistribution patterns in dryland vegetation patches. Ecol. Appl. 25, 2094–2100. doi: 10.1890/15-0550.1
Martínez-Mena, M., Albaladejo, J., and Castillo, V. M. (1998). Factors influencing surface runoff generation in a Mediterranean semi-arid environment: Chicamo watershed, SE Spain. Hydrol. Process 12, 741–754. doi: 10.1002/(SICI)1099-1085(19980430)12:5<741::AID-HYP622<3.0.CO;2-F
Menon, M., Yuan, Q., Jia, X., Dougill, A., Hoon, S., and Thomas, A. (2011). Assessment of physical and hydrological properties of biological soil crusts using X-ray microtomography and modeling. J. Hydrol. 397, 47–54. doi: 10.1016/j.jhydrol.2010.11.021
Miralles, I., Ladrón De Guevara, M., Chamizo, S., Rodríguez-Caballero, E., Ortega, R., van Wesemael, B., et al. (2018). Soil CO2 exchange controlled by the interaction of biocrust successional stage and environmental variables in two semiarid ecosystems. Soil Biol. Biochem. 124, 11–23. doi: 10.1016/j.soilbio.2018.05.020
Miralles-Mellado, I., Cantón, Y., and Solé-Benet, A. (2011). Two-dimensional porosity of crusted silty soils: Indicators of soil quality in semiarid rangelands? Soil Sci. Soc. Am. J. 75, 1330–1342. doi: 10.2136/sssaj2010.0283
Muñoz-Rojas, M., Román, J., Roncero-Ramos, B., Erickson, T., Merritt, D., Aguila-Carricondo, P., et al. (2018). Cyanobacteria inoculation enhances carbon sequestration in soil substrates used in dryland restoration. Sci. Total Environ. 636, 1149–1154. doi: 10.1016/j.scitotenv.2018.04.265
Nadal-Romero, E., Peña-Angulo, D., and Regüés, D. (2018). Rainfall, run-off, and sediment transport dynamics in a humid mountain badland area: Long-term results from a small catchment. Hydrol. Process. 32, 1588–1606. doi: 10.1002/hyp.11495
Nciizah, A. D., and Wakindiki, I. I. (2015). Soil sealing and crusting effects on infiltration rate: a critical review of shortfalls in prediction models and solutions. Arch. Agron. Soil Sci. 61, 1211–1230. doi: 10.1080/03650340.2014.998203
Nesshöver, C., Assmuth, T., Irvine, K. N., Rusch, G. M., Waylen, K. A., Delbaere, B., et al. (2017). The science, policy and practice of nature-based solutions: an interdisciplinary perspective. Sci. Total Environ. 579, 1215–1227. doi: 10.1016/j.scitotenv.2016.11.106
Park, C. H., Li, X. R., Zhao, Y., Jia, R. L., and Hur, J. S. (2017). Rapid development of cyanobacterial crust in the field for combating desertification. PLos One 12:e0179903. doi: 10.1371/journal.pone.0179903
Peters, D. P. C., Pielke, R. A., Bestelmeyer, B. T., Allen, C. D., Munson-McGee, S., and Havstad, K. M. (2004). Cross-scale interactions, nonlinearities, and forecasting catastrophic events. Proc. Natl. Acad. Sci. U.S.A. 101, 15130–15135. doi: 10.1073/pnas.0403822101
Phillips, M. L., McNellis, B. E., Howell, A., Lauria, C. M., Belnap, J., and Reed, S. C. (2022). Biocrusts mediate a new mechanism for land degradation under a changing climate. Nat. Clim. Chang. 12, 71–76. doi: 10.1038/s41558-021-01249-6
Prãvãlie, R. (2016). Drylands extent and environmental issues. a global approach. Earth Sci. Rev. 161, 259–278. doi: 10.1016/j.earscirev.2016.08.003
Puigdefábregas, J. (2005). The role of vegetation patterns in structuring runoff and sediment fluxes in drylands. Earth Surf. Process. Landf. 30, 133–147. doi: 10.1002/esp.1181
Rahimy, P. (2012). Effects of soil depth spatial variation on runoff simulation, using the limburg soil erosion model (LISEM), a case study in faucon catchment, france. Soil Water Res. 7, 52–63. doi: 10.17221/25/2011-swr
Ramírez, D. A., Bellot, J., Domingo, F., and Blasco, A. (2007). Stand transpiration of Stipa tenacissima grassland by sequential scaling and multi-source evapotranspiration modelling. J. Hydrol. 342, 1–2,124–133.
Ravi, S., Breshears, D. D., Huxman, T. E., and D’Odorico, P. (2010). Land degradation in drylands: interactions among hydrologic–aeolian erosion and vegetation dynamics. Geomorphol 116, 236–245. doi: 10.1016/j.geomorph.2009.11.023
Reynolds, J. F., Smith, D. M. S., Lambin, E. F., Turner, B. L., Mortimore, M., Batterbury, S. P. J., et al. (2007). Global desertification: building a science for dryland development. Science 316, 847–851. doi: 10.1126/science.1131634
Rodríguez-Caballero, E., Cantón, Y., Chamizo, S., Afana, A., and Solé-Benet, A. (2012). Effects of biological soil crusts on surface roughness and implications for runoff and erosion. Geomorphol 14, 81–89. doi: 10.1016/j.geomorph.2011.12.042
Rodríguez-Caballero, E., Cantón, Y., Chamizo, S., Lázaro, R., and Escudero, A. (2013). Soil loss and runoff in semiarid ecosystems: a complex interaction between biological soil crusts, micro-topography, and hydrological drivers. Ecosystem 16, 529–546. doi: 10.1007/s10021-012-9626-z
Rodríguez-Caballero, E., Cantón, Y., and Jetten, V. (2015). Biological soil crust effects must be included to accurately model infiltration and erosion in drylands: an example from Tabernas Badlands. Geomorphol 241, 331–342.
Rodríguez-Caballero, E., Cantón, Y., Lazaro, R., and Solé-Benet, A. (2014). Cross-scale interactions between surface components and rainfall properties. non-linearities in the hydrological and erosive behavior of semiarid catchments. J. Hydrol. 517, 815–825.
Rodríguez-Caballero, E., Chamizo, S., Roncero-Ramos, B., Román, R., and Cantón, Y. (2018). Runoff from biocrust: a vital resource for vegetation performance on mediterranean steppes. Ecohydrol 11:e1977. doi: 10.1002/eco.1977
Rodríguez-Caballero, E., Román, J. R., Chamizo, S., Roncero Ramos, B., and Cantón, Y. (2019). Biocrust landscape-scale spatial distribution is strongly controlled by terrain attributes: topographic thresholds for colonization in a semiarid badland system. Earth Surf. Process. Landf. 44, 2771–2779. doi: 10.1002/esp.4706
Román, J., Chamizo, S., Roncero-Ramos, B., Adessi, A., de Philippis, R., and Cantón, Y. (2021a). Overcoming field barriers to restore dryland soils by cyanobacteria inoculation. Soil Tillage Res. 207:104799. doi: 10.1016/j.still.2020.104799
Román, J., Roncero-Ramos, B., Rodríguez-Caballero, E., Chamizo, S., and Cantón, Y. (2021b). Effect of water availability on induced Cyanobacterial biocrust development. Catena 197:104988. doi: 10.1016/j.catena.2020.104988
Román, J. R., Roncero-Ramos, B., Chamizo, S., Rodríguez-Caballero, E., and Cantón, Y. (2018). Restoring soil functions by means of cyanobacteria inoculation: importance of soil conditions and species selection. Land Degrad. Dev. 29, 3184–3193. doi: 10.1002/ldr.3064
Roncero-Ramos, B., Muñoz-Martín, M., Chamizo, S., Fernández-Valbuena, L., Mendoza, D., Perona, E., et al. (2019a). Polyphasic evaluation of key cyanobacteria in biocrusts from the most arid region in Europe. PeerJ 7:e6169. doi: 10.7717/peerj.6169
Roncero-Ramos, B., Román, J. R., Gómez-Serrano, C., Cantón, Y., and Acién, F. G. (2019b). Production of a biocrust-cyanobacteria strain (nostoc commune) for large-scale restoration of dryland soils. J. Appl. Phycol. 31, 2217–2230. doi: 10.1007/s10811-019-1749-6
Roncero-Ramos, B., Román, J. R., Rodríguez-Caballero, E., Chamizo, S., Águila-Carricondo, P., Mateo, P., et al. (2019c). Assessing the influence of soil abiotic and biotic factors on nostoc commune inoculation success. Plant Soil 444, 57–70. doi: 10.1007/s11104-019-04239-y
Rossi, F., Li, H., Liu, Y., and De Philippis, R. (2017). Cyanobacterial inoculation (cyanobacterisation): perspectives for the development of a standardized multifunctional technology for soil fertilization and desertification reversal. Earth Sci. Rev. 171, 28–43. doi: 10.1016/j.earscirev.2017.05.006
Sadeghi, S. H., Kheirfam, H., Homaee, M., Darki, B. Z., and Vafakhah, M. (2017). Improving runoff behavior resulting from direct inoculation of soil micro-organisms. Soil Tillage Res. 171, 35–41. doi: 10.1016/j.still.2017.04.007
Sanchez-Moreno, J. F., Jetten, V., Mannaerts, C. M., and de Pina Tavares, J. (2013). Selecting best mapping strategies for storm runoff modeling in a mountainous semi-arid area. Earth Surf. Process. Landf. 39, 1030–1048. doi: 10.1002/esp.3501
Sand-Jensen, K., and Jespersen, T. S. (2011). Tolerance of the widespread cyanobacterium nostoc commune to extreme temperature variations (-269 to 105°C), pH and salt stress. Oecologia 169, 331–339. doi: 10.1007/s00442-011-2200-0
Svejcar, L. N., and Kildisheva, O. A. (2017). The age of restoration: challenges presented by dryland systems. Plant Ecol. 218, 1–6. doi: 10.1007/s11258-016-0694-6
Tang, C., Liu, Y., Li, Z., Guo, L., Xu, A., and Zhao, J. (2021). Effectiveness of vegetation cover pattern on regulating soil erosion and runoff generation in red soil environment, southern China. Ecol. Indic. 129:107956. doi: 10.1016/j.ecolind.2021.107956
Valdecantos, A., Fuentes, D., Smanis, A., Llovet, J., Morcillo, L., and Bautista, S. (2014). Effectiveness of low-cost planting techniques for improving water availability to olea europaea seedlings in degraded drylands. Restor. Ecol. 22, 327–335. doi: 10.1111/rec.12076
Weber, B., Büdel, B., and Belnap, J. (2016). Biological Soil Crusts: An Organizing Principle in Drylands, Vol. 226. Cham: Springer.
Weber, B., and Hill, J. (2016). “Remote sensing of biological soil crusts at different scales,” in Biological Soil Crusts: An Organizing Principle in Drylands. Ecological Studies (Analysis and Synthesis), eds B. Weber, B. Büdel, and J. Belnap (Cham: Springer), 499–523. doi: 10.1007/978-3-319-30214-0_24
Williams, W., Büdel, B., and Williams, S. (2018). Wet season cyanobacterial N enrichment highly correlated with species richness and nostoc in the northern australian savannah. Biogeoscience 15, 2149–2159. doi: 10.5194/bg-15-2149-2018
Wu, Y., Rao, B., Wu, P., Liu, Y., Li, G., and Li, D. (2013). Development of artificially induced biological soil crusts in fields and their effects on top soil. Plant Soil 370, 115–124. doi: 10.1007/s11104-013-1611-6
Xiao, B., Hu, K., Veste, M., and Kidron, G. J. (2019). Natural recovery rates of moss biocrusts after severe disturbance in a semiarid climate of the Chinese loess plateau. Geoderma 337, 402–412. doi: 10.1016/j.geoderma.2018.09.054
Xiao, B., and Veste, M. (2017). Moss-dominated biocrusts increase soil microbial abundance and community diversity and improve soil fertility in semi-arid climates on the loess plateau of China. Appl. Soil Ecol. 117-118, 165–177. doi: 10.1016/j.apsoil.2017.05.005
Zhang, B., Zhang, Y., Li, X., and Zhang, Y. (2018). Successional changes of fungal communities along the biocrust development stages. Biol. Fertil. Soils 54, 285–294. doi: 10.1007/s00374-017-1259-0
Zhang, R., Wang, J., and Niu, S. (2021). Toward a sustainable grazing management based on biodiversity and ecosystem multifunctionality in drylands. Curr. Opin. Environ. Sustain. 48, 36–43. doi: 10.1016/j.cosust.2020.09.005
Zhang, Y. (2005). The microstructure and formation of biological soil crusts in their early developmental stage. Chin. Sci. Bull. 50, 117–121. doi: 10.1007/bf02897513
Zhao, Y., Bowker, M. A., Zhang, Y., and Zaady, E. (2016). “Enhanced recovery of biological soil crusts after disturbance,” in Biological Soil Crusts: An Organizing Principle in Drylands. Ecological Studies (Analysis and Synthesis), eds B. Weber, B. Büdel, and J. Belnap (Cham: Springer), 499–523.
Keywords: runoff, sediment yield, ecological restoration, biological soil crusts, drylands, spatially distributed models
Citation: Maggioli L, Rodríguez-Caballero E, Cantón Y, Rodríguez-Lozano B and Chamizo S (2022) Design Optimization of Biocrust-Plant Spatial Configuration for Dry Ecosystem Restoration Using Water Redistribution and Erosion Models. Front. Ecol. Evol. 10:765148. doi: 10.3389/fevo.2022.765148
Received: 26 August 2021; Accepted: 18 January 2022;
Published: 11 February 2022.
Edited by:
Maik Veste, Brandenburg University of Technology Cottbus-Senftenberg, GermanyReviewed by:
Blaire Steven, Connecticut Agricultural Experiment Station, United StatesShuai Wang, Case Western Reserve University, United States
Copyright © 2022 Maggioli, Rodríguez-Caballero, Cantón, Rodríguez-Lozano and Chamizo. This is an open-access article distributed under the terms of the Creative Commons Attribution License (CC BY). The use, distribution or reproduction in other forums is permitted, provided the original author(s) and the copyright owner(s) are credited and that the original publication in this journal is cited, in accordance with accepted academic practice. No use, distribution or reproduction is permitted which does not comply with these terms.
*Correspondence: Lisa Maggioli, bGlzYW1hZ0B1YWwuZXM=; Sonia Chamizo, c2NkMzk0QHVhbC5lcw==