 Graeme D. Ruxton
 Nick Colegrave
- 1School of Biology, University of St Andrews, St Andrews, United Kingdom
- 2Institute of Evolutionary Biology, University of Edinburgh, Edinburgh, United Kingdom
A Commentary on
Parasite-mediated mate preferences in a cooperatively breeding rodent
by Lutermann, H., Butler, K. B., and Bennett, N. C. (2022). Front. Ecol. Evol. 10:A838076 doi: 10.3389/fevo.2022.838076
Introduction
Several articles have argued that the calculation of post hoc power (also called observed, realized, or achieved power) when presenting the results of a study is unhelpful at best (e.g., Hoenig and Heisey, 2001; Colegrave and Ruxton, 2003; O'Keefe, 2007). However, such calculations can still be found in modern research articles, and the recent study of Lutermann et al. (2022) provides a particularly clear example. We use this example to critique post hoc power as it is commonly used but offer a simple and more useful alternate analysis.
The original power analysis
Luttermann et al. compared 15 healthy male mole-rats with 15 infected with a parasite. They compare testosterone and cortisol levels between these groups, and both cases use post hoc power analysis as part of the interpretation of the results. Since their approach is the same for both, for brevity, we discuss only testosterone. Levels of testosterone (nmol/nmol creatinine) are reported as 139.8 ± 21.5 for healthy individuals and 105.6 ± 19.92 for infected ones. These values are compared using a t-test—the results being t28 = −1.22 and p = 0.234. “The effect size for this comparison was moderate (Cohen's d = 0.44, and the power low at β = −0.282)”. This is referred to in the Discussion as follows: “Our power analysis suggests that due to the large variance in testosterone levels larger sample sizes (n = 78) would be required to identify such differences”.
Our critique
It is well known that post hoc power offers no new information—if you know the experimental design and the form of the analysis, then there is a one-to-one relationship between the p-value and observed power (Hoenig and Heisey, 2001). If the result of your analysis is non-significant, then your power to detect an effect of the size that you observed is low, by definition. Thus, the β value is redundant. It is also of very limited informational value, since the p-value shows a strong sample-to-sample variation (Halsey et al., 2015)—β will show strong variation in replicate experiments. Quoting Cohen's d also offers no new information—for this design, it is simply the difference between the means divided by the pooled standard deviation (which can be easily obtained from the two SEs given). This too will show strong sample-to-sample variation. Finally, “such differences” in the Discussion section are undefined, and it appears from our simulations that n = 78 is the sample size required to detect an effect size the same as the observed one with 75% power. First, a reader could not have surmised this without recourse to their own investigations like our simulations, and second, there is no good reason for focusing on the power to detect this effect size just because it is the one calculated from the samples in this experiment. Overall, the presented post hoc power analyses add no useful information to the reader and risk confusing them.
Our recommended alternative
If the authors want to describe how between-individual variation leads to uncertainty in the effect size, then the most natural way to do this would be to quote a 95% confidence interval for the effect size (the mean testosterone level in healthy individuals minus that in infected ones). This can be done on the basis of the information given earlier and is (−1.5, 70). Thus, if the null hypothesis was anything from increasing testosterone by 1.5 units to decreasing it by up to 70 units, the observed sample in this study would cause that null hypothesis not to be rejected based on a test statistic calculated from that sample using the p < 0.05 criterion. This interval includes zero, thus, we would not reject the null hypothesis of no difference, but the range of other values for the predicted effect size that would similarly not be rejected is now available to the reader. We chose to work with a very simple effect size (difference between the means) because we think this facilitates easy interpretation of effect sizes. However, sometimes—especially when comparing studies—it may be useful to use a standardized measure of effect size (most obviously Cohen's d here), and this can be done using the same approach as taken here without difficulty.
If the authors want to explore the power of the experiment to detect effect sizes of different magnitudes, this can be done easily by simulation for any experiment, and such simulations can easily explore the consequences of replicating the experiment with a larger sample size (as we elaborate in Colegrave and Ruxton, 2020). The key difference to this approach over post hoc power analysis is that the effect sizes explored should be driven by consideration of what would constitute an interesting effect rather than simply the observed effect size in this experiment. Such simulations are conceptually simple, and their coding should be possible for scientists who perform statistical analyses in software like R. Although simple, they allow valuable exploration of understanding of the experiment. Most importantly, they can be used in planning a subsequent experiment that is adequately powered for the desired purpose, rather than interpreting the results of the current study.
Here, we can safely assume from the author's use of a t-test that testosterone levels in male rats of each type can be well described by two normal distributions. In fact, given that the pooled standard deviation is over 80, this assumption is questionable, but we can ignore this for our illustrative purposes. From the quoted SEs, we can calculate the common SD of these distributions. We can set the mean for the healthy male rats to be the pooled mean from this experiment (122.7), and the equivalent mean for the infected male rats to this value minus the effect size. We simply repeatedly sample n individuals from each of these distributions and submit each set of two samples to a t-test. The statistical power (for that combination of sample size and effect size) is simply the fraction of such p-values that are <0.05. Such an analysis can be seen in Figure 1.
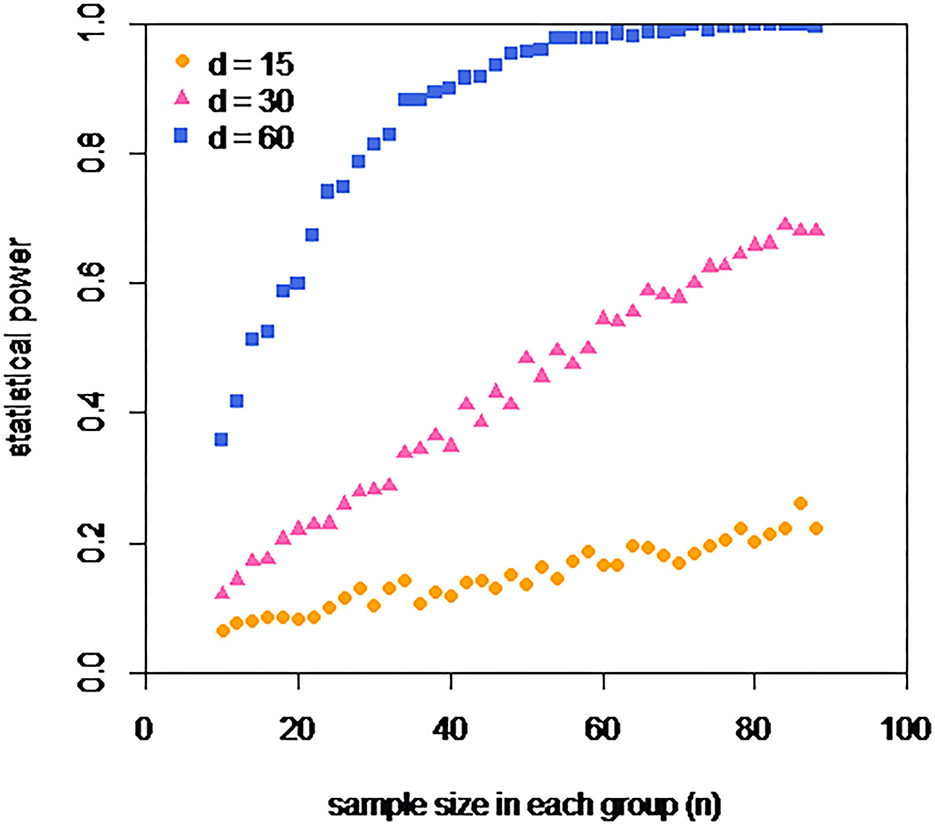
Figure 1. Estimated power of an experiment of the type described in the study to detect a difference in testosterone levels of d, if each group has a sample size of n. Three different effect sizes are explored d = 15, 30, and 60 (nmol/nmol creatinine), which are equivalent to infection reducing testosterone levels by approximately 12, 25, and 50%. For none of these effect sizes, does the actual size of the experiment carried out (n = 15) offer substantial power. An experiment two times as big (n = 30) offers a power of 0.8 to detect a 50% decrease, but even an experiment six times as big (n = 90) offers relatively little power to detect the two smaller considered effect sizes.
Discussion
We have shown with reference to this recent study that post hoc power analysis is of little value. However, the aims of such a power analysis can often be met by considering a confidence interval for the effect size and by exploring power for effect sizes determined drawing on information other than the observed magnitude in the focal study.
Author contributions
GR and NC equally developed the ideas for this study and simulations were performed. Figures were drawn by GR. All authors contributed to writing the manuscript.
Acknowledgments
We thank the various reviewers of our 2020 monograph on power analysis for helping us develop our ideas.
Conflict of interest
The authors declare that the research was conducted in the absence of any commercial or financial relationships that could be construed as a potential conflict of interest.
Publisher's note
All claims expressed in this article are solely those of the authors and do not necessarily represent those of their affiliated organizations, or those of the publisher, the editors and the reviewers. Any product that may be evaluated in this article, or claim that may be made by its manufacturer, is not guaranteed or endorsed by the publisher.
References
Colegrave, N., and Ruxton, G. D. (2003). Confidence intervals are a more useful complement to nonsignificant tests than are power calculations. Behav. Ecol. 14:446–447 doi: 10.1093/beheco/14.3.446
Colegrave, N., and Ruxton, G. D. (2020). Power analysis: An Introduction for the life Sciences. Oxford: Oxford University Press.
Halsey, L. G., Curran-Everett, D., Vowler, S. L., and Drummond, G. B. (2015). The fickle P value generates irreproducible results. Nature methods 12:179–185. doi: 10.1038/nmeth.3288
Hoenig, J. M., and Heisey, D. M. (2001). The abuse of power: the pervasive fallacy of power calculations for data analysis. Am. Statist. 55:19–24. doi: 10.1198/000313001300339897
Lutermann, H., Butler, K. B., and Bennett, N. C. (2022). Parasite-mediated mate preferences in a cooperatively breeding rodent. Front. Ecol. Evol. 10:A838076 doi: 10.3389/fevo.2022.838076
Keywords: statistical power, effect size, confidence intervals, post hoc power, sample size calculations, observed power, achieved power
Citation: Ruxton GD and Colegrave N (2023) Commentary: Parasite-mediated mate preferences in a cooperatively breeding rodent. Front. Ecol. Evol. 10:1108008. doi: 10.3389/fevo.2022.1108008
Received: 25 November 2022; Accepted: 29 December 2022;
Published: 19 January 2023.
Edited by:
Stephen T. Trumbo, University of Connecticut, United StatesReviewed by:
Peter L. Hurd, University of Alberta, CanadaCopyright © 2023 Ruxton and Colegrave. This is an open-access article distributed under the terms of the Creative Commons Attribution License (CC BY). The use, distribution or reproduction in other forums is permitted, provided the original author(s) and the copyright owner(s) are credited and that the original publication in this journal is cited, in accordance with accepted academic practice. No use, distribution or reproduction is permitted which does not comply with these terms.
*Correspondence: Graeme D. Ruxton,  Z3I0MUBzdC1hbmRyZXdzLmFjLnVr