 Li Wei
 Xiaopeng Liu
 Xinyan Li
 Haiyan Gao
- 1School of Civil and Hydraulic Engineering, Ningxia University, Yinchuan, China
- 2Department of Information and Computer Science, Xinhua College of Ningxia University, Yinchuan, China
- 3School of Geography and Planning, Ningxia University, Yinchuan, China
The human-water system synergy in Northwest China has become more significant as the ecological civilization construction continues and the implementation of the 2030 Agenda for Sustainable Development in China proceeds. In this study, taking the Ningxia Hui Autonomous Region as a typical research region, the human–water system coevolution model was established by coupling SD (System Dynamics) model and coevolution model from the theoretical perspective of complex system synergies, to simulate the human-water system’s coevolution trends from 2010 to 2030 in this region. Five regulation schemes were then designed to enhance the synergy of the human-water system by adjusting sensitive decision variables. The results revealed that the supply to demand ratio of water and the synergy index of the human-water system obtained by the status continuation scheme would decline from 1.02 and 0.39 in 2020 to 0.81 and 0.35 in 2030, respectively, indicating the growing gap between water supply and demand and revealing the worsening human-water relationship. Under the comprehensive optimization scheme, the supply to demand ratio of water and the synergy index of the human-water system would be higher than under the other schemes, demonstrating a substantially improved human-water relationship. Hence, a comprehensive optimization regulation scheme is proposed. This scheme combines improving pro-environmental water consumption, adapting industrial structures, and carrying out water conservation and pollution prevention. This research renders a decision-making basis for regulating regional water resources and finding paths to developing a harmonious relationship between humans and water.
1. Introduction
Water, as a fundamental natural resource and a strategic economic resource, is a significant controlling factor for ecology and the environment (Jiang, 2001). It also plays an crucial role in contributing to the sustainability of human economies and societies (Zuo et al., 2015; Yang et al., 2021). Against a backdrop of global and accelerated urbanization and industrialization, water resources have been used excessively, triggering environmental problems such as river and lake shrinkage, land desertification, water and soil loss, and aggravated water pollution (Wei et al., 2015; Lu et al., 2016; Shuai et al., 2020; Zhao et al., 2020). As indicated in the World Water Development Report, released by the United Nations (UN) in 2019, the ever-increasing water use by human beings will leave over 2 billion people living in countries that will face a critical shortage of water resources by 2050, and there will be at least 1 month of severe water shortages per year for approximately 4 billion population. As the water crisis worsens, the human-water relationship will confront unprecedented challenges and ordeals (Grant et al., 2012; Li et al., 2018).
Water problems are particularly evident in China (Wang et al., 2021; Zhang et al., 2022). China has a large population with inadequate water resources that are distributed inequitably across areas and throughout the year, frequent floods and droughts, water pollution, and ecological deterioration as well as outstanding human-water contradictions (Xia and Chen, 2001; Jiang, 2009; Xue et al., 2017; Li and Qian, 2018; Yin et al., 2021). The Chinese government has proposed a number of policies to deal with these issues in recent years (Wang F. et al., 2022), such as constructing a water-conserving society, implementing the most stringent management system for water resources possible, carrying out an action plan to prevent and control water pollution, promoting ecological civilization construction, and fulfilling the 2030 Agenda for Sustainable Development.
The human-water contradiction is especially prominent in Northwest China, which covers a total area of about 3,100,000 km2 (representing 32.44 percent of the country’s total national territory). Located in the hinterlands of Eurasia, Northwest China has an arid and semi-arid continental climate with minimal precipitation, significant evaporation, and wide temperature range. Rainfall is typically 10 to 1,200 millimeters per year and evaporation is typically 800–3,200 millimeters per year. It is estimated that 80.5% of the national average is available for water per capita (Bao and Zou, 2018). The water shortage and fragile ecological environment have become restrictive factors for socioeconomic growth in Northwest China. In the Ningxia Hui Autonomous Region (Ningxia), Over 75% of the inland region of Northwest China is arid and semi-arid, with average annual precipitation and evaporation of 289 millimeters and 1,250 millimeters, respectively. The surface runoff depth was 17 mm in Ningxia in 2020, which is significantly less than the national average lever (283 mm); water availability per capita was 603 m3, which is less than one third of the national average level and one ninth of the global average level (Liu et al., 2018). Ningxia is one of the provinces in China stricken by serious water shortages. As an economically underdeveloped area, it is now rapidly urbanizing and industrializing, and its water demand is expected to grow exponentially very quickly. Despite the enormous short-term economic benefits, this development has resulted in irreparable environmental problems. Therefore, it is urgent that water resource development and utilization be coordinated with socioeconomic growth and ecological environment conservation in order to facilitate the development of a harmonious relationship between humans and water.
The human-water relationship index is an interdisciplinary research technique that integrates social elements and scientific methods, which provide a scientific and effective quantitative path toward comprehensively evaluating and optimally regulating the human-water relationship. In recent years, the measurement of the human-water relationship index has become a concern for scholars and a research hotspot. Scholars have successively established single-indicator and multi-indicator index measurement models; the most representative single-indicator indexes of these, proposed at the outset, include the water stress index (WSI; Jackson et al., 1988), the human development index (HDI; Sagar and Najam, 1998), and the water exploitation index (WEI; Agence, 2005). Given that single-indicator indexes lack comprehensiveness and are unsystematic when used to evaluate the human-water relationship, composite-indicator indexes have since been used. These indexes include the water poverty index (WPI; Sullivan, 2002), the water resources carrying capacity index (WRCCI; Song et al., 2011), the water shortage index (WSI; Zeng et al., 2013), the water security index (WSI; Jia et al., 2015), the human-water system synergy index (HWSSI; Liu et al., 2014; He et al., 2018), the human-water harmony index (HWHI; Ding et al., 2014; Ahmad et al., 2018; Zuo et al., 2020a,b), and the water resources constraint intensity index (WRCII; Bao and Zou, 2018). All these indexes help explore the relationships between human activities and water resource shortages and the ecological environment, considerably enriching the research that sets out to estimate the human-water relationship. However, the emphases and evaluation criteria adopted by scholars vary with research region, temporal settings, and research objectives. For instance, the water poverty index helps investigate the relationship between water resources and human poverty, while the HWSSI attempts to balance water resource development and use, socioeconomic growth, and environmental protection. The HWHI was designed to achieve adequate states in two dimensions: the human system, as well as the water system. Additionally, the indexes were modeled primarily on the static features of the human-water relationship, which are rarely used in research on the dynamic simulation of that relationship.
The human-water relationship is a coupling system composed of the interaction of the human and water systems (Mao et al., 2017; Gholizadeh Sarabi et al., 2021), which consists of multiple subsystems including society, economy, water resources, and ecological environment. While each subsystem follows certain evolution laws (Davies and Simonovic, 2011), they are mutually restricted, thus forming a complex larger system with numerous factors, complicated feedback relationships, and strong nonlinearity (Feng et al., 2018). SD has been extensively applied in hydrology and water resources because it is useful for handling high-order, nonlinear, and time-varying problems by virtue of its unique advantages. Scholars have also tried to study the dynamic simulation of the human-water relationship using the SD model (Xi and Poh, 2015; Zomorodian et al., 2018; Zuo et al., 2020a,b). For instance, Zhao proposed the theory of the human-water harmony regulation and realized the dynamic simulation and harmonious control of the human-water relationship based on an embedded SD model (Zhao, 2016). Van Emmerik et al. (2014) developed a social hydrology-based human-water system SD model to simulate the system’s coevolution process and explain the pendulum-like relationship between agricultural development in drainage basins and environmental health. Yang et al. (2019) performed a dynamic simulation and scenario analysis of the carrying capacity in the city of Xi’an by combining the SD model with a multi-criteria decision model on the theoretical foundation of water resources carrying capacity. The above-mentioned SD models have been constructed on different theoretical bases, given differences in research objectives and emphases.
Hence, against the background of ecological civilization construction and the implementation of the 2030 Agenda for Sustainable Development promoted in China, Ningxia served as a representative research region for this paper. In this study, a human-water system coevolution model catering to regional characteristics (i.e., natural resource endowment conditions such as water resource shortages and fragile ecological environments as well as backward socioeconomic growth) of Northwest China was established by coupling SD model and coevolution model from the theoretical perspective of complex system synergies. The coevolution trends of the human-water system were simulated using this model, aiming to optimize and regulate the human-water system and to seek a path to the more harmonious relationship between humans and water. This study therefore renders a decision-making basis for regulating regional water resources and seeking paths toward the more harmonious relationship between humans and water, which is of great theoretical and realistic significance for building important ecological safety barriers in Northwest China.
Each chapter’s details are arranged as follows: the profile of the research region and the acquisition of related data are introduced in Section 2. A human-water system coevolution model of Ningxia is established in Section 3. In Section 4, validation of the model and sensitivity analysis are offered, and the dynamic simulation results of human-water system coevolution under different regulation schemes are analyzed, future research opportunities and limitations are identified, and recommendations are proposed. Finally, in Section 5, conclusions are presented.
2. Study region and data sources
2.1. Research region
Ningxia is situated at the junction of the three Plateaus: Loess Plateau, the Mongolian Plateau, and the Qinghai-Tibet Plateau, covering an entire field of 66,400 km2 (Figure 1). Situated in the Northwest inland and the upper and middle reaches of the Yellow River, Ningxia belongs to an arid and semi-arid zone covering a variety of landforms, such as mountains, loess hills, irrigated plains, and deserts. Moreover, it is an important part of the “Loess Plateau-Sichuan-Yunnan ecological screen,” the “northern sand prevention zone,” and “other key ecological regions under point-like and massive distribution” in the national ecological safety strategic pattern composed of “two screens, three zones, one region, and multiple points,” being a significant ecological screen in western China. Surrounded by three major deserts, the Uulan Buh, the Tengri, and the Mu Us, this region is characterized by a fragile ecological environment, a water resource shortage, and serious soil and water loss. In the research region as a whole, the mean annual temperature and precipitation are 5.3–9.9°C and 14,949,000,000 m3 (Ningxia Water Conservancy, China, 2010–2021a). The natural surface water resources reach 949,000,000 m3 (accounting for only 0.03% of the national average level, water crossing the region from the Yellow River not being calculated). The annual water yield per square kilometer is 17,300 m3 (only 5.6% of the national average value), and the nationally distributed water quantity available from the Yellow River is 4 billion m3 (The People’s Government of Ningxia Hui Autonomous Region, 2021a). Ningxia is therefore one of the provinces in China with the lowest per capita water availability or water use per mu (mu is a unit of area, 1 hectare is equal to 15 mu) of cultivated land.
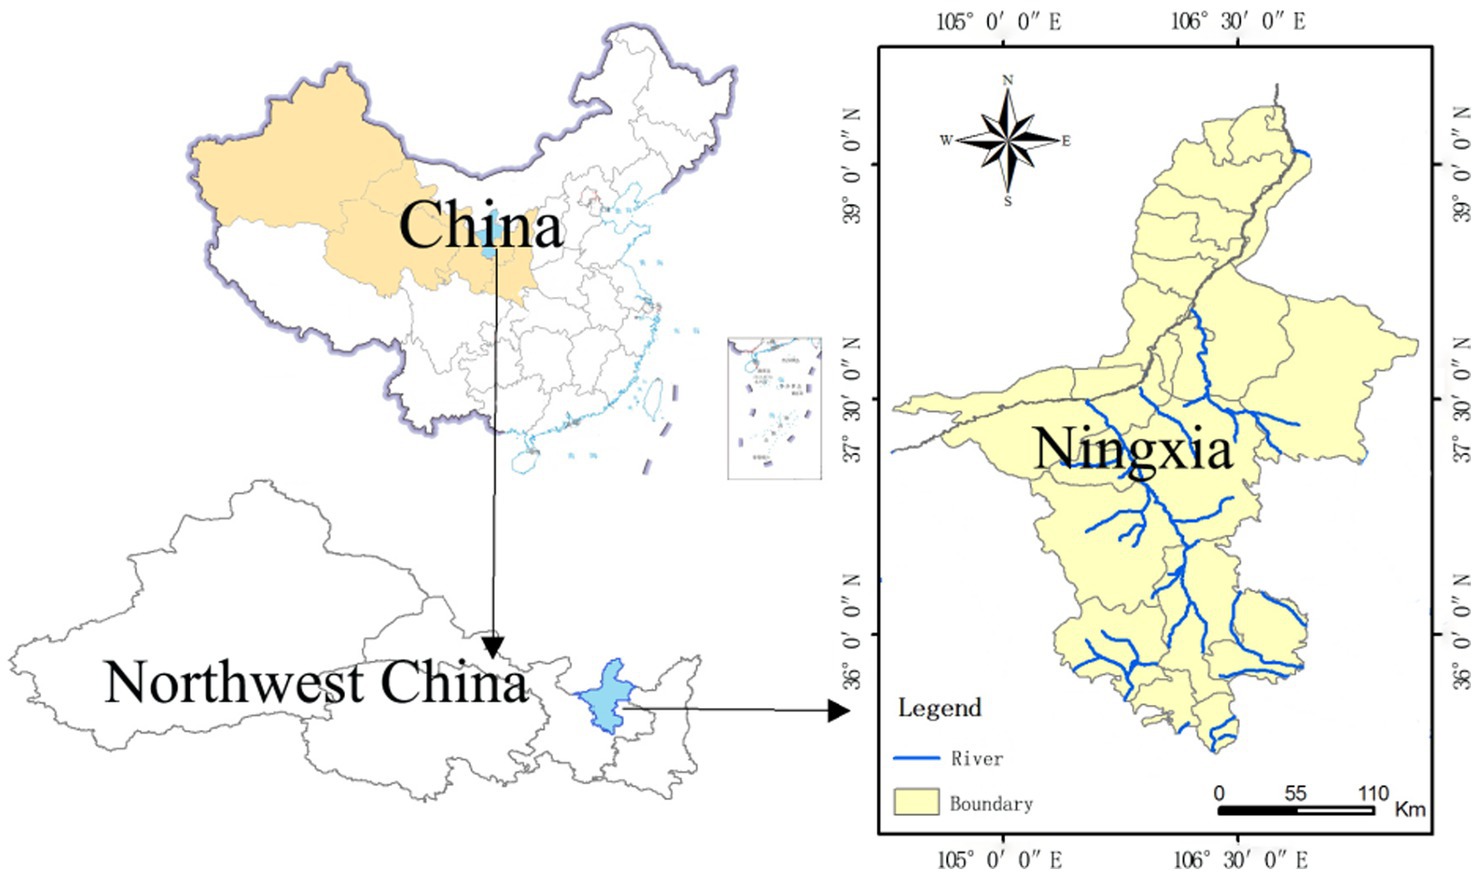
Figure 1. Location map of Ningxia.
As the whole region has witnessed continuous and rapid socioeconomic growth and aggravated environmental pressure, more and more conflicts have arisen between the need for economic growth and the need for population resources and environmental protection. By the end of 2020, the total population in the whole region was 7,209,000, with an urbanization rate of 65%. The regional GDP was RMB 392.1 billion, and the per capita GDP was RMB 54,528 (Ningxia Statistical Yearbook, 2021). The cultivated area was 18,015,000 mu, and the effective irrigation area of farmlands was 9,740,000 mu, while the irrigation rate for the cultivated land was only 40%. According to the China Water Report (Ministry of Water Resources of the People’s Republic of China, 2021), the per capita water use in the whole region was 962 m3, which was higher than the national average consumption (412 m3) and ranks second among Chinese regions. The water use per 10,000 yuan of GDP was 179 m3, which was higher than the national average (57 m3) and lower only than that in Xinjiang and Heilongjiang and even Tibet (Ningxia Water Conservancy, China, 2010–2021b). The water use per 10,000 yuan of industrial added value was 35 m3, which was 46% higher than the average value in the Northwest region and only lower than that in Gansu. The irrigation water use per mu of farmland was 591 m3, which was higher than the national average level (356 m3) and lower only than that in Hainan, Guangdong, and Guangxi. The water effective utilization coefficient for farmland irrigation was 0.543, which was lower than the average level in the Northwest region and below the national average. The usage of urban domestic water was 112 L/person per day, which was the average level in the Northwest region but lower than the national average.
2.2. Data sources
The socioeconomic and water resource data required in this study came from the Ningxia Statistical Yearbook (2010–2020) (Ningxia Hui Autonomous Region Bureau of Statistics, 2010–2020), the Ningxia Ecological Environment Bulletin (2010–2020) (Ningxia Hui Autonomous Region Department of Ecology and Environment, 2010–2020), the Ningxia Water Resource Bulletin (2010–2020) (Ningxia Water Conservancy, China, 2010–2021b), the Ningxia Statistical Bulletin of Water Conservancy (2010–2020) (Ningxia Water Conservancy, China, 2010–2021a) and the China City Statistical Yearbook (2010–2020) (China’s National Bureau of Statistics, 2010–2020). The water quota data came from Ningxia Water Quota for Different Industries (No. N [2014] 182). The data for planning years came from related national and regional development plans, such as the 14th Five-Year Plan of National Economy and Social Development in the Ningxia Hui Autonomous Region and Outline of 2035 Long-Range Objective (The People’s Government of Ningxia Hui Autonomous Region, 2021b) and the “14th Five-Year” Plan of Water Conservation in the Ningxia Hui Autonomous Region (Ningxia Water Conservancy, China, 2021) (hereinafter referred to as the “Plan”).
3. Model
The human-water system is a nonlinear, dynamic, and complex system with many variables (Kotir et al., 2016). The interactions between the influential factors in the human-water system can be qualitatively and quantitatively analyzed with the SD model. Referring to Xi and Poh (2015) and (Yang et al., 2019), and other studies, the SD model was combined with the multi-criteria decision-making model. On this basis, this research coupled the SD model with the coevolution model, which aimed to simulate the coevolution trends of the human-water system and realize the coordination and optimization of that system. Firstly, the SD model was constructed based on the theory of system dynamics. Specifically, we depicted the SD model’s flow diagram and established the model’s parameters, and simulated the evolution trends of the system over time. We selected control variables based on sensitivity analysis and designed regulation schemes. Then, based on the complex system synergy theory, the coevolution model of the human-water system was constructed. Specifically, we developed an index system using the indicators selected from the SD model. We then calculated the synergy index of the human-water system to analyze coevolution trends of the human-water system under different regulation schemes. A description of the modeling framework for this study can be found in Figure 2.
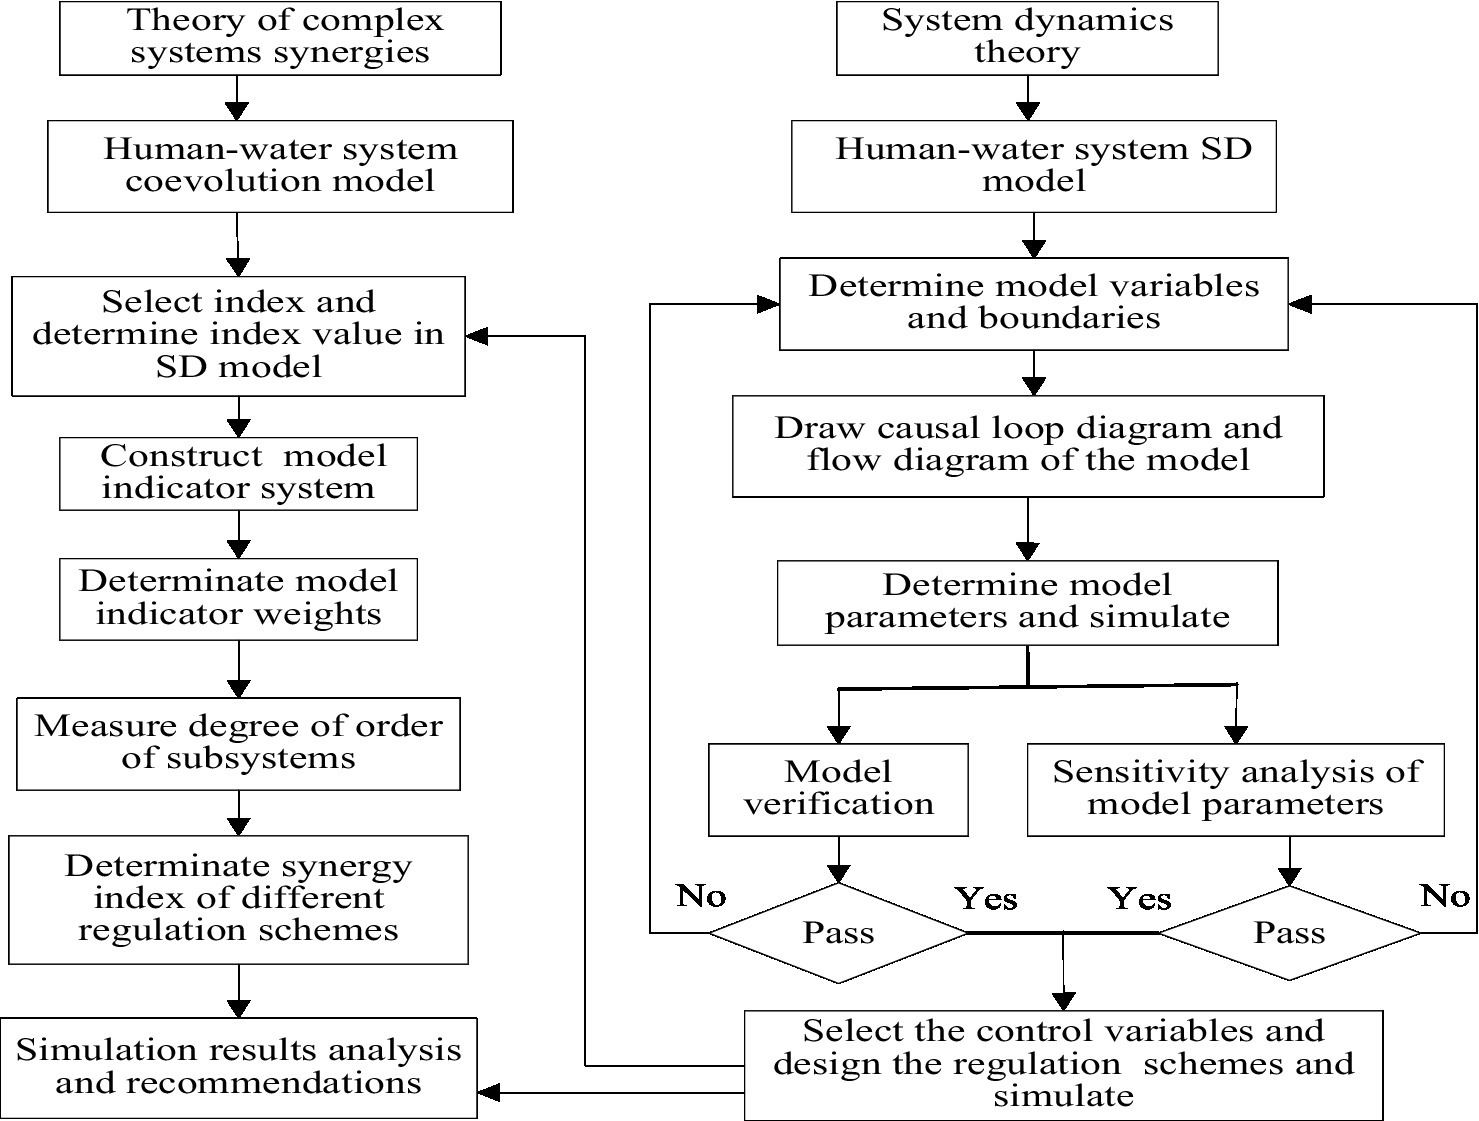
Figure 2. A flowchart illustrating the methodology of this study.
3.1. SD modeling of the human-water system
3.1.1. Model structure
The essence of SD modeling is to deconstruct the system and to provide a mathematical explanation of its internal interactions (Wang H. et al., 2022). Accordingly, the entire system was typically broken down into many subsystems, each of which was described separately (Dong et al., 2019). The model structure referred to the studies of Zhang et al. (2016), Li and Yang (2017), and Zhang et al. (2019). Based on the variation trend of the water supply–demand balance and the current socioeconomic status in the study region, simulations of human-water system coevolution trends were carried out. The human-water system in the study area was therefore separated into the water supply system and the water demand system, the latter being composed of water demand for domestic, agricultural, industrial, the tertiary industries, and the ecological environment. The SD model structure and causal feedback loop diagram of the human-water system in the study area are shown in Figure 3, Figure 4, respectively.
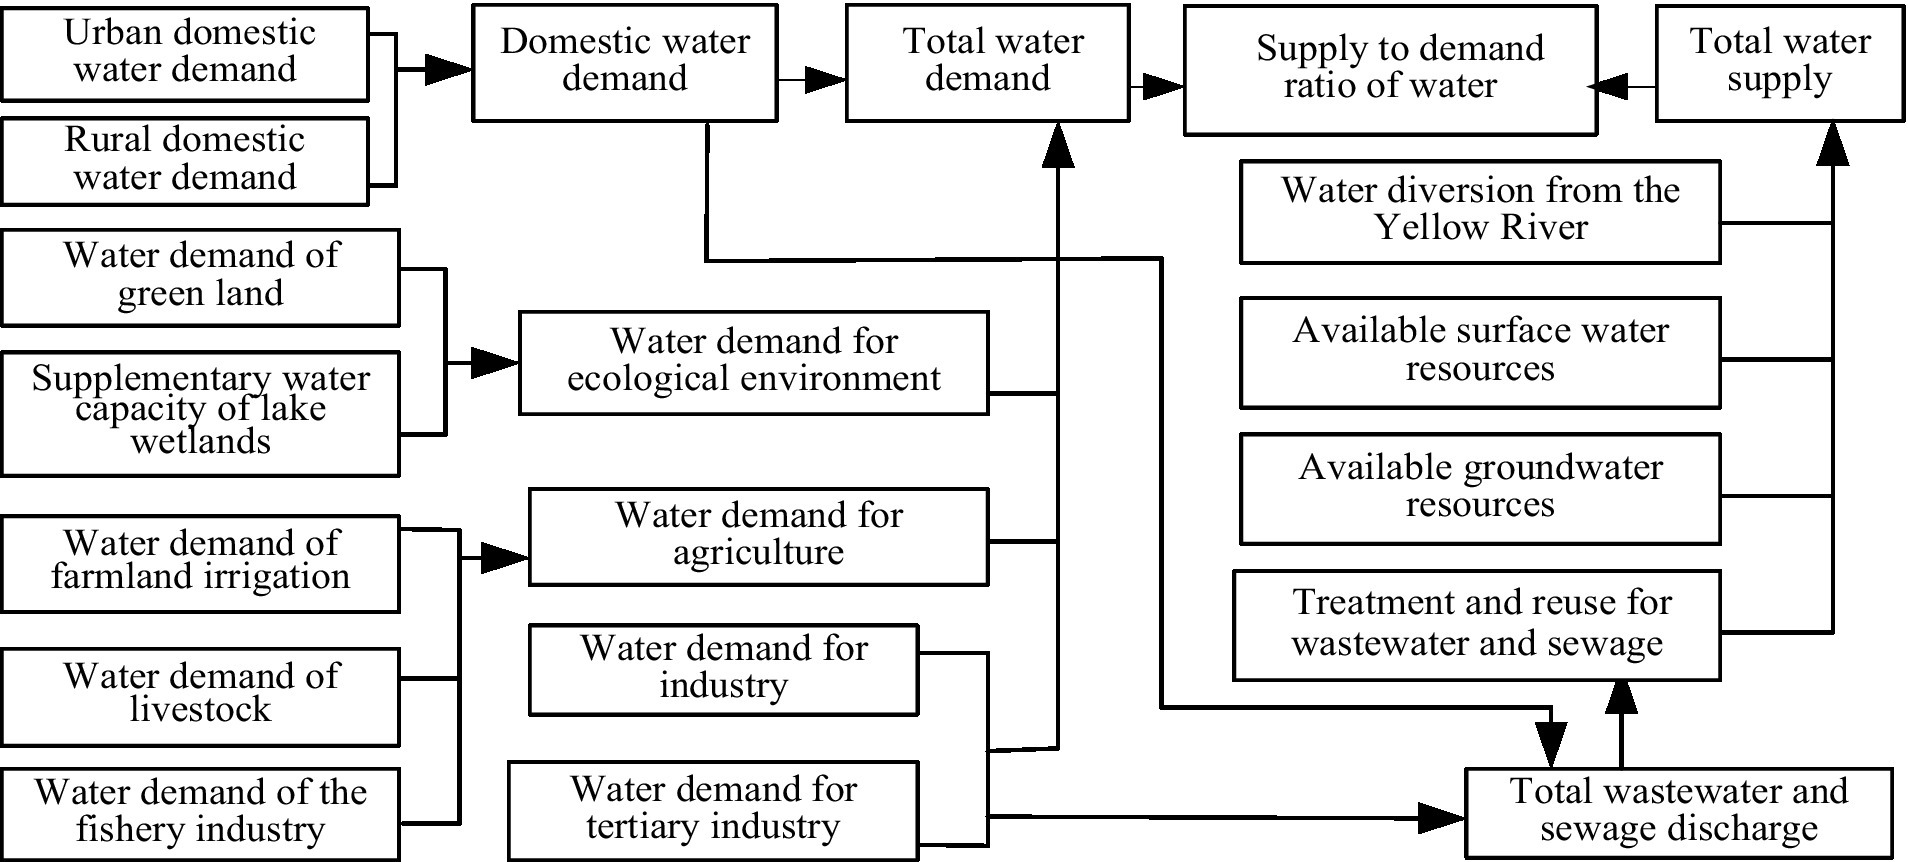
Figure 3. The structural relationship of human-water systems in Ningxia.
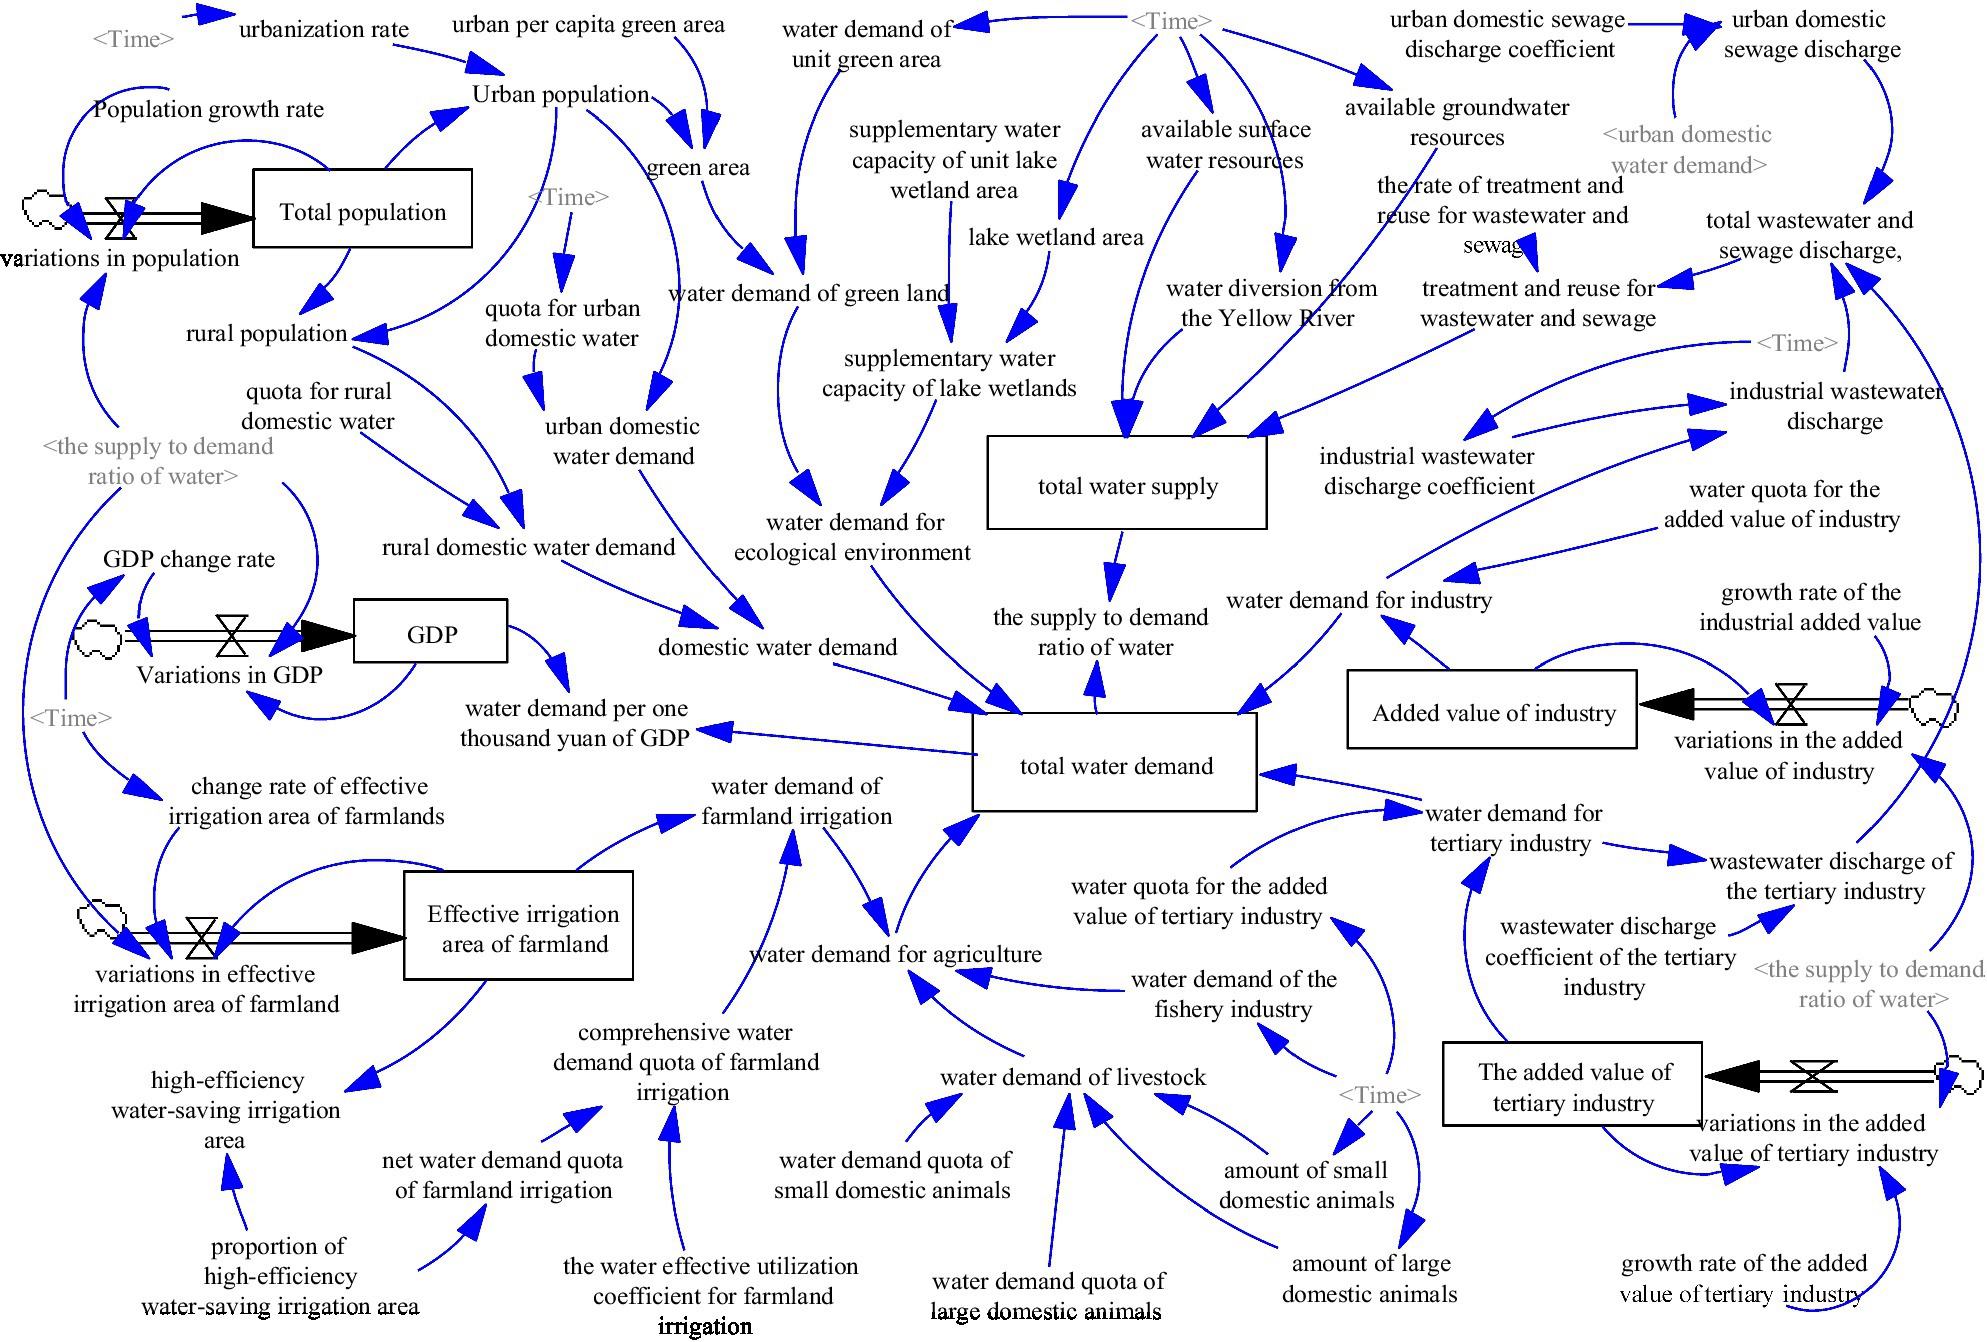
Figure 4. Dynamic flow diagram of human-water systems in Ningxia.
3.1.1.1. Water supply subsystem
For the research region, the water supply subsystem comprises four parts: local surface water, groundwater, water diverted from the Yellow River, and unconventional water supplies (Figure 3). According to the Plan in the study area, the water supply is, respectively, averaged over the next 10 years between 2010 and 2020. The unconventional water supply in the study region comes mainly from reuse for wastewater and sewage, and for this study it was therefore selected to represent the unconventional water supply. The amount of reuse for wastewater and sewage is affected by the total wastewater and sewage discharged, the discharge coefficient of wastewater and sewage, and the rate of treatment and reuse for wastewater and sewage (Figure 4). Improving the rate of treatment and reuse for wastewater and sewage can increase the overall water supply in the research region.
3.1.1.2. Domestic water demand subsystem
For the research region, the domestic water demand subsystem consists of urban and rural water demand (Figure 3), and both are determined by the product of the population and the quota for domestic water. The population figure is affected by the population growth rate and urbanization rate (Figure 4). Population growth influences an increase in domestic water demand and a drop in the supply to demand ratio of Motesharrei et al. (2016), which exerts a negative effect on the growth of domestic water demand, inhibiting the increase in population.
3.1.1.3. Agricultural water demand subsystem
For the research region, the agricultural water demand subsystem is composed of three elements: farmland irrigation water, livestock water, and fishery water (Figure 3). The water demand of farmland irrigation, which is determined by the product of the farmland effective irrigation areas and the farmland irrigation comprehensive water requirement quota, is influenced by three factors: the growth rate of farmland effective irrigation areas, the water effective utilization coefficient for farmland irrigation, the proportion of high-efficiency water-saving irrigation areas (Figure 4). The increase in farmland effective irrigation areas impacts the increase of agricultural water demand and the decrease of the supply to demand ratio of water, resulting in a negative feedback effect on the water demand for agriculture, which limits the growth of farmland effective irrigation areas. Additionally, the water demand for agriculture will also be reduced by improving the water effective utilization coefficient for farmland irrigation and the proportion of high-efficiency water-saving irrigation areas.
3.1.1.4. Industrial water demand subsystem
The water demand for industry, which is determined by the product of the industrial added value and water quota for industrial added value, is affected by industrial water efficiency and the growth rate of industrial added value (Figure 4). An increase in industrial added value affects water demand for industry as well as supply to demand ratio of water, which exerts negative feedback on industrial added value and inhibits water demand for industry. In addition, the water demand for industry will also be slowed by improving industrial water efficiency.
3.1.1.5. Tertiary industry water demand subsystem
The water demand for tertiary industry, which is determined by the product of the added value of tertiary industry and the water quota for added value of tertiary industry, is influenced by the growth rates in added value of tertiary industry and tertiary industrial water efficiency (Figure 4). A rise in the added value of tertiary industry impacts water demand for tertiary industry and the supply to demand ratio of water, which exerts negative feedback on the increase in added value of tertiary industry and inhibits the increase in water demand for that industry. Additionally, improving tertiary industrial water efficiency will also slow the rise in demand for water from the tertiary sector.
3.1.1.6. Ecological environment water demand subsystem
For the research region, the water demand for ecological environment is comprised of the supplementary water capacity from lake wetlands and the water demand of green land (Figure 3). The supplementary water capacity from lake wetlands is determined by the product of the lake wetlands area and the supplementary water capacity of unit lake wetlands area. The water demand of green land is determined by the product of green area and water demand per unit green area. Green area is affected by urban per capita green area and urban population. A rise in the urbanization rate increases the urban population (Figure 4), which impacts the increase in the green area. An increase in green space area impacts the water demand for ecological environment, as well as the supply to demand ratio of water, which restrains the growth in green areas.
3.1.2. Model boundary
In this research, factors that directly affect human-water system were demarcated within the boundary. As for the SD model for the human-water system in the study region, the spatial boundary was the administrative division boundary of Ningxia, the time boundary was 2010–2030, and 2010–2019 was the historical period of the model used to validate the model’s authenticity. With 2020 as the datum year, the situation from 2020 to 2030 was simulated at time steps of 1 year.
3.1.3. Determination of model parameters
The parameter values in the model were determined through four methods: (a) The parameters could be estimated based on the first-hand data (e.g., population growth rate, urbanization rate) of related statistical yearbooks, water resource bulletins, and water resource plans. (b) The parameters could be calculated using mathematical formulas according to the quantitative relations between variables in the model, such as the urban domestic sewage discharge coefficient, the rural domestic water demand quota, and the rate of treatment and reuse for wastewater and sewage. (c) The parameter values could be estimated by analyzing the mastered relevant professional knowledge, including per capita green area and quantity of livestock. (d) Statistical analysis approaches, such as the arithmetic mean method, could be used to set the parameter values based on data fitting the results with the end year unchanged, including the growth rate of industrial added value, lake wetlands area, and water demand per unit green area. For the choice of methods, the principle of the minimum simulation error was followed.
3.1.4. Establishment of model equations
Referring to the related research of Li et al. (2018), Zhang et al. (2019), and Zhao et al. (2021), according to the quantitative relationships between variables in the SD model structure above, a total of 51 equations were involved in the model. The names and units of the main variables in the model and the SD equations, restricted by the length limit of this paper, appear in Table 1.
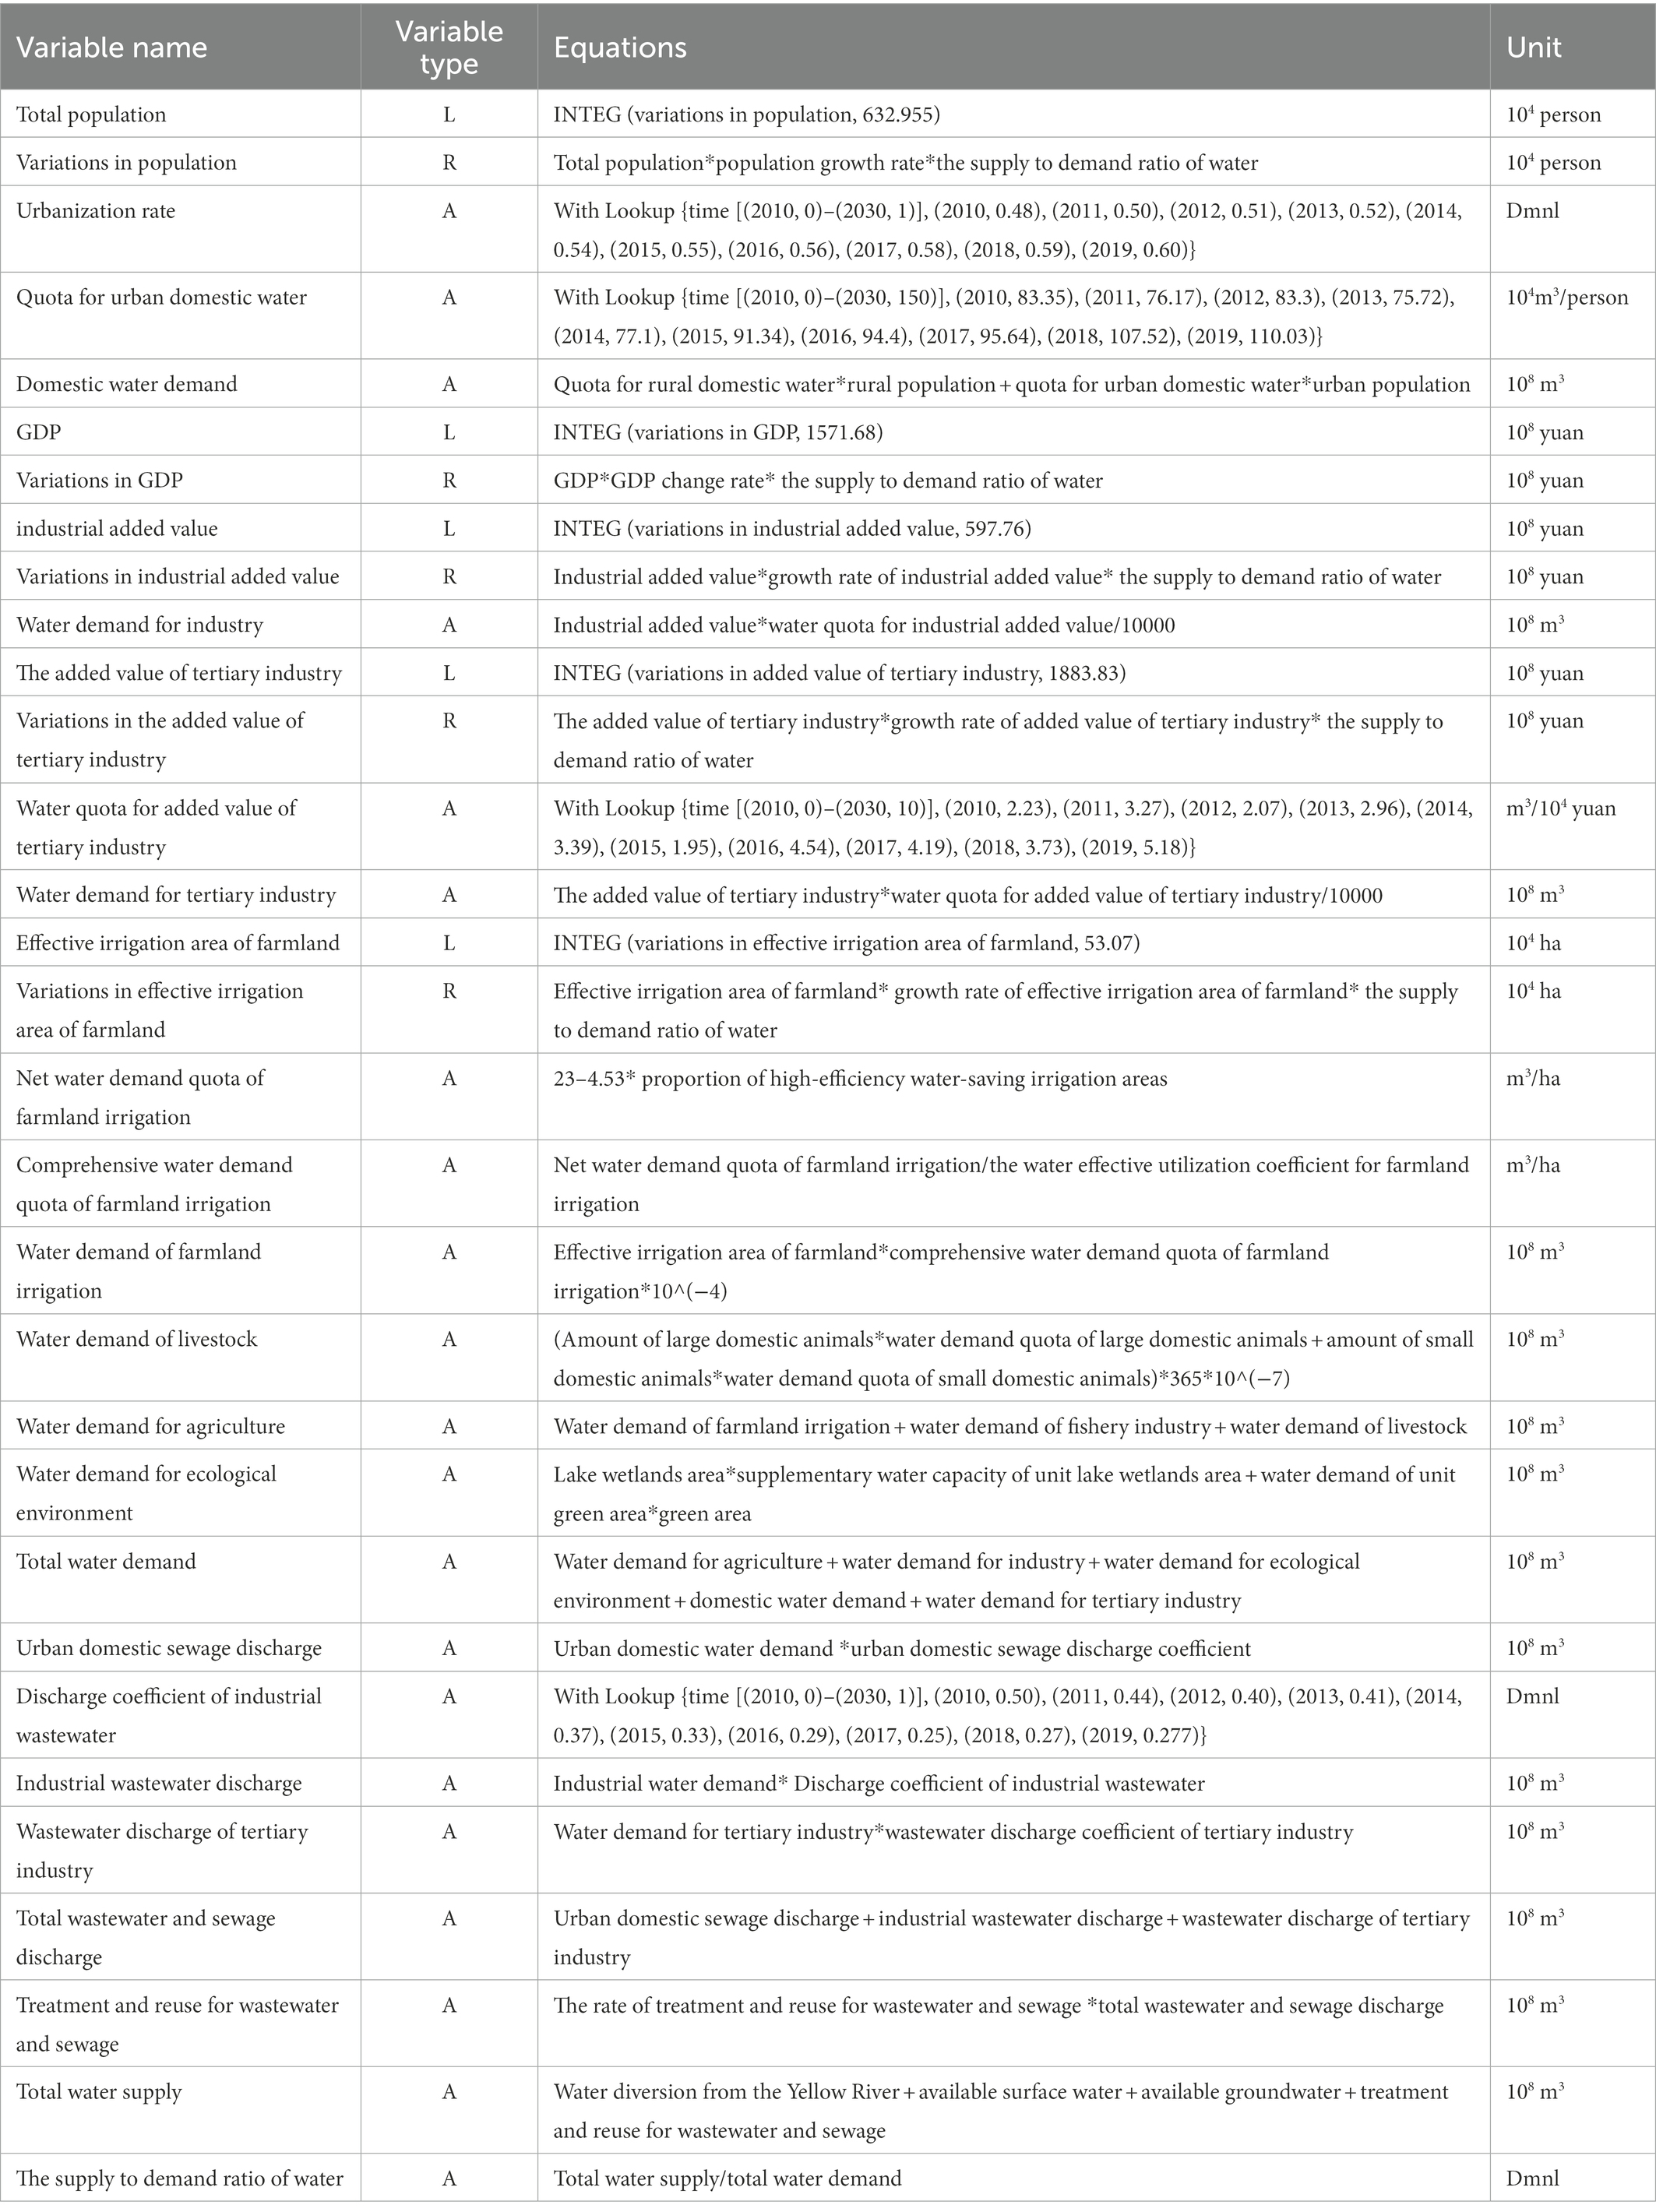
Table 1. The main variables and equations of the model.
3.1.5. Function introduction of Vensim software
Vensim software is a visual modeling tool that allows you to conceptulize, document, simulate, analyze, and optimize models of dynamic systems. There are three key steps in the process of dynamic simulation using Vensim software (Wang X. et al., 2022): (1) determine the causal relationship of variables by drawing causal loop flow diagrams; (2) quantitatively describe the relationship among SD model variables by establishing mathematical equations; and (3) input the historical data of SD model variables into the Vensim software to simulate the changes of the variables under different regulation schemes.
3.1.6. Validation of the model and sensitivity analysis
3.1.6.1. Model verification
The validity of the constructed model must be checked to ensure that the model structure and behaviors are largely consistent with the physical truth. Comparing the relative errors between the simulated and true data of the model is performed using historical data, thus verifying whether the model can reasonably and effectively represent the practical situation.
3.1.6.2. Model sensitivity analysis
The model sensitivity analysis is performed to determine which parameters strongly influence model dynamic behavior (Kotir et al., 2016) and, consequently, policy initiatives might be guided by it or centered around it in the future (Sušnik et al., 2012). The sensitivity analysis function in Vensim software was used to test the sensitivity of model’s parameters. Specific steps are described as follows. Firstly, a sensitivity test interval is set for each parameter, or an interval value is set based on future development potential (Van Emmerik et al., 2014), at the same time, the other parameters value remain unchanged. Secondly, the sensitivity interval of each parameter and the target state variable are input into Vensim software by using the sensitivity analysis function of Vensim. Finally, the graph output of the parameter sensitivity is observed to determine the sensitivity of the parameter to the target state variable. Graphic functions show that different colors denote different levels of confidence: yellow denotes a 50% level of confidence; green, a 75% level of confidence; blue, a 95% level of confidence; gray, a 100% level of confidence (Jia et al., 2021). A wider sensitive band and a larger area indicate a higher sensitivity of the parameter to the target state variable, which yield up references for the design of subsequent regulation schemes.
3.2. Establishment of the human-water system coevolution model
Based on the theory of complex system synergies (Robèrt et al., 2002; Ören and Yilmaz, 2012; Cui et al., 2020), the synergy index of a system indicates the degree of harmony among its subsystems under the action of the internal self-organization of the system as well as adjustment and organization from outside it. The index represents the tendency of the system to transform from disorder to order, and the progress of the self-organization in constantly evolving toward improvement. The mechanism of the system transforming toward order depends on neither the balance of the system nor its distance from the equilibrium state, both of which lie in the interactions between subsystems of the system. Such interactions affect the phase transition characteristics and laws of the system. The variables at the phase transition point of the system are also called the order parameters of the system and are vital players in the system’s evolution (Liu et al., 2011). For this reason, the concept of degree of order in synergies was used in this study to construct the state function of order parameters, representing the measure of the order or disorder of subsystems. According to the degree of order of subsystems, a synergy evaluation model was constructed, with the degree of order of each subsystem as the cofactor and the synergy index as the efficiency function of interactions between subsystems. Finally, the mechanism of system coevolution was disclosed based on the synergy index of the system during different periods.
3.2.1. Construction of model indicator system
Constructing an indicator system, or the selecting order parameters (indicators) that can characterize the information in the system, is crucial to establishing the human-water system coevolution model. Northwest China is a typical human-water system, which is coupled with many factors, including water, socioeconomic factors and ecological factors. In light of the regional characteristics of the research region, including water resource shortages, fragile ecological environments, and backward socioeconomic growth, an evaluation indicator system should therefore reflect the synergy level between the development and utilization of water resources and the socioeconomic growth as well as ecological environment protection.
For this study, a set of indicators were obtained in accordance with the principles of scientific validity, dynamics, availability, and independence. With reference to relevant literature in China and foreign countries (Kang et al., 2014; Xu et al., et al., 2016; Bao and Zou, 2018; He et al., 2018; Yang et al., 2019) and considering efficiency indicators and gross indicators, the human-water system was classified into three subsystems: socioeconomic subsystem, water resources development and utilization subsystem, and ecological environment subsystem. Through frequency statistical analysis of relevant literature, variables were then screened from the SD model of the human-water system. An evaluation indicator system of human-water system consisting of 18 evaluation indicators was initially constructed (see Table 2).
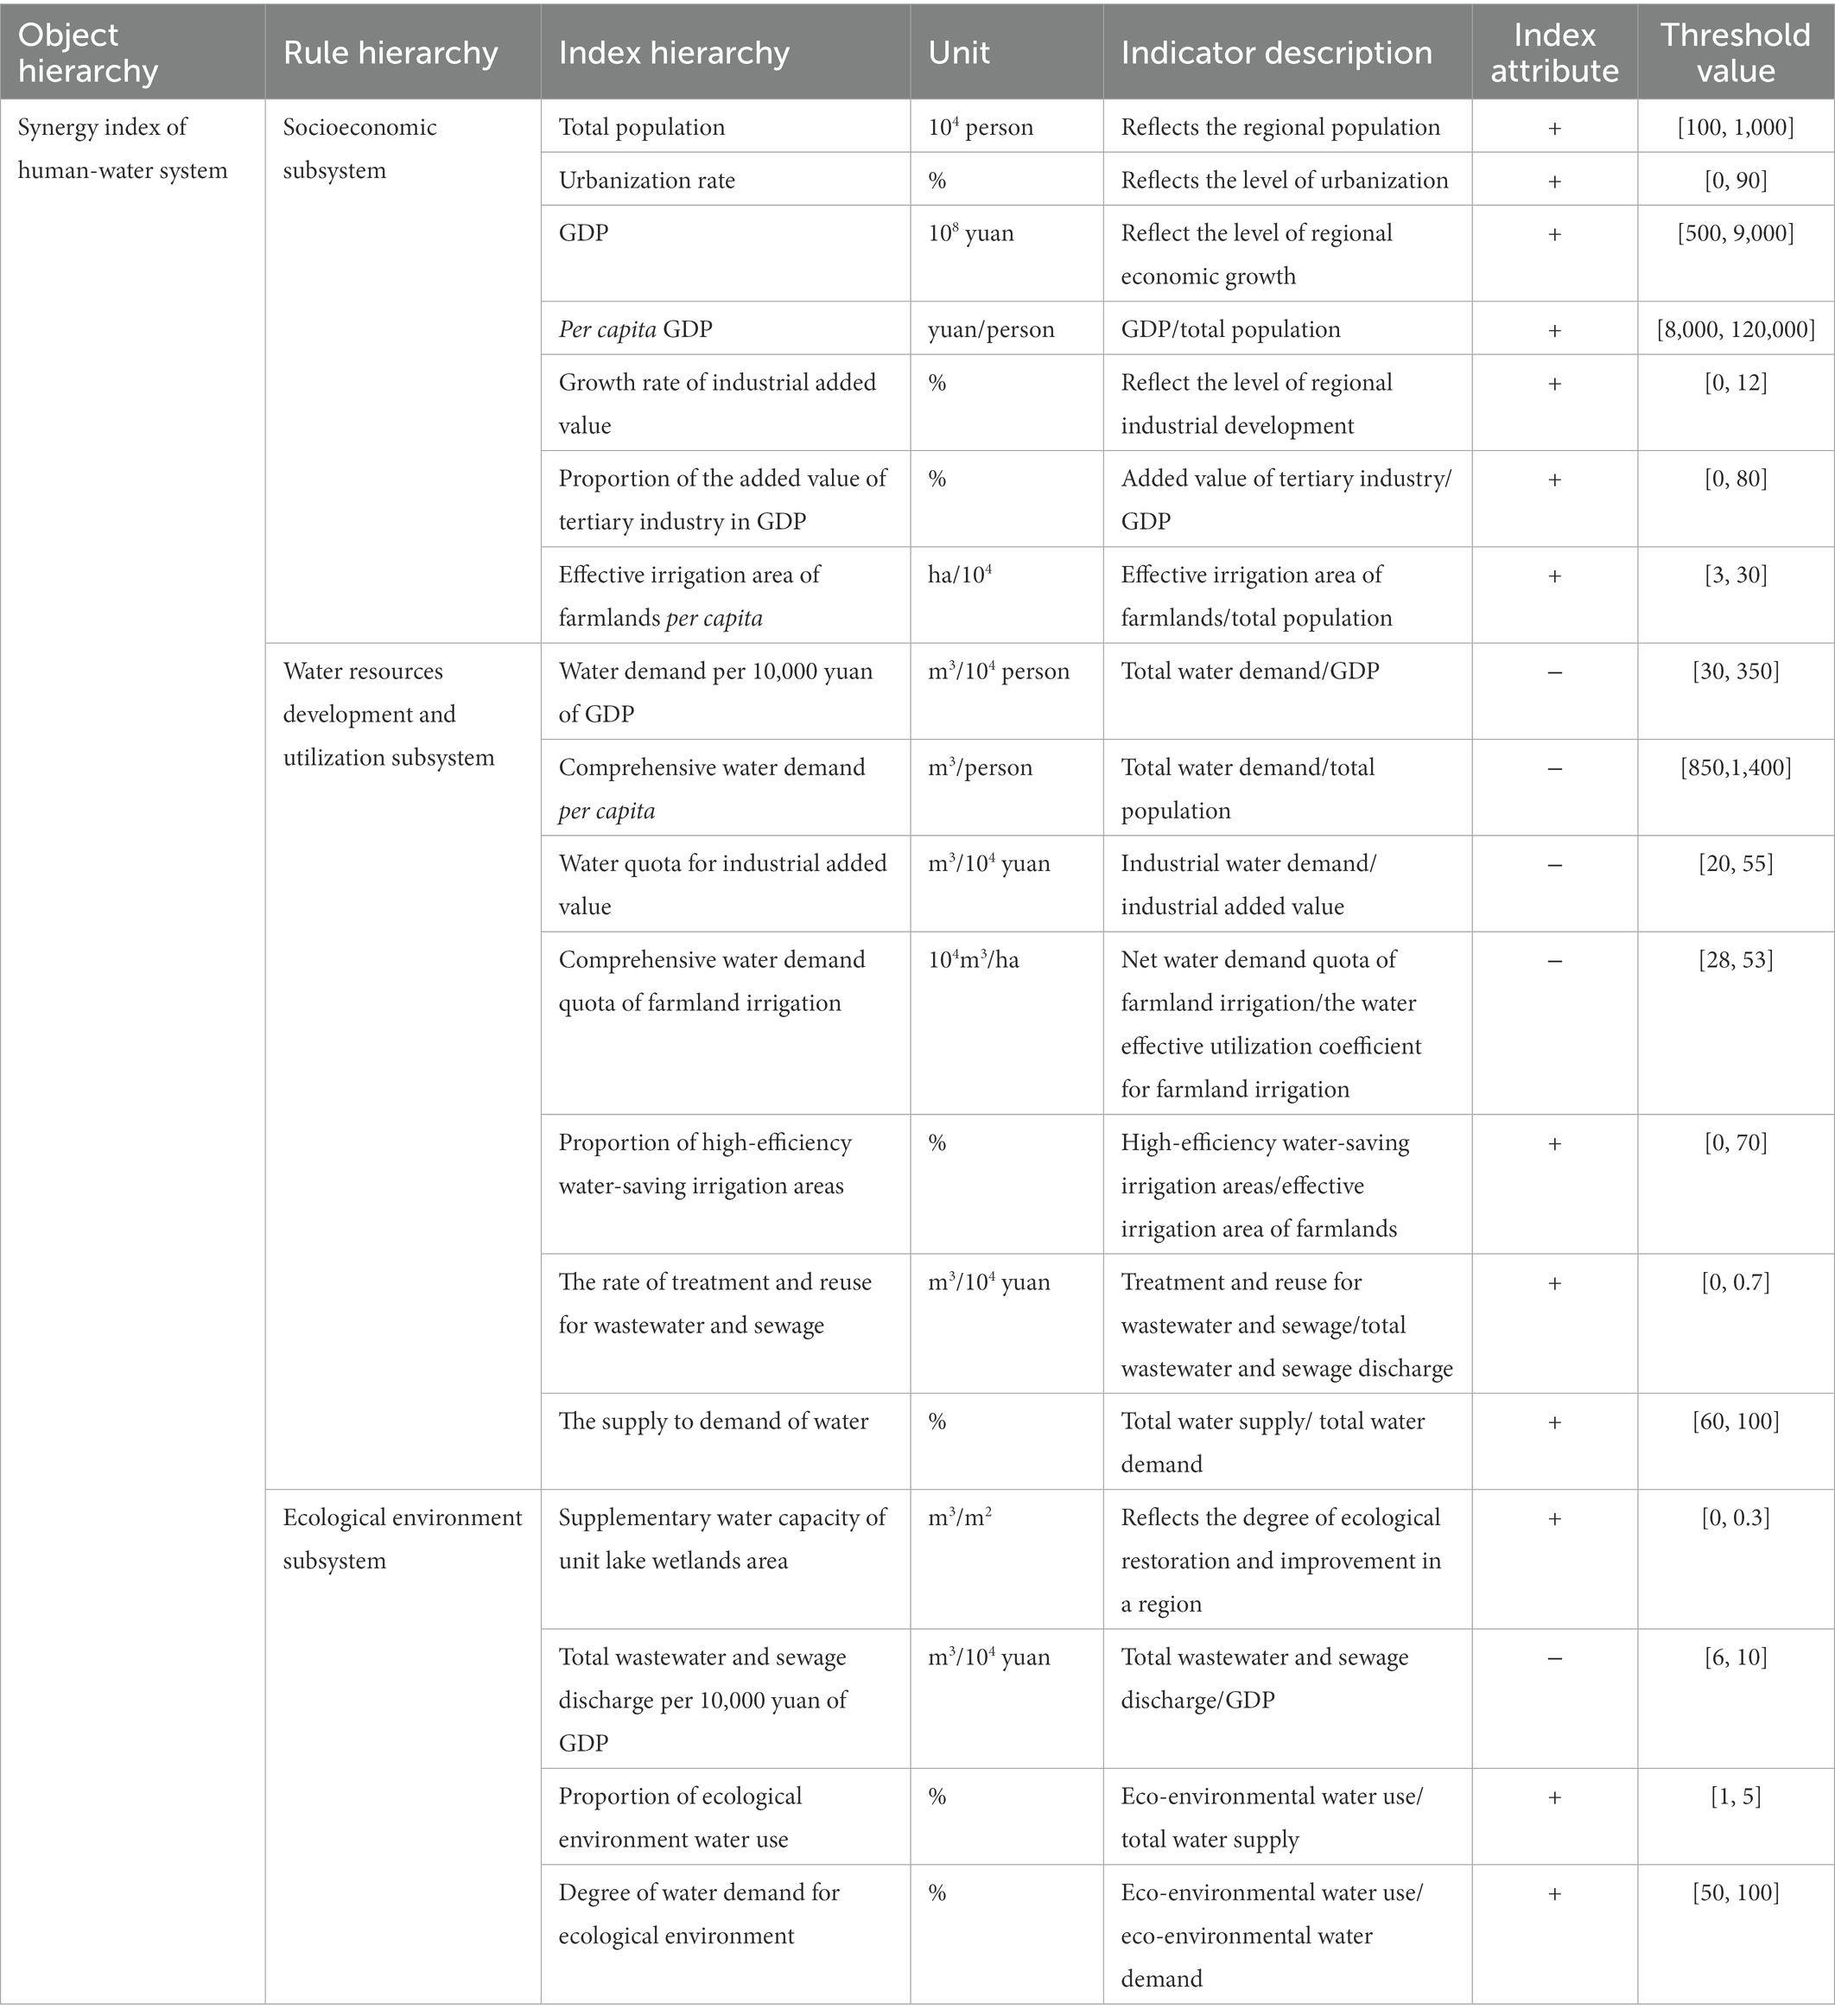
Table 2. Indicator system of human-water system coevolution model.
3.2.2. Determination of model indicator weights
The precision of the evaluation outcomes are directly affected by the rationality of indicator weights determined in a comprehensive evaluation. In this study, the indicator weights of each subsystem of the human-water system were determined through the method of subjective weighting in combination with objective weighting. The combined weight formula is as follows (Bao and Zou, 2018):
where represents the combined weight of the ith subsystem (socioeconomic, water resources development and utilization, and the ecological environment subsystem). stands for the weight of the ith subsystem that is obtained by the entropy method, and stands for the weight of the ith subsystem that is obtained by the analytic hierarchy process. The entropy method and the analytic hierarchy process used to determine indicator weights were described in the discussion of relevant literature (Arief et al., 2017).
3.2.3. Determination of the degree of order of subsystem
The j (j = 1, 2, ……, nth) order parameter of the subsystem was set as ( being the number of order parameters of the ith subsystem). The degree of order of the subsystem was then calculated according to Eq. (2) (Liu et al., 2014), using the principle of membership degree from fuzzy mathematics. A larger order parameter indicated a better type (Liu et al., 2017). Next, the degree of order was calculated according to Eq. (3) (Bao and Zou, 2018). The smaller the order parameter, the better the type. The degree of order was calculated according to Eq. (4) (Bao and Zou, 2018).
In Eq. (2), is the degree of order of the ith subsystem; is the weight coefficient of the order parameter , denoting the role of the jth objective in ensuring the orderly operation of the subsystem; is the degree of order of the jth order parameter of the ith subsystem, usually ; and is the threshold of the order parameter .
The indicator (order parameter) values of the subsystems of the human-water system coevolution model from 2020 to 2030 were acquired from the simulation results of the SD model for the human-water system. It was emphasized that human-water system coevolution is a dynamic process in this study. The degree of order of subsystems and the synergy index of the whole system were relative values, and the thresholds were selected according to the extreme values of indicators.
3.2.4. Measurement of the synergy index of the human-water system
The overall degree of order of the system depended on both the synergetic orderliness in subsystems and the degree of synergy between subsystems; that is, it depended on the comprehensive performance of the synergy index. Therefore, simulating the human-water system coevolution situation referred to studying the synergy indexes of the three relevant subsystems in different periods. Following are the formulas employed to calculate the synergy index (Liu et al., 2014):
In Eqs (5) and (6), and are the information entropy and synergy indexes of the system, respectively; is the degree of order of subsystems; and is the maximum information entropy, meaning that the system is in its most chaotic and disordered state. The dynamic change of can identify the coevolution and development directions of the system: a larger number for suggests a larger synergy index, signifying a higher degree of coevolution of the system, while a smaller number for indicates a smaller synergy index, implying a lower degree of coevolution of the system, on the basis of which the coevolution situation of the human-water system is simulated.
3.3. Scheme design
Referring to the studies of Yang et al. (2019), Wang H. et al. (2022), and Wang X. et al. (2022), this study designed a total of five regulation schemes to simulate the co-evolution trends of the human-water system, according to the Plan as well as national development strategies. Various control measures were considered in the study region, such as enhancing water efficiency, adjusting industrial structures, and improving water use for ecological environment.
3.3.1. Status continuation scheme
The status continuation scheme was employed to model the coevolution trends of the human-water system under the current social development pattern, to facilitate comparisons with the other schemes. The parameter values of control variables therefore remained unaltered.
3.3.2. Environmentally friendly scheme
Aside from the benchmark control variable parameters, the supplementary water capacity of the unit lake wetlands area was included as the major control variables of the environmentally friendly scheme. This scheme design is mainly based on the current socioeconomic growth situation and Plan’s requirements of “improving ecological water, guaranteeing domestic water, and saving production water.”
3.3.3. Industrial structures adjustment scheme
On the basis of the benchmark control variable parameters, this study takes the growth rate of industrial added value and the growth rate of tertiary industry as the main control variables of the industrial structures adjustment scheme. This scheme design is mainly based on the Plan’s requirements of “taking water resources carrying capacity as the boundary of socioeconomic growth, restricting the operation of cities, industries, land and population within the boundary, conducting industrial structures adjustment, and building a high-end, green, intelligent and integrated modern industrial system.”
3.3.4. Water conservation and pollution prevention scheme
Along with the benchmark control variable parameters, the water effective utilization coefficient for farmland irrigation, the proportion of high-efficiency water-saving irrigation areas, the water quota for industrial added value, and the rate of treatment and reuse for wastewater and sewage were taken as major control variables of the water conservation and pollution prevention scheme. This scheme design is mainly based on the goal requirements stated in the Plan that declared that “by 2025, the water effective utilization coefficient for farmland irrigation will rise to 0.6 in the whole region, the proportion of high-efficiency water-saving irrigation areas will be increased to 55%, water quota for industrial added value will drop to 29 m3, the urban treatment rate of wastewater and sewage will be 100%, and the reuse rate of reclaimed water will be 50%.”
3.3.5. Comprehensive optimization scheme
Taking into account the benchmark control variable parameters, the control variables of the comprehensive optimization scheme were designed by integrating all control variables in the environmentally friendly scheme, the industrial structure adjustment scheme, and the water conservation and pollution control scheme, which were the same as those in the three schemes previously mentioned.
4. Results and discussion
4.1. Validation of the model and sensitivity analysis results
4.1.1. Verification of model validity
Eight key variables were used to verify the validity of the model (including total population, GDP, and industrial added value) in 2010–2019 in the SD model (see Table 3). By comparing the simulated data to the historical data, the relative error of the variables was determined. According to the results, all eight key variables of the model had relative errors less than 10%, indicating a good simulation effect. Therefore, the model could be used to simulate the coevolution trends of the human-water system in Ningxia.
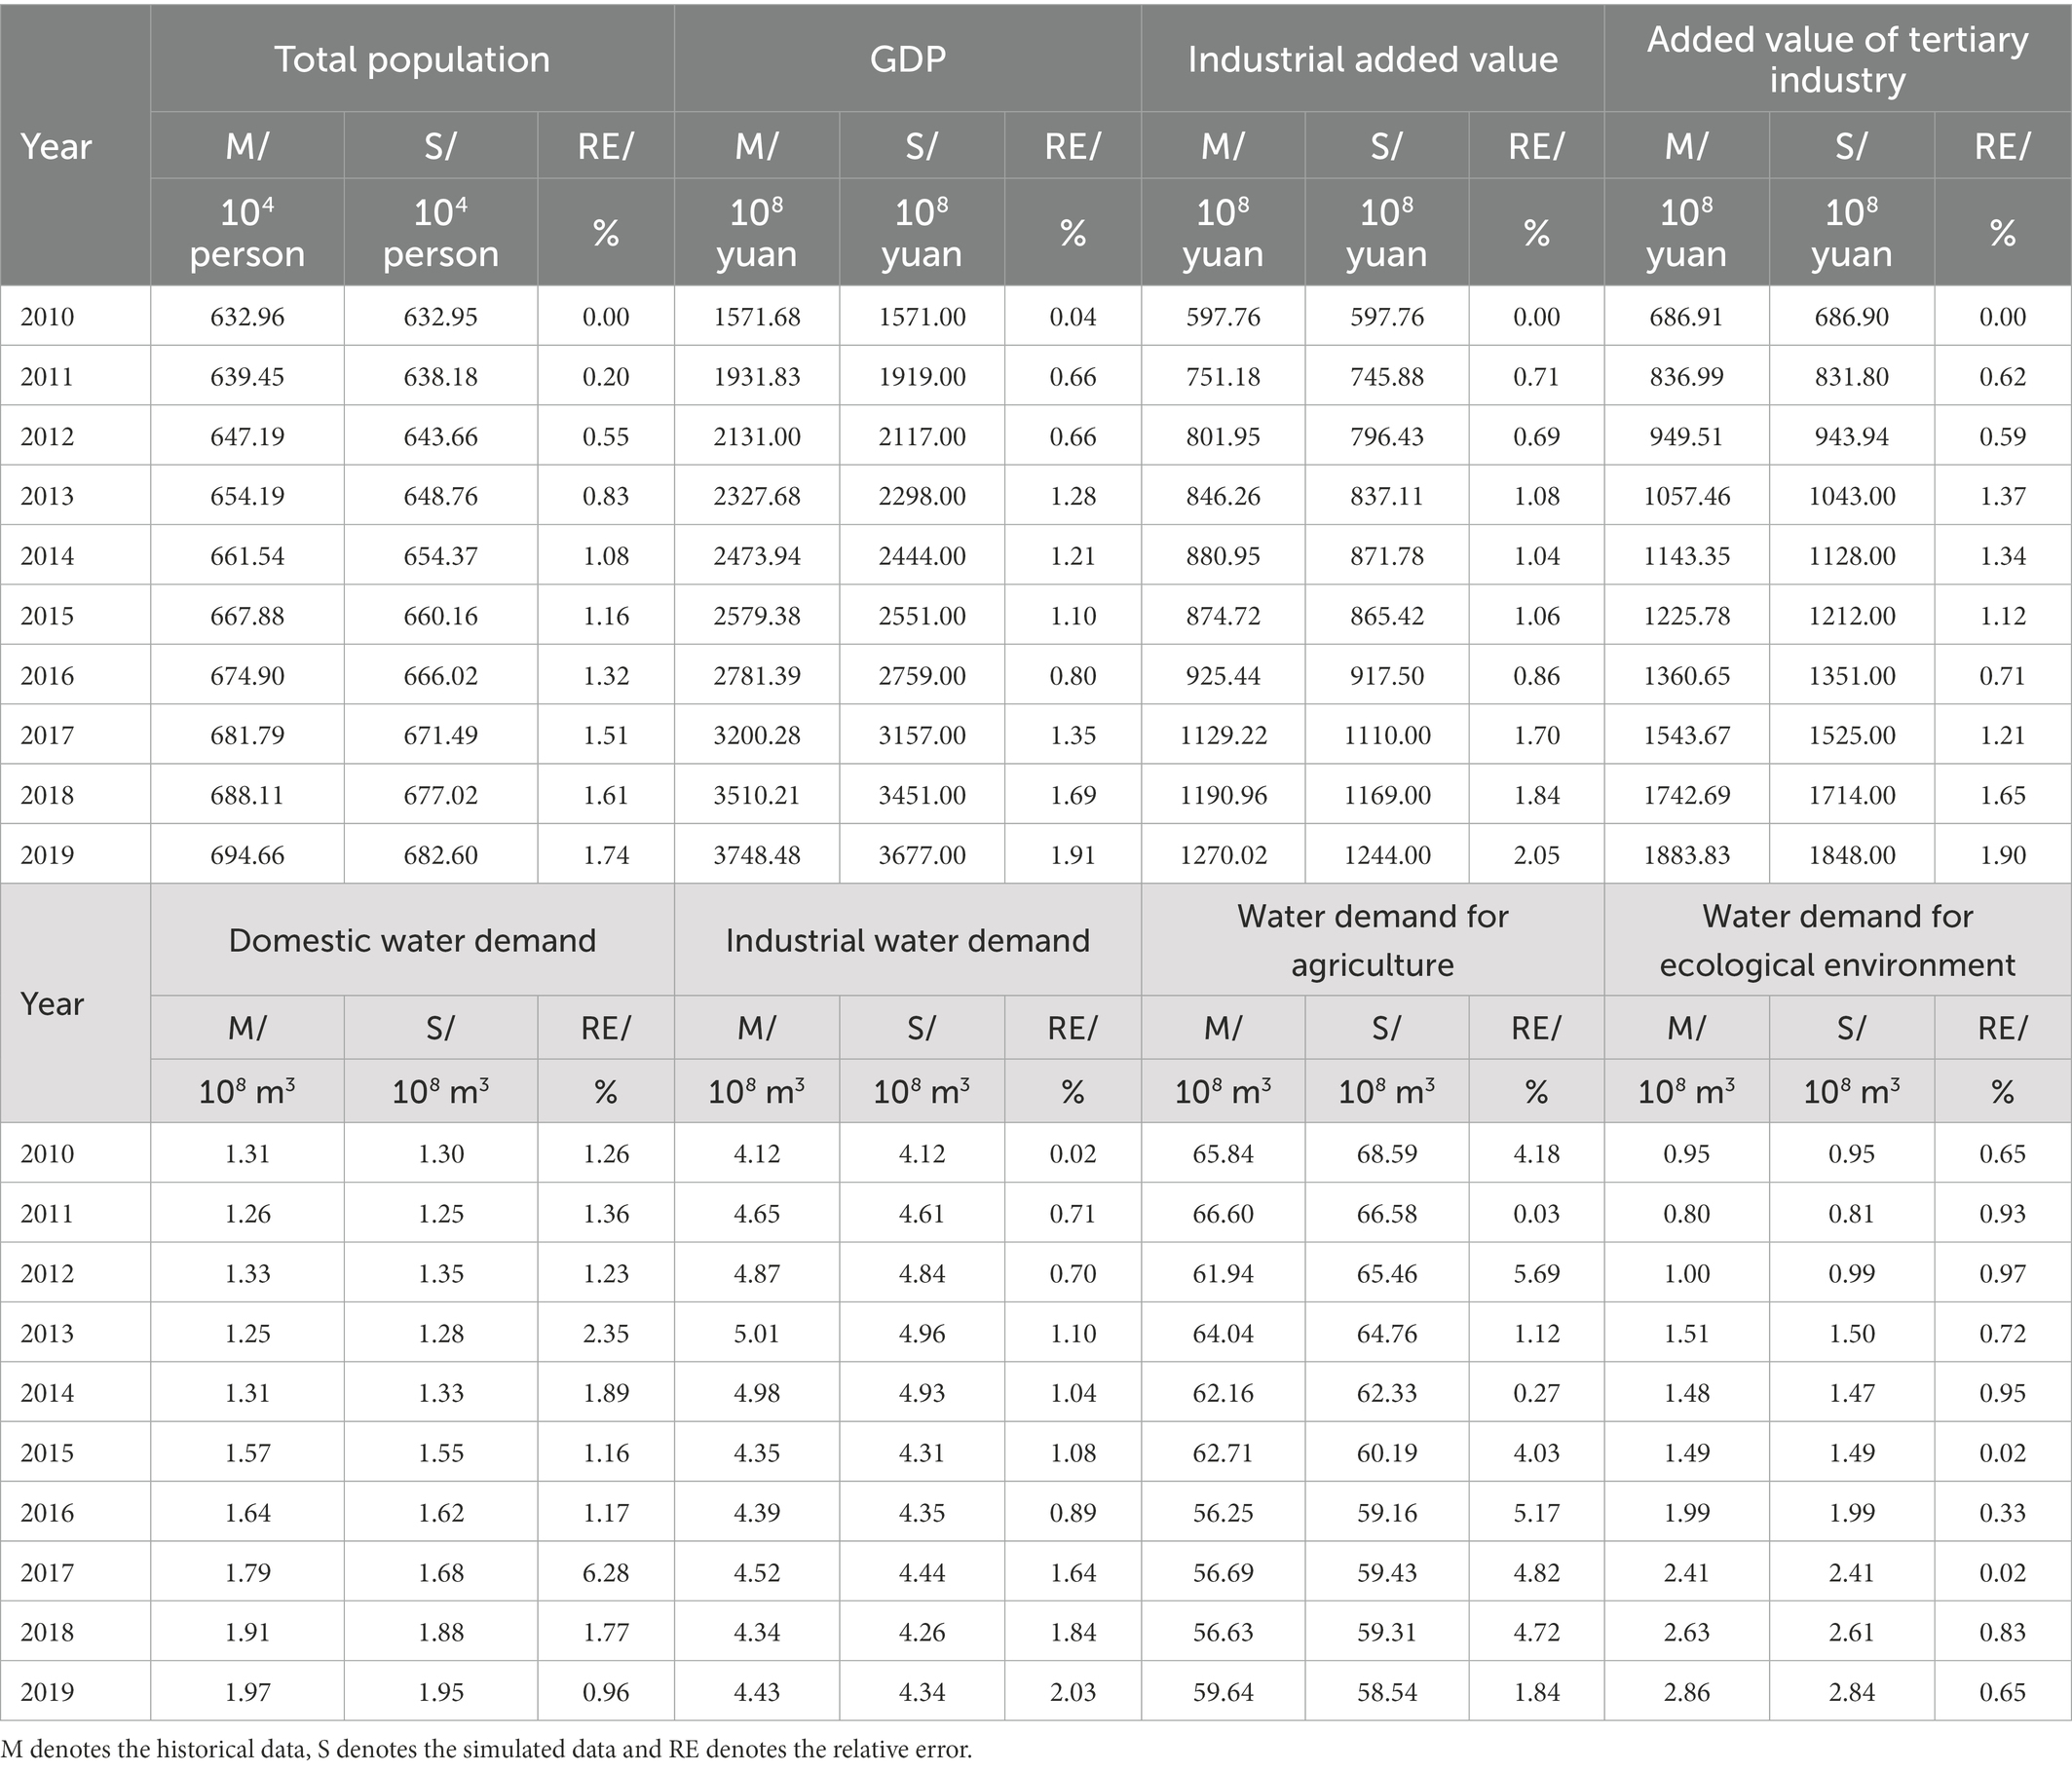
Table 3. Test results for model validity.
4.1.2. Model parameter sensitivity analysis results
The supply to demand ratio of water was the target of the sensitivity analysis in this study. The sensitivity analysis function in Vensim software was used to test the sensitivity of each parameter. The sensitivity test interval for each parameter was set to increase or decrease by 50%, or an interval value was set based on future development potential. The effect of the changes in each parameter value in the sensitive range on the supply to demand ratio of water was observed. By comparing the sensitive band, the wider the sensitive zone is, the larger the area is, which means that the parameter has a greater influence on the water supply and demand ratio. Finally, 7 parameters with a greater influence on the water supply and demand ratio are identified, which also indicates that the parameters have a strong influence on the model behavior. Table 4 and Figure 5 illustrate the sensitivity analysis interval settings and selected parameters, respectively.
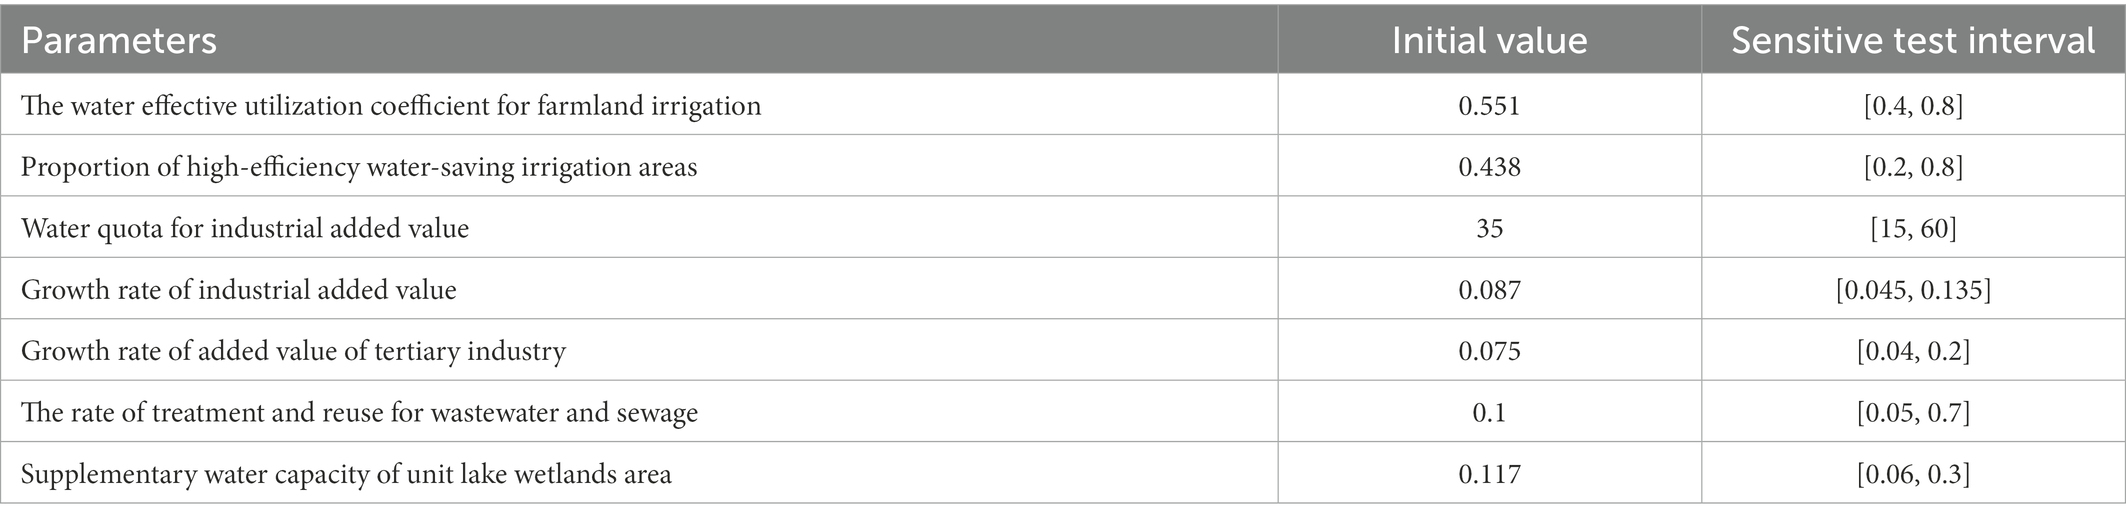
Table 4. Parameter sensitivity analysis interval setting.
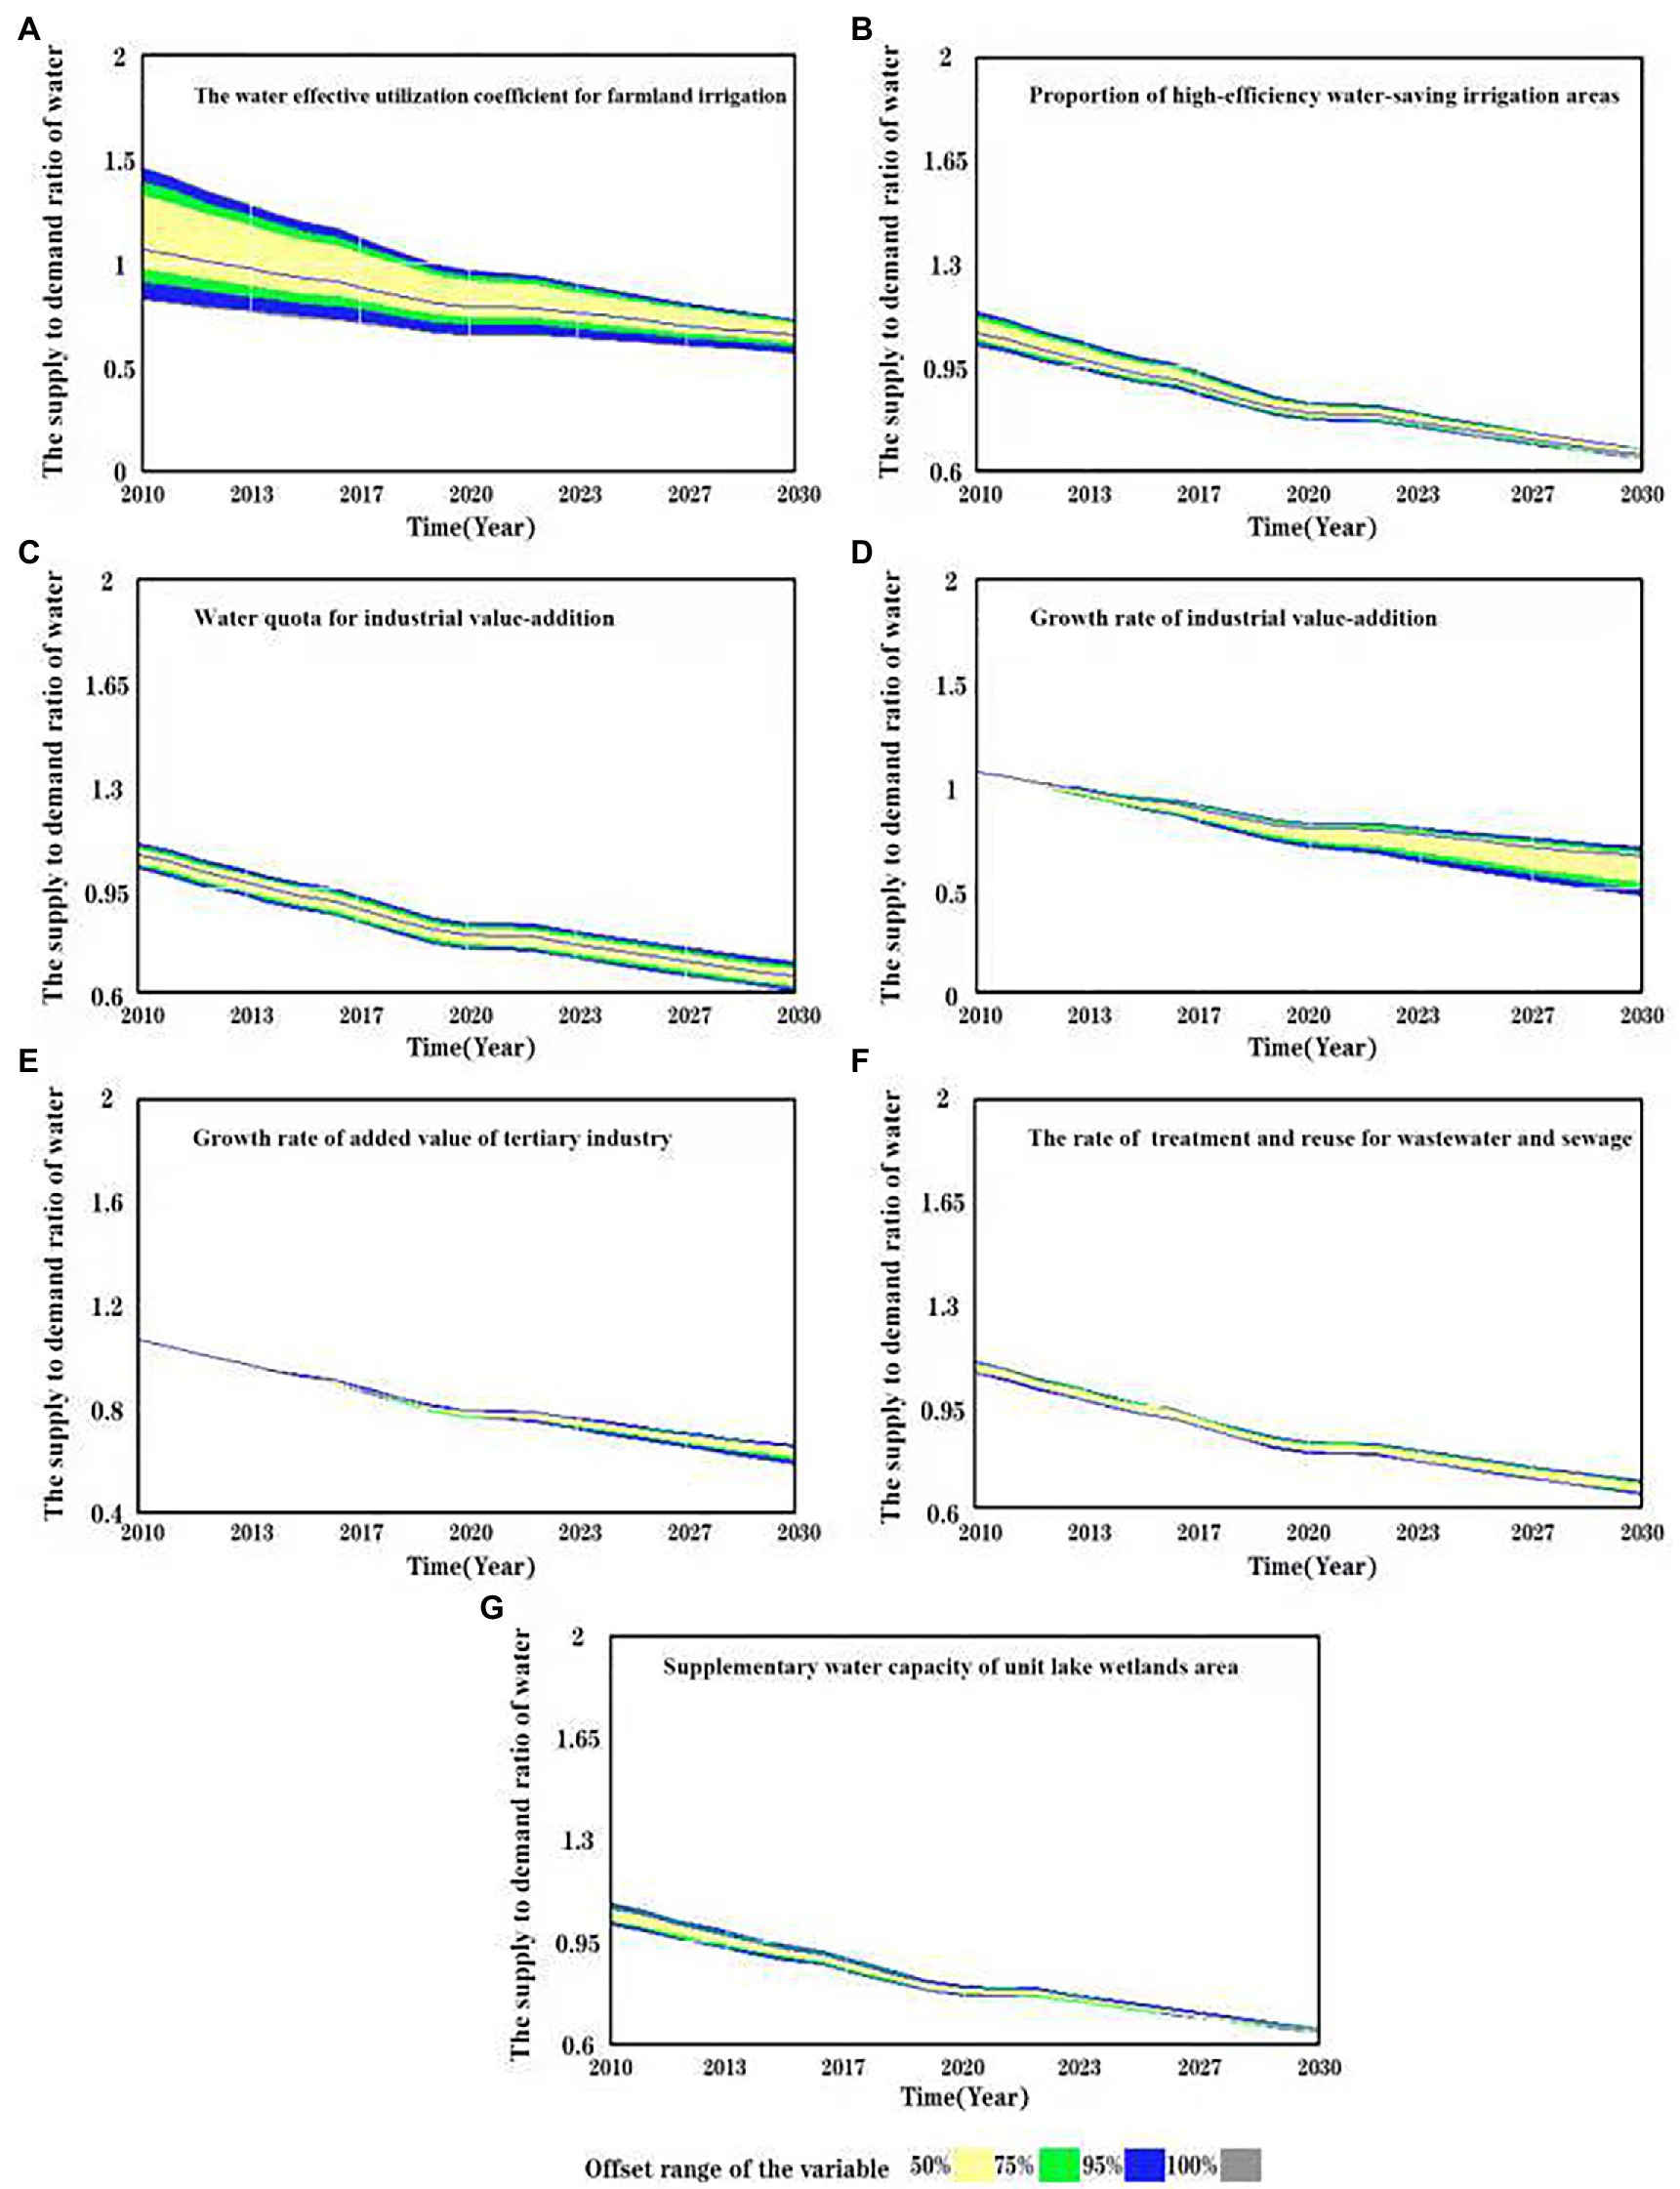
Figure 5. An analysis of the sensitivity to seven parameters on the supply to demand ratio of water. (A) The water effective utilization coefficient for farmland irrigation. (B) Proportion of high-efficiency water-saving irrigation areas. (C) Water quota for industrial value-addition. (D) Growth rate of industrial value-addition. (E) Growth rate of added value of tertiary industry. (F) The rate of treatment and reuse for wastewater and sewage. (G) Supplementary water capacity of unit lake wetlands area.
4.2. The simulation results under different schemes
According to the results of the sensitivity analysis, the parameters affecting the human-water system were selected as control variables in this study. The scheme was set by adjusting the parameters of the SD model. Particularly, the parameters were developed in consideration of the state of development of the region as well as relevant planning for the research region. The specific control variable parameter values appear in Table 5.
This study simulated the coevolution trends of the human-water system under five different regulation schemes. Utilizing Vensim software, the schemes were simulated based on the aforementioned descriptions. The synergy index of the human-water system was obtained from 2020 to 2030 (Figure 6).
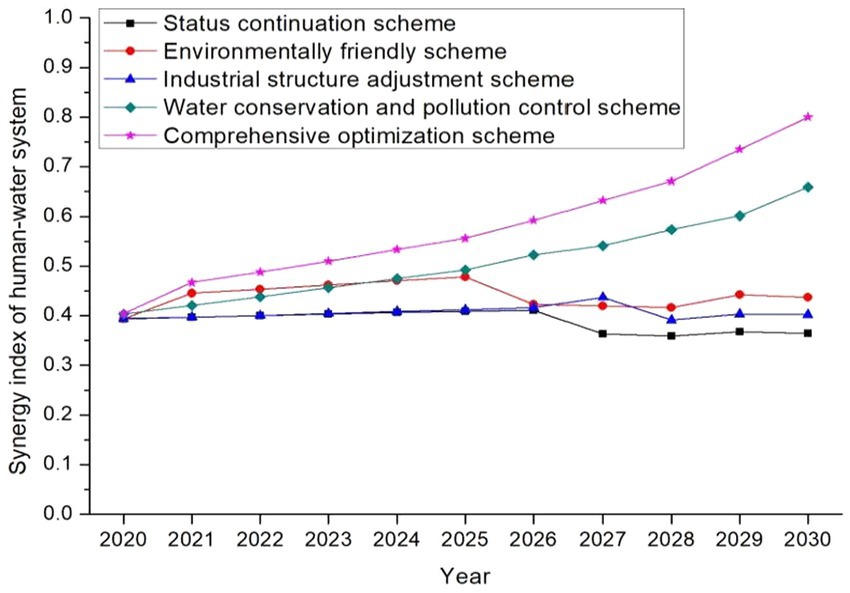
Figure 6. Synergy index of human-water system in different regulation schemes.
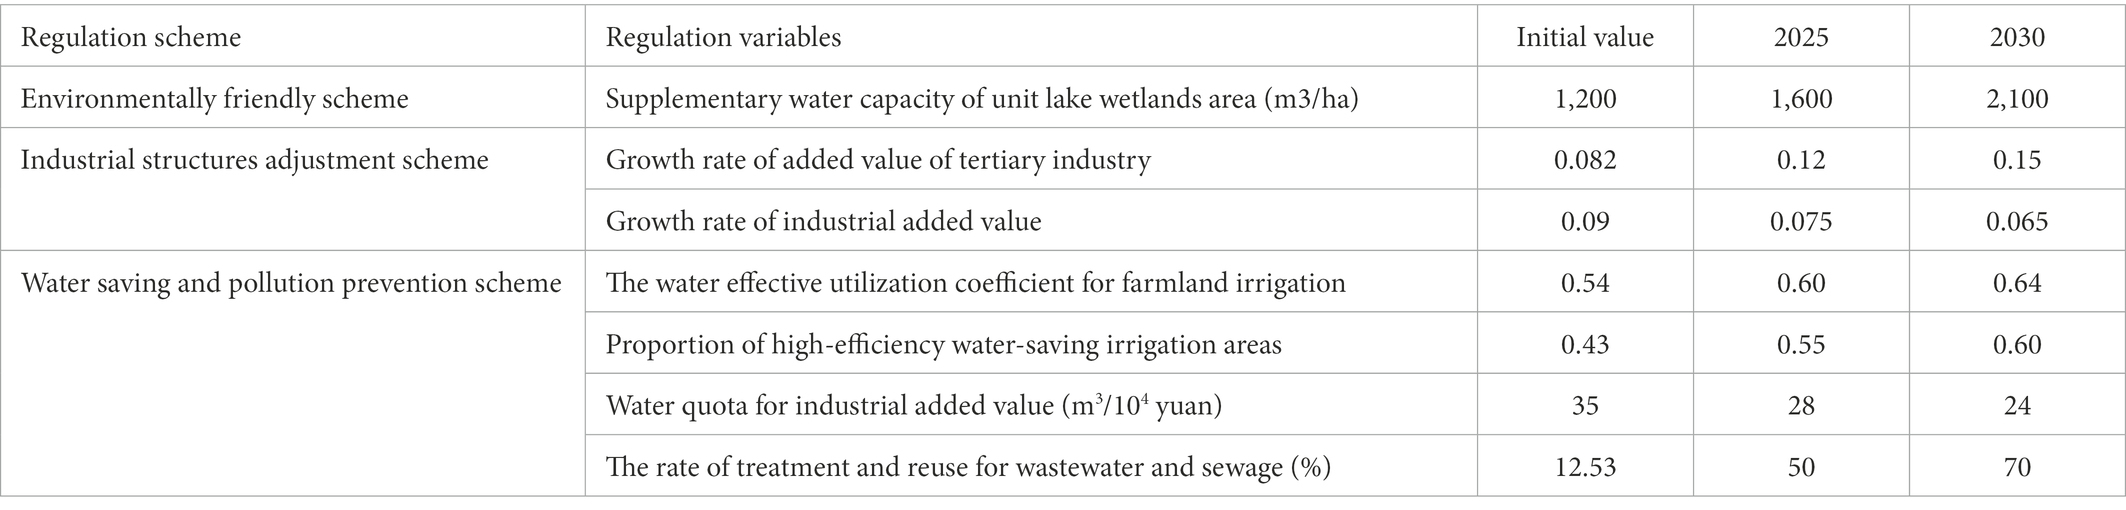
Table 5. Main control parameters of different schemes.
4.2.1. Status continuation scheme
For the status continuation scheme, the supply to demand ratio of water would drop from 1.02 in 2020 to 0.81 in 2030 (Figure 7A), and only 81% of the water demand would be met by the water supply system in the region, resulting in a water deficit of 1.602 billion m3 (Figure 7B). The proportion of agricultural water use would decline from 86% in 2020 to 80% in 2030 (Figure 7C), which is still higher than the national level of 61% in 2020. In 2030, the tertiary industry and the ecological environments will, respectively, contribute only 2 and 3% of the total water use (Figures 7E,F), with agricultural water use dominating the water use structure. Due to the imbalance between water supply and demand, unreasonable water use structure, and a low rate of treatment and reuse for wastewater and sewage(Figure 7G), the socioeconomic growth and environmental protection would not be balanced through the human-water system. The synergy index of the human-water system would drop from 0.39 in 2020 to 0.35 in 2030 (Figure 6), worsening the human-water relationship.
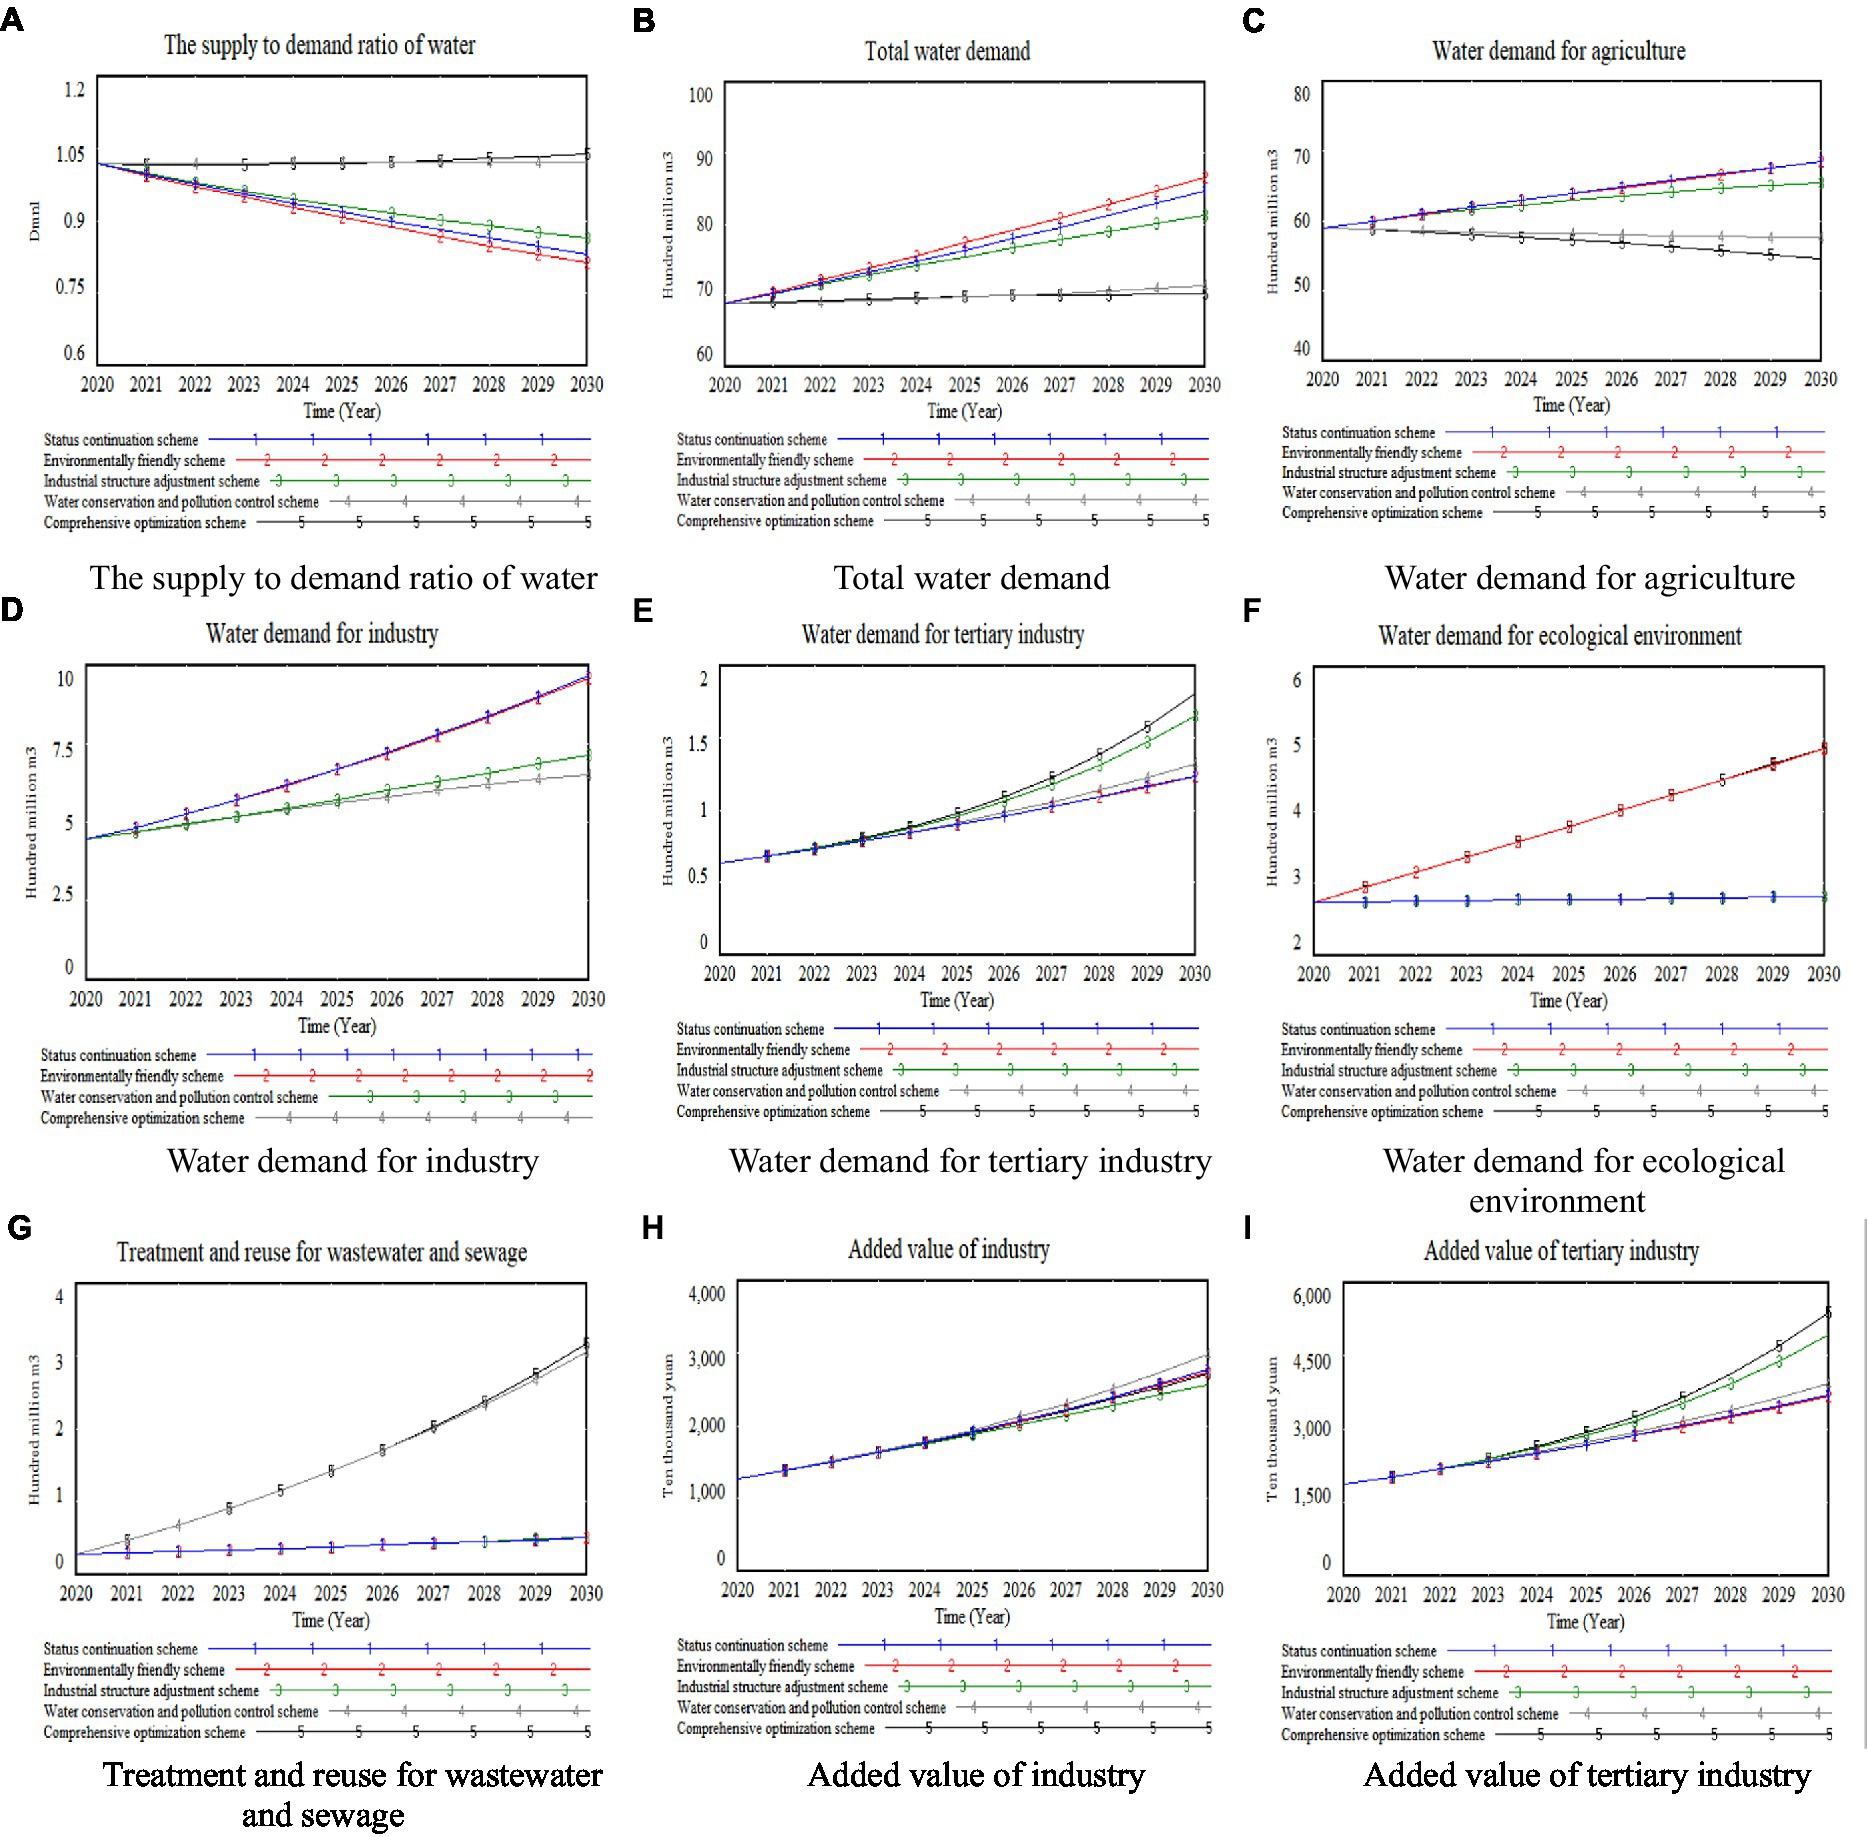
Figure 7. SD simulation of main variables in different regulation schemes. (A) The supply to demand ratio of water. (B) Total water demand. (C) Water demand for agriculture. (D) Water demand for industry. (E) Water demand for tertiary industry. (F) Water demand for ecological environment. (G) Treatment and reuse for wastewater. (H) Added value of industry. (I) Added value of tertiary industry.
4.2.2. Environmentally friendly scheme
For the environmentally friendly scheme, the environmental water use would rise by 234 million m3 from 2020 to 2030 (Figure 7F), and its proportion would rise from 4% in 2020 to 6% in 2030. However, the increase in ecological water use would intensify the load on the water supply. The supply to demand ratio of water would drop to 0.8 (Figure 7A), which is lower than that in the status continuation scheme, with a water shortage of 1.786 billion m3 (Figure 7B). In 2020–2024, the synergy index of the human-water system would rise from 0.39 in 2020 to 0.47 in 2024 as a result of the increase in environmental water use (Figure 6). In 2025–2030, the supply to demand ratio of water would continuously drop, enlarging the gap between supply and demand, and with these fluctuations the synergy index of the human-water system would decline. These occurrences would indicate that the human-water relationship cannot be improved simply by increasing the environmental water use.
4.2.3. Industrial structures adjustment scheme
For the industrial structures adjustment scheme, the supply to demand ratio of water would drop to 0.85 by 2030 (Figure 7A), which would decrease slowly compared to that decrease in the status continuation scheme, easing the contradiction between supply and demand. However, the gap between supply and demand would still be 1.232 billion m3 (Figure 7B). Compared to the status continuation scheme, the growth rate of added value of tertiary industry would be higher (Figure 7I). The synergy index of the human-water system would increase from 0.39 in 2019 to 0.45 in 2030 (Figure 6). The human-water relationship would, therefore, be slightly improved.
4.2.4. Water conservation and pollution prevention scheme
For the water conservation and pollution prevention scheme, the supply to demand ratio of water would see a sharp increase from 2020 to 2030, bringing supply and demand into balance (Figure 7A). The agricultural water demand would drop to 5.841 billion m3 by 2030, a fall of 60 million m3 from the demand in 2020 (Figure 7C). The sewage treatment and reuse would increase by 294 million m3 (Figure 7G), an increase much bigger than that of the status continuation scheme. As the supply to demand ratio of water rose, the increases in the added value of industry and the added value of tertiary industry exceeded those of the status continuation scheme (Figures 7H,I). The synergy index of the human-water system would rise from 0.39 in 2019 to 0.67 in 2030 (Figure 6). Given that increasing the environmental water use was not considered, room for improving the human-water relationship would remain.
4.2.5. Comprehensive optimization scheme
For the comprehensive optimization scheme, the supply to demand ratio of water would always be larger than 1 from 2020–2030 (Figure 7A), bringing supply and demand into balance. By 2030, the proportion of agricultural water use would drop to 77%, a fall of 9 percentage points compared with that in 2019 (Figure 7C), and the fall would be larger than that in single regulation schemes. The proportion of industrial water use would increase to 10%, and the increase would be smaller than that in single regulation scheme (Figure 7D). The tertiary industrial water use would rise to 3% in 2030 from 1% in 2020, a larger increase than that in single regulation schemes (Figure 7E). The proportion of environmental water use would increase from 4% in 2020 to 7% in 2030, a larger increase than that in single regulation schemes (Figure 7F). The treatment and reuse for wastewater and sewage would rise by 309 million m3, which is a higher growth rate than that in single regulation schemes (Figure 7G). The growth in the added value of tertiary industry was projected to be larger than that in single regulation schemes (Figure 7I). The synergy index of the human-water system would increase to 0.81, an increase larger than that in single regulation schemes (Figure 6), indicating that the human-water relationship would be optimized and regulated.
4.3. Discussion
4.3.1. Research limitations and future directions
With a complex structure, the human-water system involves many variables. Additionally, the structure of supply and demand for water will be influenced by such factors as climate change, water pricing, and water transfer policies. Hence, the model proposed in this study should be refined to provide a better fit with policy requirements. The human-water relationship involves economics, water resources, hydrology and other disciplines, so an optimization model that couples the SD model and multi-objective planning model or hydrological model could be further adapted to optimize the distribution of water resources across social, economic, and ecological systems, thus optimizing human-water relationship.
4.3.2. Recommendations
Having compared and analyzed the simulation results of the five schemes previously mentioned, the following actions can be taken to improve the human-water relationship.
4.3.2.1. Implementation of agricultural water conservation
According to the Plan, the total water use in the study region will maintain the status quo over the next 10 years. In this case, the increasing water demand should be controlled, and the water use efficiency of all industries should be appropriately improved. The results of this analysis indicate that agricultural irrigation will continue to account for more than 80 percent of the region’s overall water use over the next 10 years. Restricting the water demand for agricultural irrigation can, therefore, significantly alleviate the water shortage and improve the human-water relationship. However, that same demand for irrigation water could also be significantly reduced by increasing the water effective utilization coefficient for farmland irrigation and the proportion of high-efficiency water-saving irrigation areas. The irrigation and drainage engineering system and water transfer capacity of the irrigated areas should, therefore, be comprehensively improved, and agronomic water-saving measures should be popularized. Additionally, the proposals are in accordance with the Plan’s requirements.
4.3.2.2. Implementation of industrial water-saving and adjustment of industrial structures
This study results show that reducing the water quota for industrial added value, reducing the growth rate of industrial added value, and increasing the growth rate of added value of tertiary industry significantly improve the imbalance of water use structure. Therefore, traditional industries with high water use must therefore be encouraged to transform, to upgrade, and to optimize the water distribution network. In addition, the economic and social structure of the country should be adjusted, the development layout optimized, and the growth rate of tertiary industry accelerated. A high-quality development pattern would thereby be created, characterized by a gradual modernization of the development level and an intensive yet efficient water use level.
4.3.2.3. Strengthening measures for the reuse of reclaimed water
According to the status quo of the research region, little room remains for developing new water source. This study results show that although the amount of wastewater reuse contributes relatively little to the availability of water resources in the study region, increasing wastewater reuse may become an important source of water in the future. Therefore, reclaimed water must be included in regional water allocations, and the construction of reclaimed water reuse facilities should be enhanced. In order to increase the amount of reclaimed water reused, urban sewage treatment and reclaimed water reuse rates should be improved.
4.3.2.4. Improving pro-environmental water use
Increasing the consumption of water within the ecological environment contributes to its restoration and improvement in the study region. This study results indicate that increasing the supplementary water capacity of lake wetlands can significantly improve the synergy level of human-water systems and improve the human-water relationship. As a result, restoration efforts should be bolstered and the water supply of lakes and wetlands should be increased. Consequently, measures should be taken to repair damaged wetlands and increase their capacity to store water, control floods, drain water, purify water quality, and balance water ecology.
5. Conclusion
This study developed a coevolution model of the human-water system by coupling the human-water system SD model and coevolution model from the perspective of complex system synergies. Furthermore, the human-water system’s coevolution trends were simulated by the constructed model. In accordance with the local development plan in the study region and national development strategies, five regulation schemes were designed to enhance the coordination degree of the human-water system by adjusting sensitive decision variables. The following conclusions were made by comparing simulation and prediction results.
5.1. Balance between water supply and demand
By decreasing the growth in industrial water use through industrial structures adjustment, the decline in the supply to demand ratio of water in the next decade in the industrial structures adjustment scheme would be smaller than that in the status continuation scheme, and the contradiction between water supply and demand would be eased. By improving water use efficiency, the supply to demand ratio of water in the water conservation and pollution prevention scheme would exceed 1 in 2020–2030, achieving a balance between water supply and demand. Such an optimal balance could also be realized by adapting the industrial structures, increasing environmental water use, and improving water use efficiency in the comprehensive optimization scheme.
5.2. Water structure
In the next decade, the proportion of agricultural water use would also be over 80% in the environmentally friendly scheme, and the low proportions of ecological water use and tertiary industrial water use would not be improved. The proportion of tertiary industrial water use would be elevated in the industrial structures adjustment scheme. In the water conservation and pollution prevention scheme, the proportion of industrial water use would fall. However, in all three regulation schemes the proportion of agricultural water use would still exceed 80%, while in the comprehensive optimization scheme that proportion would fall to 77% by 2030. The increases in the proportions of ecological water use and tertiary industrial water use would exceed those in the environmentally friendly and industrial structures adjustment schemes, effectively improving the unreasonable water use structure.
5.3. Socioeconomic growth
With water supply balanced with demand and a reasonably adjusted industrial structures, the increases in GDP and added value of tertiary industry in the comprehensive optimization scheme would exceed those in other regulation schemes in the next decade, whereas the increase in industrial added value would be slightly smaller than that in other regulation schemes.
5.4. Synergy index of the human-water system
The synergy index of the human-water system would decrease in the next 10 years, with a worsening human-water relationship in the status continuation scheme due to a failure to consider environmental water use, unreasonable water use structure, low water use efficiency, or the low reuse rate of wastewater and sewage. In the comprehensive optimization scheme, combining the improvement of environmental water use, industrial structures adjustment, and water conservation and pollution prevention, the human-water relationship would be significantly improved over that improvement offered by other schemes.
Data availability statement
The datasets presented in this study can be found in online repositories. The names of the repository/repositories and accession number(s) can be found in the article/supplementary material.
Author contributions
LW: methodology, writing – original draft, visualization, and supervision. XPL: writing – review and editing, and funding acquisition. XYL: writing – review and editing, software, data curation, and formal analysis. HG: investigation, writing – original draft, data curation, and validation. All authors contributed to the article and approved the submitted version.
Funding
This work was supported by the National Natural Science Foundation of China (grant number 42071230) and Ningxia Natural Science Foundation (grant number 2020AAC03280).
Acknowledgments
We would like to thank the editor and reviewers for their numerous comments and suggestions, which have contributed to improving this manuscript.
Conflict of interest
The authors declare that the research was conducted in the absence of any commercial or financial relationships that could be construed as a potential conflict of interest.
Publisher’s note
All claims expressed in this article are solely those of the authors and do not necessarily represent those of their affiliated organizations, or those of the publisher, the editors and the reviewers. Any product that may be evaluated in this article, or claim that may be made by its manufacturer, is not guaranteed or endorsed by the publisher.
References
Ahmad, I., Waseem, M., Lei, H., Yang, H., and Yang, D. (2018). Harmonious level indexing for ascertaining human-water relationships. Environ. Earth Sci. 77, 1–9. doi: 10.1007/s12665-018-7296-7
Arief, D., Sutadian, N., Muttil, A., Gokhan, Y., and Perera, B. J. C. (2017). Using the analytic hierarchy process to identify parameter weights for developing a water quality index. Ecol. Indic. 75, 220–233. doi: 10.1016/j.ecolind.2016.12.043
Bao, C., and Zou, J. (2018). Analysis of spatiotemporal changes of the human-water relationship using water resources constraint intensity index in Northwest China. Ecol. Indic. 84, 119–129. doi: 10.1016/j.ecolind.2017.08.056
China’s National Bureau of Statistics (2010–2020). China City Statistical Yearbook. Available at: http://www.tjcn.org/e/tags/?tagname=%D6%D0%B9%FA%B3%C7%CA%D0%CD%B3%BC%C6%C4%EA%BC%F8 (Accessed December 25, 2021)
Cui, X., Fang, C., Liu, H., Liu, X., and Li, Y. (2020). Dynamic simulation of urbanization and eco-environment coupling: current knowledge and future prospects. J. Geogr. Sci. 30, 333–352. doi: 10.1007/s11442-020-1731-x
Davies, E., and Simonovic, S. P. (2011). Global water resources modeling with an integrated model of the social–economic–environmental system. Adv. Water Resour. 34, 684–700. doi: 10.1016/j.advwatres.2011.02.010
Ding, Y., Tang, D., Dai, H., and Wei, Y. (2014). Human-Water harmony index: A new approach to assess the human water relationship. Water Resour. Manag. 28, 1061–1077. doi: 10.1007/s11269-014-0534-1
Dong, Q., Zhang, X., Chen, Y., and Fang, D. (2019). Dynamic management of a water resources-socio-economic-environmental system based on feedbacks using system dynamics. Water Resour. Manag. 33, 2093–2108. doi: 10.1007/s11269-019-02233-8
Feng, X., Liu, Q., Yin, L., Fu, B., and Chen, Y. (2018). Linking water research with the sustainability of the human–natural system. Curr. Opin. Environ. Sust. 33, 99–103. doi: 10.1016/j.cosust.2018.05.012
Gholizadeh Sarabi, S., Davary, K., Ghahraman, B., and Shafiei, M. (2021). A perceptual socio-hydrological model of co-evolutionary coupled human-water system based on historical analysis, Mashhad basin, Iran. Hydrol. Sci. J. 66, 355–372. doi: 10.1080/02626667.2021.1873345
Grant, S. B., Saphores, J., Feldman, D. L., Hamilton, A. J., Fletcher, T. D., Cook, P. L., et al. (2012). Taking the “waste” out of “wastewater” for human water security and ecosystem sustainability. Science 337, 681–686. doi: 10.1126/science.1216852
He, Y., Lin, K., Zhang, F., Wang, Y., and Chen, X. (2018). Coordination degree of the exploitation of water resources and its spatial differences in China. Sci. Total Environ. 644, 1117–1127. doi: 10.1016/j.scitotenv.2018.07.050
Jackson, R. D., Kustas, W. P., and Choudhury, B. J. (1988). A reexamination of the crop water stress index. Irrigation Sci. 9, 309–317. doi: 10.1007/BF00296705
Jia, X., Cai, Y., Li, C., Wang, X., and Sun, L. (2015). An improved method for integrated water security assessment in the Yellow River basin, China. Stoch. Environ. Res. Risk Assess. 29, 2213–2227. doi: 10.1007/s00477-014-1012-2
Jia, B., Zhou, J., Zhang, Y., Tian, M., He, Z., and Ding, X. (2021). System dynamics model for the coevolution of coupled water supply–power generation–environment systems: upper Yangtze river basin, China. J. Hydrol. 593:125892. doi: 10.1016/j.jhydrol.2020.125892
Jiang, W. (2001). Study on water resource safety strategy for China in the 21th century. Adv. Water Sci. 12, 66–71.
Jiang, Y. (2009). China's water scarcity. J. Environ. Manag. 90, 3185–3196. doi: 10.1016/j.jenvman.2009.04.016
Kang, Y., Cai, H., and Song, B. (2014). Study on human-water harmony evaluation in Baoji City. J. Nat. Resour. 29, 156–165.
Kotir, J. H., Smith, C., Brown, G., Marshall, N., and Johnstone, R. (2016). A system dynamics simulation model for sustainable water resources management and agricultural development in the Volta River Basin, Ghana. Sci. Total Environ. 573, 444–457. doi: 10.1016/j.scitotenv.2016.08.081
Li, Y., Cao, J., Huang, H., and Xing, Z. (2018). International progresses in integrated water resources management. Adv. Water Sci. 29, 127–137. doi: 10.14042/j.cnki.32.1309.2018.01.015
Li, P., and Qian, H. (2018). Water resources research to support a sustainable China. Int. J. Water Resour. Dev. 34, 327–336. doi: 10.1080/07900627.2018.1452723
Li, T., and Yang, S. (2017). Prediction and optimization of water resources supply and demand balance in longhua district of Shenzhen based on system dynamics. J. Basic Sci. Eng. 25, 918–931. doi: 10.16058/j.issn.1005-0930.2017.05.005
Liu, D. I., Cao, C., Dubovyk, O., Tian, R., Chen, W., Zhuang, Q., et al. (2017). Using fuzzy analytic hierarchy process for spatio-temporal analysis of eco-environmental vulnerability change during 1990–2010 in Sanjiangyuan region, China. Ecol. Indic. 73, 612–625. doi: 10.1016/j.ecolind.2016.08.031
Liu, B., Chen, X., Lei, H., and Chen, W. (2011). Distinguishing of water resources supply and demand system evolution features. Adv. Water Sci. 22, 331–336.
Liu, H., Shi, P., Yang, X., Zhang, S., Han, M., and Chen, L. (2014). Self-organization evolution simulation and empirical study of human-water system. J. Nat. Resour. 29, 709–718. doi: 10.11849/zrzyxb.2014.04.015
Liu, X., Wang, K., Ye, J., and Wen, S. (2018). Measurement and analysis of spatial-temporal differentiation of water poverty in Ningxia based on WPI-geodetector. Arid. Land. Geogr. 41, 160–169. doi: 10.13826/j.cnki.cn65-1103/x.2018.01.020
Lu, Z., Wei, Y., Feng, Q., Xiao, H., and Cheng, G. (2016). Progress on socio-hydrology. Adv. Water Sci 27, 772–783. doi: 10.14042/j.cnki.32.1309.2016.05.015
Mao, F., Clark, J., Karpouzoglou, T., Dewulf, A., Buytaert, W., and Hannah, D. (2017). HESS opinions: a conceptual framework for assessing socio-hydrological resilience under change. Hydrol. Earth Syst. Sci. 21, 3655–3670. doi: 10.5194/hess-21-3655-2017
Ministry of Water Resources of the People’s Republic of China (2021). China Water Resource Bulletin in 2020. Available at: http://www.mwr.gov.cn/sj/tjgb/szygb/202206/t20220615_1579315.html (Accessed December 25, 2021)
Motesharrei, S., Rivas, J., Kalnay, E., Asrar, G. R., Busalacchi, A. J., Cahalan, R. F., et al. (2016). Modeling sustainability: population, inequality, consumption, and bidirectional coupling of the earth and human systems. Natl. Sci. Rev. 3, 470–494. doi: 10.1093/nsr/nww081
Ningxia Hui Autonomous Region Bureau of Statistics (2010–2020). China. Ningxia Statistical Yearbook. Available at: http://tj.nx.gov.cn/ (Accessed December 25, 2021)
Ningxia Hui Autonomous Region Department of Ecology and Environment (2010–2020). China. Ningxia Ecological Environment Bulletin. Available at: https://sthjt.nx.gov.cn/page/views/governmentPublic/InformationDisclosure/index.html?id=217 (Accessed December 25, 2021)
Ningxia Water Conservancy, China (2010–2021a). Ningxia Statistical Bulletin of Water Conservancy. Available at: http://slt.nx.gov.cn/xxgk_281/fdzdgknr/gbxx/szygb/202107/t20210716_2933558.html (Accessed December 25, 2021)
Ningxia Water Conservancy, China (2010–2021b). Ningxia Water Resource Bulletin. Available at: http://slt.nx.gov.cn/xxgk_281/fdzdgknr/gbxx/szygb/202107/t20210716_2933558.html (Accessed December 25, 2021).
Ningxia Water Conservancy, China (2021). The “14th Five-Year” Plan of Water Conservation in the Ningxia Hui Autonomous Region. Available at: http://slt.nx.gov.cn/xxgk_281/fdzdgknr/ghjh/slgh/202110/t20211021_3101565.html (Accessed December 25, 2021)
Ören, T., and Yilmaz, L. (2012). Synergies of simulation, agents, and systems engineering. Expert Syst. Appl. 39, 81–88. doi: 10.1016/j.eswa.2011.06.038
Robèrt, K., Schmidt-Bleek, B., De Larderel, J. A., Basile, G., Jansen, J. L., Kuehr, R., et al. (2002). Strategic sustainable development-selection, design and synergies of applied tools. J. Clean. Prod. 10, 197–214. doi: 10.1016/S0959-6526(01)00061-0
Sagar, A. D., and Najam, A. (1998). The human development index: a critical review. Ecol. Econ. 25, 249–264. doi: 10.1016/S0921-8009(97)00168-7
Shuai, W., Bojie, F., Xutong, W., and Yaping, W. (2020). Dynamics and sustainability of social-ecological systems in the loess plateau. Resour. Sci. 42, 96–103. doi: 10.18402/resci.2020.01.10
Song, X., Kong, F., and Zhan, C. (2011). Assessment of water resources carrying capacity in Tianjin City of China. Water Resour. Manag. 25, 857–873. doi: 10.1007/s11269-010-9730-9
Sullivan, C. (2002). Calculating a water poverty index. World Dev. 30, 1195–1210. doi: 10.1016/S0305-750X(02)00035-9
Sušnik, J., Vamvakeridou-Lyroudia, L. S., Savić, D. A., and Kapelan, Z. (2012). Integrated system dynamics modelling for water scarcity assessment: case study of the Kairouan region. Sci. Total Environ. 440, 290–306. doi: 10.1016/j.scitotenv.2012.05.085
The People’s Government of Ningxia Hui Autonomous Region. (2021a). The 14th Five-Year Plan of National Economy and Social Development in the Ningxia Hui Autonomous Region and Outline of 2035 Long-Range Objective. Available at: http://www.nx.gov.cn/zwgk/qzfwj/202103/t20210309_2620843.html (Accessed December 25, 2021)
The People's Government of Ningxia Hui Autonomous Region. (2021b). Planning of functional zones of Ningxia Hui Autonomous Region (2010-2020). Available at: https://www.nx.gov.cn/zwgk/qzfwj/ (Accessed December 25, 2021)
Van Emmerik, T. H. M., Li, Z., Sivapalan, M., Pande, S., Kandasamy, J., Savenije, H., et al., (2014). Socio-hydrologic modeling to understand and mediate the competition for water between agriculture development and environmental health: Murrumbidgee River basin, Australia. Hydrol. Earth Syst. Sci. 18, 4239–4259. doi: 10.5194/hess-18-4239-2014
Wang, H., Huang, J., Cheng, X., Zhou, H., and Yuan, Y. (2022). Scenario simulation of water resources development and utilization based on a system dynamics model. Int. J. Water Resour. Dev. 38, 447–463. doi: 10.1080/07900627.2021.1908235
Wang, X., Liu, L., Zhang, S., and Gao, C. (2022). Dynamic simulation and comprehensive evaluation of the water resources carrying capacity in Guangzhou city, China. Ecol. Indic. 135:108528. doi: 10.1016/j.ecolind.2021.108528
Wang, F., Ying, Z., Lyu, S., and Zhao, H. (2022). Evaluation of coupling coordinated development characteristics of water-economy-ecology system in Beijing-Tianjin-Hebei region. Water Resour. 38, 80–86. doi: 10.3880/j.issn.10046933.2022.05.012
Wang, Y., Zhao, Y., Wang, Y., Ma, X., Bo, H., and Luo, J. (2021). Supply-demand risk assessment and multi-scenario simulation of regional water-energy-food nexus: a case study of the Beijing-Tianjin-Hebei region. Resour. Conserv. Recy. 174:105799. doi: 10.1016/j.resconrec.2021.105799
Wei, Y., Zou, S., Xie, J., Western, A., and Ren, Z. (2015). Evolution of the human-water relationships in the Heihe River basin in the past 2000 years. Hydrol. Earth Syst. Sci. 19, 2261–2273. doi: 10.5194/hess-19-2261-2015
Xi, X., and Poh, K. L. (2015). A novel integrated decision support tool for sustainable water resources management in Singapore: synergies between system dynamics and analytic hierarchy process. Water Resour. Manag. 29, 1329–1350. doi: 10.1007/s11269-014-0876-8
Xia, J., and Chen, Y. D. (2001). Water problems and opportunities in the hydrological sciences in China. Hydrol. Sci. J. 46, 907–921. doi: 10.1080/02626660109492885
Xue, J., Gui, D., Lei, J., Sun, H., Zeng, F., and Feng, X. (2017). A hybrid Bayesian network approach for trade-offs between environmental flows and agricultural water using dynamic discretization. Adv. Water Resour. 110, 445–458. doi: 10.1016/j.advwatres.2016.10.022
Xu, D., Li, T., Zhao, B., and Yang, J. (2016). Zero growth of water resource utilization in the northern semi-arid area based on the system dynamics model: A case study in tongliao city of inner mongolia autonomous region. Areal Res. Dev. 35, 92–96.
Yang, Z., Song, J., Cheng, D., Xia, J., Li, Q., and Ahamad, M. I. (2019). Comprehensive evaluation and scenario simulation for the water resources carrying capacity in Xi'an city, China. J. Environ. Manage. 230, 221–233. doi: 10.1016/j.jenvman.2018.09.085
Yang, D., Yang, Y., and Xia, J. (2021). Hydrological cycle and water resources in a changing world: a review. Geogr. Sustain. 2, 115–122. doi: 10.1016/j.geosus.2021.05.003
Yin, L., Feng, X., Fu, B., Wang, S., Wang, X., Chen, Y., et al. (2021). A coupled human-natural system analysis of water yield in the Yellow River basin, China. Sci. Total Environ. 762:143141. doi: 10.1016/j.scitotenv.2020.143141
Zeng, Z., Liu, J., and Savenije, H. H. (2013). A simple approach to assess water scarcity integrating water quantity and quality. Ecol. Indic. 34, 441–449. doi: 10.1016/j.ecolind.2013.06.012
Zhang, J., Meng, C., Hu, S., and Li, W. (2022). Optimal allocation model for water resources coupled with ecological value factors-a case study of Dalian, China. Water 14:266. doi: 10.3390/w14020266
Zhang, T., Zhang, Z., and Xu, Y. (2016). Simulation and emulation on the equilibrium of supply and demand of water resources in haidian district based on the SD model. J. Agr. Res. Reg. Plan. 37, 29–36. doi: 10.7621/cjarrp.1005-9121.20160204
Zhang, X., Xu, D., Lu, Z., and Zhao, Z. (2019). Evolution simulation and regulation of production-living-ecological water system in Alax based on system dynamics. J. Arid. Land. Resour. Environ. 33, 107–113. doi: 10.13448/j.cnki.jalre.2019.235
Zhao, H., (2016). Research on the TYheory and Application of Harmony Regulation for Human-Water Relationship. Zheng Zhou University, Zhengzhou, pp. 99–115.
Zhao, W., Ding, J., Wang, Y., Jia, L., Cao, W., and Tarolli, P. (2020). Ecological water conveyance drives human-water system evolution in the Heihe watershed, China. Environ. Res. 182:109009. doi: 10.1016/j.envres.2019.109009
Zhao, X., Liu, D., Wei, X., Ma, L., Lin, M., Meng, X., et al. (2021). Analysis of socio-hydrological evolution processes based on a modeling approach in the upper reaches of the Han River in China. Water Sui 13:2458. doi: 10.3390/w13182458
Zomorodian, M., Lai, S. H., Homayounfar, M., Ibrahim, S., Fatemi, S. E., and El-Shafie, A. (2018). The state-of-the-art system dynamics application in integrated water resources modeling. J. Environ. Manag. 227, 294–304. doi: 10.1016/j.jenvman.2018.08.097
Zuo, Q., Diao, Y., Hao, L., and Han, C. (2020a). Comprehensive evaluation of the human-water harmony relationship in countries along the "belt and road". Water Resour. Manag. 34, 4019–4035. doi: 10.1007/s11269-020-02632-2
Zuo, Q., Li, W., Zhao, H., Ma, J., and Luo, Z. (2020b). A harmony-based approach for assessing and regulating human-water relationships: a case study of Henan province in China. Water Sui 13:32. doi: 10.3390/w13010032
Keywords: Northwest China, human-water system, coevolution, system dynamics, simulation and regulation
Citation: Wei L, Liu X, Li X and Gao H (2023) System dynamics simulation and regulation of human-water system coevolution in Northwest China. Front. Ecol. Evol. 10:1106998. doi: 10.3389/fevo.2022.1106998
Edited by:
Chengcheng Xia, Sichuan University, ChinaReviewed by:
Vikas Kamal, EHS Guru Sustainable Solutions Private Limited, IndiaSatyanarayan Shashtri, Fiji National University, Fiji
Copyright © 2023 Wei, Liu, Li and Gao. This is an open-access article distributed under the terms of the Creative Commons Attribution License (CC BY). The use, distribution or reproduction in other forums is permitted, provided the original author(s) and the copyright owner(s) are credited and that the original publication in this journal is cited, in accordance with accepted academic practice. No use, distribution or reproduction is permitted which does not comply with these terms.
*Correspondence: Xiaopeng Liu, ✉ MjY0MTk5NjU2OEBxcS5jb20=