 Shuting Chen
 Wanhua Su*
95% of researchers rate our articles as excellent or good
Learn more about the work of our research integrity team to safeguard the quality of each article we publish.
Find out more
ORIGINAL RESEARCH article
Front. Ecol. Evol. , 12 January 2023
Sec. Environmental Informatics and Remote Sensing
Volume 10 - 2022 | https://doi.org/10.3389/fevo.2022.1100089
This article is part of the Research Topic Path, Method and Theory of Carbon Neutralization in the Context of Artificial Intelligence View all 9 articles
The development of integrated energy systems is a significant way of improving energy efficiency and encouraging renewable energy absorption. However, the uncertainty of renewable energy and loads raise severe challenges to integrated energy system planning. Besides, under the low carbon background, the relationship between reducing carbon emissions and increasing the absorption of renewable energy is not investigated clearly in the planning of the park integrated energy system. Thus, this paper proposes a two-stage robust planning method considering low carbon and uncertainty. Firstly, the input-output model of energy conversion equipment in the park integrated energy system is described. Secondly, the objective function and constraints and are set up. Specifically, the carbon emission limits and renewable energy penetration target are introduced in the constraints. On this basis, the two-stage robust planning model with min-max-min structure is established, after transformation, column-and-constraint generation is used for the solution. Case study shows the ability and cost of the park integrated energy system to promote low-carbon emission reduction and renewable energy consumption. Moreover, it proves that although there is some synergy between the low carbon target and the renewable energy consumption target, maximum renewable energy consumption does not mean minimum carbon emissions, and vice versa, and in some cases increasing renewable energy penetration does not necessarily reduce carbon emissions.
China’s energy consumption and production have been ranked among the best in the world, but there are still a number of problems with the country’s energy supply and use, including an inappropriate energy structure, poor energy utilization efficiency, a low proportion of renewable energy development and use, and a need for further improvement in energy security and use. Furthermore, in the face of increasingly critical climate change issues, low-carbon emission reduction and sustainable development have gained global acceptance. Governments and organizations all over the globe have released a slew of low-carbon development strategies and countermeasures, and international collaboration has been steadily reinforced (Wen et al., 2009; Bie et al., 2012; Bridge et al., 2018; Liu et al., 2020, 2022). In 2020, China proposed a “double carbon target,” which promotes new energy development standards, and the transformation and development of the energy system is necessary to achieve this target (Wang et al., 2022). Among the major sectors of national economic production, since the energy system is the main contributor to carbon emissions, transforming it to a low-carbon model is essential to helping China meet its targets for reducing its carbon footprint.
The integrated energy system, which unifies and dispatch of energy sources including electricity, thermal, cooling, and gas, is a comprehensive energy system that is crucial for promoting China’s energy revolution, reducing carbon emissions, and promoting efficient and energy use that is clean (Huang et al., 2011).
The development of integrated energy projects is based on the scientific and logical design of integrated energy systems, which directly affects the realization of the benefits of efficient, economic, and environmentally friendly systems. Therefore, Numerous academics have conducted in-depth study on the design of IES, mainly focusing on the modelling of planning methods, equipment capacity configuration, system uncertainty, and low carbon among other things (Mirakyan and De Guio, 2015; Fan et al., 2021; Sun et al., 2022).
In terms of the planning and optimization of IES, a planning strategy for the IES is put out by Wang et al. (2021) by fusing the life cycle and energy theories. The IES planning scheme present in the paper improves the economy and wind energy, solar energy consumption when compared to experimental assessments of conventional planning schemes that take into account yearly average operating and investment costs and coefficient of energy. Wang et al. (2020) develop a planning model for storage capacity augmentation that takes into account the IES’s numerous uses for hybrid energy storage, and use the genetic quantum approach to simulate and analyze the hybrid energy storage’s advantages. When planning the optimization of a regional IES, Wang et al. (2022) consider energy quality in addition to energy quantity. They also couple a multi-objective genetic algorithm (MOGA) with an embedded tabu search algorithm to calculate the capacity of unit in the IES. Wang et al. (2019a) take the lowest carbon emission and the lowest annual total cost as the objective function, and model the system using three investment constraint schemes based on typical daily load curves of four seasons to determine the system’s ideal capacity planning strategy.
The majority of the research described above use a deterministic optimization framework. However, the IES is rife with unpredictable elements, such as the unpredictable nature of renewable energy production and shifts in load demand. Researchers both domestically and internationally have conducted pertinent research to take the effects of uncertainty elements on system planning into consideration.
Pickering and Choudhary (2019) propose a model for regional IES to solve the problem of demand uncertainty based on sampling historical demand data, improving the model’s robustness. Dou et al. (2019) use K-means clustering algorithm to summarize typical scenarios of source and load, and establish a distributed renewable energy allocation optimization model from the perspective of energy balance. For IES expansion planning, Lei et al. (2020) establish a multi-objective stochastic programming method model. Li et al. (2021) put forward an IES capacity planning model with the target of reducing the total cost of investment operations. Based on the scene analysis method, a two-stage programming strategy is adopted to obtain the multi-energy capacity planning scheme with integer variables.
To enhance the system’s ability to respond to low-carbon challenges, the operation and planning of IES must include low-carbon-related components. Scholars have mainly conducted research on carbon capture, carbon trading, and introduction of minimum carbon emissions into optimization targets.
On carbon capture, Zhang et al. (2021) established the features of the carbon capture system, which contributes greater flexibility for the conventional power plants, and expanded the dispatch issue for an integrated energy system (IES) integrating renewable penetration, carbon capture, as well as emission reduction. Ma et al. (2021) introduced carbon capture systems in conventional IES, and carbon source of P2G comes from carbon emissions from cogeneration units. The above approach solves the P2G system’s carbon source issue while reducing the cogeneration system’s carbon dioxide emissions. Liu et al. (2021) added carbon capture equipment to the IES containing electricity and gas, and also considered the carbon trading mechanism to achieve the economic low-carbon operation of the system.
On carbon trading, Cheng et al. (2021) proposed a breakthrough low carbon operational paradigm by using a carbon restricted locational marginal pricing based on carbon trading. In order to address the particular criterion of reducing carbon emissions, considering the uncertainty, Jin et al. (2019) established a stochastic dynamic optimization for the IES, which reduced the total cost of electricity and met the carbon emission reduction requirements, meanwhile this work adopted a carbon trading model. Yan et al. (2021) studied the two-way interactive trading mode between carbon and green certification trading for virtual power plants, so as to achieve multi-energy complementary carbon reduction and enhance the economic benefits. Sun et al. (2021) introduced carbon trading mechanism to optimize the annual total cost of IES.
On the introduction of minimum carbon emissions into optimization targets, Wang et al. (2019b) designed a novel multi-objective optimization model to simultaneously minimize the economic, technical, and environmental objectives while developing an IES. To reduce system operating costs and carbon penalty costs, Liu and Nie (2019) discussed the combined supply of energy device effect on system efficiency. An ideal scheduling model for IES that takes into account combined weights for low carbon and profitable operation is proposed by Zhou et al. (2022).
The contributions of this paper are summarized as follows.
1. This paper designs an IES planning solution strategy that taking uncertainty factors into account based on a two-stage robust planning model. Compared with traditional deterministic optimization, the planning model in this paper is more reliable.
2. In order to tap the low-carbon potential of the integrated energy system of the park, low-carbon constraints and renewable energy penetration constraints are introduced into the model, and the relationship between carbon emission reduction and renewable energy consumption is analyzed.
3. The planning strategy put out in the research can successfully deal with the output uncertainty of solar and wind energy, and it can be adapted to requirements in more scenarios such as the economy, and low carbon.
The system includes absorption conditioning (AC), cold storage (CS), electric conditioning (EC), electric storage (ES), gas boiler (GB), gas turbine (GT), waste heat boiler (HB), heat pump (HP), heat storage (HS), photovoltaic (PV), wind turbine (WT), and electric, thermal, and cooling loads (Bai et al., 2018; Zhai et al., 2019). Figure 1 shows the park IES’s usual physical layout.
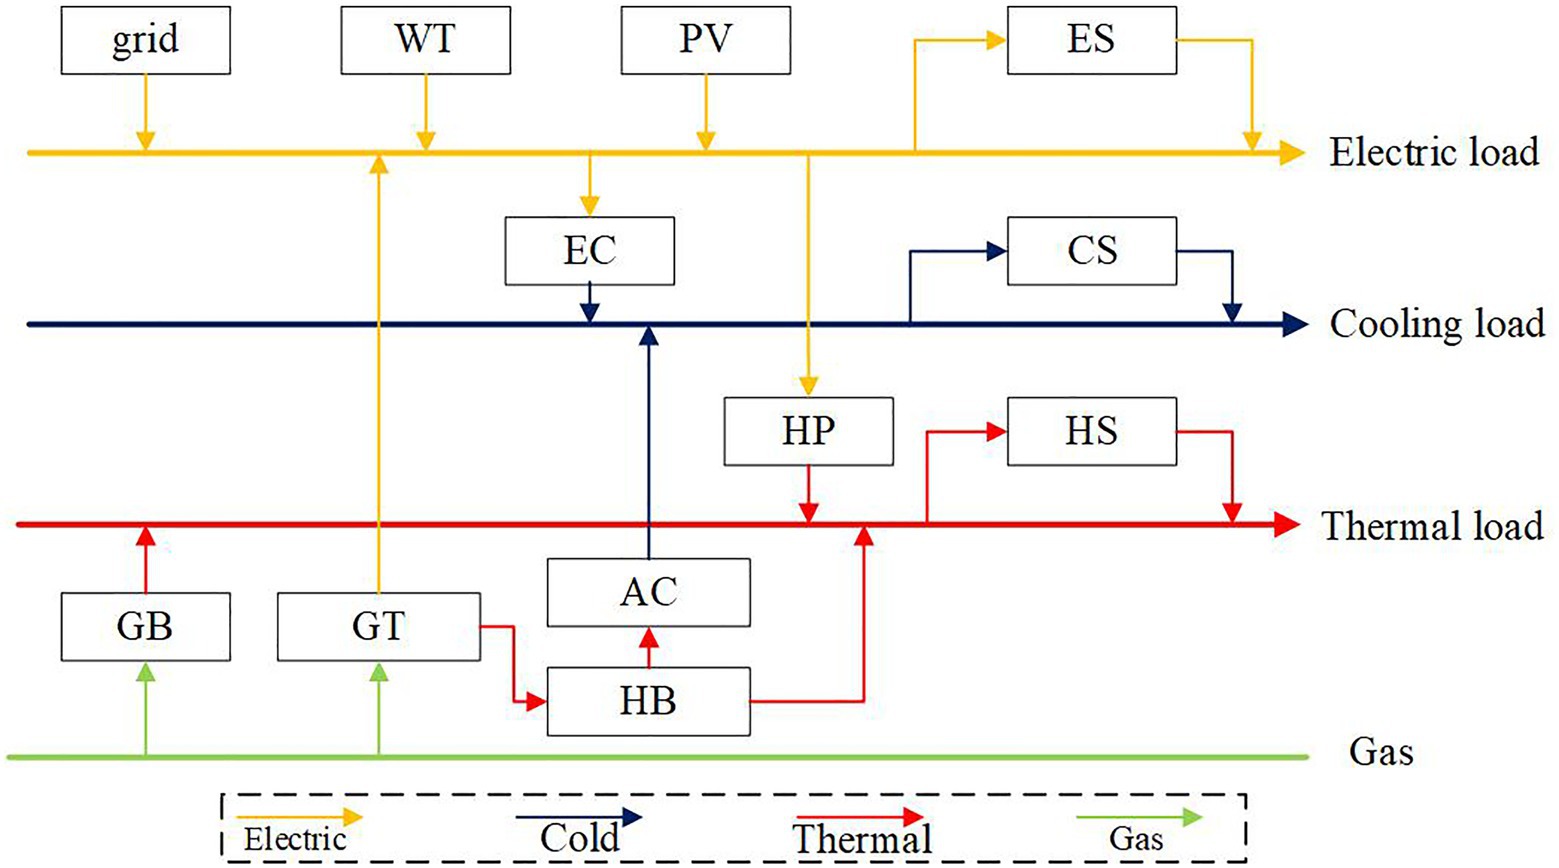
Figure 1. Typical structure of park IES.
Part of the purchased natural gas enters the gas turbine to convert into electrical energy and thermal energy, and the other part enters the gas boiler to convert into thermal energy. Formula (1) can be used to describe the consumption of natural gas Pgas.
In the formula, Pgp is the gas turbine’s fuel consumption, and the fuel used by the gas boiler is Pgb.
Formula (2) can be used to express the connection between the intake of natural gas and the outputs of electric and thermal.
In the formula, ηe is the electric efficiency of GT, ηh is the thermal efficiency of gas turbine, and ηgb is the thermal efficiency of GB (He et al., 2015).
A part of the thermal generated by the gas turbine is directly used to meet the user’s heat demand, expressed as Hgp1, and the other part Hgp2 can be transformed into cold energy by absorption conditioning. The above constraint conditions can be expressed as formula (3)
Electric energy is converted into heat energy by heat pump, which is shown in Formula (4).
In the formula, Qhp is the heat pump operating heat capacity, kW; COPhp is the performance coefficient; and Php is the power consumption, kW.
In the IES, the electric air conditioner will provide additional cooling if absorption conditioning is insufficient to fulfil the user’s cooling load need. The electric conditioning may also contribute to raising the energy system’s thermoelectric ratio. The mathematical relationship between the coefficient of performance and the cooling power of an electric conditioning is shown in Formula (5).
In Formula (5), Rec is the output power of EC; COPec is the performance coefficient of EC; and Eec is the power consumption, kW.
Formula (6) illustrates the mathematical concept of charging energy.
Formula (7) illustrates the mathematical model for the release of energy.
In the formula, δe is the battery’s own energy consumption rate. Pin is the battery’s energy deposited power. Pout is the battery’s energy released power. SOC is the remaining battery charge. ηin is the energy deposited efficiency of ES. ηout is the electrical energy released efficiency of ES, EN is the rated capacity of ES (Xue et al., 2019).
Formula (8) shows that the optimization objective is to minimize the investment cost and operation cost of the system in the worst scenario.
In the formula, Cint represents the annualized investment cost as shown in Formula (9). Cope represents the system operating cost as shown in Formula (10).
In the formula, ρ, the discount rate; r, the discounted years of unit; the investment cost per equipment unit capacity is known as cint, Pmax is the planning capacity of unit, and the subscript represents different units.
In the formula, the first part is the cost of power interaction, cgrid,t is the time of use electricity price of grid, and the other part is the operation cost of unit, Ωw is the collection of units. The third part is fuel costs.
The formula on the left is the sum of the electric output of the device, and the formula on the right is the electric load. t represents at time t.
The formula on the left is the sum of the cooling output of the device, and the formula on the right is the cooling load. t represents at time t (Tang et al., 2022).
The formula on the left is the sum of the thermal output of the device, and the formula on the right is the thermal load. t represents at time t.
All units need to run within the allowable range of work and the output cannot exceed their maximum power as shown in Formula (14).
In the formula, Pt w is the unit’s operating power, Pmax wis the planning capacity for unit, and Ωw is the collection of units.
Formula (15) shows the power interaction constraint of grid.
Where Ugrid is the 0,1-variable.
In the formula, P0 wis the maximum planning capacity for unit.
Formulas (17–20) show the electric storage constraints, and the heat storage and cold storage systems can be modelled by analogy (Xue et al., 2019).
In Formulas (17) and (18), Pdis,max, the max discharge power, Pch,max, the max charging power. Ubat indicates the state of charging or discharging of ES. Ubat = 1, discharging; Ubat = 0, charging. Formula (19) ensures that the capacity of ES before and after scheduling is the same. Formula (20) is the remaining capacity constraint at each moment of ES. SOC is the remaining capacity of ES. t0 is the beginning of scheduling.
λ represents the total carbon emissions of the IES of the park in the planning year. ρk,t represents the carbon emission intensity of type k input energy, Pk,t represents the consumption of type k input energy, λ* is the set carbon emission target.
In the formula, γ represents the renewable energy penetration of the park IES. γ* represents the set renewable energy penetration target. Pout k’,t is the generating capacity of renewable energy units, is the terminal power load.
When the uncertainties in the system are not considered, the deterministic planning model of the above IES can be obtained (Zeng and Zhao, 2013), which is shown in Formula (23)
In the formula, Pwt (t), Ppv (t), Pload (t), Qload (t), and Hload (t) represent the predicted value at time t.
Solve the above model by conventional deterministic optimization methods, such as branch and bound (BNB) and heuristic algorithm. The results of planning depend on the accuracy of the prediction technology. However, there are multiple loads in park IES, furthermore under the low carbon background, renewable energy sources have become an important source of energy supply. Park IES faces the influence of these random factors in practical application. The prediction accuracy is difficult to meet the requirements. Many scholars have studied the prediction technology of renewable energy (Sah et al., 2022). However, when forecasting techniques are limited, the deterministic optimization model shown in Formula (23) often seems too “risky” and needs to consider the influence of uncertainty in the model.
Based on Formula (23), a two-stage robust optimum capacity planning model for IES in park is created in order to address the unpredictability of wind, solar, and loads in IES. Single stage robust optimization only makes one decision before the occurrence of uncertainty, and the optimization result is too conservative. The two-stage robust optimization divides the decision variables into two parts, making decisions before and after the uncertainty, and the optimization results are more economical.
The objective function of the first stage is the park IES’s investment cost, while the objective function of the second stage is the park IES’ operating cost. The two-stage robust planning model is expressed as Formula (24)
In the formula, n is the first stage decision variable, which is the planning capacity of each unit in the IES, u is an uncertain variable, representing wind and solar output and load power, x and y are the second stage decision variables where x is the 0–1 variable (Chen et al., 2022). The specific expression is shown in Formula (25)
The box-type uncertainty U set with proportional scaling of its upper and lower bounds is represented as Formula (26)
In the formula, u0 is the predictive value of wind and solar output and load power, and the typical daily data obtained after clustering is substituted in this paper. τ is the scaling ratio of uncertain sets.
Organize these constraints in Formula (11–22) into the following form
Where the coefficient matrix of the variables under the corresponding constraint are expressed as A, B, D, and E, and a and c represent constant matrix.
Solve the two-stage robust planning model by making the use of column-and-constraint generation (C&CG). Compared with other algorithms, such as the Benders-dual method, C&CG can effectively reduce the iterations. Because it adds variables and constraints related to the subproblem continuously when solving the master problem, and get an objective function value closer to the original (Liu et al., 2018).
Break down Equation (24), adding the cut plane constraint to the first stage gives the master problem MP as shown in Formula (29)
And then, converting the second stage into a dual problem gives the subproblem SP as shown in Formula (30)
The max-min double-layer problem is transformed into the max single-layer problem for solution using the Karush Kuhn-Tucker (KKT) condition.
In Formula (31), π is the vector of dual variables to the second stage problem. The third and fourth constraints in Formula (31) are complementary slackness conditions. They are nonlinear constraints and cannot be solved directly. These nonlinear constraints can be linearized by big-M method. For example, add a 0–1 variable ωj to the last constraint in Formula (31). Then, it can be reformulated as
The robust optimization of Formula (30) is transformed into a mixed integer linear programming problem through KKT condition and big-M method. Thus, the existing solver can be used to solve the problem and improve the solving speed.
This is the algorithm procedure:
Step1: Give a collection of u as the initial worst-case scenario, set , , and k = 1;
Step2: Solve master problem MP in (29). Get an optimal solution , then update ;
Step3: Solve subproblem SP in (30), get the objective function value of SP, and , then update ;
Step4: Give ε as the convergence threshold of the algorithm, if , return and terminate. Otherwise, add variables and constraints as following:
Update , return to step 2.
The IES structure of the park shown in Figure 1 is used as a simulation case to verify the effectiveness of the low-carbon planning model and the corresponding solving algorithm. The model is simulated on the platform of MATLAB 2019 and CPLEX Optimizer. The time of use price of distribution network is shown in Figure 2. The typical day curve selects a number of prediction scenarios throughout the year, and weighted averages the scenarios. The load curve, WT, and PV curve on the base day are shown in Figures 3, 4. Maximum allowable fluctuations of renewable energy and load in integrated energy systems can be set according to past historical forecast deviations. The natural gas price and carbon emission intensity are set to 3.32 yuan/m3 and 2.09 kgCO2/m3. Taking the calorific value of natural gas as 10.45 MWh/km3, the natural gas price and carbon emission intensity can be converted to 0.318/kWh and 0.20 kg/kWh. The average carbon emission intensity of the grid is 0.65 kg/kWh, without considering the change with time. The uncertainty of wind power is set as 0.05; the uncertainty of photovoltaic is set as 0.1. The uncertainty of electricity, thermal, and cooling load is set as 0.15. Relevant parameters of the park IES is shown in Table 1. Set the following three planning cases:
Case 1: Considering wind, solar, load uncertainty, without considering carbon emission constraints, renewable energy penetration constraints;
Case 2: Considering wind, solar, load uncertainty, only considering carbon emission constraint and not considering renewable energy penetration constraints; and
Case 3: Considering wind, solar, load uncertainty, without considering carbon emission constraints, only considering renewable energy penetration constraints.
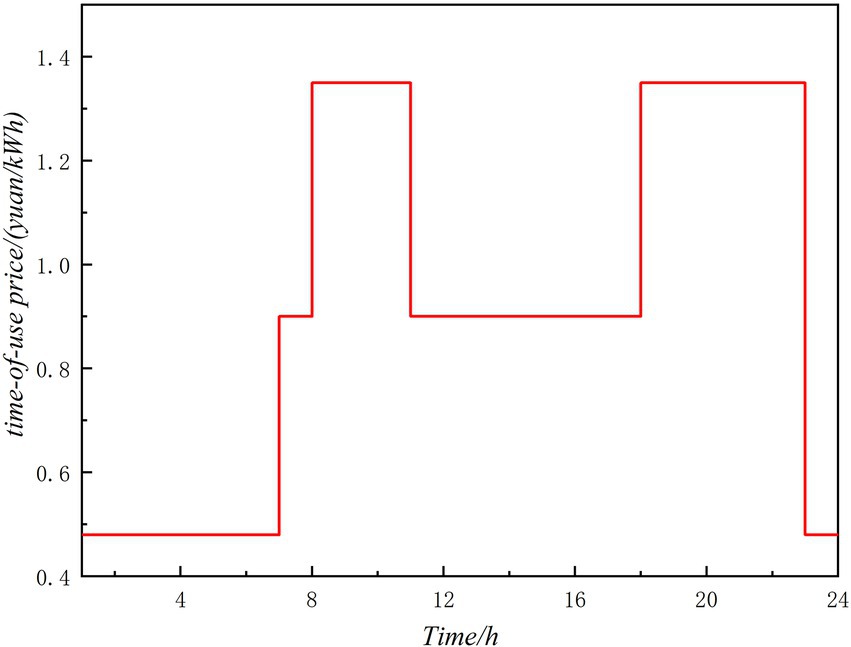
Figure 2. Time of use price of distribution network.
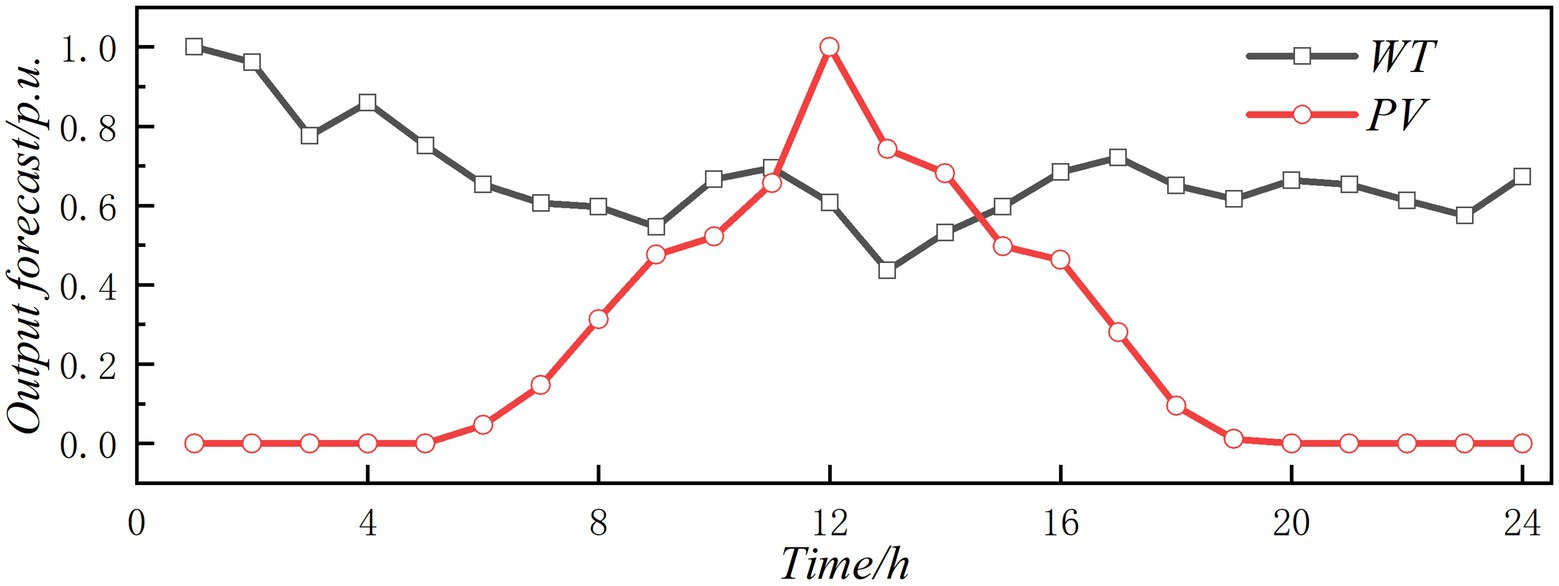
Figure 3. Unit value of typical daily renewable energy output.
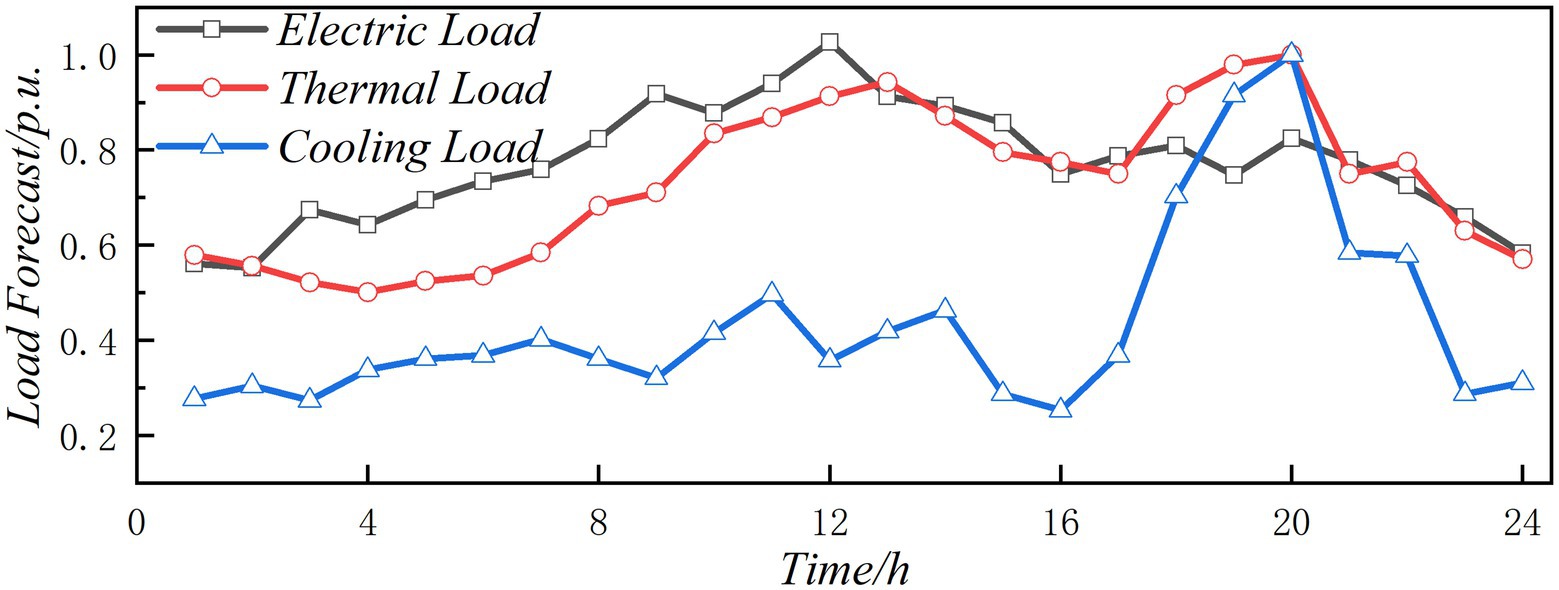
Figure 4. Unit value of typical daily load power.
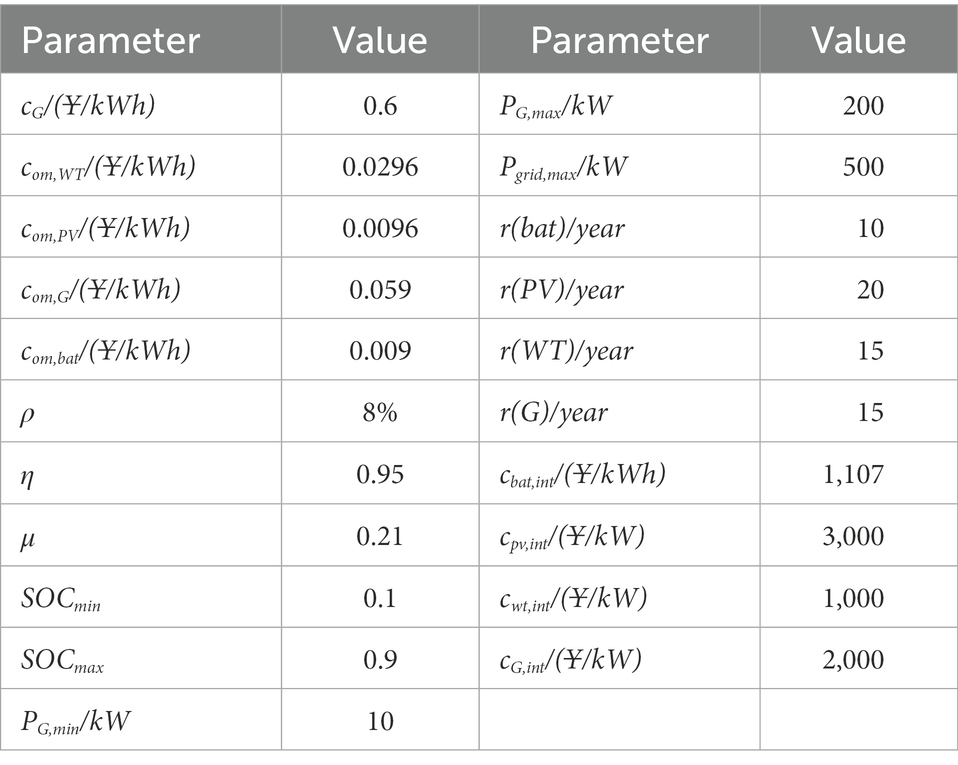
Table 1. Park IES planning parameters.
The results of unit capacity planning are shown in Figure 5. Without considering any low-carbon target, only the economic optimization is the goal. Low cost or high efficiency equipment still has the biggest competitive advantage, become the best choice in the park integrated energy system.
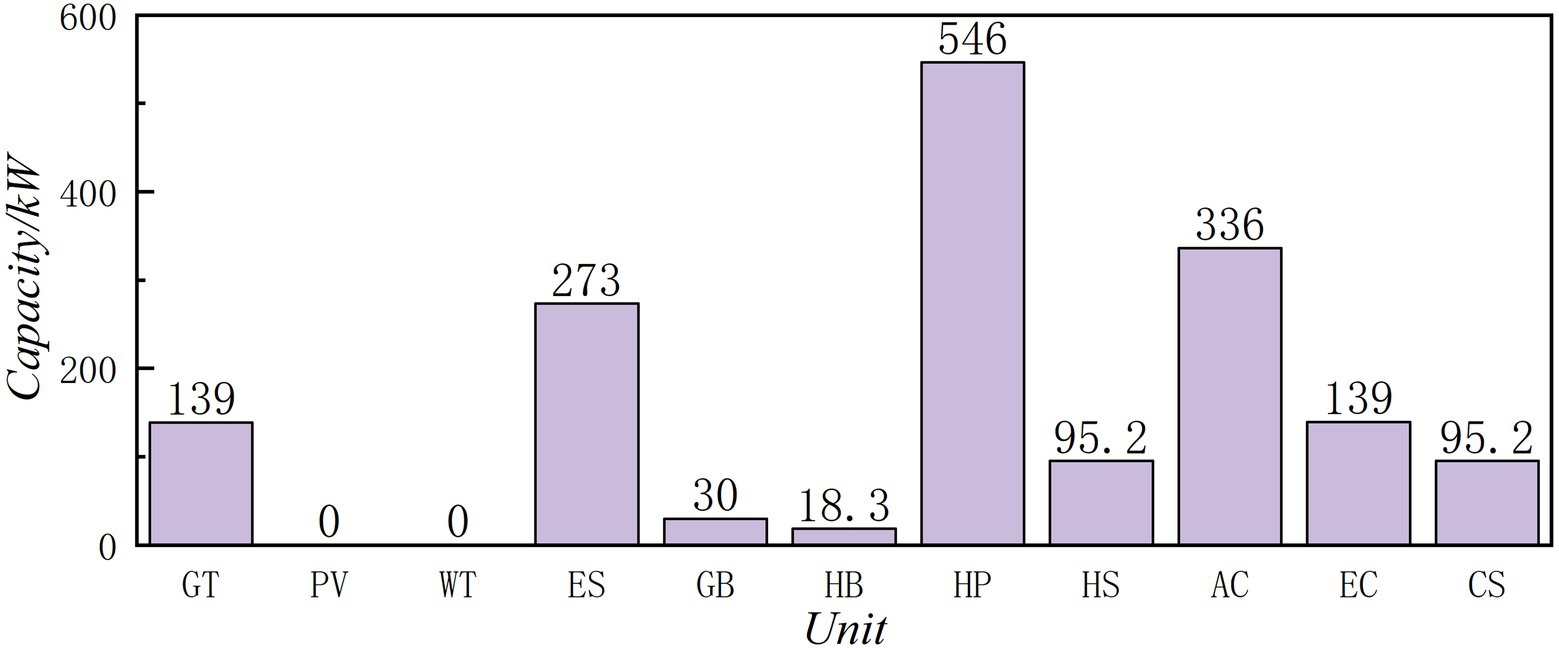
Figure 5. Unit planning capacity.
The Figure 6 shows the convergence curve of the algorithm of Case 1. At the fifth iteration, the algorithm reaches convergence, and in other cases, the number of iterations is less than 10. The effectiveness of the proposed algorithm is proved.
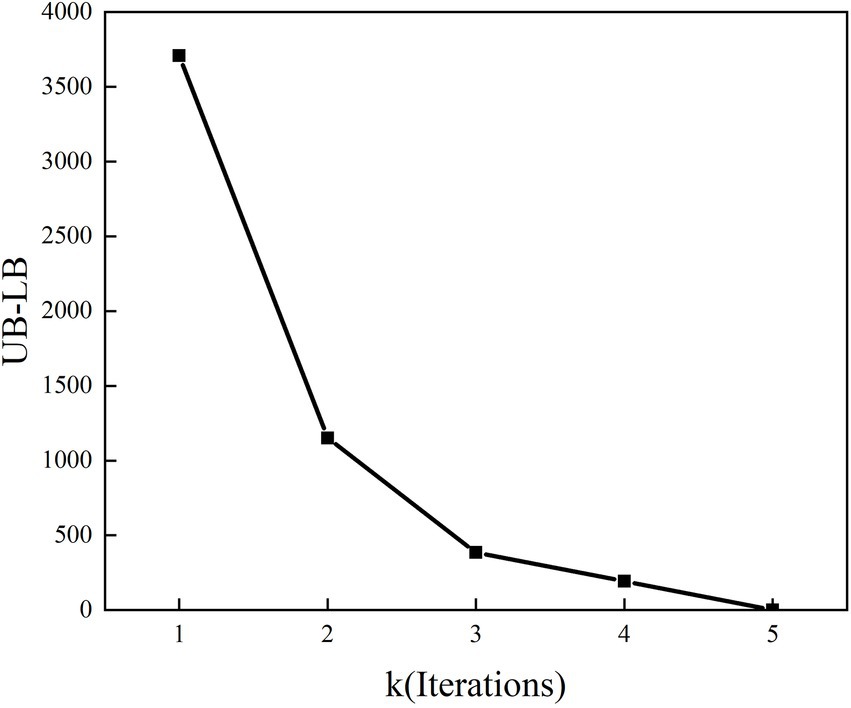
Figure 6. The number of algorithm iterations.
The carbon emission control target of the IES in a park in Tianjin is set to be 4,070 kg, equivalent to 48% reduction in the benchmark scenario. The optimal capacity configuration corresponding to the carbon emission target is shown in Figures 7, 8. Orange represents the capacity of the case 1, and green represents the difference between case 1 and case 2. Compared with case 1, due to the high-intensity carbon emission of distribution network power, the power input from the external energy system of the park is significantly reduced. On the contrary, more internal renewable energy and micro gas turbines are needed to reduce the carbon emission intensity of the park and achieve the established carbon emission reduction targets.
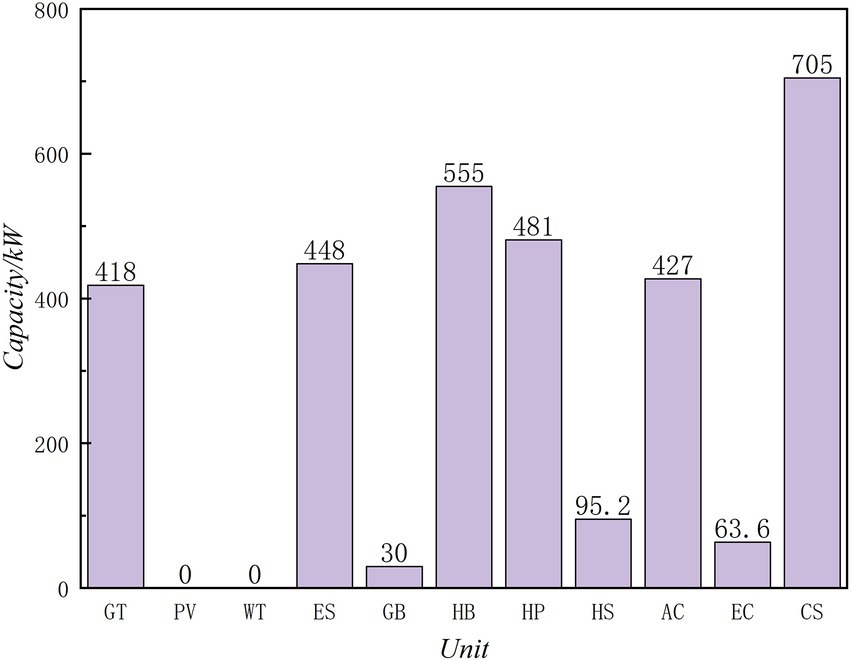
Figure 7. Unit planning capacity.
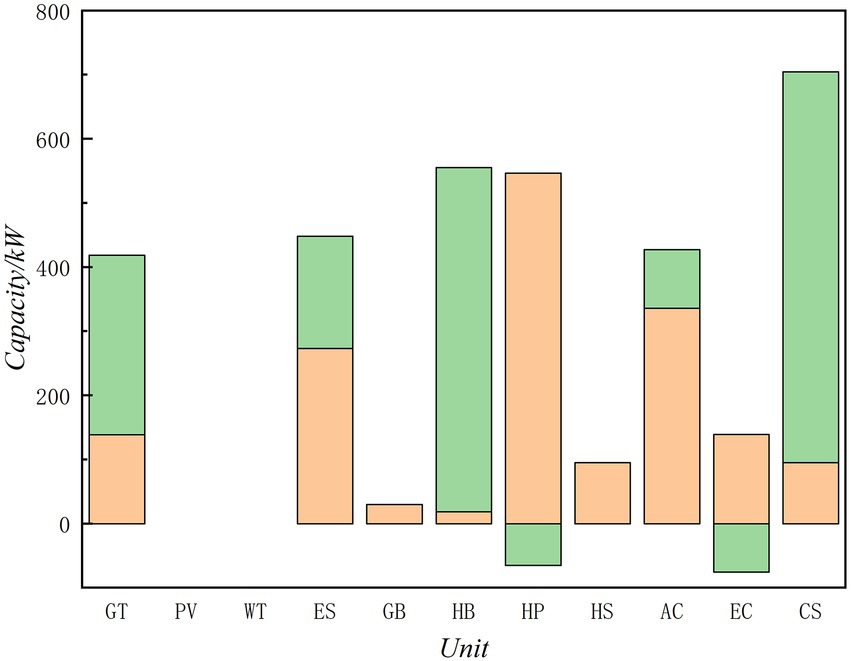
Figure 8. Capacity comparison of case 1 and case 2.
Case 3 is designed to have a minimum 30% penetration of renewable energy in the system. Figures 9, 10 show the best capacity allocation in accordance with the aim for the penetration of renewable energy sources. Green denotes the gap between case 1 and case 3, while orange reflects case 1’s capacity. The overall renewable energy output is 4,101 kW when the penetration of renewable energy output is taken into account. 32.2% of the electrical unit’s terminal power load and power consumption are accounted for by wind and solar production.
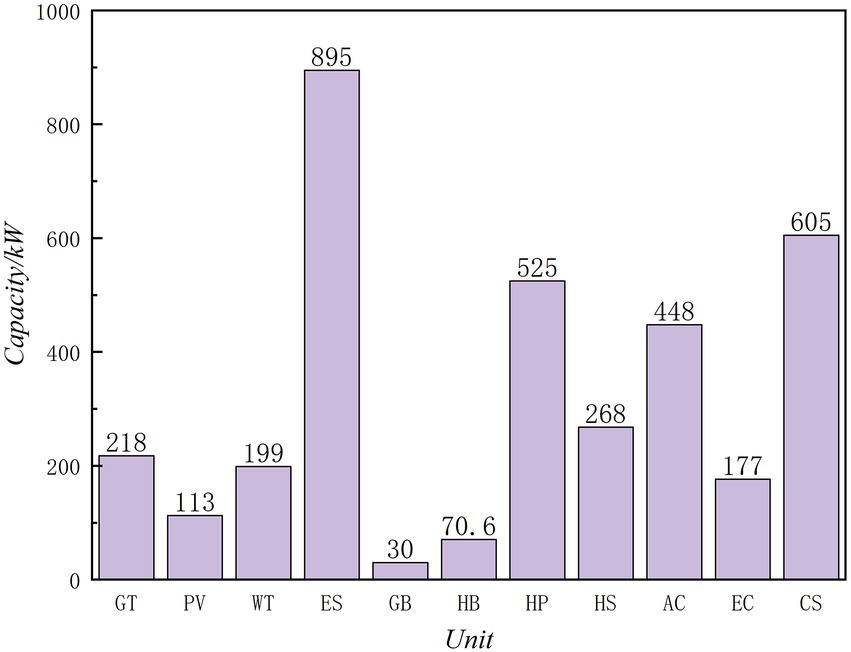
Figure 9. Unit planning capacity.
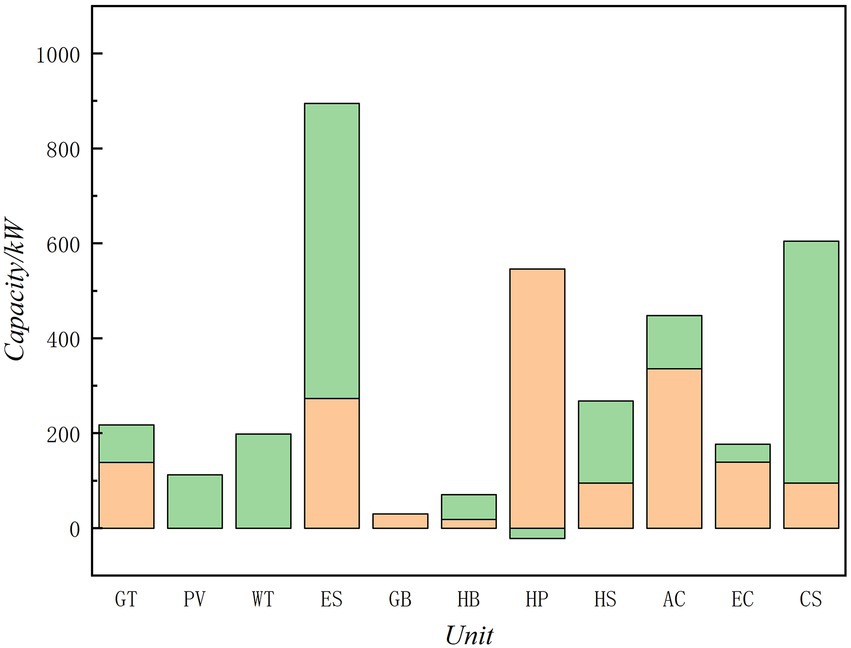
Figure 10. Capacity comparison of case 1 and case 3.
This section examines the effects of various carbon emission control and renewable energy penetration objectives on the planning outcomes and conducts a quantitative analysis of the park IES’s cost of carbon emission reduction and cost of renewable energy consumption. Figures 11–14 show the changes of the park’s planning results with carbon emission control objectives and renewable energy consumption objectives, including total carbon emissions, renewable energy penetration, total cost, average emission reduction cost, and average consumption cost. The results show that tightening carbon emission control objectives and increasing renewable energy penetration will increase the total cost of the system and reduce total carbon emissions within a specific bound, and low-carbon development must pay economic costs.
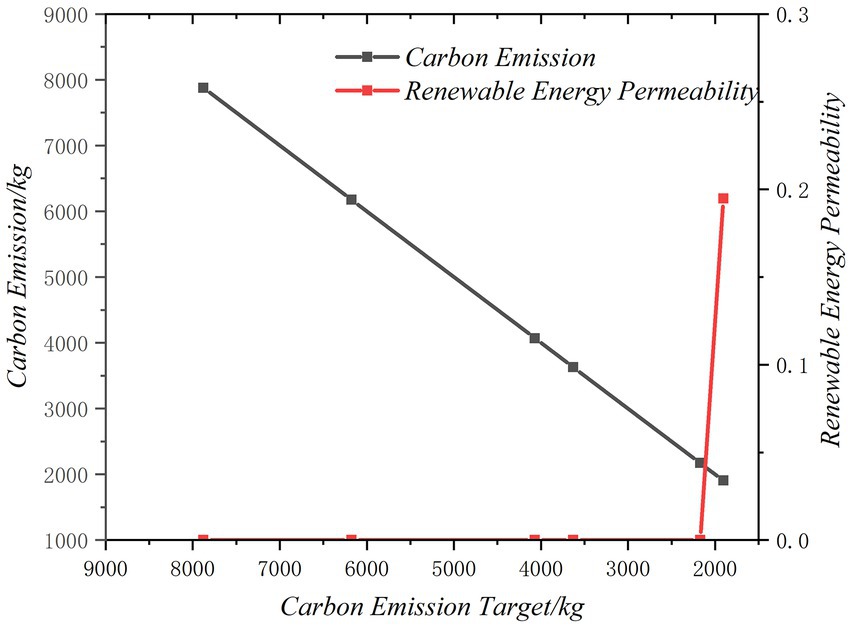
Figure 11. Carbon emission and renewable energy permeability.
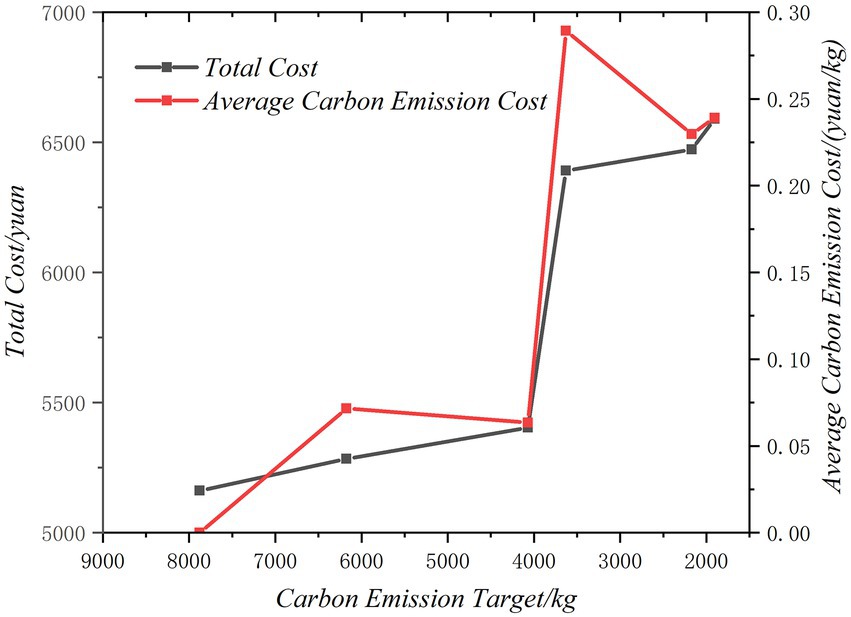
Figure 12. Total cost and average carbon emission cost.
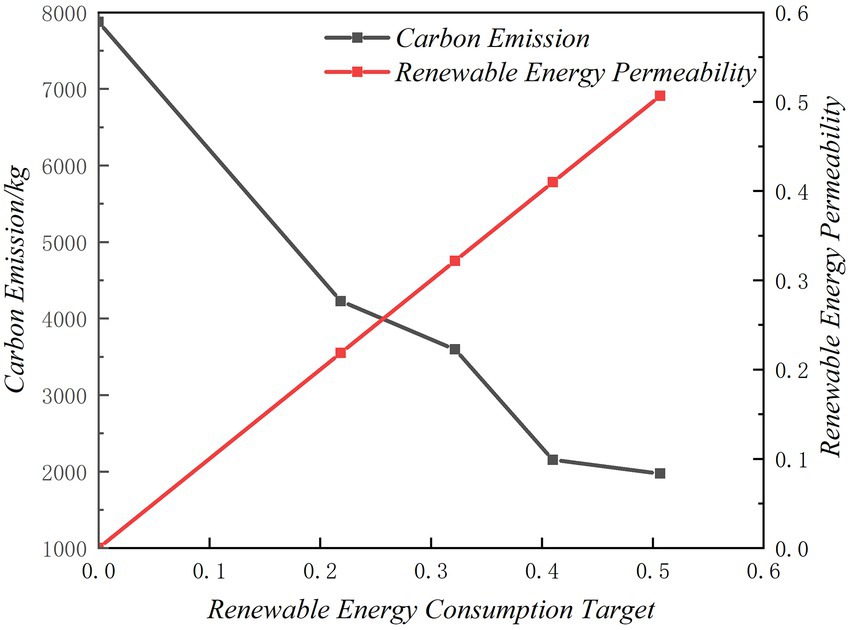
Figure 13. Carbon emission and renewable energy permeability.

Figure 14. Total cost and average carbon emission cost.
Figures 11, 12 illustrate the results of different carbon emission objectives. With the tightening of carbon emission control objectives, the average emission reduction cost and total cost are on the rise. Total costs have just begun to rise slowly, mainly due to high-cost gas turbine replacing grid power. When the emission reduction ratio is low, the system is easy to achieve emission reduction, and the penetration of renewable energy has not changed. With the further tightening of carbon emission reduction targets, only gas turbine is not enough to achieve emission reduction targets. The system needs to configure new energy power generation to meet the carbon emission targets, and the penetration of renewable energy increases.
Figures 13, 14 show the results of different renewable energy consumption targets. It is evident that the overall cost is also an upward trend, but the average consumption cost is a downward trend. In addition, although the total cost increases with the increase of renewable energy penetration, the upward trend is quite different. At the beginning stage, the penetration of renewable energy increased from 0 to 21.8%, and the total cost of the system increased by 1374.34 yuan/day. When the target of renewable energy penetration increased from 21.8 to 50%, the total cost of the system increased by 591.65 yuan/day. This is because the renewable energy penetration target is low, the investment cost of renewable energy units and energy storage in the system has increased, and when the renewable energy penetration target is further improved, the investment of renewable energy units and energy storage units increases slowly, mainly to adjust the operation state of the system.
In Figure 11, maintaining a renewable energy penetration of 0, carbon emissions can be reduced to a minimum of around 2000 kg, thus reducing carbon emissions does not imply an increase in renewable energy penetration. Figure 13 illustrates this, with the increase of renewable energy consumption target, the system’s carbon emissions progressively decline. When the renewable energy penetration rate is less than 0.3, the minimum carbon emissions decrease to about 3,500 kg, which is much higher than the minimum carbon emissions when the renewable energy penetration rate is 0 in Figure 11. From this perspective, the increase of renewable energy penetration does not mean the decrease of carbon emissions. Thus, while there is some synergy between low-carbon targets and renewable energy consumption targets, maximum renewable energy consumption does not mean minimum carbon emissions, and vice versa, in some cases increasing renewable energy penetration does not necessarily reduce carbon emissions. Although both goals can promote the development of renewable energy in general, they are quite different in operating conditions, so the two goals cannot be completely replaced in practice, but should be integrated.
In this paper, a two-stage robust planning model considering carbon emission constraints and renewable energy penetration constraints is adopted to study the planning of park IES. The main conclusions can be summarized as follows:
1. The proposed model takes into account the uncertainty and low carbon of renewable energy and load, which is conducive to the reasonable selection of comprehensive energy investors in the park between economy, environmental protection, and risk.
2. Although there is a certain synergy between the low-carbon target and the renewable energy consumption, the maximum renewable energy consumption does not mean the minimum carbon emissions, and vice versa. In some cases, increasing the permeability of renewable energy does not necessarily reduce carbon emissions. Although both goals can promote the development of renewable energy in general, they are quite different in operation, so the two goals cannot be completely replaced in practice, but should be integrated.
3. The results of the example analysis on the one hand prove the ability of the park IES to promote low carbon emission reduction, and the flexibility of the system can be enhanced by the coupling of various unit. On the other hand, it also quantitatively evaluates the comprehensive cost of the park IES to achieve carbon emission reduction. Therefore, the emission reduction potential of the system should be fully tapped in the low-carbon planning of the IES, so as to lay a good foundation for the subsequent operation scheduling.
With the increasingly close connection between the IES and the network and the diversification of user-side energy consumption, in terms of the future work, low-carbon planning can be further expanded, such as considering natural gas network (P2G technology), transportation network (electric vehicles), hydrogen energy storage, etc.
The original contributions presented in the study are included in the article/Supplementary material, further inquiries can be directed to the corresponding author.
SC designed and performed the simulations and obtained the results. SC, WS, and BW analyzed the obtained results. SC and BW wrote the paper, which was further reviewed by WS. All authors contributed to the article and approved the submitted version.
The work was financially supported by the National Key R&D Program of China (Grant No. SQ2021YFE010072).
We appreciate the reviewers’ and associate editor’s helpful comments, which helped to make this paper better.
The authors declare that the research was conducted in the absence of any commercial or financial relationships that could be construed as a potential conflict of interest.
All claims expressed in this article are solely those of the authors and do not necessarily represent those of their affiliated organizations, or those of the publisher, the editors and the reviewers. Any product that may be evaluated in this article, or claim that may be made by its manufacturer, is not guaranteed or endorsed by the publisher.
The Supplementary material for this article can be found online at: https://www.frontiersin.org/articles/10.3389/fevo.2022.1100089/full#supplementary-material
Bai, M., Sheng, W., Hu, X., Zhang, L., and Liu, K. (2018). “Optimal planning of interconnected integrated energy system at user side based on chance constrained programming.” in 2018 China International Conference on Electricity Distribution (CICED).
Bie, Z., Zhang, P., Li, G., Hua, B., Meehan, M., and Wang, X. (2012). Reliability evaluation of active distribution systems including microgrids. IEEE Trans. Power Syst. 27, 2342–2350. doi: 10.1109/TPWRS.2012.2202695
Bridge, G., Özkaynak, B., and Turhan, E. (2018). Energy infrastructure and the fate of the nation: introduction to special issue. Energy Res. Soc. Sci. 41, 1–11. doi: 10.1016/j.erss.2018.04.029
Chen, L., Tang, H., Wu, J., Li, C., and Wang, Y. (2022). A robust optimization framework for energy management of CCHP users with integrated demand response in electricity market. Int. J. Electr. Power Energy Syst. 141:108181. doi: 10.1016/j.ijepes.2022.108181
Cheng, X., Zheng, Y., Lin, Y., Chen, L., Wang, Y., and Qiu, J. (2021). Hierarchical operation planning based on carbon-constrained locational marginal Price for integrated energy system. Int. J. Electr. Power Energy Syst. 128:106714. doi: 10.1016/j.ijepes.2020.106714
Dou, C., Mi, X., Ma, K., and Xu, S. (2019). Coordinated operation of multi-energy microgrid with flexible load. J. Renew. Sustain. Energy 11:054101. doi: 10.1063/1.5113927
Fan, H., Yu, Z., Xia, S., and Li, X. (2021). Review on coordinated planning of source-network-load-storage for integrated energy systems. Front. Energy Res. 9:641158. doi: 10.3389/fenrg.2021.641158
He, F., Xu, Y., Zhang, X., Liu, C., and Chen, H. (2015). Hybrid CCHP system combined with compressed air energy storage. Int. J. Energy Res. 39, 1807–1818. doi: 10.1002/er.3303
Huang, A. Q., Crow, M. L., Heydt, G. T., Zheng, J. P., and Dale, S. J. (2011). The future renewable electric energy delivery and management (FREEDM) system: the energy internet. Proc. IEEE 99, 133–148. doi: 10.1109/JPROC.2010.2081330
Jin, J., Zhou, P., Li, C., Guo, X., and Zhang, M. (2019). Low-carbon power dispatch with wind power based on carbon trading mechanism. Energy 170, 250–260. doi: 10.1016/j.energy.2018.12.126
Lei, Y., Wang, D., Jia, H., Chen, J., Li, J., Song, Y., et al. (2020). Multi-objective stochastic expansion planning based on multi-dimensional correlation scenario generation method for regional integrated energy system integrated renewable energy. Appl. Energy 276:115395. doi: 10.1016/j.apenergy.2020.115395
Li, P., Wang, Z., Wang, J., Yang, W., Guo, T., and Yin, Y. (2021). Two-stage optimal operation of integrated energy system considering multiple uncertainties and integrated demand response. Energy 225:120256. doi: 10.1016/j.energy.2021.120256
Liu, Y., Guo, L., and Wang, C. (2018). A robust operation-based scheduling optimization for smart distribution networks with multi-microgrids. Appl. Energy 228, 130–140. doi: 10.1016/j.apenergy.2018.04.087
Liu, X., Li, X., Tian, J., and Cao, H. (2021). Low-carbon Economic Dispatch of Integrated Electricity and Natural Gas Energy System Considering Carbon Capture Device. Trans. Inst. Meas. Control.. doi: 10.1177/01423312211060572 (In Press).
Liu, S., Lin, Z., Zhao, Y., Liu, Y., Ding, Y., Zhang, B., et al. (2020). Robust system separation strategy considering online wide-area coherency identification and uncertainties of renewable energy sources. IEEE Trans. Power Syst. 35, 3574–3587. doi: 10.1109/TPWRS.2020.2971966
Liu, H., and Nie, S. (2019). Low carbon scheduling optimization of flexible integrated energy system considering CVaR and energy efficiency. Sustain. For. 11:5375. doi: 10.3390/su11195375
Liu, S., You, S., Lin, Z., Zeng, C., Li, H., Wang, W., et al. (2022). Data-driven event identification in the U.S. power systems based on 2D-OLPP and RUSBoosted trees. IEEE Trans. Power Syst. 37, 94–105. doi: 10.1109/TPWRS.2021.3092037
Ma, Y., Wang, H., Hong, F., Yang, J., Chen, Z., Cui, H., et al. (2021). Modeling and optimization of combined heat and power with power-to-gas and carbon capture system in integrated energy system. Energy 236:121392. doi: 10.1016/j.energy.2021.121392
Mirakyan, A., and De Guio, R. (2015). Modelling and uncertainties in integrated energy planning. Renew. Sust. Energ. Rev. 46, 62–69. doi: 10.1016/j.rser.2015.02.028
Pickering, B., and Choudhary, R. (2019). District energy system optimisation under uncertain demand: handling data-driven stochastic profiles. Appl. Energy 236, 1138–1157. doi: 10.1016/j.apenergy.2018.12.037
Sah, D. K., Hazra, A., Kumar, R., and Amgoth, T. (2022). Harvested Energy Prediction Technique for Solar-powered Wireless Sensor Networks. IEEE Sensors J.. doi: 10.1109/JSEN.2022.3208730 (In press).
Sun, P., Hao, X., Wang, J., Shen, D., and Tian, L. (2021). Low-carbon economic operation for integrated energy system considering carbon trading mechanism. Energy Sci. Eng. 9, 2064–2078. doi: 10.1002/ese3.967
Sun, D., Liu, Z., Shao, J., and Lin, Z. (2022). Review on low carbon planning and operation of integrated energy systems. Energy Sci. Eng. 10, 3201–3215. doi: 10.1002/ese3.1167
Tang, L., Gou, X., Liang, J., Yang, Y., Yuan, X., Yang, J., et al. (2022). A two-stage planning optimization study of an integrated energy system considering uncertainty. Sustain. For. 14:3645. doi: 10.3390/su14063645
Wang, J., Du, W., and Yang, D. (2021). Integrated energy system planning based on life cycle and Emergy theory. Front. Energy Res. 9:713245. doi: 10.3389/fenrg.2021.713245
Wang, Y., Huang, F., Tao, S., Ma, Y., Ma, Y., Liu, L., et al. (2022). Multi-objective planning of regional integrated energy system aiming at exergy efficiency and economy. Appl. Energy 306:118120. doi: 10.1016/j.apenergy.2021.118120
Wang, Y., Li, R., Dong, H., Ma, Y., Yang, J., Zhang, F., et al. (2019a). Capacity planning and optimization of Business Park-level integrated energy system based on investment constraints. Energy 189:116345. doi: 10.1016/j.energy.2019.116345
Wang, Y., Song, F., Ma, Y., Zhang, Y., Yang, J., Liu, Y., et al. (2020). Research on capacity planning and optimization of regional integrated energy system based on hybrid energy storage system. Appl. Therm. Eng. 180:115834. doi: 10.1016/j.applthermaleng.2020.115834
Wang, Y., Wang, X., Yu, H., Huang, Y., Dong, H., Qi, C., et al. (2019b). Optimal design of integrated energy system considering economics, autonomy and carbon emissions. J. Clean. Prod. 225, 563–578. doi: 10.1016/j.jclepro.2019.03.025
Wen, J., Zheng, Y., and Donghan, F. (2009). A review on reliability assessment for wind power. Renew. Sust. Energ. Rev. 13, 2485–2494. doi: 10.1016/j.rser.2009.06.006
Xue, Y., Zheng, Y., and Rahman, S. (2019). Proceedings of PURPLE MOUNTAIN FORUM 2019-International Forum on Smart Grid Protection and Control. Springer.
Yan, Q., Ai, X., and Li, J. (2021). Low-carbon economic dispatch based on a CCPP-P2G virtual power plant considering carbon trading and green certificates. Sustain. For. 13:12423. doi: 10.3390/su132212423
Zhang, G., Xie, P., Huang, S., Chen, Z., Du, M., Tang, N., et al. (2021). Modeling and Optimization of Integrated Energy System for Renewable Power Penetration considering Carbon and Pollutant Reduction Systems. Front. Energy Res. 9:767277. doi: 10.3389/fenrg.2021.767277
Zeng, B., and Zhao, L. (2013). Solving two-stage robust optimization problems using a column-and-constraint generation method. Oper. Res. Lett. 41, 457–461. doi: 10.1016/j.orl.2013.05.003
Zhai, J., Wu, X., Zhu, S., and Liu, H. (2019). “Low carbon economic dispatch of regional integrated energy system considering load uncertainty.” in 2019 34rd Youth Academic Annual Conference of Chinese Association of Automation (YAC).
Keywords: park integrated energy system, low carbon, robust optimization, capacity planning, renewable energy
Citation: Chen S, Su W and Wu B (2023) Two stage robust planning of park integrated energy system considering low carbon. Front. Ecol. Evol. 10:1100089. doi: 10.3389/fevo.2022.1100089
Edited by:
Praveen Kumar Donta, Vienna University of Technology, AustriaReviewed by:
Abhishek Hazra, National University of Singapore, SingaporeCopyright © 2023 Chen, Su and Wu. This is an open-access article distributed under the terms of the Creative Commons Attribution License (CC BY). The use, distribution or reproduction in other forums is permitted, provided the original author(s) and the copyright owner(s) are credited and that the original publication in this journal is cited, in accordance with accepted academic practice. No use, distribution or reproduction is permitted which does not comply with these terms.
*Correspondence: Wanhua Su, ✉ MjAxOTIwMTE0NUB0anUuZWR1LmNu
Disclaimer: All claims expressed in this article are solely those of the authors and do not necessarily represent those of their affiliated organizations, or those of the publisher, the editors and the reviewers. Any product that may be evaluated in this article or claim that may be made by its manufacturer is not guaranteed or endorsed by the publisher.
Research integrity at Frontiers
Learn more about the work of our research integrity team to safeguard the quality of each article we publish.