- 1Institute for Environmental Studies, Faculty of Science, Charles University, Benatska, Prague, Czechia
- 2Department of Zoology, Faculty of Science, Charles University, Vinicna, Prague, Czechia
- 3School of Biological and Behavioural Sciences, Queen Mary University of London, London, United Kingdom
Although the concept of trophic interactions has been used for a long time, there are still considerable gaps in our understanding of the effect of various environmental factors on trophic interactions within river fish assemblages. Carbon (δ13C) and nitrogen (δ15N) stable isotope ratios of 20 species of fish belonging to both eurytopic and rheophilic ecological groups from a large temperate rivers were used to evaluate overall trophic niche use and trophic position of species, and to find out how environmental variability associated with nutrient loading affects individual and community-wide aspects of trophic structure. The study was carried out at 11 sites along the European rivers Vltava and Elbe, representing a continuous gradient of pollution and habitat degradation. Corrected Standard Ellipse Area (SEAc) was significantly larger for the group of eurytopic ecological species than for rheophilic species. Despite narrower isotopic niche space, rheophilic fish species occupied a higher trophic position, suggesting that these species use resources more enriched in 15N. Of the 11 environmental variables tested, nutrients had a significant effect on trophic niche area of species (SEAc), indicating that eutrophication is of critical importance for fish assemblages. Isotopic niche area of species was found to be positively influenced by total phosphorus, and negatively affected by concentrations of nitrate (N-NO3−) and ammonia (N-NH4+). A negative association between oxygen demand and a measure of trophic diversity - mean distance to centroid (CD)- and a measure of density and clustering of species - mean nearest neighbor distance (MNND)- were found, indicating that the oxygen demand is a key factor influencing community trophic structure. An observed pattern where nutrient loading influenced both individual species and trophic structure of the fish assemblage provides strong support for an anthropogenic influence on riverine food webs.
1. Introduction
Human induced habitat alterations such as river regulation, flow adjustments, eutrophication, and pollution generally lead to degradation of riverine environments, resulting in a worldwide reduction in the ecological quality of fish assemblages (Duncan and Lockwood, 2001; Freeman et al., 2003; Aarts et al., 2004; Musil et al., 2012). As such, freshwaters are among the habitats most endangered by loss of biodiversity (Xie et al., 2003; Dudgeon et al., 2006; Erős et al., 2019). In anthropogenically impacted rivers, fish species with generalist requirements are expected to have an advantage over more specialized ones. Generalist species often exhibit limited migration behavior (Baras et al., 1994; Winter and Fredrich, 2003), lower habitat preference (Capra et al., 2018), or more general use of trophic resources (Guinan et al., 2015). As a result, guilds of specialist rheophilic species, that are highly adapted to specific riverine conditions, have declined more than generalist eurytopic species (Valová et al., 2006; Latli et al., 2018; Bierschenk et al., 2019; Maire et al., 2019).
From the trophic perspective, eurytopic fish species may pose potential threats to rheophilic species in anthropogenically degraded freshwater ecosystems (Aarts and Nienhuis, 2003; Aarts et al., 2004) as they can shift diet and resources therefore leading to more competition with specialized taxa. However, the outcome of feeding interactions may also be shaped by various environmental factors associated with nutrient loading. An assessment of trophic interactions of river fish assemblages affected by increased nutrient supply is of considerable importance (Yates and Bailey, 2010; de Carvalho et al., 2020; Wang et al., 2021).
When evaluating the impact of nutrient loading, fish become one of the most important indicators of community responses as they typically occupy higher trophic levels and reflect long-term changes in ecosystems (Bierschenk et al., 2019). Understanding the implications of nutrient loading for isotopic niche characteristics of riverine fishes is a therefore a key question as it may allow prediction of functional shifts in river ecosystems (Olin et al., 2002; Warry et al., 2016; Bierschenk et al., 2019). Nutrient addition is assumed to alter ecosystem function with a bell shaped response (Heiskary and Bouchard, 2015; Schmutz and Sendzimir, 2018). Nutrients alter resource quantity and quality, and via influence on primary producers alter the density and species composition of herbivores, and are further transferred to higher trophic levels. Although a slight increase in nutrients may have a positive effect on communities, excessive nutrient loading may induce deterioration of basal resource diversity (Hilton et al., 2006) with subsequent cascading effects (Kratina and Winder, 2015; De Castro et al., 2016; Price et al., 2019).
Such changes associated with intensive land use can result in increased omnivorous feeding in generalist species of fish (Champagne et al., 2022). For example, in the study of Champagne et al. (2022), it has been shown that in an ecosystem with high agricultural intensity, generalist fish may become more omnivorous and occupy lower trophic positions owing to greater consumption of algae and less energy derived from terrestrial pathways. On the contrary, in streams with reduced aquatic secondary production, the reliance of fish on terrestrial resources could increase as they compensate for the loss of aquatic resources (Kraus et al., 2016). Based on these findings, it can be suggested that the generalist fish species increase their trophic niche size but could have lower trophic position in river fish assemblages affected by increased nutrients inputs. On the contrary, rheophilic species (e.g., benthivores) are known to consume mostly terrestrial and benthic macroinvertebrates (Kottelat and Freyhof, 2007), which may result in higher trophic position demonstrated in these specialist fish species.
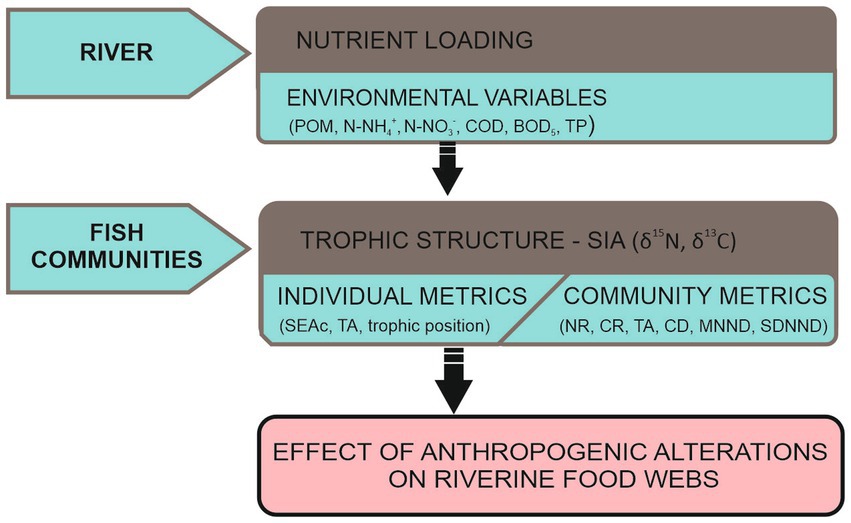
In this study we used stable isotope analysis to examine how environmental factors associated with increased nutrient inputs affects both individual and community trophic structure (Figure 1). The study was carried out at 11 sites along the Vltava and Labe rivers, Czech rivers representing a continuous gradient of pollution and habitat degradation due to anthropogenic activities. The objectives of this study were to (1) identify the isotopic niche (TA, SEAc) and trophic position of rheophilic and eurytopic group of species, and (2) to evaluate the effect of environmental variables on the trophic structure of fish assemblages. We predict that eutrophication would be the major factor that would influence trophic niche area and trophic position of fish in the food chain. To evaluate the influence of nutrient loading on trophic niche of fish assemblages, we related in-stream chemical variables to observed trophic patterns.
2. Materials and methods
2.1. Sample preparation and measurement
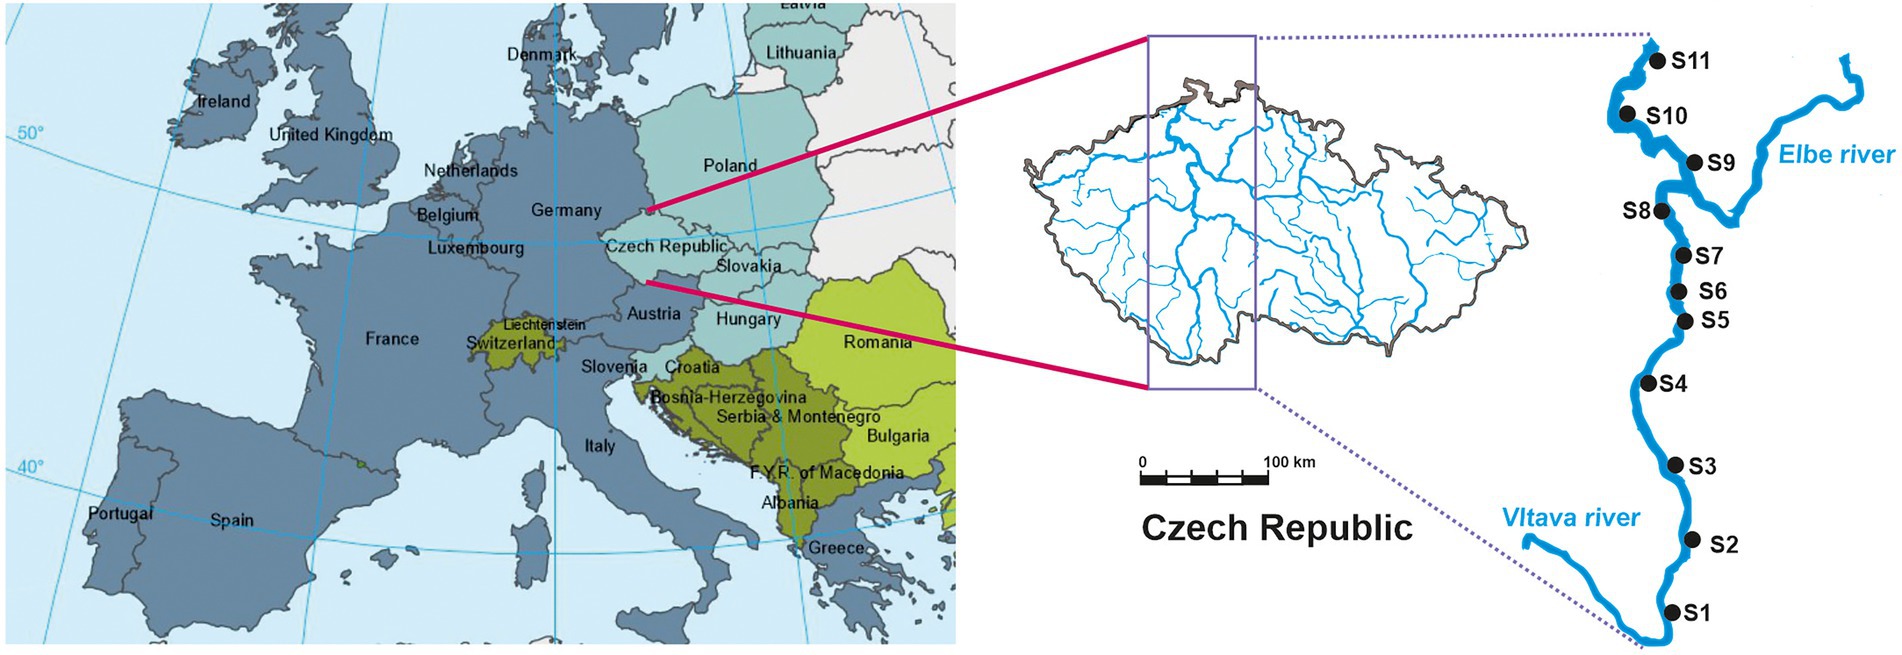
Data were collected from the rivers Vltava and Elbe in the Czech Republic, central Europe (Figure 2; EEA Map of Europe. European Environment Agency, 2022). A total of 11 sites were explored to obtain a gradient of anthropogenic stressors (Figure 2), eight (S1–S8) on the Vltava and three on the Elbe (S9–S11). The Vltava is the longest river within the Czech Republic, with a basin area of 28,090 km2 and 43 km length. The Vltava is one of the main tributaries of the Elbe. The eight sites were located from the headwaters to near the confluence with the Elbe at Mělník, 837 km from the source of the Elbe. The Elbe is one of the major rivers of Europe. It rises in the Giant Mountains of northern Czech Republic, flows through Germany and discharges into the North Sea near Hamburg. Samples were collected from the Elbe at three sampling sites 818, 767 and 738 km from the source and downstream of the confluence with the Vltava, with the most downstream at Děčín on the German border. All surveys of fish and invertebrates were performed May to June 2019. Sampling sites S1, S2, S3, S6, S8 were natural or near natural river habitats surrounded by naturally heterogeneous habitats, and characterized by a combination of shallow fast-flowing reaches interspersed with deeper and slower flowing sections, enabling the development of aquatic vegetation. Sites S4, S5, S6, S7, S8, S9, S10, S11 were characterized by a higher degree of anthropogenic degradation of habitats, either channelized for navigation and influenced by the presence of weirs and dredging of the riverbed, or impacted by fortification of banks by concrete and stones which considerably reduces the development of aquatic and riverine vegetation, leading to reduced habitat heterogeneity (Figure 2).
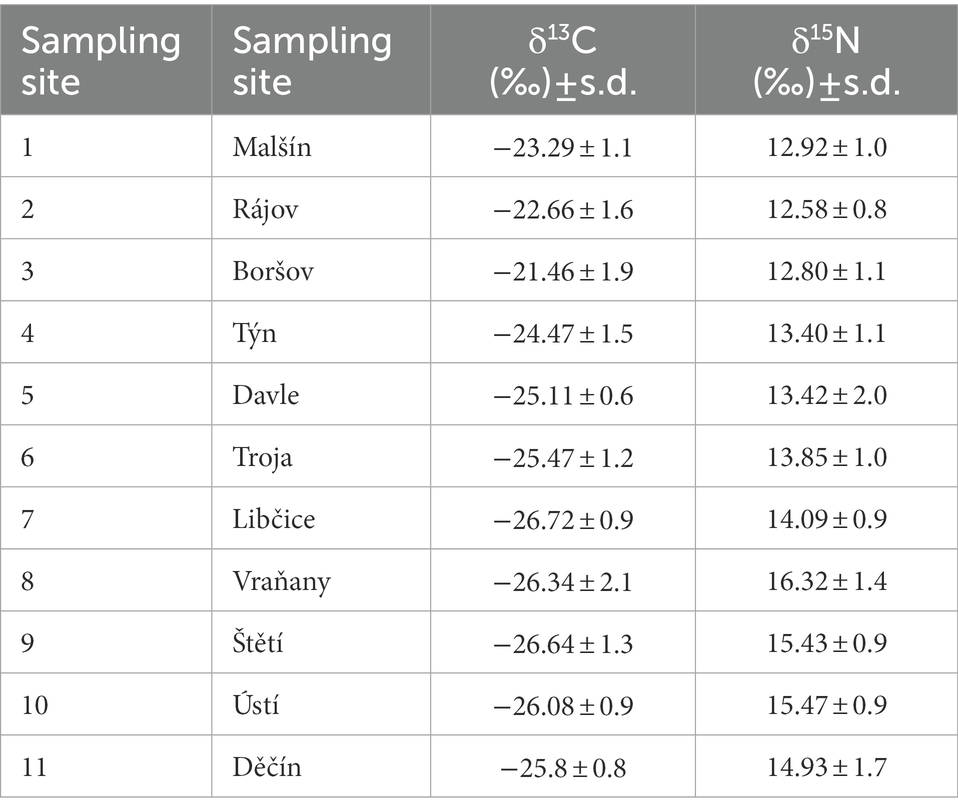
Samples of fish were collected by electric fishing, with an output voltage of 300–600 V (50 Hz) powered by a Honda engine and a LENA generator (Bednář, Czech Republic1). Fish were caught by electrofishing using a two-pass depletion method (Seber and Le Cren, 1967) to ensure representative estimates of fish abundance at each site. Fish were collected using both qualitive and quantitative methods to survey the whole community. Overall, 754 individuals of 20 fish species were used for determination of isotopic ratios and samples were kept frozen until laboratory processing. At the same time, benthic invertebrates were collected from each site, all samples were held on ice for later analyses. Invertebrates were sampled by the kick-sampling method (Frost, 1971), using a net with a 500 μm mesh size and the same sampling effort. Various type of substrate were sampled at eight different points at each study site, to ensure that individuals from various habitats were present in each sample. Collected invertebrates were identified, mainly to genus. All samples were held on ice for later analyses. Isotopic ratios of aquatic invertebrate consumers were used as a baseline to calculate trophic position of fish species (Post, 2002). In the laboratory, all fish were identified to species, measured (Standard Length, mm), weighed (Total Weight, g) and samples of dorsal muscle tissue dissected from a minimum of 3–12 adult individuals per species for stable isotope analysis according to availability (Table 1; Supplementary Table S1). All institutional and national animal welfare guidelines were followed (law no. 246/1992), and approved by the ethical committee of the Faculty of Science, Charles University, Prague. Fish species were classified into eurytopic and rheophilic ecological guilds according Aarts et al. (2004).
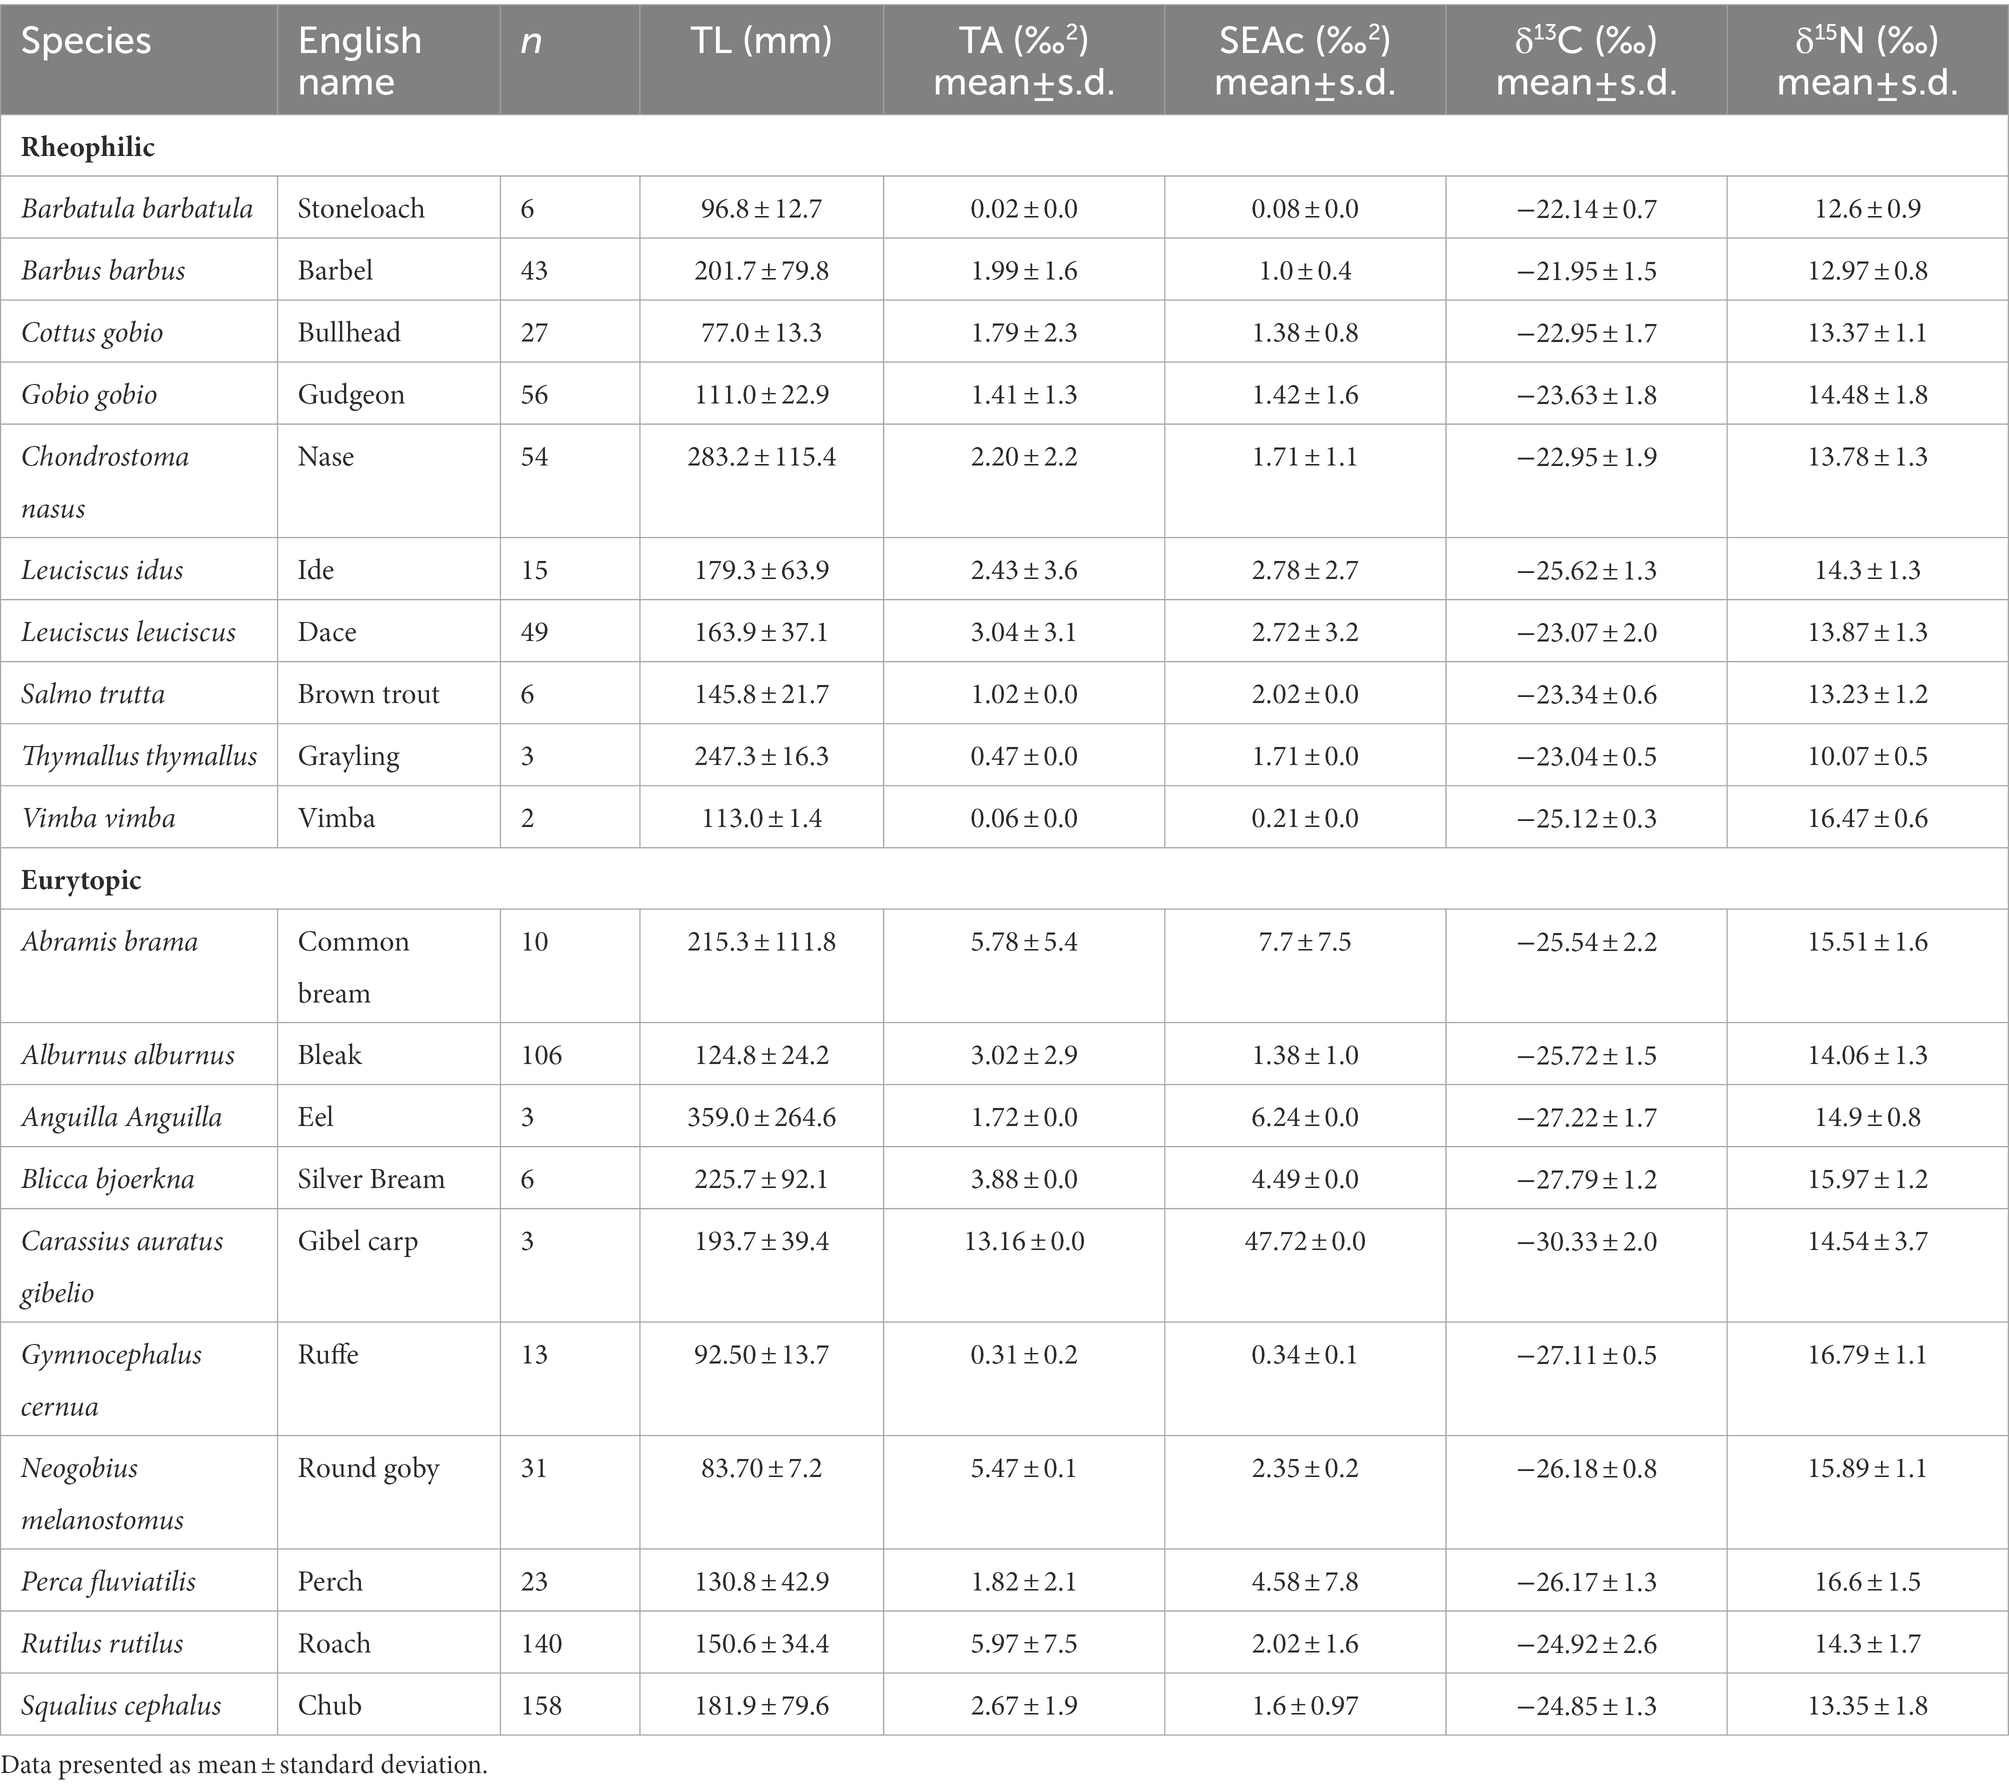
Table 1. Number of samples and size of individuals (Total Length: TL) used for each fish species, together with species level Bayesian trophic niche metrics measured, including the total area of convex hull (TA), Standard Ellipse Area (SEA), ellipse area corrected for small sample size (SEAc), species-specific variance in δ13C and δ15N.
To evaluate the influence of nutrient loading on trophic niche of fish assemblages, we related in-stream chemical variables to observed trophic patterns. Water quality data for each sampling sites was derived from long-term nutrient concentration monitoring by the Czech Hydrometeorological Institute, CHMI2, which conducts monthly monitoring at the sampling sites. Environmental parameters included pH, dissolved oxygen (DO, mg l−1), total nitrogen (TN, mg l−1), nitrate (N-NO3−, mg l−1), ammonium (N-NH4+ mg l−1), phosphate (P-PO43−, mg.l−1), total phosphorus (TP, mg.l−1), BOD5 (biological oxygen demand), COD (chemical oxygen demand), POM (particulate organic matter), DOM (dissolved organic matter, conductivity and chlorophyl-a). The frequency of nutrient sampling ranged from weekly to monthly, with an average of 12 samples per locality per year (i.e., monthly sampling).
2.2. Stable isotope analysis
Samples of invertebrates and fish muscle tissue for isotopic analysis were oven dried at 60°C to constant mass prior to analysis. Samples were homogenized using ball mill (MM400, Retsch, Germany) and 0.5 ± 0.05 mg of material was weighed into tin capsules. Total carbon and nitrogen content and isotopic ratios (δ15N and δ13C) were determined using a Delta V Advantage mass spectrometer coupled to Conflo IV and elemental analyzer Flash 2000 with TCD detector (all instrumentation by Thermo Fisher Scientific, Bremen, Germany) at the Centre for Stable Isotope Research of the Charles University, Prague. The carbon and nitrogen isotope ratios are expressed following the delta notation, as follows: δX = (Rsample/Rstandard – 1)*1,000, where, where X is 13C or 15N, respectively, and R is the relative amount of carbon or nitrogen isotopes (R = 13C/12C or 15N/14N). Isotope ratios were normalized using international standards; carbon isotope ratios were reported against the Vienna Pee Dee Belemnite (VPDB) scale, while nitrogen isotope ratios were reported against atmospheric N2. In addition to repeated measurements of a series of international standards (IAEA-CH3, IAEA-CH6, IAEA-600, IAEA-N1, IAEA-N2, IAEA-NO3), after every 10th sample a glycine standard was included to provide calibration for elemental composition and serve as a quality control for isotopic measurement. Analytical precision was within ±0.2 ‰ for both δ13C and δ15N (Table 2). As the lipid content was consistently low in samples (C:N < 3.5), lipid correction was not used (Post et al., 2007).
2.3. Data analyses
All statistical analyses were conducted using R 4.0.5 (R Core Team, 2021). To reveal food niche space, Bayesian ellipse analyses were used via the SIBER package (Stable Isotope Bayesian Ellipses in R3; Jackson et al., 2011). For each fish species, isotopic niche breadth was determined as standard ellipse area corrected for small sample size (SEAc) and total convex hull area (TA). We also used δ13C and δ15N to calculate trophic position and to evaluate trophic niche space of species (Layman et al., 2007). Relative position of species on δ13C-δ15N bi-plots was used to infer aspects of food web structure. To enable robust statistical comparisons among assemblages, we used δ13C and δ15N to describe six community-wide metrics as proposed by Layman et al. (2007), that reflect important aspects of trophic structure. The first four metrics were measures of the total extent of spacing within δ13C-δ15N bi-plot space, i.e., community-wide measures of trophic diversity. For each locality we calculated δ15N range (NR) as a measure of trophic height of the community and δ13C range (CR) as an estimate of the diversity of basal resources, total area of the convex hull encompassing the data points (TA) giving in indication of niche width of the community, mean distance to centroid (CD) as a measure of trophic diversity, mean nearest neighbor distance (MNND) providing a measure of density and clustering of species within the community, and standard deviation of MMND (SDNND) giving a measure of evenness of spatial density and packing. The final two metrics reflect the relative positions of species within niche space and can be used to estimate the extent of trophic redundancy (MNND/SDNND: Layman et al., 2007; Jackson et al., 2011).
The trophic position of fish species was calculated as TP = [(δ15Nfish – δ15Nbaseline)/3.4] + 2 (Cabana and Rasmussen, 1996), where aquatic invertebrates were used as a baseline (Vander Zanden and Rasmussen, 1999; Phillips et al., 2014). The constant 3.4‰ was used to reflect diet-tissue enrichment per trophic level (Minagawa and Wada, 1984). Nested ANOVA was used to compare mean values of trophic niche area and trophic position among ecological groups and river sites. As the data did not fulfil the criteria for parametric tests, logarithmic transformation was used to ensure normality. Simple linear regression models were used to examine relationships between the environmental variables and community metrics. To evaluate the influence of physico-chemical parameters on the trophic niche and trophic position of fish species, “lme4” (Bates et al., 2014) was used to fit linear mixed effects models LMMs and “lmerTest” (Kuznetsova et al., 2014) used to obtain value of ps for the fixed effects. We performed model selection based on the information-theoretic approach to assess the relative importance of all possible combination of predictor variables (Burnham and Anderson, 2002). Using Akaike Information Criterion corrected for small sample sizes (AICc) and best subset analysis in the package “leaps” (Lumley and Miller, 2004; Supplementary Table S2), we assessed relative performance of every combination of predictor variables. We included the variable “species” and “sampling site” as random effects in all models. T-tests were used to evaluate differences in trophic niche area among species and community metrics among sites.
3. Results
3.1. Trophic niche area of species
SEAc (Standard Ellipse Area Corrected; Jackson et al., 2011; Figure 3A) was significantly larger for eurytopic fish than rheophilic (Figure 3A; F1,74 = 1.902; p = 0.038). Total area of convex hull (TA) of eurytopic species was larger the for rheophilic species (F1,74 = 6.372; p < 0.01), indicating that eurytopic fish occupy a larger isotopic niche space than rheophilic fish. Mean SEAc was highest for gibel carp, common bream, eel, perch and silver bream (Table 1; t(18) = 49, p < 0.05).

Figure 3. Comparison of isotopic niches of eurytopic and rheophilic ecological groups (encompassing all species and sampling sites). (A) standard ellipse area corrected (SEAc), and (B) trophic position of eurytopic and rheophilic ecological group of fish; *p < 0.05.
3.2. Trophic position
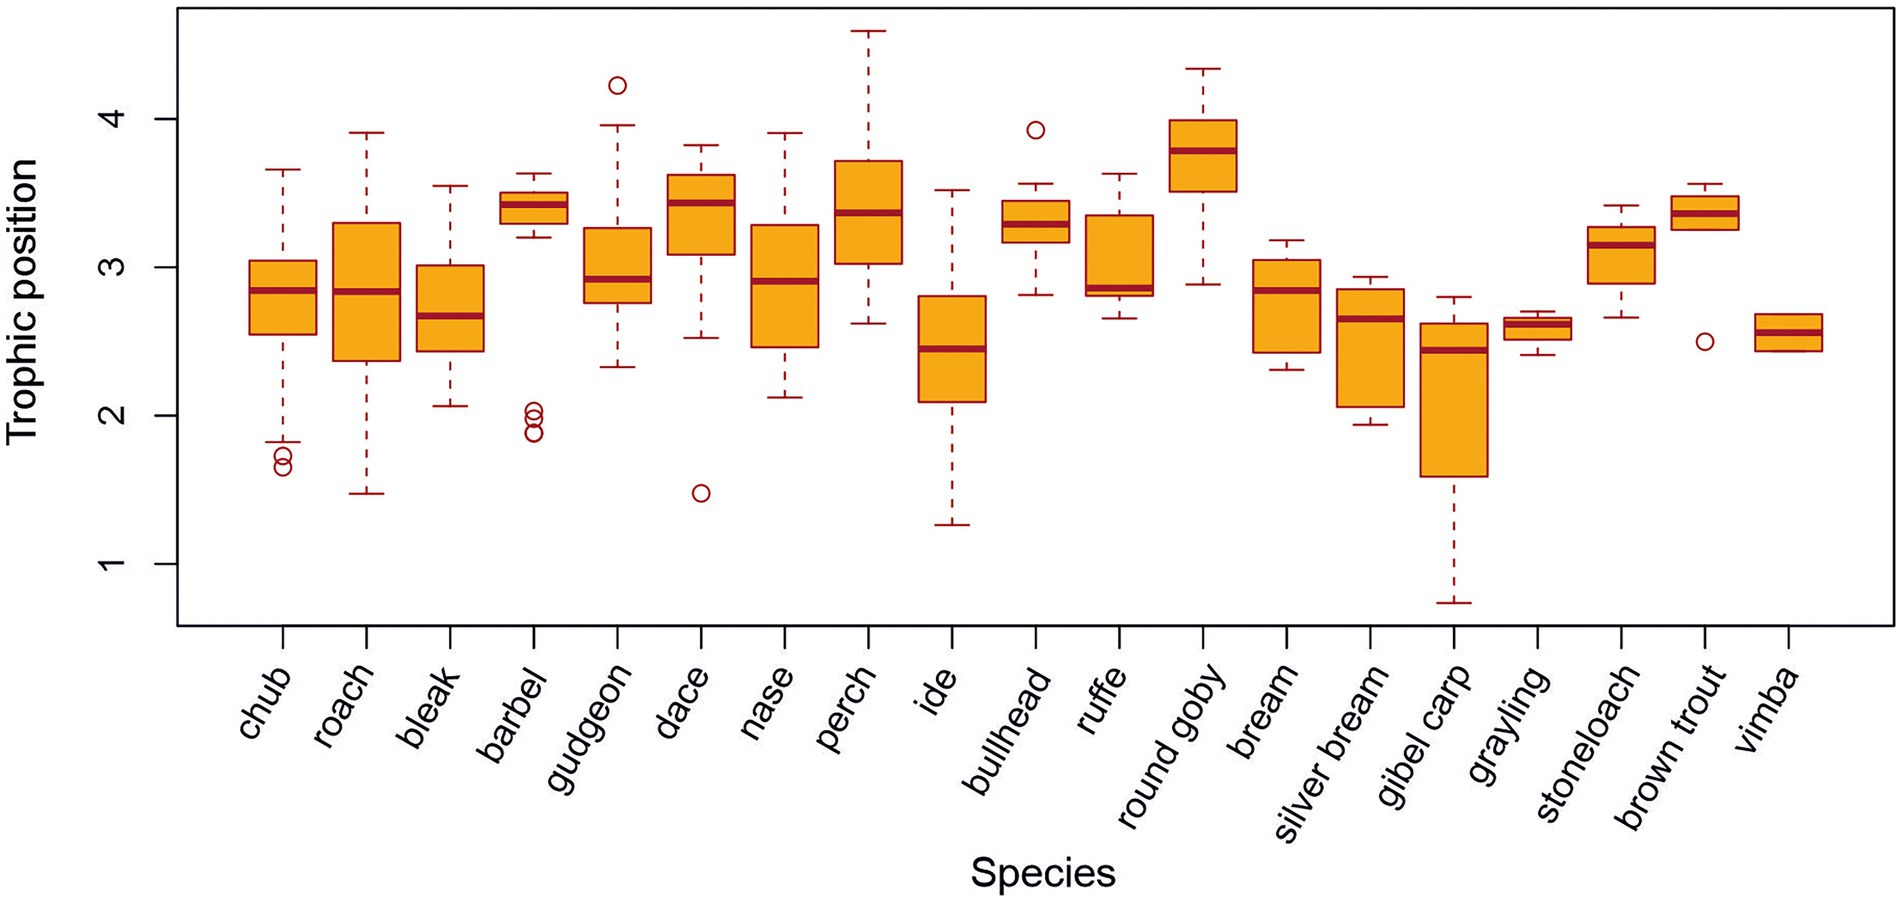
Rheophilic fish species occupied a significantly higher average trophic position (TP) than eurytopic species (Figure 3B; F1,699 = 0.3115; p < 0.01), although there was variation among species and sampling sites (Figure 4). Round goby, perch, dace, barbel, and bullhead occupied the highest mean trophic position of all species studied (Table 1; Figure 4; t(18) = −4.0, p < 0.05).
3.3. Community wide metrics
δ15N range (NR) provides a measure of the length of the longest food chain, where higher values suggest more trophic levels and a greater degree of trophic diversity. The NR was highest at sites S8 and S11 (Figure 5B). The highest δ13C range (CR), which reflects the diversity of resources exploited, was found at sites S2, S3 and S7, all on the Vltava river (Figure 5A), where total area (TA), which represents a measure of the total amount of niche space occupied, was highest also (Figure 5D). The lowest TA was observed at site S5. It was not possible to calculate community metrics for sites S5 and S7 due to the low diversity and abundance of fish at these sites. Mean CD is a metric which reflects the overall degree of trophic diversity in the food web, however, it is also a function of the degree of species spacing. CD was highest at sites S5 and S8 (Figure 5C). MNND and standard deviation of nearest neighbor distances (SDNND) are measures of diversity of trophic niche area of species in a food web. MNND was highest at S5 (Figure 5E), and SDNND highest at sites S2, S3 (Figure 5F; Supplementary Table S3).
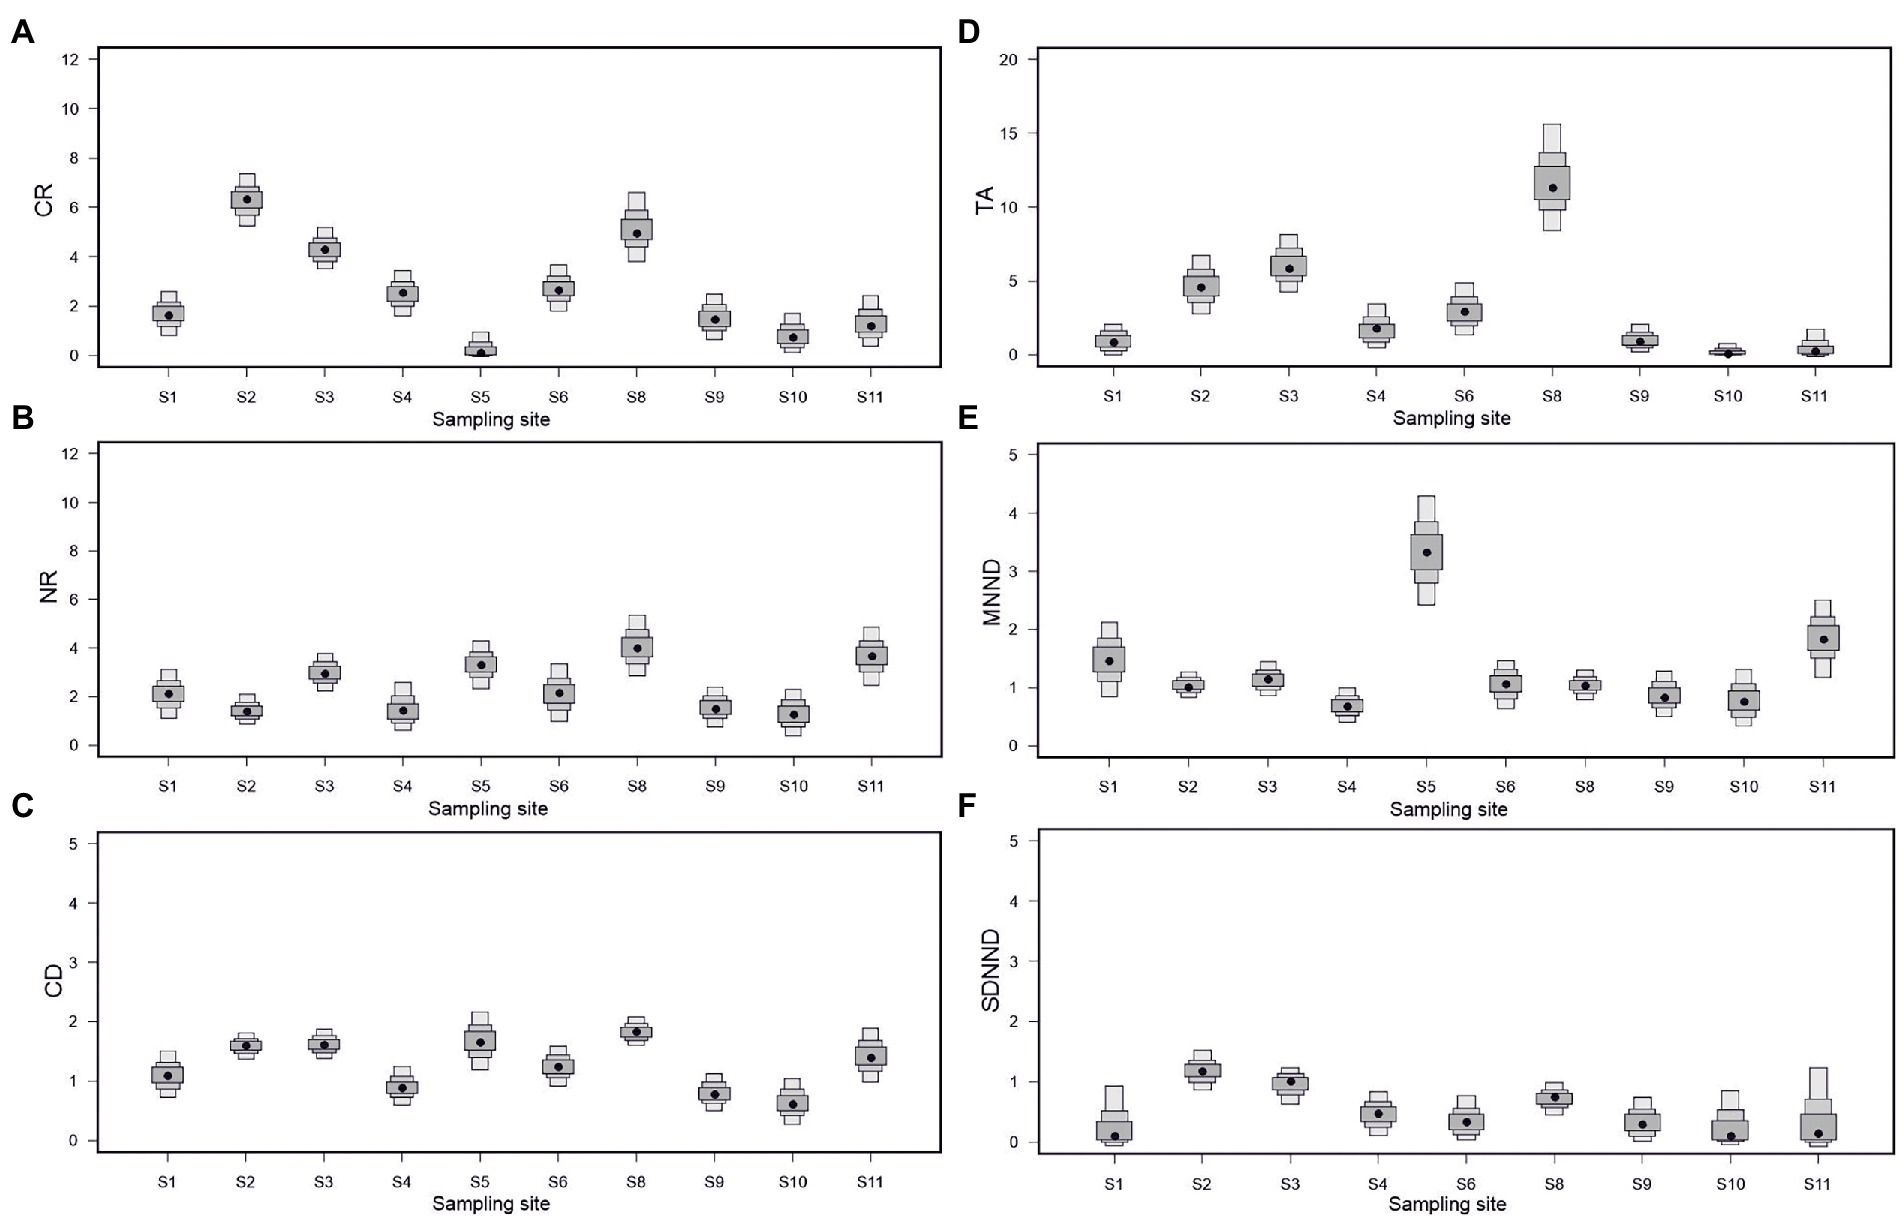
Figure 5. Quantitative community metrics at sampling sites along the Elbe River basin. (A) CR, δ13C range; (B) NR, δ15N range; (C) TA; (D) CD; (E) MNND; and (F) SDNND.
3.4. The effect of environmental variables on species trophic niche space
The effects of environmental parameters (pH, DO, TN, N-NH4+, P-PO43−, TP, BOD5, COD, POM, DOM, conductivity and chl-a) on both individual (SEAc, TA, trophic position) and community metrics (NR, CR, TA, CD, MNND, SDNND) were evaluated. Of the 11 environmental variables tested, POM, N-NH4+, N-NO3-and total phosphorus were associated significantly with the trophic niche area of species, SEAc (Table 3). The results show that POM, N-NH4+, and N-NO3-had a negative effect on SEAc, however total phosphorus (TP) had a positive effect on SEAc, suggesting that SEAc increased with TP. The results further shows that trophic position of species was positively associated with N-NH4+, and negatively with COD. Evaluation of community level metrics shows that a measure of trophic diversity - mean CD, and a measure of density and clustering of species - MNND, were affected by environmental parameters, where a negative association between BOD5 and CD, and COD and MNND (Table 4) were found. Other environmental parameters tested were found not to be significantly associated with variation in either species or community level metrics.
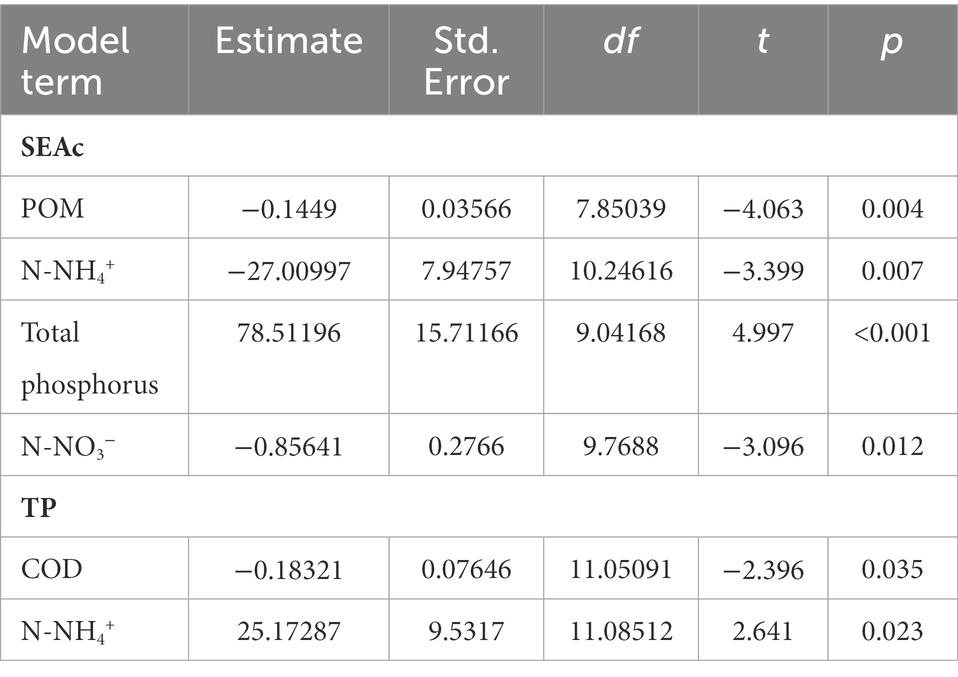
Table 3. Relationships between Standard Ellipse Area corrected (SEAc) and Trophic Position (TP) and physico-chemical parameters, estimated by the final linear mixed-effects model taking into account the effects of the species and sampling sites.
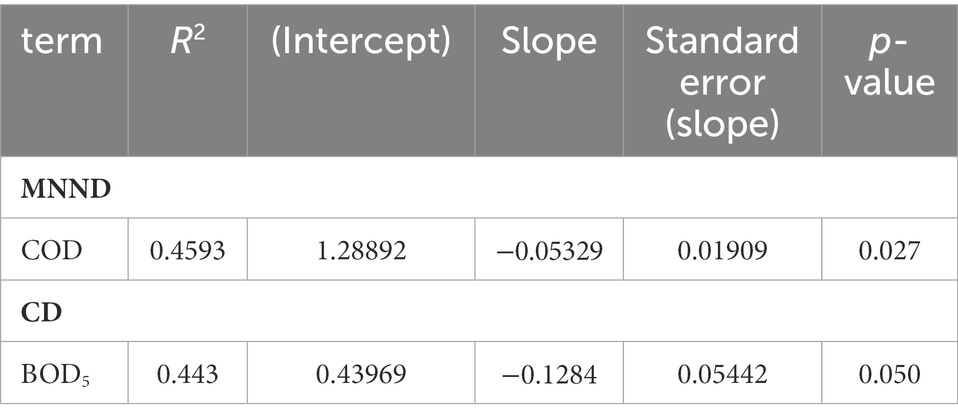
Table 4. Results of linear regression between environmental factors and mean nearest neighbour distance (MNND) and distance to centroid (CD).
4. Discussion
We predicted that eurytopic fish species would occupy wider trophic niches in riverine food webs than rheophilic species, as greater range of prey types can be accessed by omnivorous feeding. Based on previous evidence, eurytopic species should have a larger isotopic niche, indicating feeding across multiple trophic levels and a generalized diet based on a range of basal sources compared with more specialized rheophilic species (Persson, 1988; Kottelat and Freyhoff, 2007;). We found that rheophilic species occupied a narrower trophic niche space, suggesting greater dietary specialization (Araújo et al., 2011) and a smaller trophic niche size in a competitive environment (Van Valen, 1965; Human and Gordon, 1996; Olsson et al., 2009;). The largest mean trophic niche spaces were occupied by the eurytopic species gibel carp (Carassius gibelio), roach (Rutillus rutillus), and common bream (Abramis brama) whereas TA, SEAc were highest in gibel carp, eel (Anquila anquila) and perch (Perca fluviatilis). The larger trophic niche space of gibel carp, roach and common bream mostly reflected large carbon ranges as the result of a varied diet including macrophytes or detritus from terrestrial sources (Del Giorgio and France, 1996) and possibly littoral-based herbivorous resources (Vejříková et al., 2017).
We further compared the trophic position between eurytopic and rheophilic species. Interestingly, despite narrower isotopic niche space, rheophilic fish species tended to occupy a higher trophic position than eurytopic species (Figure 3B), suggesting that these species use resources more enriched in 15N. Our results are consistent with those observed by Champagne et al. (2022) who observed that the generalist consumer – creek chub (Semotilus atromaculatus) assimilated less terrestrial energy and occupied lower trophic positions. The highest trophic position was displayed by round goby, common dace and barbel. Our results suggest that on average these species were feeding higher in the food web, possibly through a greater reliance on terrestrial and/or aquatic macroinvertebrates. Common dace predominantly consumes aquatic and terrestrial insects (Hellawell, 1974), barbel feeds chiefly on benthic invertebrates, such as small crustaceans, insect larvae, molluscs, and mayfly larvae (Maitland and Campbell, 1992). The higher trophic position of perch and brown trout could be linked with a piscivory in these species (Kottelat and Freyhoff, 2007).
The relationship between community metrics and the structural variability of the sampling sites corroborates that the morphology of the stream and its surrounding landscape has important consequences for food web structure (Woodward and Hildrew, 2002; Wang et al., 2021). The highest N-ranges were found at sites S8 and S11 corresponding with the high variability of instream habitat structure and the surrounding terrestrial habitats. In contrast, it was not possible to obtain community metrics at site at site S5 and S7 due to the low diversity of the fish assemblages at these highly anthropogenically degraded sites (bank stabilization and homogenization of habitat). Niche diversification (δ13C range) was highest found at sites S2, S3 and S8 on the Vltava, where the total niche space occupied (total area) was highest also. Such finding may be explained by the observed heterogeneity of both in-river and adjacent habitats and the presence of macrophyte stands, which reflects a high diversity of resources in these less channelized reaches (Górski et al., 2016; Latli et al., 2018). Riparian zones are among the most diverse, and complex habitats (Naiman and Décamps, 2007): and the presented results demonstrate that the complexity of habitats may increase the overall trophic niche used by the species present.
Changes in the trophic structure of fish assemblages in response to ecosystem perturbations could indicate which pressures affect fish assemblages most. Nutrient concentrations were associated with change in the trophic niche width of species (SEAc, TA), whilst changes in functional community structure (CD, MNND) were associated with change in biological and chemical oxygen demand, often associated with nutrient enrichment and increased productivity. Such results provide increased understanding of the effect of nutrient loading on the structure and composition of fish assemblages reported in previous studies (Kulíšková et al., 2009; Hoffman et al., 2012; Baeta et al., 2017; Bierschenk et al., 2019; Wang et al., 2021). In our study, it has been shown that the nutrient concentration may influence the trophic niche space of species. Nitrate and ammonium have a negative effect on SEAc of species, whereas total phosphorus has a positive effect. Increased concentrations of inorganic nitrogen and phosphorus indicate water eutrophication associated with agriculture in the catchment (Roussel et al., 2004; Langhammer, 2010). Nutrient concentrations may influence the isotopic niche space of species through impacts on basal trophic resources where nutrients assimilated by primary producers are transferred to higher trophic levels (Roussel et al., 2004; Roulet and Moore, 2006; Bergfur et al., 2009; Baeta et al., 2017) further contributing to eutrophication (Weigelhofer et al., 2013). Nitrate contamination in the Elbe drainage basin has been a long-term issue. In the Czech Republic, N-NO3-concentrations have decreased slightly or remained constant since monitoring began in the 1960’s (Ritter, 2010), and in some reaches exceeded the European Union (EU) standard of 50 mg.l−1. The fact that phosphorus concentration was more strongly associated with differences in the trophic niche space of fish species than chlorophyll-a concentration implies that nutrients from catchment land use (diffuse pollution) has probably a dominant effect rather than point source pollution (Mainstone and Parr, 2002). Indeed, diffuse pollution from fertilization, soil erosion and fish farming were identified as key pollutants of surface waters in Czech Republic (River Basin Management Plans reporting of the Czech Republic; EIONET)4.
Fish are particularly prone to the toxic effects of unionized ammonia (Servizi and Gordon, 1990; Handy and Poxton, 1993), although field demonstrations of the effect of ammonia on freshwater fish are rare. Ammonia is produced by the decomposition of organic matter through the activity of microorganisms, and its form varies with temperature, pressure and ionic concentration. The concentration of the toxic unionized form of ammonia (N-NH3) increases with increasing pH (Eddy, 2005). Increased concentrations of ammonia impair activity and behavior of fish, as ammonia interferes with nervous function and ionic regulatory processes (for review see Eddy, 2005; Kemp et al., 2011). Such negative impacts may influence the ability of fish to obtain food resources, decreasing the trophic niche area of fishes. Analogous to nitrogen, phosphorus can influence the isotopic composition of basal resources. However, it may also operate indirectly by affecting the abundance and community structure of invertebrates, a vital food source for fish (Henley et al., 2000; Nixon et al., 2001; Egler et al., 2012). Excessive phosphate increases productivity, stimulating algal growth and increasing the supply of organic matter to water and sediments. Such processes are key drivers of the oxygen balance of water and sediments with subsequent detrimental effects on aquatic assemblages (Kemp et al., 2011).
A negative association between BOD5 and CD, and COD and MNND were found, indicating that the oxygen demand is a key factor influencing community trophic structure. Excessive nutrients which trigger algal growth may lead to the lack of oxygen or anoxia, leading to deterioration of basal resource diversity (Nixon et al., 2001). For example, reduced oxygen availability may induce the development of invertebrate communities dominated by a few pollution-tolerant taxa (chironomids, oligochaetes), but less suitability as a food resource for fish (Mason, 1991; Egler et al., 2012). Consequently, low dissolved oxygen concentrations may reduce the realized trophic niche of fishes, especially those specialized on benthic invertebrates.
5. Conclusion
There is a growing recognition of a value of assessing functional responses of riverine ecosystems to environmental disturbances. As river fish communities are unprecedently affected by degradation and population loss, improved understanding of food web dynamics in anthropogenically modified rivers is urgently needed. The pattern observed here, where nutrient loading influenced both individual species and the trophic structure of fish assemblages strongly supports assertions that anthropogenic nutrient loading poses a substantial impact affecting the entire food web (Woodward and Hildrew, 2002; Warry et al., 2016). As rheophilic species may rely on both aquatic and terrestrial sources of food, the morphological structure of adjacent habitats will have a substantial impact on trophic niche use of these specialized fish species (Champagne et al., 2022). Such findings highlight the need for restoration of natural river habitat and remediation of structural degradation of adjacent river habitat, together with efforts to reduce the impact of agricultural runoffs and diffuse nutrient pollution on rivers.
Data availability statement
The datasets presented in this article are not readily available because Environmental data are freely available at Czech Hydrometeorological Institute (https://www.chmi.cz). Trophic data are not publicly available due to restrictions. Requests to access the datasets should be directed to cGV0cmEuaG9ya2FAbmF0dXIuY3VuaS5jeg==.
Ethics statement
The animal study was reviewed and approved by Ethical Committee, Charles University in Prague.
Author contributions
PH: conceptualization, methodology, investigation, formal analysis, and writing-original draft preparation. ZM: methodology and investigation. KH: investigation and data curation. JK, KJ, and JR: investigation. JJ: writing-review and editing. All authors contributed critically to the drafts an gave final approval for publication.
Funding
Institutional funding for KJ was provided by the Centre for Geosphere Dynamics [grant number UNCE/SCI/006].
Acknowledgments
The authors wish to thank to Czech Fishing Union.
Conflict of interest
The authors declare that the research was conducted in the absence of any commercial or financial relationships that could be construed as a potential conflict of interest.
Publisher’s note
All claims expressed in this article are solely those of the authors and do not necessarily represent those of their affiliated organizations, or those of the publisher, the editors and the reviewers. Any product that may be evaluated in this article, or claim that may be made by its manufacturer, is not guaranteed or endorsed by the publisher.
Supplementary material
The Supplementary material for this article can be found online at: https://www.frontiersin.org/articles/10.3389/fevo.2022.1076451/full#supplementary-material
Footnotes
References
Aarts, B. G., and Nienhuis, P. H. (2003). Fish zonations and guilds as the basis for assessment of ecological integrity of large rivers. Hydrobiology 500, 157–178. doi: 10.1023/A:1024638726162
Aarts, B. G. W., Van Den Brink, F. W. B., and Nienhuis, P. H. (2004). Habitat loss as the main cause of the slow recovery of fish faunas of regulated large rivers in Europe: the transversal floodplain gradient. River Res. Appl. 20, 3–23. doi: 10.1002/rra.720
Araújo, M. S., Bolnick, D. I., and Layman, C. A. (2011). The ecological causes of individual specialisation. Ecol. Lett. 14, 948–958. doi: 10.1111/j.1461-0248.2011.01662.x
Baeta, A., Vieira, L. R., Lírio, A. V., Canhoto, C., Marques, J. C., and Guilhermino, L. (2017). Use of stable isotope ratios of fish larvae as indicators to assess diets and patterns of anthropogenic nitrogen pollution in estuarine ecosystems. Ecol. Indic. 83, 112–121. doi: 10.1016/j.ecolind.2017.07.062
Baras, E., Lambert, H., and Philippart, J. C. (1994). A comprehensive assessment of the failure of Barbus barbus (L.) migrations through a fish pass in the canalized river Meuse (Belgium). Aquat. Living Resour. 7, 181–189. doi: 10.1051/alr:1994020
Bates, D., Maechler, M., Bolker, B., and Walker, S. (2014). lmPe4: linear mixed-effects models using Eigen and S4. R package version, 1, 1–7. Available at: http://www.CRAN.R-project.org/package=lme4 (Accessed June 10, 2022).
Bergfur, J., Johnson, R. K., Sandin, L., and Goedkoop, W. (2009). Effects of nutrient enrichment on C and N stable isotope ratios of invertebrates, fish and their food resources in boreal streams. Hydrobiology 628, 67–79. doi: 10.1007/s10750-009-9746-4
Bierschenk, A. M., Mueller, M., Pander, J., and Geist, J. (2019). Impact of catchment land use on fish community composition in the headwater areas of Elbe. Danube Main. Sci. Total Environ. 652, 66–74. doi: 10.1016/j.scitotenv.2018.10.218
Burnham, K. P., and Anderson, D. R. (2002). Model Selection and Multimodel Inference: A Practical Information-theoretic Approach. New York: Springer.
Cabana, G., and Rasmussen, J. B. (1996). Comparison of aquatic food chains using nitrogen isotopes. Proc. Natl. Acad. Sci. U. S. A. 93, 10844–10847. doi: 10.1073/pnas.93.20.10844
Capra, H., Pella, H., and Ovidio, M. (2018). Individual movements, home ranges and habitat use by native rheophilic cyprinids and non-native catfish in large regulated river. Fish. Manag. Ecol. 25, 136–149. doi: 10.1111/fme.1227
Champagne, E. J., Guzzo, M. M., Gutgesell, M. K., and McCann, K. S. (2022). Riparian buffers maintain aquatic trophic structure in agricultural landscapes. Biol. Lett. 18:20210598. doi: 10.1098/rsbl.2021.0598
de Carvalho, D. R., Alves, C. B. M., Moreira, M. Z., and Pompeu, P. S. (2020). Trophic diversity and carbon sources supporting fish communities along a pollution gradient in a tropical river. Sci. Total Environ. 738:139878. doi: 10.1016/j.scitotenv.2020.139878
De Castro, D. M. P., De Carvalho, D. R., Pompeu, P. D. S., Moreira, M. Z., Nardoto, G. B., and Callisto, M. (2016). Land use influences niche size and the assimilation of resources by benthic macroinvertebrates in tropical headwater streams. PLoS One 11, 1–19. doi: 10.1371/journal.pone.0150527
Del Giorgio, P. A., and France, R. L. (1996). Ecosystem-specific patterns in the relationship between zooplankton and POM or microplankton 13C. Limnol. Oceanog. 41, 359–365. doi: 10.4319/lo.1996.41.2.0359
Dudgeon, D., Arthington, A. H., Gessner, M. O., Kawabata, Z.-I., Knowler, D. J., Leveque, C., et al. (2006). Freshwater biodiversity: importance, threats, status and conservation challenges. Biol. Rev. 81, 163–182. doi: 10.1017/S1464793105006950
Duncan, J. R., and Lockwood, J. L. (2001). Extinction in a field of bullets: a search for causes in the decline of the world’s freshwater fishes. Biol. Conserv. 102, 97–105. doi: 10.1016/S0006-3207(01)00077-5
Eddy, F. B. (2005). Ammonia in estuaries and effects on fish. J. Fish Biol. 67, 1495–1513. doi: 10.1111/j.1095-8649.2005.00930.x
EEA Map of Europe. European Environment Agency (2022). Available at: https://www.eea.europa.eu/data-and-maps/figures/map-of-europe (Accessed July 20, 2022).
Egler, M., Buss, D. F., Moreira, J. C., and Babtista, D. F. (2012). Influence of agricultural land-use and pesticides on benthic macroinvertebrate assemblages in an agricultural river basin in Southeast Brazil. Braz. J. Biol. Sci. 72, 437–443. doi: 10.1590/S1519-69842012000300004
Erős, T., Kuehne, L., Dolezsai, A., Sommerwerk, N., and Wolter, C. H. (2019). A systematic review of assessment and conservation management in large floodplain rivers – actions postponed. Ecol. Indic. 98, 453–461. doi: 10.1016/j.ecolind.2018.11.026
Freeman, M. C., Pringle, C. M., Greathouse, E. A., and Freeman, B. J. (2003). Ecosystem-level consequences of migratory faunal depletion caused by dams. Am. Fish. Soc. Symp. 35, 255–266.
Frost, S. (1971). Evaluation of kicking technique for sampling stream bottom fauna. Can. J. Zool. 49, 167–173. doi: 10.1139/z71-026
Górski, K., De Leeuw, J. J., Winter, H. V., Khoruzhaya, V. V., Boldyrev, V. S., Vekhov, D. A., et al. (2016). The importance of flooded terrestrial habitats for larval fish in a semi-natural large floodplain (Volga, Russian Federation). Inland Waters 6, 105–110. doi: 10.5268/IW-6.1.914
Guinan, M. E., Kapuscinski, K. L., and Teece, M. A. (2015). Seasonal diet shifts and trophic position of an invasive cyprinid, the Rudd Scardinius erythrophthalus (Liennaeus, 1758), in the upper Niagara River. Aquat. Invasions 10, 217–225. doi: 10.3391/ai.2015.10.2.10
Handy, R. D., and Poxton, M. G. (1993). Nitrogen pollution in mariculture: toxicity and excretion of nitrogenous compounds by marine fish. Rev. Fish Biol. Fish. 3, 205–241. doi: 10.1007/BF00043929
Heiskary, S. A., and Bouchard, W. (2015). Development of eutrophication criteria for Minnesota streams and rivers using multiple lines of evidence. Fresh. Sci. 34, 574–592. doi: 10.1086/680662
Hellawell, J. M. (1974). The ecology of populations of dace, Leuciscus leuciscus (L.), from two tributaries of the river wye, Herefordshire. England. Freshw. Biol. 4, 577–604. doi: 10.1111/j.1365-2427.1974.tb00116.x
Henley, W. F., Patterson, M. A., Neves, R. J., and Lemly, A. D. (2000). Effects of sedimentation and turbidity on lotic food webs: a concise review of natural resource managers. Fish. Sci. 8, 125–139. doi: 10.1080/10641260091129198
Hilton, J., O’Hare, M., Bowes, M. J., and Jones, J. I. (2006). How green is my river? A new paradigm of eutrophication in rivers. Sci. Total Environ. 365, 66–83. doi: 10.1016/j.scitotenv.2006.02.055
Hoffman, J. C., Kelly, J. R., Peterson, G. S., Cotter, A. M., Starry, M. A., and Sierszen, M. E. (2012). Using δ15N in fish larvae as an indicator of watershed sources of anthropogenic nitrogen: response at multiple spatial scales. Estuar. Coast. 35, 1453–1467. doi: 10.1007/s12237-012-9534-7
Human, K. G., and Gordon, D. M. (1996). Exploitation and interference competition between the invasive argentine ant, Linepithema humile, and native ant species. Oecologia 105, 405–412. doi: 10.1007/BF00328744
Jackson, A., Inger, R., Parnell, A. C., and Bearhop, S. (2011). Comparing isotopic niche widths among and within communities: SIBER-stable isotope Bayesian ellipses in R. J. Anim. Ecol. 80, 595–602. doi: 10.1111/j.1365-2656.2011.01806.x
Kemp, P., Sear, D., Collins, A., Naden, P., and Jones, I. (2011). The impacts of fine sediment on riverine fish. Hydrol. Process. 25, 1800–1821. doi: 10.1002/hyp.7940
Kottelat, M., and Freyhoff, J. (2007). Handbook of European freshwater fishes. Kottelat. Cornol, Switzerland and Freyhof, Berlin, 646.
Kratina, P., and Winder, M. (2015). Biotic invasions can alter nutritional composition of zooplankton communities. Oikos 124, 1337–1345. doi: 10.1111/oik.02240
Kraus, J. M., Pomeranz, J. F., Todd, A. S., Walters, D. M., Schmidt, T. S., and Wanty, R. B. (2016). Aquatic pollution increases use of terrestrial prey subsidies by stream fish. J. Appl. Ecol. 53, 44–53. doi: 10.1111/1365-2664.12543
Kulíšková, P., Horký, P., Slavík, O., and Jones, J. I. (2009). Factors influencing movement behaviour and home range size in ide Leuciscus idus. J. Fish Biol. 74, 1269–1279. doi: 10.1111/j.1095-8649.2009.02198.x
Kuznetsova, A., Brockhoff, P., and Christensen, R. (2014). lmerTest: Tests for random and fixed effects for linear mixed effect models (lmer objects of lme4 package). Available at: http://www.CRAN.R-project.org/package=lmerTest (Accessed May 20, 2022).
Langhammer, J. (2010). Water quality changes in the Elbe River basin, Czech Republic, in the context of the post-socialist economic transition. GeoJournal 75, 185–198. doi: 10.1007/s10708-009-9292-7
Latli, A., Michel, L. N., Lepoint, G., and Kestemont, P. (2018). River habitat homogenisation enhances trophic competition and promotes individual specialisation among young of the year fish. Freshw. Biol. 64, 520–531. doi: 10.1111/fwb.13239
Layman, C. A., Arrington, D. A., Montaña, C. G., and Post, D. M. (2007). Can stable isotope ratios provide for community-wide measures of trophic structure? Ecology 88, 42–48. doi: 10.1890/0012-9658(2007)88[42:CSIRPF]2.0.CO;2
Lumley, T., and Miller, A. (2004). Leaps: regression subset selection. R package version 2, 7. Available at: http://CRAN.R-project.org/package=leaps (Accessed May 20, 2022).
Mainstone, C. P., and Parr, W. (2002). Phosphorus in rivers – ecology and management. Sci. Total Environ. 282-283, 25–47. doi: 10.1016/S0048-9697(01)00937-8
Maire, A., Thierry, E., Viechtbauer, W., and Daufresne, M. (2019). Poleward shift in large-river fish communities detected with a novel meta-analysis framework. Freshw. Biol. 64, 1143–1156. doi: 10.1111/fwb.13291
Maitland, P. S., and Campbell, R. N. (1992). Freshwater Fishes of the British Isles. Harper Collins Publishers, London.
Mason, C. F., (1991). Biology of Freshwater Pollution, 2nd edn. New York: Longman Scientific & Technical.
Minagawa, M., and Wada, E. (1984). Stepwise enrichment of 15N along food chains: further evidence and the relation between δ15N and animal age. Geochim. Cosmochim. Acta 48, 1135–1140. doi: 10.1016/0016-7037(84)90204-7
Musil, J., Horký, P., Slavík, O., Zbořil, A., and Horká, P. (2012). The response of the young of the year fish to river obstacles: functional and numerical linkages between dams, weirs, fish habitat guilds and biotic integrity across large spatial scale. Ecol. Indic. 23, 634–640. doi: 10.1016/j.ecolind.2012.05.018
Naiman, R. J., and Décamps, H. (2007). The ecology of interfaces: riparian zones. Annu. Rev. Ecol. Evol. Syst. 28, 621–658. doi: 10.1146/annurev.ecolsys.28.1.621
Nixon, S., Buckley, B., Granger, S., and Bintz, J. (2001). Responses of very shallow marine ecosystems to nutrient enrichment. Hum. Ecol. Risk. Assess. 7, 1457–1481. doi: 10.1080/20018091095131
Olin, M., Rask, M., Ruuhijärvi, J., Kurkilahti, M., Ala-Opas, P., and Ylönen, O. (2002). Fish community structure in mesotrophic and eutrophic lakes of southern Finland: the relative abundances of percids and cyprinids along a trophic gradient. J. Fish Biol. 60, 593–612. doi: 10.1111/j.1095-8649.2002.tb01687.x
Olsson, K., Stenroth, P., Nyström, P. E. R., and Granelí, W. (2009). Invasions and niche width: does niche width of an introduced crayfish differ from a native crayfish? Freshw. Biol. 54, 1731–1740. doi: 10.1111/j.1365-2427.2009.02221.x
Persson, L. (1988). “Asymmetries in competitive and predatory interactions in fish populations” in Size-structured Populations, Ecology and Evolution. eds. B. Ebenman and L. Persson (Heidelberg: Springer-Verlag)
Phillips, D. L., Inger, R., Bearhop, S., Jackson, A. L., Moore, J. W., Parnell, A. C., et al. (2014). Best practices for use of stable isotope mixing models in food-web studies. Can. J. Zool. 92, 823–835. doi: 10.1139/cjz-2014-0127
Post, D. M. (2002). Using stable isotopes to estimate trophic position: models, methods, and assumptions. Ecology 83, 703–718. doi: 10.1890/0012-9658(2002)083[0703:USITET]2.0.CO;2
Post, D. M., Layman, C. A., Arrington, G., Takimoto, J., Quatrocchi, J., and Montaña, C. G. (2007). Getting to the fat of the matter: models, methods and assumptions for dealing with lipids in stable isotope analyses. Oecologia 152, 179–189. doi: 10.1007/s00442-006-0630-x
Price, E. L., Perić, M. S., Romero, G. Q., and Kratina, P. (2019). Land use alters trophic redundancy and resource flow through stream food webs. J. Anim. Eco. 88, 677–689. doi: 10.1111/1365-2656.12955
R Core Team (2021). R: A Language and Environment for Statistical Computing. Vienna, Austria: R Foundation for Statistical Computing.
Ritter, D. J. (2010). First order analysis of nitrate loading in the upper Elbe river basin. Czech Republic, Theses and Dissertations 2872 Available at: https://scholarsarchive.byu.edu/etd/2872 (Accessed August 25, 2022).
Roussel, J.-M., Perrier, C., Erkinaro, J. A., Niemela, E., Cunjak, R. A., Huteau, D., et al. (2004). Stable isotope analyses on oarchived fish scales reveal the long-term effect of nitrogen loads on carbon cycling in rivers. Glob. Chang. Biol. 20, 523–530. doi: 10.1111/gcb.12293
Schmutz, S., and Sendzimir, J. (2018). Riverine Ecosystem Management: Science for Governing Towards a Sustainable Future (Aquatic Ecology Series). 1st ed Berlin: Springer International Publishing.
Seber, G. A. F., and Le Cren, E. D. (1967). Estimating population parameters from catches large relative to the population. J. Anim. Ecol. 36, 631–643. doi: 10.2307/2818
Servizi, J. A., and Gordon, R. W. (1990). Acute lethal toxicity of ammonia and suspended sediment mixtures to Chinook salmon (Oncorhynchus tshawytscha). Bull. Environ. Contam. Toxicol. 44, 650–656. doi: 10.1007/BF01700890
Valová, Z., Jurajda, P., and Janáč, M. (2006). Spatial distribution of 0+ juvenile fish in differently modified lowland rivers. Folia Zool. 55, 293–308.
Van Valen, L. (1965). Morphological variation and width of ecological niche. Am. Nat. 99, 377–390. doi: 10.1086/282379
Vander Zanden, M., and Rasmussen, J. (1999). Primary consumer δ13C and δ15N and the trophic position of aquatic consumers. Ecology 80, 1395–1404. doi: 10.1890/0012-9658(1999)080[1395:PCCANA]2.0.CO;2
Vejříková, I., Eloranta, A. P., Vejřík, L., Smejkal, M., Čech, M., Sajdlová, Z., et al. (2017). Macrophytes shape trophic niche variation among generalist fishes. PLoS One 12:e0177114. doi: 10.1371/journal.pone.0177114
Wang, S., Luo, B.-K., Qin, Y. K., Zhao, J.-G., Wang, T.-T., Stewart, S. D., et al. (2021). Fish isotopic niches associated with environmental indicators and human disturbance along a disturbed large subtropical river in China. Sci. Total Environ. 750:141667. doi: 10.1016/j.scitotenv.2020.141667
Warry, F. Y., Reich, P., Cook, P. L. M., Nally, R. M., Thomson, J. R., and Woodland, R. J. (2016). Nitrogen loads influence trophic organization of estuarine fish assemblages. Funct. Ecol. 30, 1723–1733. doi: 10.1111/1365-2435.12647
Weigelhofer, G., Welti, N., and Hein, T. (2013). Limitations of stream restoration for nitrogen retention in agricultural headwater streams. Ecol. Eng. 60, 224–234. doi: 10.1016/j.ecoleng.2013.07.057
Winter, H. V., and Fredrich, F. (2003). Migratory behaviour of ide Leuciscus idus: a comparison between lowland rivers Elbe, Germany, and Vecht, the Netherlands. J. Fish Biol. 63, 871–880. doi: 10.1046/j.1095-8649.2003.00193.x
Woodward, G., and Hildrew, A. G. (2002). Food web structure in riverine landscapes. Freshw. Biol. 47, 777–798. doi: 10.1046/j.1365-2427.2002.00908.x
Xie, P., Wu, J., Huang, J., and Han, X. (2003). Three-gorges dam: risk to ancient fish. Science 302, 1149–1151. doi: 10.1126/science.302.5648.1149b
Keywords: food webs, freshwater fish, nutrient loading, rivers, stable isotope analysis, trophic niches
Citation: Horka P, Musilova Z, Holubova K, Jandova K, Kukla J, Rutkayova J and Jones JI (2023) Anthropogenic nutrient loading affects both individual species and the trophic structure of river fish communities. Front. Ecol. Evol. 10:1076451. doi: 10.3389/fevo.2022.1076451
Edited by:
Yixin Zhang, Soochow University, ChinaReviewed by:
Binsong Jin, Hangzhou Normal University, ChinaNoël Juvigny-Khenafou, University of Koblenz and Landau, Germany
Copyright © 2023 Horka, Musilova, Holubova, Jandova, Kukla, Rutkayova and Jones. This is an open-access article distributed under the terms of the Creative Commons Attribution License (CC BY). The use, distribution or reproduction in other forums is permitted, provided the original author(s) and the copyright owner(s) are credited and that the original publication in this journal is cited, in accordance with accepted academic practice. No use, distribution or reproduction is permitted which does not comply with these terms.
*Correspondence: Petra Horka, ✉ cGV0cmEuaG9ya2FAbmF0dXIuY3VuaS5jeg==
 Petra Horka
 Zuzana Musilova
 Katerina Holubova1