 Honglu Zhang1
 Fuqiang Wang
 Lei Tang
94% of researchers rate our articles as excellent or good
Learn more about the work of our research integrity team to safeguard the quality of each article we publish.
Find out more
ORIGINAL RESEARCH article
Front. Ecol. Evol., 15 December 2022
Sec. Conservation and Restoration Ecology
Volume 10 - 2022 | https://doi.org/10.3389/fevo.2022.1075914
The assessment of habitat quality plays an important role in the effective conservation of wetland biodiversity. The Yellow River Delta Wetland is located in the intertwining zone of sea, terrestrial, and river ecosystems, increasing human activities and climate change posed a great threat to wetland biodiversity. This study first analyzed the spatial and temporal evolution characteristics of habitat quality in the Yellow River Delta Wetland under the evolution of the shoreline after runoff-sediment variability (1986–2020) using the InVEST-habitat quality model and then identified the dominant influence factors on habitat quality based on Geographical Detector. Finally, elasticity index was introduced to analyze the impacts of different reclamation activities on habitat quality. Results showed that the habitat quality decreased from 0.4798 in 1986 to 0.4078 in 2020, with high values of habitat quality concentrated in mudflat wetlands and low values of habitat quality concentrated in construction land and salt pans. The results of the Geographical Detector analysis showed that the influence of human activities, especially reclamation activities, had stronger effects on habitat quality than climatic factors. The elasticity index analysis showed that the elasticity of all three types of reclamation activities, namely, culture ponds, construction land, and salt pans, were negative from 1986 to 2005, 2005 to 2020, and 1986 to 2020. The reclamation activities had a negative impact on habitat quality. The habitat quality of the Yellow River Delta Wetland was most sensitive to the change in reclamation intensity of construction land from 1986 to 2020, and the sensitivity of the change of habitat quality to the change of reclamation intensity of culture ponds and salt pans was strengthening. This study explicitly revealed the effect of climate change and human activities on the habitat quality of the Yellow River Delta Wetland and proposed to analyze the response intensity of habitat quality to different reclamation activities by using the elasticity index, thus providing a scientific basis for mitigating the tradeoff between biodiversity conservation and rapid social development in the Yellow River Delta Wetland in the future.
The Yellow River Delta Wetland is a unique estuarine coastal wetland ecosystem, and the evolution of the Yellow River Delta Wetland is constrained by both the Yellow River runoff and sediment conditions and ocean dynamics (Han et al., 2011). The Yellow River Delta Wetland is one of the key areas for the development and protection of the Yellow River Basin and is an important part of maintaining the health of the Yellow River (Wang et al., 2018a). The government attaches great importance to the ecological management of the Yellow River and has proposed a major national strategy for ecological protection and high-quality development of the Yellow River basin (Dong et al., 2020; Ji et al., 2021). The Yellow River Delta Wetland is highly valued for its pristine and fragile nature. In recent years, the rapid expansion of aquaculture and accelerated urbanization have threatened the health of the Yellow River Delta ecosystem and species diversity. Therefore, it is necessary to strengthen the biodiversity protection of the Yellow River Delta Wetland.
Habitat quality is the ability of an ecosystem to provide the conditions necessary for the continued survival and reproduction of individual species, populations, communities, and humans, and is the fundamental condition that determines biodiversity (Newbold et al., 2015). Habitat transformation is the main direct driver of biodiversity loss and the habitat loss and degradation impacts are the most direct threat to biodiversity (Banks-Leite et al., 2020). Habitat quality is an effective indicator of regional ecological security, which reflects the level of regional biodiversity and ecosystem services (Liu et al., 2021a), the higher the habitat quality, the higher the biodiversity of the ecosystem (Yan et al., 2018). Therefore, habitat quality assessment is a very effective method for understanding the regional biodiversity and the health level of regional ecosystems. The evaluation methods for habitat quality are mainly divided into two types, one is based on the construction of the index system for evaluation, and the other is based on the evaluation model. Due to a large amount of data collection required for evaluation based on indicator systems, more and more researchers are emphasizing the role of model methods in habitat quality evaluation (Polasky et al., 2011; Yan et al., 2017). Although model evaluation has certain limitations and is highly dependent on expert knowledge in determining indicators, it has obvious advantages over the large amount of data collected based on the evaluation of indicator systems (Wu et al., 2021a; Wang and Cheng, 2022). Among them, the InVEST-habitat quality model is widely used, which is flexible in its application and can replace complex methods such as species surveys, not only considers ecological processes, but also has a complete habitat quality evaluation system, reduces the randomness in the selection of evaluation indicators, and can evaluate habitat quality quickly (Xu et al., 2019; Kunwar et al., 2020; Wu et al., 2021a).
For the Yellow River Delta wetland study area, studies have applied the InVEST-habitat quality model to investigate the spatial and temporal evolution characteristics of waterbird habitats in the Yellow River Delta wetlands from 2000 to 2015 (Li et al., 2019), and also combined the FLUS model with the InVEST-habitat quality model to simulate and predict the current and future habitat quality in Dongying City (Ding et al., 2021). But both of them lacked studies on the factors influencing the evolution of habitat quality in the Yellow River Delta Wetland. To reveal the influencing factors and underlying processes of habitat quality change, a more comprehensive understanding of the influencing factors driving habitat quality change is needed. The evolution of habitat quality is a complex process that is the result of a combination of internal and external drivers, including natural and social (Yan et al., 2018). Climate change and human activities are all influential factors in habitat quality evolution. Related studies have attempted to understand the patterns and driving mechanisms of habitat quality evolution from both natural and social perspectives (Schmitt-Harsh, 2013; Teferi et al., 2013). The natural factors mainly consider climate, vegetation cover, elevation, slope, etc., and the social factors mainly consider population, GDP, and other indicators. For instance, the InVEST- habitat quality model has been applied to evaluate the spatial and temporal variability of habitat quality in the Guangdong-Hong Kong-Macao-Great Bay area and analyzed the effects of population, GDP, and impervious area on habitat quality (Wu et al., 2021b), the effects of land-use change, elevation, and population density on habitat quality in the Beressa watershed, Blue Nile basin of Ethiopian highlands (Aneseyee et al., 2020), the effects of land use, population density and GDP, and natural factors of elevation, annual average rainfall, annual average temperature, and slope and NDVI on habitat quality in Liulin County (Zhang et al., 2022b), the effects of land-use transition on habitat quality in the Taihu Lake basin (Xu et al., 2019), urbanization and landscape pattern changes on habitat quality in Hangzhou (Zhu et al., 2020). Therefore, it is important to analyze the evolution of habitat quality and explore the influencing factors for the future development and conservation of the region. There have been studies using linear regression models, spatial autocorrelation indices, and other analytical methods to analyze the influencing factors, and the research methods are mature and abundant (Geng et al., 2020), but the selection of influencing factors in the current study is more often based on reference to existing studies, and then based on specific analytical methods to explore the magnitude of the influence of different influencing factors on habitat quality. However, to a certain extent, the characteristics of the study area were not considered, and the identification of dominant factors and a further selection of suitable methods to analyze the influence of dominant factors on habitat quality in depth according to the characteristics of dominant factors were lacking.
Since 1986, there has been a significant change in the runoff and sediment flow at the Lijin Station of the Yellow River Estuary (Zhang and Hu, 2007) (Figure 1), and the shoreline of the Yellow River Delta Wetland has been changing rapidly due to the influence of the Yellow River runoff and sediment, the change of shoreline makes the area of Yellow River Delta change year by year (Niu and Wang, 2020). And the mudflat wetland, which is an important habitat, is most obviously affected by the shoreline. Therefore, it is necessary to analyze the spatial and temporal evolution of habitat quality under the dynamic evolution of shoreline siltation in the Yellow River Delta Wetland and to analyze the influencing factors on habitat quality. Therefore, the main objectives of this study were to (1) evaluate the spatial and temporal changes in habitat quality under the dynamic evolution of the shoreline after runoff-sediment variability, (2) analyze the influencing factors of habitat quality evolution, (3) analyze the response of habitat quality to reclamation activities based on the identification of dominant factors (Figure 2). In this study, 1986, 1996, 2005, 2008, 2011, and 2020 were selected as representative years. 1996 was selected mainly because the Yellow River Delta National Nature Reserve was formally established in 1992, and the establishment of the reserve is of great significance to the conservation of the Yellow River Delta Wetland. Therefore, the year 1996 was chosen as the representative year after the establishment of the reserve. Since 2008, the Yellow River Conservancy Commission has carried out the ecological recharge of the Yellow River Delta wetland, so the years 2005 before and 2011 after the ecological recharge were chosen as the representative years in this paper. The year 2020 is chosen as the representative year in the context of the continuous ecological recharge work and the major national strategy of ecological protection and high-quality development of the Yellow River basin. The results of the study aim to provide a scientific basis for the future biodiversity conservation of the Yellow River Delta Wetland.
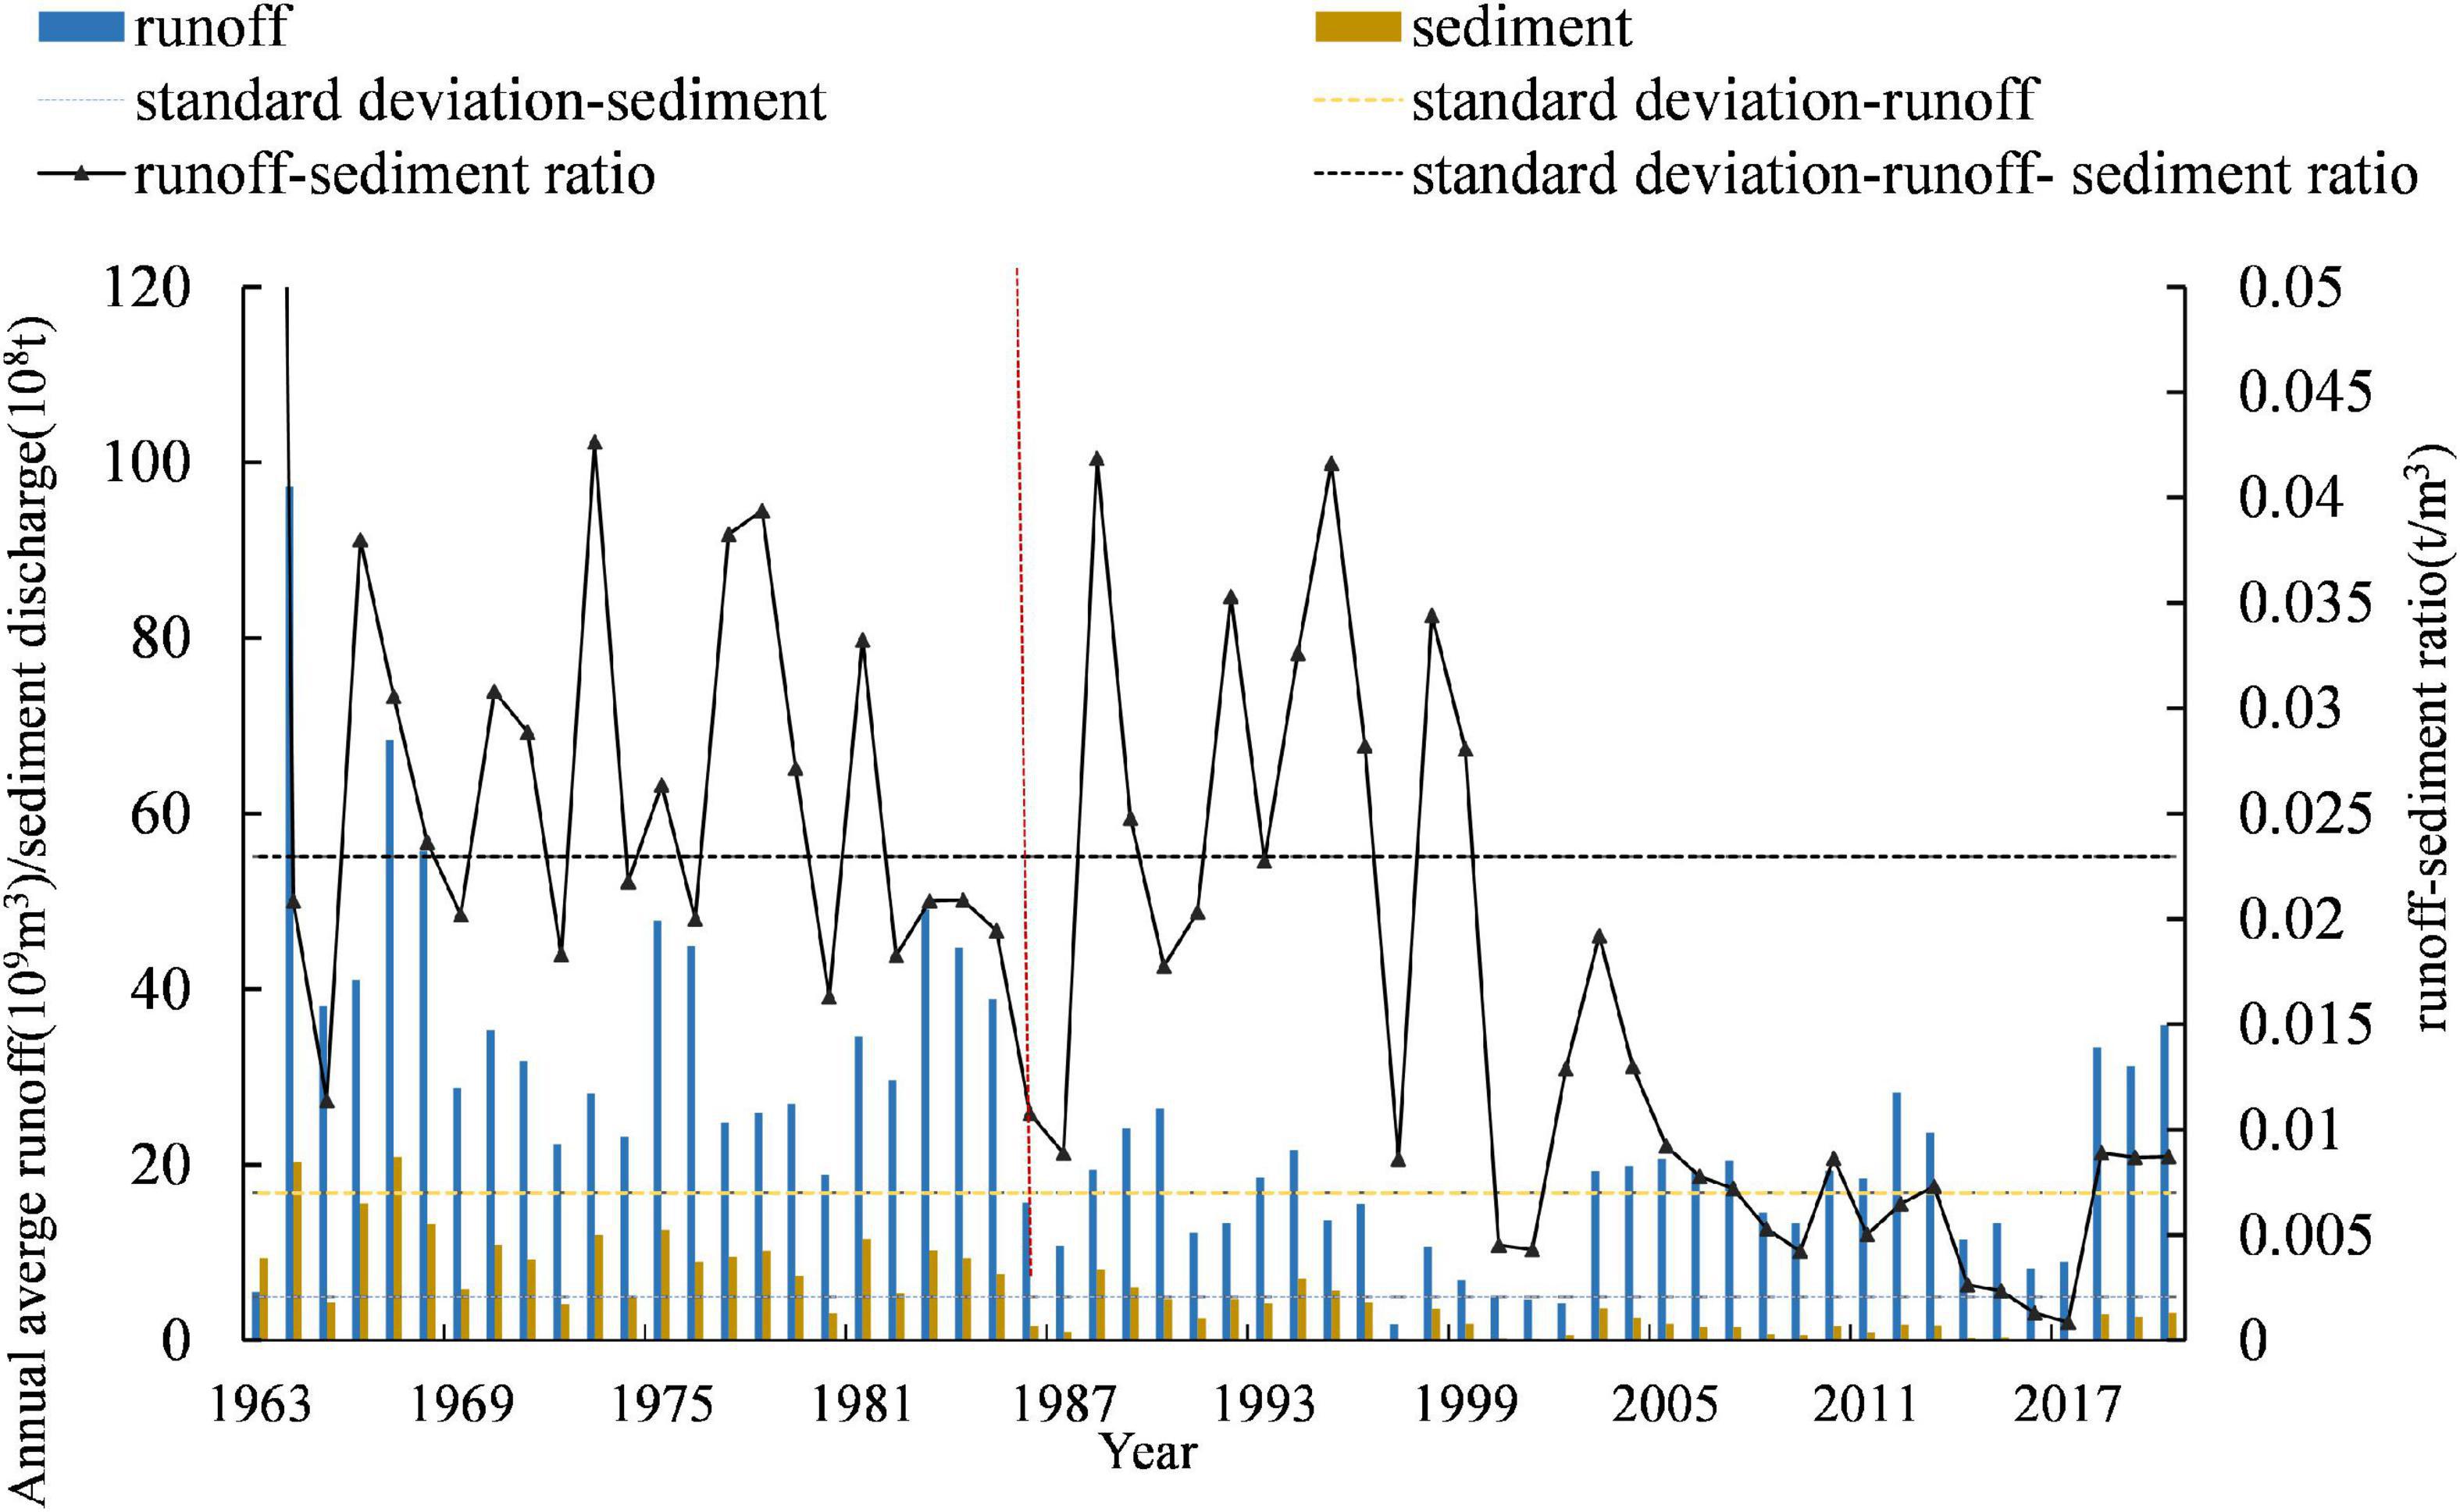
Figure 1. The trend of runoff and sediment changed from 1963 to 2020 at Lijin Station.
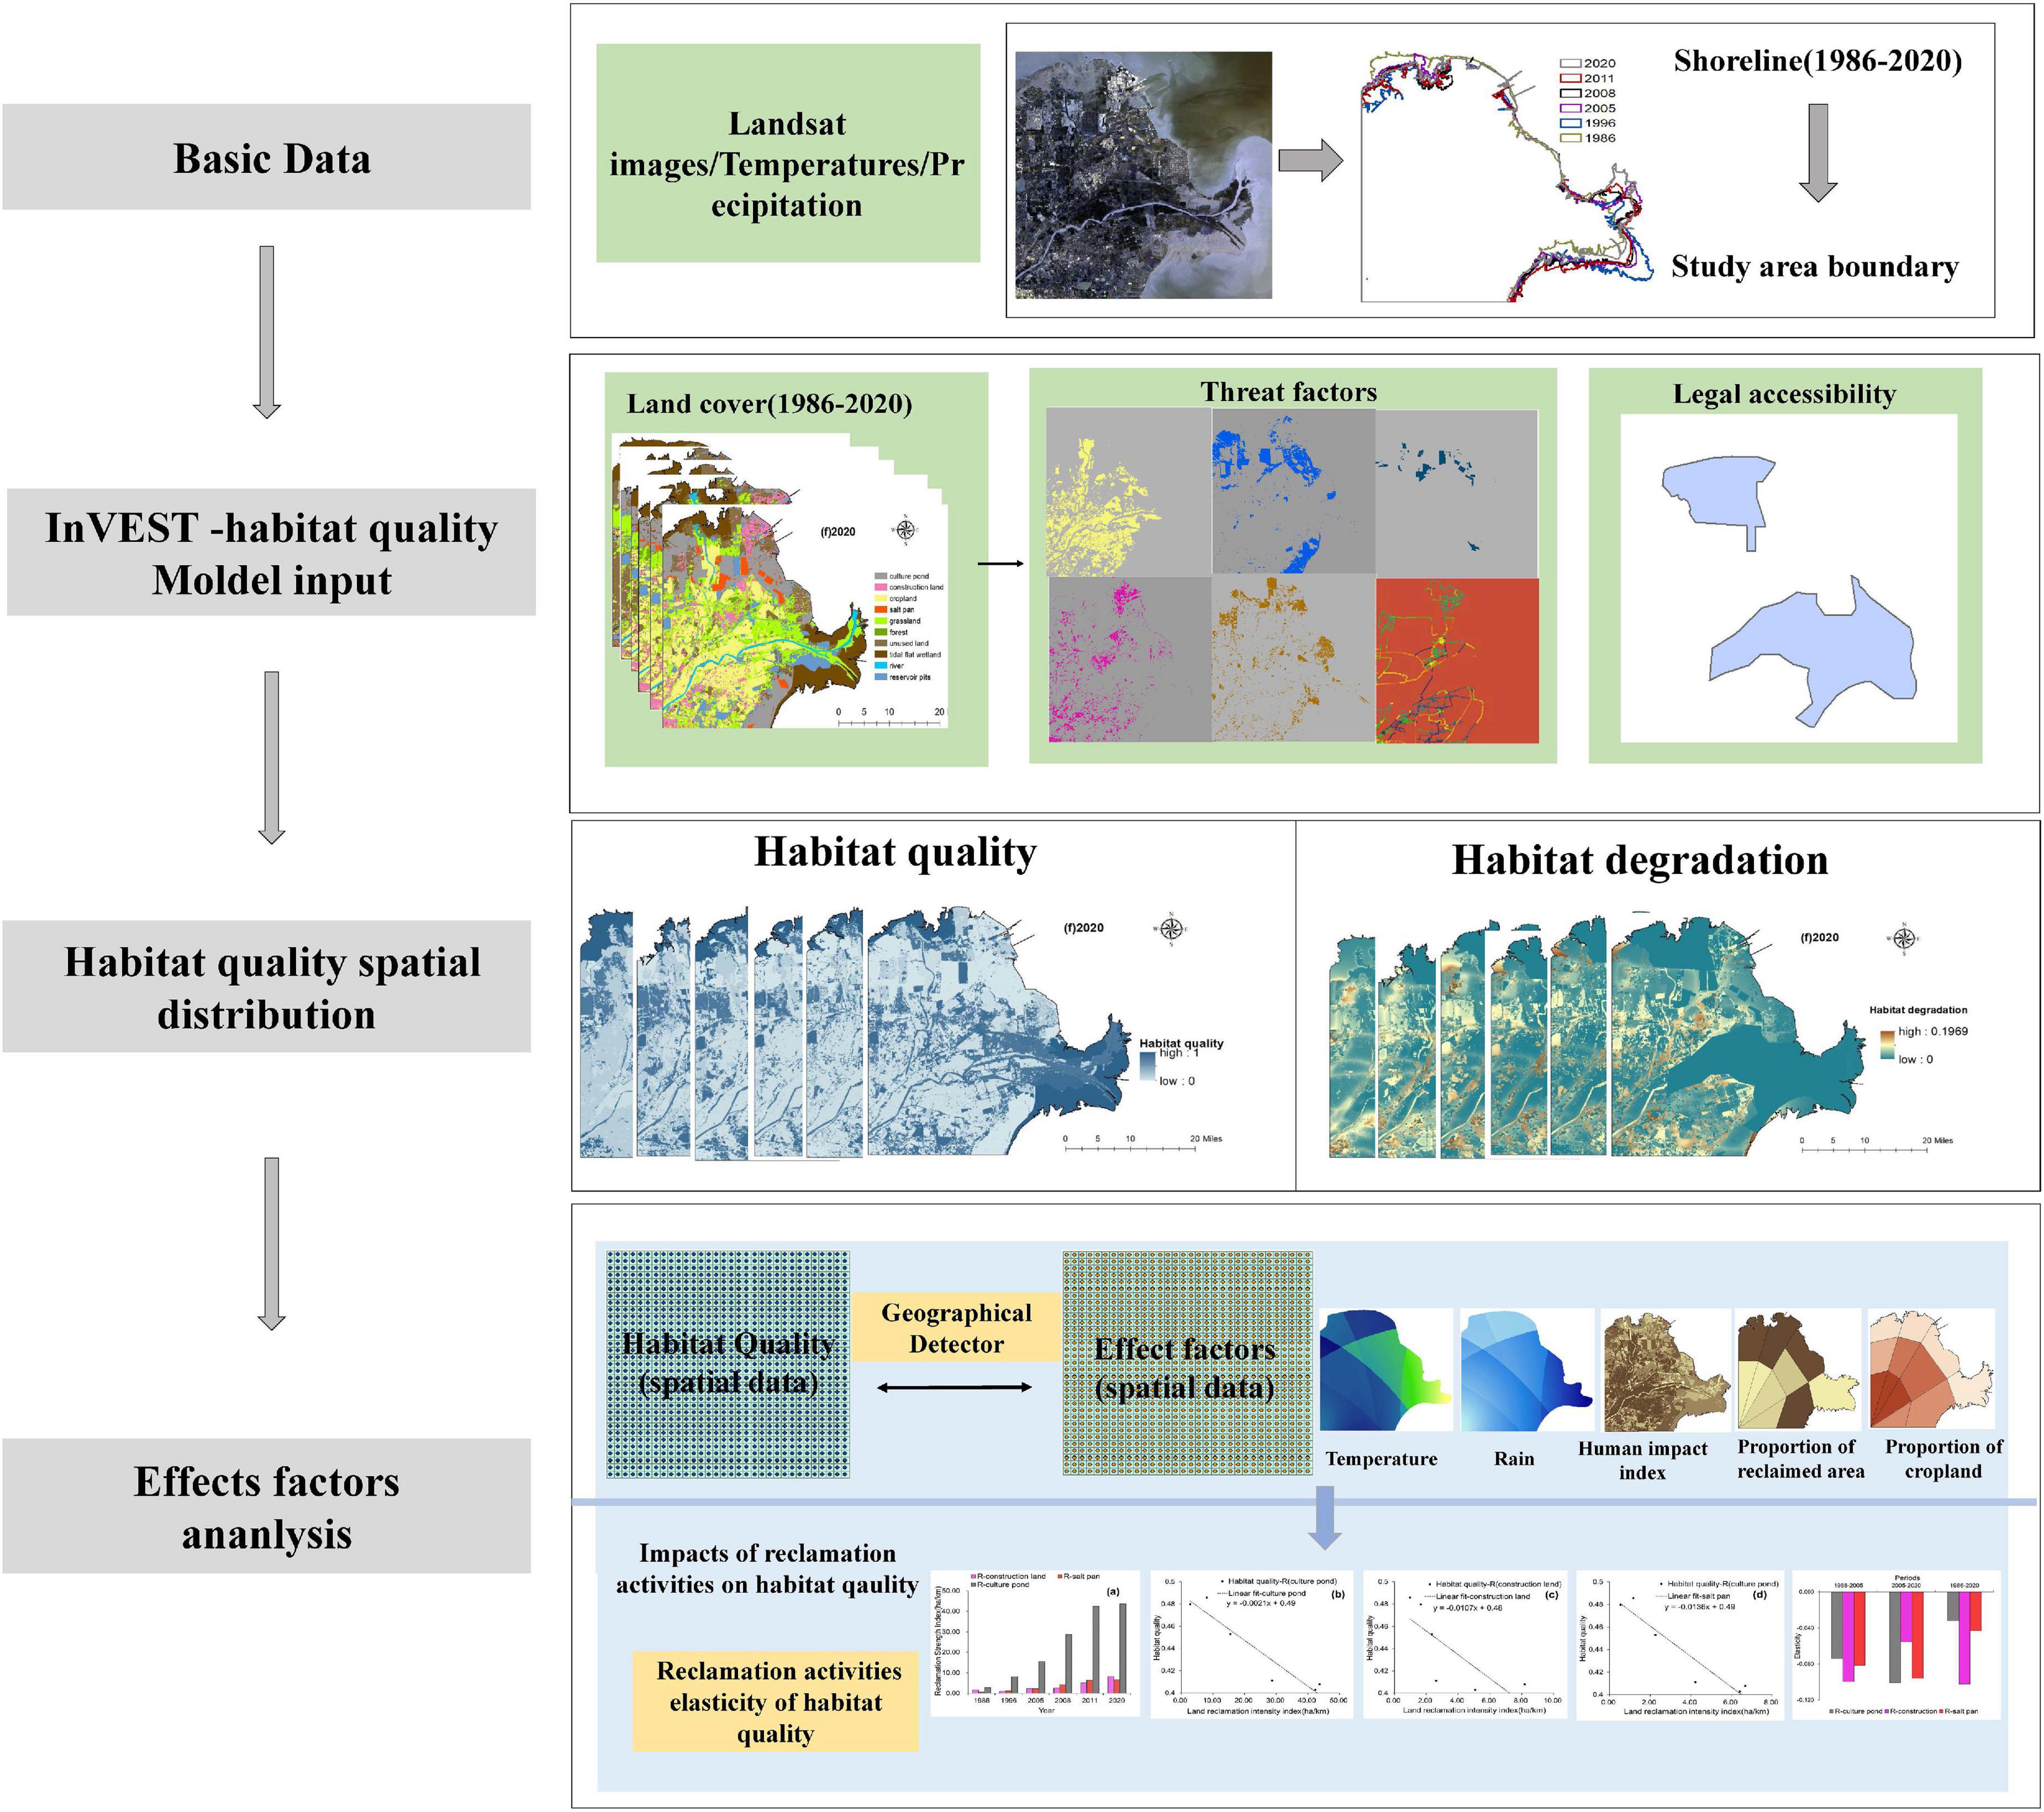
Figure 2. Flowchart showing methodological steps followed in the study.
The Yellow River Delta (37°35′N∼38°12′N, 118°33′E∼119°20′E) (Figure 3) is bordered by Bohai bay to the north and Laizhou bay to the east and is located in Dongying city, Shandong province, China (Chi et al., 2018). The interaction of river, land, and sea has created this alluvial plain and large coastal wetlands (Yu et al., 2012). It is the most typical and youngest coastal estuarine wetland in China, and it is an important habitat for a large number of endangered waterbirds. The Yellow River Delta Wetland has extremely significant ecological conservation value.
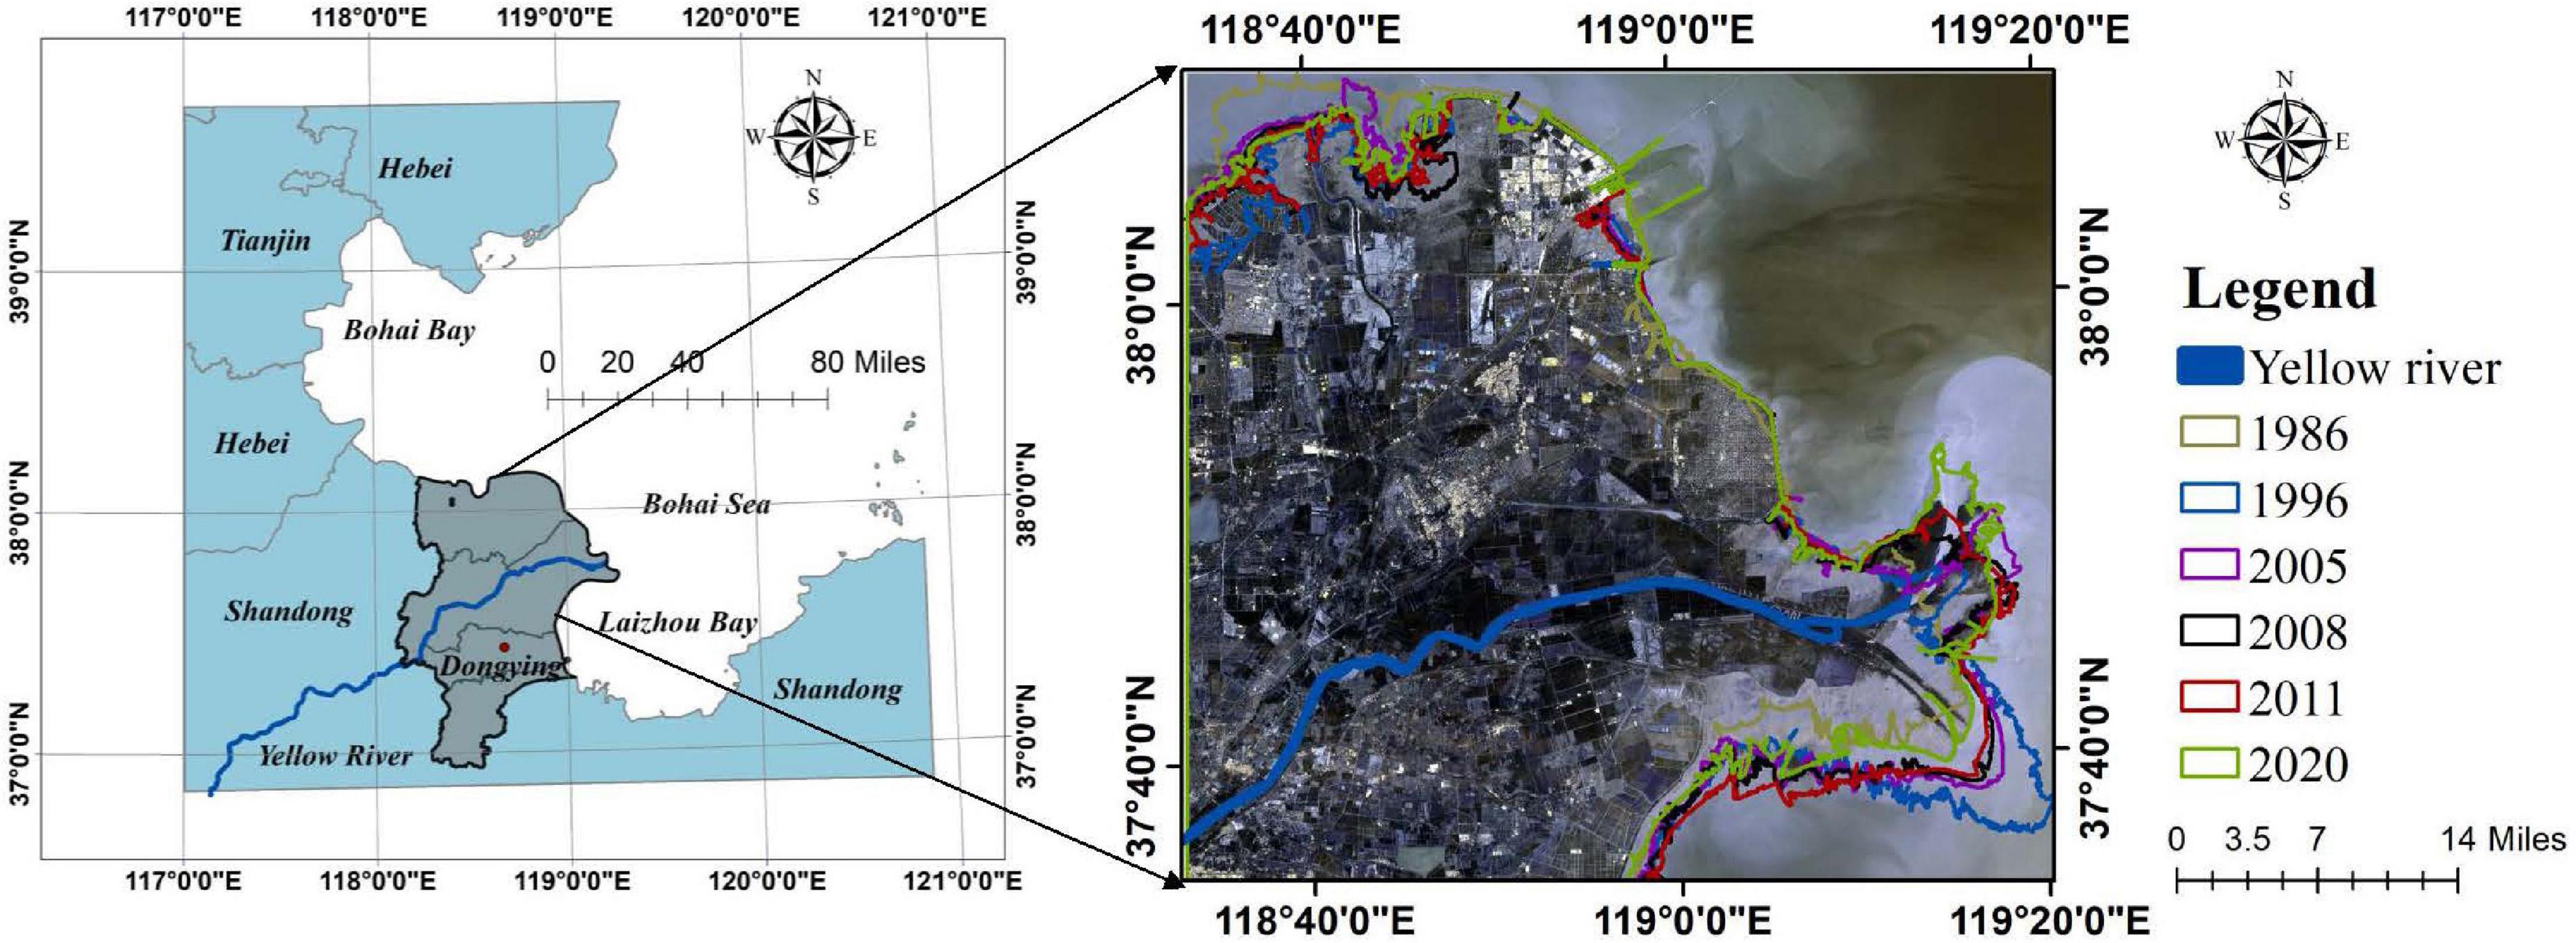
Figure 3. Location of the study area.
This study data mainly include vector data (i.e., study area boundary, Yellow River delta national nature reserve boundary, road network data), remote sensing image data (i.e., Landsat images), meteorological data (i.e., temperatures, precipitation), fieldwork data (Table 1). The remote sensing images from Landsat series satellite long time series dataset were selected as the remote sensing data source for the extraction of shoreline and land use in the Yellow River Delta Wetland for 35 years. A field survey was conducted in October 2020. A total of 70 sampling sites were visited. A global positioning system (GPS) was used and the land use type of each sample point was recorded. Based on the field survey and previous studies (Liu et al., 2016; Feng et al., 2019), the land use types of the Yellow River Delta Wetland were classified into 10 categories using a supervised classification-support vector machine approach, which are mudflat wetland, unused land, construction land, cropland, culture pond, reservoir pond, salt pan, forest, grassland, and river. Based on the field survey data of land use types and Google high-resolution remote sensing images, the interpretation results were manually visually modified, and the interpretation accuracy reached over 85%. The meteorological data including precipitation and temperature data were obtained from the China Meteorological Data Service Center, which was obtained by spatial interpolation of inverse distance weights and cropping using 31 meteorological stations in Shandong Province. All raster data were processed by resampling using the WGS1984-UTM50N coordinate system with a resolution of 30 m.

Table 1. Types and sources of data required in this study.
The current Yellow River estuary is a weakly tidal land-phase estuary with a short time for seawater to reach the high tide line position (Xia et al., 2009). The Landsat data file uses universal coordinated time (UTC), and most of the images taken were focused around 02:00 to 02:30 on that day. Since China is in the eastern eighth zone, the images were taken between 10:00 and 10:30 BST. The images selected for this paper were all taken between July and October each year, during which the tidal height in Dongying, Shandong Province, changes mainly in the evening and at night. During the daytime, especially between 10:00 and 10:30, the tidal height remains around 100 cm, while the average elevation of the tidal datum is −100 cm, so the tidal height remains 0 m above sea level. The highest value of the detected tidal height is 120 cm and the lowest value is about 70 cm. The error of using the water’s margin as the boundary line between sea and land is 20–30 cm (Wang et al., 2018b). Therefore, in this paper, the water’s margin line at the time of satellite transit is chosen as the shoreline and MNDWI is used to extract the shoreline.
The repaired normalized water index was proposed by Xu (2005) based on the normalized water index NDWI, and its mathematical expression is as follows:
where MIR and Green represent the reflectance of the mid-infrared band and Green light band, respectively.
The InVEST model, developed by Stanford University in collaboration with WWF and others, was designed to quantify three types of ecosystem services: terrestrial, freshwater, and marine. The habitat quality model is used in the InVEST model as a reflection of habitat quality, the information is mainly based on land use and habitat threat factors in habitat quality maps, and the assessment assumptions are not species-specific, but apply to biodiversity more generally, where areas of higher habitat quality can support higher species richness (Sharp et al., 2015; Terrado et al., 2016).
(1) The habitat quality assessment equation is as follows (Sharp et al., 2015):
where is the habitat quality of raster x in Land type j; k is the half-saturation constant, which is 0.5 in this study; Hj is habitat suitability of Land type j; z is normalized constant, generally 2.5; Dxj is the habitat degradation index, which indicates the degree of habitat degradation under stress.
(2) Degree of habitat degradation:
The model assumes that the more sensitive the suitable habitat raster is to the threat source raster, the more likely the threat will affect causing its degradation, and thus the greater the raster degradation. The calculation formula is as follows (Sharp et al., 2015):
where R is the number of threat factors; Yr is the number of grids occupied by the threat factors; wr is the weight of each threat; ry is the effect of threat r that originates in raster y; βx is the level of accessibility to a raster x; Sjr is the relative sensitivity of land type j to threat factor; iryx is the degradation decay function through distance.
(3) Habitat raster and threat source distance calculation formula (Sharp et al., 2015):
where dxy is the linear distance between raster x and raster y, dr max is the maximum impact distance of threat of r originating in pixel y.
(4) Legal accessibility:
Legal accessibility is a measure of the extent to which an area is legally protected from human activities. The model assumes that the larger the raster cells are legally protected, the less impact they are affected by threats. The protected areas, which are usually accompanied by administrative policies or management plans, are less affected than non-legal protected areas (Duarte et al., 2016; Kija et al., 2020). A nature reserve in the strict sense represents the least accessibility with a value of 0, the greatest accessibility with a value of 1, and an intermediate level of protection between 0 and 1. The Shandong Yellow River Delta Nature Reserve was approved as a national nature reserve by the State Council in 1992. It is a national nature reserve focused on protecting the nascent wetland ecosystem and endangered bird species in the Yellow River estuary. The Yellow River Delta Nature Reserve is a very typical formal reserve. Therefore, the reserve is considered to be included in the model evaluation, which will largely improve the accuracy of the model evaluation results. The Yellow River Delta Nature Reserve vector boundary was added to the field access using ArcGIS 10.2 and assigned a value of 0. Because it was formally established in 1992, habitat quality evaluation from 1996 to 2020 considered legal accessibility, while 1986 was not considered.
The InVEST-habitat quality model input data include land use map, threat source data, threat factor weight, and influence distance, sensitivity parameters of suitable habitats to threat sources, half-saturation constant. The threat source data are selected from cropland, culture ponds, salt pans, unused land, construction land, and road network data. The weight of each threat source data, the degradation types, sensitivity parameters, and maximum distance were selected mainly based on the InVEST model manual and referenced to related research (Li et al., 2019; Ding et al., 2021; Song et al., 2021; Yohannes et al., 2021), and the half-saturation constant was adopted as 0.5. The values of model input parameters were taken as shown in Table 2.
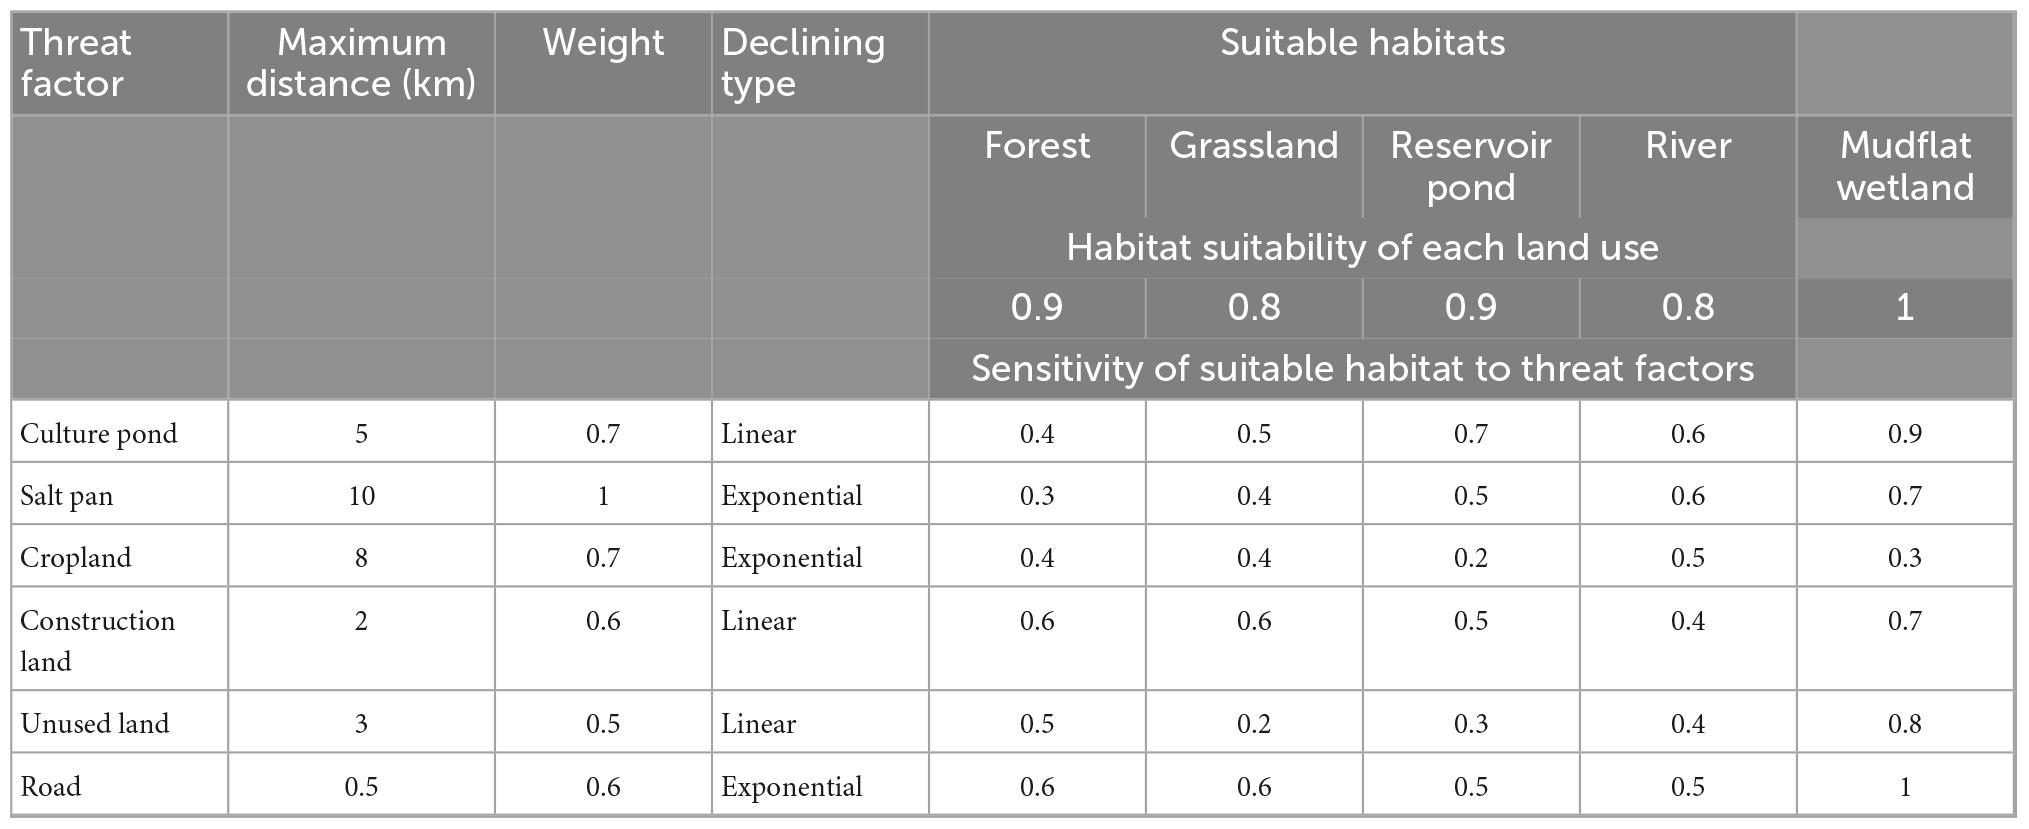
Table 2. Input data used for the InVEST-habitat quality model.
This paper analyses the relationship between different influencing factors and habitat quality using GeoDetector to identify the dominant factors of habitat quality in the Yellow River Delta Wetland. GeoDetector is a tool for detecting and exploiting spatial anisotropy and can also reveal the influencing factors behind it. The divergence and factor detectors, which are mainly to detect the spatial divergence of Y and to detect how much of the spatial divergence of the attribute Y is explained by the factor X. It is measured by the q-value (Wang and Xu, 2017). The calculation formula is:
where h is the stratification of dependent variable y or independent variable x, i.e., classification or partition; Nh and N are the unit numbers of layer h and the whole region, respectively; and σ2 are the variances of layer h and region; SSW and SST are the sum of variances within the layer and the total variances of the whole region, respectively; The value range of q is [0,1], where the larger the value, the stronger the explanatory power of the independent variable x to dependent variable y, and vice versa.
Elasticity measures the sensitivity of the outcome variable to the change of an explanatory variable (Ye and Zhai, 2010). Elasticity term originated from microeconomics and was successfully implemented in many fields to gauge responsiveness (Khan, 2018). For instance, studies have been conducted to analyze the elasticity of different ecosystem services to changes in land use area (Liu et al., 2021b; Sannigrahi et al., 2021), the elasticity approach was used to quantify the impact of land use dynamics on ecological quality (Zhang et al., 2022a), and studies have also analyzed the response of water quality parameters to precipitation and temperature using elasticity coefficients. It simplifies data analysis because it is unitless (Khan, 2018).
To understand the relationship between changes in the intensity of different types of reclamation activities and changes in habitat quality, and which type of change in the intensity of reclamation activities will have a greater and lesser effect on changes in habitat quality, can be explained using the concept of “elasticity” in economics. In a general sense, elasticity is the property of a variable to change in a certain proportion relative to another variable. As a threat source for habitat quality model calculations, reclamation activities play a role in determining the spatial and temporal distribution of habitat quality in the Yellow River Delta Wetland, so this paper considers using the elasticity index to analyze the effects of different types of reclamation activities on habitat quality. The elasticity is calculated as follows:
where E is the elasticity value, x is the independent variable, y is the dependent variable, Δx, and Δy are the amounts of change in the independent and dependent variables.
In this study, the logarithmic values of the variables are used as the elasticity values (Ye and Zhai, 2010).
where xi is the independent variable, for a certain year, yi y is the dependent variable in the corresponding year, E is the elasticity, and A is a constant.
To better quantify the intensity of construction land, culture ponds, and salt pans reclamation activities in the offshore area, this paper introduces a reclamation intensity index to quantify the intensity of different types of reclamation activities. Fu et al. (2010) proposed to use the reclamation intensity to refer to quantify the scale and intensity of reclamation in a certain area and to express the reclamation intensity in terms of the area of reclamation carried per unit of shoreline length. On this basis, this paper extrapolates this concept, mainly considering that the intensity of reclamation activity is not only related to the area but also the type of reclamation activity, and relying on the change of area does not fully reflect the intensity of reclamation activity, therefore, this paper considers the influence weight of reclamation activity as a threat source as a way to distinguish the influence of the type of reclamation activity on the result of reclamation intensity index:
where ωr is the weight of each threat (reclamation activities), Ri is the reclamation intensity index, Si is the total area of the i-th reclamation activity within the study area (ha); L is the total length of the shoreline in the study area (km).
The spatial and temporal variation of habitat quality is influenced by a variety of factors. Considering the unique geographical location of the Yellow River Delta Wetland and the accessibility of data, this study selected five initial influencing factors. They are divided into climate change and human activities. The climate factor is selected as temperature and precipitation, and the human activities are selected as the human impact index, the proportion of the area of reclaimed activities, and the proportion of the area of cropland. ArcGIS 10.2 was used to generate spatialized data of annual average temperature, annual precipitation, human impact index, the proportion of reclaimed activity area, and the proportion of cropland area for the Yellow River Delta Wetland from 1986 to 2020. The results of the calculations are in the Supplementary material.
The human impact index (HAI) represents the impact of human activities on land cover types and landscape changes (Li et al., 2022), and this index reflects the intensity of human activities to some extent, and the selection of HAI as an impact factor can reflect the interrelationship between habitat quality and human activities, which is calculated as follows (Table 3).

Table 3. Strength indices of human impact for different land use elements (Li et al., 2022).
where Ai denotes the area of the i-th land use type, TA is the total land use area of the annual Yellow River Delta Wetland, and Pi is the intensity coefficient of anthropogenic impact.
With the increase in the intensity of human activities interference, the area of culture ponds, salt pans, and construction land is growing rapidly. The continuous development of construction land, culture ponds, and salt pans in the Yellow River Delta Wetland, although it can bring great social and economic benefits, it causes the loss and degradation of a large number of natural wetlands. Therefore, the culture ponds, salt pans, and construction land in the offshore area are selected as the most important types of reclamation activities in the Yellow River Delta Wetland, and the proportion of reclamation activities under the dynamic change of shoreline from 1986 to 2020 is calculated:
where Pr is the annual percentage of reclamation activity, Sr is the total area of reclamation activity per year, S is the total area of study area per year under shoreline change.
In addition to reclamation activities, the significant increase in cropland in the central region can cause a series of problems, such as the destruction of the original wetlands and soil problems caused by the use of pesticides and fertilizers, which in turn can lead to the loss of wetland functions. Therefore, in this paper, the proportion of the area of cropland is also considered as an influencing factor of habitat quality, which is calculated as follows.
where Pc is the annual percentage of cropland, Sc is the total area of cropland per year,S is the total area of study area per year under shoreline change.
From 1986 to 2020, the overall area of the Yellow River Delta fluctuates between 2836 and 2902 km2, with a range of 66 km2. The evolution of the Yellow River Delta erosion and siltation is generally fluctuating, and the changing pattern is not obvious. Within this fluctuation range, the overall area of the delta shows an increase from 1986 to 2005, reaching a peak of 2902 km2 in 2005, followed by a gradual decrease in the overall area of the Yellow River Delta until 2020. From 1986 to 2020, the Yellow River Delta area showed an overall increasing trend.
The distribution of land-use types from 1986 to 2020 is shown in Figure 4, and the changes in land-use types in different periods are shown in Figure 5. From 1986 to 2020, the different land-use types of the Yellow River Delta Wetland have changed significantly, among which the changing trend of culture ponds, salt pans, and construction land is obvious. The area of the culture pond increased from 23.27 km2 in 1986 to 419.52 km2 in 2020, and the salt pan increased from 4.94 km2 in 1986 to 64.41 km2 in 2020, the construction land increased from 28.81 to 245.71 km2. The unused land and mudflat wetland showed an obvious decreasing trend, the unused land decreased from 1110.47 km2 in 1986 to 286.87 km2 in 2020, and the mudflat wetland from 540.83 km2 in 1986 to 328.06 km2 in 2020. It can be seen that from 1986 to 2020, most of the natural wetlands in the Yellow River Delta were transformed into artificial wetlands and non-wetlands with the enhancement of the intensity of human activities. Construction land, culture ponds, salt pans, cropland, and reservoir ponds show a significant increase in general, while mudflat wetlands, forest, grassland, and unused land show a decreasing trend, and the increase of culture ponds, salt pans, reservoir ponds, and coastal construction land encroaches on a large number of mudflat wetlands, while the cropland in the central region encroaches on forest land, grassland, and unused land.
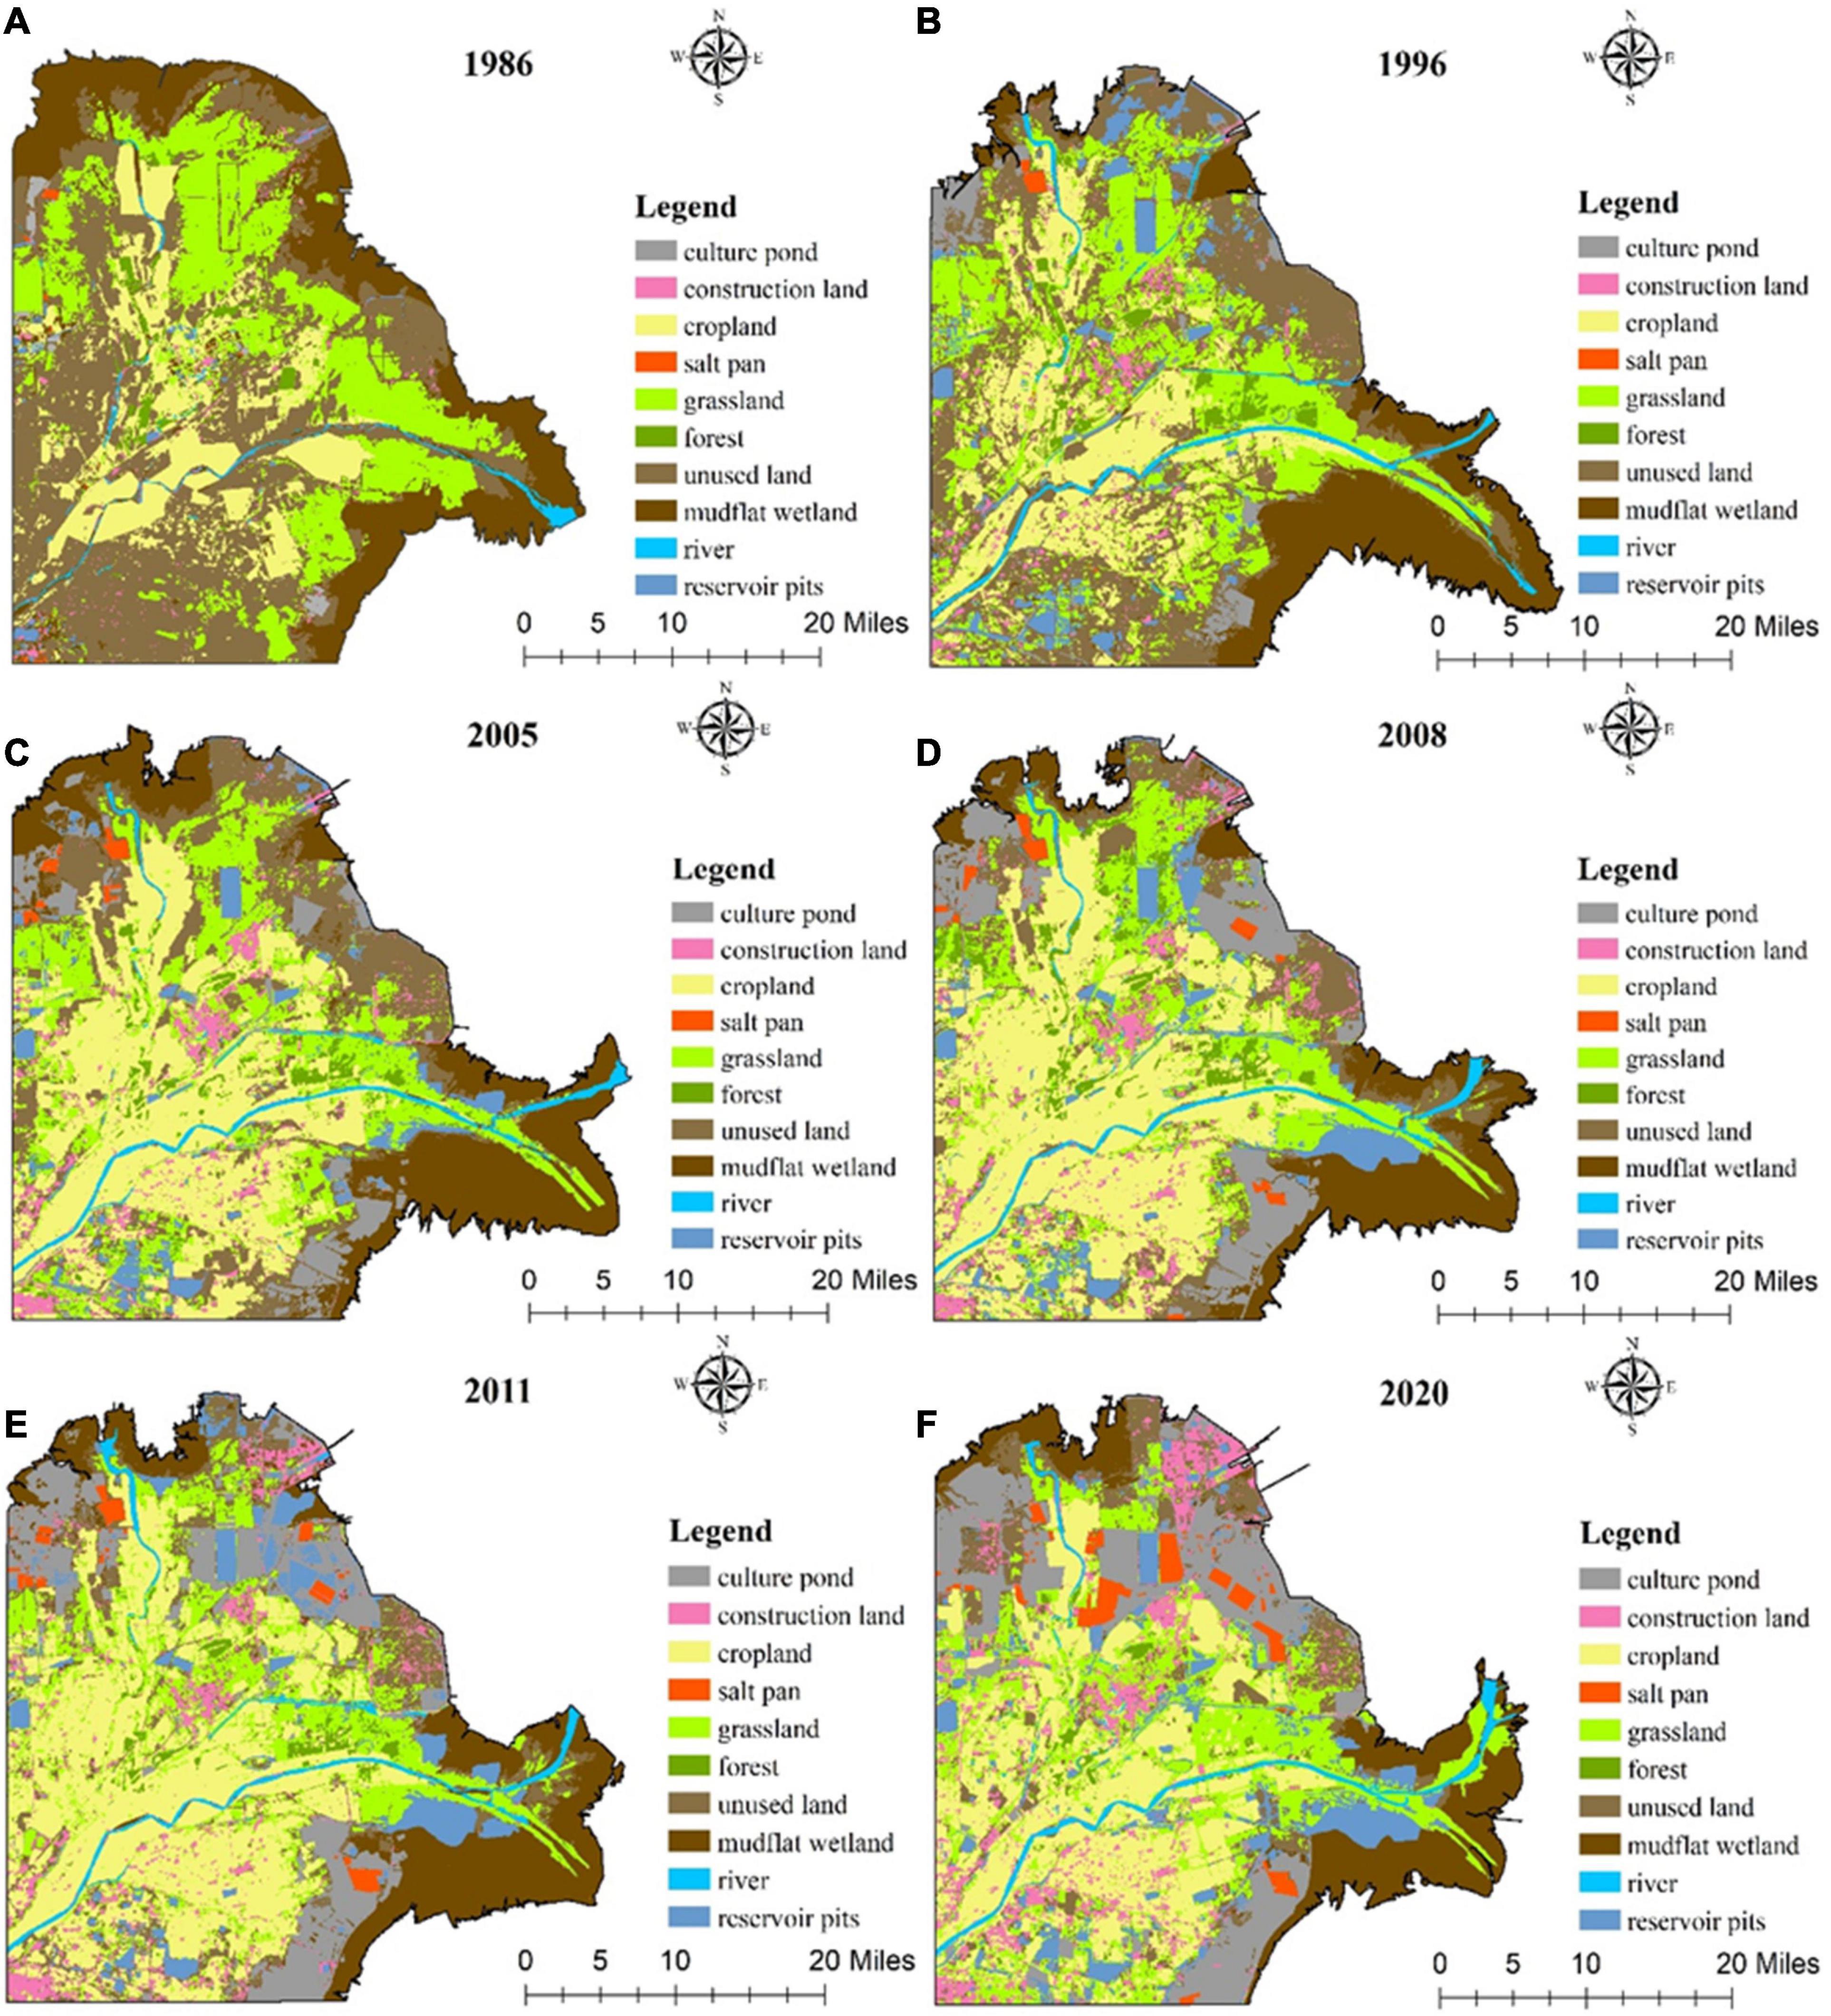
Figure 4. Land use maps, 1986 (A), 1996 (B), 2005 (C), 2008 (D), 2011 (E), and 2020 (F).
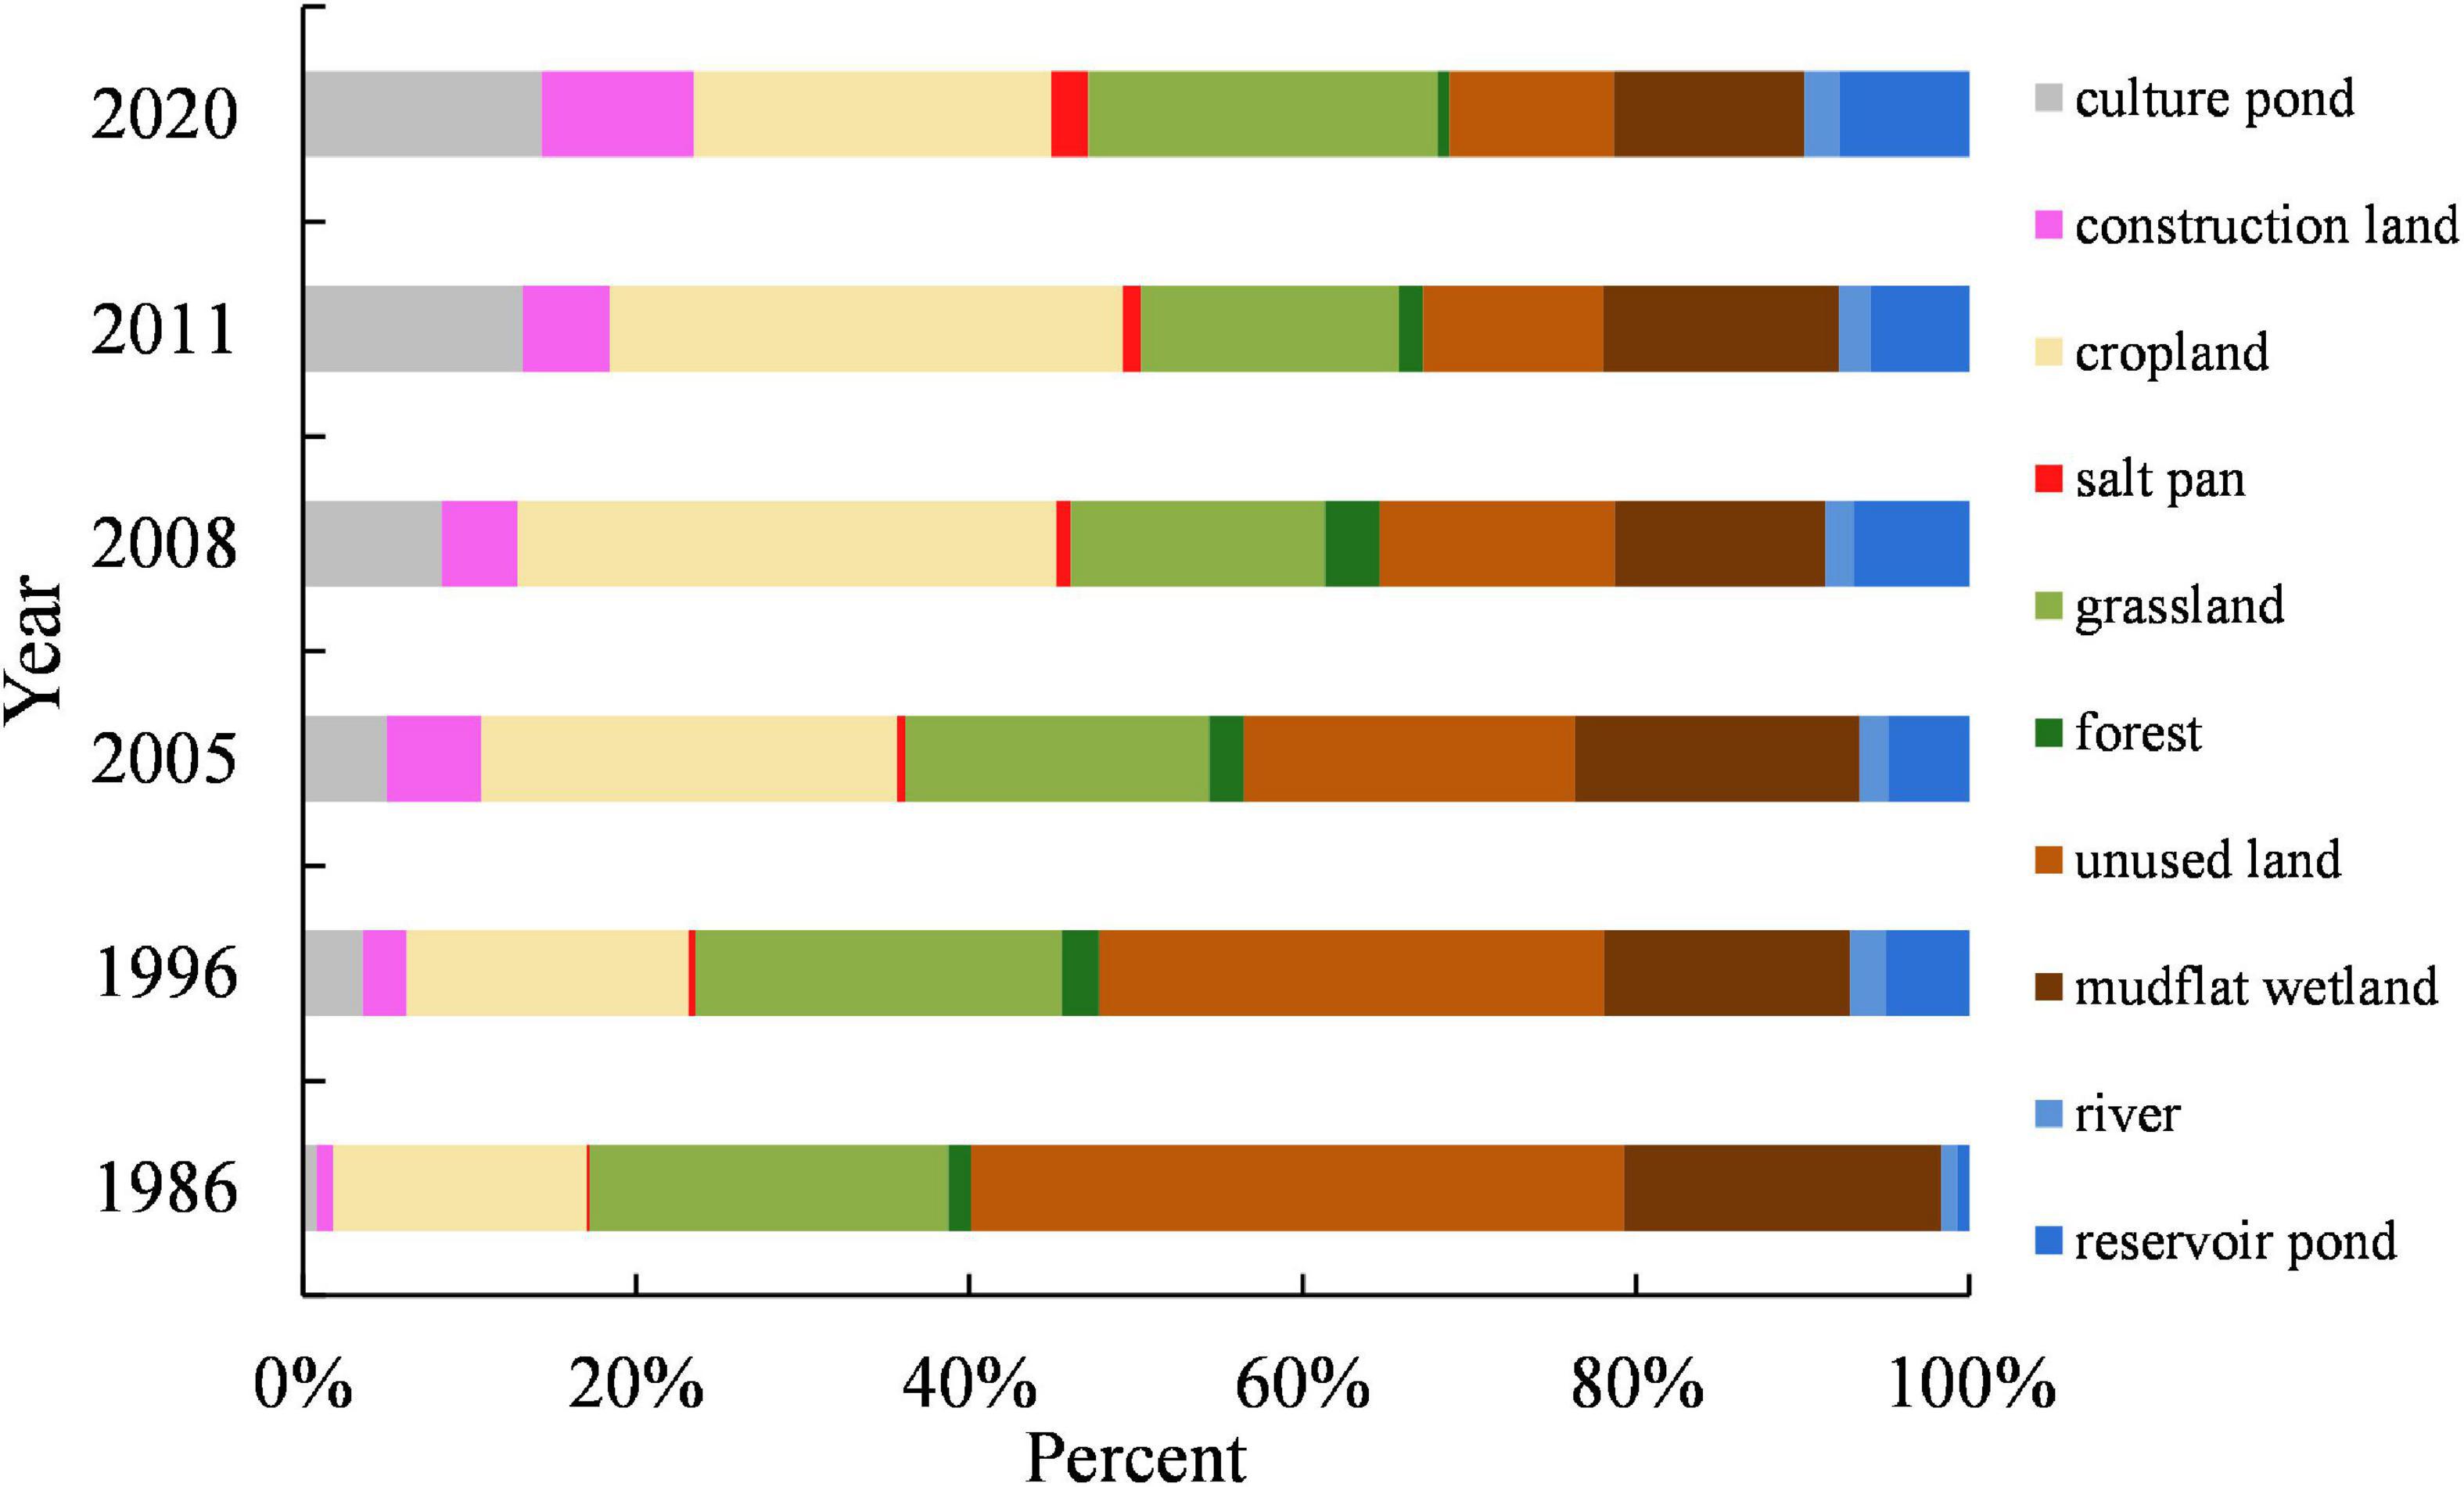
Figure 5. Changes in the area proportion of different land-use types in the Yellow River Delta Wetland.
Figure 6 shows the spatial distribution of habitat quality in the Yellow River Delta Wetland from 1986 to 2020, and the habitat quality index ranges from 0 to 1. Higher values represent more suitable habitat quality. According to the statistics (Figure 7), the average values of habitat quality index in the Yellow River Delta Wetland were 0.4798, 0.4858, 0.4531, 0.4113, 0.4029, and 0.4078 from 1986 to 2020. From 1986 to 1996, habitat quality showed an increasing trend. From 1996 to 2011, habitat quality showed a decreasing trend, and habitat quality in 2020 had a slowly increasing trend compared to 2011. From 1986 to 2020, habitat quality in the Yellow River Delta Wetland showed an overall decreasing trend.

Figure 6. Habitat quality spatial distribution in the Yellow River Delta Wetland, 1986 (A), 1996 (B), 2005 (C), 2008 (D), 2011 (E), and 2020 (F).
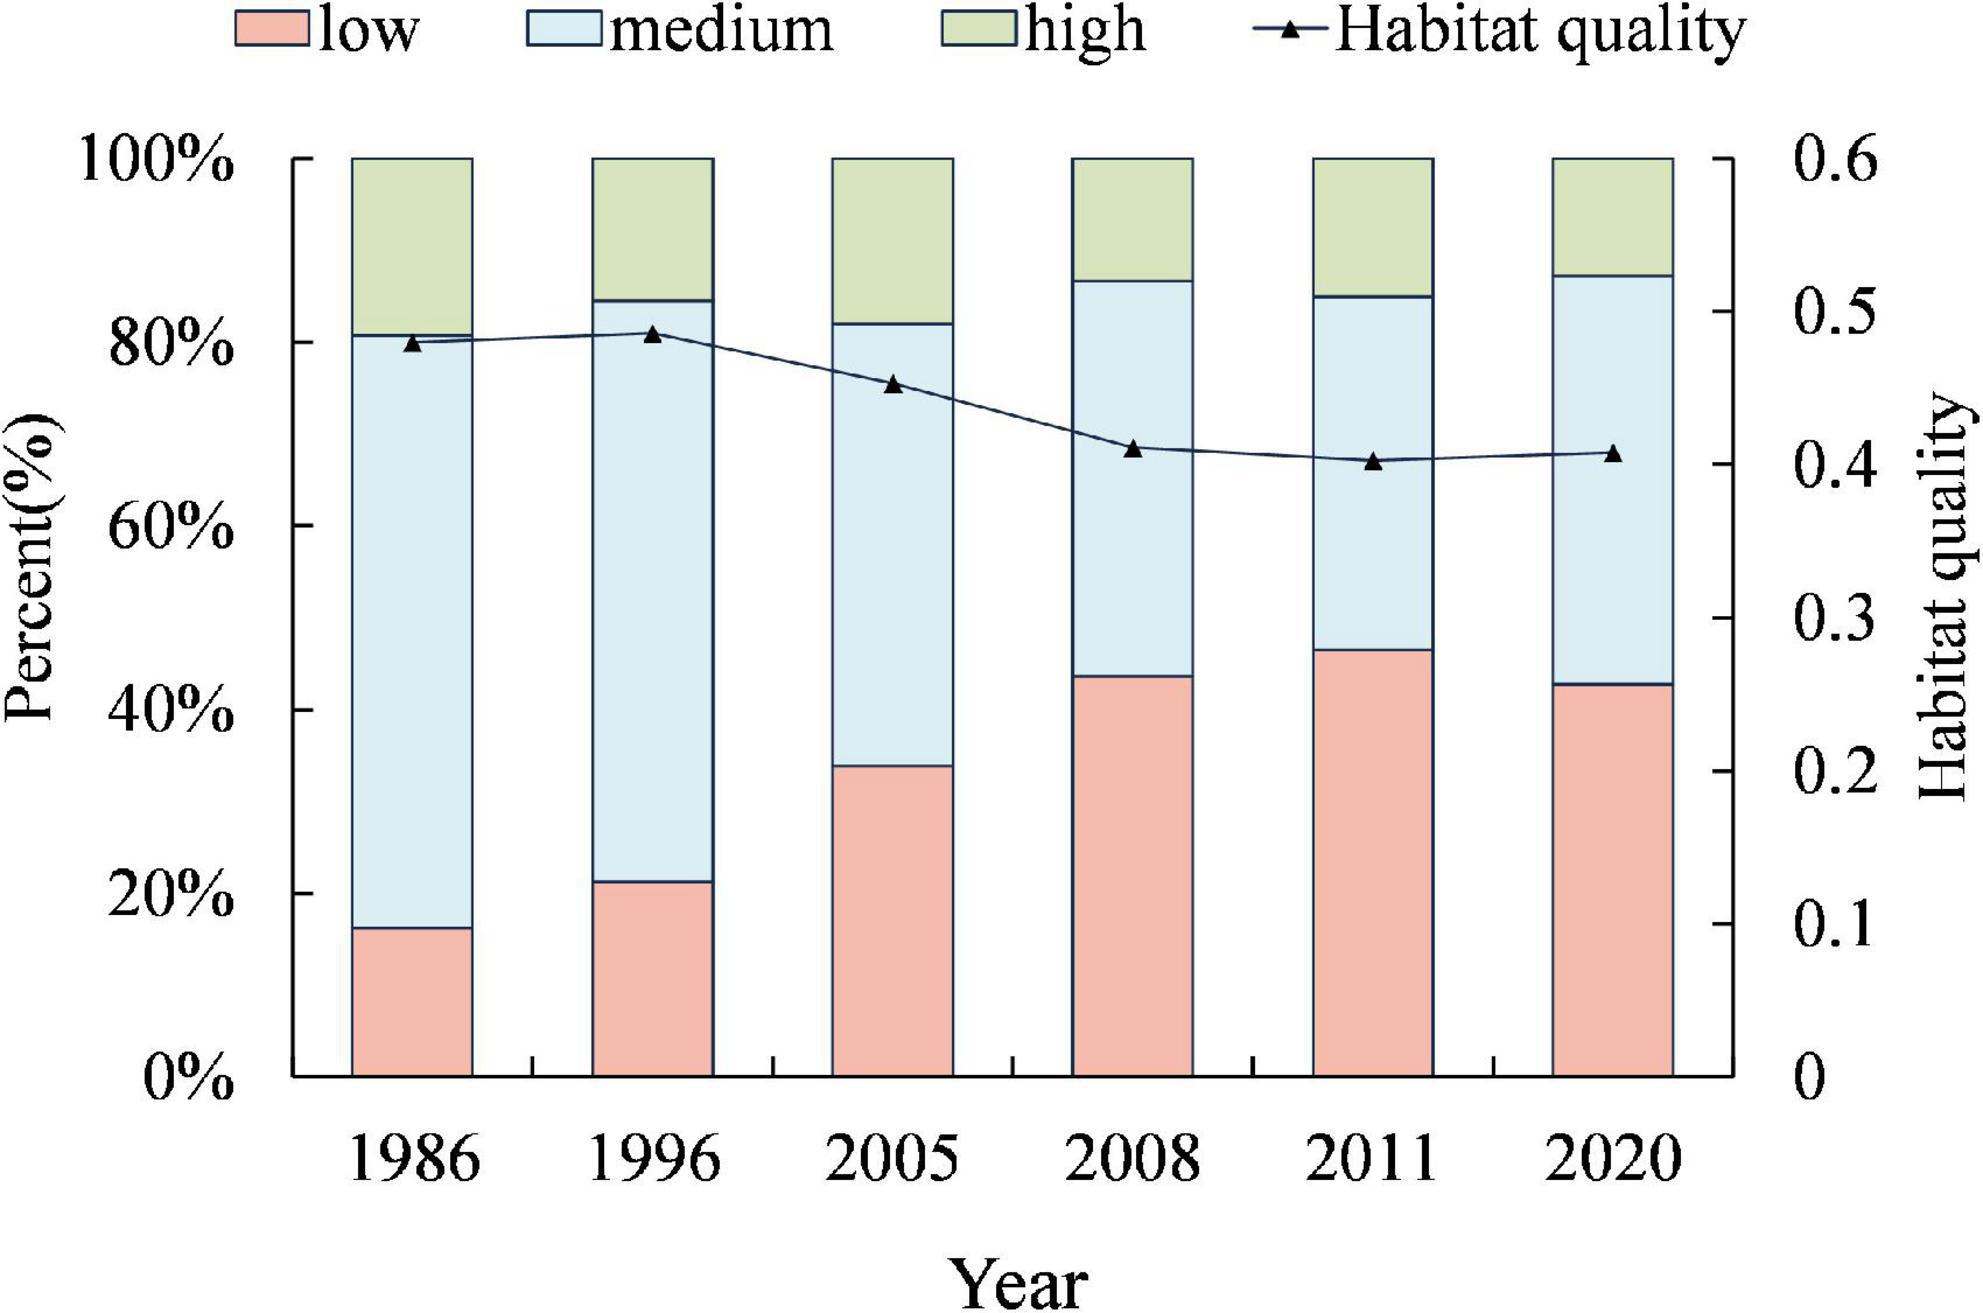
Figure 7. Habitat quality average index (right axis) and the percentage of area with different levels of habitat quality (left axis) from 1986 to 2020.
This study classified the habitat quality index into three categories. The habitat quality index of 0–0.1 was defined as low-quality habitat, 0.1–0.9 as medium-quality habitat, and 0.9–1 as high-quality habitat. The spatial distribution of habitat quality is consistent with the distribution of land use, with high-quality habitats mainly distributed in the mudflat wetland, grassland, and forest, and low-quality habitats mainly distributed in construction land and salt pans. From 1986 to 2020, there was an increasing trend of low-quality habitats and a decreasing trend of medium-quality and high-quality habitats in the Yellow River Delta Wetland.
Based on the land use types of the Yellow River Delta Wetland, the habitat quality of different land use types from 1986 to 2020 was further extracted (Table 4). Habitat quality varied considerably among land-use types, with the highest habitat quality index for mudflat wetland, which was generally close to 1, with the lowest habitat quality index for salt pan and construction land were to 0.
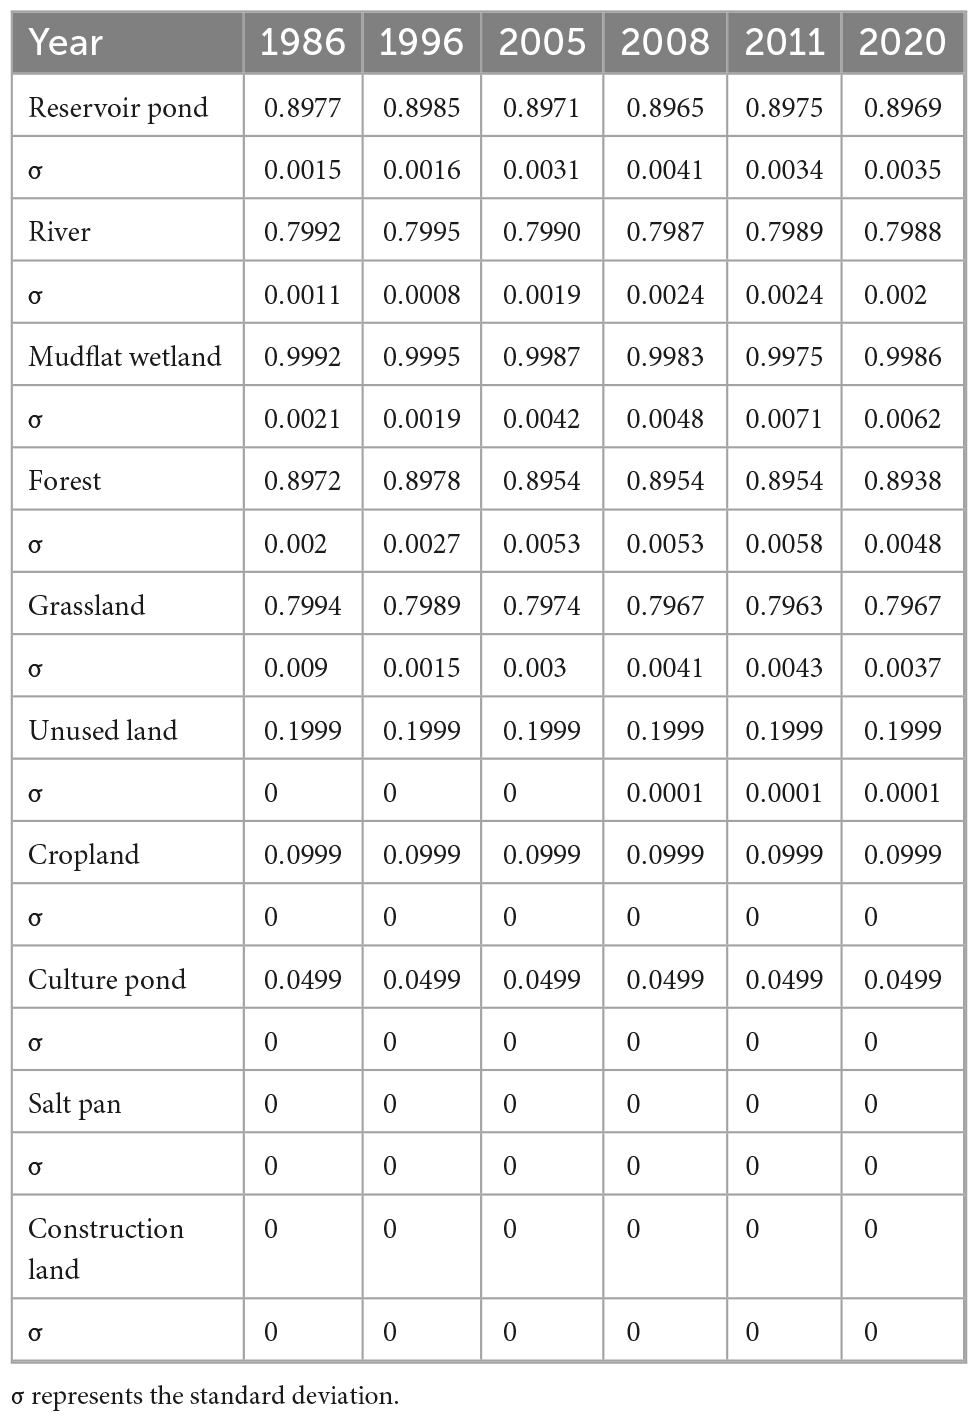
Table 4. Habitat quality average index of each land-use type from 1986 to 2020.
To have a more comprehensive understanding of the evolution of habitat quality, the degree of habitat degradation in the Yellow River Delta Wetland was calculated (Figure 8). The higher degree of habitat degradation represents the higher destructiveness of threat sources to habitat quality, and thus the possibility of habitat quality degradation will become greater. The degree of habitat degradation in the Yellow River Delta Wetland showed an increasing trend from 1986 to 2020. The habitat degradation value was 0.0088 in 1986, which increased to 0.0142 in 1996, and increased to 0.0162 in 2005, then increased to 0.0167 in 2008 and 0.0169 in 2011, and continued to increase to 0.0173 in 2020. Spatially, the establishment of the Yellow River Delta Reserve resulted in the degradation in the reserve being 0 after 1996, and the areas with a stronger degree of habitat degradation are concentrated in artificial areas such as construction land, which is consistent with existing studies (Xu et al., 2019; Zhu et al., 2020).
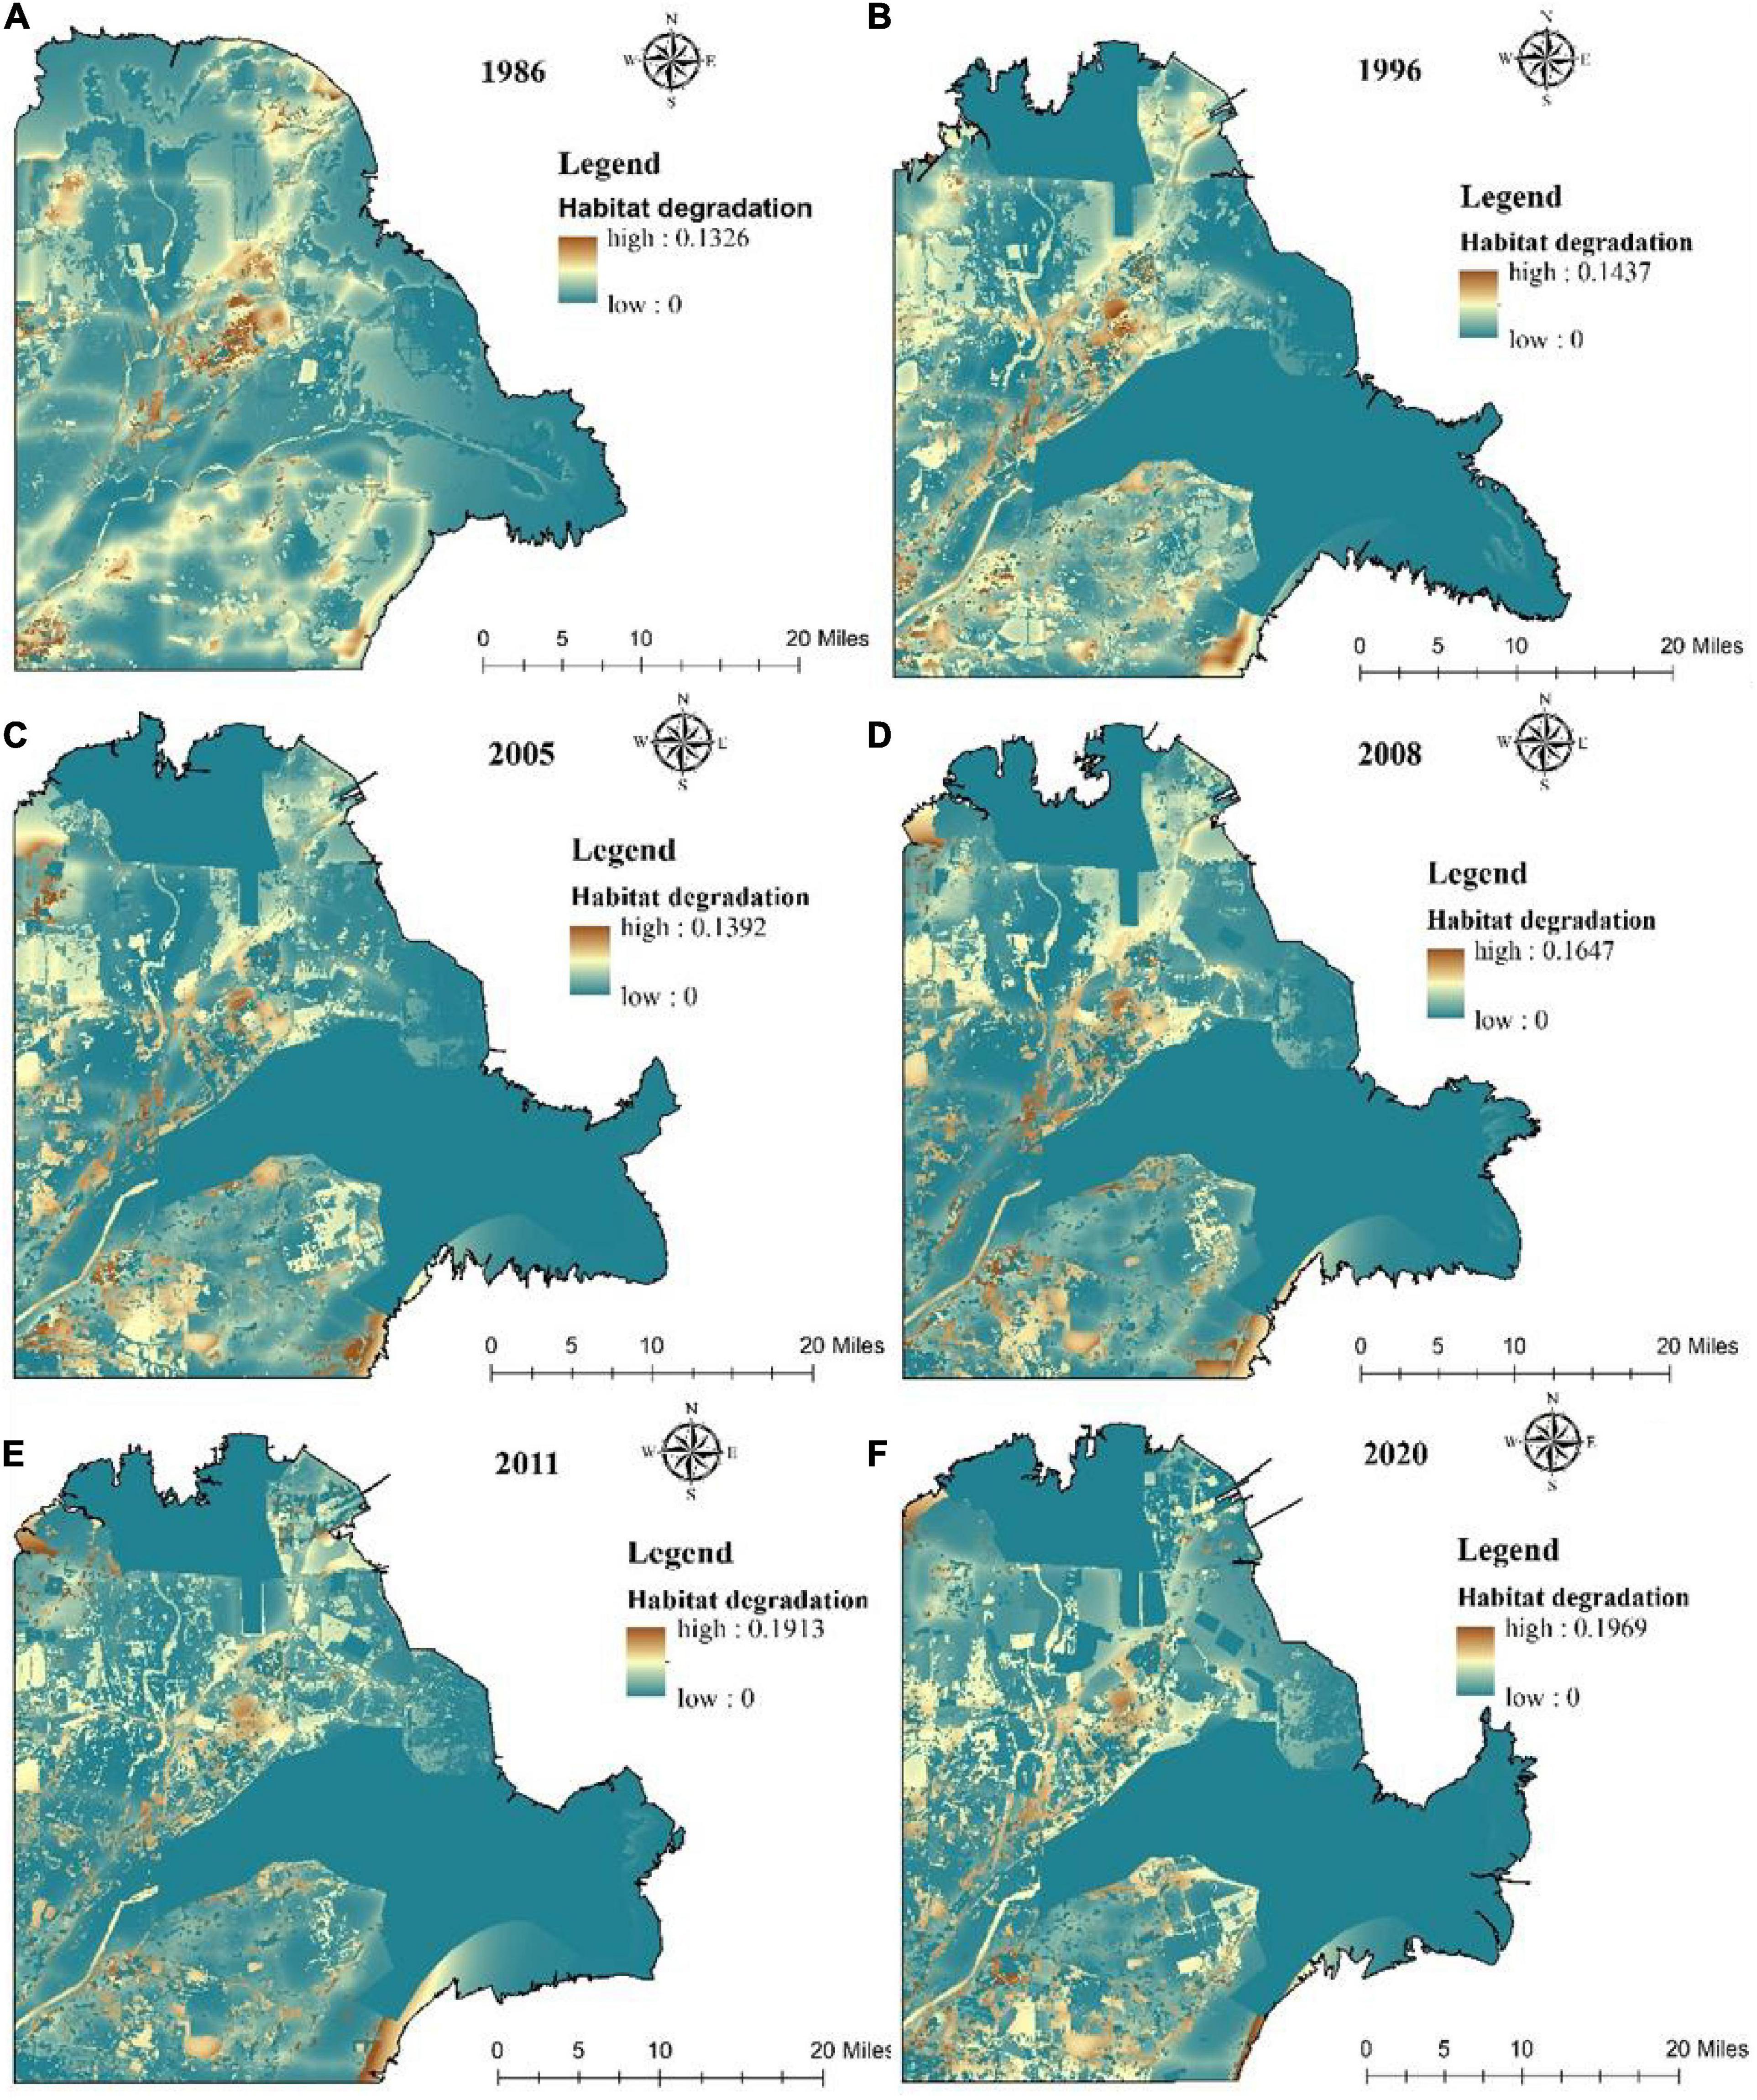
Figure 8. Habitat degradation spatial distribution in the Yellow River Wetland, 1986 (A), 1996 (B), 2005 (C), 2008 (D), 2011 (E), and 2020 (F).
The detection results are shown in Figure 9. The mean value of q for the proportion of reclaimed activities area is 0.87, the mean value of q for the proportion of cropland area is 0.84, the mean value of q for the human impact index is 0.82, the mean value of q for precipitation is 0.16, and the mean value of q for temperature is 0.17. The interpretation capacity of the impact factors was ranked according to the mean value of q. The proportion of reclaimed activities area > proportion of cropland area > human impact index > temperature > precipitation. It can be seen that the proportion of reclamation activities area is significantly higher than the climatic factors. This indicates that changes in climatic conditions have little influence on the habitat quality of the Yellow River Delta Wetland, while human disturbances, mainly reclamation activities, are an important influencing factor on the habitat quality of the Yellow River Delta Wetland.
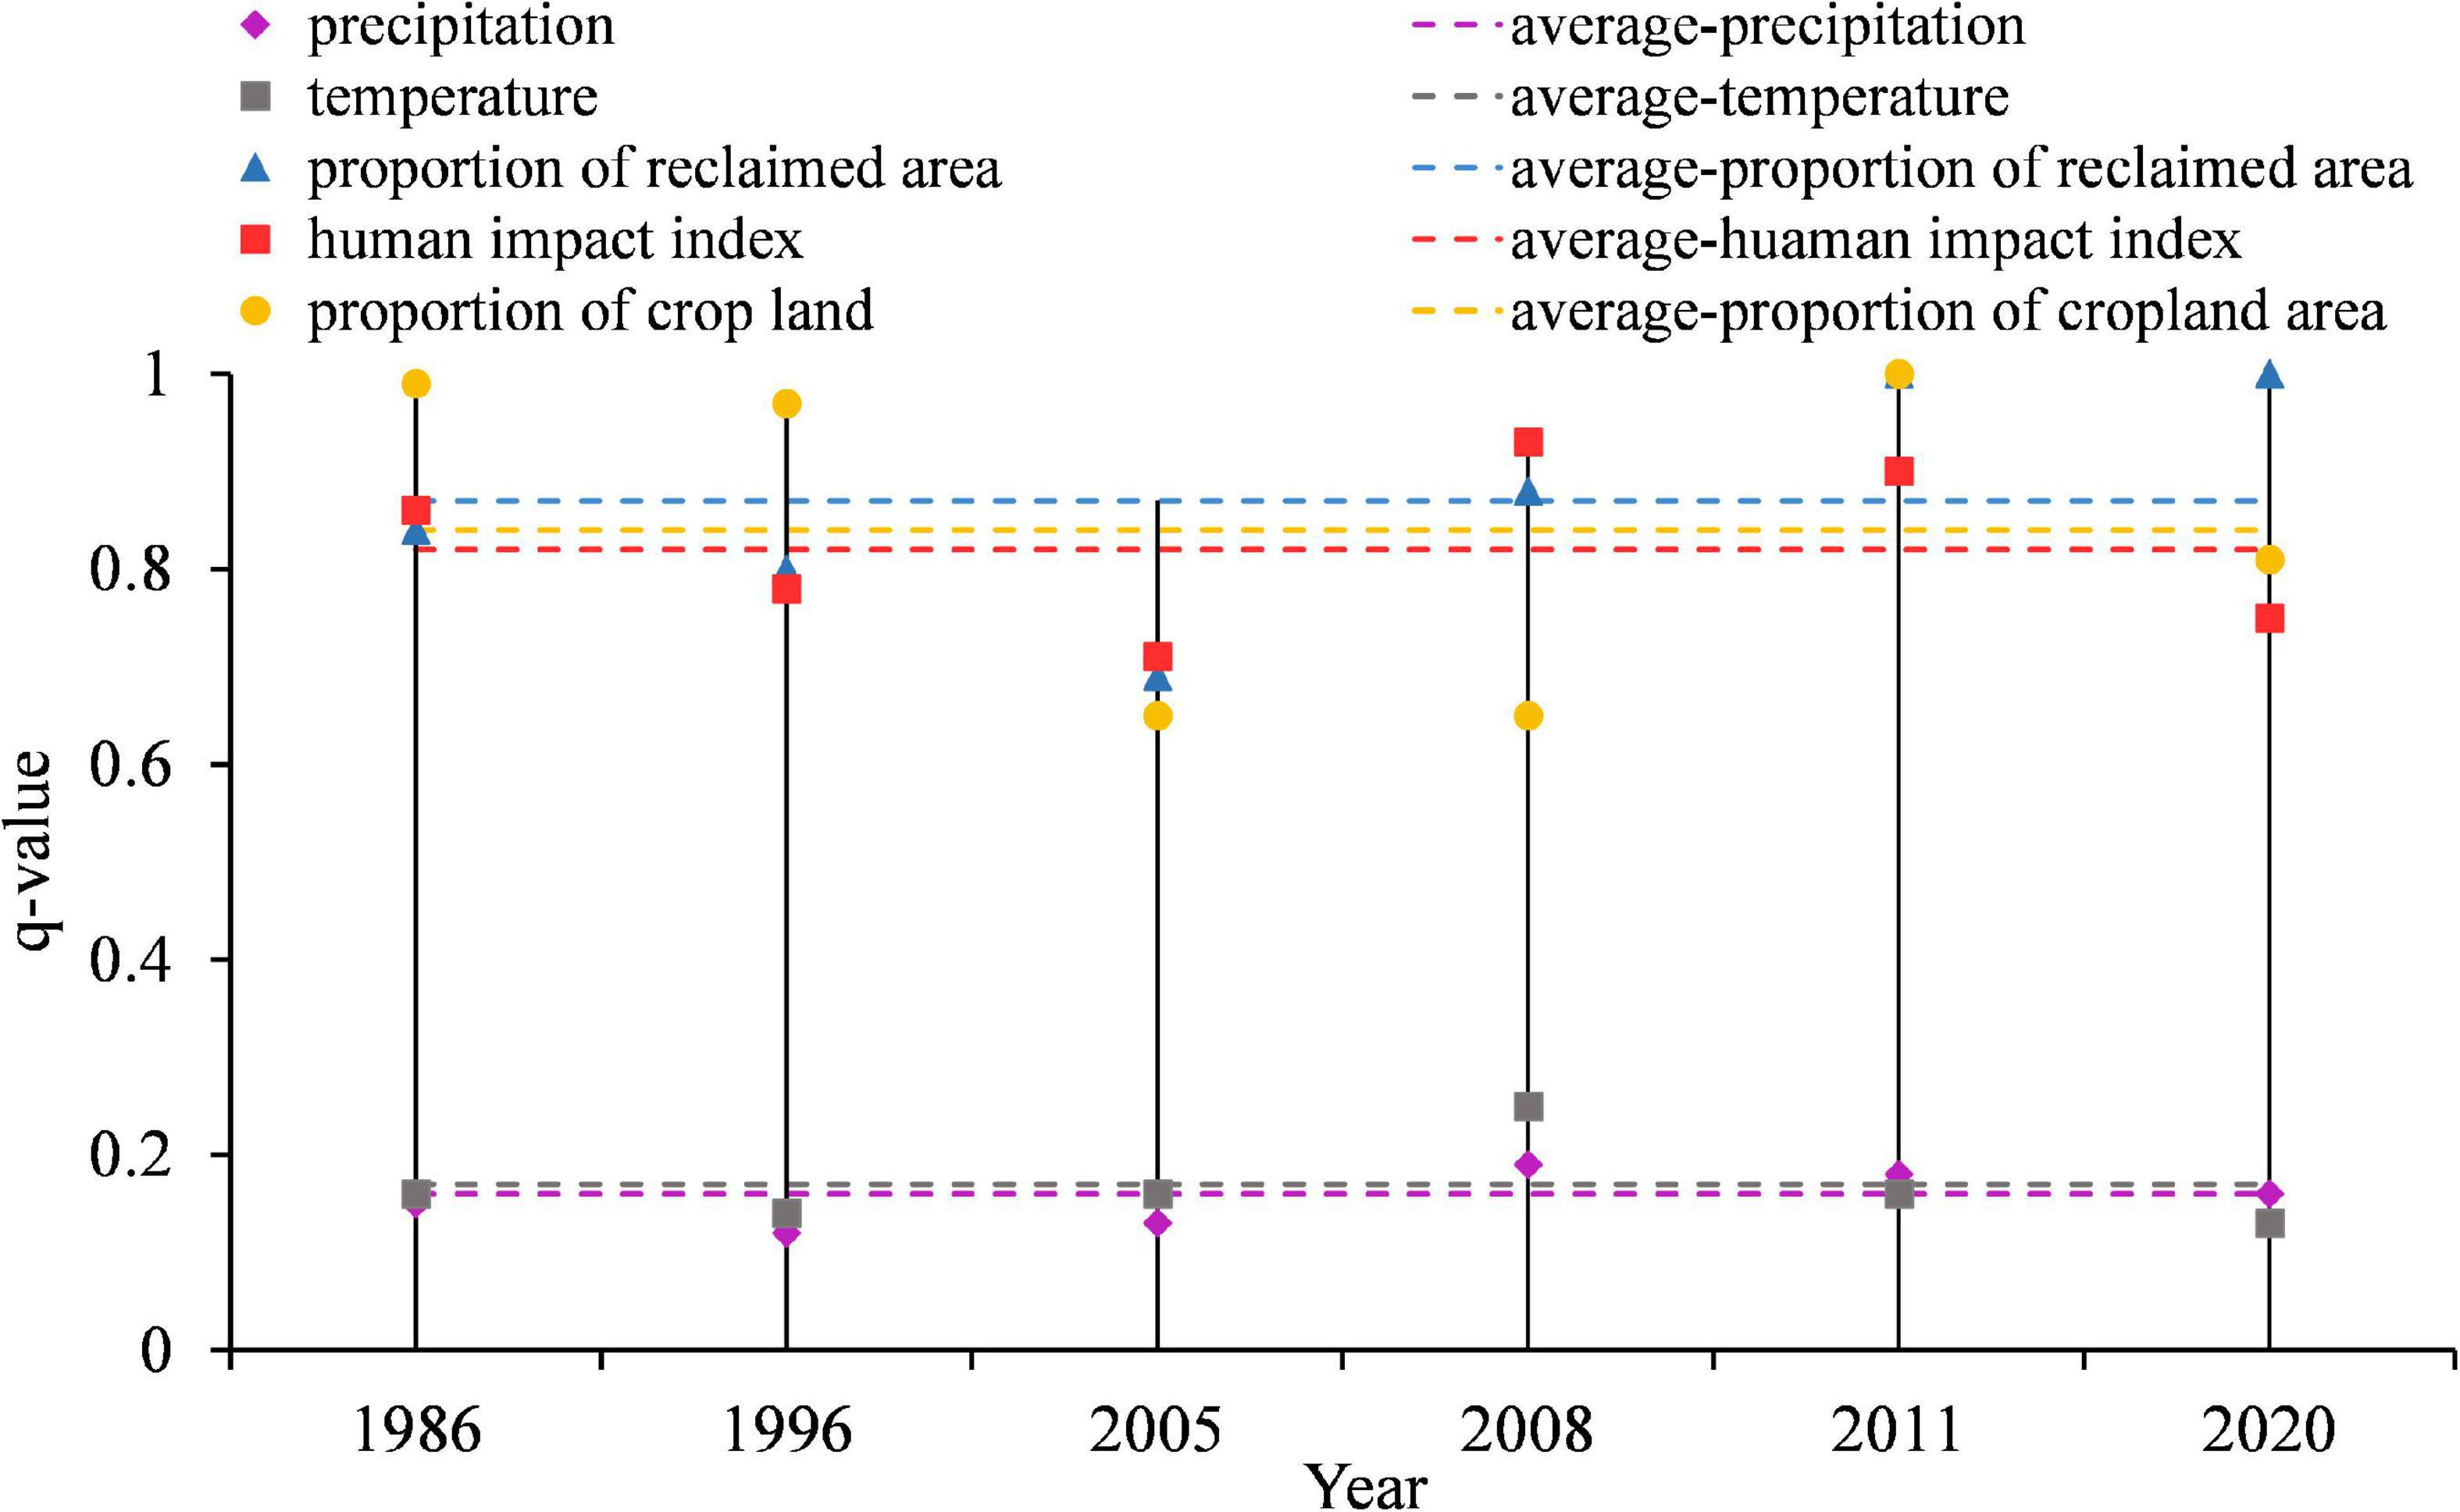
Figure 9. The q-value of each factor’s influence on habitat quality.
The calculation results of the reclamation intensity index of construction land, salt pans, and culture ponds in the Yellow River Delta Wetland were shown in Figure 10A. From 1986 to 2020, the reclamation intensity index of construction land, salt pans, and culture ponds increased year by year. Among them, the reclamation intensity index of culture ponds is significantly higher than that of salt pans and construction land. Figures 10B–D shows a simple linear correlation between habitat quality and different types of reclamation intensity index in the Yellow River Delta Wetland, which shows a simple linear negative correlation between habitat quality and reclamation intensity. The correlation coefficient between the reclamation intensity index and habitat quality index was −0.0021 for culture ponds, the correlation coefficient between reclamation intensity and habitat quality for construction land was −0.0107, and the correlation coefficient between reclamation intensity and habitat quality for salt pans was −0.0136.
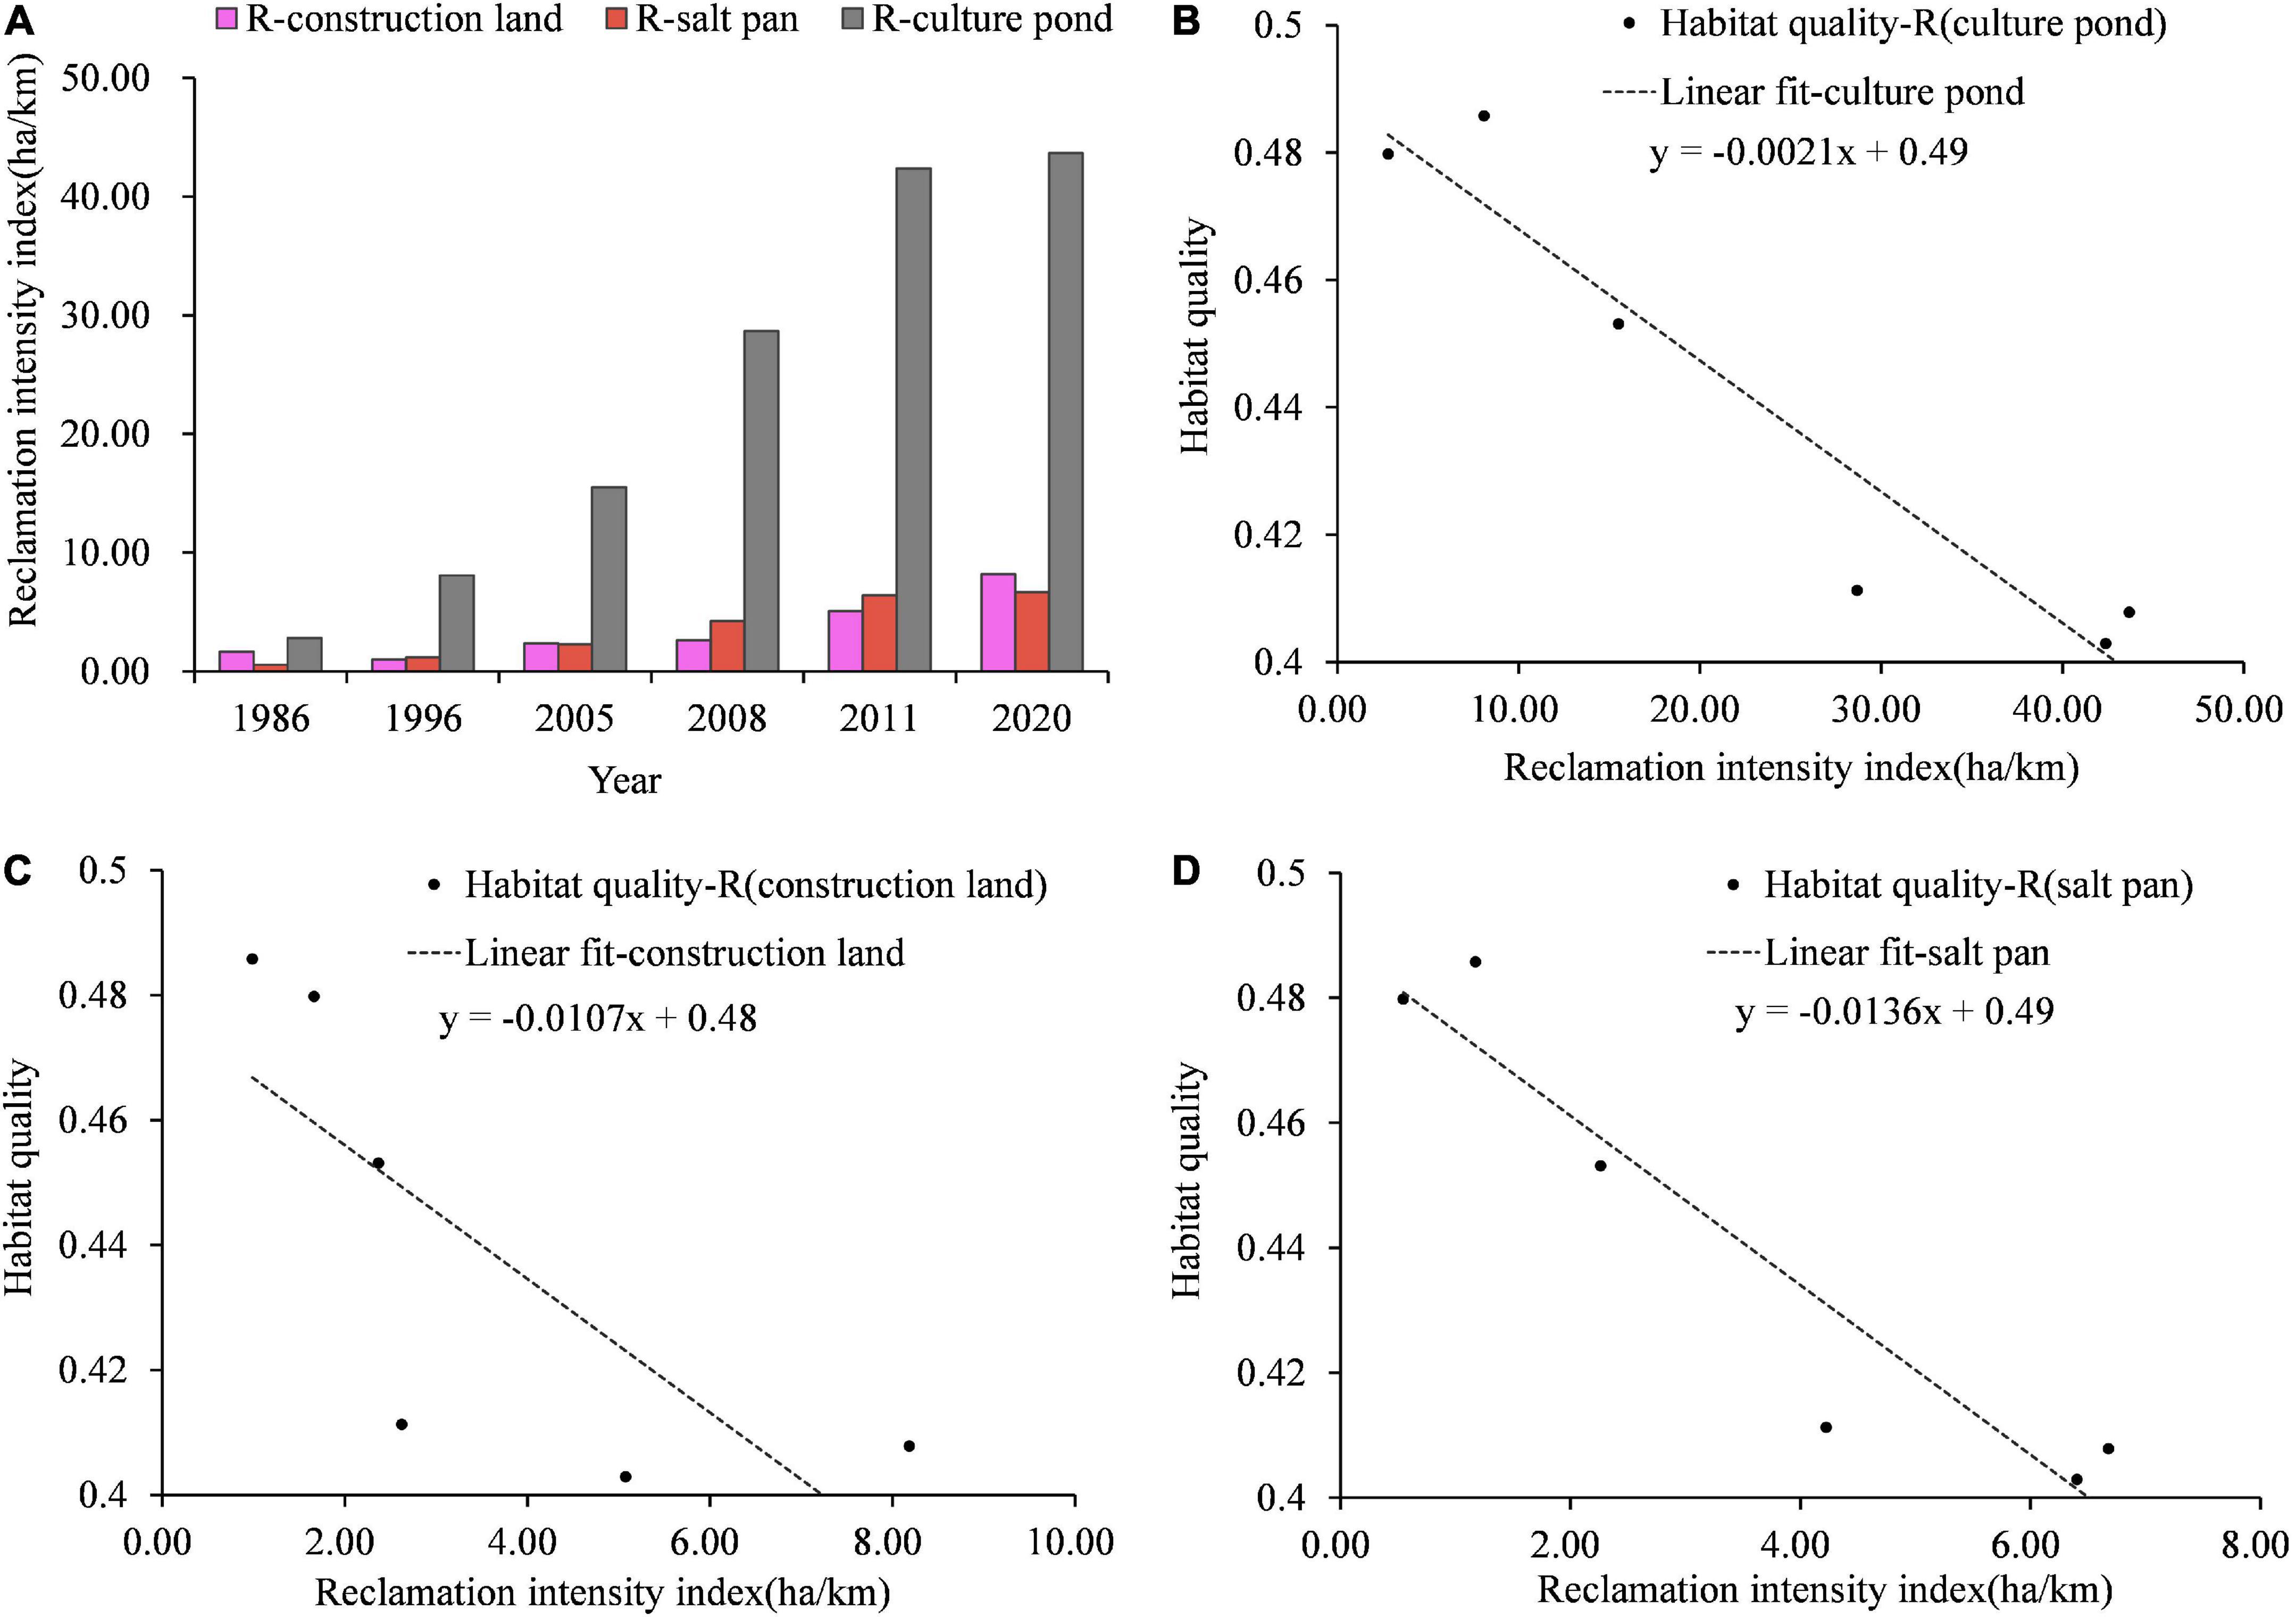
Figure 10. The results of the reclamation intensity index (A), the simple linear relationship between the reclamation intensity index and habitat quality (B–D).
The reclamation activities elasticity of habitat quality are documented for three different periods, i.e., 1986–2005, 2005–2020,1986–2020 in Figure 11. During 1986–2005, 2005–2020, 1986–2020, negative elasticities were documented for three types of reclamation activities, which further demonstrates the negative impact of reclamation activities on habitat quality. The direction of the response of habitat quality to the intensity of the different types of reclamation activities can be seen for the periods 1986–2005, 2005–2020, and 1986–2020, with negative elasticity for all three types of reclamation activities, and the elasticity is consistent with the direction of linear statistical correlation, which further illustrates the negative impact of the three reclamation activities on habitat quality. But the elasticity approach is better than the statistical correlation approach because it gives the concept of response intensity. The intensity of the response is quite useful and conveys useful information as far as this study is concerned.
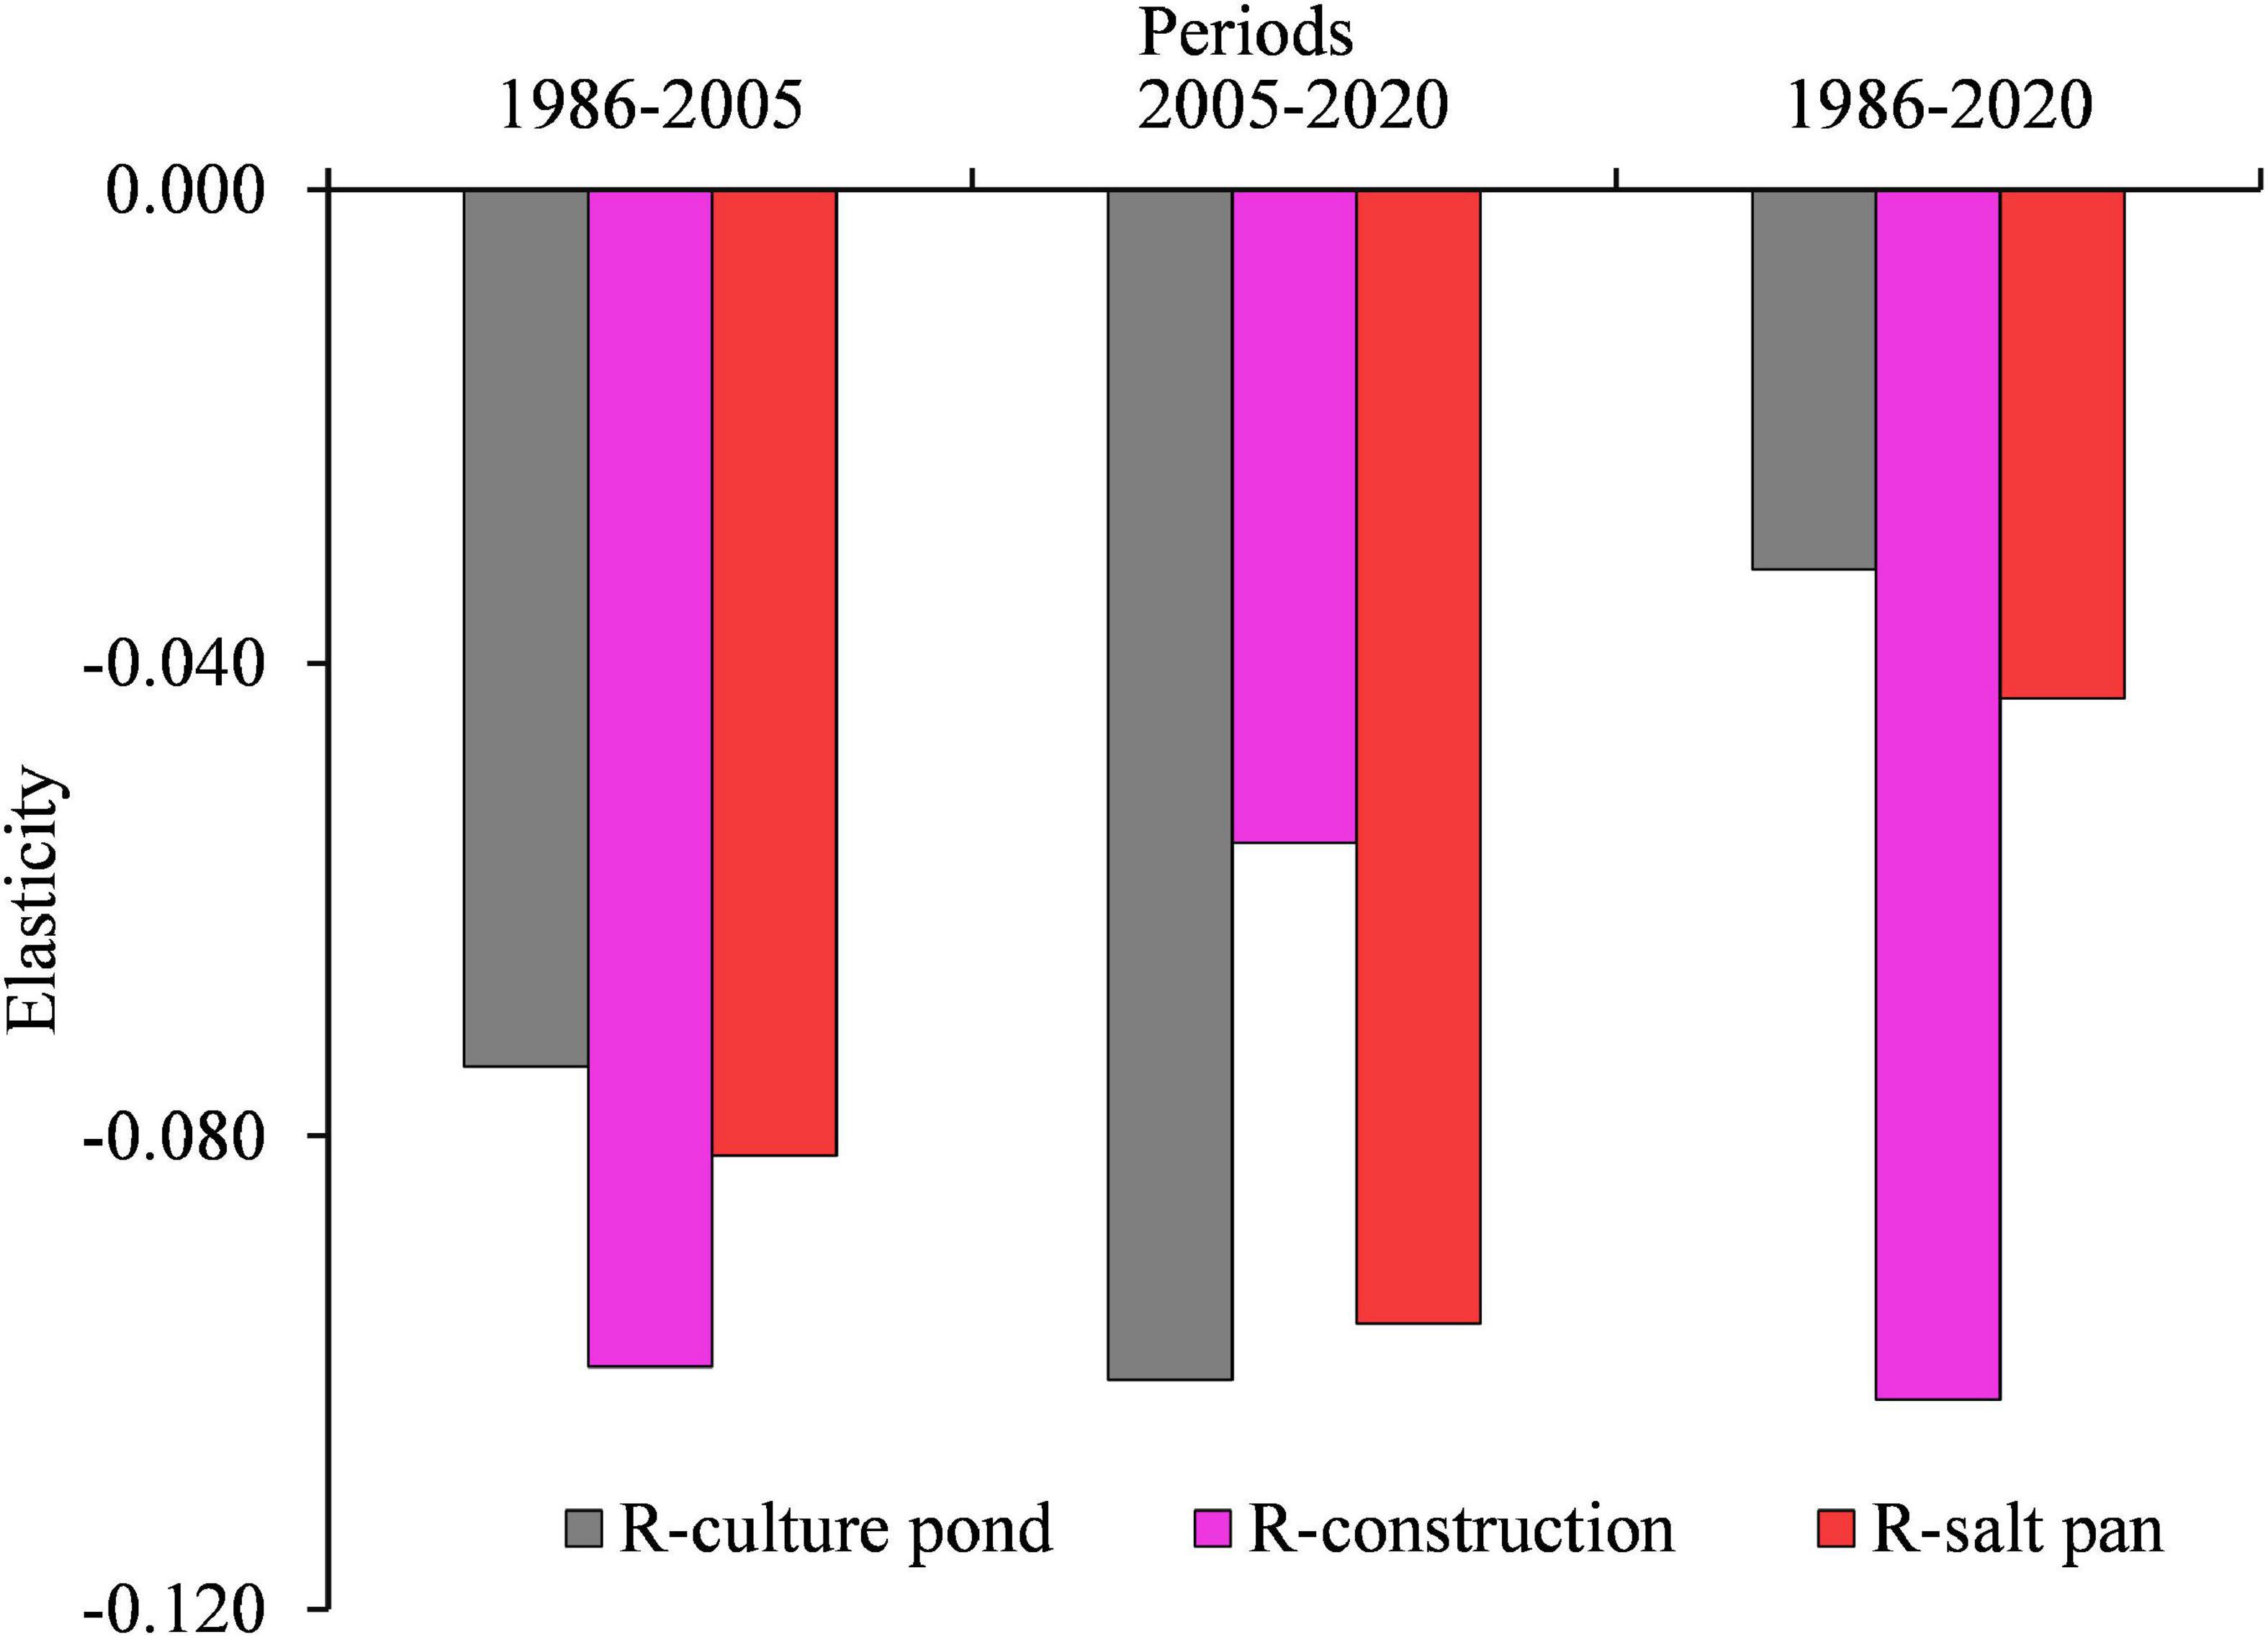
Figure 11. The reclamation activities elasticity of habitat quality.
It can be seen that the sensitivity of changes in habitat quality to different types of reclamation activities differs in these three periods. During the period of 1986–2005, the highest negative elasticity value of reclamation intensity of construction land, followed by salt pans, and the smallest negative elasticity of reclamation intensity of culture ponds, indicates that changes in construction land cause significant changes in habitat quality in this period, in other words, changes in habitat quality in this period are sensitive to changes in construction land changes, while in the period of 2005–2020, the negative elasticity of the reclamation intensity of culture ponds is the highest, followed by salt pans, and the negative elasticity of the reclamation intensity of construction land is the smallest, indicating that changes in habitat quality in this period are more sensitive to changes in reclamation intensity of culture ponds. From the whole period of 1986–2020, the negative elasticity of reclamation intensity of construction land is the largest, followed by salt pans and the smallest negative elasticity of reclamation intensity of culture ponds, from the whole period, habitat quality is more sensitive to changes in construction land.
The evolution of the reclamation intensity elasticity index shows that the negative elasticity of reclamation intensity of construction land has a decreasing trend from the period of 1986–2005 to the period of 2005–2020, while the negative elasticity of reclamation intensity of culture ponds and salt pans has an increasing trend. This indicates that the sensitivity of the changes in habitat quality to changes in the intensity of construction land reclamation is weakening, while the sensitivity of the changes in habitat quality to changes in the intensity of culture ponds and salt pans reclamation is increasing.
Spatially, the high-quality habitats in the Yellow River Delta Wetland were concentrated in mudflat wetlands, forest, and grassland, while the low-quality habitats were mainly concentrated in construction land and salt pans. This finding also proves that urban construction and expansion of culturing ponds, are the major threats to habitats in natural ecosystems, and is supported by the results of existing studies (Li et al., 2019; Zhu et al., 2020). At the same time, mudflat wetlands, as the high-quality habitat of the Yellow River Delta wetland, although the establishment of the Yellow River Delta Nature Reserve has protected the mudflat wetlands to a certain extent, the mudflat wetlands are still affected by the surrounding reclamation activities. In terms of time, the habitat quality improved in 1996 compared with 1986, mainly due to the establishment of the Yellow River Delta Nature Reserve in 1992, which reduced the destruction and development of some pristine wetlands and made the overall habitat quality improved. This also demonstrates that strict nature reserves can indeed provide a stronger protection mechanism against human disturbance activities (Kija et al., 2020). The habitat quality in 2020 has increased compared to 2011, this is mainly due to the background of the major strategy of ecological protection and high-quality development of the Yellow River basin and the continuous ecological replenishment work since 2008, more policies and management measures have been implemented to strengthen the protection of the Yellow River Delta Wetland, but the increase is small, thus the habitat quality of the Yellow River Delta Wetland from 1986 to 2020 showed a decreasing trend overall. This is consistent with the overall decreasing trend of habitat quality in the Yellow River basin in existing studies (Song et al., 2021).
This study found that human activities in the Yellow River Delta wetland were stronger than the effects of climate change on habitat quality. Climate as a background condition for wetland habitats, in general, abundant precipitation and suitable temperature have positive effects on species survival, but the q-values of precipitation and temperature are small compared to the q-values of human impact index, the proportion of reclamation activities area and the proportion of cropland area, indicating that precipitation and temperature have relatively small effects on the habitat quality of the Yellow River Delta Wetland. This result is inconsistent with our existing knowledge, and this paper suggests that this is mainly due to the small span range of the study area and the small differences in the spatial distribution of temperature and precipitation, causing the results to show inconsistency with our general knowledge.
Based on the results of the GeoDetector impact factors identification and the elasticity index, this study concludes that human activities, mainly reclamation activities, are the main cause of habitat quality degradation in the Yellow River Delta Wetland, and previous related studies support the results of this study. Yu et al. (2012) pointed out that reclamation significantly reduces ecosystem services in coastal wetlands, reclamation activities are a major factor in stressing wetlands (Jin et al., 2016), so the conclusion is reliable. Appropriate reclamation activities can bring certain economic benefits, but excessive reclamation will cause the loss and degradation of a large number of original wetlands in the Yellow River Delta Wetland and destroy the original habitats of many species. Therefore, it is inevitable that two conflicting issues will be faced, which are the need for economic development through reclamation activities and the need for wetland habitat conservation. Therefore, the rational implementation of reclamation activities and the identification of the most influential reclamation activities are the key to solving this problem, and the elasticity index analysis in this study answers this question. The results of the elasticity index analysis reflect the sensitivity of habitat quality to different types of reclamation activities and conclude that habitat quality is the most sensitive to which type of reclamation activity of the Yellow River Delta Wetland in different periods, and also understand the temporal evolution characteristics of the effects of changes in different reclamation activities on habitat quality, which is the reason why this paper adds two periods, 1986–2005, and 2005–2020, to be analyzed. The results of the elasticity analysis in this paper can determine the response of habitats to different reclamation activities.
From the whole period, habitats are most sensitive to changes in the reclamation intensity of construction land, which is consistent with the results of existing studies where ecosystem services are converted into construction projects with the greatest loss (Yu et al., 2021). This paper argues that this is mainly due to the permanent loss of pristine wetlands due to hardscaping such as construction sites, which has caused the permanent destruction of pristine habitats. From the changes in the two periods, the habitat quality becomes more sensitive to changes in the intensity of the two reclamation activities as the intensity of culture ponds and salt pans reclamation continues to increase. Therefore, in the future, the Yellow River Delta Wetland should strengthen wetland protection and restoration efforts, reasonably control the development of culture ponds and salt pans, and for the permanent loss of pristine wetlands due to construction and other hardening construction, more effective compensation measures are urgently needed to compensate for the encroachment of pristine wetlands which are supposed to play a habitat function (Ma et al., 2015), and studies also have shown that the conversion of coastal wetlands to aquaculture usually leads to relatively little reduction in ecosystem services, the offset ratios for the conversion of coastal wetlands into culture ponds were smallest (Yu et al., 2021), combining the results of this study, although habitats are becoming increasingly sensitive to the expansion of culture ponds and salt pans, the combination of the economic benefits generated by culture ponds and the size of compensation after their loss, and also based on the fact that habitats are most sensitive to construction land, the continuous expansion of culture ponds compared to construction land and salt pans is the most preferable in the inevitable future reclamation activities. This also implies that in the future, offshore areas can resolve the conflicts between reclamation activities and wetland conservation from the perspective of elasticity index analysis results, combined with the evaluation of benefits brought by reclamation activities and compensation after losses, so as to provide guidance for subsequent habitat conservation.
The InVEST-habitat quality model assesses habitat quality primarily through land use and associated threat sources. The results of habitat quality were not calibrated and validated by in situ species surveys, which may bring some uncertainty to the results. In future studies, species surveys should be conducted, and other habitat quality assessment models should be used to validate and correct the results.
In this paper, the elasticity was introduced to analyze the response of habitat quality to reclamation activities, the reclamation intensity index is introduced to better reflect the intensity of reclamation activities, and considering that the intensity of reclamation activities is not only related to the area of reclamation activities but also related to the type of reclamation activities, the reclamation intensity index is improved to distinguish the type of reclamation activities by using the weights of threat sources in the input of InVEST habitat quality model. On this basis, the sensitivity of habitat quality to the reclamation activities is analyzed with the intensity of reclamation activities as the independent variable and habitat quality as the dependent variable, and the results of the analysis can better answer the question of how to trade-off between wetland protection and reclamation in the future. This paper concludes that it is reasonable and valid to use the elasticity index method to analyze the effects of changes in the intensity of reclamation activities on changes in habitat quality.
Habitat quality evolution is a complex process that is influenced by many factors. The Yellow River runoff and sediment have an important influence on the evolution of the Yellow River Delta Wetland, however, the effects of runoff and sediment changes on habitat quality have not been quantified at the spatial scale. Therefore, the relationship between habitat quality evolution and runoff-sediment in the Yellow River Delta Wetland still needs to be further clarified in future studies to better determine the reasonable range of runoff-sediment ratio and provide the scientific basis for the conservation of Yellow River Delta Wetland habitats in the future.
In this study, the spatial and temporal evolution of habitat quality was evaluated based on the InVEST-habitat quality model in the Yellow River Delta Wetland under the dynamic evolution of the shoreline after runoff-sediment variability, and on this basis, the dominant factors of habitat quality were identified spatially using the Geographical Detector, and the effects of climate change and human activities on habitat quality were clearly revealed, and the elasticity index was proposed to analyze the response of habitat quality to the changes of different reclamation activities, and the results of the elasticity index effectively reflected the sensitivity of habitat quality to the changes of different reclamation activities.
The main conclusions are as follows: the habitat quality of the Yellow River Delta Wetland decreased from 0.4798 in 1986 to 0.4078 in 2020, showing an overall decreasing trend. The high-value areas were mainly concentrated in natural areas such as mudflat wetlands, and low-value areas were mainly concentrated in artificial areas such as construction land and salt pans. The influence of climate change on the habitat quality of the Yellow River Delta Wetland was weaker than human activities, and human activities, mainly reclamation activities, were the important influencing factors on the habitat quality of the Yellow River Delta Wetland. The results of reclamation activities elasticity of habitat quality showed that the reclamation activities had a negative impact on habitat quality, the habitat quality was most sensitive to the change of the reclamation intensity for construction land, and the influence of the change of the intensity of culture ponds and salt pans on the change of habitat quality were strengthening.
The results of this study provide a scientific basis for biodiversity conservation and ecosystem protection for wetland managers and policy administrators in the Yellow River Delta Wetland. The future development of the Yellow River Delta Wetland should not expand reclamation activities at the expense of natural wetlands, and prevent the loss of a large amount of original habitat due to over-exploitation. The application of the elasticity index in this study provides new ideas for tradeoffs between habitat protection and reclamation activities in offshore areas in the future.
The original contributions presented in this study are included in the article/Supplementary material, further inquiries can be directed to the corresponding author.
FW, HeZ, PK, and LT were performed the material preparation, data collection, and analysis. HoZ was written the first draft of the manuscript. All authors contributed to the study’s conception and design, commented on previous versions of the manuscript, have read and agreed to the published version of the manuscript.
This project was financially supported by the National Natural Science Foundation of China (52279014 and 51879106), the Central Plains Science and Technology Innovation Leader Project (214200510001), the Key Research and Development Program of Ningxia Hui Autonomous Region (2021BEG02012), and the Science and Technology Innovation Team in Universities of Henan Province (20IRTSTHN010).
The authors would like to express their sincere gratitude to the reviewers for their constructive comments and useful suggestions that help us improve this study.
The authors declare that the research was conducted in the absence of any commercial or financial relationships that could be construed as a potential conflict of interest.
All claims expressed in this article are solely those of the authors and do not necessarily represent those of their affiliated organizations, or those of the publisher, the editors and the reviewers. Any product that may be evaluated in this article, or claim that may be made by its manufacturer, is not guaranteed or endorsed by the publisher.
The Supplementary Material for this article can be found online at: https://www.frontiersin.org/articles/10.3389/fevo.2022.1075914/full#supplementary-material
Aneseyee, A. B., Noszczyk, T., Soromessa, T., and Elias, E. (2020). The InVEST habitat quality model associated with land use/cover changes: a qualitative case study of the winike watershed in the omo-gibe basin, Southwest Ethiopia. Remote Sens. 12:1103. doi: 10.3390/rs12071103
Banks-Leite, C., Ewers, R. M., Folkard-Tapp, H., and Fraser, A. (2020). Countering the effects of habitat loss, fragmentation, and degradation through habitat restoration. One Earth 3, 672–676. doi: 10.1016/j.oneear.2020.11.016
Chi, Y., Zheng, W., Shi, H. H., Sun, J. K., and Fu, Z. Y. (2018). Spatial heterogeneity of estuarine wetland ecosystem health influenced by complex natural and anthropogenic factors. Sci. Total Environ. 634, 1445–1462. doi: 10.1016/j.scitotenv.2018.04.085
Ding, Q. L., Chen, Y., Bu, L. T., and Ye, Y. M. (2021). Multi-Scenario analysis of habitat quality in the yellow river delta by coupling FLUS with InVEST model. Int. J. Environ. Res. Public Health 18:2389. doi: 10.3390/ijerph18052389
Dong, Z. F., Qu, A. Y., and Ji, Y. Q. (2020). On ecological environment protection of lower reaches of Yellow River with high-quality development strategy. Sci. Technol. Rev. 38, 109–115.
Duarte, G. T., Ribeiro, M. C., and Paglia, A. P. (2016). Ecosystem services modeling as a tool for defining priority areas for conservation. PLoS One 11:e0154573. doi: 10.1371/journal.pone.0154573
Feng, Q. L., Yang, J. Y., Zhu, D. H., Liu, J. T., Guo, H., Bayartungalag, B., et al. (2019). Integrating multitemporal Sentinel-1/2 data for coastal land cover classification using a multibranch convolutional neural network: a case of the Yellow River Delta. Remote Sens. 11:1006. doi: 10.3390/rs11091006
Fu, Y. B., Cao, K., Wang, F., and Zhang, F. S. (2010). A preliminary study on the quantitative evaluation method of reclamation intensity and potential. Ocean Dev. Manag. 27, 27–30. doi: 10.20016/j.cnki.hykfygl.2010.01.007
Geng, T. W., Chen, H., Zhang, H., Shi, Q. Q., and Liu, D. (2020). Spatiotemporal evolution of land ecosystem service value and its influencing factors in Shaanxi province based on GWR. J. Nat. Resources 3, 1714–1727.
Han, G. X., Li, Y. Z., Yu, J. B., Xu, J. W., Wang, G. M., Zhang, Z. D., et al. (2011). Evolution process and related driving mechanisms of Yellow River Delta since the diversion of Yellow River. Chinese J. Appl. Ecol. 22, 467–472. doi: 10.13287/j.1001-9332.2011.0047
Ji, W., Liu, H. J., Gao, J. X., Ma, H., Song, T., Gao, Y. N., et al. (2021). Spatial-Temporal variations of ecological quality in the Yellow River basin. Res. Environ. Sci. 34, 1700–1709. doi: 10.13198/j.issn.1001-6929.2021.03.17
Jin, Y. W., Yang, W., Sun, T., Yang, Z. F., and Li, M. (2016). Effects of seashore reclamation activities on the health of wetland ecosystems: a case study in the Yellow River Delta, China. Ocean Coastal Manage. 123, 44–52. doi: 10.1016/j.ocecoaman.2016.01.013
Khan, A. U. (2018). Attributes of River Water Quality Response to Climate Drivers Based on Climate Elasticity Approaches. Ph.D thesis, China: Harbin Institute of Technology.
Kija, H. K., Ogutu, J. O., Mangewa, L. J., Bukombe, J., Verones, F., Graae, B. J., et al. (2020). Spatio-Temporal changes in wildlife habitat quality in the greater serengeti ecosystem. Sustainability 12:2440. doi: 10.3390/su12062440
Kunwar, R. M., Evans, A., Mainali, J., Ansari, A. S., Rimal, B., and Bussmann, R. W. (2020). Change in forest and vegetation cover influencing distribution and uses of plants in the Kailash Sacred Landscape. Nepal. Environ. Dev. Sustain. 22, 1397–1412. doi: 10.1007/s10668-018-0254-4
Li, G. C., Chen, W., Zhang, X. P., Yang, Z., Bi, P. S., and Wang, Z. (2022). Ecosystem service values in the dongting lake eco-economic zone and the synergistic impact of its driving factors. Int. J. Environ. Res. Public Health 19:3121. doi: 10.3390/ijerph19053121
Li, X. W., Hou, X. Y., Song, Y., Shan, K., Zhu, S. Y., Yu, X. B., et al. (2019). Assessing changes of habitat quality for shorebirds in stopover sites: a case study in Yellow River Delta, China. Wetlands 3, 67–77. doi: 10.1007/s13157-018-1075-9
Liu, J. T., Feng, Q. L., Gong, J. H., Zhou, J. P., and Li, Y. (2016). Land-cover classification of the Yellow River Delta wetland based on multiple end-member spectral mixture analysis and a Random Forest classifier. Int. J. Remote Sens. 37, 1845–1867. doi: 10.1080/01431161.2016.1165888
Liu, Y. X., Liu, S. L., Wang, F. F., Sun, Y. X., Li, M. Q., Wang, Q. B., et al. (2021a). Responses of habitat quality and animal biodiversity to grazing activities on the qinghai-tibet plateau. Front. Ecol. Evol. 9:681775. doi: 10.3389/fevo.2021.681775
Liu, Z. T., Wang, S. J., and Fang, C. L. (2021b). Spatiotemporal evolution and influencing mechanism of ecosystem service value in the Guangdong-Hong Kong-Macao Greater Bay Area. Acta Geographica Sinica 76, 2797–2813.
Ma, T. T., Liang, C., Li, X. W., Xie, T., and Cui, B. S. (2015). Quantitative assessment of impacts of reclamation activities on Coastal Wetlands in China. Wetland Sci. 13, 653–659.
Newbold, T., Hudson, L. N., Hill, S. L. L., Contu, S., Lysenko, I., Senior, R. A., et al. (2015). Global effects of land use on local terrestrial biodiversity. Nature 520, 45–50. doi: 10.1038/nature14324
Niu, M. X., and Wang, J. (2020). Analysis of coastline variations in Dongying section of Yellow River Delta based on Landsat remote sensing image. Water Resources Protection 36, 26–33.
Polasky, S., Nelson, E., Pennington, D., and Johnson, K. A. (2011). The impact of land-use change on ecosystem services, biodiversity and returns to landowners: a case study in the State of Minnesota. Environ. Resour. Econ. 48, 219–242. doi: 10.1007/s10640-010-9407-0
Sannigrahi, S., Pilla, F., Zhang, Q., Chakraborti, S., Wang, Y., Basu, B., et al. (2021). Examining the effects of green revolution led agricultural expansion on net ecosystem service values in India using multiple valuation approaches. J. Environ. Manage. 277:111381. doi: 10.1016/j.jenvman.2020.111381
Schmitt-Harsh, M. (2013). Landscape change in Guatemala: driving forces of forest and coffee agroforest expansion and contraction from 1990 to 2010. Appl. Geogr. 40, 40–50. doi: 10.1016/j.apgeog.2013.01.007
Sharp, R., Tallis, H. T., Ricketts, T., Guerry, A. D., Wood, S. A., and Chaplin-Kramer, R. (2015). InVEST 3.2.0 User’s Guide. The Natural Capital Project, Stanford University, University of Minnesota, The Nature Conservancy, and World Wildlife Fund.
Song, Y. A., Wang, M., Sun, X. F., and Fan, Z. M. (2021). Quantitative assessment of the habitat quality dynamics in Yellow River Basin, China. Environ. Monit. Assess. 193:614. doi: 10.1007/s10661-021-09404-4
Teferi, E., Bewket, W., Uhlenbrook, S., and Wenninger, J. (2013). Understanding recent land use and land cover dynamics in the source region of the Upper Blue Nile, Ethiopia: spatially explicit statistical modeling of systematic transitions. Agric. Ecosyst. Environ. 165, 98–117. doi: 10.1016/j.agee.2012.11.007
Terrado, M., Sabater, S., Chaplin-Kramer, B., Mandle, L., Ziv, G., and Acuna, V. (2016). Model development for the assessment of terrestrial and aquatic habitat quality in conservation planning. Sci. Total Environ. 540, 63–70. doi: 10.1016/j.scitotenv.2015.03.064
Wang, B. X., and Cheng, W. M. (2022). Effects of land use/cover on regional habitat quality under different geomorphic types based on InVEST model. Remote Sens. 14:1279. doi: 10.3390/rs14051279
Wang, F. Q., Yang, H., Zhao, H., and Kang, P. P. (2018a). Ecological effect evaluation of water diversion in the Yellow River delta wetland. Water Policy 20, 744–757. doi: 10.2166/wp.2018.166
Wang, Y. M., Gao, P., Mu, X. M., and Zhao, G. J. (2018b). Relationship between the shape of the Yellow River delta and the runoff-sediment flux Since 1973. J. Sediment Res. 43, 39–45. doi: 10.16239/j.cnki.0468-155x.2018.05.007
Wang, J. F., and Xu, C. D. (2017). Geodetector: principle and perspective. Acta Geographica Sinica 72, 116–134. doi: 10.3390/ijerph182111605
Wu, J. S., Li, X. C., Luo, Y. H., and Zhang, D. N. (2021a). Spatiotemporal effects of urban sprawl on habitat quality in the Pearl River Delta from 1990 to 2018. Sci. Rep. 11:13981. doi: 10.1038/s41598-021-92916-3
Wu, L. L., Sun, C. G., and Fan, F. L. (2021b). Estimating the characteristic spatiotemporal variation in habitat quality using the InVEST Model-A case study from Guangdong-Hong Kong-Macao Greater Bay Area. Remote Sens. 13:1008. doi: 10.3390/rs13051008
Xia, D. X., Duan, Y., and Wu, S. Y. (2009). Study on the methodology of recent coastline delimitation. J. Mar. Sci. 27, 28–33.
Xu, H. Q. (2005). A study on information extraction of water body with the modified normalized difference water index(MNDWI). J. Remote Sens. 9, 589–595.
Xu, L. T., Chen, S. S., Xu, Y., Li, G. Y., and Su, W. Z. (2019). Impacts of land-use change on habitat quality during 1985-2015 in the Taihu Lake basin. Sustainability 11:3513. doi: 10.3390/su11133513
Yan, S. J., Wang, X., Cai, Y. P., Li, C. H., Yan, R., Cui, G. N., et al. (2018). An integrated investigation of spatiotemporal habitat quality dynamics and driving forces in the upper basin of miyun reservoir. North China. Sustainability 10:4625. doi: 10.3390/su10124625
Yan, S. J., Wang, X., Cai, Y. P., Li, C. H., Yang, Z. F., and Yi, Y. J. (2017). Investigation of the spatio-temporal dynamics in landscape variations in a shallow lake based on a new Tendency-Pattern-Service conceptual framework. J. Clean Prod. 161, 1074–1084. doi: 10.1016/j.jclepro.2017.05.114
Ye, S. S., and Zhai, G. F. (2010). Study on the driving forces of urban international competitiveness based on factor contribution rate and elasticity analysis—a case study of cities along Shanghai- Nanjing- Hangzhou- Ningbo. Econ. Geography 30, 1821–1826. doi: 10.15957/j.cnki.jjdl.2010.11.010
Yohannes, H., Soromessa, T., Argaw, M., and Dewan, A. (2021). Spatio-temporal changes in habitat quality and linkage with landscape characteristics in the Beressa watershed, Blue Nile basin of Ethiopian highlands. J. Environ. Manage. 281:111885. doi: 10.1016/j.jenvman.2020.111885
Yu, J., Wang, Y., Li, Y., Dong, H., Zhou, D., Han, G., et al. (2012). Soil organic carbon storage changes in coastal wetlands of the modern Yellow River Delta from 2000 to 2009. Biogeosciences 9, 2325–2331. doi: 10.5194/bg-9-2325-2012
Yu, S. L., Cui, B. S., Xie, C. J., Ma, X., Man, Y., Yan, J. G., et al. (2021). A quantitative approach for offsetting the coastal reclamation impacts on multiple ecosystem services in the Yellow River Delta. Ecosyst. Serv. 52:101382. doi: 10.1016/j.ecoser.2021.101382
Zhang, L. N., Zhang, H. Q., and Xu, E. Q. (2022a). Information entropy and elasticity analysis of the land use structure change influencing eco-environmental quality in Qinghai-Tibet Plateau from 1990 to 2015. Environ. Sci. Pollut. Res. 29, 18348–18364. doi: 10.1007/s11356-021-17978-2
Zhang, X., Lyu, C. J., Fan, X., Bi, R. T., Xia, L., Xu, C. C., et al. (2022b). Spatiotemporal variation and influence factors of habitat quality in loess hilly and gully area of yellow river basin: a case study of liulin county, China. Land 11:127. doi: 10.3390/land11010127
Zhang, Z. H., and Hu, C. H. (2007). Variation of the processes of flow and sediment and its effect on epeirogenesis of seacoast in the Yellow River estuary. Adv. Water Sci. 18, 336–341.
Keywords: habitat quality, influencing factors, elasticity, reclamation activities, Yellow River Delta Wetland
Citation: Zhang H, Wang F, Zhao H, Kang P and Tang L (2022) Evolution of habitat quality and analysis of influencing factors in the Yellow River Delta Wetland from 1986 to 2020. Front. Ecol. Evol. 10:1075914. doi: 10.3389/fevo.2022.1075914
Received: 21 October 2022; Accepted: 01 December 2022;
Published: 15 December 2022.
Edited by:
Sharif A. Mukul, University of the Sunshine Coast, AustraliaReviewed by:
Hanxi Wang, Harbin Normal University, ChinaCopyright © 2022 Zhang, Wang, Zhao, Kang and Tang. This is an open-access article distributed under the terms of the Creative Commons Attribution License (CC BY). The use, distribution or reproduction in other forums is permitted, provided the original author(s) and the copyright owner(s) are credited and that the original publication in this journal is cited, in accordance with accepted academic practice. No use, distribution or reproduction is permitted which does not comply with these terms.
*Correspondence: Fuqiang Wang, ✉ d2FuZ2Z1cWlhbmdAbmN3dS5lZHUuY24=
Disclaimer: All claims expressed in this article are solely those of the authors and do not necessarily represent those of their affiliated organizations, or those of the publisher, the editors and the reviewers. Any product that may be evaluated in this article or claim that may be made by its manufacturer is not guaranteed or endorsed by the publisher.
Research integrity at Frontiers
Learn more about the work of our research integrity team to safeguard the quality of each article we publish.