- 1College of Geography and Ocean Sciences, Yanbian University, Yanji, Jilin, China
- 2School of Geographical Sciences, Northeast Normal University, Changchum, Jilin, China
- 3College of Integration Science, Yanbian University, Yanji, Jilin, China
- 4Northeast Institute of Geography and Agroecology, Chinese Academy of Sciences, Changchun, Jilin, China
Vegetation is an integral part of terrestrial ecosystem and plays an important role in responding to climate change, with its dynamic characteristics reflecting the ecological environmental quality. Recently, the continually increasing frequency and intensity of droughts has greatly changed how vegetation growth and development respond to drought. In this study, using normalized difference vegetation index and standardized precipitation evapotranspiration index (SPEI), we studied the response characteristics of vegetation dynamics to multi-scale drought stress (SPEI-1, SPEI-3, and SPEI-12) in the Nenjiang River basin (NRB) via Pearson correlation analysis, along with further exploration of the vegetation stability under drought. The results showed that the same period effect of drought on vegetation growth in NRB mainly occurs during the early and middle stages of vegetation growth. Furthermore, the proportion of significant positive correlation between them is 15.3%–43.3%, mainly in the central and southern parts of the basin. The lagged period effect of drought on vegetation growth mainly occurred during autumn in the southeast and middle of the basin, with a significant positive correlation of 20.8%. Under drought stress, the forest vegetation stability in NRB was the highest, with the resilience of wetland and grassland vegetation being the best and worst, respectively. Our study results will not only deepen our understanding of the dynamic vegetation changes in the high-latitude semi-arid basin under global climate change, but also provide a scientific basis for the management and water resources allocation of “agriculture-wetland-forest” complex ecosystem in the future.
Introduction
Vegetation is an important part of the terrestrial ecosystem and an indicator of the response to climate change (Jia et al., 2014). It is indispensable in the global hydrological cycle, energy flow, and climate regulation (Xia et al., 2014). As one of the important soil erosion barriers, vegetation can effectively change the underlying surface of the ground. However, due to global warming, the increasing frequency and intensity of droughts will change the vegetation cover and indirectly have a great impact on the ecological environment, agricultural production, and economic and social development (Dai, 2013; Leng et al., 2015). Drought occurs frequently, transforming the growth status and spatial distribution of vegetation (Wu et al., 2015). Drought-induced water stress hinders the growth and development of plants, with some even withering and dying, thereby deteriorating the regional ecological environment (Zhao et al., 2020a). Drought accompanied by an increase in temperature may have a greater impact on vegetation growth in the future (Cooley et al., 2019). Understanding the variability of plant response times to drought is essential to improve our understanding of the reciprocal feedbacks between ecological environments and climate change (Wen et al., 2019).
The response of vegetation change to drought has been widely studied on both the regional and global scales. Studies have shown that global warming-induced drought has reduced the net primary productivity of vegetation (Zhao and Running, 2010). Nanzad et al. (2019) suggested that the spatial difference between vegetation change and drought in Mongolia was mainly determined by land types and plant growth environment. Although Gouveia et al. (2017) showed that the drought in the Mediterranean basin had little effect on the vegetation of temperate oceanic and continental climates, it greatly affected the types of desert vegetation. Hollunder et al. (2021) evaluated the impact of drought events on the forest ecosystem function in South America and Atlantic Ocean. They found that larger habitats of trees are resources-rich and, therefore, can provide nutrients and water during periods of drought. There is a positive correlation between vegetation cover and drought in northern Xinjiang, North China, and Northeast China, with a negative correlation in the south of the Qinling-Huaihe region (Zhang et al., 2017); with vegetation changes in arid and semi-arid areas being more sensitive to meteorological drought (Zhang et al., 2016). Different ecosystems have varied responses to drought, with forests having the strongest drought resistance (Xu et al., 2019). However, more frequent droughts have begun affecting forests in tropical and subtropical China (Wang et al., 2016). The response of vegetation change to drought has a lagged period effect on the time scale. Related studies show that vegetation changes in Qinghai and Yunnan have lagged period effects on drought at different time scales (Nichol and Abbas, 2015; Liu et al., 2017). There are time differences in the response of different vegetation types toward drought in the east, middle, and west of Inner Mongolia (Wang et al., 2022a). Among them, short-term drought significantly affects the grassland, desert steppe, and grassland desert vegetation. Contrastingly, long-term drought has a greater impact on forest, forest steppe, and sandy desert vegetation (Li et al., 2018). The same period effect refers to the impact of drought events occurring in a period of time on vegetation growth, and the lagged period effect refers to the impact of the dynamic changes of climatic conditions on the current vegetation growth in the past period of time. Due to the changes of climatic conditions and human activities, the effects of drought characteristics on vegetation growth will be different in different regions. Therefore, the study on the same period and lagged period effects of drought on vegetation growth in specific areas is of great significance for understanding the interaction between multi-scale drought and vegetation growth and implementing more effective vegetation management strategies (Zhao et al., 2020a).
The NRB, located in Northeast China, is a high-latitude region with “agriculture-wetland-forest” due to the dual influence of the natural environment and human activities. Under global climate change, due to the increase of temperature, the decrease of precipitation, and the increase of evaporation, the region tends to be arid, with drought disasters frequently occurring, thereby causing land salinization and crop yield reduction in the western part of the basin (Ma et al., 2021). Furthermore, with the increase of extreme events like high temperature and drought, the wetland vegetation in the basin has successively evolved to the semi-arid vegetation type (Zhao and Wu, 2014a). In the past three decades, large farmland areas have suffered from drought, resulting in great economic losses (Dong et al., 2012; Guo et al., 2017). Additionally, the unwarranted development and utilization of soil and water resources has sharply reduced the area under natural vegetation and caused a significant decline in soil and water conservation. Especially, due to the problems of drought, water shortage and water pollution (Höpfner and Scherer, 2011), the wetlands in this region show phenomena, like abnormal succession rate of plant community, reduction in wetland area, destruction of biodiversity, etc. The above-mentioned problems impact the stability of the NRB ecosystem, thereby endangering both the ecological security and economic and social sustainable development. However, there are few studies on the effects of multi-scale drought on vegetation in this region.
This study analyzes the dynamic changes in response of vegetation to multi-scale drought in the NRB in Northeast China. This will provide (1) a theoretical reference for regional eco-environmental protection and rational distribution of water resources and (2) practical significance to protect the high-latitude “agriculture-wetland-forest” complex resource area.
Materials and methods
Study area
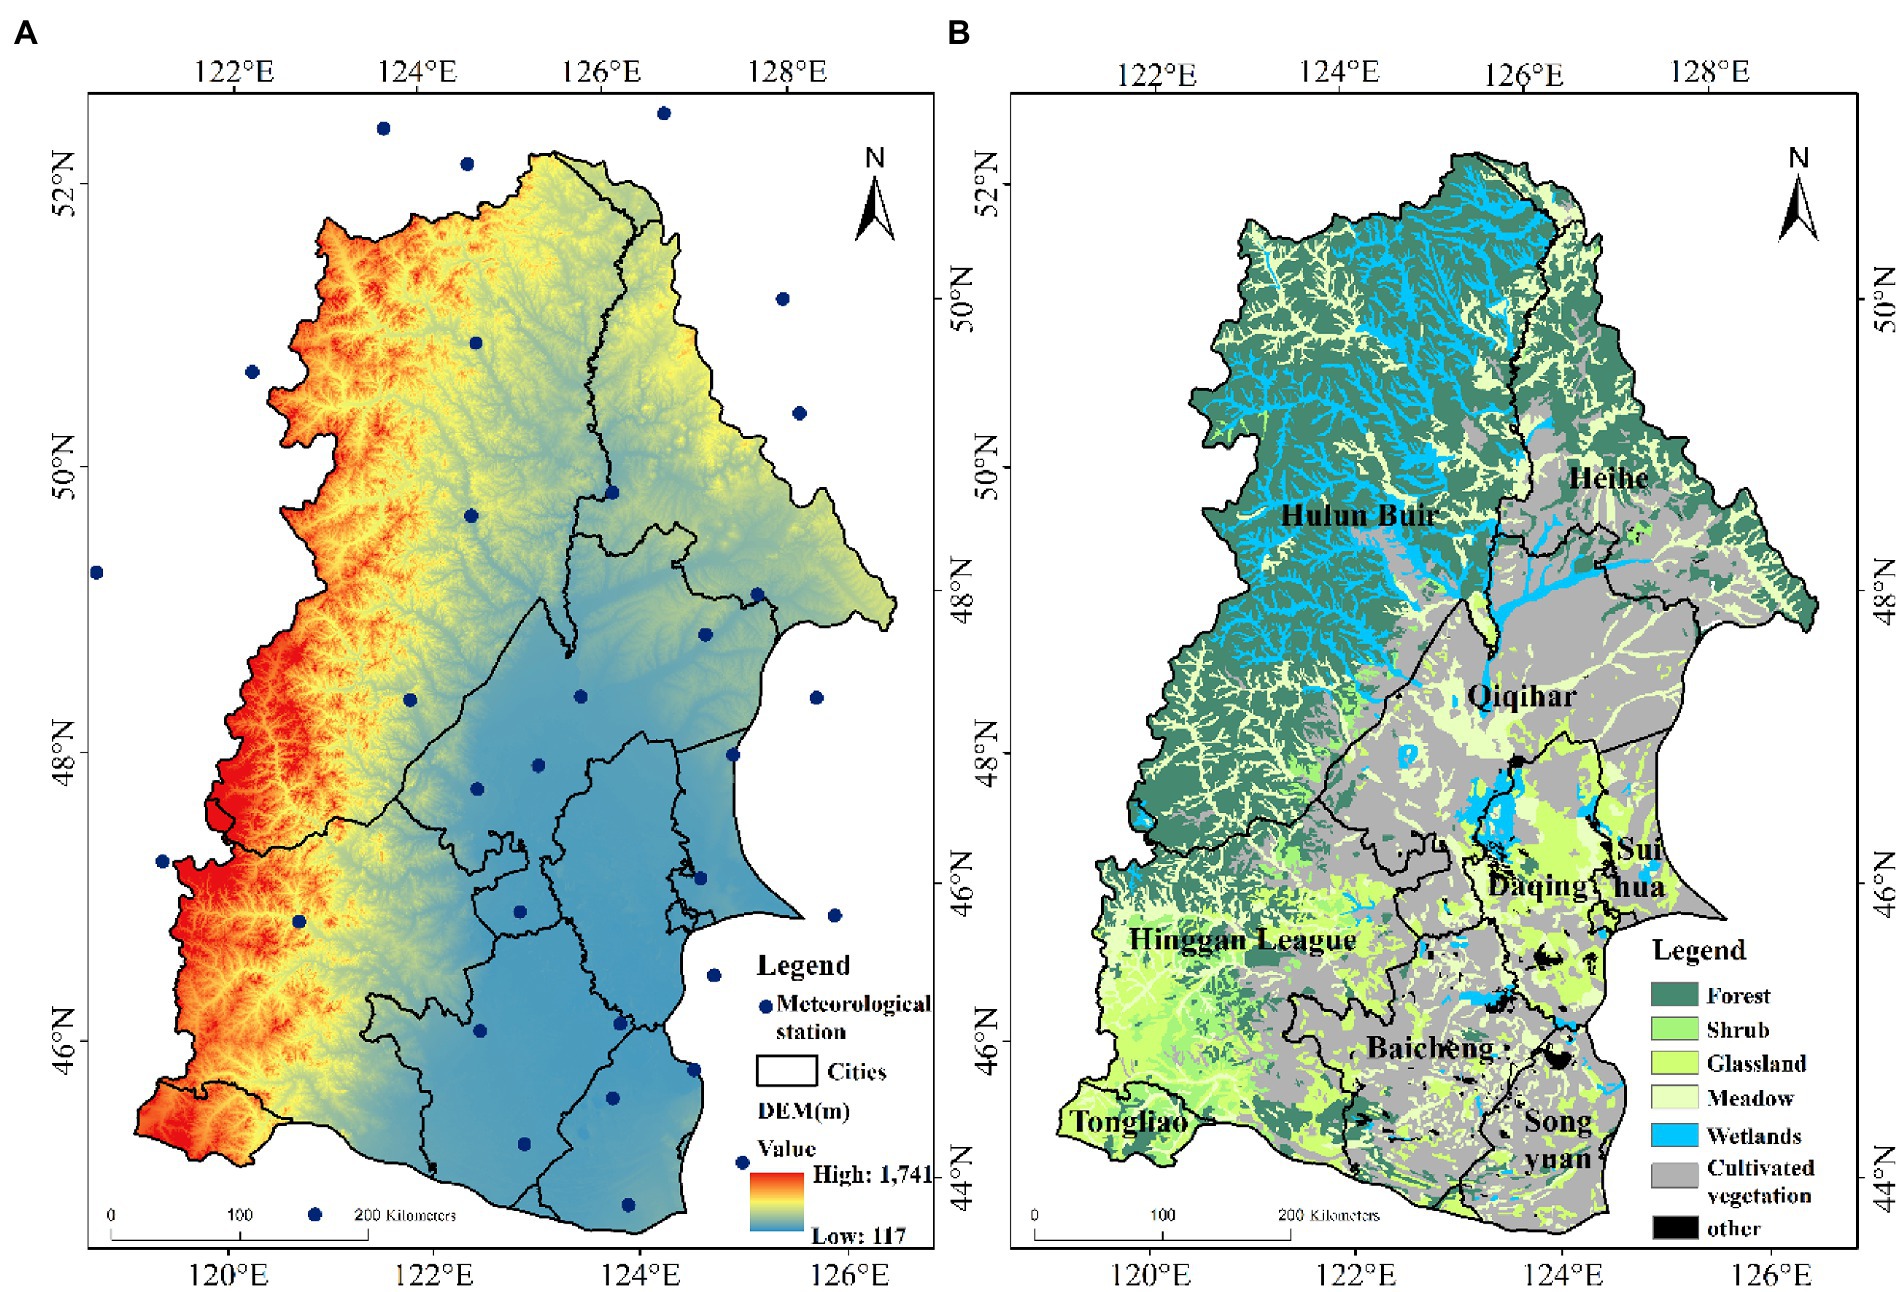
The NRB, with an area of 29.7 × 10⁴ km2, is located in the central and western part of Northeast China (44–50°N, 120–128°E, Figure 1). It is hot and rainy in summer, whereas being cold and dry in winter (Du et al., 2013). The NRB is rich in cultivated land resources with sufficient sunshine, making it one of the major food production areas in China. Several important wetland nature reserves are located in this basin (such as Zhalong, Xianghai and Momoge wetlands; Wu et al., 2020b), with the vegetation in these wetlands possibly being more vulnerable to drought changes than other ecosystems (Qi et al., 2021). The Greater Khingan Mountains and the Lesser Khingan Mountains are located in the west and north of the NRB, making it the location of the “agriculture-wetland-forest” complex ecosystem. Recently, due to climate change and human activities, plant diversity has changed to varying degrees, which has affected the stability of the NRB ecosystem.
Data
The vegetation index has currently been widely used to evaluate vegetation growth (Ge et al., 2021). Among the many indices, normalized difference vegetation index (NDVI) uses near infrared and infrared bands to eliminate some effects of external factors like atmosphere and topography (Beck et al., 2011), which are widely used in the studying vegetation cover and growth status (Li et al., 2022a). The NDVI dataset was downloaded from the National Aeronautics and Space Administration1 and it comprised the vegetation index (MOD13A3, collection v006) product of the Terra MODIS, which provides a value with 1,000-m spatial resolution and 1-month temporal resolution. Also, the entire study area spanned over four tiles of granules like a horizontal and vertical coordinate (h25v03, h25v04, h26v03, and h26v04). Using the pre-processing of the original data, we obtained the monthly NDVI data from 2000 to Xu et al., 2019, and the mean method was used to obtain the seasonal and annual NDVI data, in order to reflect the growth status of surface vegetation.
Meteorological data were obtained from the China Integrated Meteorological Information Sharing System.2 The meteorological data was collected by 32 meteorological stations in the NRB from 2000 to 2019. The variables included the daily precipitation, wind speed, average temperature, and the lowest and highest temperatures. Considering that the study area surface being snow covered for a long time during winter, with the vegetation growth having stopped, it greatly impacts the NDVI value. Therefore, only the NRB in spring, summer, autumn, and vegetation growing season were studied. According to the vegetation growth in NRB (Feng et al., 2011), the following categorizations were done: March–May as spring, June–August as summer, September–November as autumn, and May–October as the growing season of vegetation.
Methodology
SPEI drought indicator
Considering regional drought evaluation, due to the different temporal and spatial scales, the selection of the appropriate drought index also varies (Hao and Singh, 2015). Among the droughts evaluation indices, the standardized precipitation evapotranspiration index (SPEI) accounts for the effects of precipitation and evapotranspiration. Since these have the advantages of long-time scale and wide space, while also being able to characterize the surface drought trend, they have been widely used in drought research (Zhang et al., 2019b; Li et al., 2020). The SPEI was calculated using precipitation and evapotranspiration, while rainfall was measured at the rainfall stations. Penman-Monteith method, which is widely used in related research, is used to calculate evapotranspiration (Allen et al., 1998; Li et al., 2022b). The SPEI calculation formula is as follows (Vicente-Serrano et al., 2013):
Climate moisture balance ():
where and are the monthly precipitation and the monthly potential evapotranspiration, respectively.
The set of on each time scale can be expressed as:
where and indicates the monthly scale and the number of calculations, respectively.
The log-logistic probability distribution with three parameters was used to normalize the data sequence, and the SPEI corresponding to each value was calculated using the following formula:
The parameters , , and were calculated as follows:
where is the factorial function, and , , are the probability weighting moments of the data sequence.
where indicates the number of months.
Finally, the cumulative probability density was standardized as shown below:
When the cumulative probability ≤ 0.5:
When the cumulative probability > 0.5:
where is 2.515517, is 0.802853, is 0.010328, is 1.432788, is 0.189269, is 0.001308。.
In this study, 1-, 3-, and 12-month scales of SPEI (SPEI-1, SPEI-3, and SPEI-12) were used to represent the drought conditions at different time scales in the NRB. SPEI-1 represents drought on a short time scale, thereby reflecting subtle changes in climate moisture during that month. SPEI-3 represents drought on a medium time scale, thereby reflecting the climate and moisture of the season. SPEI-12 means drought on a long-time scale, thus reflecting the cumulative climate water balance throughout the year. Therefore, SPEI can identify the effects of different drought types (short-term, medium-term, and long-term drought) on vegetation (Beguería et al., 2014; Zhang et al., 2017; Gebremeskel Haile et al., 2020).
The ANUSPLIN method was used to interpolate multi-scale drought with longitude, latitude, and elevation. Compared with the commonly used inverse distance weight and Kriging interpolation methods, ANUSPLIN interpolation accounts for the effects of other variables on meteorological factors, with the error of result being smaller (Shi et al., 2021).
Correlation analysis
To understand the response relationship between vegetation change and drought in NRB, the Pearson correlation analysis of the same period effect and lagged period effect of NDVI and SPEI was carried out, respectively (Ding et al., 2021). The value of correlation coefficient ‘r’ reflected the correlation between vegetation and drought. When r was positive, it meant that they were positively correlated, and vice versa. The greater the absolute value of r was, the higher their correlation became (Tong et al., 2017). When analyzing the same period effect of the growing season, the correlation between NDVI and SPEI in each month from May to October was analyzed. However, when studying the seasonal same period effect, the correlations between NDVI and SPEI during spring, summer and autumn were analyzed, respectively. During the study of the annual same period effect, the correlation between NDVI and SPEI was analyzed; with the period having the highest coefficient considering that drought had the greatest impact on vegetation. When analyzing the lagged period effect of the growing season, the correlation between the monthly NDVI from May to October and the monthly SPEI with the lag time from April to September was analyzed. But when the seasonal lagged period effect was studied, the correlation between the NDVI of spring, summer, and autumn and the previous season SPEI was analyzed. During the study of the annual lagged period effect, the annual scale SPEI value corresponding to the annual NDVI and the previous year lag time were analyzed. The period with the highest coefficient was considered having the greatest impact of drought on vegetation.
Analysis of vegetation stability under multi-scale drought
The coefficient of variation can represent the relative changes of geographical data and reflect its stability. We define the reciprocal of coefficient of variation as vegetation stability (Jiang et al., 2015). The ratio of the mean value of NDVI to its standard deviation during the entire study period, with larger value, the stronger the stability (Wu et al., 2021). The drought resistance of vegetation indicates the ability of vegetation structure and function to maintain their original state during drought (Ivits et al., 2016). Their drought resilience indicates the speed at which they return to normal post drought stress (Van Ruijven and Berendse, 2010). Each index has no unit and can be compared and evaluated under different vegetation types. The formulae are as follows:
where is the vegetation stability index; is the coefficient of variation of NDVI; is the standard deviation; is the mean value of NDVI in all years; is the resistance index; is the mean value of NDVI in non-dry years; is the NDVI in dry years; is the resilience index, and is the NDVI of the driest year. With a higher resistance index, the reduction of NDVI during the drought period was smaller. With a higher resilience index, the disturbance of NDVI in the driest years was lesser. Furthermore, with a higher index of resistance and resilience, vegetation showed better stability and was lesser affected by drought (Huang and Xia, 2019).
Results
The same period effect of drought on NDVI
Response of NDVI to drought at different time scales
The correlation of the same period effect between NDVI and SPEI in the growing season of NRB varies greatly at different time scales (Figure 2). Although NDVI and SPEI were positively correlated, it began to decrease in July. The correlation between them was the most significant in May (r = 0.51, p < 0.05), while being the lowest in October (r = 0.26, p > 0.1). The proportion of areas with positive correlation was >69%, with the largest and smallest being in July (84.9%) and September (69.4%), respectively.
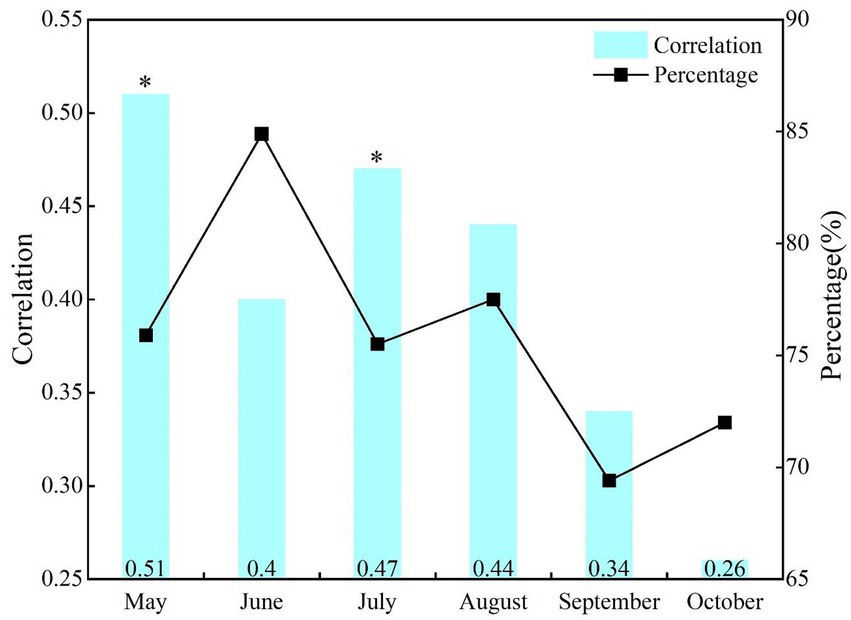
Figure 2. Correlations and area percentage of positive correlations between NDVI and SPEI at the same period effect of monthly scale. *p < 0.05, **p < 0.01; the same below.
During the study period, there were great differences in the correlation between the seasonal and annual NDVI and SPEI in NRB (Figure 3). There was a positive correlation between NDVI and SPEI in annual, summer, and autumn, with a significant positive correlation in summer (r = 0.66, p < 0.05), but no significant negative correlation in spring (r = −0.11, p > 0.1). In terms of positive correlation area percentage, the proportion was the largest and smallest in summer (85.9%) and spring (47.1%), respectively.
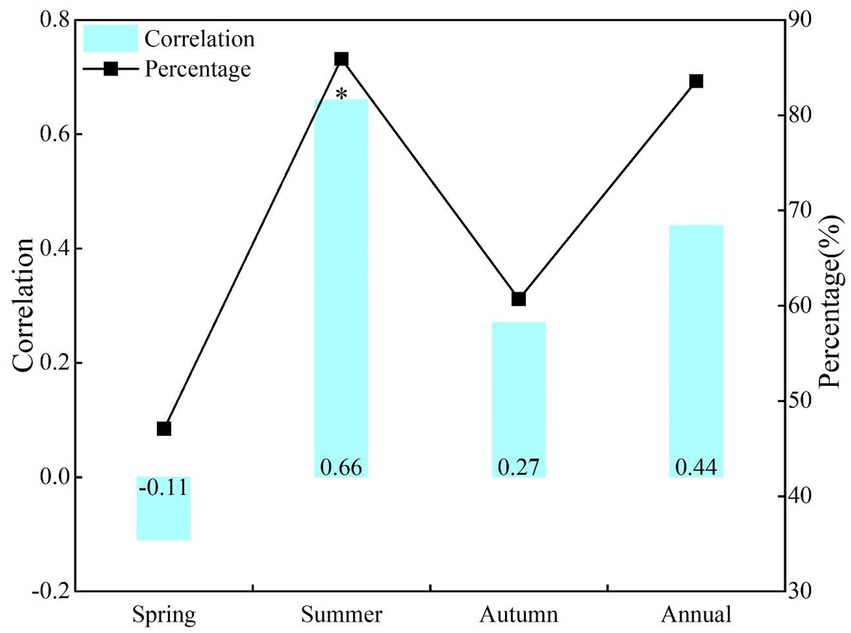
Figure 3. Correlations and area percentage of positive correlations between NDVI and SPEI at the same period effect of seasonal and annual scales.
Spatial distributions of the same period effects of drought on NDVI
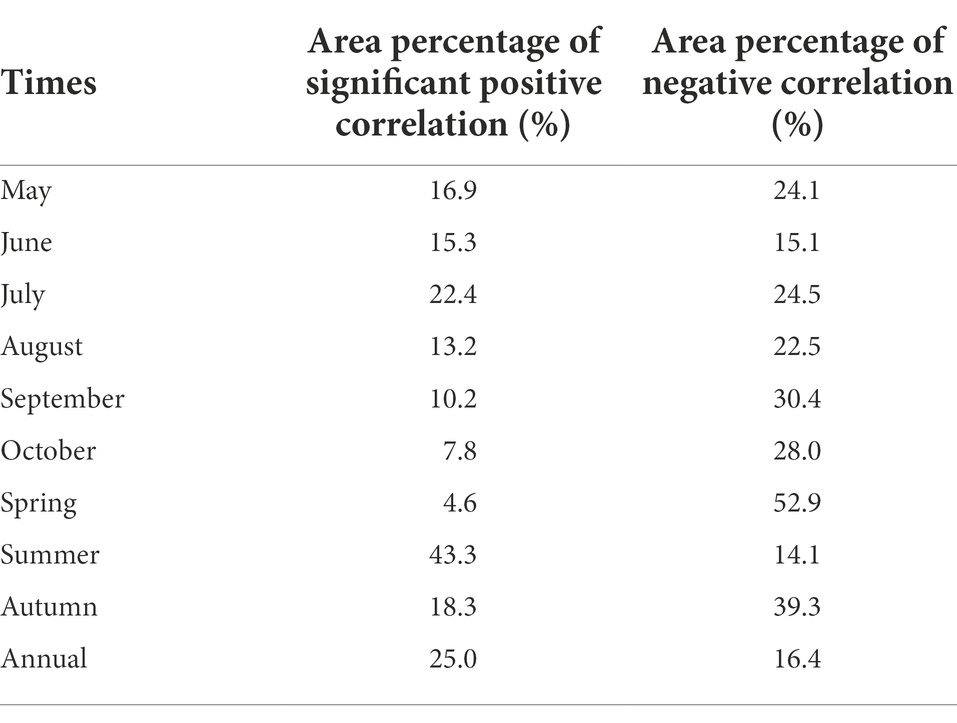
The spatial distribution of same periodical response between vegetation change and drought in NRB showed that the proportion of regions with positive correlation between NDVI and SPEI in each month of the vegetation growing season was >70% (Figure 2). The relatively large area of significant positive correlation between NDVI and SPEI happened in May (16.9%), June (15.3%) and July (22.4%; Table 1). Additionally, they are mainly distributed in some areas of Hulun Buir, Heihe, Hinggan League, Tongliao, Daqing, and Suihua in the NRB (Figure 4).
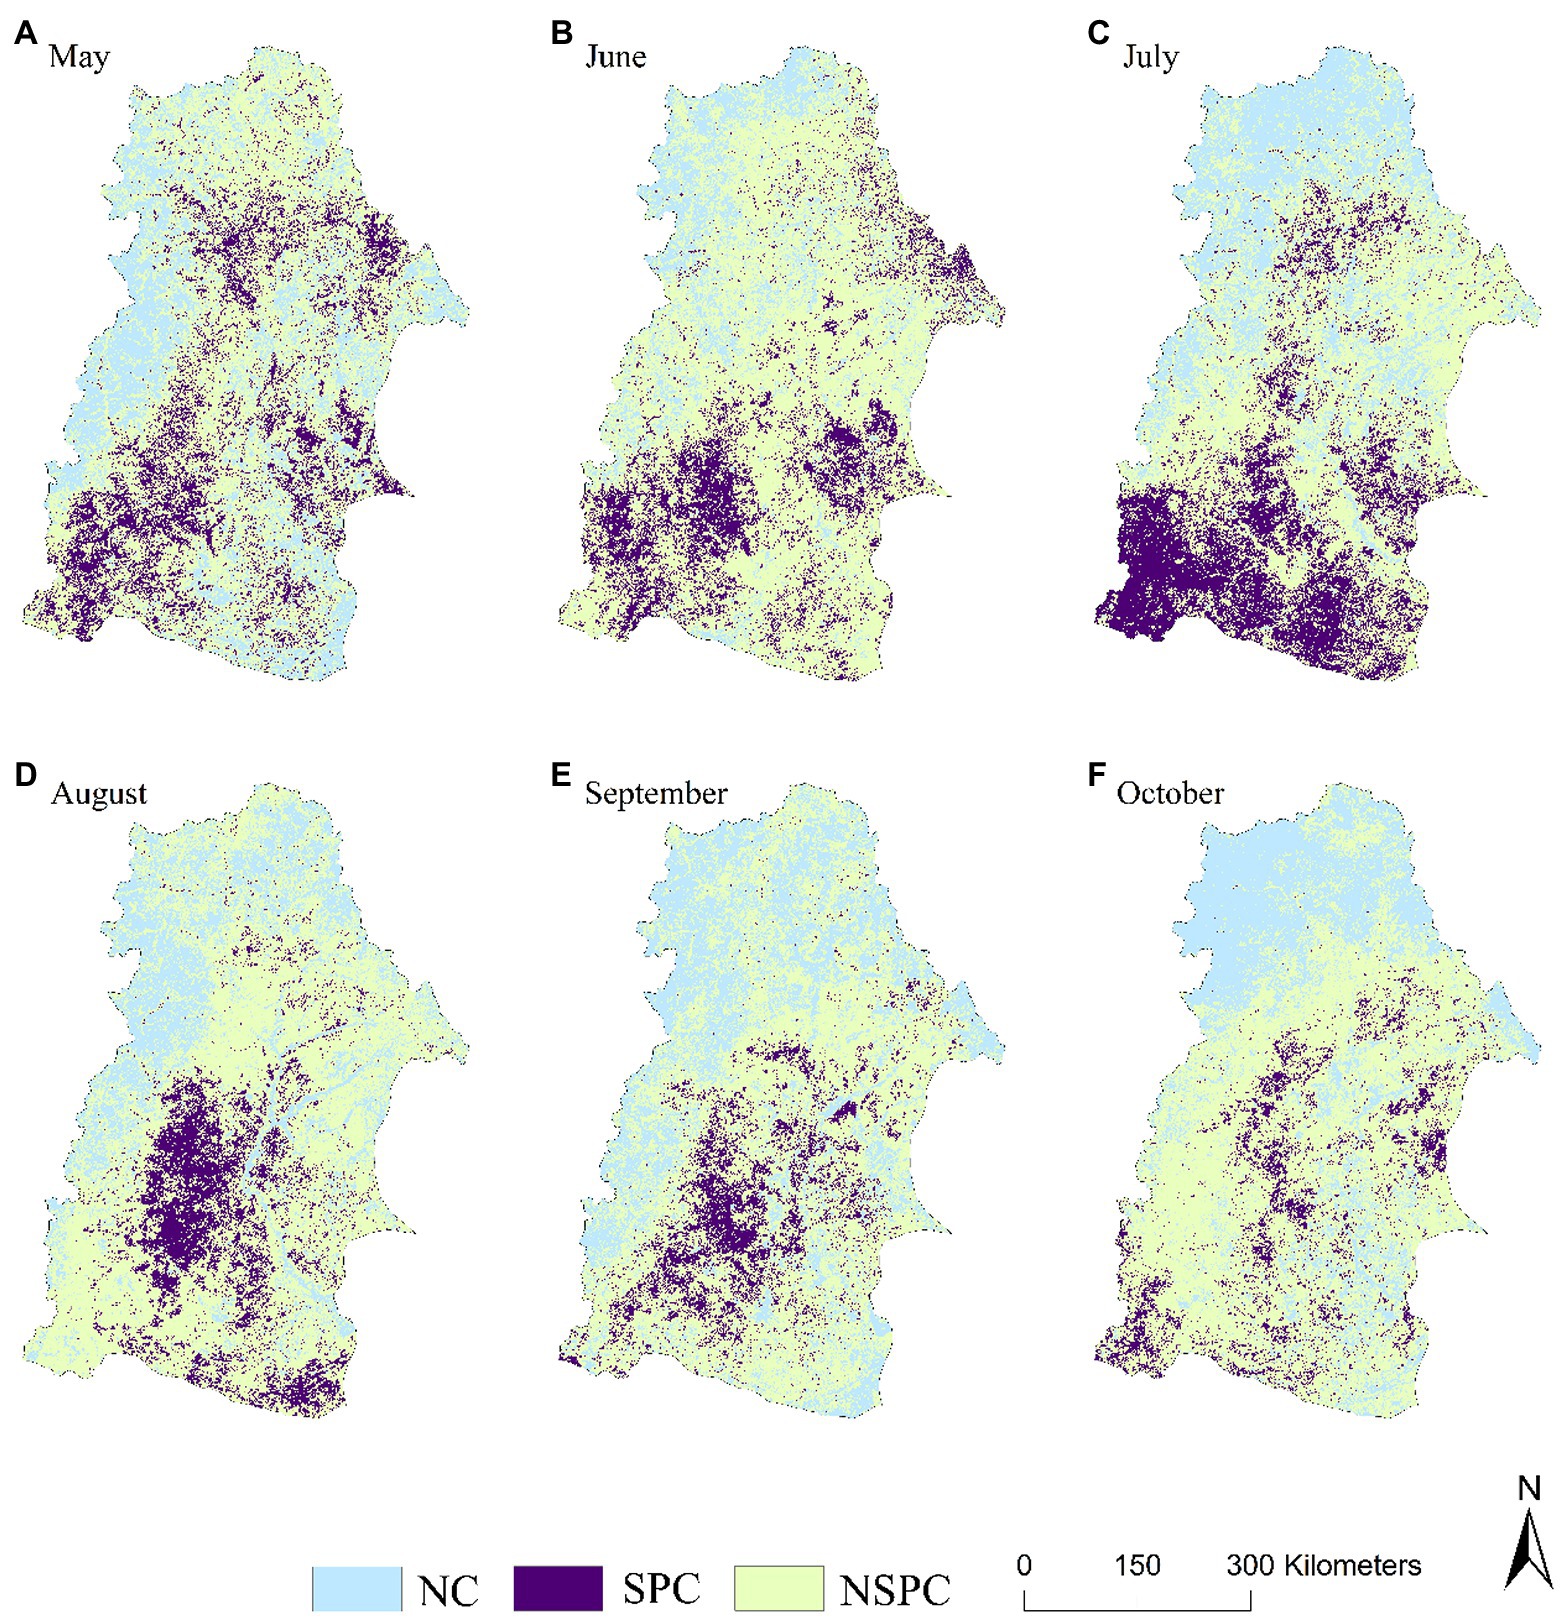
Figure 4. Spatial distribution of correlative level between the NDVI and SPEI same period effect at the monthly scale. NC: Negative correlation; SPC: Significant positive correlation; NSPC: Not significant positive correlation; the same below.
From the spatial distribution at seasonal and annual scales, the significant positive correlation between NDVI and SPEI occurred in summer, mainly in some areas in the south of the NRB (Figure 5B). The regional proportion of significant positive correlation was the smallest in spring, and was mainly distributed in Hinggan League in the southwest of the NRB (Figure 5A). The largest proportion of negative correlation between NDVI and SPEI occurred in spring, and was mainly in the northwest of the NRB (Figure 5A).
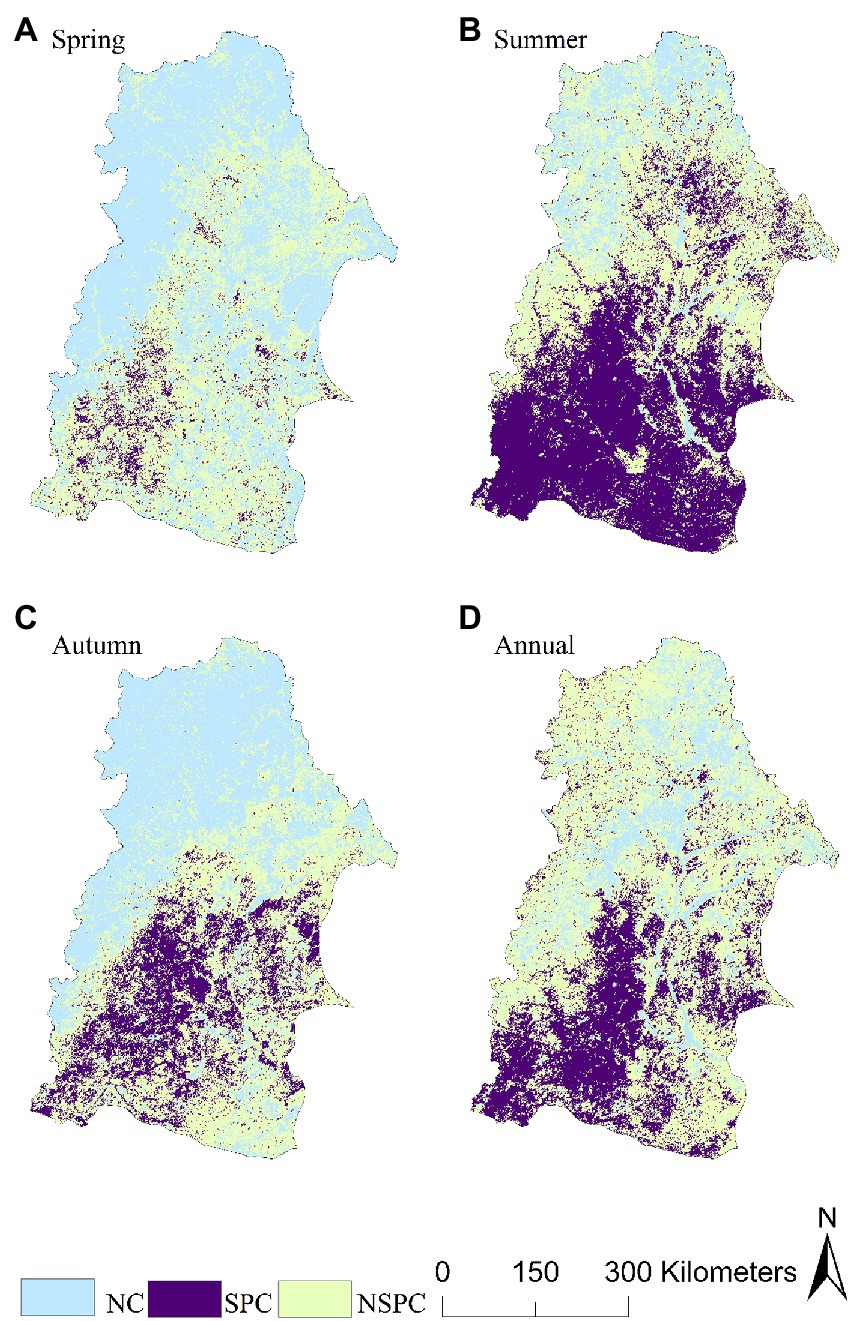
Figure 5. Spatial distribution of correlative level between the NDVI and SPEI same period effect at the seasonal and annual scales.
The lagged period effect of drought on NDVI
Response of NDVI to drought at different time scales
The correlation between NDVI and lagging SPEI varied greatly in each month of the vegetation growing season in the NRB (Figure 6). There was no significant negative correlation between NDVI in May and SPEI in April (r = −0.19, p > 0.1), but we observed positive correlation in other months, among which, the correlation between NDVI in October and SPEI in September was the most significant (r = 0.73, p < 0.01). The positive correlation area between NDVI and their correspondingly lagged SPEI from June to October was >68%, with the positive correlation area between June NDVI and May SPEI being the largest (90.9%).
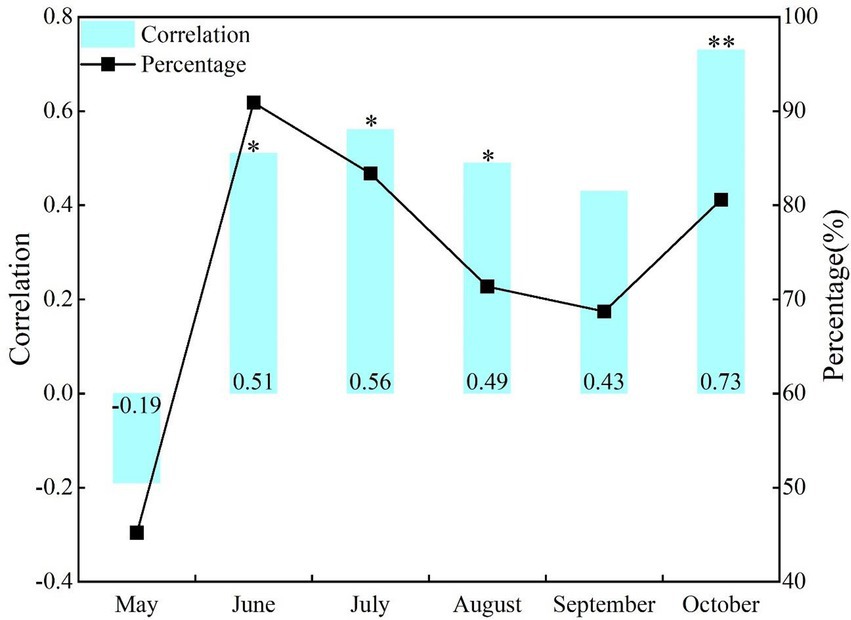
Figure 6. Correlations and area percentage of positive correlations between the NDVI and SPEI lagged period effect at the monthly scale.
The lagged response of vegetation to drought in NRB varied greatly on seasonal and annual scales (Figure 7). Although there was no significant negative correlation between spring NDVI and winter SPEI in the previous year (r = −0.36, p > 0.1), autumn NDVI and summer SPEI were positively correlated (r = 0.47, p < 0.05). In terms of the percentage of positive correlation area between NDVI and SPEI, we found that the positive correlation area between summer, autumn, and annual NDVI and corresponding lagging SPEI was >70%, with the positive correlation area between summer NDVI and spring SPEI being the largest (84.2%).
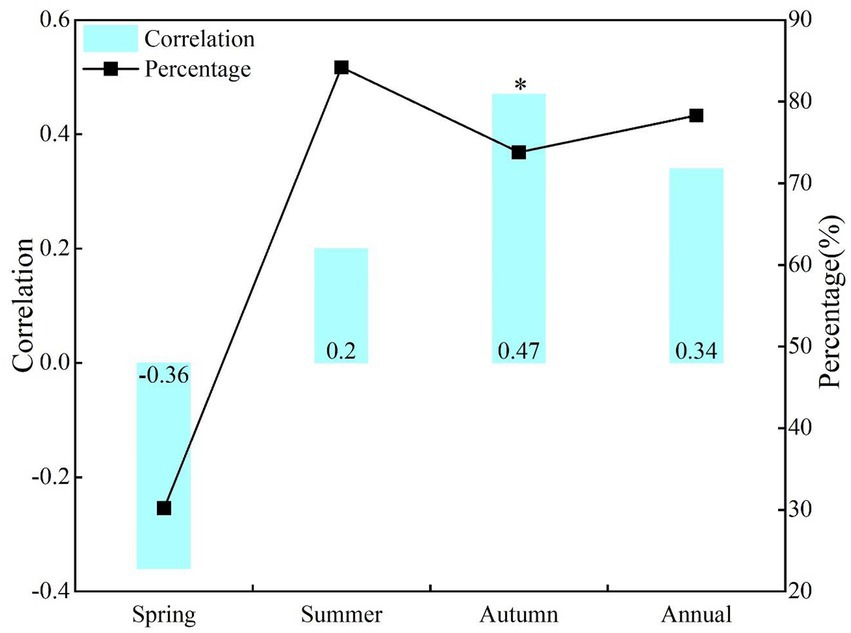
Figure 7. Correlations and area percentage of positive correlations between NDVI and SPEI at the lagged period effect of seasonal and annual scales.
Spatial distributions of the lagged period effects of drought on NDVI
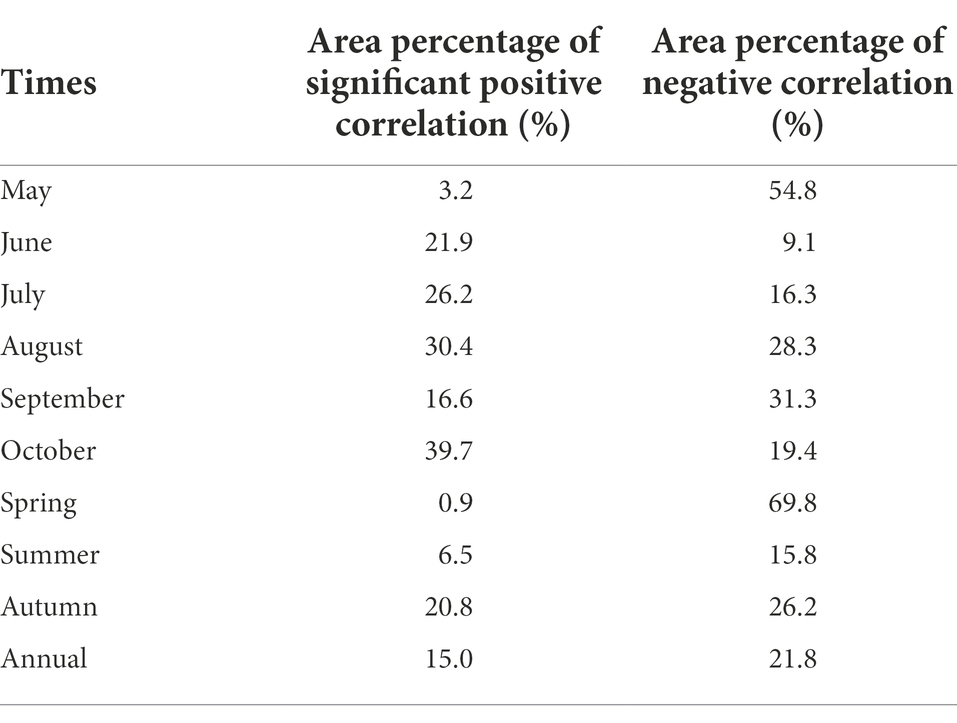
We observed great differences in the spatial distribution of significant positive correlation between NDVI and their corresponding lagging SPEI in each month of the vegetation growing season in NRB (Table 2; Figure 8). The significant positive correlation between October NDVI and September SPEI was the largest, and was mainly distributed in the south and northeast of the basin (Figure 8F). However, the significant positive correlation between May NDVI and April SPEI was the smallest, which was concentrated in the southeast of Heihe and the northeast of Qiqihar (Figure 8A). During each month of the vegetation growing season, the area with a negative correlation of vegetation growth status to drought in May was the largest, and was mainly located in the northwest and southeast of the basin (Figure 8A). Furthermore, the area proportion of negative correlation of the vegetation’s lagged response to drought was the smallest in June, and was scattered in the north of the basin (Figure 8B).
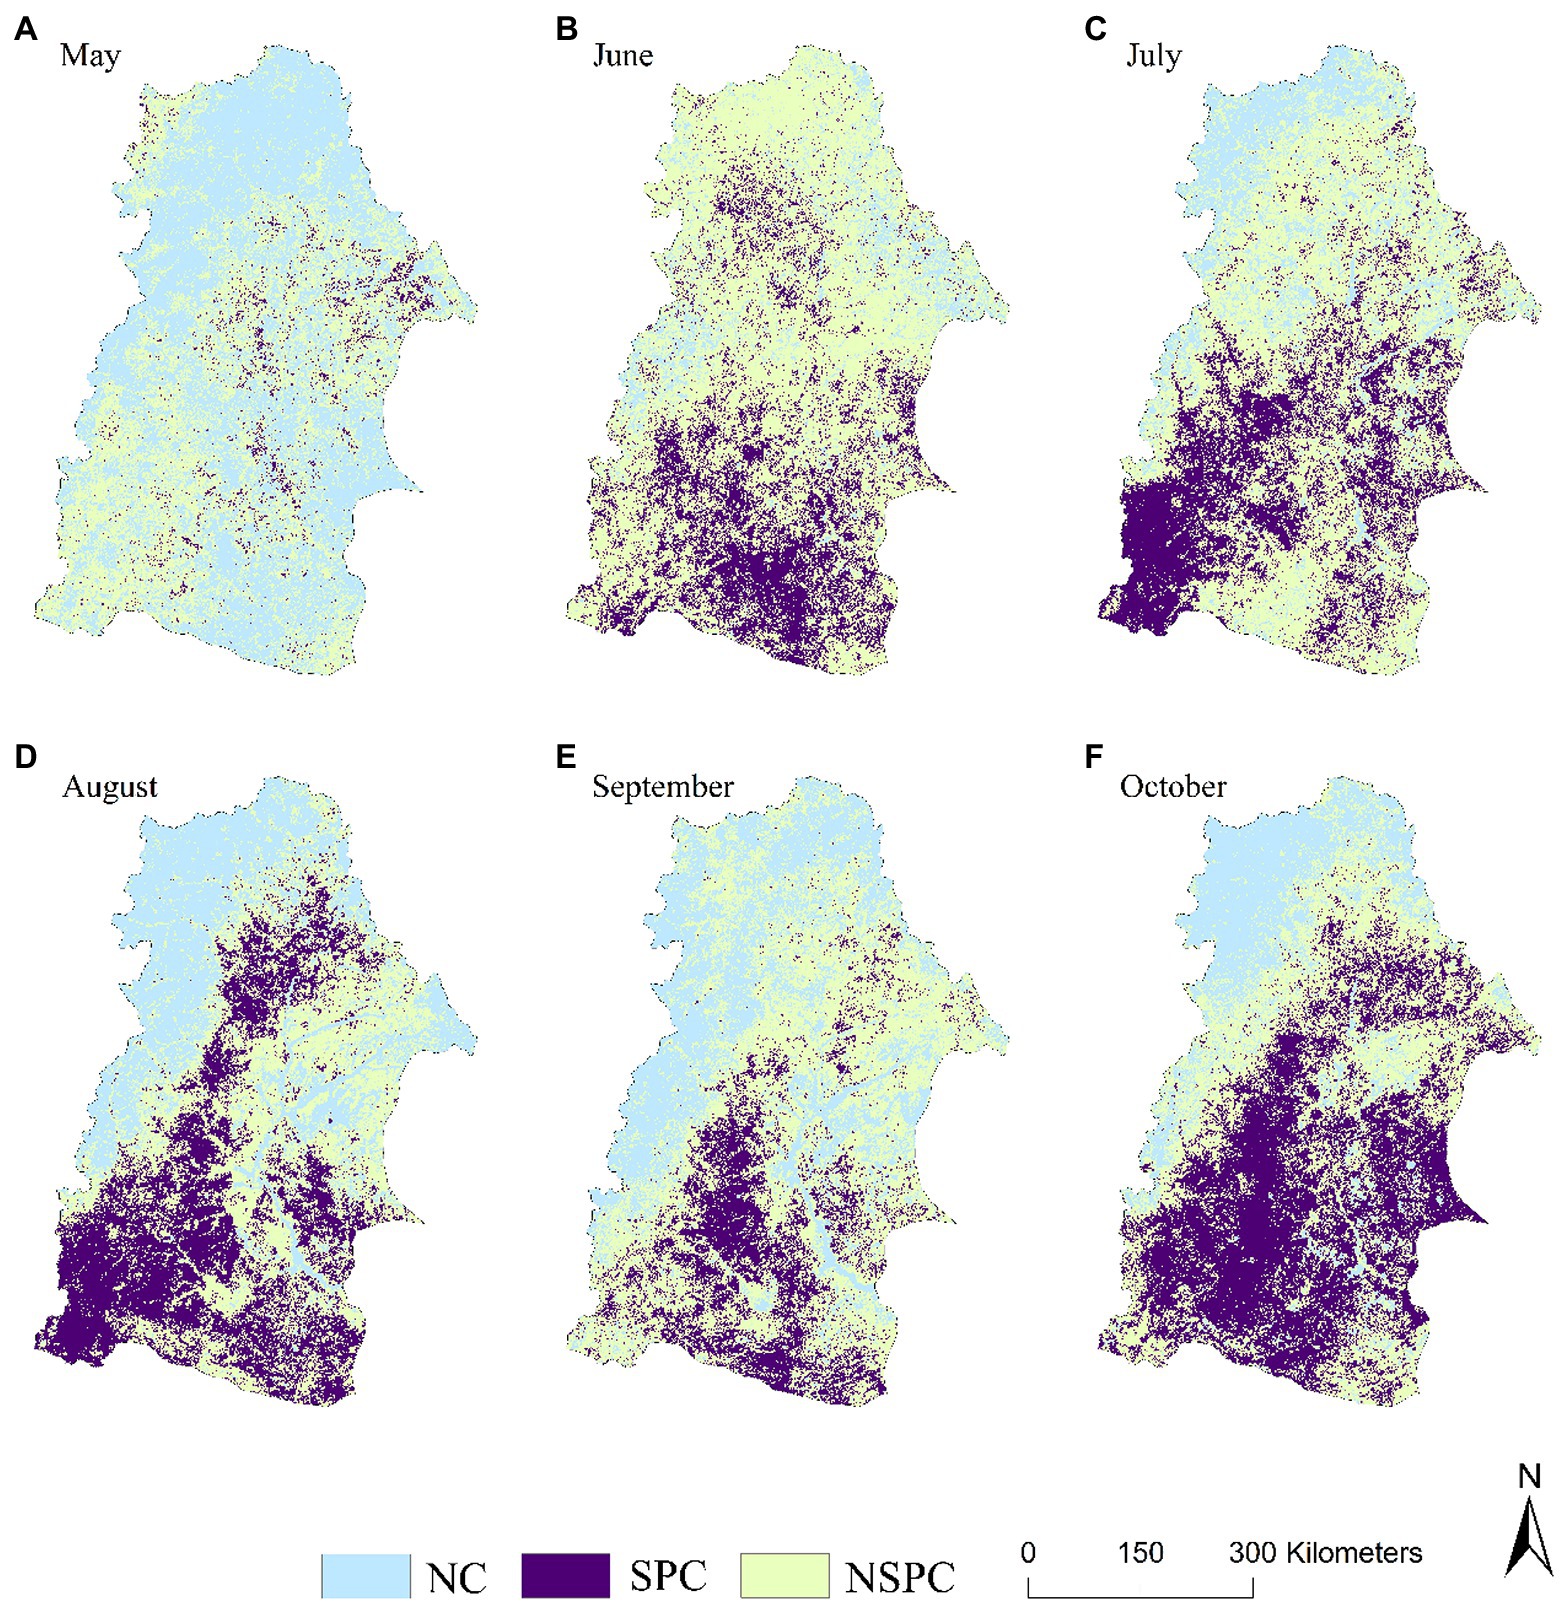
Figure 8. Spatial distributions of correlative level between the NDVI and SPEI lagged period effect at the monthly scale.
In terms of seasonal and annual scales, the proportion of regions with significant positive correlation of vegetation growth status to the lagged drought response in NRB was very small (0.9% ~ 20.8%)(Table 2). The autumn vegetation NDVI was positively correlated with the largest areas having the summer SPEI, and was mainly distributed in Baicheng, Songyuan, and Hinggan League in the southeast of the basin and Qiqihar and Daqing in the middle of the basin (Figure 9c). The proportion of the spring NDVI negatively correlation with SPEI in the previous winter was the largest, and it was widely distributed in the north and middle of the basin (Figure 9A).
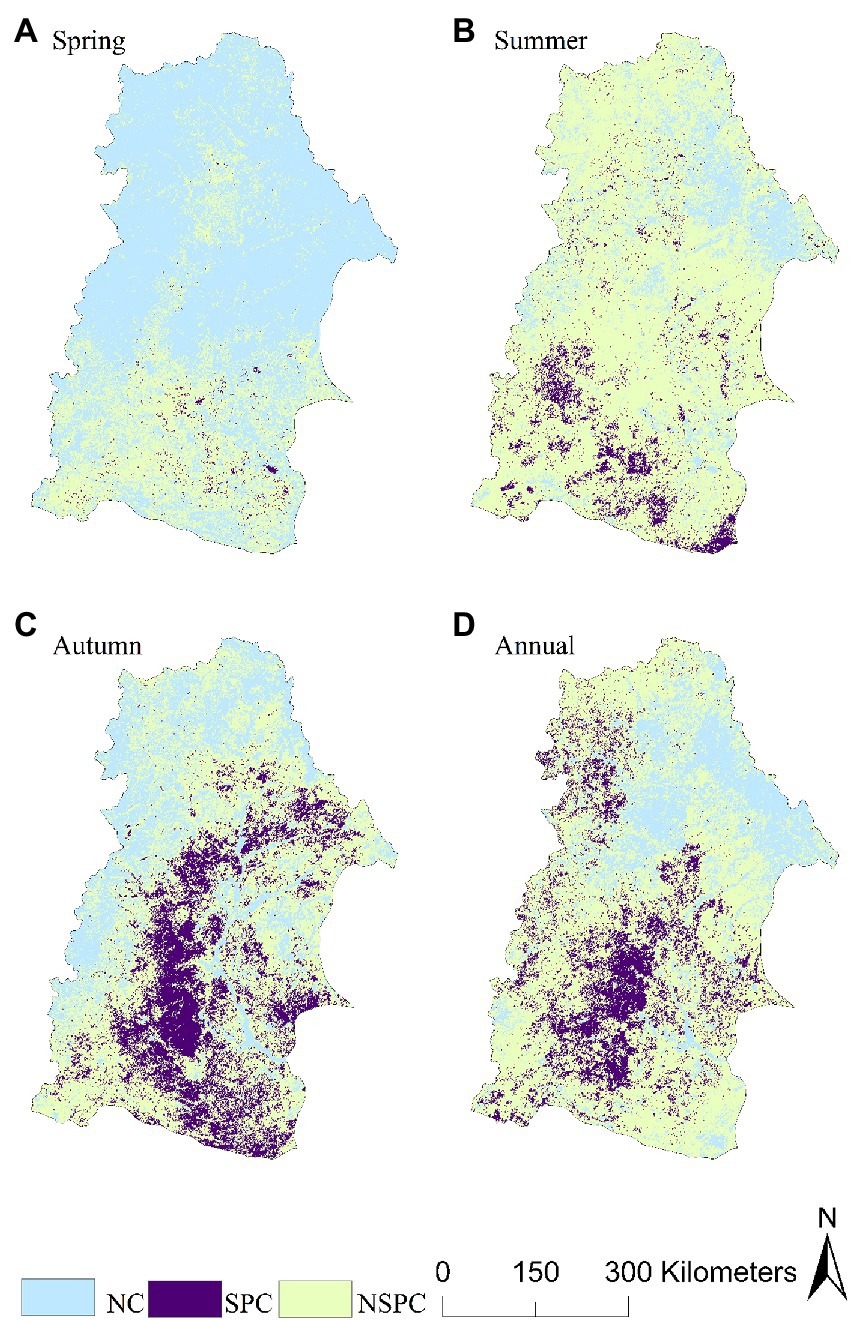
Figure 9. Spatial distribution of the correlative level between the NDVI and SPEI lagged period effect at the seasonal and annual scales.
Vegetation stability under multi-scale drought
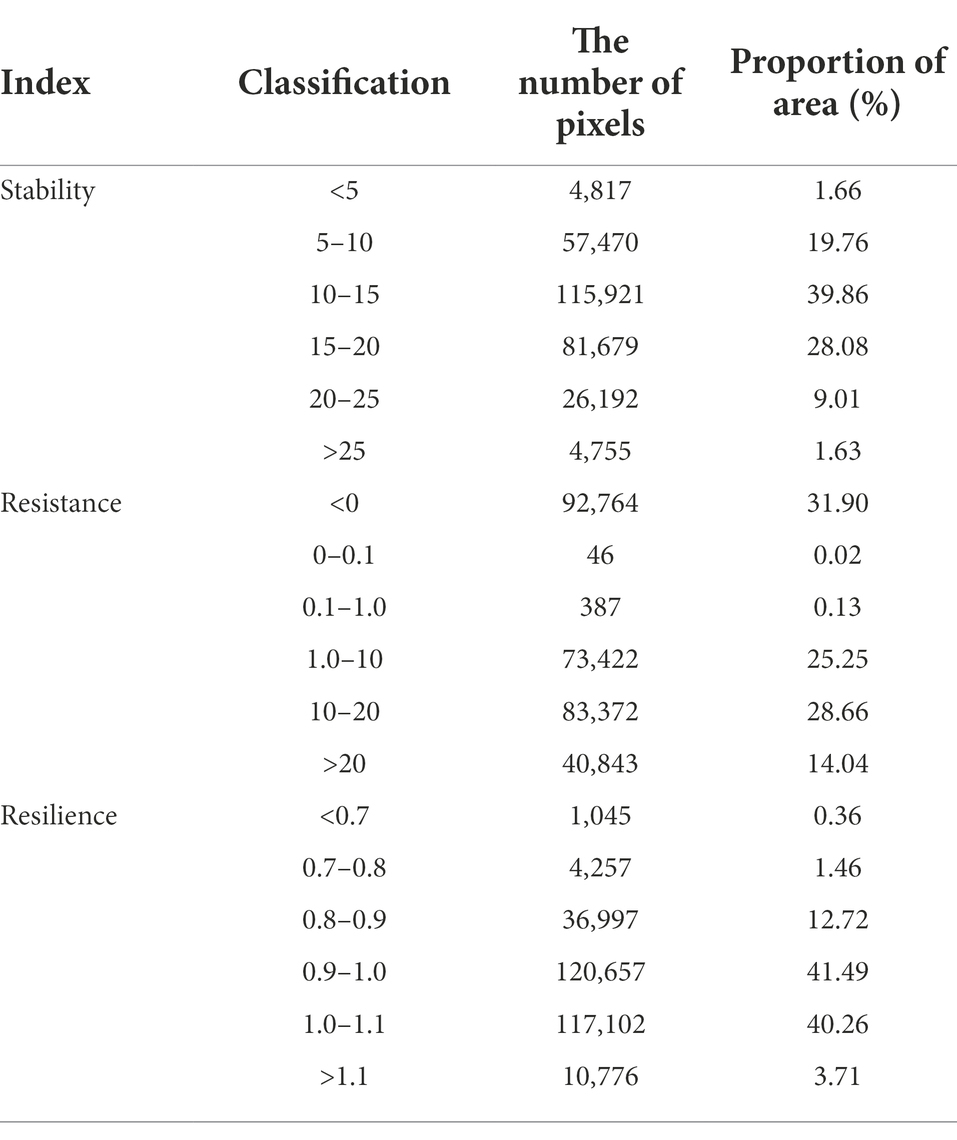
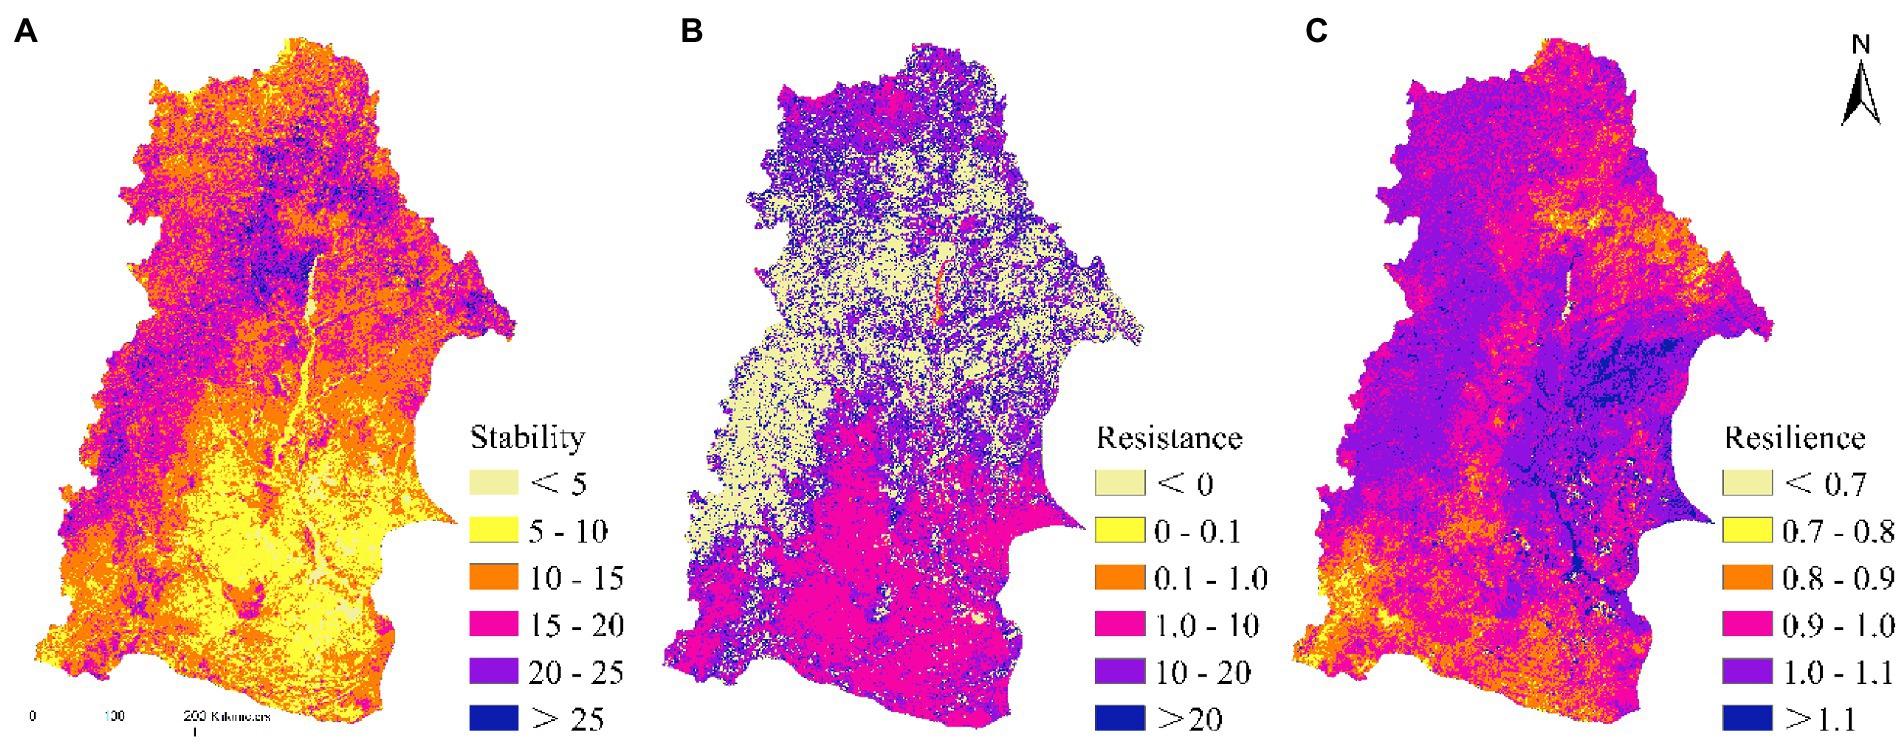
During the study period, the overall level of vegetation stability in the NRB was higher. The area with a stability index >10 was relatively large, with the area having relatively low vegetation stability being mainly distributed at the junction of Baicheng, Daqing, and Hinggan League in the southeast of the basin, which accounted for 21.42% of the area (Table 3; Figure 10A). The resistance of vegetation to drought showed a large spatial difference, and the stronger areas were mainly distributed in the north and southeast of the basin, which accounted for 67.95% of the area. Furthermore, we found the weaker areas were mainly distributed in Hulun Buir in the west of the basin, which accounted for 32.05% of the total area (Table. 3; Figure. 10B). The strong drought resilience of vegetation was mainly distributed in the central and eastern part of the basin, thereby accounted for 43.97% of the area, whereas the weaker area was mainly distributed in the south of the basin, and it accounted for 1.82% of the area (Table. 3; Figure 10c).
According to the utilization types of vegetation, the forest stability in the NRB was the highest, while those of saline-alkali soil and water body were the lowest (Figure 11). Considering the drought resistance of vegetation, it was the strongest cultivated vegetation and building land, followed by grassland and forest. There was no significant difference in the drought resilience of different vegetation use types in the NRB. However, we observed relatively high drought resilience in the wetland vegetation, forest and cultivated vegetation, while there was poor drought resilience is the grassland and saline-alkali soil (Figure 11).
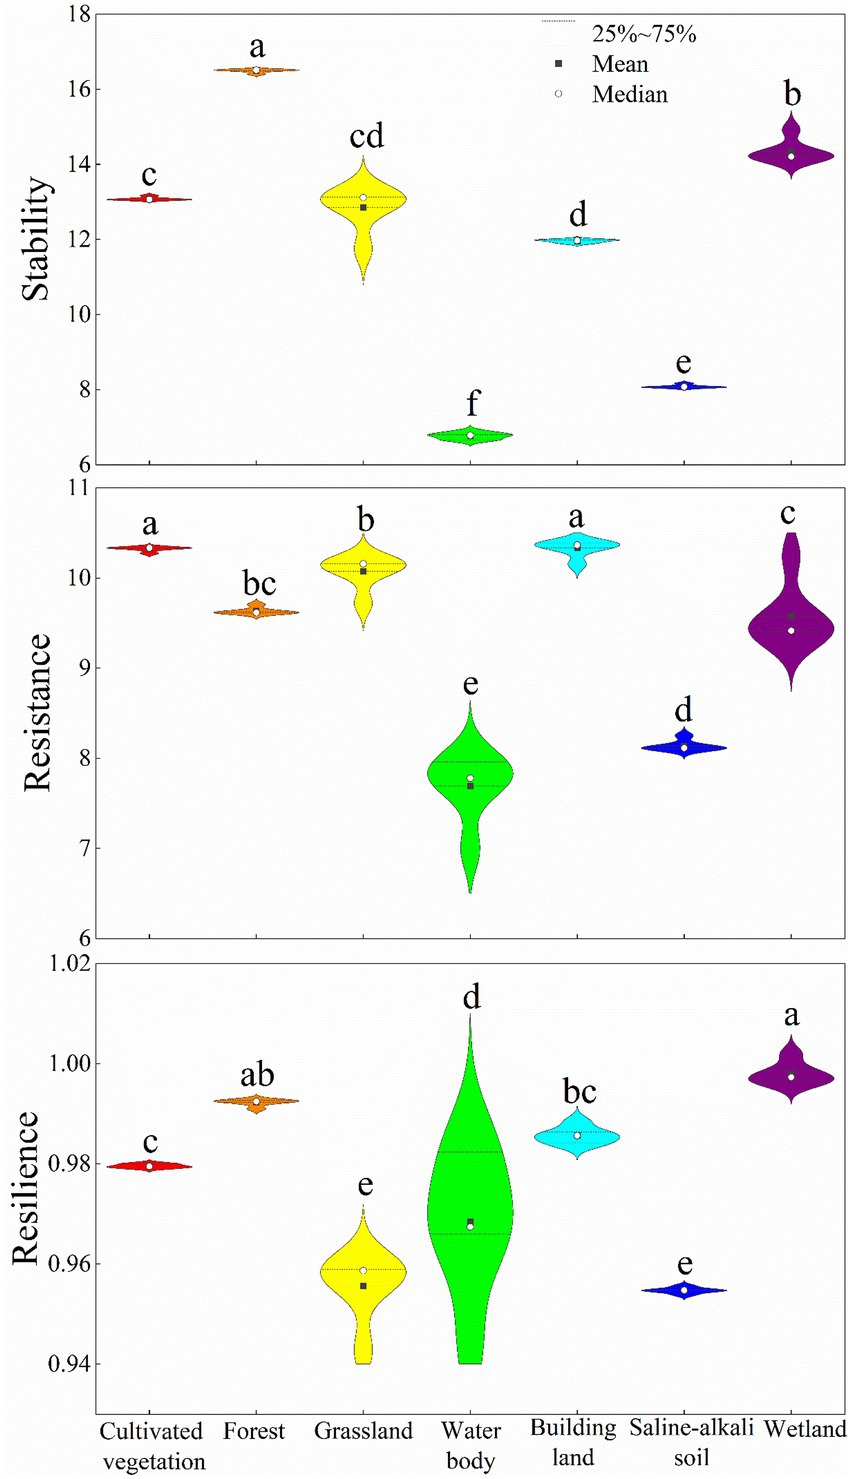
Figure 11. Comparison of the vegetation stability, resistance, and resilience among the different vegetation types. Different lowercase letters indicate the statistical differences, p < 0.05.
Discussion
Response of vegetation growth to multi-scale drought
The semi-arid boundary of Northeast China has gradually moved to the southeast (Zhao and Wu, 2014b), with the drought trend becoming increasingly serious (Zhao et al., 2020b). The NRB is located in the central and western part of Northeast China, at the junction of semi-arid and semi-humid areas. Due to the increase in temperature, the decrease in precipitation, and the increase in evaporation, the climate tends to be arid, with the frequent occurrence of droughts (Qi et al., 2021), ultimately resulting in salinization and crop yield reduction in most of the land in the basin (Zhao and Wu, 2014a). Additionally, with the increase of extreme events like high temperature and drought, the wetland vegetation has evolved into the semi-arid vegetation type in the basin. This meant that the dynamic vegetation change caused by drought has significantly affected the ecological environment and human society of the high-latitude basin.
Our study found that during the early and middle stages of vegetation growth (May–July), the areas with significant positive correlation between NDVI and SPEI of the same period effects were mainly distributed in the north and southwest of the basin (Figure 4), thus indicating that drought in these areas would fairly inhibit the vegetation growth. Combined with the distribution of the vegetation types in the NRB, the saline-alkali land, grassland, and cultivated vegetation were greatly limited by both water and man-made conditions (Xu et al., 2018), and were also easily affected by drought. Waters and wetlands are important in regulating the regional microclimate, with vegetation having a strong ability to adapt to drought conditions (Liu et al., 2021), thus making them less affected by drought. Most of the regional vegetation types with weak positive correlation and negative correlation were located in the forest zone of the Greater Khingan Mountains (Figures 4, 5), with the forest ecological environment being relatively stable. Moreover, their root system can extend to the deep soil layer containing greater more water content, to absorb more water under low external water conditions (Davidson et al., 2000). Therefore, the changes caused by drought had the least impact on the forest. Some studies have found that the drought trend increased in the NRB (Zhang et al., 2019a), with some areas showing negative correlation possibly due to the early drought-like conditions stimulating their adaptation potential (Bose et al., 2020), which ultimately mitigates the negative effect of stronger drought conditions on NDVI. Additionally, the spring vegetation was in their early stage of growth, especially in Northeast China, where most of the natural vegetation does not begin to grow until late May (Sun et al., 2013). Furthermore, although the vegetation coverage was also relatively low, possibly due to the relatively small negative correlation area between NDVI and SPEI in the high-latitude basin (Fan et al., 2015), this relationship may change with the advance of the green period of natural vegetation.
Similar to the same period effect, the vegetation had a lagged period response to drought in the NRB. The areas with significant positive correlation between NDVI and the lagging SPEI in each month of the vegetation growing season were mainly distributed in the grasslands, saline land, and building land in the southwest and central and eastern parts of the basin (Figure 8). The vegetation types in these areas may be affected by both natural environment and strong man-made disturbance (Finger et al., 2013), thus causing the vegetation in this area to be affected by the delayed drought for about 1 month during the vegetation growing period. The areas with insignificant positive correlation mainly included cultivated vegetation, water areas, and wetlands, where the cultivated vegetation was positively affected by human activities (Wang et al., 2022b), and the water areas and wetlands play an important hydrological role in the landscape, thus helping reduce the drought impact (Endter-Wada et al., 2020). Therefore, this shows that the lag effect of drought had little effect on the growth of vegetation in the above-mentioned areas. The areas showing negative correlation were mainly distributed in the forests in the northwest of the basin (Figures 8, 9), which may be due to the well-developed roots of the forest vegetation, which can absorb water from the deep soil, along with the ability of leaves of some trees of storing water (Pritzkow et al., 2021). Since the lack of surface water caused by meteorological drought has little effect on it, the response of this region to lagging drought was weak, which was similar to the effect of the same period. The significant positive correlation area between autumn NDVI and summer SPEI was the largest, and was mainly distributed in the northeast (Baicheng, Songyuan, and Hinggan League) and the central (Qiqihar and Daqing) regions of the NRB. This indicates that the summer drought in the above-mentioned areas may inhibit the vegetation growth during autumn, which leads to insufficient water demand of autumn crops during their mature stage (Ramadas and Govindaraju, 2015), ultimately affecting the yield of crops.
Stability of vegetation under multi-scale drought
The vegetation growth is the key factor affecting the ecological environment quality of the whole basin, and is related to the natural environment of the basin and the development of human society and economy (Jiang et al., 2016). Especially under the significant impact of human activities on the earth’s surface ecological environment, drought has evolved into a “natural-human” compound disaster (Mishra et al., 2021). Therefore, under the dual influence of the natural environment and anthropogenic activities, the assessment of vegetation stability and its resistance and resilience to drought in the NRB will be highly significant in the understanding the degradation and restoration of vegetation caused by drought in the future (Ye et al., 2020).
Our study found that the vegetation-induced drought resistance of the cultivated vegetation and building land was the strongest in the NRB (Figure 11), which may be due to the positive impact of human management measures on these two types of land use (Abi et al., 2019; Grainger et al., 2021). The vegetation-induced drought resistance of the grassland and forest was better. While on the one hand, the reason for the better drought resistance of grassland may be related to the type of grassland vegetation in this area (Lei et al., 2020). However, on the other hand, the water loss caused by meteorological drought had little influence on the forest with a well-developed root system, which provides better drought resistance (Pritzkow et al., 2021). Furthermore, the drought resistance of vegetation in the water area was the weakest, possibly related to the recent decrease of both the water area and biodiversity (Ma et al., 2021). Generally, under the action of drought, the forest has strong resistance and resilience, which provides it with the highest stability and makes it the least affected by drought. The environmental adaptability of wetland vegetation was good, especially in the recent years, since the state has greatly promoted the protection of wetlands, along with an increase in the area of wetlands in NRB during the research period (Chen et al., 2020; Wu et al., 2020a), which has significantly promoted the growth and development of the wetland vegetation. It is worth noting that, although, the grassland has a certain degree of drought resistance, its drought resilience was weak. Therefore, under the dual effects of extreme drought years and man-made negative disturbances (overgrazing, farmland reclamation, and pandemic diseases), the difficulty and effect of grassland restoration will be hampered to a great extent. Additionally, since the grassland vegetation environment is related to the ecological security barrier and the development of modern animal husbandry (Zhang et al., 2021), the development of the grassland ecosystem is very important.
Prospects and limitation
This study reasonably shows the spatio-temporal change in the vegetation’s response characteristics to multi-time-scale drought in the study area. The results provide a rationale behind the vegetation protection strategy, vegetation response to climate change, and agricultural water resources allocation in the high-latitude watershed with “agriculture-wetland-forest” as the compound ecosystem.
We found that drought has a great impact on the growth of vegetation in the south of NRB, where there are large areas of farmlands and wetlands. A large number of studies have shown that the loss of natural wetlands is mainly caused by agricultural cultivation (Johnston, 2013; Song et al., 2014). In the late 1990s and early 2000s, large areas of natural wetlands were converted into farmlands in Northeast China (Mao et al., 2018). And some problems have also been found in wetland protection and farmland management. For example, the irrigation of rice cultivation has a great demand for water resources (Chen et al., 2015). Additionally, due to the large areas of soil salinization, the water supply of natural wetlands will face a great threat (Zhu et al., 2016). The protection of natural wetlands and the adjustment of agricultural structure need the continuous attention of the government. Therefore, how to coordinate the relationship between China’s natural wetland conservation and stable agricultural production will be an important part of sustainable development in the future.
In this study, it is found that multi-scale drought has little impact on the virgin forest in the northwest of NRB. However, the global climate change not only directly affects the vegetation itself, but also indirectly affects the forest ecosystem by changing external environmental factors (McDowell et al., 2020). Forest, as the largest carbon pool in terrestrial ecosystems, can mitigate the impact of climate change through carbon sequestration (Meng et al., 2022). Compared with new forestations, existing forests were the main source of carbon sequestration efficiency. We can take management measures such as fertilization, pest control, forest regeneration, young forest tending, pruning, thinning, harvesting mode selection and management of deadwood to enhance the capacity of forests to further sequester CO2 in NRB (Gao et al., 2011; Cai et al., 2022). One of the biggest hidden dangers of primeval forests is fire. Previous studies have found that climate warming would alter the fire status of forests by changing fire source patterns and occurrence probabilities in the boreal forests of Northeast China (Liu et al., 2012). In order to solve this problem, deciduous tree species may be planted properly to reduce the burn area (Huang et al., 2022). Furthermore, using long-term remote sensing monitoring system to improve a fast and effective early warning strategy in the high-frequency period of drought (Pu et al., 2019). In summary, for the sustainable development of the “agriculture-wetland-forest” complex ecosystems, it also needs the close cooperation of all departments to formulate effective protection strategies and establish lasting management mechanisms according to different seasons in different areas of the NRB.
However, there are still some shortcomings. Due to the tardiness of meteorological data, the drought trend results we obtained were less stable, making it necessary to expand the study time period to further verify the extent of drought in the NRB. We also discussed the impact of meteorological drought on vegetation change, but the soil moisture situation was not clear. Therefore, in the future research, we should combine meteorological drought and hydrological drought to explore the response mechanisms of vegetation change to drought.
Conclusion
In this study, using the NDVI and SPEI, we assessed the same and lagged period effects of drought on the NRB with a typical “agriculture-wetland-forest” integrated ecosystem at high latitudes during 2000–2019. We also explored the stability of vegetation under the action of drought. The main findings show that: at the monthly scale, the area with significant positive correlation between NDVI and SPEI was the largest in July, with it being mainly in the south of the NRB. Furthermore, In October, the area with significant positive correlation between the lagged effect of NDVI and SPEI was the largest, which was mainly distributed in the south and northeast of the NRB. At the seasonal and annual scales, the area with significant positive correlation between NDVI and SPEI was the largest in summer, and was mainly in the middle and south of the NRB. Spring NDVI showed the largest negative correlation to the lagged response of SPEI in the previous winter, which was widely distributed in the north and middle of the NRB. Under the action of drought, the stability of the forest was the highest, the drought resistance of the cultivated vegetation and building land was the strongest, and the drought resilience of the grassland was the worst in the NRB.
Data availability statement
The original contributions presented in the study are included in the article/supplementary material, further inquiries can be directed to the corresponding author.
Author contributions
GZ: methodology, software, data curation, writing—original draft, visualization. CZ: conceptualization, writing—review and editing, project administration, funding acquisition. ST: conceptualization, methodology. WZ: writing—review and editing. All authors contributed to the article and approved the submitted version.
Funding
This work was financially supported by the National Natural Science Foundation of China (grant no. 41830643), Jilin Provincial Basic Research Project of the Central Government Guided Local Funding for Science and Technological Development (grant no. 202002024JC).
Conflict of interest
The authors declare that the research was conducted in the absence of any commercial or financial relationships that could be construed as a potential conflict of interest.
Publisher’s note
All claims expressed in this article are solely those of the authors and do not necessarily represent those of their affiliated organizations, or those of the publisher, the editors and the reviewers. Any product that may be evaluated in this article, or claim that may be made by its manufacturer, is not guaranteed or endorsed by the publisher.
Footnotes
References
Abi, M., Kessler, A., Oosterveer, P., and Tolossa, D. (2019). Adapting the current mass mobilization approach in Ethiopia to enhance its impact on sustainable land management: lessons from the sago-kara watershed. J. Environ. Manag. 248:109336. doi: 10.1016/j.jenvman.2019.109336
Allen, R. G., Pereira, L. S., Raes, D., and Smith, M. (1998). Crop Evapotranspiration-Guidelines for Computing Crop Water Requirements-FAO Irrigation and Drainage Paper 56. Rome, Italy: FAO.
Beck, H. E., McVicar, T. R., van Dijk, A. I. J. M., Schellekens, J., de Jeu, R. A. M., and Bruijnzeel, L. A. (2011). Global evaluation of four AVHRR–NDVI data sets: intercomparison and assessment against Landsat imagery. Remote Sens. Environ. 115, 2547–2563. doi: 10.1016/j.rse.2011.05.012
Beguería, S., Vicente-Serrano, S. M., Reig, F., and Latorre, B. (2014). Standardized precipitation evapotranspiration index (SPEI) revisited: parameter fitting, evapotranspiration models, tools, datasets and drought monitoring. Int. J. Climatol. 34, 3001–3023. doi: 10.1002/joc.3887
Bose, A. K., Gessler, A., Bolte, A., Bottero, A., Buras, A., Cailleret, M., et al. (2020). Growth and resilience responses of Scots pine to extreme droughts across Europe depend on predrought growth conditions. Glob. Chang. Biol. 26, 4521–4537. doi: 10.1111/gcb.15153
Cai, W., He, N., Li, M., Xu, L., Wang, L., Zhu, J., et al. (2022). Carbon sequestration of Chinese forests from 2010 to 2060: spatiotemporal dynamics and its regulatory strategies. Sci. Bull. 67, 836–843. doi: 10.1016/j.scib.2021.12.012
Chen, L., Liu, S., Wu, Y., Xu, Y. J., Chen, S., Pang, S., et al. (2020). Does ecological water replenishment help prevent a large wetland from further deterioration? Results from the Zhalong nature reserve, China. Remote Sens. 12:3449. doi: 10.3390/rs12203449
Chen, H., Wang, G., Lu, X., Jiang, M., and Mendelssohn, I. A. (2015). Balancing the needs of China’s wetland conservation and Rice production. Environ. Sci. Technol. 49, 6385–6393. doi: 10.1021/es505988z
Cooley, S. S., Williams, C. A., Fisher, J. B., Halverson, G. H., Perret, J., and Lee, C. M. (2019). Assessing regional drought impacts on vegetation and evapotranspiration: a case study in Guanacaste, Costa Rica. Ecol. Appl. 29:e01834
Dai, A. (2013). Increasing drought under global warming in observations and models. Nat. Clim. Chang. 3, 52–58. doi: 10.1038/nclimate1633
Davidson, E. A., Verchot, L. V., Cattânio, J. H., Ackerman, I. L., and Carvalho, J. E. M. (2000). Effects of soil water content on soil respiration in forests and cattle pastures of eastern Amazonia. Biogeochemistry 48, 53–69. doi: 10.1023/A:1006204113917
Ding, Y., Xu, J., Wang, X., Cai, H., Zhou, Z., Sun, Y., et al. (2021). Propagation of meteorological to hydrological drought for different climate regions in China. J. Environ. Manag. 283:111980. doi: 10.1016/j.jenvman.2021.111980
Dong, L. Q., Zhang, G. X., and Xu, Y. J. (2012). Effects of climate change and human activities on runoff in the Nenjiang River basin, Northeast China. Hydrol. Earth Syst. Sci. Discuss. 2012, 11521–11549. doi: 10.5194/hessd-9-11521-2012
Du, H., Wu, Z., Zong, S., Meng, X., and Wang, L. (2013). Assessing the characteristics of extreme precipitation over Northeast China using the multifractal detrended fluctuation analysis. J. Geophys. Res. Atmos. 118, 6165–6174. doi: 10.1002/jgrd.50487
Endter-Wada, J., Kettenring, K. M., and Sutton-Grier, A. (2020). Protecting wetlands for people: strategic policy action can help wetlands mitigate risks and enhance resilience. Environ. Sci. Pol. 108, 37–44. doi: 10.1016/j.envsci.2020.01.016
Fan, D. Q., Zhu, W. Q., Zheng, Z. T., Zhang, D. H., Pan, Y. Z., Jiang, N., et al. (2015). Change in the green-up dates for Quercus mongolica in Northeast China and its climate-driven mechanism from 1962 to 2012. PLoS One 10:13. doi: 10.1371/journal.pone.0130516
Feng, X., Zhang, G., and Yin, X. (2011). Hydrological responses to climate change in Nenjiang River basin, northeastern China. Water Resour. Manag. 25, 677–689. doi: 10.1007/s11269-010-9720-y
Finger, R., Gilgen, A. K., Prechsl, U. E., and Buchmann, N. (2013). An economic assessment of drought effects on three grassland systems in Switzerland. Reg. Environ. Chang. 13, 365–374. doi: 10.1007/s10113-012-0346-x
Gao, G., Ding, G., Wang, H., Zang, Y., and Liang, W. (2011). China needs Forest management rather than reforestation for carbon sequestration. Environ. Sci. Technol. 45, 10292–10293. doi: 10.1021/es203897f
Ge, W., Deng, L., Wang, F., and Han, J. (2021). Quantifying the contributions of human activities and climate change to vegetation net primary productivity dynamics in China from 2001 to 2016. Sci. Total Environ. 773:145648.. doi: 10.1016/j.scitotenv.2021.145648
Gebremeskel Haile, G., Tang, Q., Leng, G., Jia, G., Wang, J., Cai, D., et al. (2020). Long-term spatiotemporal variation of drought patterns over the greater horn of Africa. Sci. Total Environ. 704:135299. doi: 10.1016/j.scitotenv.2019.135299
Gouveia, C. M., Trigo, R. M., Beguería, S., and Vicente-Serrano, S. M. (2017). Drought impacts on vegetation activity in the Mediterranean region: An assessment using remote sensing data and multi-scale drought indicators. Glob. Planet. Chang. 151, 15–27. doi: 10.1016/j.gloplacha.2016.06.011
Grainger, S., Murphy, C., and Vicente-Serrano, S. M. (2021). Barriers and opportunities for actionable knowledge production in drought risk management: embracing the Frontiers of co-production. Front. Environ. Sci. 9:602128. doi: 10.3389/fenvs.2021.602128
Guo, E., Liu, X., Zhang, J., Wang, Y., Wang, C., Wang, R., et al. (2017). Assessing spatiotemporal variation of drought and its impact on maize yield in Northeast China. J. Hydrol. 553, 231–247. doi: 10.1016/j.jhydrol.2017.07.060
Hao, Z., and Singh, V. P. (2015). Drought characterization from a multivariate perspective: a review. J. Hydrol. 527, 668–678. doi: 10.1016/j.jhydrol.2015.05.031
Hollunder, R. K., Mariotte, P., Carrijo, T. T., Holmgren, M., Luber, J., Stein-Soares, B., et al. (2021). Topography and vegetation structure mediate drought impacts on the understory of the south American Atlantic Forest. Sci. Total Environ. 766:144234. doi: 10.1016/j.scitotenv.2020.144234
Höpfner, C., and Scherer, D. (2011). Analysis of vegetation and land cover dynamics in North-Western Morocco during the last decade using MODIS NDVI time series data. Biogeosciences 8, 3359–3373. doi: 10.5194/bg-8-3359-2011
Huang, C., Feng, J., Tang, F., He, H. S., Liang, Y., Wu, M. M., et al. (2022). Predicting the responses of boreal forests to climate-fire-vegetation interactions in Northeast China. Environ. Model Softw. 153:105410. doi: 10.1016/j.envsoft.2022.105410
Huang, K., and Xia, J. (2019). High ecosystem stability of evergreen broadleaf forests under severe droughts. Glob. Chang. Biol. 25, 3494–3503. doi: 10.1111/gcb.14748
Ivits, E., Horion, S., Erhard, M., and Fensholt, R. (2016). Assessing European ecosystem stability to drought in the vegetation growing season. Glob. Ecol. Biogeogr. 25, 1131–1143. doi: 10.1111/geb.12472
Jia, K., Liang, S., Zhang, L., Wei, X., Yao, Y., and Xie, X. (2014). Forest cover classification using Landsat ETM+ data and time series MODIS NDVI data. Int. J. Appl. Earth Obs. Geoinf. 33, 32–38. doi: 10.1016/j.jag.2014.04.015
Jiang, W., Yang, S., Yang, X., and Gu, N. (2016). Negative impacts of afforestation and economic forestry on the Chinese loess plateau and proposed solutions. Quat. Int. 399, 165–173. doi: 10.1016/j.quaint.2015.04.011
Jiang, W., Yuan, L., Wang, W., Cao, R., Zhang, Y., and Shen, W. (2015). Spatio-temporal analysis of vegetation variation in the Yellow River Basin. Ecol. Indic. 51, 117–126. doi: 10.1016/j.ecolind.2014.07.031
Johnston, C. A. (2013). Wetland losses due to row crop expansion in the Dakota prairie pothole region. Wetlands 33, 175–182. doi: 10.1007/s13157-012-0365-x
Lei, T., Feng, J., Lv, J., Wang, J., Song, H., Song, W., et al. (2020). Net primary productivity loss under different drought levels in different grassland ecosystems. J. Environ. Manag. 274:111144. doi: 10.1016/j.jenvman.2020.111144
Leng, G., Tang, Q., and Rayburg, S. (2015). Climate change impacts on meteorological, agricultural and hydrological droughts in China. Glob. Planet. Chang. 126, 23–34. doi: 10.1016/j.gloplacha.2015.01.003
Li, C., Leal Filho, W., Yin, J., Hu, R., Wang, J., Yang, C., et al. (2018). Assessing vegetation response to multi-time-scale drought across inner Mongolia plateau. J. Clean. Prod. 179, 210–216. doi: 10.1016/j.jclepro.2018.01.113
Li, Y., Qin, Y., and Rong, P. (2022b). Evolution of potential evapotranspiration and its sensitivity to climate change based on the Thornthwaite, Hargreaves, and penman–Monteith equation in environmental sensitive areas of China. Atmos. Res. 273:106178. doi: 10.1016/j.atmosres.2022.106178
Li, L., She, D., Zheng, H., Lin, P., and Yang, Z.-L. (2020). Elucidating diverse drought characteristics from two meteorological drought indices (SPI and SPEI) in China. J. Hydrometeorol. 21, 1513–1530. doi: 10.1175/JHM-D-19-0290.1
Li, M., Yao, J., Guan, J., and Zheng, J. (2022a). Vegetation Browning trends in spring and autumn over Xinjiang, China, during the warming hiatus. Remote Sens. 14:1298. doi: 10.3390/rs14051298
Liu, Z., Yang, J., Chang, Y., Weisberg, P. J., and He, H. S. (2012). Spatial patterns and drivers of fire occurrence and its future trend under climate change in a boreal forest of Northeast China. Glob. Chang. Biol. 18, 2041–2056. doi: 10.1111/j.1365-2486.2012.02649.x
Liu, S., Zhang, Y., Cheng, F., Hou, X., and Zhao, S. (2017). Response of grassland degradation to drought at different time-scales in Qinghai Province: Spatio-temporal characteristics, correlation, and implications. Remote Sens. 9:1329. doi: 10.3390/rs9121329
Liu, F., Zhang, Y., Liang, H., and Gao, D. (2021). Resilience of methane cycle and microbial functional genes to drought and flood in an alkaline wetland: a metagenomic analysis. Chemosphere 265:129034. doi: 10.1016/j.chemosphere.2020.129034
Ma, F., Chen, J., Chen, J., Wang, T., Han, L., Zhang, X., et al. (2021). Evolution of the hydro-ecological environment and its natural and anthropogenic causes during 1985–2019 in the Nenjiang River basin. Sci. Total Environ. 799:149256. doi: 10.1016/j.scitotenv.2021.149256
Mao, D., Luo, L., Wang, Z., Wilson, M. C., Zeng, Y., Wu, B., et al. (2018). Conversions between natural wetlands and farmland in China: a multiscale geospatial analysis. Sci. Total Environ. 634, 550–560. doi: 10.1016/j.scitotenv.2018.04.009
McDowell, N. G., Allen, C. D., Anderson-Teixeira, K., Aukema, B. H., Bond-Lamberty, B., Chini, L., et al. (2020). Pervasive shifts in forest dynamics in a changing world. Science 368:eaaz9463. doi: 10.1126/science.aaz9463
Meng, Y., Zhang, Y., Li, C., Wang, Z., and Li, Y. (2022). The effect of thinning management on the carbon density of the tree layers in larch–birch mixed natural secondary forests of the greater Khingan range, Northeastern China. Forests 13:1035. doi: 10.3390/f13071035
Mishra, A., Bruno, E., and Zilberman, D. (2021). Compound natural and human disasters: managing drought and COVID-19 to sustain global agriculture and food sectors. Sci. Total Environ. 754:142210. doi: 10.1016/j.scitotenv.2020.142210
Nanzad, L., Zhang, J., Tuvdendorj, B., Nabil, M., Zhang, S., and Bai, Y. (2019). NDVI anomaly for drought monitoring and its correlation with climate factors over Mongolia from 2000 to 2016. J. Arid Environ. 164, 69–77. doi: 10.1016/j.jaridenv.2019.01.019
Nichol, J. E., and Abbas, S. (2015). Integration of remote sensing datasets for local scale assessment and prediction of drought. Sci. Total Environ. 505, 503–507. doi: 10.1016/j.scitotenv.2014.09.099
Pritzkow, C., Szota, C., Williamson, V., and Arndt, S. K. (2021). Previous drought exposure leads to greater drought resistance in eucalypts through changes in morphology rather than physiology. Tree Physiol. 41, 1186–1198. doi: 10.1093/treephys/tpaa176
Pu, L., Zhang, S., Yang, J., Yan, F., and Chang, L. (2019). Assessment of high-standard farmland construction effectiveness in Liaoning Province during 2011–2015. Chin. Geogr. Sci. 29, 667–678. doi: 10.1007/s11769-019-1061-z
Qi, P., Xia, Z., Zhang, G., Zhang, W., and Chang, Z. (2021). Effects of climate change on agricultural water resource carrying capacity in a high-latitude basin. J. Hydrol. 597:126328. doi: 10.1016/j.jhydrol.2021.126328
Ramadas, M., and Govindaraju, R. S. (2015). Probabilistic assessment of agricultural droughts using graphical models. J. Hydrol. 526, 151–163. doi: 10.1016/j.jhydrol.2014.09.026
Shi, S., Yu, J., Wang, F., Wang, P., Zhang, Y., and Jin, K. (2021). Quantitative contributions of climate change and human activities to vegetation changes over multiple time scales on the loess plateau. Sci. Total Environ. 755:142419. doi: 10.1016/j.scitotenv.2020.142419
Song, K., Wang, Z., Du, J., Liu, L., Zeng, L., and Ren, C. (2014). Wetland degradation: its driving forces and environmental impacts in the Sanjiang plain, China. Environ. Manag. 54, 255–271. doi: 10.1007/s00267-014-0278-y
Sun, Q.-Q., Shi, K., Damerell, P., Whitham, C., Yu, G.-H., and Zou, C.-L. (2013). Carbon dioxide and methane fluxes: seasonal dynamics from inland riparian ecosystems, Northeast China. Sci. Total Environ. 465, 48–55. doi: 10.1016/j.scitotenv.2013.01.036
Tong, S., Zhang, J., Bao, Y., Wurina, T., and Weilisi, L. (2017). Spatial and temporal variations of vegetation cover and the relationships with climate factors in Inner Mongolia based on GIMMS NDVI3g data. J. Arid. Land 9, 394–407. doi: 10.1007/s40333-017-0016-4
Van Ruijven, J., and Berendse, F. (2010). Diversity enhances community recovery, but not resistance, after drought. J. Ecol. 98, 81–86. doi: 10.1111/j.1365-2745.2009.01603.x
Vicente-Serrano, S. M., Gouveia, C., Camarero, J. J., Beguería, S., Trigo, R., López-Moreno, J. I., et al. (2013). Response of vegetation to drought time-scales across global land biomes. Proc. Natl. Acad. Sci. 110, 52–57. doi: 10.1073/pnas.1207068110
Wang, W., Li, J., Qu, H., Xing, W., Zhou, C., Tu, Y., et al. (2022b). Spatial and temporal drought characteristics in the Huanghuaihai plain and its influence on cropland water use efficiency. Remote Sens. 14:2381. doi: 10.3390/rs14102381
Wang, S., Li, R., Wu, Y., and Zhao, S. (2022a). Effects of multi-temporal scale drought on vegetation dynamics in Inner Mongolia from 1982 to 2015, China. Ecol. Indic. 136:108666. doi: 10.1016/j.ecolind.2022.108666
Wang, W., Wang, J., Liu, X., Zhou, G., and Yan, J. (2016). Decadal drought deaccelerated the increasing trend of annual net primary production in tropical or subtropical forests in southern China. Sci. Rep. 6:28640. doi: 10.1038/srep28640
Wen, Y., Liu, X., Xin, Q., Wu, J., Xu, X., Pei, F., et al. (2019). Cumulative effects of climatic factors on terrestrial vegetation growth. J. Geophys. Res. Biogeo. 124, 789–806. doi: 10.1029/2018JG004751
Wu, Z., Lv, H., Meng, Y., Guan, X., and Zang, Y. (2021). The determination of flood damage curve in areas lacking disaster data based on the optimization principle of variation coefficient and beta distribution. Sci. Total Environ. 750:142277. doi: 10.1016/j.scitotenv.2020.142277
Wu, Y., Zhang, G., Rousseau, A. N., and Xu, Y. J. (2020a). Quantifying streamflow regulation services of wetlands with an emphasis on quickflow and baseflow responses in the upper Nenjiang River basin, Northeast China. J. Hydrol. 583:124565. doi: 10.1016/j.jhydrol.2020.124565
Wu, Y., Zhang, G., Rousseau, A. N., Xu, Y. J., and Foulon, É. (2020b). On how wetlands can provide flood resilience in a large river basin: a case study in Nenjiang river basin, China. J. Hydrol. 587:125012. doi: 10.1016/j.jhydrol.2020.125012
Wu, D., Zhao, X., Liang, S., Zhou, T., Huang, K., Tang, B., et al. (2015). Time-lag effects of global vegetation responses to climate change. Glob. Chang. Biol. 21, 3520–3531. doi: 10.1111/gcb.12945
Xia, J., Chen, J., Piao, S., Ciais, P., Luo, Y., and Wan, S. (2014). Terrestrial carbon cycle affected by non-uniform climate warming. Nat. Geosci. 7, 173–180. doi: 10.1038/ngeo2093
Xu, H.-J., Wang, X.-P., Zhao, C.-Y., and Yang, X.-M. (2018). Diverse responses of vegetation growth to meteorological drought across climate zones and land biomes in northern China from 1981 to 2014. Agric. For. Meteorol. 262, 1–13. doi: 10.1016/j.agrformet.2018.06.027
Xu, H.-J., Wang, X.-P., Zhao, C.-Y., and Zhang, X.-X. (2019). Responses of ecosystem water use efficiency to meteorological drought under different biomes and drought magnitudes in northern China. Agric. For. Meteorol. 278:107660. doi: 10.1016/j.agrformet.2019.107660
Ye, Z.-X., Cheng, W.-M., Zhao, Z.-Q., Guo, J.-Y., Yang, Z.-X., Wang, R.-B., et al. (2020). Spatio-temporal characteristics of drought events and their effects on vegetation: a case study in southern Tibet, China. Remote Sens. 12:4174. doi: 10.3390/rs12244174
Zhang, R., Chen, Z.-Y., Xu, L.-J., and Ou, C.-Q. (2019b). Meteorological drought forecasting based on a statistical model with machine learning techniques in Shaanxi province, China. Sci. Total Environ. 665, 338–346. doi: 10.1016/j.scitotenv.2019.01.431
Zhang, Q., Kong, D., Singh, V. P., and Shi, P. (2017). Response of vegetation to different time-scales drought across China: spatiotemporal patterns, causes and implications. Glob. Planet. Chang. 152, 1–11. doi: 10.1016/j.gloplacha.2017.02.008
Zhang, Y., Liu, L.-Y., Liu, Y., Zhang, M., and An, C.-Y. (2021). Response of altitudinal vegetation belts of the Tianshan Mountains in northwestern China to climate change during 1989–2015. Sci. Rep. 11:4870. doi: 10.1038/s41598-021-84399-z
Zhang, L., Xiao, J., Zhou, Y., Zheng, Y., Li, J., and Xiao, H. (2016). Drought events and their effects on vegetation productivity in China. Ecosphere 7:e01591. doi: 10.1002/ecs2.1591
Zhang, L., Yao, Y., Bei, X., Jia, K., Zhang, X., Xie, X., et al. (2019a). Assessing the remotely sensed evaporative drought index for drought monitoring over Northeast China. Remote Sens. 11:1960. doi: 10.3390/rs11171960
Zhao, M., and Running, S. W. (2010). Drought-induced reduction in global terrestrial net primary production from 2000 through 2009. Science 329, 940–943. doi: 10.1126/science.1192666
Zhao, Z., Wang, H., Yu, C., Deng, C., Liu, C., Wu, Y., et al. (2020b). Changes in spatiotemporal drought characteristics over Northeast China from 1960 to 2018 based on the modified nested copula model. Sci. Total Environ. 739:140328. doi: 10.1016/j.scitotenv.2020.140328
Zhao, D., and Wu, S. (2014a). Responses of vegetation distribution to climate change in China. Theor. Appl. Climatol. 117, 15–28. doi: 10.1007/s00704-013-0971-4
Zhao, D., and Wu, S. (2014b). Vulnerability of natural ecosystem in China under regional climate scenarios: an analysis based on eco-geographical regions. J. Geogr. Sci. 24, 237–248. doi: 10.1007/s11442-014-1085-3
Zhao, A., Yu, Q., Feng, L., Zhang, A., and Pei, T. (2020a). Evaluating the cumulative and time-lag effects of drought on grassland vegetation: a case study in the Chinese loess plateau. J. Environ. Manag. 261:110214. doi: 10.1016/j.jenvman.2020.110214
Keywords: vegetation change, drought, same period effect, lagged period effect, vegetation stability, high-latitude basin
Citation: Zhu G, Zhao C, Tong S and Zhu W (2022) Response of vegetation dynamic change to multi-scale drought stress in the high-latitude Nenjiang River basin in China. Front. Ecol. Evol. 10:1074199. doi: 10.3389/fevo.2022.1074199
Edited by:
Mathew Kurian, Texas A&M University, United StatesCopyright © 2022 Zhu, Zhao, Tong and Zhu. This is an open-access article distributed under the terms of the Creative Commons Attribution License (CC BY). The use, distribution or reproduction in other forums is permitted, provided the original author(s) and the copyright owner(s) are credited and that the original publication in this journal is cited, in accordance with accepted academic practice. No use, distribution or reproduction is permitted which does not comply with these terms.
*Correspondence: Chunzi Zhao, Y3p6aGFvQHlidS5lZHUuY24=; Shouzheng Tong, dG9uZ3Nob3V6aGVuZ0BpZ2EuYWMuY24=
 Guanglei Zhu
 Chunzi Zhao1,3*
 Shouzheng Tong