 Yue Ren
 Yu Chen
 Dongmei Chen
95% of researchers rate our articles as excellent or good
Learn more about the work of our research integrity team to safeguard the quality of each article we publish.
Find out more
ORIGINAL RESEARCH article
Front. Ecol. Evol. , 16 January 2023
Sec. Conservation and Restoration Ecology
Volume 10 - 2022 | https://doi.org/10.3389/fevo.2022.1072015
This article is part of the Research Topic Managing Open Ecosystems for Biodiversity Conservation, Livelihood Improvement and Climate Change Mitigation View all 5 articles
In the context of global warming and the continued increase in greenhouse gas emissions, the expansion of the global arid and semi-arid zones will accelerate, and there will be a risk of further land degradation. Changes in land use are one of the human activities that cause the increase in CO2 concentration in the global atmosphere. This article takes Helan Mountain as the research object which is located in the arid and semi-arid regions. It analyzes the spatial and temporal effects of land use changes, ecosystem service value, and ecological risk of land use in Helan Mountain by using GIS technology and five periods of land use data in 2000, 2005, 2010, 2015, and 2020. The study results show the following: First, due to land use changes in the arid and semi-arid zones, grasslands lost the largest area (in total 50,407.11 ha) during the study period. Construction land is the highest dynamic land type that increased by 22,364.73 ha. Land use generally shows a trend of increasing before decreasing, with an inevitable increase in the degree of utilization. Second, the total ecosystem service value decreased by 0.1148 million yuan from 5,674.5490 to 5,674.6638 million yuan, which shows a slight change in the overall ecosystem service value. Third, the ecological risk of land use could be divided into five classes, with a transformation characteristic from high and low ecological risk to comparatively high, medium, and comparatively low ecological risk. Fourth, the western side of Helan Mountain is the principal supply area for ecosystem services in the entire study area, which is an area with high-grade ecological risk at the same time. The vulnerability and importance of this area need to be given high priority. This study will provide spatial guidelines for the protection and restoration of ecological security issues such as environmental damage and land degradation in the arid and semi-arid regions of the mountains.
With a dry climate and annual precipitation below 400 mm, the arid and semi-arid zones (Zhou and Huang, 2008; Singh and Chudasama, 2021) have a very fragile ecosystem, where there is a major distribution area of ecological and environmental problems such as soil salinization, pasture degradation, and land sanding (Bourgoud, 2017), where there is also the key implementation area for several ecological projects in China (Mao et al., 2018). The mountains are an important geographical space where multiple elements such as land, biology, water, landscape, and minerals overlap (Huang et al., 2015). The over-exploitation and irrational use of various resources in the mountainous space, driven by economic interests, have exacerbated the vulnerability and instability of mountain ecosystems in arid and semi-arid areas (Thakur et al., 2021), making the task of ecological and environmental protection even more severe. With the interference of human activities, changes in land use could affect the mountain ecosystem significantly, leading to a series of ecological risks (Leman et al., 2016) and ecosystem service function decline such as land degradation and soil erosion (Jat et al., 2008; Bryan et al., 2018). Ecosystem service refers to the conditions and processes to meet and maintain human survival and livelihoods that consist of ecosystems and their species composition (Egoh et al., 2007; Vihervaara et al., 2010). The value assessment of ecosystem service is an essential prerequisite for the rational use and management of ecosystems by humans (Bateman et al., 2010), as well as an essential foundation for ecological and environmental protection, ecological function zoning, and ecological compensation (Daily et al., 2000). The structure, processes, and functions of ecosystems can be influenced by changes in land use. As a consequence, the service value of the ecosystem could be affected further (Makwinja et al., 2021; Belay et al., 2022).
Many scholars have researched ecosystem service values extensively, and the value accounting methods are summarized into three categories. Costanza et al. (1998) was the first to assess global ecosystem service values in 1997, who determined the assessment methods, principles, and scientific significance based on the factor of ecosystem value equivalent per unit area. Based on Costanza's research, Xie et al. (2008, 2015) proposed a Chinese ecosystem service value equivalent combined with the reality of the time and using the expert survey method. Ouyang et al. (1999a,b) modeled the ecosystem service function of a small area by establishing the productivity equation between a single service function and local ecological environment variables, using the amount of ecosystem service functions and unit prices to obtain the total value, forming an assessment method based on the value of the unit service function. Odum et al. (1987) took the energy value as the benchmark and converted different types of non-comparable energy into the energy value of the same standard that can be measured and analyzed. It is a non-monetary approach to valuing ecosystem services. However, there are few studies on small-scale, long-term ecosystem service valuation as well as the spatial and temporal relationships of related factors in mountain ecosystems of arid and semi-arid climates. This study would enrich that part of the research.
As one of the essential natural geographical and climatic dividing lines in China (Deng et al., 2006), Helan Mountain has been the last ecological security barrier in the northwest region (Zhou et al., 2019), which is an important flora and fauna reserve as well as biological carbon sequestration area that is concentrating endemic and rare plants, precious species, and growing dense plants, where there is also a vital water connotation area for water recharging and long flowing water supplying in northern Ningxia (Sciences, 2020). Helan Mountain is rich in species and coal resources, and it is a famous pond salt production area in China as well. However, the long-term rough development, predatory exploitation of resources, and disorderly development of the mining industry have led to severe damage to the mineral geological environment, extinction of wildlife, and serious wind erosion of the land. Under the influence of the climatic environment, it is difficult to restore natural vegetation, and land degradation would be worse and worse, which results in a tendency of imbalance in the ecosystem. This study uses five periods of 30-m land use raster data as the fundamental data source, to analyze the spatial change characteristics of land use from 2000 to 2020, to explore the ecosystem service value in Helan Mountain, and to further research on the spatial and temporal pattern evolution of ecological risks. It provides a scientific and reasonable spatial reference for the spatial ecological restoration and management of Helan Mountain as well as similar climatic regions.
Helan Mountain (Figure 1) is located on the border between the Ningxia Hui Autonomous Region and the Inner Mongolia Autonomous Region. This is a temperate arid and semi-arid regions, in cold desert climate class (Mamtimin et al., 2011) as well, bordering and transitioning between grassland and desert. It is 1,084–3,556 meters above sea level. The mountain range runs nearly north-south, with a length of 220 km from north to south and a width of about 24–40 km from east to west. The eastern slope is windy, and the wind speed is high, especially in the upper part of the mountain. The vegetation is mainly spruce and oleander, as well as other species are mountain poplar, mountain elm, birch, and many kinds of wild fruit trees and shrubs, but the general vegetation coverage is low. According to the exploration census for coal, the coalfield was found with nine layers of coal, and the mining area is more than 40 square kilometers with a storage capacity of ~1.5 billion tons (about 570–770 yuan per ton). Since 2017, the local government has been taking measures to defend the ecology of Helan Mountain, successively implementing environmental restoration projects such as the clean-up and remediation of human activity sites, and the comprehensive improvement of ecological environment sites.
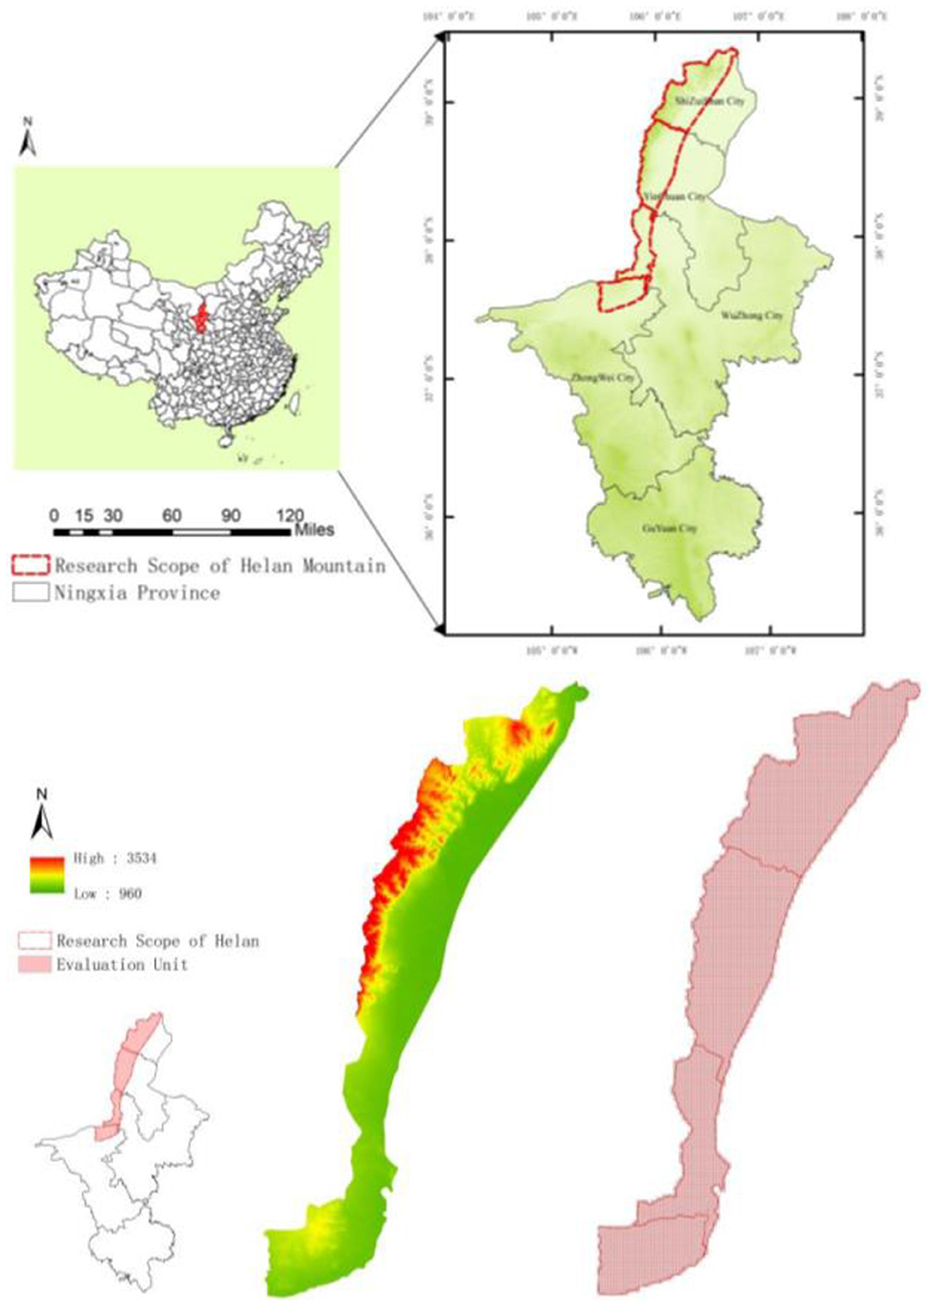
Figure 1. Study area location and evaluation unit delineation map.
The study area of this article is Helan Mountain and its front extension area in Ningxia, covering an area of 550,102 ha, involving four administrative regions of Ningxia. The land use data and related socio-economic data from 2000 to 2020 were obtained, and the data and descriptions are shown in Table 1. The vector data processing tool is ArcGIS10.7. The land use types are subdivided into seven categories: impervious, forest, shrubs, grassland, barren, water, and cropland, according to the Guidelines of China's Land and Sea Classification in Land Spatial Survey, Planning and Use Control (Ministry of Natural Resources of the People's Republic of China (MNR of PRC), 2020), and in line with the actual situation of the study.
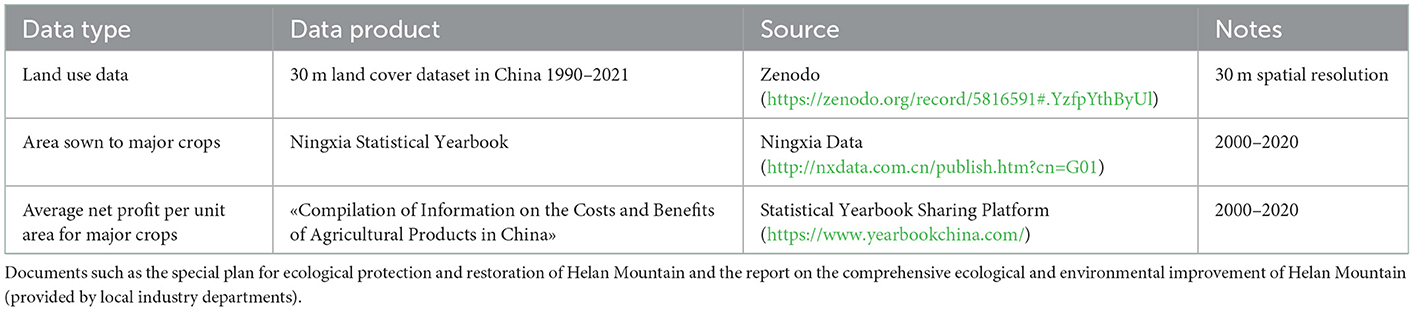
Table 1. Data sources.
The 1 * 1 km grids of evaluation cells were chosen to construct a fishnet for Helan Mountain land use types based on the fine scale of this study, yielding 5,869 evaluation cells (Figure 1). Calculating the value of ecosystem services and the ecological risk index in the study area for the past 20 years based upon the equivalent factor method, the centroid assignment method was adopted for spatial interpolation, and the spatial and temporal effects were analyzed through visualization.
Land use dynamics refers to the quantitative changes in land use types within a certain period. It reflects regional differences between the degree and the rate of land use change, which could be divided into single land use dynamics and integrated land use dynamics. The formulas are as follows.
Single land use dynamics:
K is the dynamic attitude of a land use type during the study period; Ua is a land use type at the beginning; Ub is the land use type at the end; T is the length of the study.
Integrated land uses dynamics:
Lc is the integrated dynamic attitude of land use in the study area. LUi is the area of land use type I at the beginning. ΔLUi−j is the absolute value of the area of land converted from type I to type j within the study time. T is the study time.
The degree of land use is the influence of human activities on land, which can visually reflect the intensity and efficiency of regional land use and has positive effect on the spatio-temporal comparison of land use changes. The formula is as follows:
L is the land use degree index; Ai is the proportion of the land area of type I; Ci is the number of land use degree classes of type I; n is the number of land types.
According to the characteristics of the study area and relevant literature references (Zhuang and Liu, 1997; Chen and Jie, 2021), land use classifications required for this study were established according to the land use types. There were seven land use types that could be classified into four categories. The first classification includes Barren; the second includes forest, grassland, shrub, and water; the third includes cropland; and the fourth includes impervious.
In this study, the equivalent factor method of ecosystem value per unit area put forward by Costanza and Gaodi Xie was used, which has the advantages of small amount of data, simple operation, high applicability in practical application, and strong repeatability.
The value of the ecosystem service accounting model is as follows:
ESVk and ESV are the service value and total service value of type k, respectively. Ak is the land area of type k, and VCk is the value coefficient representing the service value per unit area of type k. VCk value coefficient is the product of the value of one standard equivalent factor times the ecological service value equivalent per unit area of type k (Xie et al., 2008, 2015).
The food production of agroecosystem's net profit per unit area is used as the value quantity of ecosystem services for one standard equivalent factor. The value of food production in agroecosystem is calculated based on the three main food products: rice, wheat, and corn. The formula is as follows:
D represents the value of ecosystem services for one standard equivalent factor (yuan per hectare). Sr, Sw, and Sc express the percentage (%) of the three grain areas with rice, wheat, and corn in a given year separately. Fr, Fs, and Fc represent the average net profit per unit area of rice, wheat, and corn nationwide in a given year separately (yuan per hectare).
To verify the representativeness of the land use types and the accuracy of the ecological value coefficients, the ecosystem value sensitivity index (CS) was introduced based on Costanza's model, considering that elements such as human activities, climate, and altitude would influence the biomass of mountain ecosystems. During verification, the influence should be appropriately enhanced and the selection scope should be expanded as much as possible to ensure reliability. Suppose that half factors of mountain ecosystem biomass come from the external environment, a coefficient tolerance of 50% was adjusted up and down for the eight land categories to calculate the sensitivity, thus indicating how sensitive the ESV is to VC. When CS > 1, it shows that ESV is elastic to VC, and the accounting of ESV's value volume is invalid; when CS < 1, it means that ESV is inelastic to VC, and the value coefficient is credible. The formula is as follows:
CS is the ecosystem value sensitivity index of land use type I. ESVi is the initial ecosystem service value of the land. ESVj is the adjusted ecosystem service value. VCik is the initial ecosystem service value coefficient of the land use type k. VCjk is the adjusted ecosystem service value coefficient of the land use type k.
The behavior and degree of human activities vary among land use types, affecting the ecological service function and value. Generally speaking, the ecological service value of impervious is low, followed by agricultural land and grassland, and the value of forest and water is high (Guo et al., 2022; Lin et al., 2022). The ecological risk of the study area is influenced by the degree of landscape disturbance and fragility (Lv et al., 2021; Guo et al., 2022). Its status can be reflected by studying the spatial combination ratio of different land use types, and the land use ecological risk index can be constructed, evaluating the risk of loss of ecological service function in the study area and comparing differences among each unit's ecological risks. The formula is as follows:
ERIa is the ecological risk value of land use in the a-th evaluation cell. Sai is the area of land use type I in the a-th evaluation cell. Sa is the area of the a-th evaluation cell, and Ri is the ecological risk parameter of the i-th land use type.
Among them, the Ri ecological risk parameter is influenced by both natural factors and human activities. The formula is as follows:
Ei is the landscape disturbance index, and Fi is the landscape vulnerability index.
(i) The landscape disturbance index reflects the external disturbance degree of the ecosystems represented by different land use types. The greater the degree of disturbance, the higher the ecological risk. Based on the landscape pattern analysis, the index reflects the disturbance degree of different land use types by superimposing the relevant indices. The formula is as follows:
Ci is the landscape fragmentation index. Ni is the landscape separation index. Di is the landscape dominance index. Ni is the number of patches of landscape type I. Ai is the total area of landscape type I. A is the total area of the landscape. Qi = the number of quadrats of patch I occur/total number of quadrats. Mi = the number of patch I/total number of patches. Li = the area of patch I/total area of quadrats. The three indicators (a, b, and c) are the weights of Ci, Ni, and Di, respectively, and a+b+c = 1. According to the relevant references (Hu et al., 2011) and experts' opinions, the three indicators a, b, and c are assigned weights of 0.5, 0.3, and 0.2, respectively.
(ii) Landscape vulnerability refers to the vulnerability of the ecosystem internal structure that different land use represented, reflecting the resistance to external disturbances among different land use types. The lower the resistance to external disturbance, the greater the vulnerability and ecological risk. Based on the actual situation in the study area and relevant literature references (Liu et al., 2019), the expert scoring method is used to classify the vulnerability of the landscape types into seven classes for Helan Mountain. Assigning vulnerability values for different land use types, cropland is 7, grassland is 6, barren is 5, shrub is 4, forest is 3, water is 2, and impervious is 1.
Landscape vulnerability was normalized using an inverse tangent function to map the ecological landscape vulnerability number to [0,1]. The seven Fi landscape vulnerability index values for the study area were obtained after processing: 0.9097, 0.8949, 0.8743, 0.8440, 0.7952, 0.7048, and 0.5. The inverse tangent function equation is as follows.
Based on China's 30-m land cover dataset from 1990 to 2021, seven land use types were extracted, and the spatial change pattern of land use in Helan Mountain from 2000 to 2020 was obtained with GIS technical support (Figure 2). Concerning Equations 1–3, the land use change in Helan Mountain from 2000 to 2020 was calculated (Table 2). In terms of spatial changes, the spatial changes in barren, impervious, water, and cropland are the most obvious. Among them, the area of barren increases on the west side of the upper section, the west side of the middle section, and the east side of the middle and lower sections of Helan Mountain gradually. Only the area on the east side of the upper section decreases gradually. It is showing the spatial distribution characteristics of scattering to clustering, increasing the acreage as well. The impervious is mainly concentrated in the east side of the middle section of Helan Mountain, with the trend of clustering and spreading. The water area increases on the east side of the upper section gradually. The cropland is generally stable, with some new extensions on the western side of the bottom section. From the data statistics, the area of impervious increased by 22,364.73 ha between 2000 and 2020, with a dynamic attitude of 8.13%, which is the land type with the most significant change in land area and dynamic attitude. The dynamic attitude of land use in descending order is as follows: impervious (8.13%) > water area (7.18%) > shrubs (3.9%) > cropland (0.84%) > grassland (0.71%) > barren (0.57%) > forest land (0.13%). The dimension of cropland, forest land, water area, and impervious in the study area continued to increase, by 16,877.43, 344.61, 3,527.37, and 22,364.73 ha, respectively. The dimension of shrubs continued to decrease by 7.02 ha. The dimension of grassland increased first and then decreased by 50,470.11 ha. The dimension of barren decreased first and then increased by 7,396.38 ha. The overall land use degree of each category in the five periods was 211.48, 218.3, 223.21, 221.95, and 221.33, showing a tendency to increase and then decrease.
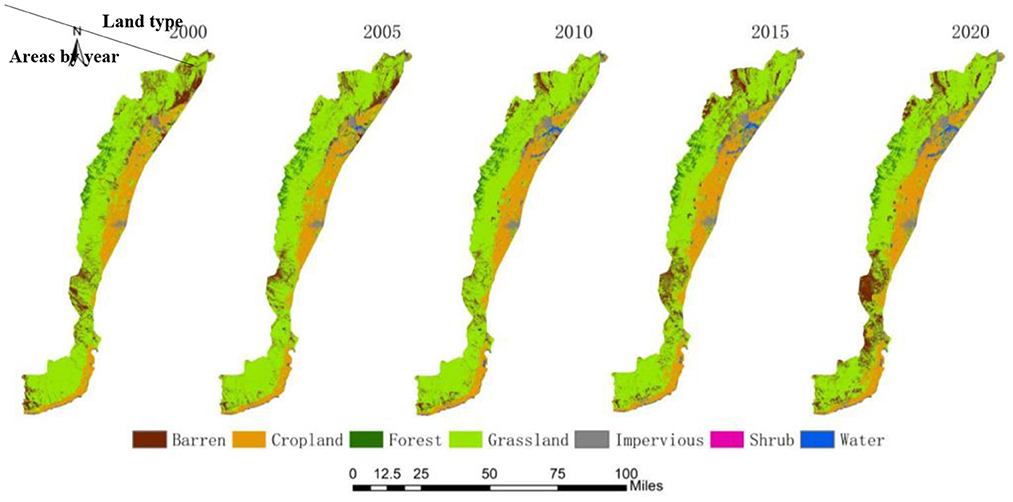
Figure 2. Spatial pattern changes in land use in Helan Mountain from 2000 to 2020.
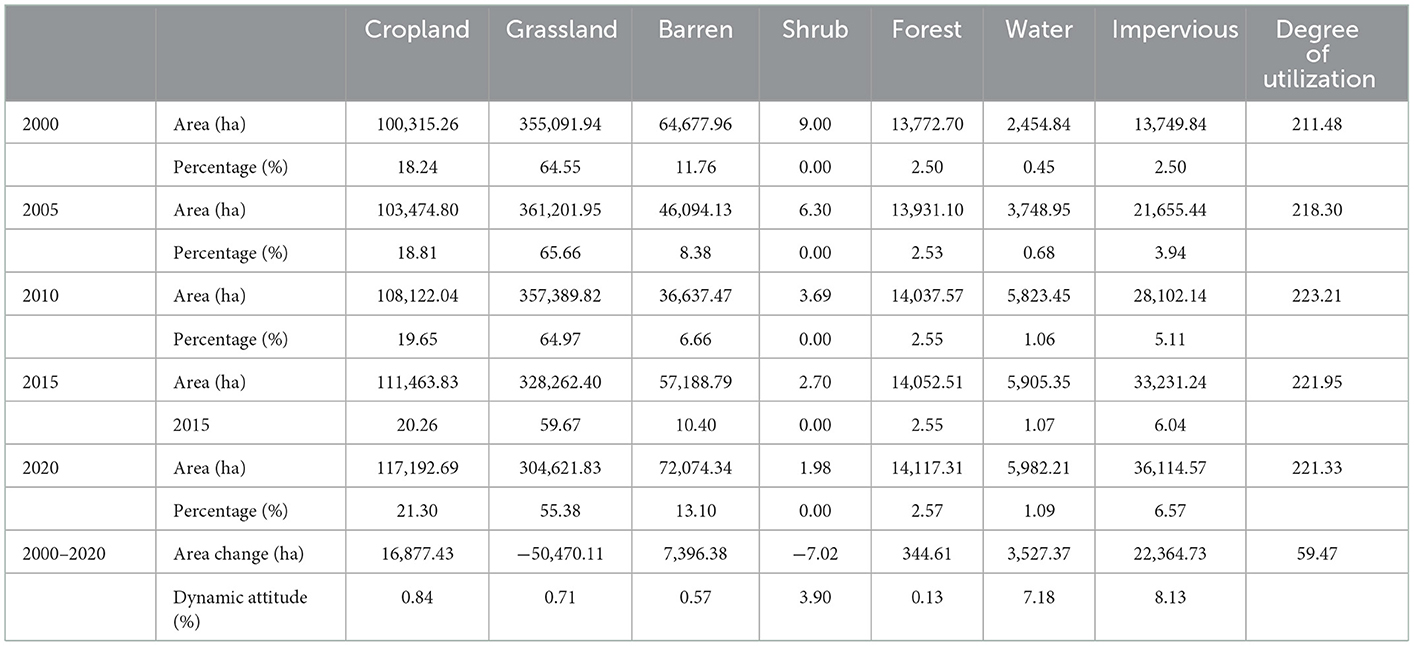
Table 2. Summary table of land use changes in Helan Mountain from 2000 to 2020.
According to the Ningxia Statistical Yearbook and Compilation of Information on the Costs and Benefits of Agricultural Products in China, the ecosystem service value of the equivalent factor in the study area of Helan Mountain was calculated as 1,049.88 yuan per hectare by Equation 6. Relying on the Chinese terrestrial ecosystem service value equivalent in the unit area table of Gaodi Xie, the ecological service value per unit area for each type of the ecosystem in Helan Mountain from 2000 to 2020 was obtained (Table 3).
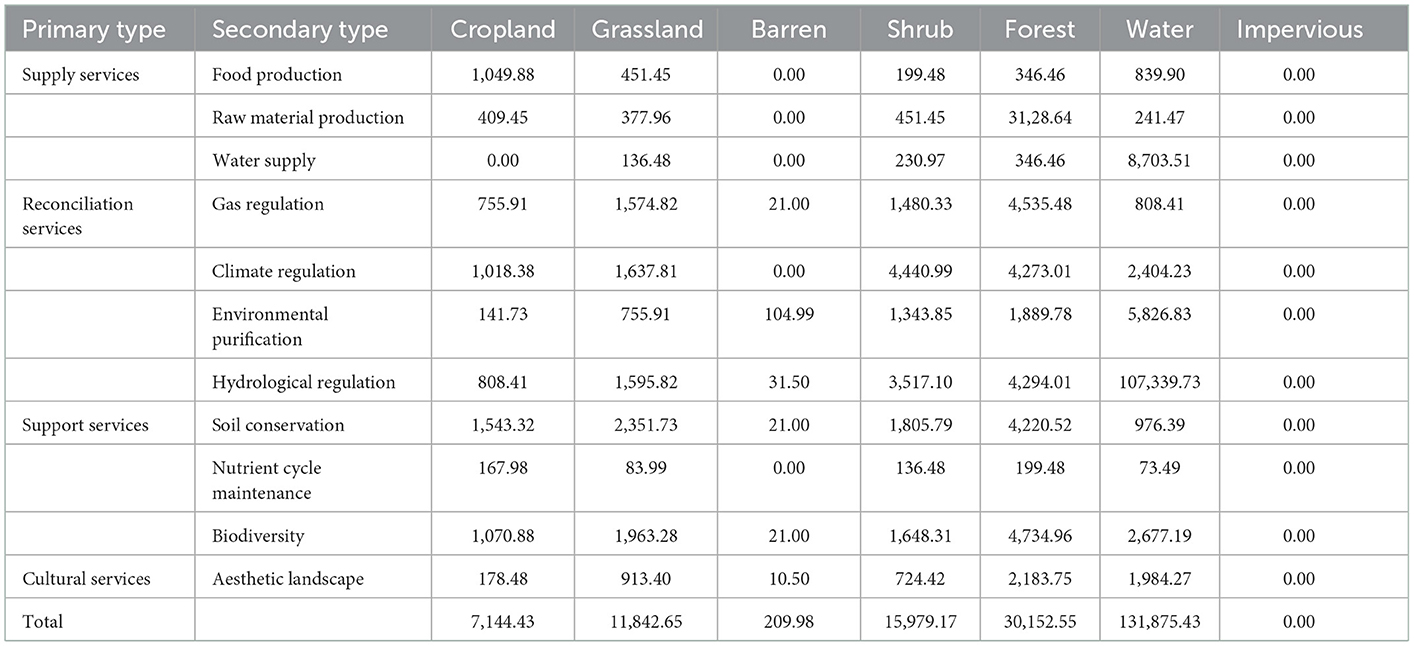
Table 3. Average value of ecological services per unit area of various ecosystems in Helan Mountain from 2000 to 2020 (yuan per hectare).
The accuracy of the ecological service value coefficient was verified according to Equation 7, and the ecological value coefficient of each land use category was adjusted up and down by 50%. Moreover, the total ecosystem service value of the study area was estimated by applying the ecological value coefficient before and after adjustment, getting the ecological value sensitivity index (Table 4). The calculation results showed that the ecological sensitivity index of each land use category was < 1, among which the sensitivity index of grassland was relatively high from 0.6357 to 0.7411, that is, when the ecological value coefficient of grassland increased by 1%, the total ecosystem service value (ESV) would increase by 0.6357 to 0.7411 percentage points; the sensitivity index of ecological value for all other land types converged to 0.1, that is, the total ecosystem service value would increase by 0.1 percentage point when the ecological value coefficient increased by 1%. It indicates that ESV is inelastic to VC in the study area, and the calculated value coefficients of the average ecological service value per unit area of each ecosystem type in Helan Mountain from 2000 to 2020 are plausible.

Table 4. Sensitivity index of ecosystem service value in Helan Mountain from 2000 to 2020.
Referring to formulas (4–5) in the ecosystem service accounting model, the spatial pattern change in ecosystem service value (Figure 3) in Helan Mountain from 2000 to 2020 was put forward by using GIS software. The change in ecosystem service value of each category (Table 5) was worked out by data calculation. From the spatial change, the ecosystem service values showed a polarization trend, with the spatial range gradually expanding between the lowest and highest value zones of 0–0.5 million yuan and 5–13 million yuan. In contrast, the spatial range of the median value zone of 0.5–5 million yuan was gradually compressed. Among them, the lowest value range of 0–0.5 million yuan becomes more extensive in the western side of the middle and lower part of Helan Mountain. The overall low-value interval in Helan Mountain shows a trend of clustering from point to point. The value range of 0.5–1 million yuan is mainly concentrated along the eastern side of Helan Mountain, and the range increases significantly, crowding out the spatial range of the value from 1 to 2 million yuan. The value range of 5–13 million yuan expanded slowly in the eastern side of the upper part of Helan Mountain. From the data statistics, the total value of ecosystem services from 2000 to 2020 decreased from 5,674.5490 to 5,674.6638 million yuan, with an overall decrease of 0.1148 million yuan, and the overall ecological value was unchanged. The proportion of ecosystem service value of land use types in descending order is as follows: grassland > cropland > water > forest > barren > shrubs > impervious. Within the study area, the ecological service values of cropland, forest land, and water continued to increase, by 120.5797, 10.3909, and 465.1734 million yuan, respectively. The ecological service values of shrubs continued to decrease by 0.1122 million yuan. The ecological service values of grassland increased first and then decreased by 597.6997 million yuan. The ecological service values of barren decreased first and then increased by 1.5531 million yuan. The ecological value of water and shrubs has a high attitude of dynamic, at 7.18 and 3.9%, respectively, while other land types are more stable, with the degree of change tending to be close to zero.
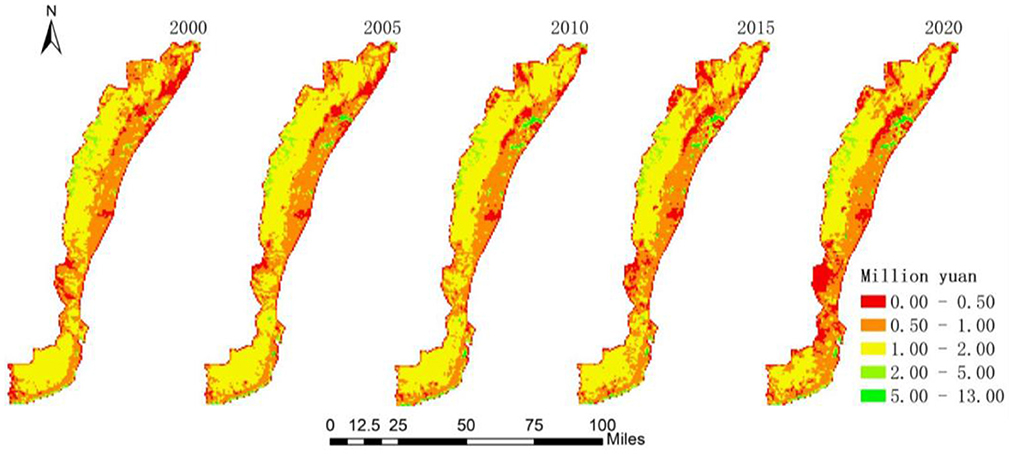
Figure 3. Spatial pattern of ecosystem service value changes in Helan Mountain from 2000 to 2020.
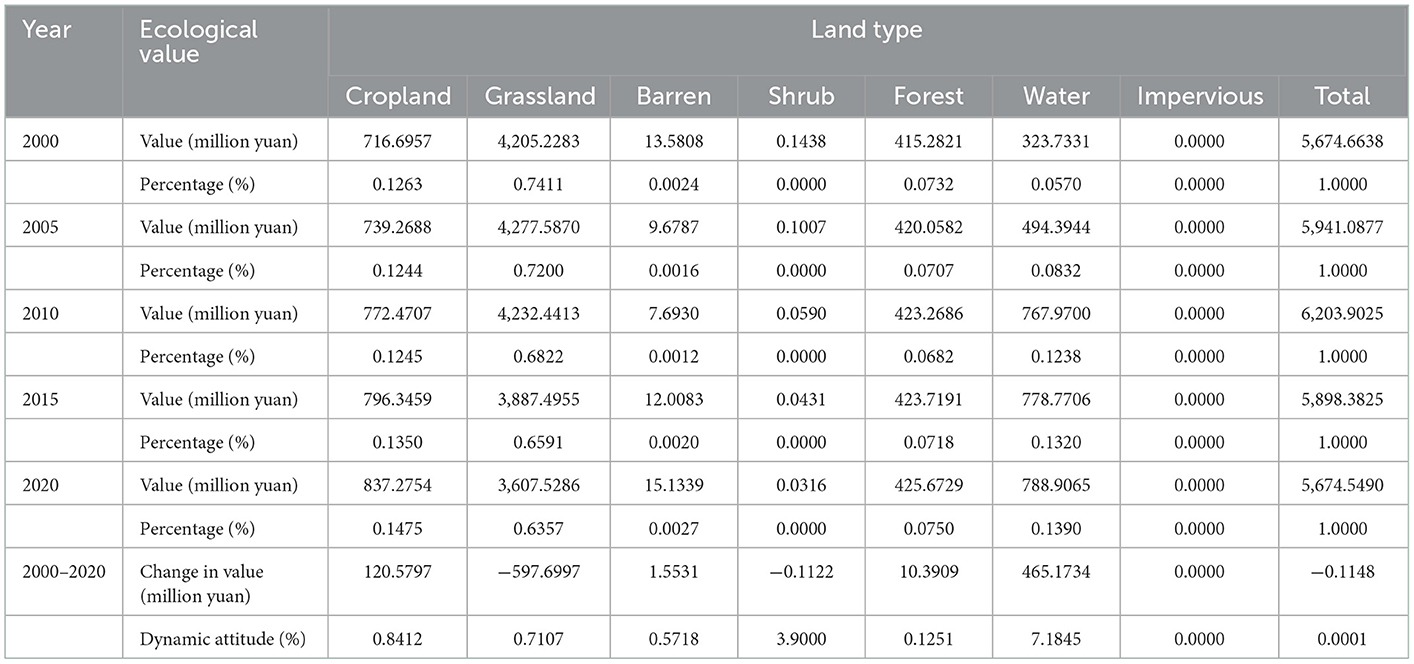
Table 5. Summary table of changes in the value of ecosystem services by category in Helan Mountain from 2000 to 2020.
Based on the fishery network in the study area, the landscape pattern indices for each land use type were obtained through Equations 9–13 by extracting the number of patches and the grid area in Helan Mountain from 2000 to 2020 (Table 6). The ecological risk parameter is influenced by both landscape disturbance and vulnerability degrees. The larger the parameter, the greater the impact on the ecosystem when an uncertain accident or disaster occurs. The ecological risk parameters in Helan Mountain are, in descending order, as follows: shrubs > grassland > cropland > barren > impervious > forest > water, among which the number of shrub patches is the lowest, the proportion of area is the lowest, and the separation degree is the highest; the proportion of grassland area is the highest, and the dominance degree is the highest, which indicates that the number of species in the study area is unevenly distributed, and the position of grassland as the dominant species is more prominent with a high degree of singleness. The spatial specificity of these two land use classes in the study area influenced the regular change in the ecological risk coefficient.
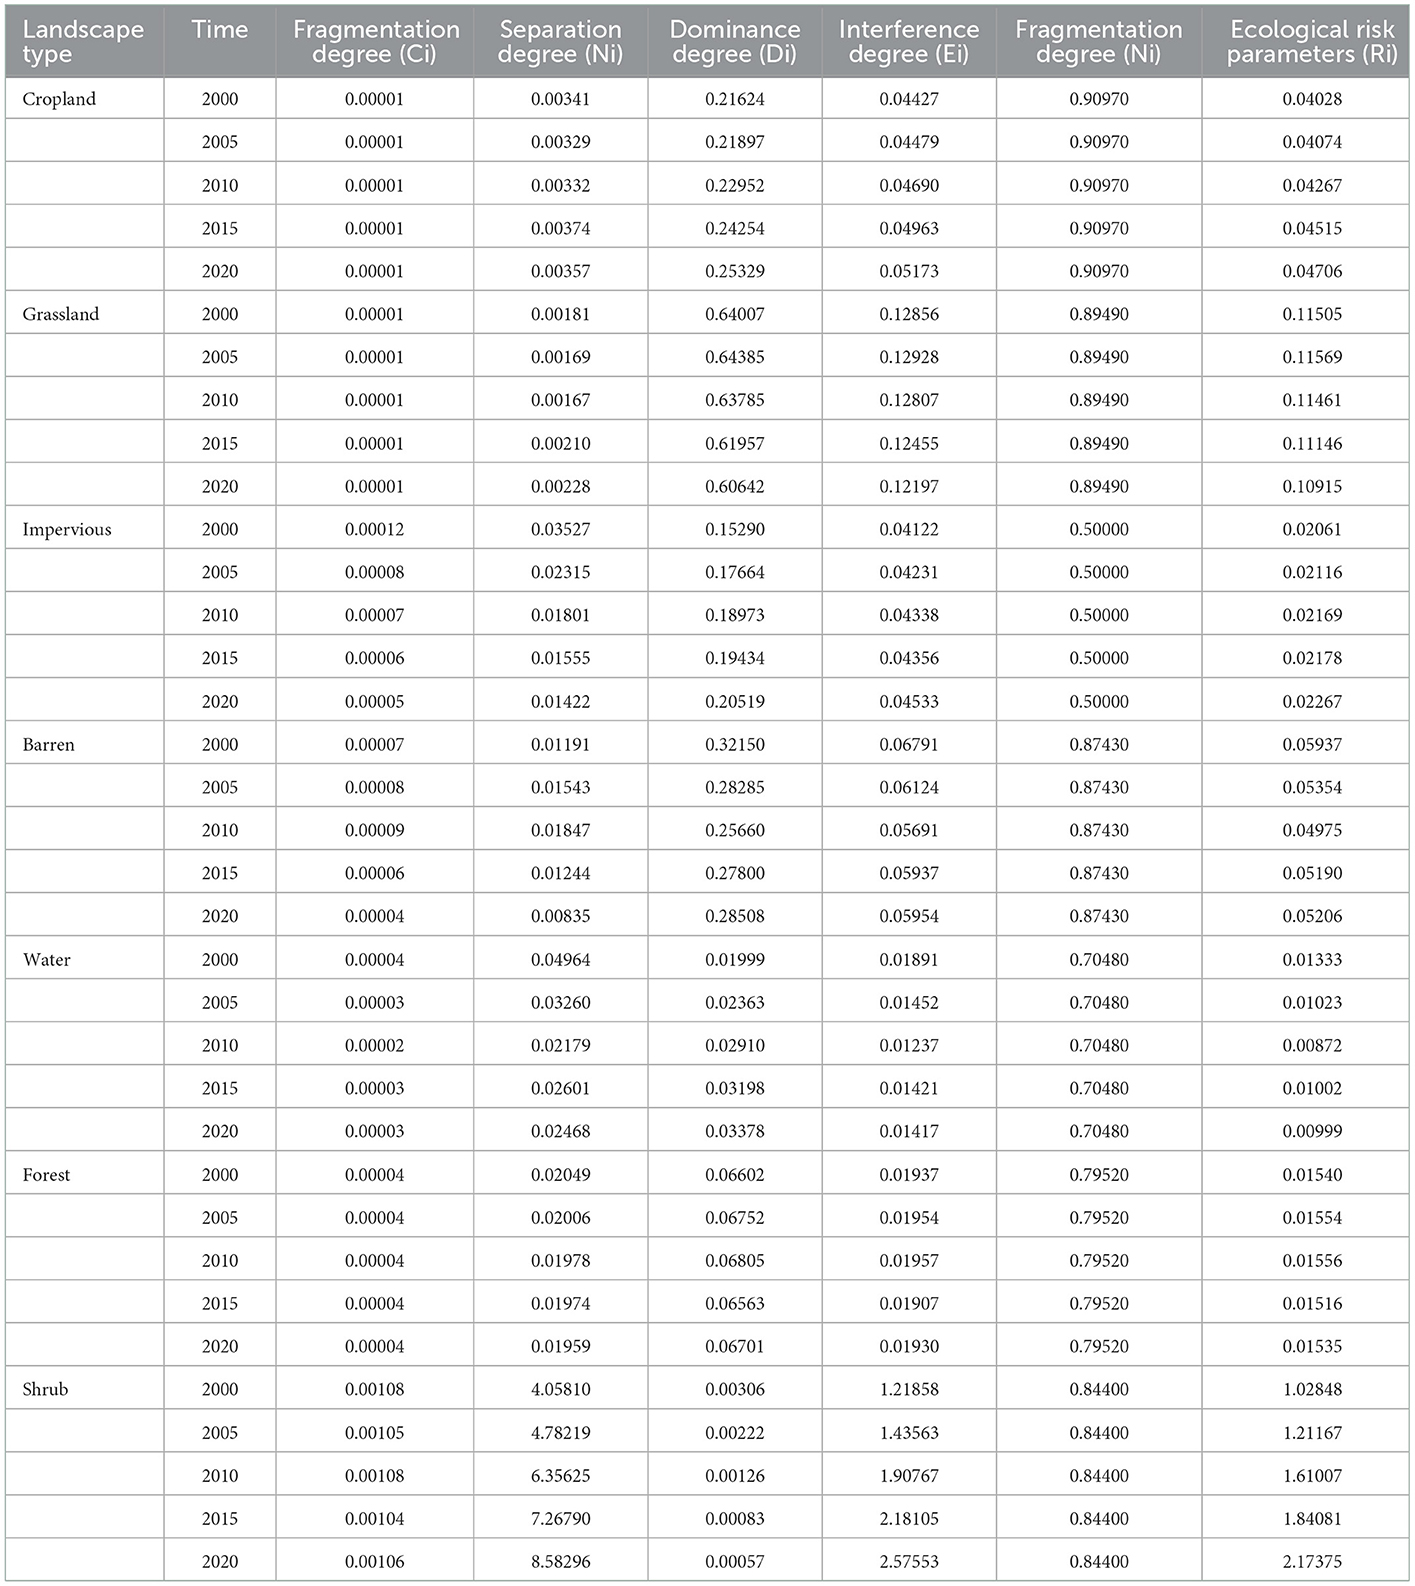
Table 6. Landscape pattern index of Helan Mountain 2000–2020.
Combined with the graphs of changes in the proportion of each land type area (Figure 4), it can be found that the grassland area accounts for 55.38–64.55%, and the area of cropland accounts for 18.23–21.3%. Those two accounted for 80% of the total, which are the primary land use types in the study area. The percentage of area in water, forest, and impervious increased slightly; however, the impact is much less compared to the primary land use type. The changes in the landscape disturbance index are mainly concentrated from 2010 to 2020. The increase in dominance and decrease in separation in cropland, impervious, and water indicate the impervious and cropland scope accumulating and the area increasing. The decrease in dominance and separation of grass and shrubs indicates that cropland and impervious keep crowding other land space, which is an essential factor affecting the evolution of the landscape pattern of Helan Mountain.
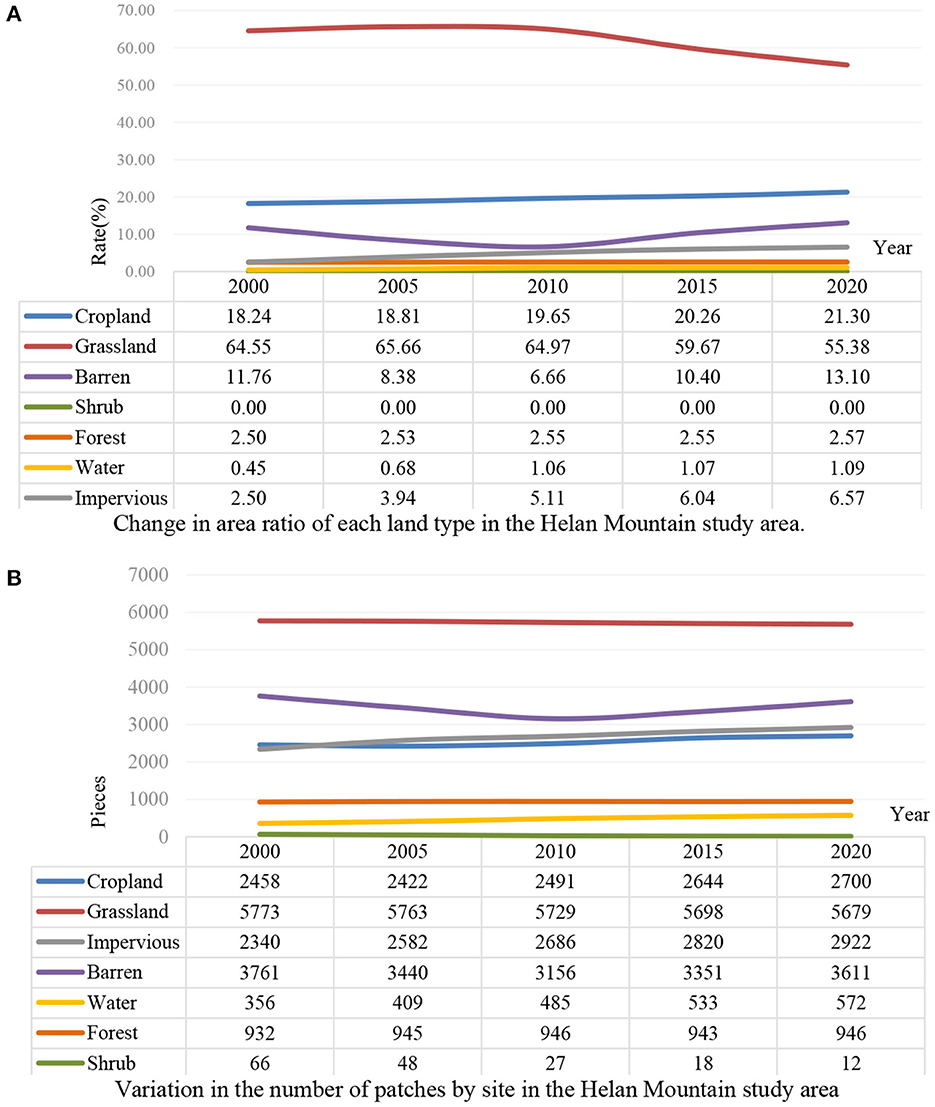
Figure 4. (A) Change in area ratio of each land type in the Helan Mountain study area. (B) Variation in the number of patches by site in the Helan Mountain study area.
The spatial interpolation method in kriging was used to interpolate the ecological risk indices of the fishnet in the study area. The values of the land use ecological risk indices for the five periods ranged from 0 to 0.117 by Equation 8and GIS data processing.
To analyze the spatial distribution of ecological land use risks expediently, the indices of each period are standardized into five risk levels by the relative index method, which are high ecological risk (>0.09), comparatively high ecological risk (0.07–0.09), medium ecological risk (0.05–0.07), comparatively low ecological risk (0.03–0.05), and low ecological risk (<0.03). The spatial and temporal variation of ecological risk for the five periods (Figure 5) and the proportional change in the area occupied by each ecological risk level (Figure 6) were obtained. In terms of spatial variation, the spatial differences of ecological risk are apparent in the study area of Helan Mountain, and the overall spatial characteristics of the distribution are banded. From 2000 to 2010, the area of high ecological risk is the largest and is mainly located on the west side of Helan Mountain. The medium, comparatively low, and low ecological risk areas are mainly distributed on the east side of Helan Mountain, and the area of comparatively low ecological risk is the main part. From 2010 to 2020, the obvious changes in the ecological risk zones are more prominent, with the transition from high and comparatively high ecological risk zones to medium ecological risk zones, that happened in the western part of the upper mountain as well as the middle and lower parts. The transition from medium ecological risk zones to comparatively low and low ecological risk zones is concentrated in the eastern part of Helan Mountain. The overall ecological environment trend is improving gradually. The area with more tremendous spatial changes in ecological risk is the western side of the middle and lower part of Helan Mountain, which is located around the city and has more frequent human activities. Compared with land use changes, the ups and downs of risk changes are due to the mutual transformation among barren, cropland, and grassland land types. The grassland's ecological risk factor is larger than barrens and croplands, and the area share changes to a lesser extent. It influenced the change in the spatial pattern of ecological risk.
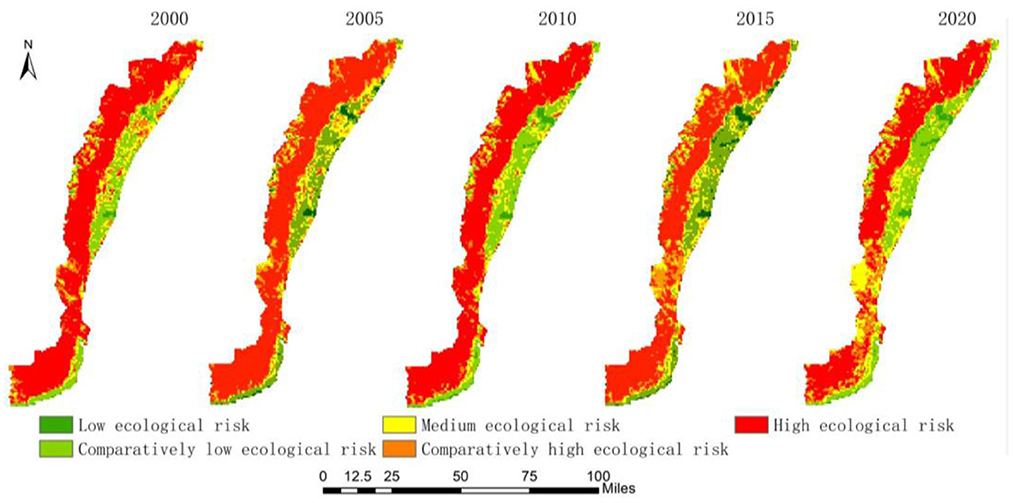
Figure 5. Spatial pattern change in ecological risk of land use in Helan Mountain from 2000 to 2020.
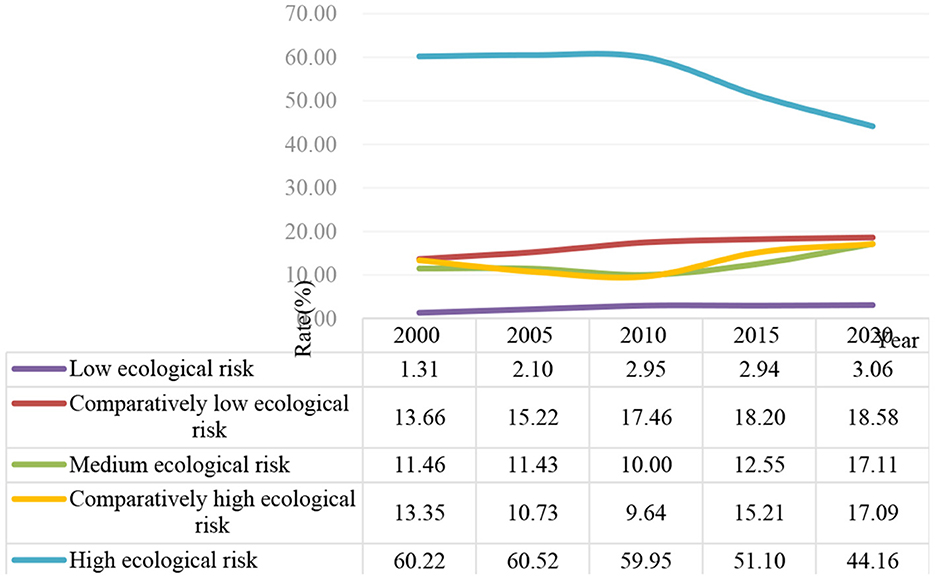
Figure 6. Trends in the percentage of ecological risk level area in Helan Mountain from 2000 to 2020.
In general, the high and comparatively high ecological risk areas are mainly concentrated in the west side of Helan Mountain, which is the main part with a relatively high altitude, large slope, sparse vegetation, and fragmented landscape. It is an important area for ecological protection, and therefore, further restoration efforts are needed in future to enhance the ecological barrier capacity. The medium-risk area is mainly located in the middle and lower part of Helan Mountain. It is necessary to strengthen ecological construction and enhance ecological functions in this area in future. The comparatively low-risk areas are mainly concentrated in the foothills and hinterland of Helan Mountain, where the terrain is gentle and suitable for the layout of ecological agriculture and green industries to enhance ecological values under the premise of sustainable development. The low ecological risk area is mainly concentrated in the east side of the upper part of Helan Mountain, and the scope shows a yearly increasing trend. Thanks to the increase in water area and water volume, it provides abundant water for the surrounding vegetation and positively improves the ecological environment.
From the statistical data, the change in each ecological risk level of land use generally shows a feature change from high and low ecological risk to comparatively high, medium, and comparatively low ecological risk in the study area between 2000 and 2020. The high ecological risk area changed from a stable to decreasing trend, and the percentage of area decreased by 16.06%. The comparatively high and medium ecological risk areas show a decreasing trend from 2000 to 2010 and an increasing trend from 2010 to 2020, and the percentage of area increased by 3.74 and 5.65%, respectively. The comparatively low and low ecological risk areas show a slowly increasing trend, and the percentage of area increased by 4.92 and 1.75%, respectively. In addition, many ecological restoration projects have been implemented in Helan Mountain and its hinterland since 2017, which have played a positive role in the change in ecological risk pattern in Helan Mountain in 2020.
Land use is the main factor in the response to ecosystem service value (Mendoza-González et al., 2012). This research focused on land use data of five periods in Helan Mountain. It systematically analyzed the spatial and temporal effects on land use changes, ecosystem service values, and the ecosystem risks in Helan Mountain from 2000 to 2020, where there is an arid and semi-arid mountain zone. Accounting models included land use dynamics and its extent, the ecosystem service value accounting model, and the land use ecological risk index model.
Overall, Helan Mountain is part of arid and semi-arid climate regions, where natural factors determine the fragility and sensitivity of Helan Mountain's ecological environment primarily such as scarce precipitation, intense evaporation, windy weather, sizeable daily temperature difference, and climate variability due to altitude. At the same time, the difficulty of protection and restoration is great, with slow recovery and long cycle time. Excessive human activities have become the most critical external disturbance since 1980's, which has aggravated the deterioration of the ecological environment of Helan Mountain. In recent years, people have gradually realized the importance of ecological protection and taken many remedial measures. The analysis of various ecological indices in 2020 shows that the ecological environment of Helan Mountain has improved increasingly.
On the aspect of land use changes, barren is distributed in the west side of the upper section of Helan Mountain mainly. These are rich in mineral resources, but continuous mining of minerals has damaged vegetation severely. It caused the expansion of barren and the decrease in ecological quality. The west side of Helan Mountain is grassland and forest mainly, with a slow increase in forest area. This is consistent with the research results of Lin et al. (2022). The growth of forest area indicates that the ecological restoration is effective and the land use is changed. The slow growth rate of forest area also indicates that high investment does not necessarily lead to faster vegetation recovery in zones with fragile ecological conditions.
On the aspect of ecosystem service, grassland occupies the largest value. In terms of ecosystems, grasslands contribute the most, which is consistent with the research results of Xia and Han (2021). Grassland is distributed in the west side of Helan Mountain mainly. There is an overcast slope from 2,400 to 3,100 m elevation, and grassland occupies a large area on conditions of climate, altitude, light, and heat. Thus, grassland has become the main source of realizing the ecosystem service value.
On the aspect of ecological risk of land use, the ecological risk index reveals the temporal and spatial characteristics of ecological risk in Helan Mountain. It is consistent with the ecological environment of the study area, as well as the research results of Zhang et al. (2014). On a shorter time scale, landscape pattern of land use reflects the impact of human activities on the ecological environment. The range of high ecological risk levels is shrinking, and the overall ecological development is improving, through a series of ecological restoration projects and ecological protection measures in Helan Mountain. In addition to the area immediately adjacent to the city, their ecological risks are on the rise.
The study on the ecosystem service value of Helan Mountain is of great significance to the construction of China's ecological security barrier. At the same time, those studies provide some theoretical basis and method supports for the studies of the ecological environment in arid and semi-arid (Xie et al., 2022) mountains over the world. However, the mountainous area is a complex ecosystem. This study evaluated ecological value and ecological risk based on the change in land use. Furthermore, it can analyze relevance by integrating other influencing factors. That might have positive significance for researching on the driving mechanism of ecosystem value and ecological risk and for setting out corresponding management plans or improvement policies.
(i) The most dominant land use types in Helan Mountain from 2000 to 2020 are grassland and cropland on its west and east sides. Influenced by the arid and semi-arid climates, the area of shrubs and forest accounts for a relatively low proportion, with scattered distribution and low coverage, but mainly stony mountainous land, with the percentage of barren land area for 11.76–13.1%. During the period, the impervious dynamic attitude is 8.13%, with the area increase of 22,364.73 ha, which is the most significant land area and dynamic attitude changes in the study area. The scope of human disturbance has increased, which is not conducive to the stability and restoration of the ecological environment of Helan Mountain. At the same time, the overall degree of land use of each category was studied separately in five periods, and the change values were 211.48, 218.3, 223.21, 221.95, and 221.33, showing a trend of increasing first and then decreasing, and the overall degree of land use has increased to a certain extent.
(ii) The total value of ecosystem services from 2000 to 2020 decreased from 5,674.5490 to 5,674.6638 million yuan, with an overall decrease of 0.1148 million yuan, and the whole ecosystem service value changed slightly. Among them, grassland is the category with the most significant proportion of ecological value in the study area. The ecological value of grassland decreased by 597.6997 million yuan during the study period, dominating the overall ecological value change trend.
(iii) The ecological risk of land use is divided into five levels, and the overall transformation is from high and low ecological risk to comparatively high, medium, and comparatively low ecological risk. From 2000 to 2010, the ecological risk level of Helan Mountain was mainly high and comparatively low. The proportion of high, comparatively high, medium, and comparatively low-risk levels tends to be balanced in 2020. Among them, the proportion of high ecological risk area is the largest, mainly distributed on the west side of Helan Mountain, but its decrease rate is the largest during the study period, with the percentage decreasing from 60.22 to 44.16%. All other areas with different risk levels increase slowly.
(iv) A comparison between ecosystem service values and land use ecological risks in the spatial pattern maps shows that the western side of Helan Mountain is the central supply area of ecosystem services for the entire study area, which is also an area at high ecological risk. For the uncertainty of external disturbance, the vulnerability and importance of this area should be paid great attention to, this part of the range should be included in the critical area of ecological protection and environmental restoration, and strict protection measures and control methods should be formulated as well.
The original contributions presented in the study are included in the article/supplementary material, further inquiries can be directed to the corresponding author.
Conceptualization and validation: YR and YC. Methodology and writing original manuscript preparation: YR. Software, data collation, and visualization: YC and HZ. Formal analysis: YR and DC. Survey: YC. Writing—review and editing: YC and DC. All authors have read and agreed to the published version of the manuscript.
The authors would like to thank Comrade Liu Dongmei for support in the conception of the manuscript and Comrade Jie Ma for support on technical aspects of the software.
The authors declare that the research was conducted in the absence of any commercial or financial relationships that could be construed as a potential conflict of interest.
All claims expressed in this article are solely those of the authors and do not necessarily represent those of their affiliated organizations, or those of the publisher, the editors and the reviewers. Any product that may be evaluated in this article, or claim that may be made by its manufacturer, is not guaranteed or endorsed by the publisher.
Bateman, I. J., Mace, G. M., Fezzi, C., Atkinson, G., and Turner, K. (2010). Resource economic analysis for ecosystem service assessments. Environmental 48, 177–218. doi: 10.1007/s10640-010-9418-x
Belay, T., Melese, T., and Senamaw, A. (2022). Impacts of land use and land cover change on ecosystem service values in the Afroalpine area of Guna Mountain, Northwest Ethiopia. Heliyon 8, e12246. doi: 10.1016/j.heliyon.2022.e12246
Bourgoud Tana, and Dalai. (2017). Ecological and Environmental Problems and Restoration in Arid and Semi-arid Regions. Shandong Industrial Technology, 287.
Bryan, B. A., Gao, L., Ye, Y., Sun, X., and Hou, X. (2018). China's response to a national land-system sustainability emergency. Nature 559, 2. doi: 10.1038/s41586-018-0280-2
Chen, W., and Jie, Z. (2021). Decoupling analysis of land use extent and ecosystem service intensity in China. J. Nat. Resour. 36, 2853–2864. doi: 10.31497/zrzyxb.20211110
Costanza, R., D'arge, R., Groot, R. D., Farber, S., Grasso, M., and Hannon, B. (1998). The value of the world's ecosystem services and natural capital. Ecol. Econ. 25, 5. doi: 10.1016/S0921-8009(98)00020-2
Daily, G. C., Soederqvist, T., Aniyar, S., Arrow, K., Dasgupta, P., Ehrlich, P. R., et al. (2000). The value of nature and the nature of value. Science 289, 395–396. doi: 10.1126/science.289.5478.395
Deng, H., Yingming, W., Qiaoxian, Z., and Yan, Y. (2006). On island landscape pattern of forests in Helan Mountain and its cause of formation. Sci. China 2006, 8106. doi: 10.1007/s11431-006-8106-0
Egoh, B., Rouget, M., Reyers, B., Knight, A. T., Cowling, R. M., Jaarsveld, A., et al. (2007). Integrating ecosystem services into conservation assessments: A review. Ecol. Econ. 63, 714–721. doi: 10.1016/j.ecolecon.2007.04.007
Guo, C., He, Z., and Liu, H. (2022). Spatial and temporal dynamics of the coupled coordination of ecosystem services and human activity intensity in the Yellow River Basin and the influencing factors. China Rural Water Hydropower.
Hu, H., Liu, H., Hao, J., and An, J. (2011). Evaluation of urbanization impact and ecological risk of watershed landscape structure. J. Ecol. 31, 1–9.
Huang, J., Zhao, L., Miao, S., and Zhang, L. (2015). Zoning and countermeasures for the protection of mountain resources in Jiangsu Province. 24, 1337–1344.
Jat, M. K., Garg, P. K., and Khare, D. (2008). Modelling of urban growth using spatial analysis techniques: a case study of Ajmer city (India). Int. J. Remote Sens. 29, 543–567. doi: 10.1080/01431160701280983
Leman, N., Ramli, M. F., and Khirotdin, R. (2016). GIS-based integrated evaluation of environmentally sensitive areas (ESAs) for land use planning in Langkawi, Malaysia. Ecol. Indicat. 61, 293–308. doi: 10.1016/j.ecolind.2015.09.029
Lin, Y., Nan, X., Hu, Z., Li, X., and Wang, F. (2022). Spatial and temporal changes in vegetation cover in typical ecologically fragile areas in Northwest China and evaluation of their ecological security: An example from the Helan Mountains of Ningxia. J. Ecol. Rural Environ. 38, 599–608. doi: 10.19741/j.issn.1673-4831.2021.0461
Liu, D., Chen, H., Shi, Q., Zhang, X., and Geng, T. (2019). Spatial and temporal dynamics of ecological risk and its risk partitioning in the loess hilly gully area: The case of Mili County, Shaanxi Province. J. Nat. Resour. 34, 14. doi: 10.31497/zrzyxb.20190916
Lv, H., Zhou, X., Zhang, W., and Wang, H. (2021). A study on ecological risk in the Yangtze River Economic Belt based on land use change. J. Beijing Normal Univ. 57, 1–7. doi: 10.12202/j.0476-0301.2020090
Makwinja, R., Kaunda, E., Mengistou, S., Alamirew, T., and Assessment (2021). Impact of land use/land cover dynamics on ecosystem service value—A case from Lake Malombe, Southern Malawi. Environ. Monitor. 193, 1–23. doi: 10.1007/s10661-021-09241-5
Mamtimin, B., Et-Tantawi, A. M. M., Schaefer, D., Meixner, F. X., and Domroes, M. (2011). Recent trends of temperature change under hot and cold desert climates: Comparing the Sahara (Libya) and Central Asia (Xinjiang, China). J. Arid Environ. 75, 1105–1113. doi: 10.1016/j.jaridenv.2011.06.007
Mao, D., Wang, Z., Wu, B., Zeng, Y., Luo, L., and Zhang, B. (2018). Land degradation and restoration in the arid and semiarid zones of China: Quantified evidence and implications from satellites. Land Degrad. Develop. 29, 3135. doi: 10.1002/ldr.3135
Mendoza-González, G., Martínez, M., Lithgow, D., Pérez-Maqueo, O., and Simonin, P. (2012). Land use change and its effects on the value of ecosystem services along the coast of the Gulf of Mexico. Ecol. Econ. 82, 23–32. doi: 10.1016/j.ecolecon.2012.07.018
Ministry of Natural Resources of the People's Republic of China (MNR of PRC). (2020). Notice of the General Office of the Ministry of Natural Resources on the Issuance of the Guidelines for the Classification of Land and Sea Use for Land Spatial Survey, Planning and Use Control (for Trial Implementation). Available online at: http://www.gov.cn/zhengce/zhengceku/2020-11/22/content_5563311.htm
Odum, H. T., Diamond, C., and Brown, M. T. (1987). Energy Systems Overview of the Mississippi River Basin. Chesapeake, VA: The Cousteau Society.
Ouyang, Z., Wang, R., and Zhao, J. (1999a). Evaluation of ecosystem service functions and their ecological and economic values. Acta Ecol. Sin. 10, 6.
Ouyang, Z., Wang, X., and Miao, H. (1999b). A preliminary study on the service functions of terrestrial ecosystems and their ecological and economic values in China. Acta Ecol. Sin. 19, 607–607.
Sciences, N. A. O. S. (2020). Ningxia Ecological Civilization Construction Report. Yinchuan: Ningxia People's Publishing House.
Singh, P. K., and Chudasama, H. (2021). Pathways for climate change adaptations in arid and semi-arid regions. J. Clean. Prod. 284, 124744. doi: 10.1016/j.jclepro.2020.124744
Thakur, S., Negi, V. S., Dhyani, R., Satish, K. V., and Bhatt, I. D. (2021). Vulnerability assessments of mountain forest ecosystems: A global synthesis. Trees Forests People 6, 100156. doi: 10.1016/j.tfp.2021.100156
Vihervaara, P., Rönkä, M., and Walls, M. (2010). Trends in ecosystem service research: Early steps and current drivers. Ambio 39, 314–324. doi: 10.1007/s13280-010-0048-x
Xia, F., and Han, H. (2021). Assessment of the ecological benefits of forests in the north and south mountains of Lanzhou city in the western semi-arid region. Ecol. Sci. 40, 106–115. doi: 10.14108/j.cnki.1008-8873.2021.06.013
Xie, G., Zhang, C., Zhang, L., Chen, W., and Li, S. (2015). Improvement of ecosystem service valorization method based on unit area value equivalent factor. J. Nat. Resour. 30, 1243–1254. doi: 10.11849/zrzyxb.2015.08.001
Xie, G., Zhen, L., Lu, C., Yu, X., and Chen, C. (2008). A method for valorizing ecosystem services based on expert knowledge. J. Nat. Resour. 2008, 911–919. doi: 10.11849/zrzyxb.2008.05.019
Xie, Q., Cleverly, J., Moore, C. E., Ding, Y., Hall, C. C., Ma, X., et al. (2022). Land surface phenology retrievals for arid and semi-arid ecosystems. ISPRS J. Photogrammetr. Remote Sens. 185, 129–145. doi: 10.1016/j.isprsjprs.2022.01.017
Zhang, X., Shi, P., Luo, J., Liu, H., and Wei, W. (2014). Ecological risk analysis of an arid inland river basin based on landscape patterns: The Shiyang River basin as an example. J. Nat. Resour. 29, 410–419. doi: 10.11849/zrzyxb.2014.03.005
Zhou, L., and Huang, R. (2008). Interdecadal variability of sensible heat in arid and semi-arid regions of northwest China and its relationship with summer precipitation in China. Chin. J. Atmos. Sci. 32, 1276–1288. doi: 10.3878/j.issn.1006-9895.2008.06.04
Zhou, M., Cai, Y., Zhang, R., Liu, J., and Song, X. (2019). Study on the change of spatial and temporal patterns of regional ecological vulnerability before and after the establishment of Ningxia Helan Mountain National Nature Reserve. Ecol. Sci. 38, 78–85. doi: 10.14108/j.cnki.1008-8873.2019.05.011
Keywords: arid and semi-arid zones, mountainous areas, land use, the value of ecosystem services, ecological risks
Citation: Ren Y, Chen Y, Chen D and Zhang H (2023) Spatial and temporal effects on the value of ecosystem services in arid and semi-arid mountain areas—A case study from Helan Mountain in Ningxia, China. Front. Ecol. Evol. 10:1072015. doi: 10.3389/fevo.2022.1072015
Received: 17 October 2022; Accepted: 22 December 2022;
Published: 16 January 2023.
Edited by:
Orsolya Valkó, Hungarian Academy of Sciences, HungaryReviewed by:
Sergio Noce, Fondazione Centro Euro-Mediterraneo sui Cambiamenti Climatici (CMCC), ItalyCopyright © 2023 Ren, Chen, Chen and Zhang. This is an open-access article distributed under the terms of the Creative Commons Attribution License (CC BY). The use, distribution or reproduction in other forums is permitted, provided the original author(s) and the copyright owner(s) are credited and that the original publication in this journal is cited, in accordance with accepted academic practice. No use, distribution or reproduction is permitted which does not comply with these terms.
*Correspondence: Yue Ren,  MTcyNTk4OTE1QHFxLmNvbQ==
Disclaimer: All claims expressed in this article are solely those of the authors and do not necessarily represent those of their affiliated organizations, or those of the publisher, the editors and the reviewers. Any product that may be evaluated in this article or claim that may be made by its manufacturer is not guaranteed or endorsed by the publisher.
Research integrity at Frontiers
Learn more about the work of our research integrity team to safeguard the quality of each article we publish.